tagso' seismic survey 1995: operational report … · "t asgo" seismic survey 1995:...
TRANSCRIPT

"T ASGO" SEISMIC SURVEY
1995: OPERATIONAL REpORT
By
T.J. BARTON, D. W. JOHNSTONE & R. G. RICHARDSON
RECORD 1995/72

• • • • • • • • • • • • • • • • • • • • • • • • • • • • • • • • • •
AGSO
AUSTRALIAN GEOLOGICAL SURVEY ORGANISATION
AGSO RECORD 1995/72
"TASGO" SEISMIC SURVEY 1995:
OPERA TIONAL REPORT
by
TJ. BARTON 1 , D.W. JOHNSTONE 1 and R. G. RICHARDSON2
I Marine, Petroleum & Sedimentary Resources Program Australian Geological Survey Organisation, GPO Box 378, Canberra, ACT 2601, Australia.
2 Tasmanian Geological Survey, Tasmania Development and Resources, PO Box 56, Rosny Park, Tasmania, 7018. Australia.
A CONTRIBUTION TO THE NATIONAL GEOSCIENCE MAPPING ACCORD
©Australian Geological Survey Organisation 1995
II ~ II ~I * R 9 5 a 7 2 a 1 *
DEPARTMENT OF PRIMARY INDUSTRIES AND ENERGY
Minister for Resources: Hon. David Beddall, MP Secretary: Greg Taylor
AUSTRALIAN GEOLOGICAL SURVEY ORGANISATION
Executive Director: Neil Williams
© Commonwealth of Australia 1995
ISSN: 1039-0073 ISBN: 0 642 22376 9
This work is copyright. Apart from any fair dealings for the purposes of study, research, criticism or review, as permitted under the Copyright Act 1968, no part may be reproduced by any process without written permission. Copyright is the responsibility ofthe Executive Director, Australian Geological Survey Organisation. Requests and inquiries concerning reproduction and rights should be directed to the Principal Information Officer, Australian Geological Survey Organisation, GPO Box 378, Canberra City, ACT, 2601.
It is recommended that this publication be referred to as:
BARTON, T.J. et aI., TASGO Seismic Survey 1995: Operational Report Australian Geological Survey Organisation Record 1995/72.
• • • • • • • • • • • • • • • • • • • • • • • • • • • • • • • • • •

• • • • • • • • •
EXECUTIVE SUMMARY
1. INTRODUCTION 1.1 Background
CONTENTS
1.2 Previous geophysical investigations 1.3 Location 1.4 Seismic Lines 1.5 Associated Gravity Surveys (R. G. Richardson)
• 2. FIELD OPERATIONS
• • • • • • • • • • • • • • • • • • • • • • • •
2.1 General 2.2 Reconnaissance 2.3 Environmental Management Plan 2.4 Transport of equipment to and from Tasmania 2.5 Communications 2.6 Line Clearing 2.7 Surveying 2.8 Field Safety
2.8.1 Field Safety Recommendations 2.9 Drilling and Explosives
2.9.1 Drilling 2.9.2 Explosives
2.10 Seismic Recording 2.10.1 Conventional SEG-D 2.10.2 Eavesdropping on the SN368
2.10.2.1 Eavesdropper Interface Box 2.10.2.2 PDMA 16 Interface Card 2.10.2.3 Eavesdropper PC
2.11 Data Processing 2.11.1 In Field 'VISTA' 2.11.2 Head Office 'DISCO / FOCUS'
3. ACKNOWLEDGMENTS
4. REFERENCES
(continued over page)
©Australian Geological Survey Organisation 1995
1 1 1 8 10
12 12 13 13 14 14 14 15
18
18
23
32
32
APPENDICES
1. Operational Statistics and Timetable. 2. Seismic Survey Personnel. 3. Seismic Survey Vehicles. 4. Recording System. 5. Line Recording spread parameters. 6. Seismic Field Tape Index 7. Archival Information 8. Environmental Management Plan.
FIGURES
1. Location of the T AS GO seismic lines 2. Location map: line 95AGS-TI 3. Location map: line 95AGS-T2 4. Location map: line 95AGS-T3 5. Location map: line 95AGS-T4 6. Location map: line 95AGS-TS 7. CMP stack: line 95AGS-TI 8. CMP stack: line 9SAGS-T2 9. CMP stack: line 9SAGS-T3 1O.CMP stack: lines 95AGS-T4 & T5 II.CMP stack: line 9SAGS-AB
TABLES
1. Operational Statistics, Line Summary
©Australian Geological Survey Organisation 1995
35 37 38 39 40 44 47 48
2 3 4 S 6 7 26 27 28 29 30
36
• • • • • • • • • • • • • • • • • • • • • • • • • • • • • • • • • •
• • • • • • • • • • • • • • • • • • • • • • • • • • • • • • • • • •
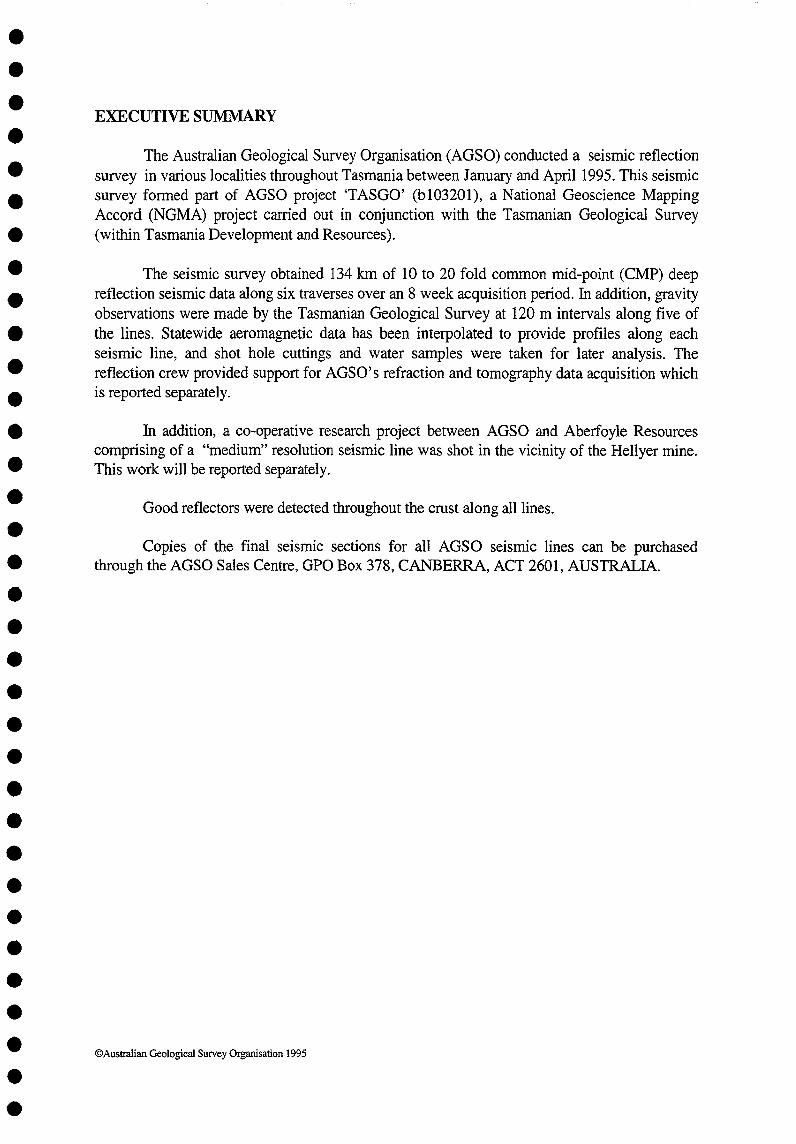
EXECUTIVE SUMMARY
The Australian Geological Survey Organisation (AGSO) conducted a seismic reflection survey in various localities throughout Tasmania between January and April 1995. This seismic survey formed part of AGSO project 'TASGO' (b103201), a National Geoscience Mapping Accord (NGMA) project carried out in conjunction with the Tasmanian Geological Survey (within Tasmania Development and Resources).
The seismic survey obtained 134 kIn of 10 to 20 fold common mid-point (CMP) deep reflection seismic data along six traverses over an 8 week acquisition period. ill addition, gravity observations were made by the Tasmanian Geological Survey at 120 m intervals along five of the lines. Statewide aeromagnetic data has been interpolated to provide profiles along each seismic line, and shot hole cuttings and water samples were taken for later analysis. The reflection crew provided support for AGSO's refraction and tomography data acquisition which is reported separately.
ill addition, a co-operative research project between AGSO and Aberfoyle Resources comprising of a "medium" resolution seismic line was shot in the vicinity of the Hellyer mine. This work will be reported separately.
Good reflectors were detected throughout the crust along all lines.
Copies of the final seismic sections for all AGSO seismic lines can be purchased through the AGSO Sales Centre, GPO Box 378, CANBERRA, ACT 2601, AUSTRALIA.
©Australian Geological Survey Organisation 1995
• • • • • • • • • • • • • • • • • • • • • • • • • • • • • • • • • •
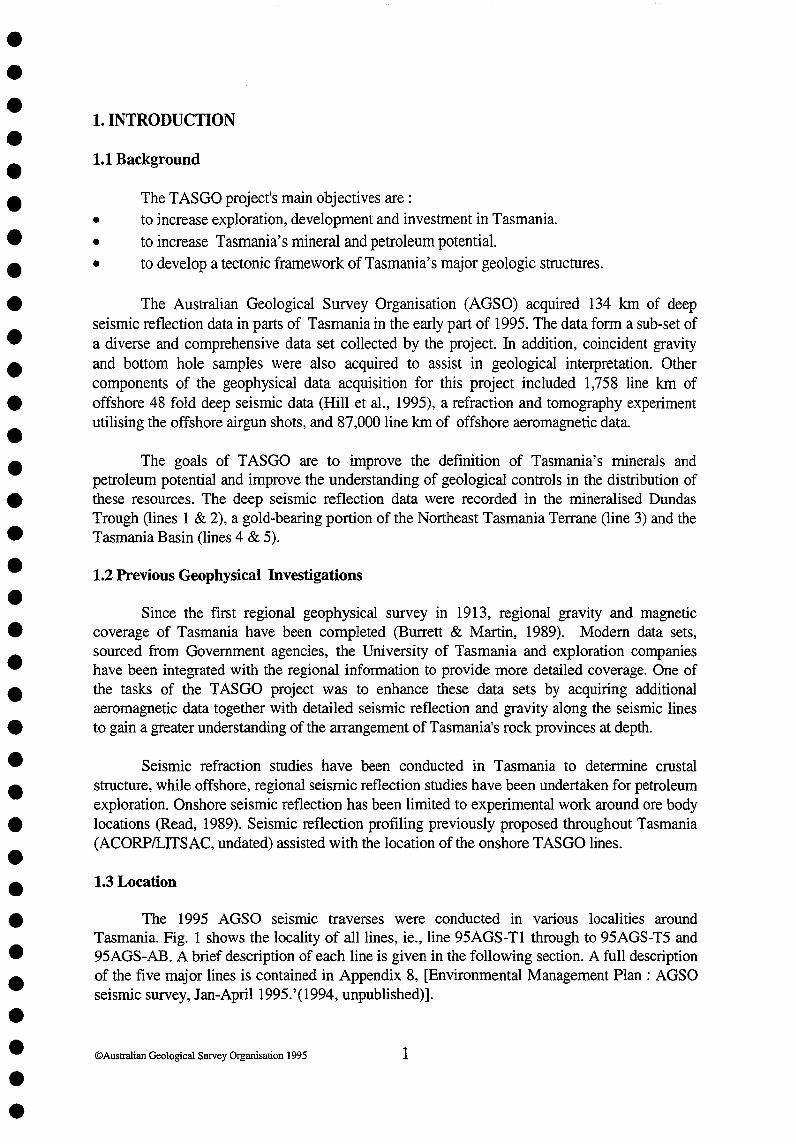
1. INTRODUCTION
1.1 Background
The TASGO project's main objectives are :
• • •
to increase exploration, development and investment in Tasmania.
to increase Tasmania's mineral and petroleum potential.
to develop a tectonic framework of Tasmania's major geologic structures.
The Australian Geological Survey Organisation (AGSO) acquired 134 km of deep seismic reflection data in parts of Tasmania in the early part of 1995. The data form a sub-set of a diverse and comprehensive data set collected by the project. In addition, coincident gravity and bottom hole samples were also acquired to assist in geological interpretation. Other components of the geophysical data acquisition for this project included 1,758 line km of offshore 48 fold deep seismic data (Hill et aI., 1995), a refraction and tomography experiment utilising the offshore airgun shots, and 87,000 line km of offshore aeromagnetic data.
The goals of TASGO are to improve the definition of Tasmania's minerals and petroleum potential and improve the understanding of geological controls in the distribution of these resources. The deep seismic reflection data were recorded in the mineralised Dundas Trough (lines 1 & 2), a gold-bearing portion of the Northeast Tasmania Terrane (line 3) and the Tasmania Basin (lines 4 & 5).
1.2 Previous Geophysical Investigations
Since the first regional geophysical survey in 1913, regional gravity and magnetic coverage of Tasmania have been completed (BUffett & Martin, 1989). Modern data sets, sourced from Government agencies, the University of Tasmania and exploration companies have been integrated with the regional information to provide more detailed coverage. One of the tasks of the T ASGO project was to enhance these data sets by acquiring additional aeromagnetic data together with detailed seismic reflection and gravity along the seismic lines to gain a greater understanding of the arrangement of Tasmania's rock provinces at depth.
Seismic refraction studies have been conducted in Tasmania to determine crustal structure, while offshore, regional seismic reflection studies have been undertaken for petroleum exploration. Onshore seismic reflection has been limited to experimental work around ore body locations (Read, 1989). Seismic reflection profiling previously proposed throughout Tasmania (ACORPILITSAC, undated) assisted with the location of the onshore TASGO lines.
1.3 Location
The 1995 AGSO seismic traverses were conducted in various localities around Tasmania. Fig. 1 shows the locality of all lines, ie., line 95AGS-T1 through to 95AGS-T5 and 95AGS-AB. A brief description of each line is given in the following section. A full description of the five major lines is contained in Appendix 8, [Environmental Management Plan: AGSO seismic survey, Jan-April 1995.'(1994, unpublished)].
©Australian Geological Survey Organisation 1995 1

Figure 1. Location map, TASGO land seismic 1995
©Australian Geological Survey Organisation 1995^ 2
39 30 003
40 00 003
42 00 003
44 00 DOS
44 30 003
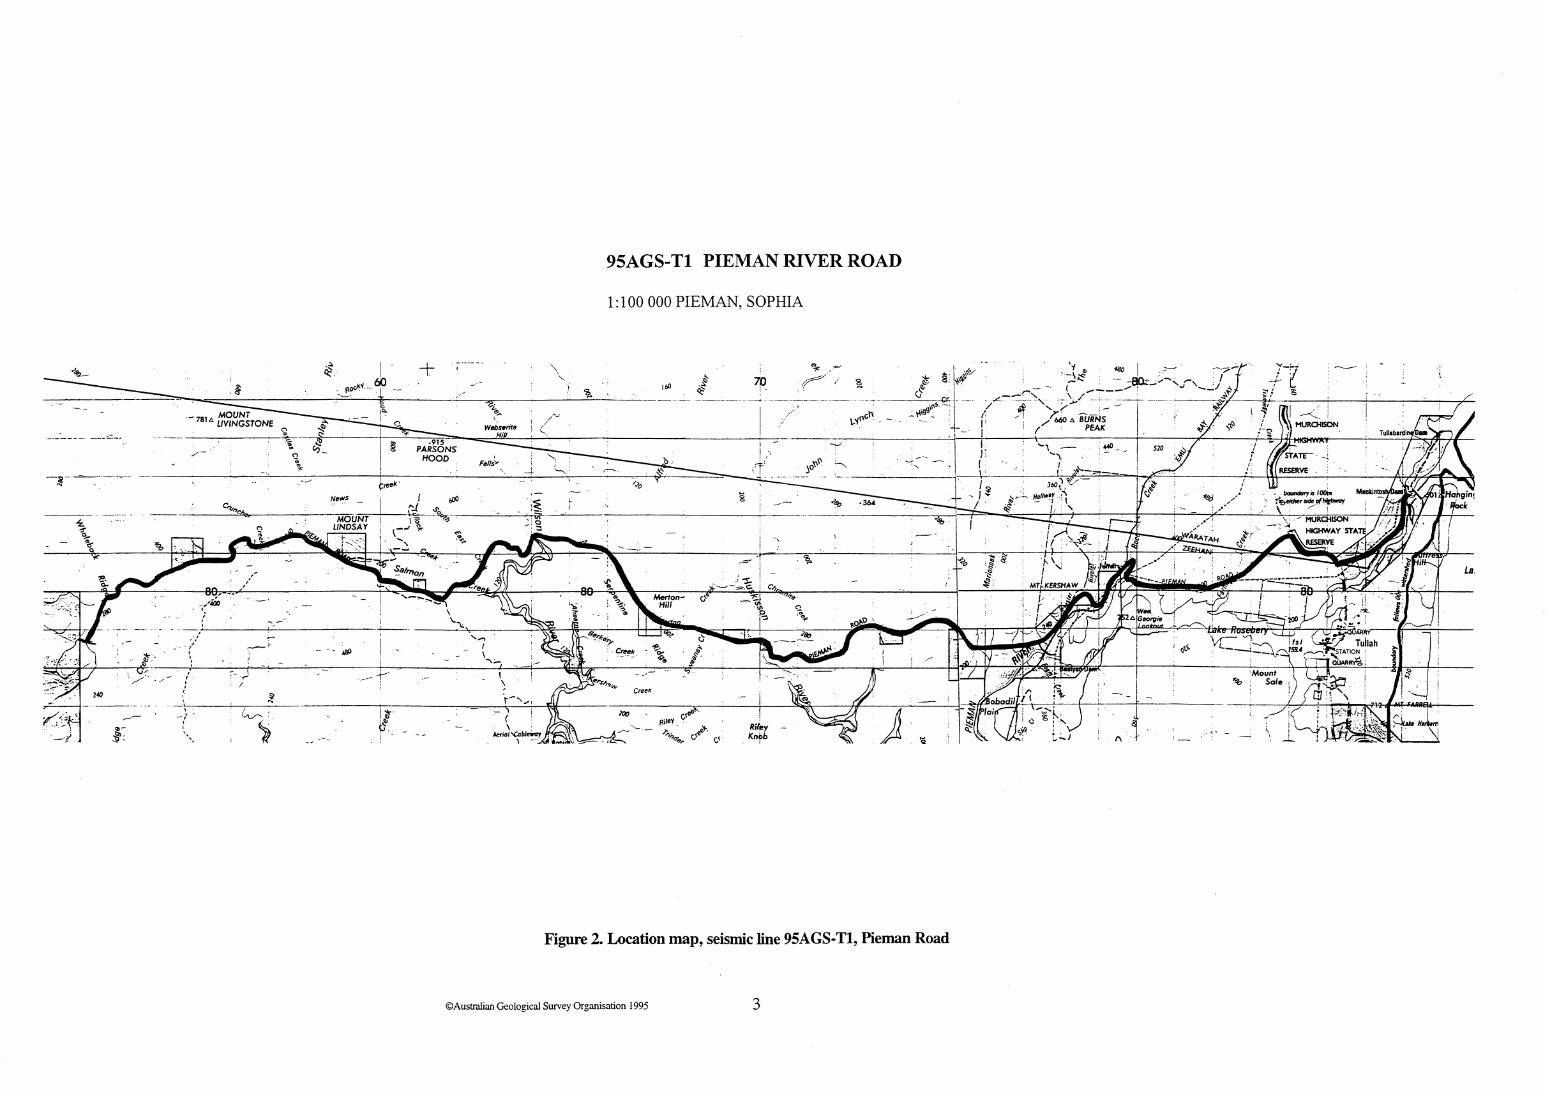
95AGS-Tl PIEMAN RIVER ROAD
1:100000 PIEMAN, SOPHIA
-~---------~---
;.S,' 1,1 - + ~" , ' 't' _ _ ' "'-'-' .... ' "" ,/= :f>' I \OY ,--\~ ""'. ,: , I ,: .(
(£J ~ 70:: _ , r".-? / ~ *' is' ~,., ~,;:: , - _an~_,,.,._,,,, .: -----, ' : § _~~~~t-l liD ;t r ,- l' 'j . (gw.o - /
= __ ~~~ ________ ~_=--~~~-----~~-'-~~-----~-~-~---------~ ____ ---------_________ ~6~,~~-- j~~~,~~,~/~=~~-----,',- --.~~_ ~ I,'~ ",/ "":'o(r~91_: /, ~ >" ~,
_ \..~f\~' _ - ,,/1 ,/t4JIO. BURNs {
';l__ --_--'--"---"'---'-l'I--- I' (' PEAK ':. 8 ' ~ :' f, .... , -' - :.j040 . :___ . n .... ",'-,o:r;.<'.,----- ~- r I • ------_ :.... ',,--4i.. " ; ~~-"..--r reek' . I J "l '0'/-~ ~ , 60(-
NeWS -L I tIfJ 8 "... ,.~r:i.. H~/I"~,r -r', ,- ,- - "J ~ I' rI' - t.. ' -MOUNT I ~-,--, ---=--..::......~ LINDSAY C..l ~
____ c_~
... . -~
,-=' ,~ La.
\
Figure 2. Location map, seismic line 95AGS-Tl, Pieman Road
©Australian Geological Survey Organisation 1995 3

'-; __ r-
9SAGS-T2 CRADLE MOUNTAIN LINK ROAD
1:100000 SOPHIA, MERSEY
Prospect Mt ~ '<. •
.,"
Figure 3. Location map, seismic line 95AGS-T2, Cradle Mountain Link Road
©Australian Geological Survey Organisation 1995 4
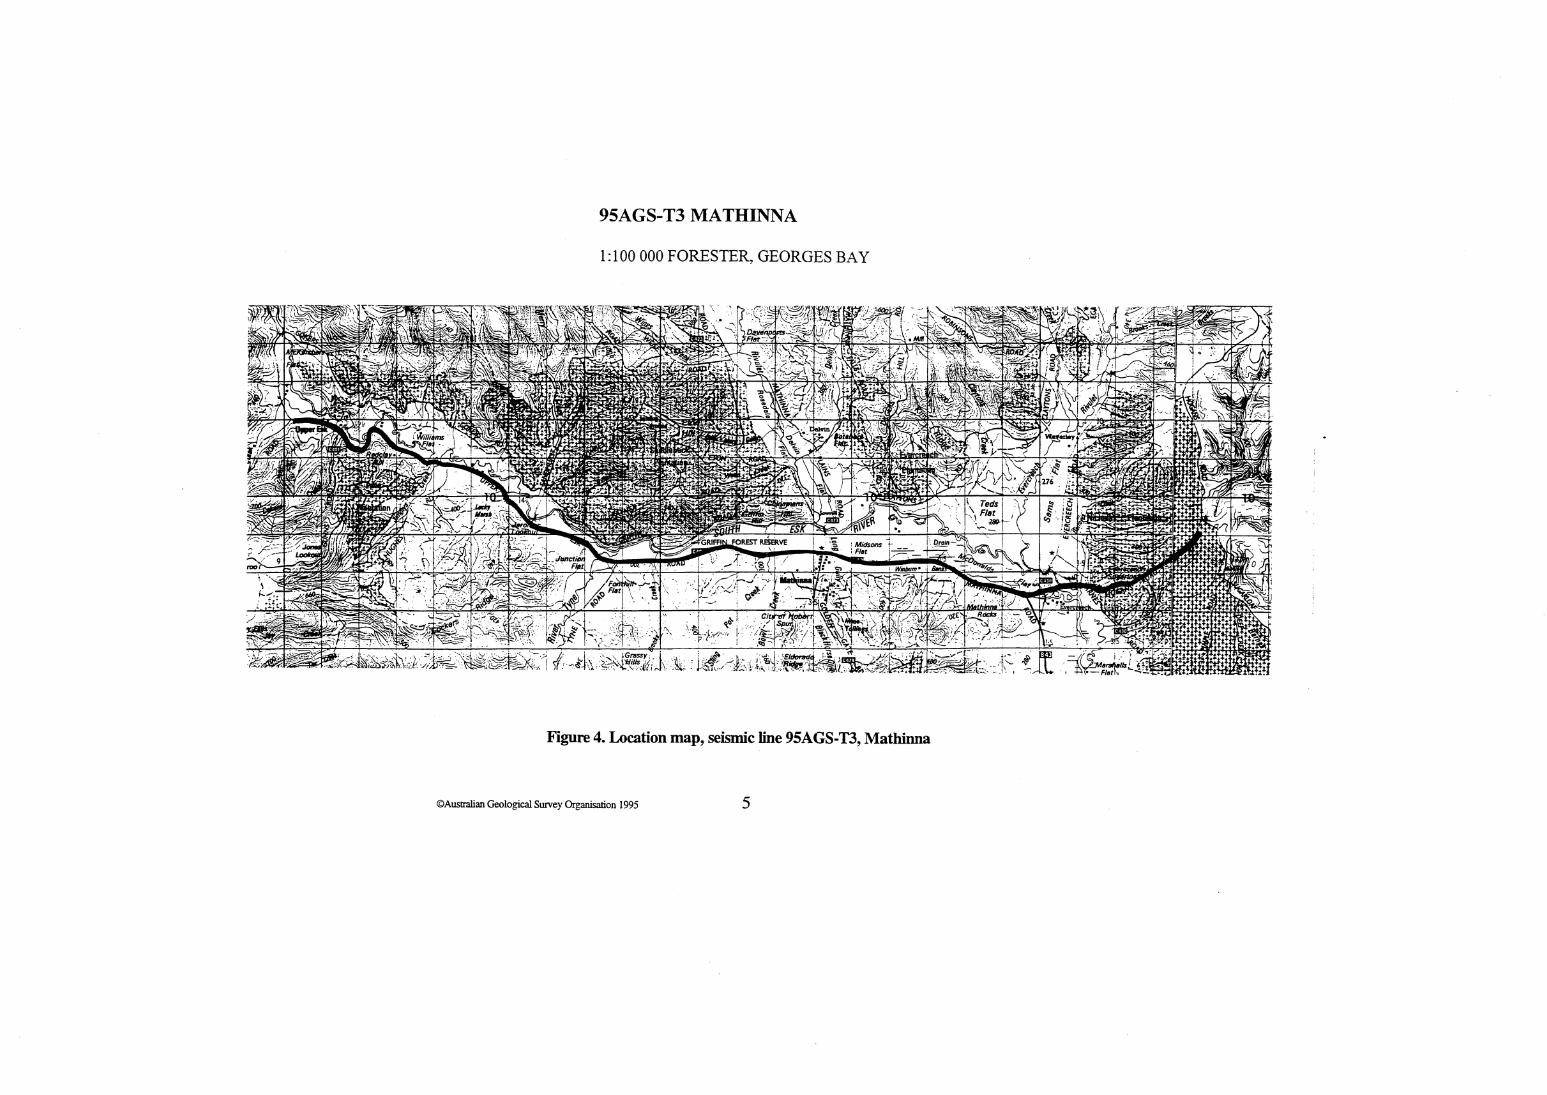
9SAGS-T3 MATHINNA
1: 1 00 000 FORESTER, GEORGES BAY
Figure 4. Location map, seismic line 9SAGS· T3, Mathinna
©Australian Geological Survey Organisation 1995 5

Figure s. Location map, seismic line 95AGS-T4, Ross - Woodbury Stock Route
©Australian Geological Survey Organisation 1995 6

'\ ., .s-., I
?,
.-... \f ~.;. : '}
'\~J
95AGS-T5 OUSE - OSTERLEY
1:100000 SHANNON
!~
\ , )
" ! ~ "
Figure 6. Location map, seismic line 9SAGS-TS, Osterely
©Australian Geological Survey Organisation 1995 7
• • • • • • • • • • • • • • • • • • • • • • • • • • • • • • • • • •
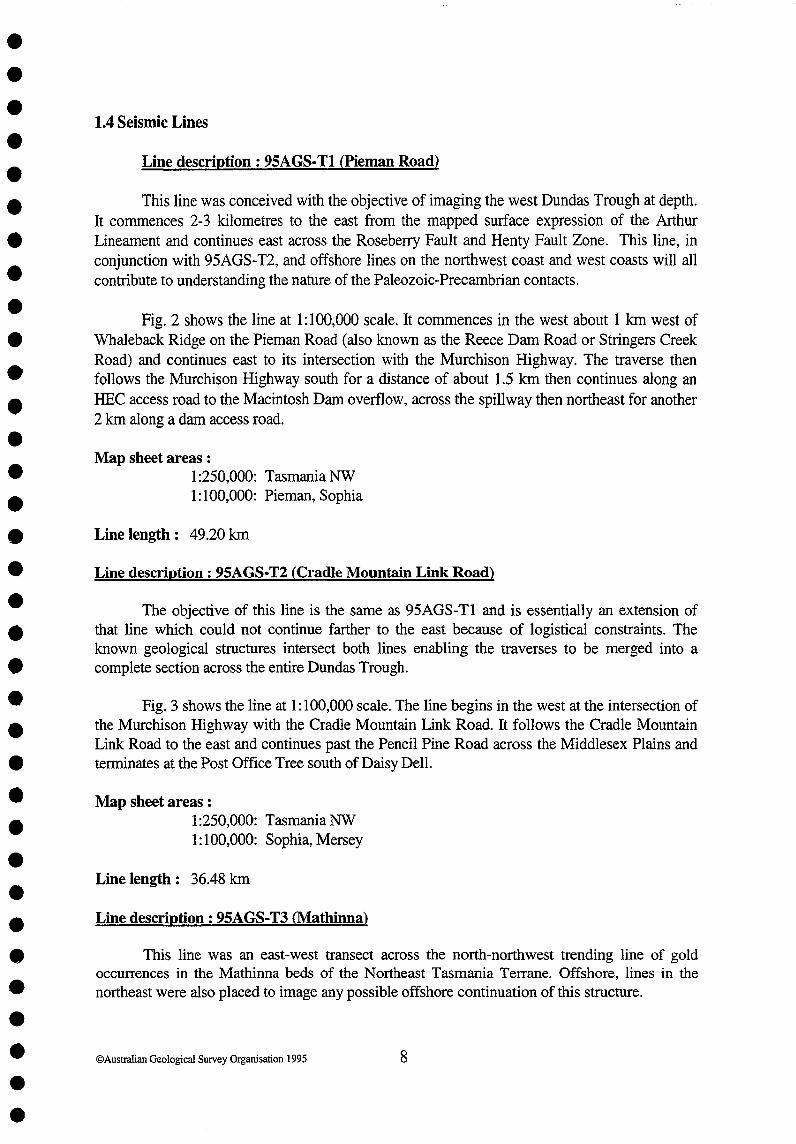
1.4 Seismic Lines
Line description: 95AGS· Tl Wieman Road)
This line was conceived with the objective of imaging the west Dundas Trough at depth. It commences 2-3 kilometres to the east from the mapped surface expression of the Arthur Lineament and continues east across the Roseberry Fault and Henty Fault Zone. This line, in conjunction with 95AGS-T2, and offshore lines on the northwest coast and west coasts will all contribute to understanding the nature of the Paleozoic-Precambrian contacts.
Fig. 2 shows the line at 1: 100,000 scale. It commences in the west about 1 km west of Whaleback Ridge on the Pieman Road (also known as the Reece Dam Road or Stringers Creek Road) and continues east to its intersection with the Murchison Highway. The traverse then follows the Murchison Highway south for a distance of about 1.5 km then continues along an HEC access road to the Macintosh Dam overflow, across the spillway then northeast for another 2 km along a dam access road.
Map sheet areas: 1 :250,000: Tasmania NW 1: 100,000: Pieman, Sophia
Line length: 49.20 Ian
Line description: 95AGS·T2 (Cradle Mountain Link Road)
The objective of this line is the same as 95AGS-Tl and is essentially an extension of that line which could not continue farther to the east because of logistical constraints. The known geological structures intersect both lines enabling the traverses to be merged into a complete section across the entire Dundas Trough.
Fig. 3 shows the line at 1: 100,000 scale. The line begins in the west at the intersection of the Murchison Highway with the Cradle Mountain Link Road. It follows the Cradle Mountain Link Road to the east and continues past the Pencil Pine Road across the Middlesex Plains and terminates at the Post Office Tree south of Daisy Dell.
Map sheet areas : 1 :250,000: Tasmania NW 1: 100,000: Sophia, Mersey
Line length: 36.48 Ian
Line description: 95AGS·T3 <Mathinna)
This line was an east-west transect across the north-northwest trending line of gold occurrences in the Mathinna beds of the Northeast Tasmania Terrane. Offshore, lines in the northeast were also placed to image any possible offshore continuation of this structure.
©Australian Geological Survey Organisation 1995 8
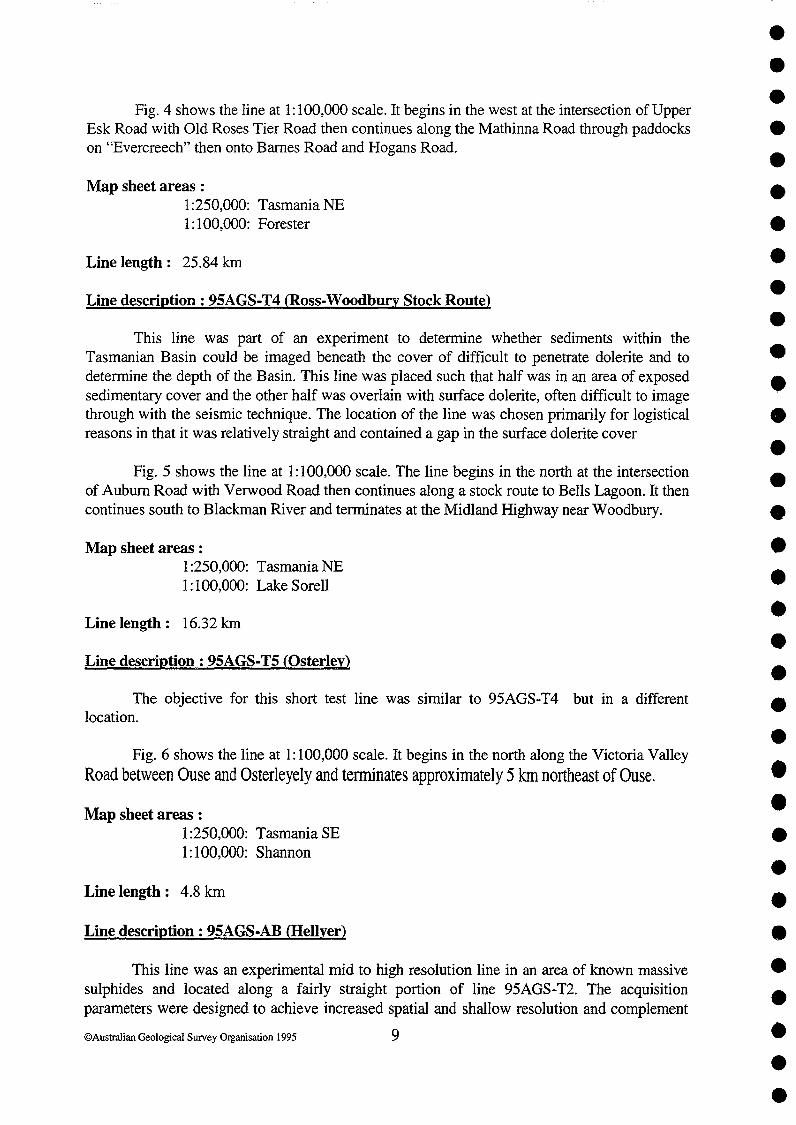
Fig. 4 shows the line at 1: 100,000 scale. It begins in the west at the intersection of Upper Esk Road with Old Roses Tier Road then continues along the Mathinna Road through paddocks on "Evercreech" then onto Barnes Road and Hogans Road.
Map sheet areas: 1 :250,000: Tasmania NE 1: 100,000: Forester
Line length: 25.84 km
Line description: 95AGS-T4 (Ross-Woodbury Stock Route)
This line was part of an experiment to determine whether sediments within the Tasmanian Basin could be imaged beneath the cover of difficult to penetrate dolerite and to determine the depth of the Basin. This line was placed such that half was in an area of exposed sedimentary cover and the other half was overlain with surface dolerite, often difficult to image through with the seismic technique. The location of the line was chosen primarily for logistical reasons in that it was relatively straight and contained a gap in the surface dolerite cover
Fig. 5 shows the line at 1: 100,000 scale. The line begins in the north at the intersection of Auburn Road with Verwood Road then continues along a stock route to Bells Lagoon. It then continues south to Blackman River and terminates at the Midland Highway near Woodbury.
Map sheet areas : 1 :250,000: Tasmania NE 1: 100,000: Lake Sorell
Line length: 16.32 km
Line description: 95AGS-T5 (Osterley)
The objective for this short test line was similar to 95AGS-T4 but in a different location.
Fig. 6 shows the line at 1: 100,000 scale. It begins in the north along the Victoria Valley Road between Ouse and Osterleyely and terminates approximately 5 km northeast of Ouse.
Map sheet areas : 1 :250,000: Tasmania SE 1 : 100,000: Shannon
Line length: 4.8 km
Line description: 95AGS-AB (Hellyer)
This line was an experimental mid to high resolution line in an area of known massive sulphides and located along a fairly straight portion of line 95AGS-T2. The acquisition parameters were designed to achieve increased spatial and shallow resolution and complement
©Australian Geological Survey Organisation 1995 9
• • • • • • • • • • • • • • • • • • • • • • • • • • • • • • • • • •
the regional scale data set. This line was later intersected by another line carried out as joint•^research project with Aberfoyle Resources.
• This line was coincident with stations 2132-2162 of line 95AGS-T2•^Map sheet areas :• 1:250,000: Tasmania NE
1:100,000: Sophia
• Line length : 1.2 km
• 1.5 Associated Gravity Survey : by R. G. Richardson (from Richardson, 1995).
• As part of the TASGO project, Industry Safety and Mines (now the Tasmanian
• Geological Survey) acquired gravity data along the onshore seismic reflection traverses. Repeatreadings showed an accuracy of better than 0.1 mgal, and comparison with previously levelled
• stations showed differences of 0.05 mgal or better after reduction of the data.
• Base stations
All base stations used had previously been tied to Australian Geological SurveyOrganisation (AGSO) Isogal stations and have Isoga165 values. The base stations used were:-
Station^GoBs (Isoga165)^Line(m/sec2)
Tullah^9.8027489^95AGS-T1Que River^9.8017750^95AGS-T2Mathinna^9.8025147^95AGS-T3Tunbridge^9.8031485^95AGS-T4Ross^9.8031257^95AGS-T4Ouse^9.8036534^95AGS-T5
Base readings were made at least three times per day.
Gravity meter
• Sodin meter number 183 was used for all readings. This meter was calibrated on the• Hobart calibration range immediately prior to commencement of data acquisition and has a
scale constant of 0.1014(5) mgal/scale division. Previous usage has shown this meter to have• very good drift characteristics and repeatability.
• Data processing
All data were corrected for linear drift between base readings. The gravity data were• integrated with the height and coordinate data from the seismic line surveying and reduced to
•Bouguer anomalies using the 1930 International Gravity Formula and a density of 2.67 t/m 3
@Australian Geological Survey Organisation 1995^10
•
•

Terrain corrections were computed to a radius of 21 km using a density of 2.67 tlm3 •
Station numbers are of the form 9552.NNNN for line 95AGS-Tl and 9553.NNNN for the other lines.
Statistics
Line 9SAGS-Tl (pieman Road)
- 415 stations - maximum check difference 0.07 mgal - average maximum check difference 0.03 mgal
Line 9SAGS-T2 (Cradle Mountain Link Road)
- 308 stations - maximum check difference 0.08 mgal - average maximum check difference 0.04 mgal
Line 9SAGS-T3 (Mathinna)
- 224 stations - maximum check difference 0.07 mgal - average maximum check difference 0.04 mgal
Line 9SAGS-T4 (Ross-Woodbury Stock Route)
- 138 stations - maximum check difference 0.09 mgal - average maximum check difference 0.06 mgal
Line 9SAGS-TS (Osterley)
- 41 stations - maximum check difference 0.04 mgal - average maximum check difference 0.02 mgal
©Australian Geological Survey Organisation 1995 11
• • • • • • • • • • • • • • • • • • • • • • • • • • • • • • • • • •

2. FIELD OPERATIONS
2.1 General
Five 10-20 fold CMP deep seismic reflection profiles, one short test line and one highresolution line were recorded. In total 133.8 km of new seismic reflection data were acquired bythis project.
The seismic lines were surveyed, shot hole drilled and recordings began with line95AGS-T1 and finished with line 95AGS-T5. Another line, 95AGS-AB2 was also recorded in ajoint research project with Aberfoyle Resources which will be reported separately. Spread and
• recording parameters for all TASGO lines are given in Appendices 4 and 5.
All lines were surveyed by a single contractor, Dynamic Satellite Surveys.
Shot hole drilling for lines 95AGS-T1, 95AGS-T2, and 95AGS-AB was carried out• using contract drilling as access and drilling conditions were unsuitable for AGSO rigs. Lines
95AGS-T3, 95AGS-T4 and 95AGS-T5 were drilled by AGSO.•
Seismic recording was done using AGSO's SERCEL SN368 acquisition system.40• The town of Tullah was used as a base for lines 95AGS-T1, 95AGS-T2 & 95AGS-AB
with all personnel involved staying at the Tullah Lakeside Chalet. In addition, office facilities• and phone lines were set up at the Chalet to manage operations and carry out preliminary data
processing and quality control. Office rental cost was $350 per week. Accommodation was at• Fingal for line 95AG5-T3, Ross/Campbell Town for line 95AGS-T4 and New Norfolk for line• 95AGS-T5. Office accommodation for these three lines was based at the Fingal Community
Centre at a cost of $300 for 14 days. Accomodation at Tullah was based on a subsidised travel• allowance rate, with full travelling allowance paid to staff in other areas.
• 2.2 Reconnaissance• A feasibility study for potential locations of seismic lines was carried out in late 1993 in• the preparation of the NGMA project proposal for Tasmania. This study was carried out by Tim
Barton (AGSO), Keith Corbett (ISM) and David Duncan (ISM) from the November 29 to• December 3, 1993. The objective was to identify logistically feasible seismic traverses in areas
• where the relationship of rock units could be examined at depth. In total, ten potential lines wereidentified as technically feasible. Some of these lines were later discarded in favour of offshore
• lines based on the offshore aeromagnetic data acquired as part of the project. This showed thatthe structures of interest continued offshore. A map of these lines is included in the 'Tasmania
• NGMA Project TASGO, 1995/96' document (Yeates et al., 1995).
• A further reconnaissance of short-listed survey lines was made from the November 3 to• November 11, 1994 by Kevin Wake-Dyster (AGSO) and Tim Barton (AGSO), to finalise
selection of survey lines. The chosen locations are shown in Fig. 1.•
•
• ©Australian Geological Survey Organisation 1995^12••
O••
•••
2.3 Environmental Management Plan
As part of the planning process for the seismic survey, and to comply with Stateregulations for conducting seismic surveys, an environmental management plan was formulated.The TASGO 'Environmental Management Plan' is appended to this report as Appendix 8.
This plan, in conjunction with letters, was sent to all stakeholders including Local andState Government authorities and property owners in late 1994. The objective of this was toinform the stakeholders and allow them time to identify any problems which the work couldpotentially cause in particular areas. The stakeholders contacted are listed within Appendix 8.
2.4 Transport of equipment to and from Tasmania.
All vehicles used for the survey were required to be driven from Canberra to Melbourneand then transported across Bass Strait by ferry vessels. As such only essential vehicles weretaken with other vehicle requirements met locally.
The reconnaissance crew of Barton and Wake-Dyster left a Toyota station wagon inHobart at the completion of their reconnaissance. This vehicle was retrieved by Barton onJanuary 13 to commence line pegging on 95AGS-T1. He was supported by Talcken andCrawford who arrived in Tullah on January 14 after transporting their vehicles across BassStrait on the 'Spirit of Tasmania'.
The AGSO drilling and pre-loading crew arrived via the 'Spirit of Tasmania' onFebruary 3 and proceeded to Fingal to begin drilling line 95AGS-T3 on February 6. Therecording crew, together with their vehicles, travelled on the 'Spirit of Tasmania' overnight onFebruary 15 then proceeded to Tullah to commence line 95AGS-T1.
The total cost of transporting 15 people and vehicles from Melbourne to Devonport onthe 'Spirit of Tasmania' was $10,800.00.
The AGSO drill crew completed their work in Tasmania in late March, 1995. The drillrig and water-tanker were transported by Brambles Shipping from Burnie to Melbourne onApril 4. The recording crew also used Brambles Shipping to transport their vehicles fromBurnie to Melbourne on April 18. The crew then flew to Melbourne on April 18 and 19,collected the vehicles on April 19 and returned to Canberra.
The total cost for transporting 15 vehicles across Bass Strait via Brambles shipping was$9,775.00 , accommodation and aircraft transport for the 15 personnel was $3,810.00.
2.5 Communications
In order to ensure that the operations of the survey ran as smoothly as possible it wasrecognised in the planning phase that reliable communication systems were required. For thework on the West Coast (lines 95AGS-T1,T2 & AB) a field office was set up at the TullahLakeside Chalet. Two telephone lines were installed to provide voice and fax communication.Express Post facilities were available at the Tullah Post Office providing next day delivery toCanberra. Two PC's were used in the office, one for clerical/scientific and administrative tasks,
©Australian Geological Survey Organisation 1995^13
••• the other for project management use. Also, field data processing and quality control functions• were carried out in this complex using additional computing equipment. While working on lines
95AGS-T3, T4 & T5 an office was rented at the Community Centre in Fingal. This office, also• with two phone lines, was configured similarly to the one at Tullah and the local post office
O handled the survey's mail.
• Field communication was via UHF and VHF radios. Two mobile phones were also usedin areas where this service was available.
• 2.6 Line Clearing
• Due to environmental restrictions, all lines were placed along existing roads or tracks tominimise any environmental impact of the work. For line 95AGS-T1 all of the work along the
• Pieman Road and Murchison Highway was done on the edge of the road as no off-road access
•was possible. The first 18 km of line 95AGS-T2 was also conducted on the edge of the road assignificant environmental restoration had been carried out along the road verges and off road
• access for the drill rig was prohibited. For the remainder of the line, drilling operations wereconducted on the road verge. Line 95AGS-T3 was also conducted along roadsides, but
• sufficient verges allowed the use of an AGSO rotary drill rig, some of the line passed throughpaddocks which were too soft to permit drill rig access without causing damage to the surface.
• Part of line 95AGS-T4 along a stock route was slashed to remove patches of Gorse (Ulex• europaeus, a secondary weed) to minimise the possibility of spreading to other areas and
improve line access. In addition, preventive measures were taken as outlined in the Mineral• Exploration Code of Practice for Tasmania (Bacon, 1992). Line 95AGS-T5 was entirely along a
road verge.•
• Permission to use the road verges was obtained from the relevant local councils andproperty owners as outlined in the 'Environmental Management Plan'.
•2.7 Surveying•
• Chaining and pegging of all lines was done by AGSO staff. This work required aminimum of two people and two vehicles to maintain productivity of 5 km to 8 km per day.
• Additional staff were required when traffic control was needed. Each station was marked on theroad edge by green road marking paint which were the points surveyed and used for gravity
• readings. Wooden pegs 300 mm in length sourced from a local sawmill were placed at each
0^station. Pegs painted white on the top 100 mm were used to denote each station and similar redpegs for shot hole locations. The shorter than normal peg length, usually 600 mm, was used to
• minimise visual impact of the peg from the road to reduce the incidence of them being stolen ashas been the case in prior surveys. This strategy seemed to be fairly successful. The pegs were
O removed at the completion of operations on each line. Chaining was done using a nylon coatedbraided steel cable 100 m long and marked at 40 m intervals.
•
O Surveying of the seismic lines was performed under contract by Dynamic SatelliteSurveys. Survey data was supplied on PC floppy discs. The company's report `DSS Report #95-
• 36' lists all relevant information. Included below is a copy of its 'Summary'.
•
• @Australian Geological Survey Organisation 1995^14••
0
••
"During February, March and April 1995 Dynamic Satellite Surveys performed surveywork in Tasmania on behalf of the Australian Geological Survey Organisation for their95AGS-T seismic exploration survey.
All planned goals of the survey were reached and the survey was successfully completedwith no mishaps.
Due to the rugged nature of the areas surveyed, the field work required the application ofall of Dynamic Satellite Surveys' advanced survey techniques during the data acquisition phase.The primary system utilised was kinematic GPS, with infill being obtained with the uniqueRapid Elevation Meter."
The total cost for the surveying was $27,472.04, total distance surveyed was 132.64 km,i.e., $207.06 per km.
2.8 Field Safety
Due to the nature of the terrain and the requirement to perform most of the work whilston roads, special procedures were required to ensure the safety of personnel. All vehiclesworking on the line were fitted with rotating yellow beacons. Crew members wore reflectivevests and were instructed on safe working practices in this environment. Crew members weredirected to exercise caution when travelling on the West Coast roads as they were often veryslippery.
In addition, road signs were placed at either end of the area being worked usingAustralian Standard AS 1742.3-1985 as a guide. Where applicable, flagmen were used tocontrol traffic flow to ensure the safety of the workers and the travelling public. In particular, foroperations on line 95AGS-T2, flagmen were required for all drilling that was conducted fromthe rear of the low loader and on various sections of line 95AGS-T1. For drilling operations onthe other lines, traffic control consisted of road signs only, as the work in these areas wasconducted on the road verge. Flagmen were used at all times during the data acquisition phaseto ensure the safety of the workers and minimise noise contamination of shot records.
Consultations were held with the Department Of Transport and Works and the Hydro-Electric Commission to ensure that the practices used by the survey crew were acceptable.Potential hazards included adverse weather conditions, such as rain, snow and fog, and driverswho ignored signs and flagmen. Only minimal drilling production time was lost due to a roadweather hazard on one day when visibility was less than 200 metres. Other hazards includedtiger snakes.Snake bite kits were kept in each vehicle. Fortunately no member of the crew orcontractors suffered a snake bite in the course of the survey.
Blasting operations presented some problems with blow outs occurring through varioussegments of lines. Line 95AGS-T1 caused the greatest concern and it was necessary to hire ablasting mat and a truck with a lifting crane to prevent material being blown out of the shothole.Attempts to reduce the magnitude of the problem using reduced charge size did not substantiallyalleviate the problem. Deeper shotholes was not an available option as the holes had been pre-drilled. The problem appeared to be closely related to near surface water-table levels and highlyfractured igneous rocks in the vicinity of the hole. The conclusion drawn from the nature of the
©Australian Geological Survey Organisation 1995^15
••• blow-outs, which were not a case of the shot tamping being blown out, was that crater formation• around the hole was due to ground water being compressed between the fractured rock then
forced to the surface on a path of least resistance.•• Overall crew safety was maintained throughout the entire operation. The only injury was
a twisted ankle incurred on the Crew chief whilst inspecting a portion of line 95AGS-T2.•
• 2.8.1 Field Safety Recommendations• The following recommendations are made for future survey operations :• (i) Operations on public roads.
• AS 1742.3-1985 should be adhered to in relation to road signs.• • Flashing yellow beacons should be used on all vehicles, in conjunction with flashing
• hazard lights.• Reflective vests should be worn by all crew members.• • Flagmen should be used for all line operations when traffic volume is not low.• The seismic line should be worked on the side of the road which oncoming traffic
• uses.•
(ii)^Blasting Operations.• • In regions of blow outs in hard rock terrain the use of a blasting mat should be
considered.• • Where blow outs are anticipated, detonator lead wires should be secured at the top of• the hole to prevent wire being caught in overhead structures, e.g. power lines, trees etc.
• (iii)^General field safety.• The AGSO Field Safety policy should be examined to ensure that land seismic
operations comply with the policy.• • Snake bite kits should be carried in all vehicles along with the standard first aid kit.
• 2.9 Drilling and Explosives
2.9.1 Drilling•
Drilling of line 95AGS-T1 was contracted out to Columbus Drilling, 27 Cattley St.,• Burnie, Tasmania. Work on this line commenced on January 23, 1995 and was completed on
March 17, 1995. Columbus used a truck-mounted Atlas Copco 601 which was capable of• working from either side or at the back of the truck. An Ingersoll Rand 750/250 compressor was• towed behind on a trailer. The driller for Columbus was John Clayton (22 years experience) and
his offsider was Alan Tuxworth.•
Columbus drilled a total of 367 shot holes to a maximum depth of 12 m; a total of• 4465.5 m was drilled at an average cost of $15.78 per metre. Average drilling rate was 11.77• metres per hour.
•
• @Australian Geological Survey Organisation 1995^16••

Columbus staff were accommodated at the Tullah Lakeside Chalet and worked a fiveday week, returning to Burnie on weekends.
Drilling of lines 95AGS-T2, AB and 43 shot holes on line 95AGS-Tl was contracted to Maxfield Nominees Pty. Ltd. of 5 Melrose St., East Devonport, Tasmania. The drillers for Maxfield were Darren Woods and Steve Newall. Work on line 95AGS-T2 began on February 1, 1995 and final work was completed on March 17, 1995. Maxfield used an Atlas Copco 712H drilling rig which sat on the rear of a low loader. When the rig was able to operate off the road, the low loader was de-hired. A trailer-mounted compressor was towed behind a light vehicle. This was a small compressor providing air circulation for cutting removal only, as this rig was hydraulically driven. The drilling was carried out by a driller and one offsider. As no access off the road was allowable for the first 18 km of line 95AGS-T2 all drilling was conducted with the rig on the low loader with the mast swung to one side of the trailer. Drilling was done on either side of the road depending upon suitable hole locations. In this instance a minimum of two flagmen and a low loader driver was also required for operations.
Maxfield drilled 362 shot holes at an average of 11.8 metres depth. Their total drilling was 4252.5 metres at an average cost of $21.75 per metre. The cost would have been cheaper, $16.70 per metre, if low loader costs are removed. Their production rate on average was 11.52 metres per hour.
Maxfield staff were also accommodated at the Tullah Lakeside Chalet and worked a sixday week, returning to Devonport on Saturday evenings.
Traffic control for drilling operations on lines 95AGS-Tl and T2 were carried out by AGSO staff.
Drilling of lines 95AGS-T3, T4 and T5 were also offered for tender. However, the quoted costs were higher than those estimated for AGSO to carry out the work itself, including transportation to and from Tasmania. AGSO staff Des Eaton and Alan Porter carried out the work using a Mayhew 1000 drill rig mounted on 6x8 Mack truck and a water tanker mounted on a Mercedes 9115 tonne 4x4 truck.
AGSO drilled 199 holes at an average depth of 22 metres, a total of 4157 metres at an average rate of 16.05 metres per hour. The higher drilling rate, as compared to the contract work, was solely due to the different geology on the West Coast. It should also be noted that AGSO rigs were not suitable for the West Coast lines due to limited access. After completing the reflection drilling, the AGSO rig was used to drill holes for the reverse shoot refraction experiment at Osterley.
Staff were accommodated at Fingal, Ross and Ouse and a 4x4 Toyota station wagon used as a support vehicle.
Bottom hole samples were obtained by the drillers for all the lines, and sent to Hobart and Canberra for later analysis. Water samples were also collected where possible. Two litre samples were taken and subsequently sent to Hobart for analysis by the Tasmanian Geological Survey's ground water group, who also carried out conductivity measurements in open holes when possible.
©Australian Geological Survey Organisation 1995 17
• • • • • • • • • • • • • • • • • • • • • • • • • • • • • • • • • •

2.9.2 Explosives
2 kg cartridges of ICI 'Powergel Seismic 3000' explosive were used as the seismic• energy source. A 10 kg charge was selected as the best size to meet the project's objectives,
•although this size was reduced where shot holes were shallow. A 2 kg per hole charge was usedon line 95AGS-AB.
•ICI No. 8 star detonators with 3.6 m leads were used to detonate all charges. Additional
• shot firing wire was used to connect the charge to the blasting unit at a safe working distance.
•'Scotcklok' connectors were used for this.
• Explosives and detonators were stored at the ICI magazines at Hellyer for lines 95AGS-T1 and T2 and at The Cornwall Coal Company magazines at Fingal for lines 95AGS-T3, T4
• and T5. Explosives were collected on a daily basis and unused quantities returned at the end of
•each days work.
• Difficulty was experienced with holes standing up due to collapse or washing in. Overthe course of the survey an average loss of 14% of the drilled depth was encountered when holes
• were loaded.
• Holes on lines 95AGS-T1 8z T2 were tamped with road metal purchased from Burnie,
• as insufficient cuttings were produced by the hammer drilling. Tamping for the other lines wasdone with drill cuttings.
•2.10 Seismic Recording
• The recording crew performed very well under some difficult circumstances. Poorweather conditions made work very unpleasant. A total of two working days were lost because
• of weather. Rain and fog during acquisition of lines 95AGS-T1 & T2 were the maincontributing factors. The acquisition crew also had to contend with traffic control on all of the
• lines except 95AGS-T4. This, together with having to support the contract drill crew and
• surveying crew and supplying gravel for tamping, slowed the acquisition crew. Support was alsoprovided for a separate refraction survey carried out by AGSO at the same time. It was a rare
• day that four buggies were manned and employed in reflection acquisition.
• Prior to commencing acquisition on line 95AGS-T1, some tests were carried out to
•determine those acquisition parameters which could be altered. Parameters tested on this line,95AGS-TEST, were a 50 Hz notch filter test and low cut filter tests. It also served the purpose
• of familiarising new staff and determining the best means of traffic control. Results indicatedthat the notch filter removed power line noise effectively. However, since the 50 Hz was not
• saturating the signal it was decided to do this filtering in the processing phase. A low cut filtervalue of 8 Hz was determined as the best to attenuate ground roll and shot-generated noise.
•
•Spread and recording parameters for all lines are given in Appendices 4 and 5.
• 153 station units were available for the survey and if found to be faulty were repaired inthe field and returned to the line as soon as possible. Strings of geophones, 16 to a group, were
• laid out in line, centred on the station. Any faulty sets of geophones were also repaired in the
©Australian Geological Survey Organisation 1995^18
••
field. In general, the 24 pick up and leapfrog technique was employed, (24 sets of cables, stationunits and geophones were moved from the back to the front of the line) to maximise recordingefficiency.
On the completion of acquisition on line 95AGS-T1 & T2 two juggies', locallyemployed, were de-hired, leaving six staff for work on the other lines.
The 'jug' crew were also responsible for removal of wooden survey marker pegs at theend of acquisition of each line.
2.10.1 Conventional SEG-D
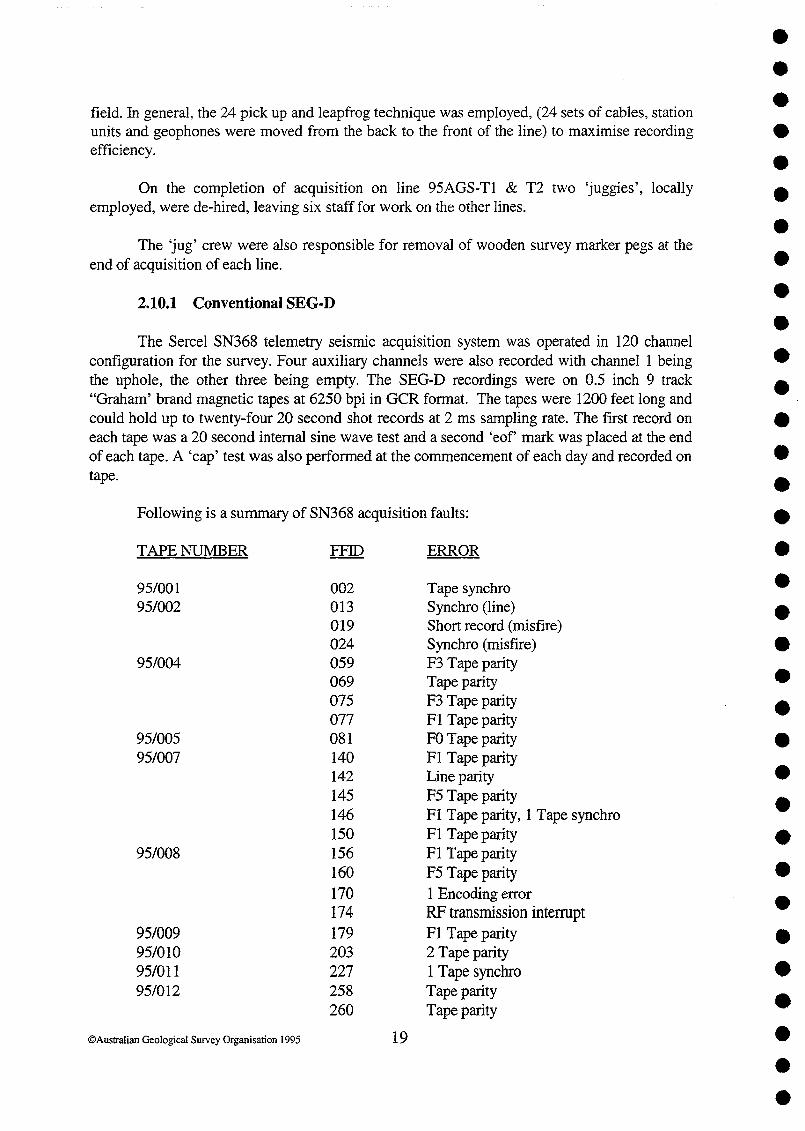
The Sercel SN368 telemetry seismic acquisition system was operated in 120 channelconfiguration for the survey. Four auxiliary channels were also recorded with channel 1 beingthe uphole, the other three being empty. The SEG-D recordings were on 0.5 inch 9 track"Graham' brand magnetic tapes at 6250 bpi in GCR format. The tapes were 1200 feet long andcould hold up to twenty-four 20 second shot records at 2 ms sampling rate. The first record oneach tape was a 20 second internal sine wave test and a second `eof mark was placed at the endof each tape. A 'cap' test was also performed at the commencement of each day and recorded ontape.
Following is a summary of SN368 acquisition faults:
TAPE NUMBER^
FFTD^ERROR
95/001^002^Tape synchro95/002^013^Synchro (line)
019^Short record (misfire)024^Synchro (misfire)
95/004^059^F3 Tape parity069^Tape parity075^F3 Tape parity077^Fl Tape parity
95/005^081^FO Tape parity95/007^ 140^Fl Tape parity
142^Line parity145^F5 Tape parity146^Fl Tape parity, 1 Tape synchro150^Fl Tape parity
95/008^ 156^Fl Tape parity160^F5 Tape parity170^1 Encoding error174^RF transmission interrupt
95/009^ 179^Fl Tape parity95/010^203^2 Tape parity95/011^227^1 Tape synchro95/012^258^Tape parity
260^Tape parity
©Australian Geological Survey Organisation 1995^19
a• TAPE NUMBER ERROR1+.11)•
261 Tape parity• 95/014 290 Tape parity
305 Tape synchro• 95/015 313 Tape parity• 322 Tape parity
327 Tape parity• 95/017 358 Tape parity
0 360 Tape parity365 Tape parity
• 95/019 419 F7 Tape parity420 F3 Tape parity
• 95/020 449 F3 Tape parity95/021 452 Line failure at shotpoint• 454 Tape parity
0 95/022 464 Tape synchro95/023 488 F7 Tape parity
• 493 Tape synchro95/025 524 2 Tape parity
• 95/026 559 Tape synchro• 561 Tape synchro
565 Tape synchro• 566 Tape synchro
95/027 580 Line synchro• 95/028 604 Tape synchro• 95/029 628
629Tape synchroTape synchro
• 631 Tape synchro635 Line synchro, interrupt
• 636 Line synchro, interrupt• 95/031 645
653Tape synchroTape synchro• 663 Line synchro
95/032 670 Tape synchro• 95/034 720 Tape parity95/037 787 Tape synchro• 95/038 811 Line failure• 819 RF interrupt95/040 830 Line failure• 839 Tape synchro
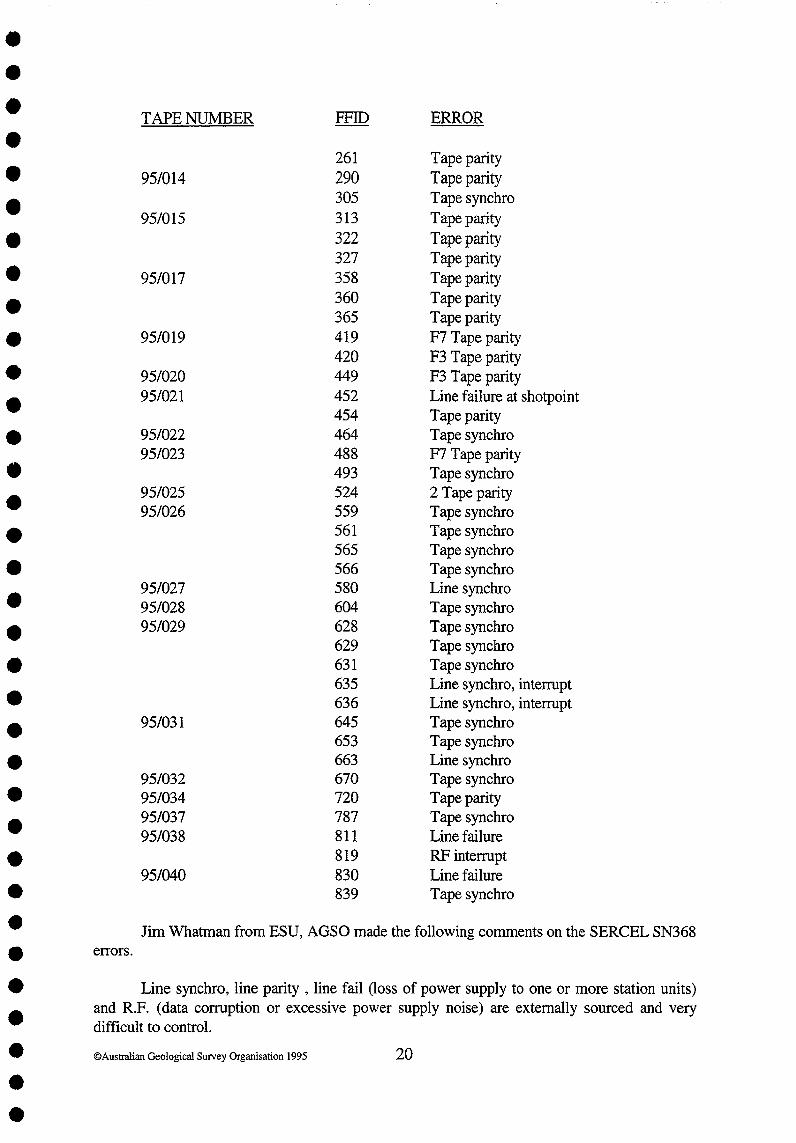
• Jim Whatman from ESU, AGSO made the following comments on the SERCEL SN368• errors.
• Line synchro, line parity , line fail (loss of power supply to one or more station units)and R.F. (data corruption or excessive power supply noise) are externally sourced and very
• difficult to control.• ©Australian Geological Survey Organisation 1995^20
0
0

Tape synchro and tape parity are, I believe, a problem with reading/writing the tape which has insufficient saturation of magnetic material. This could result from either:
(i) A defect in the coating of the tape (the error can be repeated at the same spot on tape by writing another record) (ii) The tape has lost close contact with the head during writing (reading back the original record produces a consistent error but the record can be over written with no errors). (iii) The tape lost contact with the head during reading (reading back the record consistently produces no error) (iv) The head is wearing and needs lapping (write currents are at full amplitude to produce barely acceptable read levels).
2.10.2 Eavesdropping on the SERCEL
An eavesdropping system was trialed for the first time in production mode during the TASGO survey. This system has three parts:
1. A real time interface (RT!) from the Sercel data cable to the Pc. 2. A PDMA16 interface card and LINUX software driver which writes the digital data into memory. 3. A 486 PC running a LINUX operating system, with demux and control programs.
The system captures a copy of the SEG-D data as it is written to tape by the Sercel system.
Shane Brandon from ESU, AGSO developed the hardware and Jim Leven supervised the software development for the eavesdropper. A brief description of the hardware configuration follows:
2.10.2.1 Eavesdropper Interface Box
There are two data cables connected between the Sercel SN368 Master Control Unit (MCU) and the Sercel SN368 tape transport: the write cable carries the data to be written on tape plus several signals to control the transport, the read cable carries the data read from tape plus several signals indicating the tape transport status. Presently the Eavesdropper Interface Box monitors the data on the write cable and sends this data to the PC through a digital I/O board (MetraByte PDMA16 compatible) mounted in the PC.
Besides serving as a wiring junction, the Eavesdropper Interface Box provides electronics for three main functions:
1) First In First Out (FIFO) memory for intermediate storage of data. Data transfers via the board within the PC are performed under the control of the PC's Direct Memory Access (DMA) controller. While the PC can perform most DMA transfers within the 6.3~s between incoming data bytes, some DMA transfers will be longer (due to the DMA controller requiring re-programming every 64 kb
©Australian Geological Survey Organisation 1995 21
• • • • • • • • • • • • • • • • • • • • • • • • • • • • • • • • • •

00
transferred, and also vital PC housekeeping functions such as DRAM refreshing).• Hence data arriving at these times need to be stored temporarily until the PC can
catch up.•
• 2) A controller to mediate between the 1-11 , 0 memory and the PC. The differencebetween the average DMA transfer time and the above 6.3gs is nowhere near
• sufficient to allow PC software control of the FIFO. More time can be bought witha larger^but due to the large number of bytes transferred per record
• (3,257,598 bytes for a 20s record) the present 2 kb FIFO would buy over 12ms for• any single transfer but only 4ns on a per transfer basis. A sufficiently large
memory would rule out the use of a commercial FIFO adding significantly to the• complexity of the design. A hardware controller is thus used to conduct the data
transfer operation between the FIFO and PC by monitoring their respective statuslines and asserting their control lines accordingly.
3) Signal buffering. Signals on long lines are susceptible to noise and ringing etc.• Buffering is provided to reduce further degradation, re-shape the signals before
use, and drive outgoing lines.
• 2.10.2.2 PDMA16 interface card
• A commercial PDMA16 interface card was employed to write the digital data from theinterface box into memory. This requires writing around 3.2 Mb of data to memory in 20
• seconds, corresponding to a transfer rate of 160 kb s -1 (within the capability of the PDMA16
• interface board).
• 2.10.2.3 Eavesdropper PC
• The eavesdropper PC uses a 486 DX2/66 with 16 Mb of RAM and runs a LINUXoperating system. It has two SCSI disks : 420 Mb, and 1Gb, and an exabyte 8505 tape drive. A
• specialised driver has been written for the PDMA16 interface card by David Blackman. Custom• programs have been written to enable the data acquisition, and to demultiplex the captured data.
•The capture program resets the PDMA16 driver and interface box, and passes control to
• the PDMA16 driver. This driver writes the incoming data via DMA into kernel memory,• whereafter it is written to a disk file in the SEG-D format. The demultiplex program reads this
disk file and demultiplexes the data into SEG-Y format, writing the appropriate header• information into the SEG-Y headers. The SEG-Y data is written to a disk file on the other disk,
to ensure data security in the event of a disk failure.•
• At the conclusion of recording, the SEG-Y data are written to an exabyte tape in UNIXtar format, for transfer to the field processing computer at the base camp. Both the SEG-D and
• SEG-Y data are stored on the eavesdrop PC until this transfer has been verified. Together withthe SEG-Y data, a log file of the day's acquisition is also transferred to the field geophysicist.
4111
• The eavesdropper proved a successful tool to have in the field. The most obviousadvantage being the fact the SEG-D tapes did not have to be de-multiplexed with the 'Vista'©Australian Geological Survey Organisation 1995^22
•
•
•

on the field processing system. Further development of the system enable the play-back of SEG-D records on the Sercel and the writing of these to the PC disc.
The following errors were reported by the Observer for the eavesdropping system:
TAPE NUMBER FFID ERROR DATA CAPTURE
95/002 19 Short record 14158 ms 95/002 27 Extra 10 bytes 2ms 95/005 95 Extra 2 bytes 2700ms 95/007 146 Short record 8820ms 95/008 174 RF interrupt 19256 ms 95/011 220 EV timeout 704ms 95/020 452 Line interrupt 14 ms 95/022 465 Nil Ev 2ms 95/023 491 Extra 2 bytes 17182 ms 95/026 580 EV short-line synchro error 2324ms 95/029 624 Extra 2 bytes 7074ms 95/029 628 Extra 1 byte - tape synchro 16438 ms 95/029 635 EV short - line interrupt 14ms 95/029 636 EV short - line interrupt 4ms 95/031 657 Line interrupt 964ms 95/039 808 Extra byte 6474ms 95/039 811 Line fail 18 ms 95/039 819 RF interrupt 3338 ms 95/040 830 EV short - line fail 338 ms
2.11 Data Processing
2.11.1 In field 'Vista'
The 'Vista' field seismic processing system was used on the seismic survey for quality control and to produce 'Brute stacks' in the field. QC was done by reading in the SEG-Y eavesdropper tapes, concatenating the separate SEG-Y files and writing these out to exabyte tape in SEG-Y 32 bit ffiM floating point format. The odd short or missing file could be demultiplexed from the SEG-D field tape on Vista and incorporated with the other data.
Vphole signals, recorded on auxiliary trace number 1, were demultiplexed separately and written onto exabyte tape. These were also concatenated and analysed on the Vista and uphole time arrivals computed.
Geometry information was taken from the SEG-Y headers, stacking velocities calculated from constant velocity analysis and datum statics applied to produce a 'brute' stack, (straight line geometry assumed).
First breaks were also picked in the field using 'Green Mountain Geophysics' software to compute refraction statics, but were not applied to the field processed data as crooked line geometry was not available at this point.
©Australian Geological Survey Organisation 1995 23
• • • • • • • • • • • • • • • • • • • • • • • • • • • • • • • • • •
• • • • • • • • • • • • • • • • • • • • • • • • • • • • • • • • • •
Field QC also included the checking of shot geometry from the monitor records and observers reports. Loading, drilling and shot firing logs were also cross-checked for correctness in the field.
Survey information from Dynamic Satellite Surveys was checked using the 'Green Mountain Geophysics' software on the elevation profiles and x, y plots.
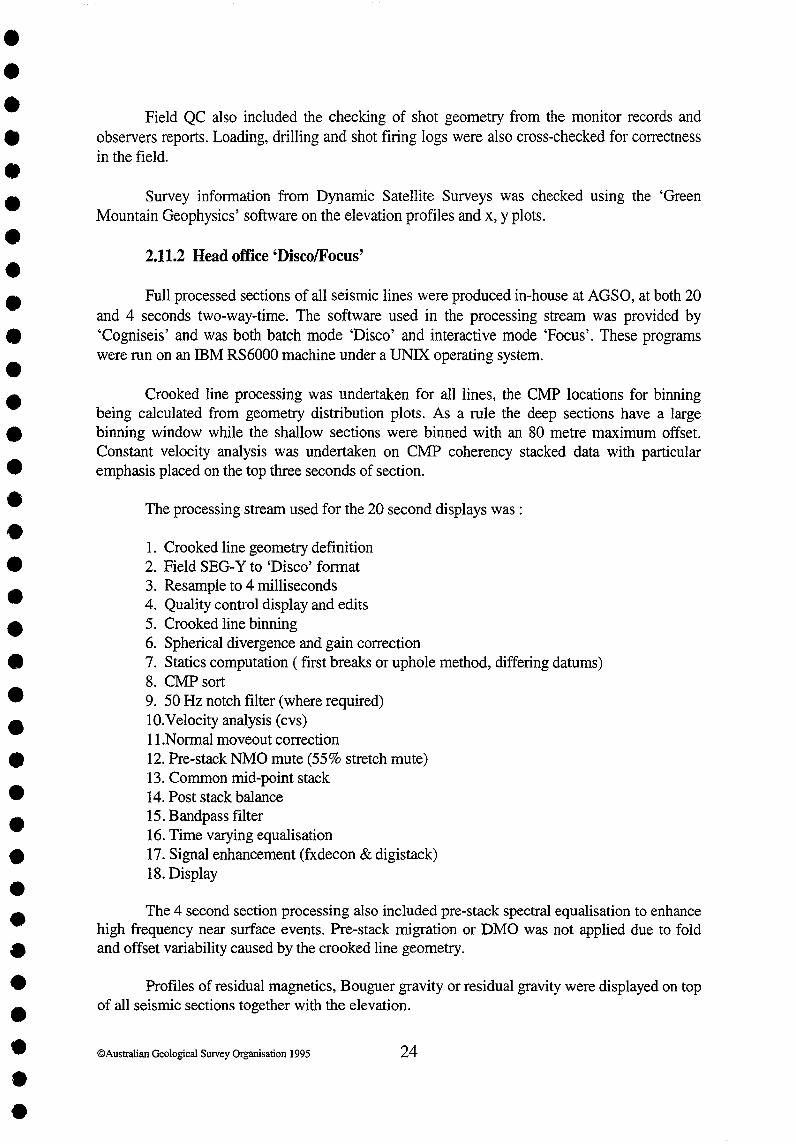
2.11.2 Head office 'DiscolFocus'
Full processed sections of all seismic lines were produced in-house at AGSO, at both 20 and 4 seconds two-way-time. The software used in the processing stream was provided by 'Cogniseis' and was both batch mode 'Disco' and interactive mode 'Focus'. These programs were run on an IBM RS6000 machine under a UNIX operating system.
Crooked line processing was undertaken for all lines, the CMP locations for binning being calculated from geometry distribution plots. As a rule the deep sections have a large binning window while the shallow sections were binned with an 80 metre maximum offset. Constant velocity analysis was undertaken on CMP coherency stacked data with particular emphasis placed on the top three seconds of section.
The processing stream used for the 20 second displays was :
1. Crooked line geometry definition 2. Field SEG-Y to 'Disco' format 3. Resample to 4 milliseconds 4. Quality control display and edits 5. Crooked line binning 6. Spherical divergence and gain correction 7. Statics computation (first breaks or uphole method, differing datums) 8. CMP sort 9. 50 Hz notch filter (where required) 10. Velocity analysis (cvs) II.Normal moveout correction 12. Pre-stack NMO mute (55% stretch mute) 13. Common mid-point stack 14. Post stack balance 15. Bandpass filter 16. Time varying equalisation 17. Signal enhancement (fxdecon & digistack) 18. Display
The 4 second section processing also included pre-stack spectral equalisation to enhance high frequency near surface events. Pre-stack migration or DMO was not applied due to fold and offset variability caused by the crooked line geometry.
Profiles of residual magnetics, Bouguer gravity or residual gravity were displayed on top of all seismic sections together with the elevation.
©AustraJian Geological Survey Organisation 1995 24

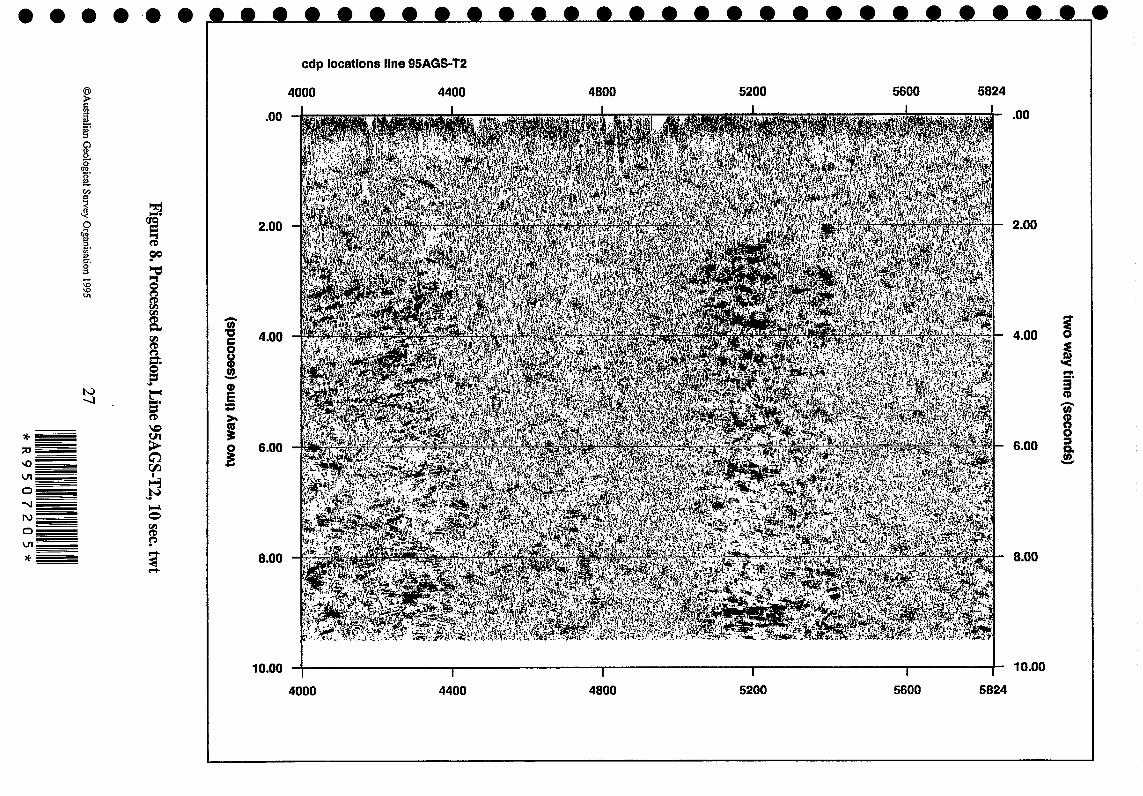
Highly compressed displays of stack data at 1:1 scale are shown in figs. 7 to 11. All linesshow data was obtained throughout the crust.
••
@Australian Geological Survey Organisation 1995^25

Figure 7. Processed section, Line 95AGS-T1, 10 sec. twt
©Australian Geological Survey Organisation 1995^26!IltifIRIN
• • • • • • III • • • • • • • • • • • • • • • • • • • • • • • • • • •
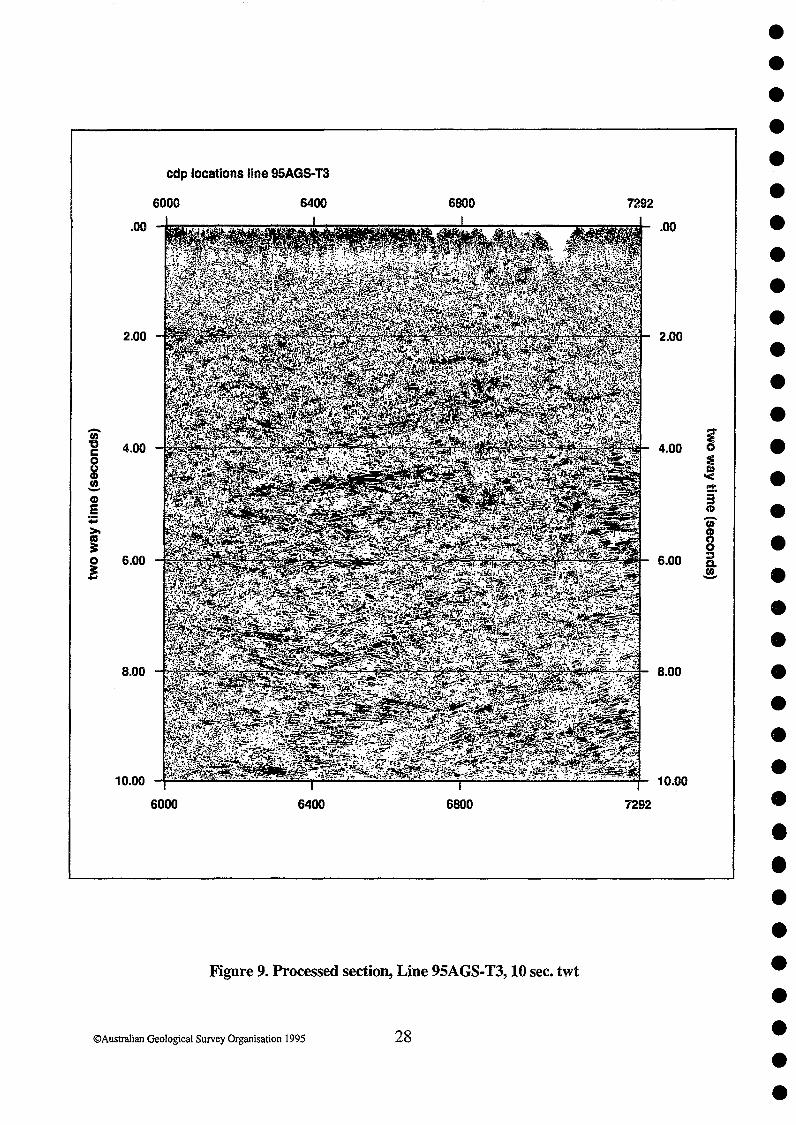

Figure 10. Processed sections, Lines 95AGS-T4, T5, 10 sec. twt
©A
ustralian Geological Survey O
rganisation 1995^29

cmp locations line 95ags-ab, horizontal exagerration x 5
2000
.00
2200 2237
.00
6.00 ^
2000
Figure 11. Processed section, Line 95AGS-AB, 6 sec. twt
@Australian Geological Survey Organisation 1995 30

• • • • • • • • • • • • • • • • • • • • • • • • • • • • • • • • • •
3. ACKNOWLEDGMENTS
The authors acknowledge the contributions and efforts made by all members of the 1995 T ASGO seismic survey team. The co-operation and assistance from Local Government authorities, landowners, exploration companies and the Tasmanian Government are appreciated.
In particular the following organisations and people are thanked.
Survey Design B. Drummond, T. Barton, K. Wake-Dyster (AGSO); R. Richardson, A. V. Brown (TGS).
Survey Crew T. Barton (scientific party leader), D. Johnstone, A. Owen (scientific officers) K. WakeDyster (operations manager), J. Leven (software development), S. Brandon ( eavesdropper hardware), B. Devenish (quality control and technology expert), A. Crawford (mechanical technician), J. Whatman, S. Thomas (technical officers), D. Eaton (driller), A. Porter (driller's offsider), S. Pardalis, A. Takken (loaders and shot firers), A. Cherry, R. Fisher, D. Keast, P. Kebblewhite, S. Nulsen (field hands), D. Hampton, S. Krushka, B. Ralph, G. Wright (locally recruited temporary field hands), R. Richardson, S. Hayward (TGS).
Gravity Readings R. Richardson (ISM).
Groundwater and Cuttings Sampling R. Donaldson (ISM), T. Barton (AGSO).
Field Office Rental H. and J. Turnbull (Tullah Lakeside Chalet); B. Yates (Fingal Community Centre).
Surveying Contractor P. Robinson, D. Williams, D. Brooks, B. Hedditch (Dynamic Satellite Surveys).
Environmental Issues D. Gatehouse, C. Bacon (TGS) T. Barton (AGSO) K. Lynd, P. Rainbird, (Hydroelectric Commission) O. Hedberg and staff (Land Resources Branch) G. Williams (Forestry Tasmania) innumerable land holders.
Road Signs 1. Foley, T. Scolyer, L. Braid, 1. Gillian, T. Berryman, B. Chillcott (Works Tasmania).
Drilling Contractors M. Lillas, Columbus Drilling (Line 1); M. Maxfield, Maxfield Nominees Pty. Ltd. (Lines 1 and 2).
Supply of Low Loader Holloway Transport, Devonport.
©Australian Geological Survey Organisation 1995 31

Supply of Gravel P. Beamish, Beamish Contractors, Burnie.
Explosives Licences and Use M. Robertson, C. Bacon, D. Blackaby, J. Coffey, S. Halfacre, J. Mollison (TGS).
Explosives Supply and Shipment M. Kelly, G. Burstow, N. Kramer (ICI)
Explosives Storage J. McGiveron, The Cornwall Coal Company NL, Fingal, ICI Hellyer Mine.
Car Hire Avis, Burnie, A. V. Browm (TGS)
Equipment Transhipment M. Brown, R. Ryder (Brambles Shipping) L. Pol den (Spirit of Tasmania)
Field Communications D. Schoe, Telecom Australia.
Data Processing T. Barton, D. Johnstone, A. Owen (AGSO).
Supervision and Customer Liaison B. Drummond (AGSO)
4. REFERENCES
A.S. 1742.3 - 1985. Australian standard - Traffic control devices for works on roads. Standards Association of Australia. ISBN 0 7262 3787 6
ACORPILITSAC Undated, c1979. Working Group in Tasmania, ACORP - Proposal for seismic reflection profiles in Tasmania. Tasmania Department Of Mines (unpublished)
Bacon, c.A. 1992. Mineral exploration code of practice (Second Edition). Tasmania Department of Mines: Hobart. ISBN 0 7246 4010 X
Burrett, c.F. & Martin, E.L (Editors), 1989. Geology and mineral resources of Tasmania, Geological Society of Australia Inc, Special Publication 15.
Dynamic Satellite Surveys, Final operations report, for AGSO, Tasmania February-April, 1995. DSS Report #95-36 (unpublished)
©Australian Geological Survey Organisation 1995 32
• • • • • • • • • • • • • • • • • • • • • • • • • • • • • • • • • •

• • • • • • • • • • • • • • • • • • • • • • • • • • • • • • • • • •
Read, J J. 1989. Seismic reflection investigations of the Hellyer orebody and Que - Hellyer volcanics, North West Tasmania. In 7th Geophysical Conference and Exhibition Abstracts. Exploration Geophysics, 20( 112), 159-162.
Richardson, R.G., 1995. Operations report - Gravity surveys of NGMA seismic traverses, 1995. Tasmania Development and Resources, Industry Safety and Mines, Tasmanian Geological Survey, Record 1995107.
Wake-Dyster, K.D., Johnstone D.W. & Owen, AJ. 1991. Otway Basin seismic test survey 1991: Operational report. Australian Geological Survey Organisation, Record 1994118.
Hill, PJ., Webber, K. & Survey 1481159 Shipboard Party. 1995. Deep crustal seismic survey, circum-Tasmania and South Tasman Rise : AGSO survey 1481159 post-cruise report. Australian Geological Survey Organisation, Record 1995113.
Tasmania NGMA project : Geological Framework of an "Island State with Potential", Draft Proposal for a new National Geoscience Mapping Accord (NGMA) Project 1994 to 1997, presented to the Tasmanian Chamber of Mines, at the Exploration Group's meeting in Launceston. 24 June 1994. (Unpublished AGSOIMRT document)
Yeates, A N. & Brown, AV. 1995. Tasmania NGMA Project "TASGO": Geological Framework of an "Island State with Potential", The first year and plans for 1995/96, presented to delegates attending the Tasmanian Chamber of Mines Exploration Division Meeting, Launceston 30 June 1995. (Unpublished AGSOIMRT document)
©Australian Geological Survey Organisation 1995 33

APPENDIXl
Operational Statistics and Timetable
Line pegging commenced
Contract drilling commenced Contract drilling completed
AGSO drill crew departed Canberra AGSO drilling commenced AGSO drilling completed AGSO drilling crew returned to Canberra
Contract surveying commenced Contract surveying completed
Recording crew departed Canberra Recording crew commenced acquisition Recording completed Recording crew returned to Canberra
Recording:
Total number of recording days worked Recording days lost:
Due to travel to and from Canberra Due to town shifts Due to adverse weather Due to instrument breakdown
CMPfold Total number of shots A verage number of production shots/recording day Explosives used Detonators used Average charge/production shot (lines Tl- T5)
(line AB)
Drilling: AGSO
Number of drilling rigs Total number of rig days worked Rig days lost:
Due to town shifts Due to adverse weather Due to equipment breakdowns and maintenance
©Australian Geological Survey Organisation 1995 34
16/111995
231111995 17/311995
21211995 61211995 22/311995 6/411995
12/211995 11/411995
14/211995 22/211995 8/411995 20/411995
32
4 4 2 o 10-20 765 23.9 7036 kg 809 10 kg 2kg
1 33
4 1 1
• • • • • • • • • • • • • • • • • • • • • • • • • • • • • • • • • •

• • • Shot holes:
• Total number of shot holes 199
• Total metres drilled 4,157.0m Average depth/shot hole 21.92 m
• Average number of holes/rig/day 6.0
• MAXFIELD • • Number of drilling rigs 1
Total number of rig days worked 35
• Shot holes: Total number of shot holes 362 • Total metres drilled 4252.5 m
• Average depth/shot hole (TI, T2) 11.57 m (AB) 5.0m
• Average number of holes/rig/day 10.3 • • COLUMBUS
• Number of drilling rigs 1 Total number of rig days worked 41
• Shot holes: Total number of shot holes 367 • Total metres drilled 4465.5 m
• Average depth/shot hole 12.17 m
• Average number of holes/rig/day 8.9
• • • • • • • • • • • • ©Australian Geological Survey Organisation 1995 35
• •
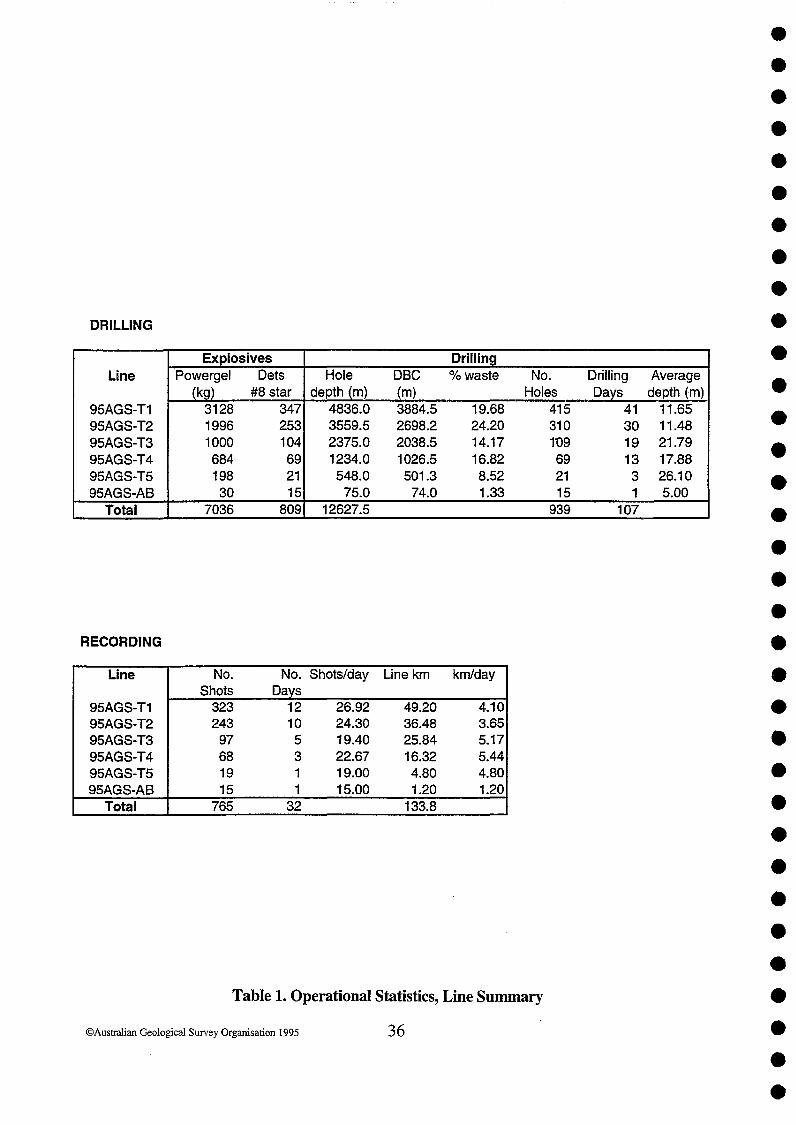
DRILLING
Explosives Drilling Line Powergel Dets Hole DBC % waste No.
(kg) #8 star depth (m) (m) Holes 95AGS-T1 3128 347 4836.0 3884.5 19.68 415 95AGS-T2 1996 253 3559.5 2698.2 24.20 310 95AGS-T3 1000 104 2375.0 2038.5 14.17 1'09 95AGS-T4 684 69 1234.0 1026.5 16.82 69 95AGS-T5 198 21 548.0 501.3 8.52 21 95AGS-AB 30 15 75.0 74.0 1.33 15
Total 7036 809 12627.5 939
RECORDING
Line No. No. Shots/day Line km kmlday Shots Days
95AGS-T1 323 12 26.92 49.20 4.10 95AGS-T2 243 10 24.30 36.48 3.65 95AGS-T3 97 5 19.40 25.84 5.17 95AGS-T4 68 3 22.67 16.32 5.44 95AGS-T5 19 1 19.00 4.80 4.80 95AGS-AB 15 1 15.00 1.20 1.20
Total 765 32 133.8
Table 1. Operational Statistics, Line Summary
©AustraJian Geological Survey Organisation 1995 36
Drilling Days
41 30 19 13 3 1
107
Average depth (m)
11.65 11.48 21.79 17.88 26.10 5.00
• • • • • • • • • • • • • • • • • • • • • • • • • • • • • • • • • •
• • • • • • • • • • • • • • • • • • • • • • • • • • • • • • • • • •
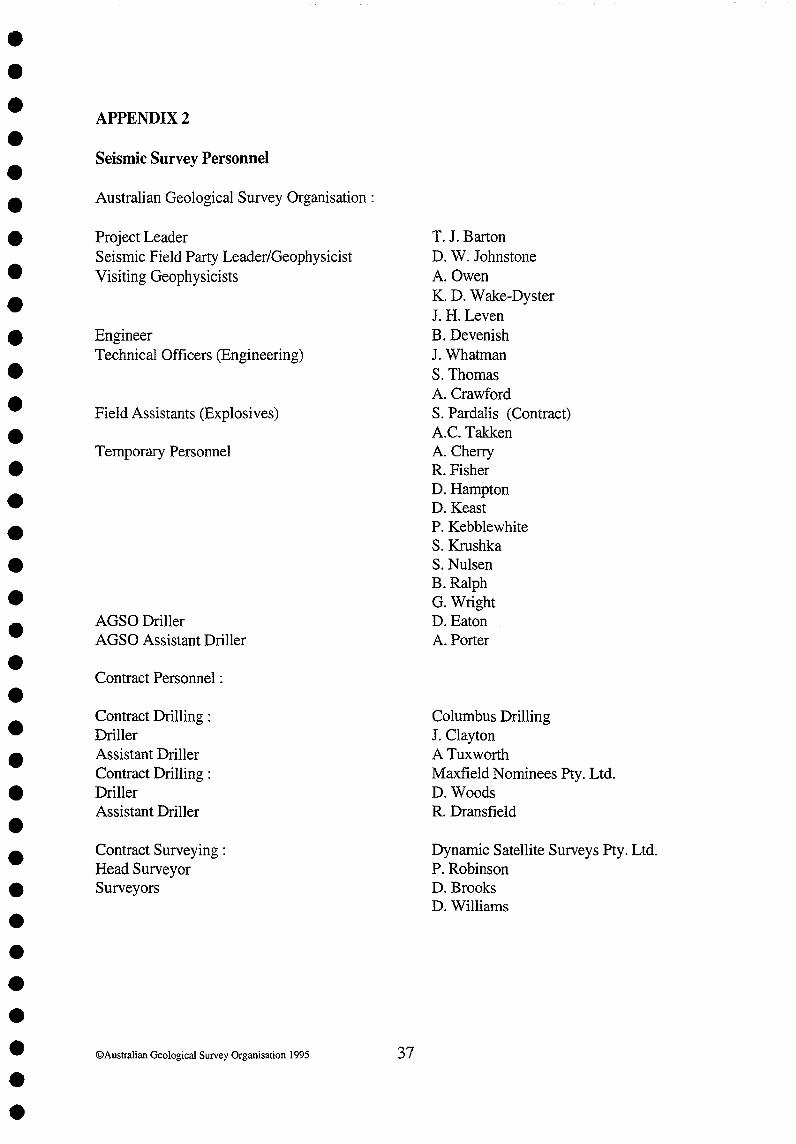
APPENDIX 2
Seismic Survey Personnel
Australian Geological Survey Organisation:
Project Leader Seismic Field Party Leader/Geophysicist Visiting Geophysicists
Engineer Technical Officers (Engineering)
Field Assistants (Explosives)
Temporary Personnel
AGSO Driller AGSO Assistant Driller
Contract Personnel :
Contract Drilling : Driller Assistant Driller Contract Drilling : Driller Assistant Driller
Contract Surveying : Head Surveyor Surveyors
©AustraIian Geological Survey Organisation 1995 37
T. J. Barton D. W. Johnstone A Owen K. D. Wake-Dyster J. H. Leven B. Devenish J. Whatman S. Thomas A Crawford S. Pardalis (Contract) AC. Takken A. Cherry R. Fisher D. Hampton D. Keast P. Kebblewhite S. Krushka S. Nulsen B. Ralph G. Wright D. Eaton A. Porter
Columbus Drilling J. Clayton A Tuxworth Maxfield Nominees Pty. Ltd. D. Woods R. Dransfield
Dynamic Satellite Surveys Pty. Ltd. P. Robinson D. Brooks D. Williams

APPENDIX 3
Seismic Survey Vehicles
Recording:
Recording truck Workshop/electronics truck Cable/stores truck Geophone carrier Geophone carrier Geophone carrier Geophone carrier Shooting truck Personnel carrier Reconnaissance vehicle Crew Chief vehicle
Drilling:
Drilling rig Drilling rig (Columbus)
Drilling rig (Maxfield)
Drill water tanker Preloading truck Stores/preloader truck Personnel carrier
Mercedes 911 4X4 Mercedes 911 4X4 Mercedes 911 4X4 Toyota Landcruiser 4X4 Tffop Toyota Landcruiser 4X4 Tffop Toyota Landcruiser 4X4 Tffop Toyota Landcruiser 4X4 Tffop Toyota Landcruiser 4X4 Tffop Toyota Landcruiser 4X4 SIW Toyota Landcruiser 4X4 SIW Toyota Camry
ZBE-748 ZBE-689 ZBE-687 ZRM-016 ZRM-017 ZRM-018 ZRM-020 ZRM-019 ZJE-152 ZJE-129 Leased by TGS for AGSO
Mayhew lOOOlMack R600, 8X6 ZBE-606 Atlas Copco 601IMAN truck Ingersoll Rand 750/250 compressor Atlas Copco 712H, track mounted Atlas Copco low volume compressor Mercedes 911 5 tonne 4X4 ZSU-782 Toyota Landcruiser, 4X4, Tffop ZJE-055 Toyota Landcruiser, 4X4, Tffop ZJE-015 Toyota Landcruiser 4X4 SIW ZJE-269
©Australian Geological Survey Organisation 1995 38
• • • • • • • • • • • • • • • • • • • • • • • • • • • • • • • • • •
• • • • • • • • • • • • • • • • • • • • • • • • • • • • • • • • • •
APPENDIX 4
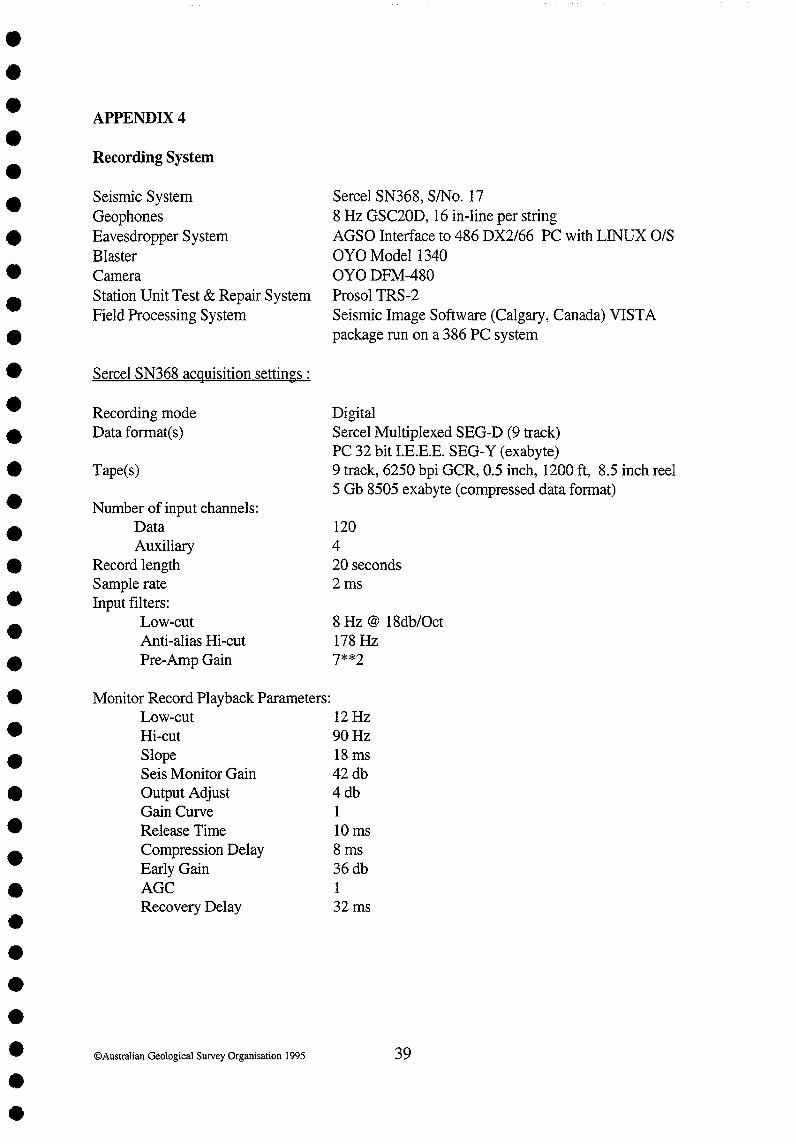
Recording System
Seismic System Geophones Eavesdropper System Blaster Camera Station Unit Test & Repair System Field Processing System
Sercel SN368 acquisition settings:
Recording mode Data format(s)
Tape(s)
Number of input channels: Data Auxiliary
Record length Sample rate Input filters:
Low-cut Anti-alias Hi-cut Pre-Amp Gain
Monitor Record Playback Parameters:
Sercel SN368, SINo. 17 8 Hz GSC20D, 16 in-line per string AGSO Interface to 486 DX2/66 PC with LINUX O/S OYO Model1340 OYODFM-480 Prosol TRS-2 Seismic Image Software (Calgary, Canada) VISTA package run on a 386 PC system
Digital Sercel Multiplexed SEG-D (9 track) PC 32 bit I.E.E.E. SEG-Y (exabyte) 9 track, 6250 bpi GCR, 0.5 inch, 1200 ft, 8.5 inch reel 5 Gb 8505 exabyte (compressed data format)
120 4 20 seconds 2ms
8 Hz @ 18db/Oct 178 Hz 7**2
Low-cut 12 Hz Hi-cut 90 Hz Slope 18 ms Seis Monitor Gain 42 db Output Adjust 4 db Gain Curve 1 Release Time 10 ms Compression Delay Early Gain AGC Recovery Delay
©Australian Geological Survey Organisation 1995
8ms 36 db 1 32ms
39
APPENDIX 5
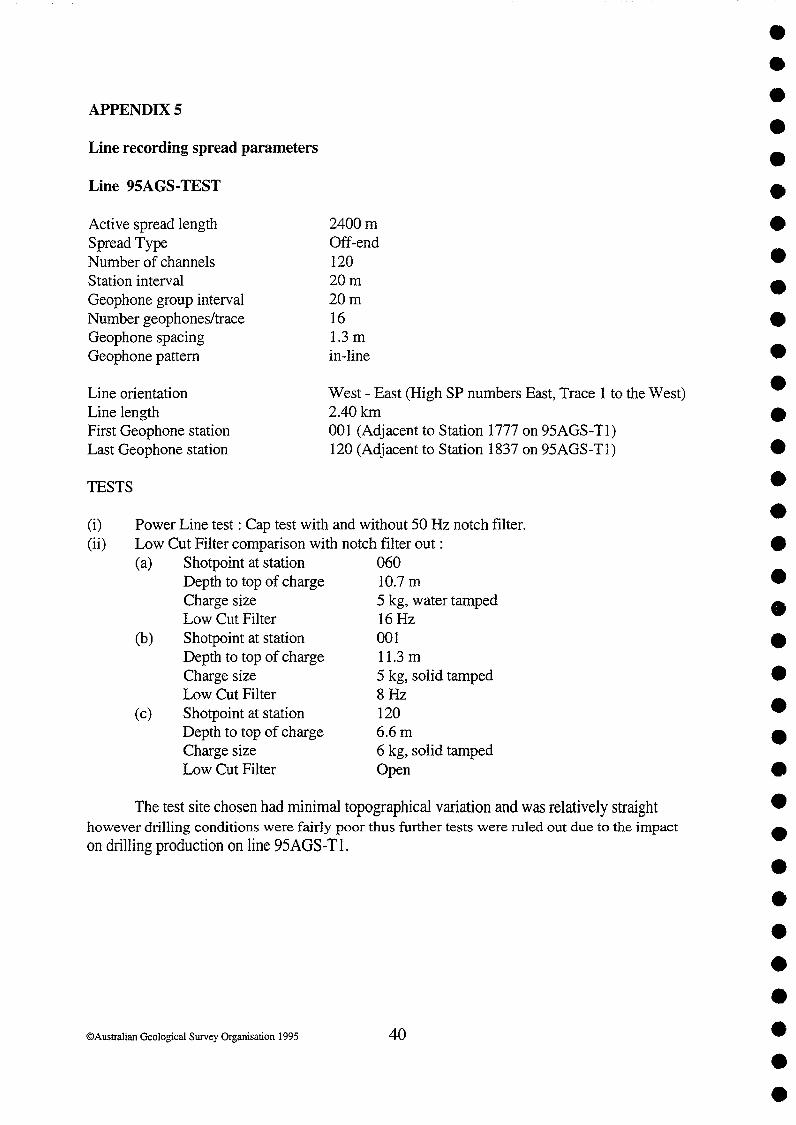
Line recording spread parameters
Line 95AGS-TEST
Active spread length Spread Type Number of channels Station interval Geophone group interval Number geophones/trace Geophone spacing Geophone pattern
Line orientation Line length First Geophone station Last Geophone station
TESTS
2400m Off-end 120 20m 20m 16 1.3 m in-line
West - East (High SP numbers East, Trace 1 to the West) 2AOkIn 001 (Adjacent to Station 1777 on 95AGS-Tl) 120 (Adjacent to Station 1837 on 95AGS-Tl)
(i) (ii)
Power Line test: Cap test with and without 50 Hz notch filter. Low Cut Filter comparison with notch filter out: (a) Shotpoint at station 060
Depth to top of charge 10.7 m Charge size 5 kg, water tamped Low Cut Filter 16 Hz
(b) Shotpoint at station 001 Depth to top of charge 11.3 m Charge size 5 kg, solid tamped Low Cut Filter 8 Hz
(c) Shotpoint at station 120 Depth to top of charge 6.6 m Charge size 6 kg, solid tamped Low Cut Filter Open
The test site chosen had minimal topographical variation and was relatively straight however drilling conditions were fairly poor thus further tests were ruled out due to the impact
on drilling production on line 95AGS-Tl.
©Austra1ian Geological Survey Organisation 1995 40
• • • • • • • • • • • • • • • • • • • • • • • • • • • • • • • • • •

• • • • • • • • • • • • • • • • • • • • • • • • • • • • • • • • • •
Line 95AGS-Tl
Active spread length Spread Type Number of channels Station interval Geophone group interval Number geophones/trace Geophone spacing Geophone pattern Shotpoint interval (nominal) Hole depth (nominal) Charge size CMP fold (nominal) Line orientation Line length First Geophone station Last Geophone station First Shotpoint Last shotpoint
Line 95A GS-T2
Active spread length Spread Type Number of channels Station interval Geophone group interval Number geophones/trace Geophone spacing Geophone pattern Shotpoint interval (nominal) Hole depth (nominal) Charge size CMP fold (nominal) Line orientation Line length First Geophone station Last Geophone station First Shotpoint Last shotpoint
©Austra1ian Geological Survey Organisation 1995
4760m Split Spread 120 40m 40m 16 2.67m in-line 120m 12m up to 10 kg 20 West - East (High SP numbers East, Trace I to the West) 49.20km 1000 2230 1000 2230
4760m Split Spread 120 40m 40m 16 2.67m in-line 120m 12m up to 10 kg 20 West - East (High SP numbers East, Trace 1 to the West) 36.48 km 2000 2912 2000 2912
41

Line 9SAGS-T3
Active spread length Spread Type Number of channels Station interval Geophone group interval Number geophones/trace Geophone spacing Geophone pattern Shotpoint interval (nominal) Hole depth (average) Charge size CMP fold (nominal) Line orientation Line length First Geophone station Last Geophone station First Shotpoint Last shotpoint
Line 9SAGS-T4
Active spread length Spread Type Number of channels Station interval Geophone group interval Number geophones/trace Geophone spacing Geophone pattern Shotpoint interval (nominal) Hole depth (average) Charge size
4760m Split Spread 120 40m 40m 16 2.67m in-line 240m 30m 10 kg 10 West - East (High SP numbers East, Trace 1 to the West) 25.84km 3000 3646 3000 3646
4760m Split Spread 120 40m 40m 16 2.67m in-line 240m 30m 10 kg 10 CMP fold (nominal)
Line orientation North-South (High SP numbers South, Trace 1 to the North)
Line length First Geophone station Last Geophone station First Shotpoint Last shotpoint
©Australian Geological Survey Organisation 1995
16.32 km 4000 4408 4000 4408
42
• • • • • • • • • • • • • • • • • • • • • • • • • • • • • • • • • •

• • • • Line 9SAGS-TS
• • • • • • • • • • • • • • • • • • • • • • • • •
Active spread length Spread Type Number of channels Station interval Geophone group interval Number geophones/trace Geophone spacing Geophone pattern Shotpoint interval (nominal) Hole depth (average) Charge size CMP fold (nominal) Line orientation Line length First Geophone station Last Geophone station First Shotpoint Last shotpoint
Line 9SAGS-AB
Active spread length Spread Type Number of channels Station interval Geophone group interval Number geophones/trace Geophone spacing Geophone pattern Shotpoint interval (nominal) Hole depth (nominal) Charge size CMP fold (nominal) Line orientation Line length First Geophone station Last Geophone station First Shotpoint Last shotpoint
4760m Split Spread 120 40m 40m 16 2.67m in-line 240m 32m 10 kg 10
North-South (High SP numbers South, Trace 1 to the North) 4.S0km 5000 5120 5001 5120
4760m Split Spread 120 10m 20m 16 1.3 m in-line 60m 5m 2kg 20 West - East (High SP numbers East, Trace 1 to the West) 1.20km 1000 (at same location as 2132 on 95AGS-T2) 111S 1000 1118
• • • • • ©Australian Geological Survey Organisation 1995 43

• • • APPENDIX 6 • SEISMIC FIELD TAPE INDEX • SEG-D (9 track) • Tape No. Line Shotpoints Recording Dates Record Mode Survey • ---------------------------------------------------------------------------------------------------------------
95001 95AGS-Tl Test shots 22/02/95-22/02/95 6250 bpi GCR TASGO 1995 • 95002 95AGS-Tl 1000-1075 23/02/95-23/02/95 6250 bpi GCR TASGO 1995 • 95003 95AGS-TI 1078-1159 22/02/95-22/02/95 6250 bpi GCR TASGO 1995 95004 95AGS-TI 1162-1252 22/02/95-22/02/95 6250 bpi GCR TASGO 1995 • 95005 95AGS-TI 1255-1320 22/02/95-22/02/95 6250 bpi GCR TASGO 1995 95006 95AGS-Tl 1331-1390 22/02/95-22/02/95 6250 bpi GCR TASGO 1995 • 95007 95AGS-Tl 1396-1459 23/02/95-23/02/95 6250 bpi GCR TASGO 1995 • 95008 95AGS-Tl 1462-1527 22/02/95-22/02/95 6250 bpi GCR TASGO 1995 95009 95AGS-Tl 1531-1576 22/02/95-22/02/95 6250 bpi GCR TASGO 1995 • 9501 0 95AGS-T2 2000-2066 22/02/95-22102/95 6250 bpi GCR TASGO 1995 • 95011 95AGS-T2 2069-2159 22/02/95-22/02/95 6250 bpi GCR TASGO 1995 • 95012 95AGS-T2 2161-2261 22/02/95-22/02/95 6250 bpi GCR TASGO 1995 95013 95AGS-T2 2264-2345 22/02/95 -22/02/95 6250 bpi GCR TASGO 1995 • 95014 95AGS-T2 2352-2435 22/02/95-22/02/95 6250 bpi GCR TASGO 1995 95015 95AGS-T2 2438-2534 22/02/95-22/02/95 6250 bpi GCR TASGO 1995 • 95016 95AGS-T2 2537-2603 22/02/95-22/02/9 5 6250 bpi GCR TASGO 1995 95017 95AGS-T2 2606-2675 22/02/95-22/02/95 6250 bpi GCR TASGO 1995 • 95018 95AGS-T2 2678-2741 22/02/95-22/02/95 6250 bpi GCR TASGO 1995 • 95019 95AGS-T2 2744-2816 22/02/95-22/02/95 6250 bpi GCR TASGO 1995 95020 95AGS-T2 2819-2891 22/02/95-22/02/95 6250 bpi GCR TASGO 1995 • 95021 95AGS-T2 2897-2912 22/02/95 -22/02/95 6250 bpi GCR TASGO 1995 • 95022 95AGS-AB 1000-1118 22/02/95-22/02/95 6250 bpi GCR TASGO 1995 • 95023 95AGS-Tl 1588-1662 22/02/95-22/02/95 6250 bpi GCR TASGO 1995 • 95024 95AGS-Tl 1666-1744 22/02/95-22/02/9 5 6250 bpi GCR TASGO 1995 95025 95AGS-Tl 1747-1849 22/02/95-22/02/95 6250 bpi GCR T AS GO 1995 • 95026 95AGS-T1 1858-1954 22/02/95-22/02/95 6250 bpi GCR T AS GO 1995 95027 95AGS-T1 1957-2053 22/02/95-22/02/95 6250 bpi GCR T ASGO 1995 • 95028 95AGS-T1 2062-2152 22/02/95-22/02/95 6250 bpi GCR T ASGO 1995 • 95029 95AGS-Tl 2155-2224 22/02/95-22/02/95 6250 bpi GCR TASGO 1995 95030 95AGS-Tl 2227-2230 22/02/95-22/02/95 6250 bpi GCR TASGO 1995 • 95031 95AGS-T3 3000-3144 22/02/95-22/02/95 6250 bpi GCR TASGO 1995 • 95032 95AGS-T3 3150-3278 22/02/95-22/02/95 6250 bpi GCR TASGO 1995 • 95033 95AGS-T3 3284-3424 22/02/95-22/02/95 6250 bpi GCR TASGO 1995 95034 95AGS-T3 3449-3565 22/02/95-22/02/95 6250 bpi GCR TASGO 1995 • 95035 95AGS-T3 3578-3646 22/02/95-22/02/95 6250 bpi GCR TASGO 1995 • ©Australian Geological Survey Organisation 1995 44 • • •

• • • • • • • • • • • •
Tape No. Line Shotpoints Recording Dates Record Mode Survey ---------------------------------------------------------------------------------------------------------------
95036 95AGS-T4 4000-4114 22/02/95-22/02/95 6250 bpi GCR TASGO 1995 95037 95AGS-T4 4120-4246 22/02/95-22/02/95 6250 bpi GCR TASGO 1995 95038 95AGS-T4 4252-4396 22/02/95-22/02/95 6250 bpi GCR TASGO 1995 95039 95AGS-T4 4403-4408 22/02/95-22/02/95 6250 bpi GCR TASGO 1995
95040 95AGS-T5 5001-5120 22/02/95-22/02/95 6250 bpi GCR TASGO 1995
95041 95AGS-AB2 1006-1138 22/02/95-22/02/95 6250 bpi GCR TASGO 1995 95042 95AGS-AB2 1144-1288 22/02/95-22/02/95 6250 bpi GCR T ASGO 1995 95043 95AGS-AB2 1294-1300 22/02/95-22/02/95 6250 bpi GCR T AS GO 1995
• SEG·Y (I.E.E.E 32 bit, 5 Gb compressed, exabyte)
• • • • • • • • • • • • • • • • • • • • •
Tape No. FFID Range Record Mode Survey -----------------------------------------------------------------------------------------------EV95T01 2-6 UNIX 'TAR' (Exabyte) TASGO 1995 EV95T02 9 -43 UNIX 'TAR' (Exabyte) TASGO 1995 EV95T03 44- 84 UNIX 'TAR' (Exabyte) TASGO 1995 EV95T04 85 - 140 UNIX 'TAR' (Exabyte) TASGO 1995 EV95T05 141 - 174 UNIX 'TAR' (Exabyte) TASGO 1995 EV95T06 176 - 190 UNIX 'TAR' (Exabyte) TASGO 1995 EV95T07 176 - 213 UNIX 'TAR' (Exabyte) TASGO 1995 EV95T08 215 - 225 UNIX 'TAR' (Exabyte) TASGO 1995 EV95T09 226 - 252 UNIX 'TAR' (Exabyte) TASGO 1995 EV95T1O 226 - 287 UNIX 'TAR' (Exabyte) TASGO 1995 EV95Tl1 288 - 303 UNIX 'TAR' (Exabyte) TASGO 1995 EV95T12 304 - 335 UNIX 'TAR' (Exabyte) TASGO 1995 EV95T13 336 - 360 UNIX 'TAR' (Exabyte) TASGO 1995 EV95T14 361 - 402 UNIX 'TAR' (Exabyte) TASGO 1995 EV95T15 404 - 439 UNIX 'TAR' (Exabyte) TASGO 1995 EV95T16 440 - 458 UNIX 'TAR' (Exabyte) TASGO 1995 EV95T17 460 - 475 UNIX 'TAR' (Exabyte) TASGO 1995 EV95T18 460 - 497 UNIX 'TAR' (Exabyte) TASGO 1995 EV95T19 499 - 536 UNIX 'TAR' (Exabyte) TASGO 1995 EV95T20 537 - 548 UNIX 'TAR' (Exabyte) TASGO 1995 EV95T21 549 - 564 UNIX 'TAR' (Exabyte) TASGO 1995 EV95T22 565 - 592 UNIX 'TAR' (Exabyte) TASGO 1995 EV95T23 593 - 626 UNIX 'TAR' (Exabyte) TASGO 1995 EV95T24 627 - 643 UNIX 'TAR' (Exabyte) TASGO 1995 EV95T25 645 - 666 UNIX 'TAR' (Exabyte) TASGO 1995 EV95T26 645 - 697 UNIX 'TAR' (Exabyte) TASGO 1995 EV95T27 698 - 718 UNIX 'TAR' (Exabyte) TASGO 1995
©Australian Geological Survey Organisation 1995 45
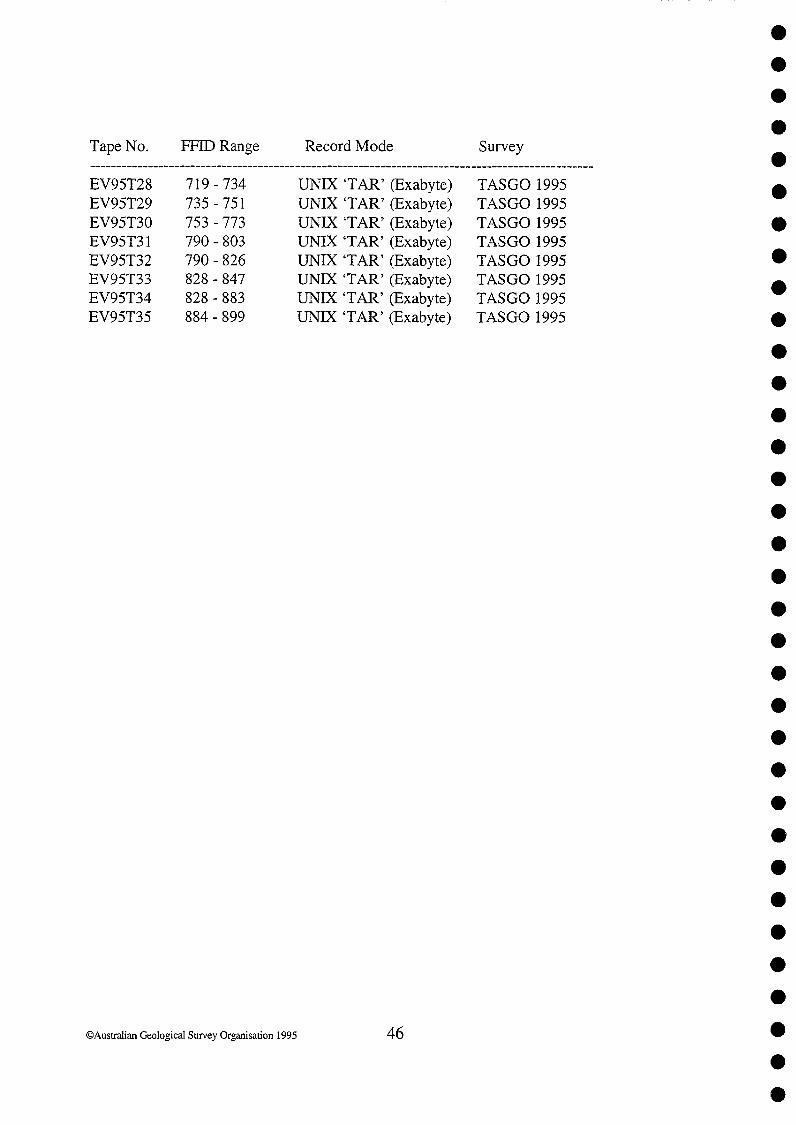
Tape No. FFID Range Record Mode Survey -----------------------------------------------------------------------------------------------EV95T28 719 - 734 UNIX 'TAR' (Exabyte) TASGO 1995 EV95T29 735-751 UNIX 'TAR' (Exabyte) TASGO 1995 EV95T30 753 -773 UNIX 'TAR' (Exabyte) TASGO 1995 EV95T31 790 - 803 UNIX 'TAR' (Exabyte) TASGO 1995 EV95T32 790 - 826 UNIX 'TAR' (Exabyte) TASGO 1995 EV95T33 828 - 847 UNIX 'TAR' (Exabyte) TASGO 1995 EV95T34 828 - 883 UNIX 'TAR' (Exabyte) TASGO 1995 EV95T35 884 - 899 UNIX 'TAR' (Exabyte) TASGO 1995
©Australian Geological Survey Organisation 1995 46
• • • • • • • • • • • • • • • • • • • • • • • • • • • • • • • • • •
• • • • • • • • • • • • • • • • • • • • • • • • • • • • • • • • • •
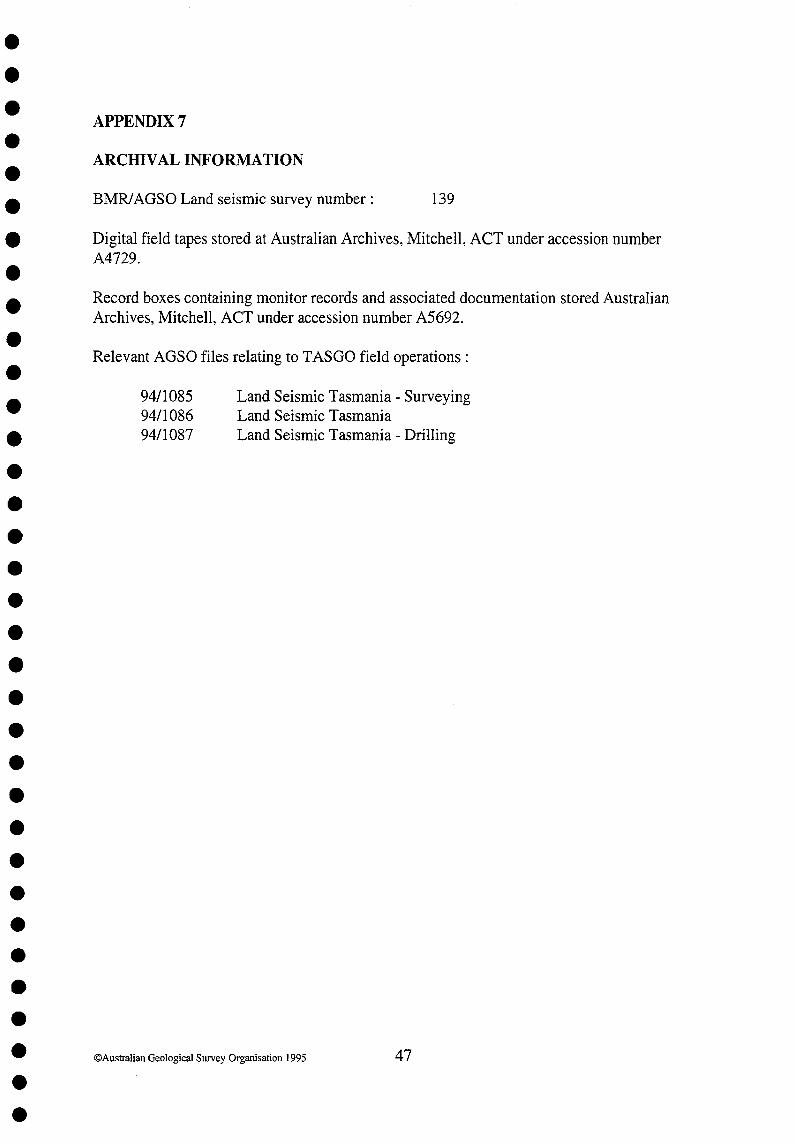
APPENDIX 7
ARCHIVAL INFORMATION
BMRJAGSO Land seismic survey number: 139
Digital field tapes stored at Australian Archives, Mitchell, ACT under accession number A4729.
Record boxes containing monitor records and associated documentation stored Australian Archives, Mitchell, ACT under accession number A5692.
Relevant AGSO files relating to T ASGO field operations:
9411085 9411086 9411087
Land Seismic Tasmania - Surveying Land Seismic Tasmania Land Seismic Tasmania - Drilling
©Australian Geological Survey Organisation 1995 47
APPENDIX 8
ENVIRONMENTAL MANAGEMENT PLAN: AGSO SEISMIC SURVEY, JAN-APRIL 1995
INTRODUCTION
As part of the Australian National Geoscience Mapping Accord (NGMA), the Australian Geological Survey Organisation (AGSO) proposes to conduct seismic reflection profiling over a number of regions in Tasmania in early 1995. This research is aimed at achieving a better understanding of the sub-surface structure in regions of considerable mineral resource potential. Part of the work is aimed at determining the depth of the Tasmania Basin which may have potential hydrocarbon prospectivity. Experience in other parts of Australia has shown that AGSO seismic reflection profiling techniques for investigating the deep geologic structure provides a new perspective on geologic evolution not available using other techniques.
The proposed traverses pose a number of particular technical and environmental problems in the acquisition of seismic data. All the lines are along existing roads to avoid the need for any line clearing, most of the terrain is hilly and the roads are not as straight as would be desired. All of the lines have extensive hard rock cover and areas of sensitive vegetation. These all present specific difficulties for setting recording parameters. Some of these problems will be addressed in a short series of tests along parts of these lines prior each lines acquisition.
This Environmental Management Plan has been formulated to address matters relating to the conduct of AGSO seismic work in Tasmania during January - April 1995. Fig 1 shows the location of the five proposed seismic lines. In general the work will be carried out in compliance with the AGSO Code of Environmental Practice. Some specific areas of concern relating to the proposed lines are covered in a later section of this document. Initial reconnaissance was carried out in conjunction with Industry Safety and Mines (ISM) in November 1993 and followed up by a second visit in November 1994 to finalise line placement. In conjunction with ISM matters concerning access to seismic lines, land ownership, possible environmental degradation are currently being addressed. Attached to this document are detailed descriptions of the routes for the proposed seismic lines and other pertinent information.
CO-OPERATIVE PARTNERS
The proposed 1995 Tasmanian seismic profiles will be conducted under the National Geoscience Mapping Accord (NGMA) which provides a mechanism for co-operative research and geological mapping between State and Commonwealth geoscience institutions, universities and industry.
©Australian Geological Survey Organisation 1995 48
• • • • • • • • • • • • • • • • • • • • • • • • • • • • • • • • • •
• • • • • • • • • • • • • • • • • • • • • • • • • • • • • • • • • •
The partners in the T ASGO project are:
1. The Australian Geological Survey Organisation (AGSO), a research bureau of the Commonwealth Department of Primary Industry & Energy (DPIE).
2. Tasmanian Geological Survey, within Industry Safety and Mines (ISM), Tasmania Development and Resources.
The co-operative partners in this project are jointly responsible for the preparation of this document which was drafted by T. Barton, Project Scientist, T ASGO project, AGSO.
PROPOSED SCHEDULE
It is proposed that line surveying and drilling commence in mid January 1995. Data acquisition is expected to begin in mid February. Field operations are anticipated to be completed by the end of March. Details of timing for individual lines is given in the appendices.
SPECIFIC ENVIRONMENTAL ISSUES
It is proposed to conduct the seismic survey in areas of Tasmania. Although all are along roads and road reserves, each have some special requirements. It is in the interests of all concerned that the work practices of the AGSO seismic crew and contractors engaged by AGSO do not impinge on the environment in any lasting way. To minimise impact along the Pieman Road (95AGS-Tl) drilling operations will be carried out in such a way as not to cause any damage to the road pavement Little, if any, drilling is anticipated greater than 10 m from the road verge. It is most probable that the drill rig will be mounted on a low loader.
The Cradle Mountain Link Road (95AGS-T2) presents a number of special problems for shothole drilling. In particular the first 15 km of road verge has been totally rehabilitated and disturbances of the verges would interfere with this recently completed very expensive rehabilitation plan. One option being explored to minimise any impact is to drill from the road with a rig mounted on a low loader. This would require a lane closure around drilling operations and traffic control. For the remainder of the line, work would be carried out off the road verge. The technical feasibility of such an operation on this road will be determined when AGSO selects a drilling contractor for the work.
The Mathinna (95AGS-T3), Woodbury (95AGS-T4) and Ouse (95AGS-T5) lines are all along road verges and present no specific environmental difficulties which are not covered in the AGSO Code of Environmental Practice.
If you require more information please contact:
Mr Tim Barton (Seismic Crew Leader) or Mr A N (Tony) Yeates (Project Coordinator) Telephone: (06) 249 9625 Telephone: (06) 249 9335 Fax: (06) 249 9972 Fax: (06) 249 9983
©Australian Geological Survey Organisation 1995 49

LINE DESCRIPTION: 9SAGS-Tl PIEMAN RIVER ROAD
1. MAP SHEET AREAS
1 :250 000 scale: Tasmania NW 1: 100 000 scale: Pieman, Sophia Special: 1 :25 000 Mt. Read Volcanics Project (1986) Map 2 Geology of the
Rosebery - Mt. Block area 1 :25 000 Regional Geology of the Dundas - Mt. Lindsay - Mt. Ramsay area (1983) Parts 1 & 2 1:50000 Corinna (1991) Geological Atlas Series. Sheet 7914N
2. LOCAL GOVERNMENT
WaratahlWynyard West Coast
3. TRAVERSE DESCRIPTION
The proposed traverse commences approximately 1 km west of the Stanley River along the Pieman River road and continues to the intersection with the Murchison Highway. The line then follows the highway southeast for 2 km then continues along a HEC access road up to the Macintosh Dam wall.
The Pieman Road is an all bitumen road with very limited road verge available to allow for operations to be carried out off the road. This will require drilling operations to be carried out from the road using suitable machinery to avoid damage to the road surface. Little if any drilling is possible along the Murchison Highway section due to the traffic volume along the road and limited access to drill hole locations. The dam road presents no practical difficulties.
The nominal shot hole spacing is 120m with expected hole depths of 12 - 15m. Drilling will be carried out using a track-mounted rig, possibly on the rear of a low loader. All operations will be required to be done along the road, limiting access along the specific areas being worked to a single lane.
No line clearing will be required along any part of this traverse. No major security problems are envisioned along the Pieman or dam Roads. However, some measures will be required along the 2 km highway section. The crew will be based in Tullah for this line.
Traverse Length : 51 km
4. CONTACTS FOR OPERATIONS
Mr Kevin Lynd Asset Co-Ordinator - West Coast Hydro Electric Commission EBU Building
©Australian Geological Survey Organisation 1995 50
• • • • • • • • • • • • • • • • • • • • • • • • • • • • • • • • • •
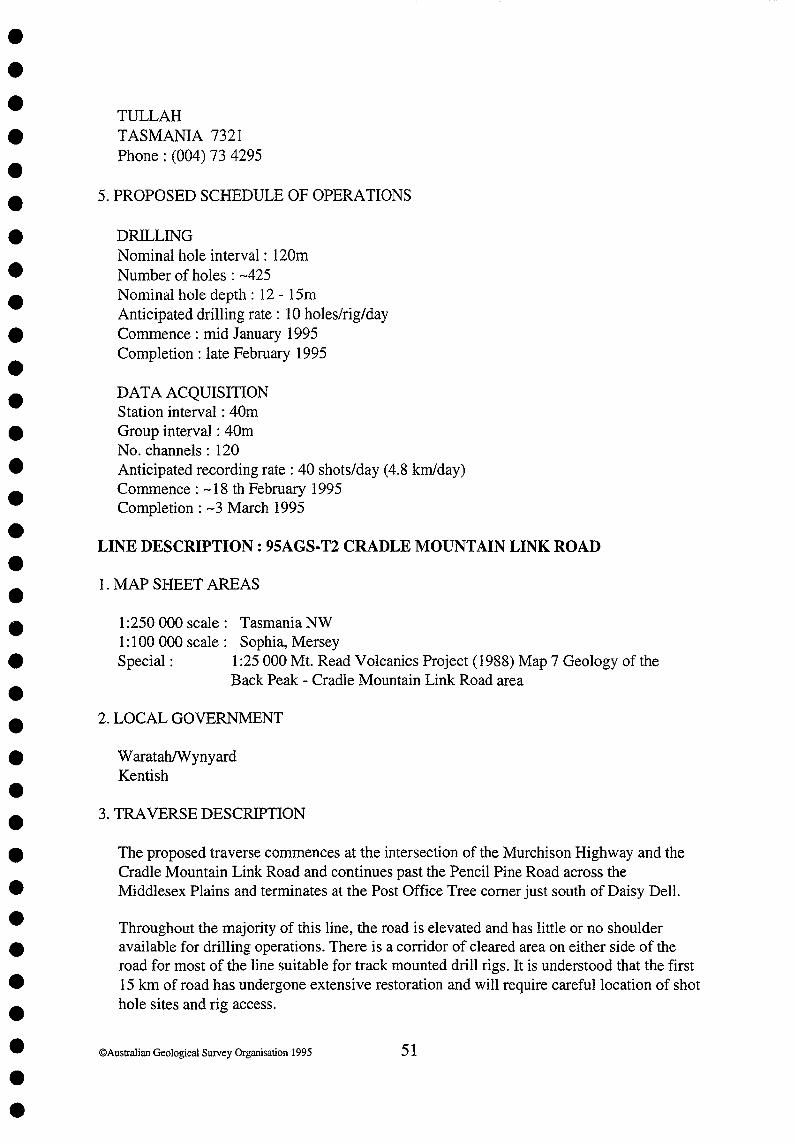
• • • • • • • • • • • • • • • • • • • • • • • • • • • • • • • • • •
TULLAH TASMANIA 7321 Phone: (004) 734295
5. PROPOSED SCHEDULE OF OPERATIONS
DRILLING Nominal hole interval: 120m Number of holes: -425 Nominal hole depth: 12 - 15m Anticipated drilling rate: 10 holes/rig/day Commence: mid January 1995 Completion: late February 1995
DATA ACQUISITION Station interval : 40m Group interval: 40m No. channels: 120 Anticipated recording rate: 40 shots/day (4.8 kmlday) Commence: -18 th February 1995 Completion: -3 March 1995
LINE DESCRIPTION: 9SAGS-T2 CRADLE MOUNTAIN LINK ROAD
1. MAP SHEET AREAS
1 :250 000 scale: Tasmania NW 1 : 100 000 scale: Sophia, Mersey Special: 1 :25 000 Mt. Read Volcanics Project (1988) Map 7 Geology of the
Back Peak - Cradle Mountain Link Road area
2. LOCAL GOVERNMENT
WaratahlWynyard Kentish
3. TRAVERSE DESCRIPTION
The proposed traverse commences at the intersection of the Murchison Highway and the Cradle Mountain Link Road and continues past the Pencil Pine Road across the Middlesex Plains and terminates at the Post Office Tree comer just south of Daisy Dell.
Throughout the majority of this line, the road is elevated and has little or no shoulder available for drilling operations. There is a corridor of cleared area on either side of the road for most of the line suitable for track mounted drill rigs. It is understood that the first 15 km of road has undergone extensive restoration and will require careful location of shot hole sites and rig access.
©Australian Geological Survey Organisation 1995 51
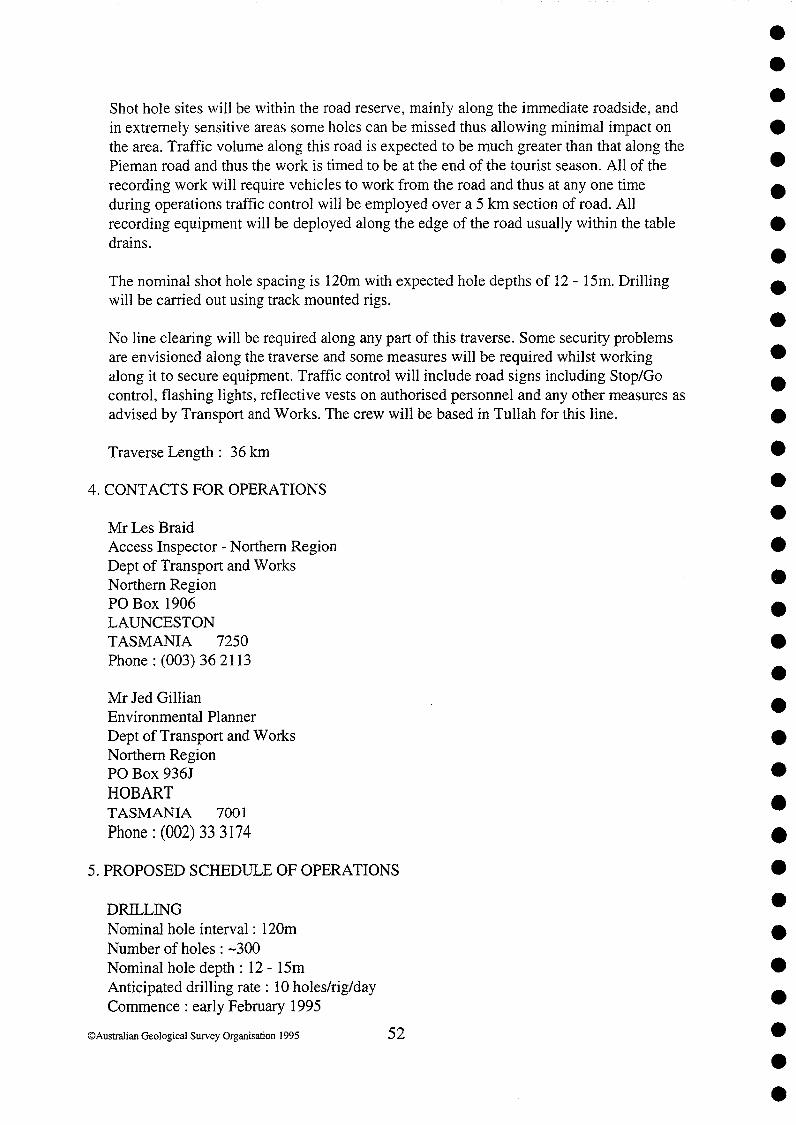
Shot hole sites will be within the road reserve, mainly along the immediate roadside, and in extremely sensitive areas some holes can be missed thus allowing minimal impact on the area. Traffic volume along this road is expected to be much greater than that along the Pieman road and thus the work is timed to be at the end of the tourist season. All of the recording work will require vehicles to work from the road and thus at anyone time during operations traffic control will be employed over a 5 km section of road. All recording equipment will be deployed along the edge of the road usually within the table drains.
The nominal shot hole spacing is 120m with expected hole depths of 12 - 15m. Drilling will be carried out using track mounted rigs.
No line clearing will be required along any part of this traverse. Some security problems are envisioned along the traverse and some measures will be required whilst working along it to secure equipment. Traffic control will include road signs including Stop/Go control, flashing lights, reflective vests on authorised personnel and any other measures as advised by Transport and Works. The crew will be based in Tullah for this line.
Traverse Length: 36 km
4. CONTACTS FOR OPERATIONS
MrLes Braid Access Inspector - Northern Region Dept of Transport and Works Northern Region PO Box 1906 LAUNCESTON TASMANIA 7250 Phone: (003) 36 2113
Mr Jed Gillian Environmental Planner Dept of Transport and Works Northern Region PO Box 936J HOBART TASMANIA 7001
Phone: (002) 33 3174
5. PROPOSED SCHEDULE OF OPERATIONS
DRILLING Nominal hole interval: 120m Number of holes: -300 Nominal hole depth: 12 - 15m Anticipated drilling rate: 10 holes/rig/day Commence: early February 1995
©Australian Geological Survey Organisation 1995 52
• • • • • • • • • • • • • • • • • • • • • • • • • • • • • • • • • •
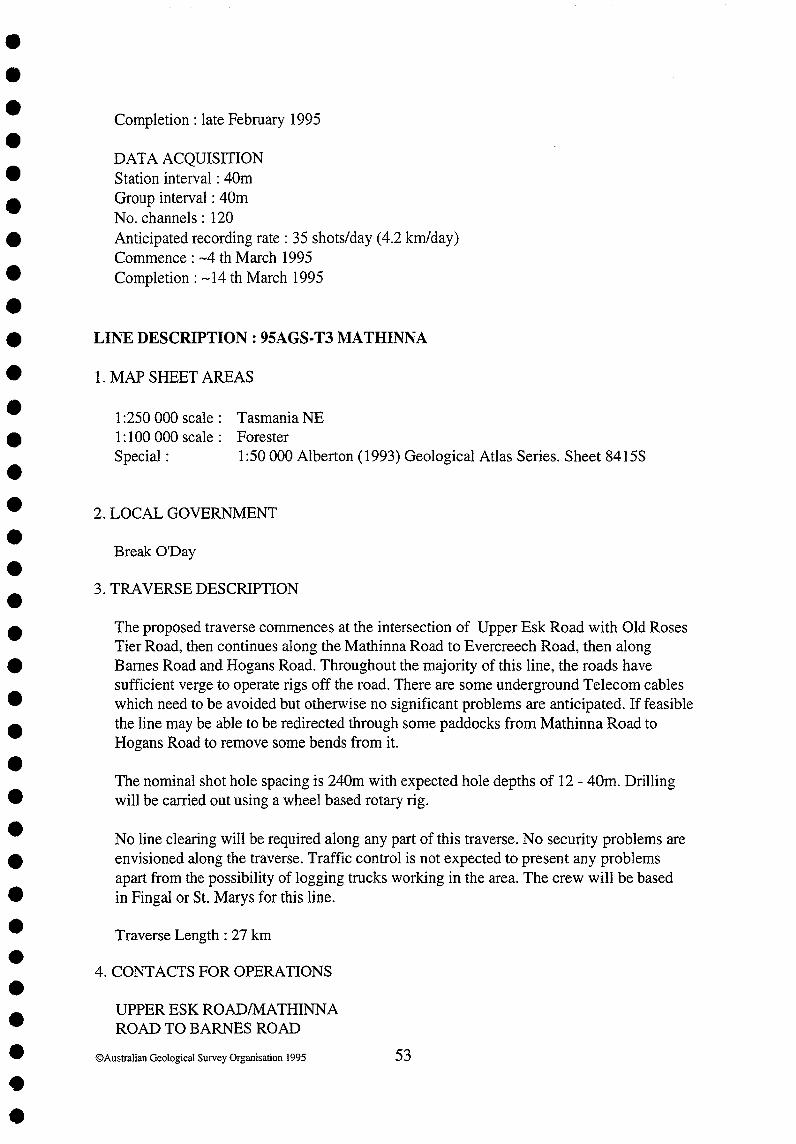
• • • • • • • • • • • • • • • • • • • • • • • • • • • • • • • • • •
Completion: late February 1995
DATA ACQUISITION Station interval: 40m Group interval : 40m No. channels: 120 Anticipated recording rate: 35 shots/day (4.2 kmlday) Commence: -4 th March 1995 Completion: -14 th March 1995
LINE DESCRIPTION: 95AGS· T3 MATHINNA
1. MAP SHEET AREAS
1 :250 000 scale: Tasmania NE 1: 100 000 scale: Forester Special: 1 :50000 Alberton (1993) Geological Atlas Series. Sheet 8415S
2. LOCAL GOVERNMENT
Break O'Day
3. TRAVERSE DESCRIPTION
The proposed traverse commences at the intersection of Upper Esk Road with Old Roses Tier Road, then continues along the Mathinna Road to Evercreech Road, then along Barnes Road and Hogans Road. Throughout the majority of this line, the roads have sufficient verge to operate rigs off the road. There are some underground Telecom cables which need to be avoided but otherwise no significant problems are anticipated. If feasible the line may be able to be redirected through some paddocks from Mathinna Road to Hogans Road to remove some bends from it.
The nominal shot hole spacing is 240m with expected hole depths of 12 - 40m. Drilling will be carried out using a wheel based rotary rig.
No line clearing will be required along any part of this traverse. No security problems are envisioned along the traverse. Traffic control is not expected to present any problems apart from the possibility of logging trucks working in the area. The crew will be based in Fingal or St. Marys for this line.
Traverse Length: 27 km
4. CONTACTS FOR OPERATIONS
UPPER ESK ROADIMATHINNA ROAD TO BARNES ROAD
©Australian Geological Survey Organisation 1995 53
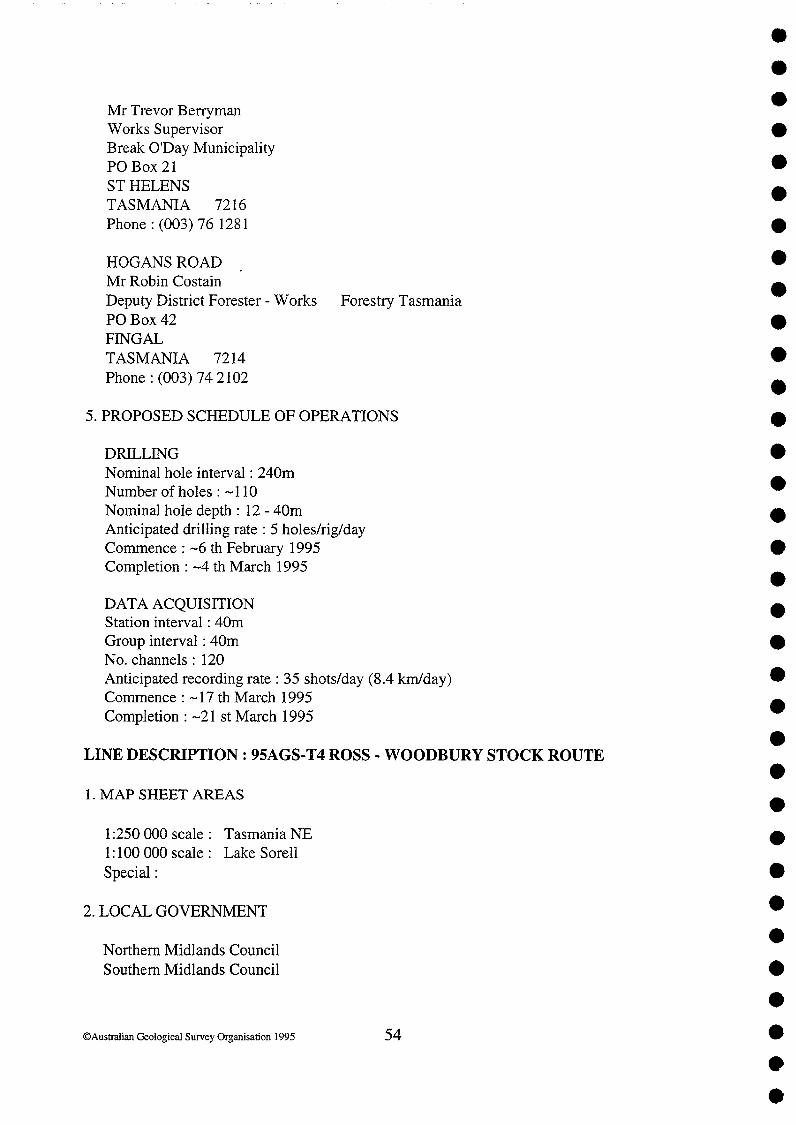
Mr Trevor Berryman Works Supervisor Break O'Day Municipality PO Box 21 STHELENS TASMANIA 7216 Phone: (003) 76 1281
HOGANS ROAD Mr Robin Costain Deputy District Forester - Works Forestry Tasmania POBox 42 FINGAL TASMANIA 7214 Phone: (003) 742102
5. PROPOSED SCHEDULE OF OPERATIONS
DRILLING Nominal hole interval: 240m Number of holes: -110 Nominal hole depth: 12 - 40m Anticipated drilling rate: 5 holes/rig/day Commence: -6 th February 1995 Completion : -4 th March 1995
DATA ACQUISITION Station interval : 40m Group interval : 40m No. channels: 120 Anticipated recording rate: 35 shots/day (8.4 kmlday) Commence: -17 th March 1995 Completion : -21 st March 1995
LINE DESCRIPTION: 95AGS-T4 ROSS - WOODBURY STOCK ROUTE
1. MAP SHEET AREAS
1 :250000 scale: Tasmania NE 1: 100 000 scale: Lake Sorell Special:
2. LOCAL GOVERNMENT
Northern Midlands Council Southern Midlands Council
©Australian Geological Survey Organisation 1995 54
• • • • • • • • • • • • • • • • • • • • • • • • • • • • • • • • • •
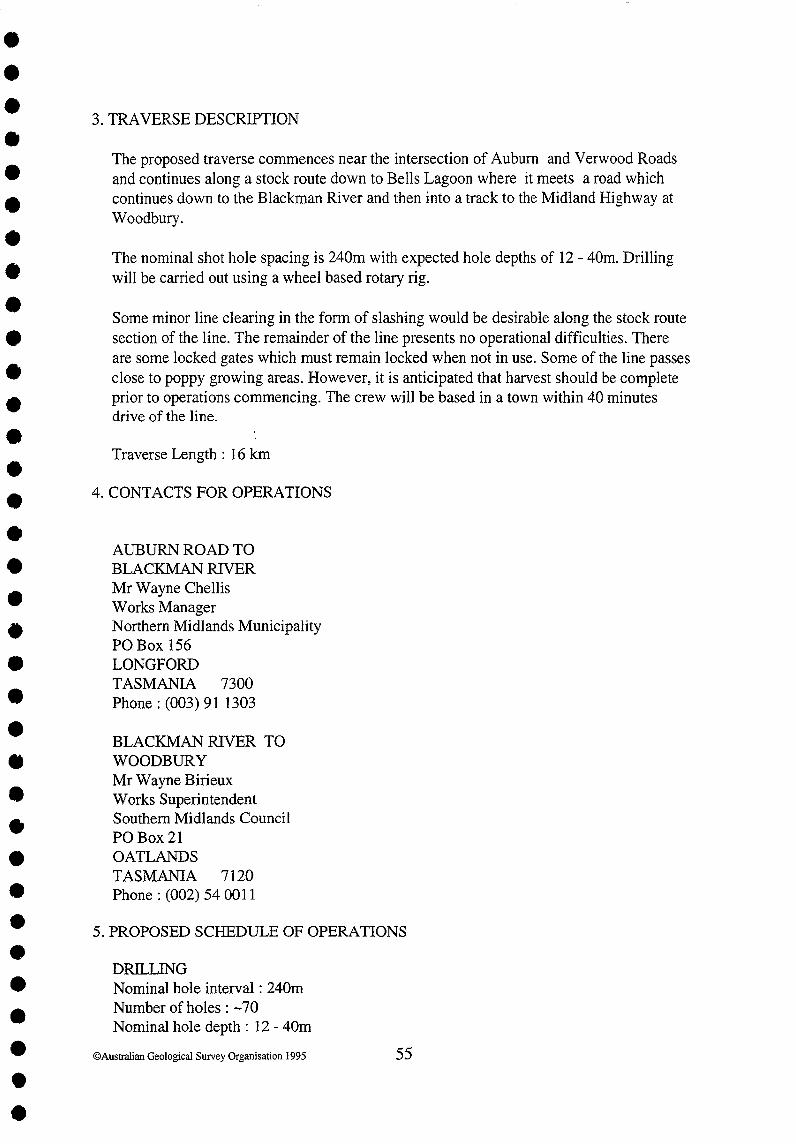
• • • • • • • • • • • • • • • • • • • • • • • • • • • • • • • • • •
3. TRAVERSE DESCRIPTION
The proposed traverse commences near the intersection of Auburn and Verwood Roads and continues along a stock route down to Bells Lagoon where it meets a road which continues down to the Blackman River and then into a track to the Midland Highway at Woodbury.
The nominal shot hole spacing is 240m with expected hole depths of 12 - 40m. Drilling will be carried out using a wheel based rotary rig.
Some minor line clearing in the form of slashing would be desirable along the stock route section of the line. The remainder of the line presents no operational difficulties. There are some locked gates which must remain locked when not in use. Some of the line passes close to poppy growing areas. However, it is anticipated that harvest should be complete prior to operations commencing. The crew will be based in a town within 40 minutes drive of the line.
Traverse Length : 16 km
4. CONTACTS FOR OPERATIONS
AUBURN ROAD TO BLACKMAN RIVER Mr Wayne Chellis Works Manager Northern Midlands Municipality PO Box 156 LONGFORD TASMANIA 7300 Phone: (003) 91 1303
BLACKMAN RIVER TO WOODBURY Mr Wayne Birieux Works Superintendent Southern Midlands Council PO Box 21 OATLANDS TASMANIA 7120 Phone: (002) 54 0011
5. PROPOSED SCHEDULE OF OPERATIONS
DRILLING Nominal hole interval: 240m Number of holes: - 70 Nominal hole depth: 12 - 40m
©Australian Geological Survey Organisation 1995 55

Anticipated drilling rate: 5 holes/rig/day Commence: -6 th March 1995 Completion: -22 nd March 1995
DATA ACQUISITION Station interval: 40m Group interval : 40m No. channels: 120 Anticipated recording rate: 35 shots/day (S.4 kmlday) Commence: -23 rd March 1995 Completion: -27 th March 1995
LINE DESCRIPTION: 9SAGS-TS OUSE - OSTERLEY
1. MAP SHEET AREAS
1 :250 000 scale: Tasmania SE 1: 100 000 scale: Shannon Special: 1 :50000 Ouse (1994) Special ARC INFO edition
2. LOCAL GOVERNMENT
Central Highlands Council
3. TRAVERSE DESCRIPTION
The proposed traverse is along the Victoria Valley Road between Ouse and Osterley and will be 4.S km in length. Its precise location will be determined at a later date but will be within the 10 km section as shown on the map. Part of the road is bitumen with sufficient verge to conduct drilling operations. Recording equipment will be deployed along the edge of the road.
The nominal shot hole spacing is 240m with expected hole depths of 12 - 40m. Drilling will be carried out using a wheel based rotary rig.
No line clearing is required. The line presents no operational difficulties. The crew will be based in a town within 40 minutes drive of the line.
Traverse Length: 5 km
4. CONTACTS FOR OPERATIONS
Mr Len Hills Works Supervisor Central Highlands Council POBox 20 HAMILTON TASMANIA 7140
©Australian Geological Survey Organisation 1995 56
• • • • • • • • • • • • • • • • • • • • • • • • • • • • • • • • • •

• • • Phone: (002) 86 3202
• 5. PROPOSED SCHEDULE OF OPERATIONS • • DRllLING Nominal hole interval: 240m
• Number of holes: -20
• Nominal hole depth: 12 - 40m Anticipated drilling rate: 5 holes/rig/day
• Commence : -23 rd March 1995 Completion: -27 th March 1995
• • DATA ACQUISITION Station interval : 40m
• Group interval: 40m No. channels: 120
• Anticipated recording rate: 35 shots/day Commence: -28 th March 1995 • Completion : -29 th March 1995
• • • • • • • • • • • • • • • • • • ©Australian Geological Survey Organisation 1995 57
• •