taic-part - cumberland lodge, uk – 29 aug 2006 motorola and the stylized m logo are registered in...
TRANSCRIPT

TAIC-PART - Cumberland Lodge, UK – 29 Aug 2006 MOTOROLA and the Stylized M Logo are registered in the US Patent & Trademark Office. All other product or service names are the property of their respective owners. © Motorola, Inc. 2005
Generating a Test Strategy with Bayesian Networks, …
and Common Sense
Presentation by:Jean-Jacques Gras and Rishabh GuptaSoftware and Systems Engineering Research LabMotorola Labs

TAIC-PART - Cumberland Lodge, UK – 29 Aug 2006 MOTOROLA and the Stylized M Logo are registered in the US Patent & Trademark Office. All other product or service names are the property of their respective owners. © Motorola, Inc. 2005
Slide 2
Contents
• Introduction• Bayesian Networks• Defect Models• Defect Profile Modelling• Test Strategy Generation• Sample Results• Conclusion and Future Work

TAIC-PART - Cumberland Lodge, UK – 29 Aug 2006 MOTOROLA and the Stylized M Logo are registered in the US Patent & Trademark Office. All other product or service names are the property of their respective owners. © Motorola, Inc. 2005
Slide 3
Introduction
• Problem: Software Testing is Difficult– Testing is coming late in lifecycle, means under pressure.
– Information about Software weaknesses available too late to produce effective Test Strategy.
• Solution: Anticipate with Defect Prediction Models– Need advanced decision support tool to optimise V&V activities.
– Use Predictions to drive V&V Activities
– Use Predictions to generate intelligent Test Strategy by focussing on High Risk Areas.
– Need to base models on real quality drivers: causal models
– Use Bayesian Networks based Defect Models of each Activity to predict Quality of software artefacts along lifecycle.
TAIC-PART - Cumberland Lodge, UK – 29 Aug 2006 MOTOROLA and the Stylized M Logo are registered in the US Patent & Trademark Office. All other product or service names are the property of their respective owners. © Motorola, Inc. 2005
Slide 4
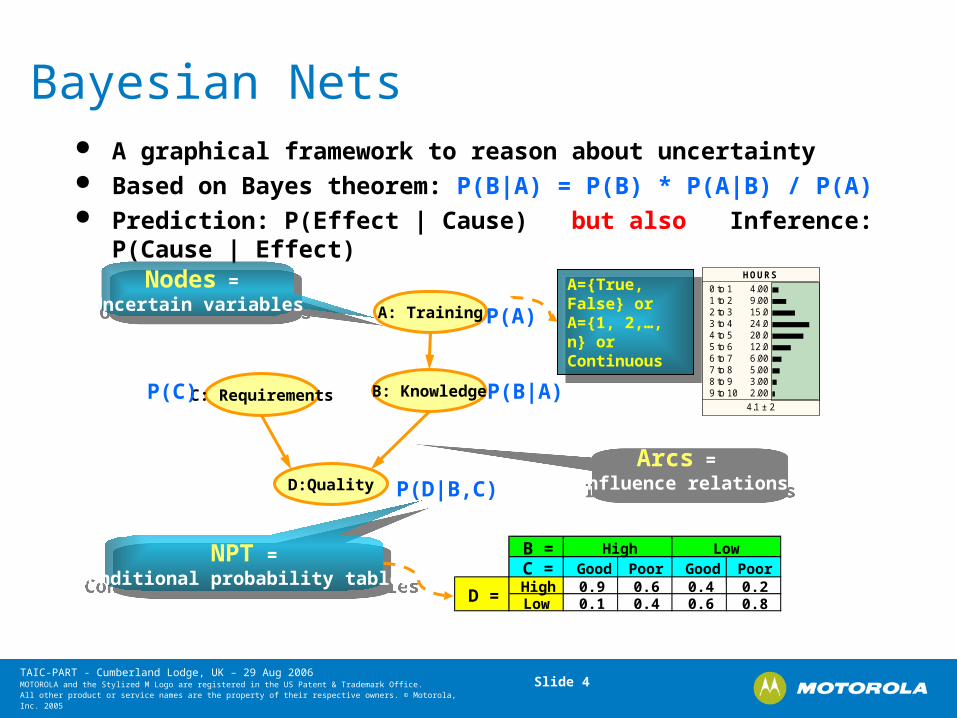
Bayesian Nets A graphical framework to reason about uncertainty Based on Bayes theorem: P(B|A) = P(B) * P(A|B) / P(A) Prediction: P(Effect | Cause) but also Inference: P(Cause | Effect)
A: Training
B: Knowledge
D:Quality
C: Requirements
Arcs = Influence relations
Arcs = Influence relations
P(B|A)
P(D|B,C)
P(C)
NPT =Conditional probability tables
NPT =Conditional probability tables
B =C = Good Poor Good PoorHigh 0.9 0.6 0.4 0.2Low 0.1 0.4 0.6 0.8
High Low
D =
Nodes = Uncertain variables
Nodes = Uncertain variables
P(A)A={True, False} orA={1, 2,…, n} or Continuous
A={True, False} orA={1, 2,…, n} or Continuous
HOURS
0 to 11 to 22 to 33 to 44 to 55 to 66 to 77 to 88 to 99 to 10
4.009.0015.024.020.012.06.005.003.002.00
4.1 ± 2

TAIC-PART - Cumberland Lodge, UK – 29 Aug 2006 MOTOROLA and the Stylized M Logo are registered in the US Patent & Trademark Office. All other product or service names are the property of their respective owners. © Motorola, Inc. 2005
Slide 5
End-To-End Defect Prediction
Requirements
Design
Coding
Coding FTR
Design FTR
Requirements FTR
Unit Test
Integration Test
System TestBAT
BAT
BAT
BAT
BAT
BAT
BAT
BAT
BAT
X
-
X
-
X
-
X
X
X
X
-
X
-
X
-
Req Size Des Size Cod Size
-
X
- -
X
- - -
- - -
XX X
Latent Defects
XX
XX

TAIC-PART - Cumberland Lodge, UK – 29 Aug 2006 MOTOROLA and the Stylized M Logo are registered in the US Patent & Trademark Office. All other product or service names are the property of their respective owners. © Motorola, Inc. 2005
Slide 6
BN Design Process
• Identify Causal Factors– Identify Factors that drive Software Quality or are indicators of it– Each factor is given a precise definition that can be understood
by end-users• Identify States and Ranges
– Identify Node Type (Discrete or Continuous)– Identify States (for Discrete) or Ranges (for Continuous)
• Establish Cause-Effect Relations– Identify relationship between nodes– Use intermediate nodes where appropriate
• Quantify Cause-Effect Relations– Establish Conditional Probability Tables– Must define each relation

TAIC-PART - Cumberland Lodge, UK – 29 Aug 2006 MOTOROLA and the Stylized M Logo are registered in the US Patent & Trademark Office. All other product or service names are the property of their respective owners. © Motorola, Inc. 2005
Slide 7
Additional Model
• Working BN Models may not be available– Models may not have been yet calibrated
– Subjective data may not be available• Schedule Pressure• Process not instituted into organisation
• Need Predictions for Test Strategy. – Defect prediction for each Component/Sub-System
• Use alternative Model– to bootstrap the BN deployment
– Multiple defect models provide reinforcements and credibility.
• Defect Profile Model (DPM)

TAIC-PART - Cumberland Lodge, UK – 29 Aug 2006 MOTOROLA and the Stylized M Logo are registered in the US Patent & Trademark Office. All other product or service names are the property of their respective owners. © Motorola, Inc. 2005
Slide 8
DPM Method
•Use Defect Data from past Releases to understand Profile of Defect Discovery across Lifecycle
Defect Profile (Requirements)
0.00
0.20
0.40
0.60
0.80
1.00
INIT Req Des Cod UT IT ST
Development Phase
Eff
ec
tiv
en
es
s (
Ac
cu
mu
late
d)
Req = 65%
Des = 86%
Cod = 94%
UT = 98%
Actual: Req Faults Found ≈ 40
Estimate: 40/86% Total Req Faults Inserted ≈ 47
Prediction: Req Faults Unfound ≈ 7

TAIC-PART - Cumberland Lodge, UK – 29 Aug 2006 MOTOROLA and the Stylized M Logo are registered in the US Patent & Trademark Office. All other product or service names are the property of their respective owners. © Motorola, Inc. 2005
Slide 9
DPM Process
Req Des Cod TotReq 82 0 0 82Des 31 24 0 55Cod 8 51 13 72UT 5 16 8 29IT 1 5 7 13ST 1 2 4 7Sum 128 98 32 258
Ph
ase
Fo
un
d

TAIC-PART - Cumberland Lodge, UK – 29 Aug 2006 MOTOROLA and the Stylized M Logo are registered in the US Patent & Trademark Office. All other product or service names are the property of their respective owners. © Motorola, Inc. 2005
Slide 10
Count Ratio Comp ActualReq 82 0.64 1.00 61Des 31 0.24 1.00 21Cod 8 0.06 1.00 11UT 5 0.04 2IT 1 0.01 1ST 1 0.01 1Sum 128Total Ratio 0.95Total Found 93Total Inserted 98.38Total Unfound 5.38
Ph
ase
Fo
un
dDPM Process

TAIC-PART - Cumberland Lodge, UK – 29 Aug 2006 MOTOROLA and the Stylized M Logo are registered in the US Patent & Trademark Office. All other product or service names are the property of their respective owners. © Motorola, Inc. 2005
Slide 11
DPM Key Points
• Data availability– Defect Data is usually collected by mature organisations
• No need for any other metrics– e.g. size of project, total effort
• Based on Component/Sub-System History– Generate a Prediction per Component/Sub-System
– One DPM model for each Component/Sub-System
– Calculate average ratio across multiple releases
• Historic Projects must be mature– Need Defect Data from the Field
– More mature Projects mean better Prediction

TAIC-PART - Cumberland Lodge, UK – 29 Aug 2006 MOTOROLA and the Stylized M Logo are registered in the US Patent & Trademark Office. All other product or service names are the property of their respective owners. © Motorola, Inc. 2005
Slide 12
System Test Strategy Generation
Test StrategyServices # TC Defects
Service 1 60 1Service 2 300 5Service 3 240 4Service 4 180 3Service 5 300 5Service 6 120 2Service 7 240 4Service 8 60 1
ServiceBN
ServiceBN
ServicesService Box A Box B Box C
Service 1 10% 55% 90%
Service 2 0% 17% 60%
Service 3 30% 20% 70%
Service 4 70% 50% 80%
Service 5 20% 50% 30%
Service 6 60% 50% 70%
Service 7 10% 20% 10%
Mapping components influence
Ranked Services: Defects exposed + Suggested # Test Cases
Service (FA) Models: Defect exposure calculation
Component latent defects
ComponentModels
TESTINGBBN
Test Eff % Defects
Latent Defects
TEST
INSPECTIONBBN
Insp. Eff % Faults FoundINSP
CODINGBBN
Fault Density Code Faults
Code Size
NC
SL
COD
REQUIREMENTSBBN
Quality %
REQ
Core
TESTINGBBN
Test Eff % Defects
Latent Defects
TEST
INSPECTIONBBN
Insp. Eff % Faults FoundINSP
CODINGBBN
Fault Density Code Faults
Code Size
NC
SL
COD
REQUIREMENTSBBN
Quality %
REQ
Core
Latent defects ->
Development Survey

TAIC-PART - Cumberland Lodge, UK – 29 Aug 2006 MOTOROLA and the Stylized M Logo are registered in the US Patent & Trademark Office. All other product or service names are the property of their respective owners. © Motorola, Inc. 2005
Slide 13
Test Strategy – “Exposure” Matrix
• Method– Defect “Exposure” weight based on System Design information– Test Strategy = ranked services (per Test Area)
• Benefit– Identifies weakest services– Determines number of test cases to write for each Service
SubSys 1 SubSys 2 SubSys 3
…
0% 20% 80%
80% 60% 20%
100% 80% 0%
* * *+ +
+ +
+ +
(Exposed Faults)
= 47
Faults left
Strategy
35 15 75
= 63
… … … …
= 52
“Exposure” weights from experts
Service 4.1
Service 4.2
Service 4.3

TAIC-PART - Cumberland Lodge, UK – 29 Aug 2006 MOTOROLA and the Stylized M Logo are registered in the US Patent & Trademark Office. All other product or service names are the property of their respective owners. © Motorola, Inc. 2005
Slide 14
Suite 2
DevelopmentDevelopment
Applying BTA to Drive Testing
System TestPre-test
Development
System TestNew Feature Test
TCs
BTA Outputs
Suite 1
ComponentDefects
Test Selection
Test Selection
PreliminaryTest Strategy
Updated Test Strategy
Updated data
Preliminary data
Create Test Cases

TAIC-PART - Cumberland Lodge, UK – 29 Aug 2006 MOTOROLA and the Stylized M Logo are registered in the US Patent & Trademark Office. All other product or service names are the property of their respective owners. © Motorola, Inc. 2005
Slide 15
End-to-End Defect Prediction Results
Pilot Type Sample Size Accuracy
A Development Faults 16 components +/- 25% to actuals,
88% of the time
B System Test Effectiveness 15 areas +/- 25% to actuals,
80% of the time
C Test Case Selection 8 components
19 services
48% more faults detected than random selection = 5 yr. expert
D Third-Party Faults 5 vendors +/- 25% to actuals,
80% of the time
E Development Faults 5 component +/- 16.4%,
100% of the time
7% effort reduction
F Test Strategy 1 system release
67 test categories
1/3 number of test cases
2X functional areas
Success Criteria: Prediction accuracy of +/- 25% to actuals, 75% of the time

TAIC-PART - Cumberland Lodge, UK – 29 Aug 2006 MOTOROLA and the Stylized M Logo are registered in the US Patent & Trademark Office. All other product or service names are the property of their respective owners. © Motorola, Inc. 2005
Slide 16
• Defects Found– BTA Test Strategy would have found all the Defects
Found by the original Test Strategy
• Test Cases– BTA Test Strategy recommends 1/3 the number of
Test Cases as the original Test Strategy
Test Strategy Impact
0.00
0.50
1.00
1.50
2.00
2.50
# T
es
t C
as
es
BTA
Orig
0
0.5
1
1.5
2
2.5
# F
un
cti
on
al
Are
as
BTA
Orig
0
0.5
1
1.5
2
2.5
# D
efe
cts
Fo
un
d
BTA
Orig
• Functional Areas– BTA Test Strategy recommends 2x the number of
Functional Areas as the original Test Strategy
Test Cases Functional Areas Defects Found

TAIC-PART - Cumberland Lodge, UK – 29 Aug 2006 MOTOROLA and the Stylized M Logo are registered in the US Patent & Trademark Office. All other product or service names are the property of their respective owners. © Motorola, Inc. 2005
Slide 17
Test Strategy Optimization
0
100
200
300
400
500
600
700
1 6 11 16 21 26 31 36 41 46 51 56 61 66 71 76 81 86 91 96 101 106 111 116 121 126 131 136 141
Services Tested
Def
ects
Rem
ain
ing
Original
Optimised
Original unoptimised Test Strategy Execution
Time to remove all Defects
Optimised Test Strategy Execution
Time to remove all Defects Reduced
Savings
TAIC-PART - Cumberland Lodge, UK – 29 Aug 2006 MOTOROLA and the Stylized M Logo are registered in the US Patent & Trademark Office. All other product or service names are the property of their respective owners. © Motorola, Inc. 2005
Slide 18
Future Work & Conclusion
• BN Defect Models– Better calibration techniques – machine learning– Simpler “Lightweight” model
• DPM– A “2D” version to allow earlier predictions with less information– Integration BN models with DPM approach leverage strength of
each• Test Strategy
– More detailed exposure information• Include type or category of Defect• Exposure per Defect Type, not just Component
– Automatic extraction of Exposure information, • e.g. through UML / MSC Models

TAIC-PART - Cumberland Lodge, UK – 29 Aug 2006 MOTOROLA and the Stylized M Logo are registered in the US Patent & Trademark Office. All other product or service names are the property of their respective owners. © Motorola, Inc. 2005
Slide 19
Q & A
Thank You