taiwan food processing ingredients - usda gain publications/food processing... · food processing...
TRANSCRIPT
THIS REPORT CONTAINS ASSESSMENTS OF COMMODITY AND TRADE ISSUES MADE BY
USDA STAFF AND NOT NECESSARILY STATEMENTS OF OFFICIAL U.S. GOVERNMENT
POLICY
-
Date:
GAIN Report Number:
Post:
Report Categories:
Approved By:
Prepared By:
Report Highlights:
Taiwan’s formidable food processing industry offers numerous opportunities for U.S. ingredient
exporters. In 2016, the U.S. exports of food preparation ingredients to Taiwan reached US$210 million,
with further growth expected in the food retail and food service sectors. In the face of stricter food
safety regulations, aging population, and busy consumer lifestyles, Taiwan’s food processing industry is
forging ahead by introducing a wide variety of natural, healthy, functional, and ready-to-eat products.
Katherine Lee, Agricultural Marketing Specialist
Interns: Li-Kai (David) Chen, Yu-Han (Jacques) Chu, Yi-Cheng (Alex) Lu
Chris Frederick
SP1 - Expand International Marketing Opportunities
Food Processing Ingredients
Food Processing Ingredients
Taipei ATO
Taiwan
TW17026
12/28/2017
Public Voluntary
Section I—Market Summary
Background
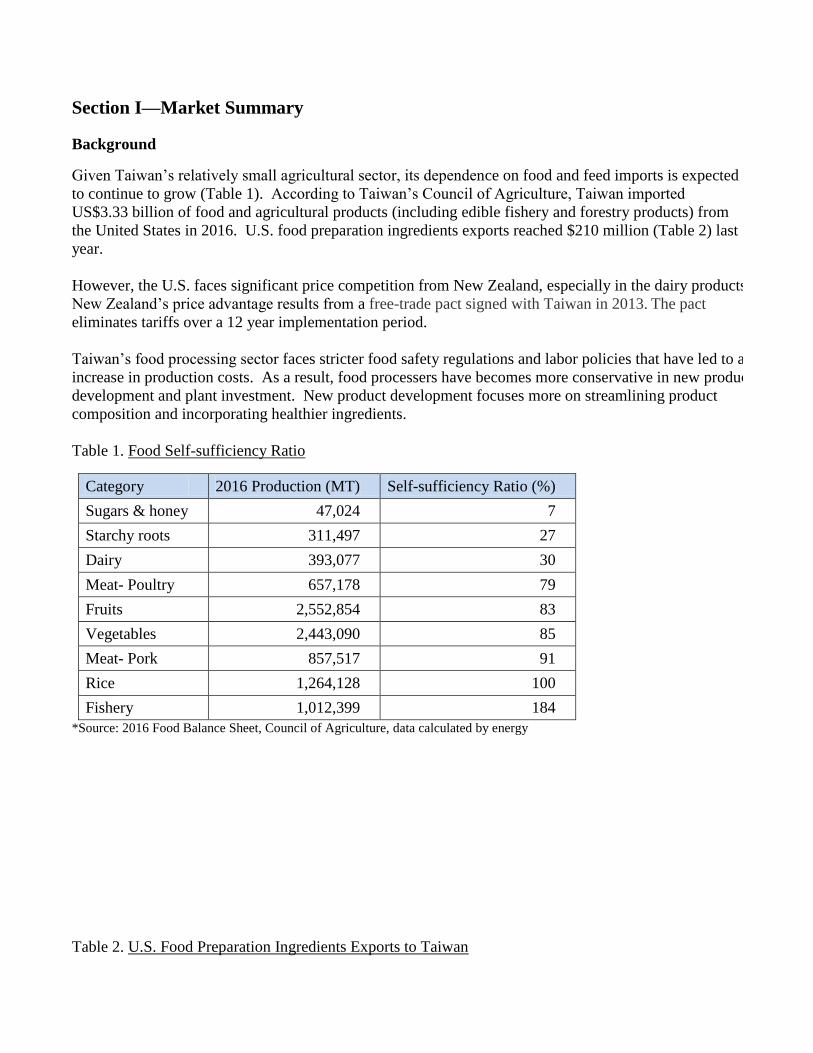
Given Taiwan’s relatively small agricultural sector, its dependence on food and feed imports is expected
to continue to grow (Table 1). According to Taiwan’s Council of Agriculture, Taiwan imported
US$3.33 billion of food and agricultural products (including edible fishery and forestry products) from
the United States in 2016. U.S. food preparation ingredients exports reached $210 million (Table 2) last
year.
However, the U.S. faces significant price competition from New Zealand, especially in the dairy products.
New Zealand’s price advantage results from a free-trade pact signed with Taiwan in 2013. The pact
eliminates tariffs over a 12 year implementation period.
Taiwan’s food processing sector faces stricter food safety regulations and labor policies that have led to an
increase in production costs. As a result, food processers have becomes more conservative in new product
development and plant investment. New product development focuses more on streamlining product
composition and incorporating healthier ingredients.
Table 1. Food Self-sufficiency Ratio
Category 2016 Production (MT) Self-sufficiency Ratio (%)
Sugars & honey 47,024 7
Starchy roots 311,497 27
Dairy 393,077 30
Meat- Poultry 657,178 79
Fruits 2,552,854 83
Vegetables 2,443,090 85
Meat- Pork 857,517 91
Rice 1,264,128 100
Fishery 1,012,399 184
*Source: 2016 Food Balance Sheet, Council of Agriculture, data calculated by energy
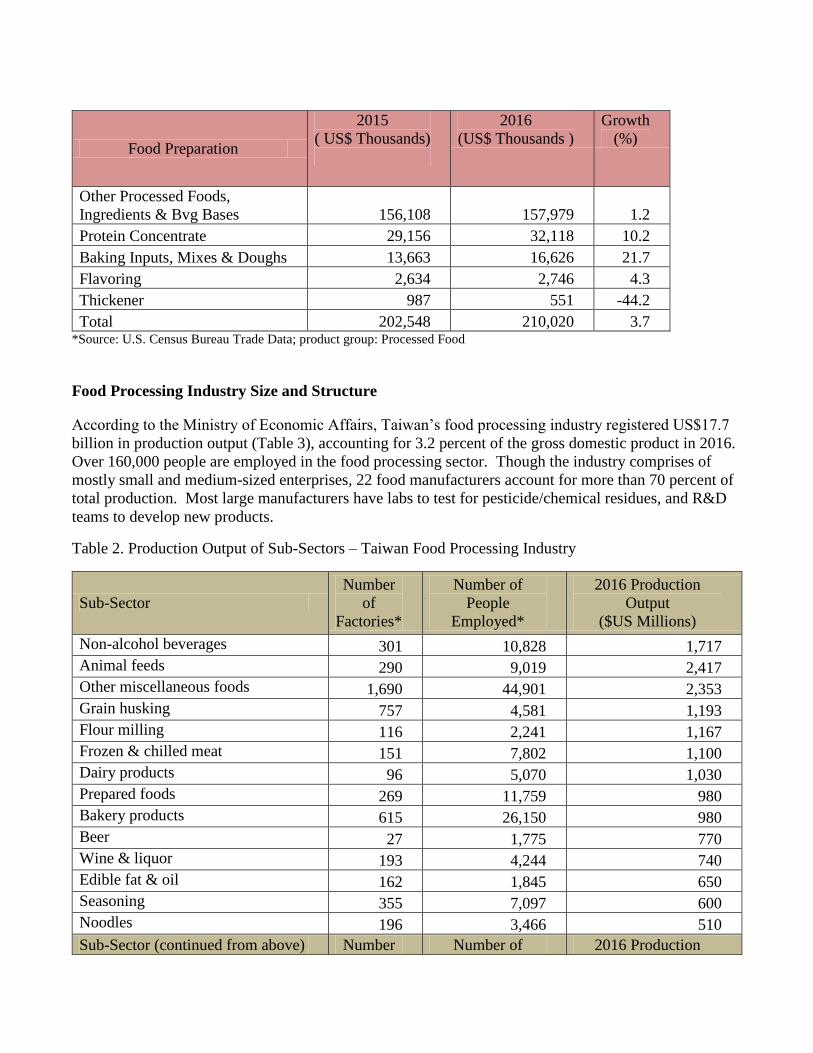
Table 2. U.S. Food Preparation Ingredients Exports to Taiwan
Food Preparation
2015
( US$ Thousands)
2016
(US$ Thousands ) Growth
(%)
Other Processed Foods,
Ingredients & Bvg Bases 156,108 157,979 1.2
Protein Concentrate 29,156 32,118 10.2
Baking Inputs, Mixes & Doughs 13,663 16,626 21.7
Flavoring 2,634 2,746 4.3
Thickener 987 551 -44.2
Total 202,548 210,020 3.7 *Source: U.S. Census Bureau Trade Data; product group: Processed Food
Food Processing Industry Size and Structure
According to the Ministry of Economic Affairs, Taiwan’s food processing industry registered US$17.7
billion in production output (Table 3), accounting for 3.2 percent of the gross domestic product in 2016.
Over 160,000 people are employed in the food processing sector. Though the industry comprises of
mostly small and medium-sized enterprises, 22 food manufacturers account for more than 70 percent of
total production. Most large manufacturers have labs to test for pesticide/chemical residues, and R&D
teams to develop new products.
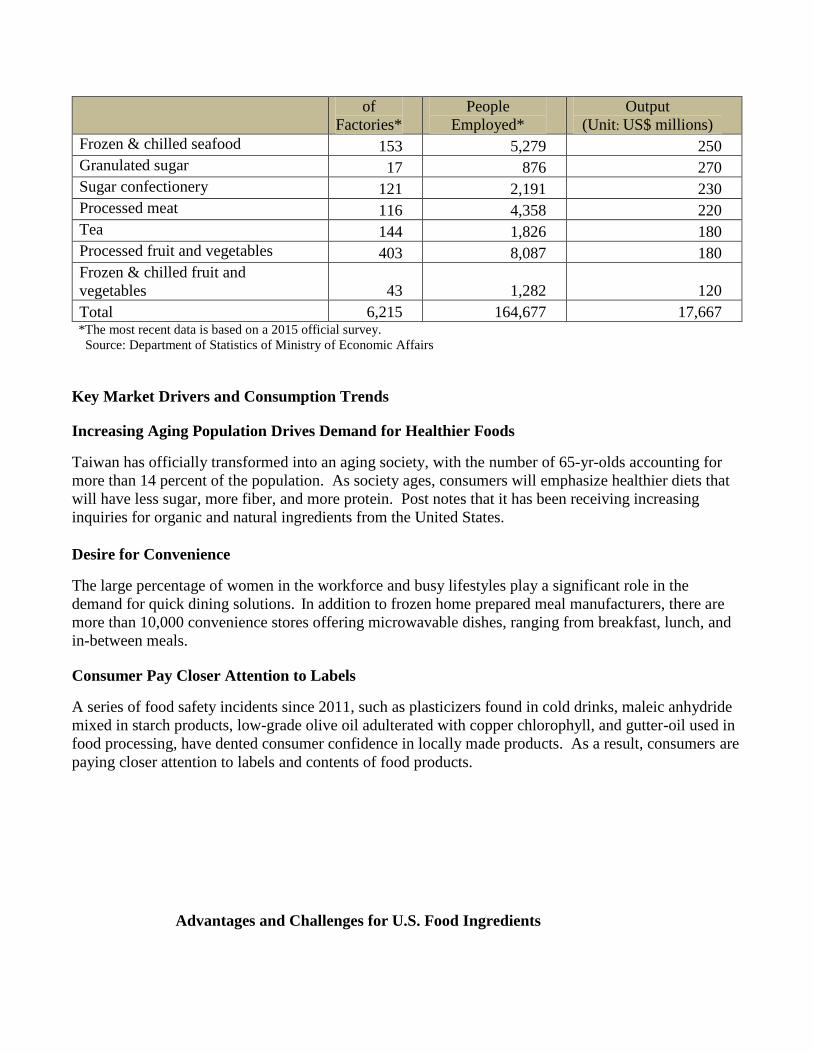
Table 2. Production Output of Sub-Sectors – Taiwan Food Processing Industry
Sub-Sector
Number
of
Factories*
Number of
People
Employed*
2016 Production
Output
($US Millions)
Non-alcohol beverages 301 10,828 1,717
Animal feeds 290 9,019 2,417
Other miscellaneous foods 1,690 44,901 2,353
Grain husking 757 4,581 1,193
Flour milling 116 2,241 1,167
Frozen & chilled meat 151 7,802 1,100
Dairy products 96 5,070 1,030
Prepared foods 269 11,759 980
Bakery products 615 26,150 980
Beer 27 1,775 770
Wine & liquor 193 4,244 740
Edible fat & oil 162 1,845 650
Seasoning 355 7,097 600
Noodles 196 3,466 510
Sub-Sector (continued from above) Number Number of 2016 Production
of
Factories*
People
Employed*
Output
(Unit: US$ millions)
Frozen & chilled seafood 153 5,279 250
Granulated sugar 17 876 270
Sugar confectionery 121 2,191 230
Processed meat 116 4,358 220
Tea 144 1,826 180
Processed fruit and vegetables 403 8,087 180
Frozen & chilled fruit and
vegetables 43 1,282 120
Total 6,215 164,677 17,667 *The most recent data is based on a 2015 official survey.
Source: Department of Statistics of Ministry of Economic Affairs
Key Market Drivers and Consumption Trends
Increasing Aging Population Drives Demand for Healthier Foods
Taiwan has officially transformed into an aging society, with the number of 65-yr-olds accounting for
more than 14 percent of the population. As society ages, consumers will emphasize healthier diets that
will have less sugar, more fiber, and more protein. Post notes that it has been receiving increasing
inquiries for organic and natural ingredients from the United States.
Desire for Convenience
The large percentage of women in the workforce and busy lifestyles play a significant role in the
demand for quick dining solutions. In addition to frozen home prepared meal manufacturers, there are
more than 10,000 convenience stores offering microwavable dishes, ranging from breakfast, lunch, and
in-between meals.
Consumer Pay Closer Attention to Labels
A series of food safety incidents since 2011, such as plasticizers found in cold drinks, maleic anhydride
mixed in starch products, low-grade olive oil adulterated with copper chlorophyll, and gutter-oil used in
food processing, have dented consumer confidence in locally made products. As a result, consumers are
paying closer attention to labels and contents of food products.
Advantages and Challenges for U.S. Food Ingredients
Advantages Challenges
Perception that U.S. grading systems are
transparent and consistent.
The negative perception of GMOs by some consumers may
cause some to shy away from products that use U.S.
ingredients.
U.S suppliers have better technical support
and offer more diversified ingredient
specifications than other suppliers.
Some pesticides allowed for use in the U.S. are not approved
for use in Taiwan. Taiwan’s lack of established MRLs for
pesticides hinders U.S. exports.
Taiwan food processors already have long
standing relationships with U.S. ingredient
suppliers.
U.S. products that are “fortified” are perceived in the local
market as products with “additives,” which pushes some end-
users away as the consumption trend is for “low/no
additives.”
Section II—Road Map for Market Entry
Entry Strategy
First, Agricultural Trade Office in Taipei suggests U.S. exporters evaluate the market and product
potential first through studying the applicable tariffs, market access restrictions, and regulatory
requirements pertinent to the products. Second, evaluate competitive advantages by analyzing the
overall imported volume and market shares across foreign suppliers. Below is the list of useful websites
for suppliers to start with:
Taiwan’s Tariff Rate Quota (TRQ) Implementation
Taiwan Customs On-line Tariff Database
USDA Food and Agricultural Import Regulations and Standards (FAIRS) Report
Taiwan’s Bureau of Trade - Statistics
Also, ATO Taipei recommends exporters reach out to U.S. State Regional Trade Groups (SRTGs) for
guidance. The SRTGs provide small to medium-sized exporters with assistance by introducing U.S.
products to overseas markets through multi-faceted marketing activities, such as reverse trade missions,
and trade shows.
Western U.S. Agricultural Trade Association
Southern U.S. Trade Association
Food Export-Midwest
Food Export-Northeast
The next step is to consult the ATO Taipei for a list of potential importers. Keep in mind that there are
multiple decision makers in the procurement process when contacting importing companies. Product
development personnel dominate the final procurement decision, but marketing managers drive
promotional plans, while procurement personnel handle logistics. It is advisable to meet with R&D staff
and provide them with technical specification reports along with samples. It is recommended to share
successful practices with marketing personnel and offer promotional support. Samples are required for
testing, and demonstrations are recommended. Due to stringent Taiwan food safety regulations, the
importers will also request lab test reports, country of origin certificates, and certificates of analysis.
ATO Taipei also strongly recommends U.S. exporters exhibit in the USA Pavilion at the Taipei
International Food Show, which takes place in June every year. The USA Pavilion serves as a platform
to promote the overall USA image and is an efficient way to connect exhibitors to local buyers.
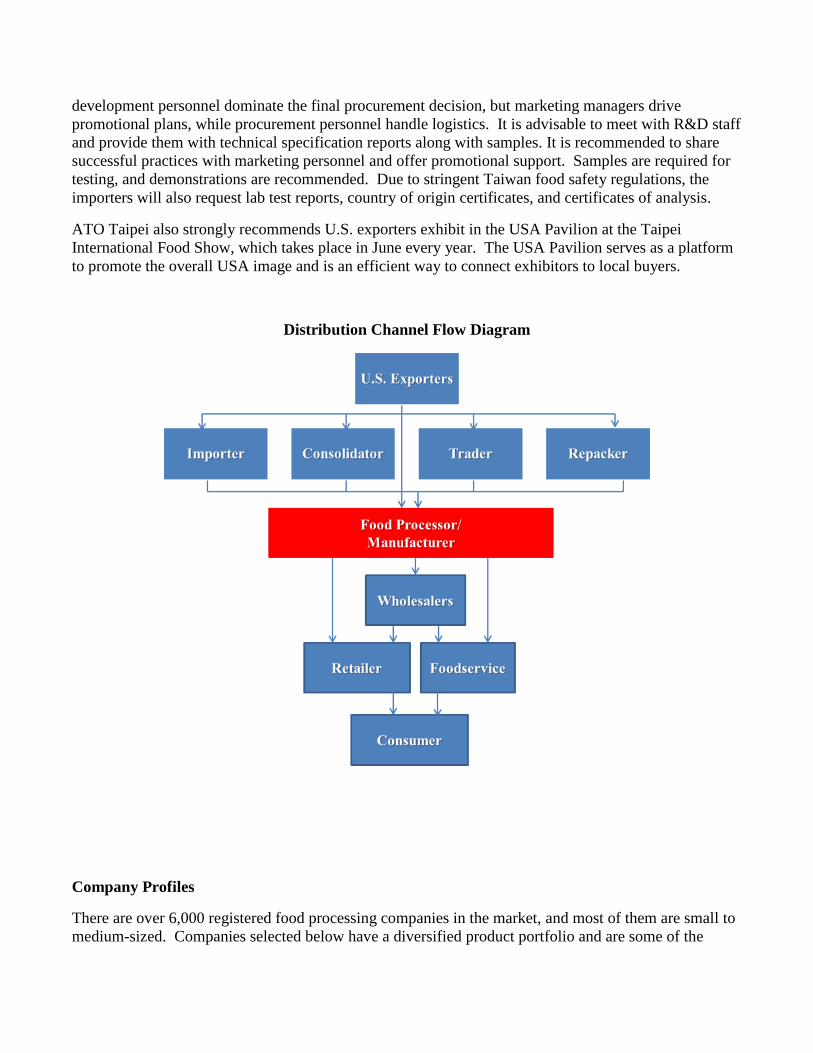
Distribution Channel Flow Diagram
Company Profiles
There are over 6,000 registered food processing companies in the market, and most of them are small to
medium-sized. Companies selected below have a diversified product portfolio and are some of the
leading food manufactures in Taiwan.
Company Product Types Sales: (US$
Million)
End-Use
Channels
Production
Location
Uni-President
Enterprises
Corp.
Packaged tea, juice, instant noodles,
packaged milk, flavored milk,
yogurt, pastry, soymilk, canned
coffee, bottled water, confectionery,
ice-cream, sauce, frozen food, flour,
sausage & ham, sports drinks,
edible oil, health supplement
1,378
Retail
Foodservice Taiwan
China
Vietnam
Indonesia
Thailand
Philippines
Standard Foods
Baby & adult formula, edible oil,
packaged milk, confectionery, oats,
cereal beverages, health supplement
902 Retail Taiwan
China
Charoen
Pokphand
Enterprise
(Taiwan) Co.,
Ltd.
Poultry & livestock meat, prepared
meals/ meat, ready-to-eat meals,
bacon &ham, poultry & livestock
feed/ feed additives
606 Retail
Foodservice
Processing
Taiwan
Thailand
Namchow
Group
Edible oil, fresh cream, frozen
dough & noodle, ice cream, instant
noodle, rice cracker, ready-to-eat
rice
543 Retail,
Foodservice
Processing
Taiwan
Thailand
I-Mei Confectionery and sweets, snacks,
edible oil, nuts and dried
berries/veggies, bakery products,
frozen prepared foods, soy milk,
milk/milk tea, tea, health
supplements
300**
Retail
Taiwan
China
Vietnam
HeySong Corp.
Drinking tea,
soda, sports drinks, canned coffee,
bottled water,
wine & liqueur, health supplement
292 Retail,
Foodservice Taiwan
China
Lian Hwa
Foods
Nuts, dry seaweed, instant drinks,
salty snacks, ready-to-eat meals,
dietary supplements
224 Retail
Taiwan
China
Company
(continued from
above)
Product Types Sales: (US$
Million)
End-Use
Channels
Production
Location
King Car Beverages, coffee, tea, energy
drinks, water and soft drinks,
whiskey
203 Retail
Taiwan
China
Vietnam
AGV Products
Corp.
Flavored water, tea, oat beverage,
juice,
agar beverage, canned sweet soup,
canned condiment, canned tuna,
sauce, edible oil, health
supplements
137 Retail
Taiwan
China
UTC Foods Home prepared meal foods,
condiments, soup, starch products,
jelly and pudding
NA Foodservice
Retail Taiwan
*Source: Market Observation Post System
** Media reports
Sector Trends
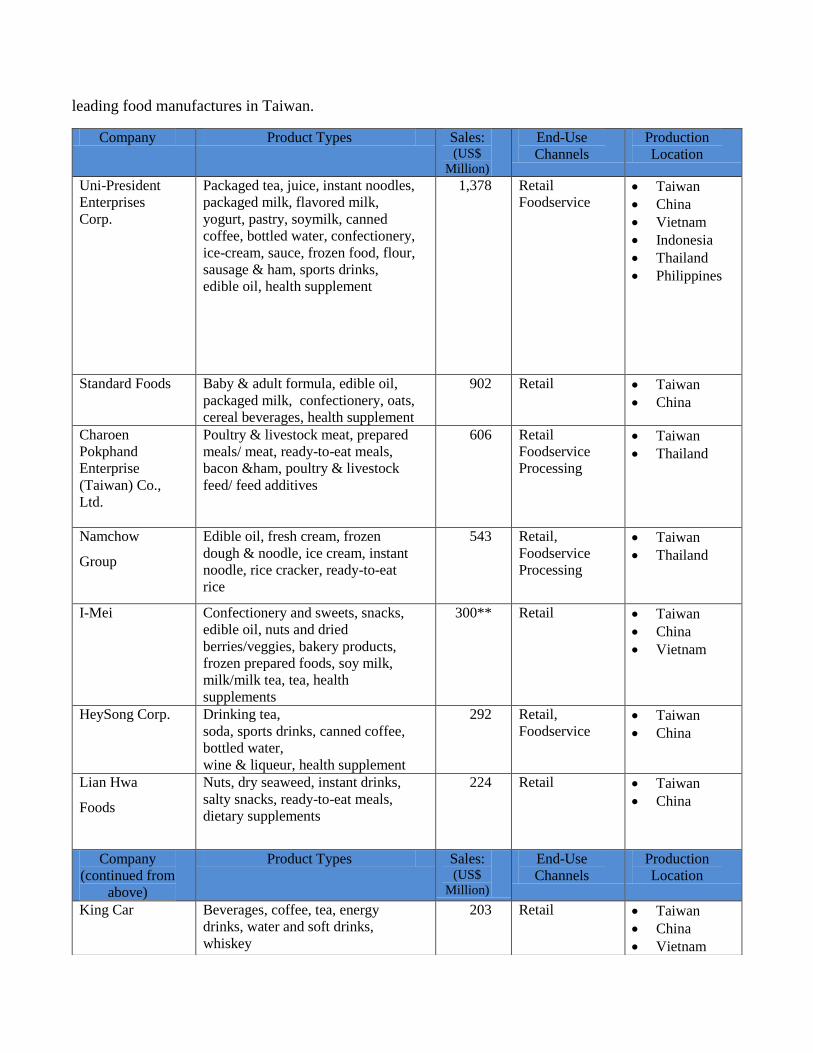
Sourcing Shifts to Direct Importation
To manage food safety risks and restore consumer confidence, Taiwan’s FDA mandates that local food
processing manufacturers and additive/ingredient importers provide a comprehensive record of
ingredients, including supplier information, purchase quantity, production/expiration dates, and
distribution. Some food manufacturers also display QR codes on product packaging so consumers can
identify the ingredient sources and product distribution (Picture 1). Trends indicate that more
established food manufacturers are inclined to import ingredients on their own, instead of relying on
importers, to secure product traceability and regulatory compliance.
Picture 1. QR codes on packaging provide traceability information
Product Development Aims for Clean Labels
Stricter regulation requirements and consumer attention to labels drive food manufacturers to
simplify product composition. According to Article 22 of Act Governing Food Safety and
Sanitation, food manufacturers are required to display all the ingredients and additives on labels.
Consumers, therefore, become more hesitant to purchase products containing long lists of unfamiliar
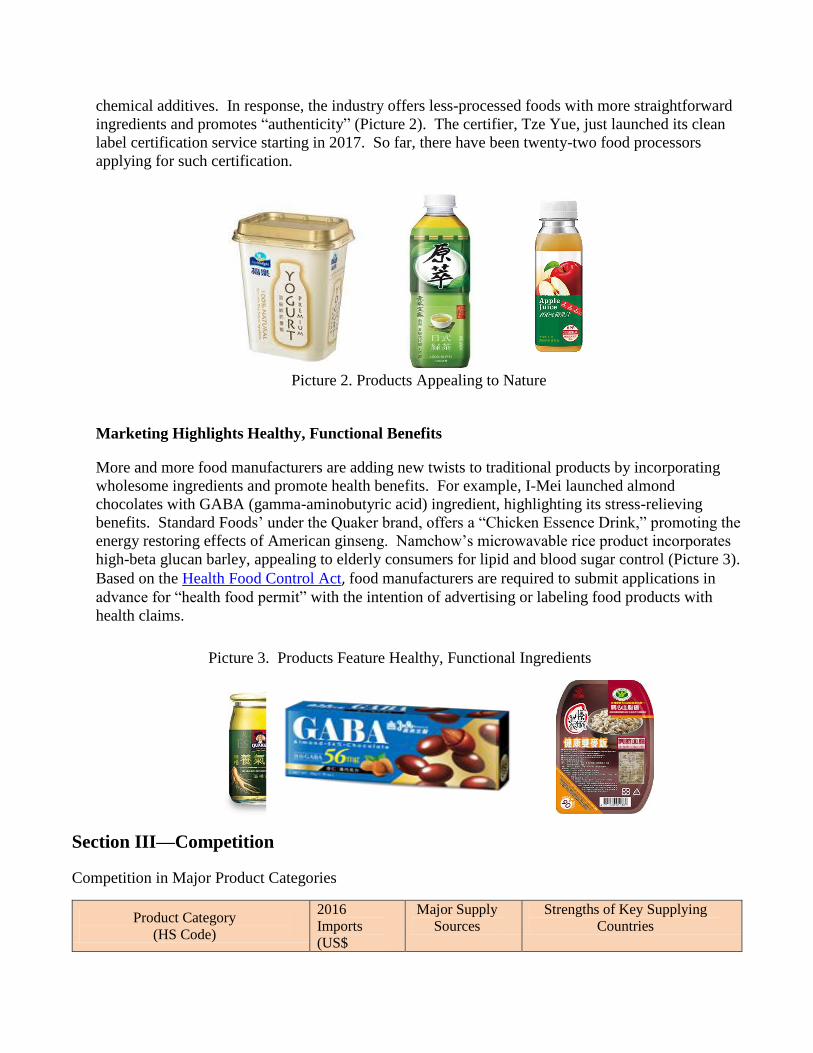
chemical additives. In response, the industry offers less-processed foods with more straightforward
ingredients and promotes “authenticity” (Picture 2). The certifier, Tze Yue, just launched its clean
label certification service starting in 2017. So far, there have been twenty-two food processors
applying for such certification.
Picture 2. Products Appealing to Nature
Marketing Highlights Healthy, Functional Benefits
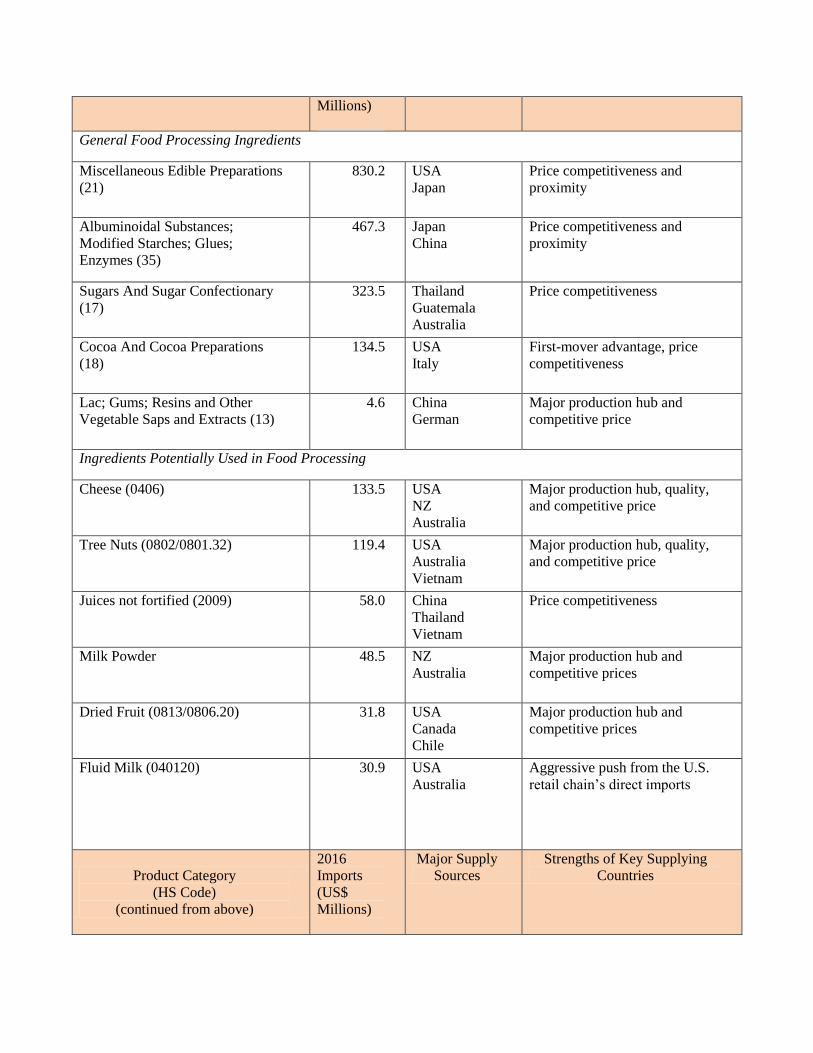
More and more food manufacturers are adding new twists to traditional products by incorporating
wholesome ingredients and promote health benefits. For example, I-Mei launched almond
chocolates with GABA (gamma-aminobutyric acid) ingredient, highlighting its stress-relieving
benefits. Standard Foods’ under the Quaker brand, offers a “Chicken Essence Drink,” promoting the
energy restoring effects of American ginseng. Namchow’s microwavable rice product incorporates
high-beta glucan barley, appealing to elderly consumers for lipid and blood sugar control (Picture 3).
Based on the Health Food Control Act, food manufacturers are required to submit applications in
advance for “health food permit” with the intention of advertising or labeling food products with
health claims.
Section III—Competition
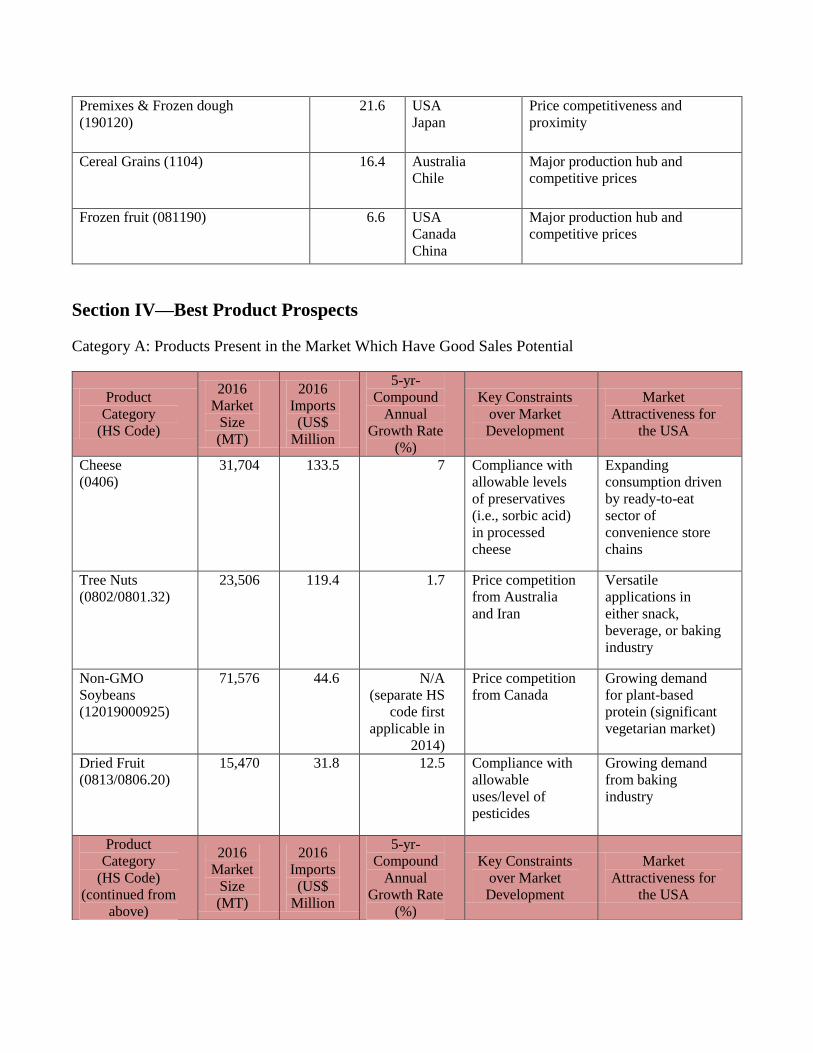
Competition in Major Product Categories
Product Category
(HS Code)
2016
Imports
(US$
Major Supply
Sources
Strengths of Key Supplying
Countries
Picture 3. Products Feature Healthy, Functional Ingredients
Millions)
General Food Processing Ingredients
Miscellaneous Edible Preparations
(21)
830.2 USA
Japan
Price competitiveness and
proximity
Albuminoidal Substances;
Modified Starches; Glues;
Enzymes (35)
467.3 Japan
China
Price competitiveness and
proximity
Sugars And Sugar Confectionary
(17)
323.5 Thailand
Guatemala
Australia
Price competitiveness
Cocoa And Cocoa Preparations
(18)
134.5 USA
Italy
First-mover advantage, price
competitiveness
Lac; Gums; Resins and Other
Vegetable Saps and Extracts (13)
4.6 China
German
Major production hub and
competitive price
Ingredients Potentially Used in Food Processing
Cheese (0406) 133.5 USA
NZ
Australia
Major production hub, quality,
and competitive price
Tree Nuts (0802/0801.32) 119.4 USA
Australia
Vietnam
Major production hub, quality,
and competitive price
Juices not fortified (2009) 58.0 China
Thailand
Vietnam
Price competitiveness
Milk Powder 48.5 NZ
Australia
Major production hub and
competitive prices
Dried Fruit (0813/0806.20) 31.8 USA
Canada
Chile
Major production hub and
competitive prices
Fluid Milk (040120)
30.9 USA
Australia
Aggressive push from the U.S.
retail chain’s direct imports
Product Category
(HS Code)
(continued from above)
2016
Imports
(US$
Millions)
Major Supply
Sources
Strengths of Key Supplying
Countries
Premixes & Frozen dough
(190120)
21.6 USA
Japan
Price competitiveness and
proximity
Cereal Grains (1104) 16.4 Australia
Chile
Major production hub and
competitive prices
Frozen fruit (081190) 6.6 USA
Canada
China
Major production hub and
competitive prices
Section IV—Best Product Prospects
Category A: Products Present in the Market Which Have Good Sales Potential
Product
Category
(HS Code)
2016
Market
Size
(MT)
2016
Imports
(US$
Million
5-yr-
Compound
Annual
Growth Rate
(%)
Key Constraints
over Market
Development
Market
Attractiveness for
the USA
Cheese
(0406)
31,704 133.5 7 Compliance with
allowable levels
of preservatives
(i.e., sorbic acid)
in processed
cheese
Expanding
consumption driven
by ready-to-eat
sector of
convenience store
chains
Tree Nuts
(0802/0801.32)
23,506 119.4 1.7 Price competition
from Australia
and Iran
Versatile
applications in
either snack,
beverage, or baking
industry
Non-GMO
Soybeans
(12019000925)
71,576 44.6 N/A
(separate HS
code first
applicable in
2014)
Price competition
from Canada
Growing demand
for plant-based
protein (significant
vegetarian market)
Dried Fruit
(0813/0806.20)
15,470 31.8 12.5 Compliance with
allowable
uses/level of
pesticides
Growing demand
from baking
industry
Product
Category
(HS Code)
(continued from
above)
2016
Market
Size
(MT)
2016
Imports
(US$
Million
5-yr-
Compound
Annual
Growth Rate
(%)
Key Constraints
over Market
Development
Market
Attractiveness for
the USA
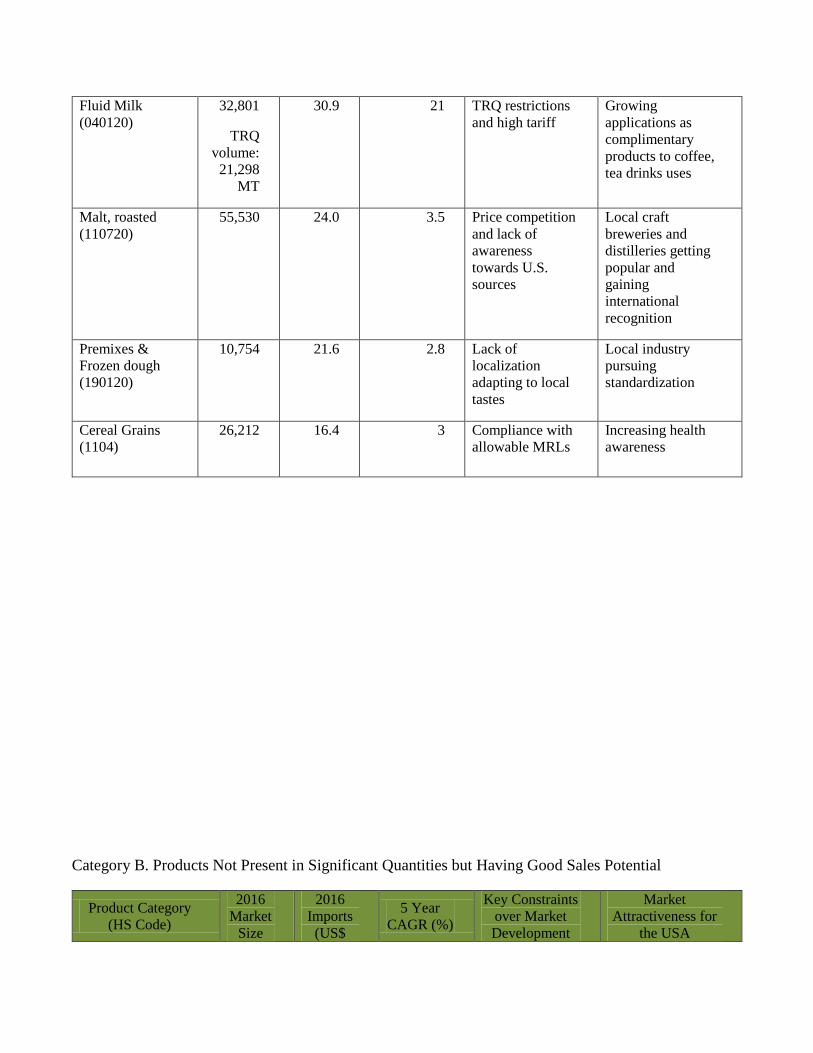
Fluid Milk
(040120)
32,801
TRQ
volume:
21,298
MT
30.9 21 TRQ restrictions
and high tariff
Growing
applications as
complimentary
products to coffee,
tea drinks uses
Malt, roasted
(110720)
55,530 24.0 3.5 Price competition
and lack of
awareness
towards U.S.
sources
Local craft
breweries and
distilleries getting
popular and
gaining
international
recognition
Premixes &
Frozen dough
(190120)
10,754 21.6 2.8 Lack of
localization
adapting to local
tastes
Local industry
pursuing
standardization
Cereal Grains
(1104)
26,212 16.4 3 Compliance with
allowable MRLs
Increasing health
awareness
Category B. Products Not Present in Significant Quantities but Having Good Sales Potential
Product Category
(HS Code)
2016
Market
Size
2016
Imports
(US$
5 Year
CAGR (%)
Key Constraints
over Market
Development
Market
Attractiveness for
the USA
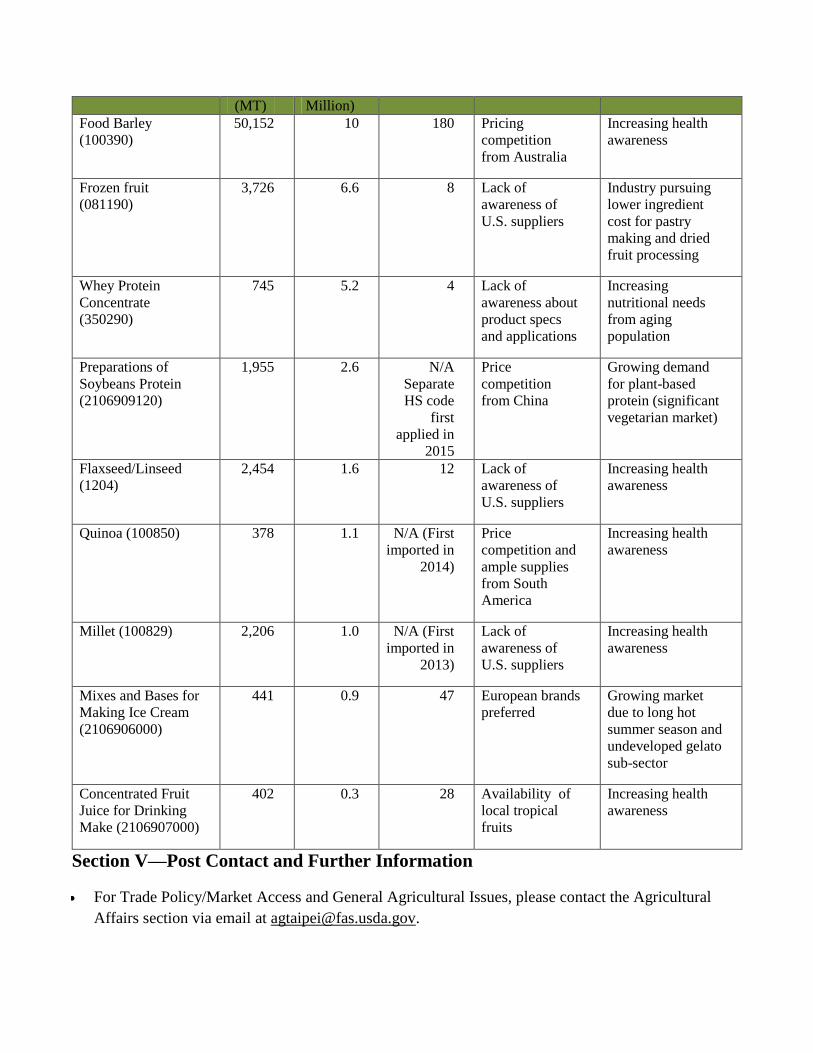
(MT) Million)
Food Barley
(100390)
50,152 10 180 Pricing
competition
from Australia
Increasing health
awareness
Frozen fruit
(081190)
3,726 6.6 8 Lack of
awareness of
U.S. suppliers
Industry pursuing
lower ingredient
cost for pastry
making and dried
fruit processing
Whey Protein
Concentrate
(350290)
745 5.2 4 Lack of
awareness about
product specs
and applications
Increasing
nutritional needs
from aging
population
Preparations of
Soybeans Protein
(2106909120)
1,955 2.6 N/A
Separate
HS code
first
applied in
2015
Price
competition
from China
Growing demand
for plant-based
protein (significant
vegetarian market)
Flaxseed/Linseed
(1204)
2,454 1.6 12 Lack of
awareness of
U.S. suppliers
Increasing health
awareness
Quinoa (100850) 378 1.1 N/A (First
imported in
2014)
Price
competition and
ample supplies
from South
America
Increasing health
awareness
Millet (100829) 2,206 1.0 N/A (First
imported in
2013)
Lack of
awareness of
U.S. suppliers
Increasing health
awareness
Mixes and Bases for
Making Ice Cream
(2106906000)
441 0.9 47 European brands
preferred
Growing market
due to long hot
summer season and
undeveloped gelato
sub-sector
Concentrated Fruit
Juice for Drinking
Make (2106907000)
402 0.3 28 Availability of
local tropical
fruits
Increasing health
awareness
Section V—Post Contact and Further Information
For Trade Policy/Market Access and General Agricultural Issues, please contact the Agricultural
Affairs section via email at [email protected].
For Market Development Assistance, please contact the Agricultural Trade Office via email at
Other relevant GAIN reports:
Exporter Guide 2017
Food and Agricultural Import Regulations and Standards – Narrative
USDA GAIN