taking afrobarometer data everywhere
TRANSCRIPT

Santa Clara UniversityScholar Commons
Computer Engineering Senior Theses Engineering Senior Theses
6-7-2017
Taking Afrobarometer Data EverywhereChristen NguyenSanta Clara University, [email protected]
Sean ThomasSanta Clara University, [email protected]
Adrienne TinaSanta Clara University, [email protected]
Follow this and additional works at: https://scholarcommons.scu.edu/cseng_senior
Part of the Computer Engineering Commons
This Thesis is brought to you for free and open access by the Engineering Senior Theses at Scholar Commons. It has been accepted for inclusion inComputer Engineering Senior Theses by an authorized administrator of Scholar Commons. For more information, please contact [email protected].
Recommended CitationNguyen, Christen; Thomas, Sean; and Tina, Adrienne, "Taking Afrobarometer Data Everywhere" (2017). Computer Engineering SeniorTheses. 94.https://scholarcommons.scu.edu/cseng_senior/94

Abstract
According to statistics gathered by research group Afrobarometer,many countries in Africa lack infrastructure and basic necessities. Infact, Afrobarometer knows the specific rates of need and availabilitysampled across thirty-six countries but more prosperous African coun-tries do not know these numbers. These more developed countries arein a position to help their less fortunate neighbors if only made awareof the social and economic climate in the respective areas. Our part-nership with Afrobarometer will allow us to advertise these statisticsthrough the use of a mobile application. The data will be displayedin a way that is easy for the average reader to digest and understand.By exposing a larger African audience to the results from these publicopinion surveys, Afrobarometer hopes to inspire these people to takeaction and make donations to the appropriate social benefit groups.The countries represented by the surveys can then receive help in theareas expressing need.
i

Acknowledgements
This research was supported by Santa Clara University’s School of Engi-neering and the Frugal Innovation Hub at the university.
We would like to thank Dr. Silvia Figueira, Associate Professor of Com-puter Engineering and Director of the Frugal Innovation Hub for trustingus with this project and for her assistance in its development.
We would also like to express our gratitude for Afrobarometer for grant-ing us access to their survey data and for allowing us the opportunity tocreate this application.

Contents
1 Introduction 1
2 Background or related work 3
3 Use Cases 4
4 Conceptual Model 54.1 Introduction . . . . . . . . . . . . . . . . . . . . . . . . . . . . 54.2 Figures . . . . . . . . . . . . . . . . . . . . . . . . . . . . . . 5
5 List of Requirements 85.1 Introduction . . . . . . . . . . . . . . . . . . . . . . . . . . . . 85.2 Functional Requirements . . . . . . . . . . . . . . . . . . . . . 85.3 Non-Functional Requirements . . . . . . . . . . . . . . . . . . 95.4 Design Constraints . . . . . . . . . . . . . . . . . . . . . . . . 9
6 System Sequence Diagram 106.1 Introduction . . . . . . . . . . . . . . . . . . . . . . . . . . . . 106.2 Diagram . . . . . . . . . . . . . . . . . . . . . . . . . . . . . . 11
7 Design Rationale 127.1 Features . . . . . . . . . . . . . . . . . . . . . . . . . . . . . . 127.2 Suggested Features . . . . . . . . . . . . . . . . . . . . . . . . 13
8 Technologies Used 14
9 Architecture Diagram 15
10 Design 1610.1 Original Requirements and Scope Changes . . . . . . . . . . . 1610.2 Final Design . . . . . . . . . . . . . . . . . . . . . . . . . . . 16
11 Test Plan and Test Cases 2311.1 Introduction . . . . . . . . . . . . . . . . . . . . . . . . . . . . 2311.2 Test Plan . . . . . . . . . . . . . . . . . . . . . . . . . . . . . 2311.3 Test Cases . . . . . . . . . . . . . . . . . . . . . . . . . . . . . 23
12 Risks 25
iii

13 Societal Issues 2613.1 Introduction . . . . . . . . . . . . . . . . . . . . . . . . . . . . 2613.2 Ethical . . . . . . . . . . . . . . . . . . . . . . . . . . . . . . . 2613.3 Social . . . . . . . . . . . . . . . . . . . . . . . . . . . . . . . 2613.4 Political . . . . . . . . . . . . . . . . . . . . . . . . . . . . . . 2613.5 Economic . . . . . . . . . . . . . . . . . . . . . . . . . . . . . 2713.6 Health and Safety . . . . . . . . . . . . . . . . . . . . . . . . 2713.7 Manufacturability . . . . . . . . . . . . . . . . . . . . . . . . . 2713.8 Sustainability . . . . . . . . . . . . . . . . . . . . . . . . . . . 2713.9 Environmental Impact . . . . . . . . . . . . . . . . . . . . . . 2813.10Usability . . . . . . . . . . . . . . . . . . . . . . . . . . . . . . 2813.11Lifelong Learning . . . . . . . . . . . . . . . . . . . . . . . . . 2813.12Compassion . . . . . . . . . . . . . . . . . . . . . . . . . . . . 28
14 Conclusion 3014.1 Summary . . . . . . . . . . . . . . . . . . . . . . . . . . . . . 3014.2 Lessons Learned . . . . . . . . . . . . . . . . . . . . . . . . . 3014.3 Disadvantages . . . . . . . . . . . . . . . . . . . . . . . . . . . 3114.4 Future Work . . . . . . . . . . . . . . . . . . . . . . . . . . . 31
15 References 3315.1 Introduction . . . . . . . . . . . . . . . . . . . . . . . . . . . . 3315.2 Current System . . . . . . . . . . . . . . . . . . . . . . . . . . 3315.3 Infographics and Data Visualization . . . . . . . . . . . . . . 3315.4 Databases and Touch Screen Displays . . . . . . . . . . . . . 3515.5 Internationalization and Localization . . . . . . . . . . . . . . 37
List of Figures
1 Use Case Diagram . . . . . . . . . . . . . . . . . . . . . . . . 42 Conceptual Model: Language selection page . . . . . . . . . . 53 Conceptual Model: Country selection page . . . . . . . . . . . 64 Conceptual Model: Survey topic selection . . . . . . . . . . . 65 Conceptual Model: Result page . . . . . . . . . . . . . . . . . 76 System Sequence Diagram . . . . . . . . . . . . . . . . . . . . 117 Software Architecture Diagram . . . . . . . . . . . . . . . . . 158 Country selection screen . . . . . . . . . . . . . . . . . . . . . 179 Main topic selection screen . . . . . . . . . . . . . . . . . . . 1810 Subtopic selection screen . . . . . . . . . . . . . . . . . . . . . 1911 Subtopic screen with subtopic selected . . . . . . . . . . . . . 20
iv

12 Result page displaying sample results via pie chart . . . . . . 2113 Result page displaying sample results via bar graph . . . . . . 2214 Risk Analysis Table . . . . . . . . . . . . . . . . . . . . . . . 25
v
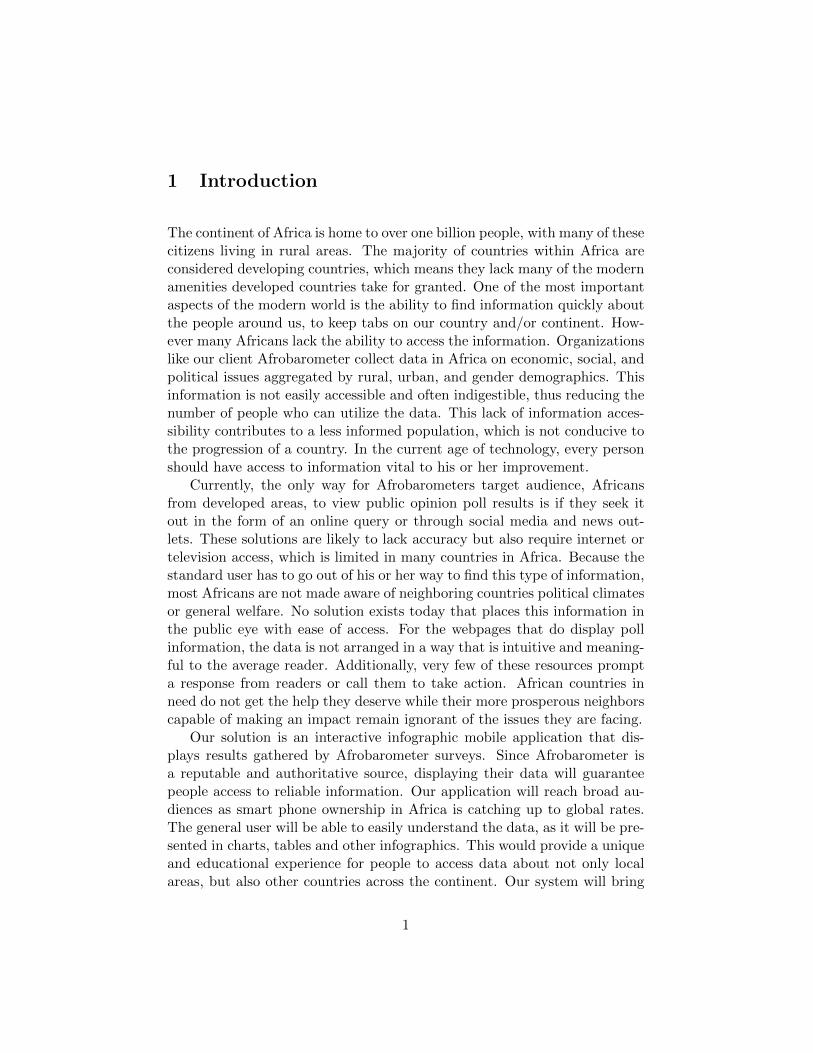
1 Introduction
The continent of Africa is home to over one billion people, with many of thesecitizens living in rural areas. The majority of countries within Africa areconsidered developing countries, which means they lack many of the modernamenities developed countries take for granted. One of the most importantaspects of the modern world is the ability to find information quickly aboutthe people around us, to keep tabs on our country and/or continent. How-ever many Africans lack the ability to access the information. Organizationslike our client Afrobarometer collect data in Africa on economic, social, andpolitical issues aggregated by rural, urban, and gender demographics. Thisinformation is not easily accessible and often indigestible, thus reducing thenumber of people who can utilize the data. This lack of information acces-sibility contributes to a less informed population, which is not conducive tothe progression of a country. In the current age of technology, every personshould have access to information vital to his or her improvement.
Currently, the only way for Afrobarometers target audience, Africansfrom developed areas, to view public opinion poll results is if they seek itout in the form of an online query or through social media and news out-lets. These solutions are likely to lack accuracy but also require internet ortelevision access, which is limited in many countries in Africa. Because thestandard user has to go out of his or her way to find this type of information,most Africans are not made aware of neighboring countries political climatesor general welfare. No solution exists today that places this information inthe public eye with ease of access. For the webpages that do display pollinformation, the data is not arranged in a way that is intuitive and meaning-ful to the average reader. Additionally, very few of these resources prompta response from readers or call them to take action. African countries inneed do not get the help they deserve while their more prosperous neighborscapable of making an impact remain ignorant of the issues they are facing.
Our solution is an interactive infographic mobile application that dis-plays results gathered by Afrobarometer surveys. Since Afrobarometer isa reputable and authoritative source, displaying their data will guaranteepeople access to reliable information. Our application will reach broad au-diences as smart phone ownership in Africa is catching up to global rates.The general user will be able to easily understand the data, as it will be pre-sented in charts, tables and other infographics. This would provide a uniqueand educational experience for people to access data about not only localareas, but also other countries across the continent. Our system will bring
1

independent peoples together through a wealth of knowledge made readilyavailable at just the touch of a button. Furthermore, our solution will worktoward raising awareness amongst people in Africa. We hope that with thisawareness, people will gain insight that inspires them to take philanthropicaction.
2

2 Background or related work
Previous senior design projects have tried to achieve similar results for sim-ilar issues. One such project was a group from the 2016 Senior DesignConference titled Tanzania Education Graphing, Ranking, and Mapping.The solution was a webpage that allowed users to interact with a graph ormap page and view statistics on educational data in Tanzania.
Our solution is specific to another dataset entirely and also has verydifferent functional and non-functional requirements as well as design con-straints. For our senior design project, we are working on creating an in-fographic display specifically for Afrobarometer’s aggregated data. BecauseAfrobarometer employed the help of the Frugal Innovation Hub and Dr. Sil-via Figuiera to carry out this task, our project will be the first attempt tosolve this problem. Our solution will play a pivotal role in raising awarenessabout a variety of issues in Africa.
3

3 Use Cases
The use case diagram visualizes all of the potential users (actors) in a sys-tem. The diagram outlines all of the ways that an actor can interact withthe system. Each actor is represented by a stick figure which has a linedrawn connecting it to an activity bubble. Our project’s use case diagramonly involves one actor, as there is only one way to interact with our projectfrom a user’s side. Figure 1 shows the use case diagram as well as a tableoutlining pre-conditions, post-conditions, steps, and exceptions for the usecase.
Figure 1: Use Case Diagram
4

4 Conceptual Model
4.1 Introduction
Our conceptual model is made up of a low fidelity prototype. It is a simplewireframe mockup that shows a generalized view of the application withoutgetting too concerned with design and usability. Our conceptual model alsodoes not concern itself with marketing and using the companys exact colorsthough that is a crucial detail in the final application. The figures belowoutline the major features in our application.
4.2 Figures
Figure 2: Conceptual Model: Language selection page
5

Figure 3: Conceptual Model: Country selection page
Figure 4: Conceptual Model: Survey topic selection
6

Figure 5: Conceptual Model: Result page
7

5 List of Requirements
5.1 Introduction
This section organizes the requirements of the project into three categories:functional requirements, non-functional requirements, and design constraints.Functional Requirements are those which the project must perform. Non-Functional Requirements are those which impact user experience. Lastly,Design Constraints are limitations on the scope of the project. Additionally,each of these requirements are further divided into subcategories based ontheir level of priority: critical, recommended and suggested.
5.2 Functional Requirements
• Critical
– The system will aggregate associated data by country
– The system will produce the appropriate infographics based onthe users selections
– The system will accredit all data used to Afrobarometer and ac-knowledge copyright holders
– The system will allow the user to browse results on specific topics
∗ Examples: gender equality, economy, taxation and nationalidentity
• Recommended
– The system will allow the user to select the survey rounds (yearwhen survey was taken)
∗ Implementing selection of several rounds depends on howmuch is needed for prototype
∗ User can choose from six rounds (years when survey wastaken)
• Suggested
– The system will support language selection
∗ English or French
8

5.3 Non-Functional Requirements
• Critical
– The system will be intuitive for the user to make specificationson the data to be viewed
– The system will be easy to use
– The system will be quick and responsive
– The system will produce clear and understandable infographics
– The system will be extendable/scalable
• Recommended
– The system will be flexible/adaptable to possible requirementchanges
• Suggested
– The system will be internationalized to support a multilingualaudience
– The system will be extensible for future projects
5.4 Design Constraints
• Critical
– Must function on iOS and Android devices
– Must be easily transferable to other hardware
• Recommended
– Should quickly render graphs that are easily intelligible
– Should utilize a database-centric architecture for data access
– Should utilize an event-based architecture for user interface
9

6 System Sequence Diagram
6.1 Introduction
This system sequence diagram outlines the basic flow of user activity whenusing our system. When users first access the system, they are promptedto select the survey round they would like to review. The user then spec-ifies which country or countries to investigate given the specified round.Afterward, the user selects which survey question to interpret. This step ismultifaceted; a survey topic is first selected, and each survey topic is dividedinto subcategories. Under each subcategory is a series of particular surveysfrom which the user makes his or her selection. The user is then presentedwith the appropriate infographics containing all information specific to theround, countries, and survey topic chosen. After viewing these infographicsthe user can start a new data analysis session or exit. At any point, theuser always has option to perform the subsequent action or exit the systementirely.
10

6.2 Diagram
Figure 6: System Sequence Diagram
11

7 Design Rationale
The design rationale describes features in our application and the justifica-tion for including each feature.
7.1 Features
• Startup Page
Description: Displays an option to select between two display lan-guages (English and French)
Rationale: We expect to have the majority of our audience be English-speaking, but we want to accommodate the French-speaking audiencein Africa as well.
• Back Button
Description: Allows users to move one page back
Rationale: We want to give users the ability to freely navigate theapplication as well as going back to make different selections.
• Home Button
Description: A button that allows users to return to the first screen
Rationale: Gives users ability to start over and make new selections
• Category Selection
Description: A page that allows users to select from a multitude ofcategories
Rationale: Allows users to fully personalize the results they are mostinterested in seeing
• Analyze Button
Description: A button to display results after categories have beenselected
Rationale: This button is necessary because we want to allow users toselect from several different categories before choosing to view resultsrather than automatically displaying results after the selection of justone category.
12

7.2 Suggested Features
These features include functionality that was not required and could benefitthe application users in a later and future build or extension.
• Donate Button
Description: Navigates to donation page when clicked
Rationale: If users are compelled to take action and donate, we allowthem to with the simple selection of this button
• Donate Page
Description: A form that takes user’s payment information as well asan option to select from different charities
Rationale: This page allows users to make a transaction and selecttheir desired charity for a more meaningful experience. If in the futureour application is scaled up for use in public spaces, this page wouldonly take the user’s email address and desired charity. They would beemailed more information about the charity as well as ways to donate.
13

8 Technologies Used
The technologies used outlines the languages as well as hardware used tocomplete the design and testing of our product. These particular technolo-gies were chosen because of our familiarity with web development as well astheir ability to complete the project. The technologies we used are listedbelow:
• Client Side
– JavaScript
• Front End
– HTML
– CSS
• Server Side
– Node.js
– MongoDB
• Deployment
– Adobe PhoneGap
14

9 Architecture Diagram
The Architecture Diagram outlines the kind of software architecture utilizedto create our project. Our project utilizes a Database Centric architecturewith a NodeJS server acting as the intermediary between the client’s phoneand the MongoDB. The MongoDB database is the center of our project.Using the data stored there, we can populate the various client screens thatwill be connected to the database.
Figure 7: Software Architecture Diagram
15

10 Design
10.1 Original Requirements and Scope Changes
Upon our first meeting with Afrobarometer, we had a solid outline of ouroriginal project. We were initially tasked with creating a touchscreen ap-plication that would allow a user to query data and display graphs of Afro-barometer’s data. Afrobarometer would place these screens in various com-mon areas with high foot traffic in order to further proliferate their surveyresults. With this in mind, we set out to research and begin the process ofcreating this touchscreen application.
Our initial idea was to write the program in Java and utilize a computerto host the application. Users would then interact with the application ona 40-inch or larger touchscreen. After a lapse in our communication withAfrobarometer and some confusion on both ends, we realized that there wasa requirements and scope miscommunication. The Afrobarometer partybelieved that we would be constructing the physical screens as well as theapplication. They were also lead to believe due to extenuating circumstancesthat there was a team developing a mobile application for them. Due to thismiscommunication, as well as their interest in a mobile application, ourgroup decided that the best course of action would be to pivot and createa mobile application instead of the original touchscreen idea. With thisscope change our group set out to develop the application using the AdobePhoneGap framework as well as standard web development technologieswhich we were comfortable using.
10.2 Final Design
After settling on our final project scope, our group set out to create anapplication with a simple flow, intuitive for those familiar and unfamiliarwith technology. The application flows from one stage of selection to thenext, allowing a user to appropriately narrow their search to their desiredresults. The country selection page, shown in Figure 8, allows the user toselect the country about which he or she would like to learn. The subsequenttopic screen sorts surveys by general topic, ranging from socio-demographicsto politics, as shown in Figure 9. Once a general topic is specified, itscorresponding subtopics are then listed for the user to browse. The followingscreen allows the user to select a particular survey question for which theywish to view the resulting data, as shown in Figure 11. The results aredisplayed on the final screen in the form of a pie and bar chart - shown inFigures 12 and 13 - between which the user can toggle.
16

Figure 8: Country selection screen
17

Figure 9: Main topic selection screen
18

Figure 10: Subtopic selection screen
19

Figure 11: Subtopic screen with subtopic selected
20

Figure 12: Result page displaying sample results via pie chart
21

Figure 13: Result page displaying sample results via bar graph
22

11 Test Plan and Test Cases
11.1 Introduction
The test plan describes the steps we planned to take in testing our applica-tion as well as the types of testing that were to be performed at each stage.The test cases track specific actions and features that should be tested inaddition to expected results of each action.
11.2 Test Plan
For our first round of testing, we were in alpha testing stage. In this stage,each member performed white box testing for general functionality on thefeature they owned. When the code was refined, we followed this with around of black box testing in which each member tested features they didnot implement. We concluded the alpha test stage with a final round ofwhite box testing and unit testing.
11.3 Test Cases
• Country Selection Page
We tested this page by ensuring that it loaded properly and quickly.We tested each radio button and submitted on each country to ensurethat the next page contained the proper country information. Addi-tionally we eliminated the need to disable the submit button until acountry was selected by having one radio button selected by default.
• Back Button
Selection of this button takes users exactly one step backwards intheir activity timeline but should still maintain query information fromselections made on screens earlier on in the activity flow.
• Survey Topics and Subtopic Selection
There are a variety of topics that the user can select from. Individualselections and a combination of selections were tested to ensure thatthe data displayed on the application reflects the selected topics.
• Analyze Button
After the subtopic is selected, the Analyze button is clicked. Thisresults in the page displaying results based off of the selected subtopic.The question at the top of the page should be the question related to
23

the subtopic. Not only did we test to make sure that the page isupdated but also that the information displayed is correct.
24

12 Risks
A risk table lists all the potential issues that might arise throughout thedevelopment of our project. Some of these potential risks are more easy toavoid than others and some have a much greater impact on the project thanothers. Each risk has a probability, severity, impact (probability * severity),and mitigation strategy associated with it. This table outlines the majorrisks our project faces. There are other unforeseeable risks outside the onesshown. However, these risks create the biggest issues for out project.
Figure 14: Risk Analysis Table
25

13 Societal Issues
13.1 Introduction
Santa Clara University takes pride in crossing high-tech innovation withsocial consciousness. The School of Engineering emphasizes ”engineeringwith a mission” – that is, supporting students to develop an intellectualcuriosity and passion for ”building a more just, humane and sustainableworld.” This entails a regard for numerous societal issues when developingany engineering project. This section describes how our project relates toeach of these societal issues.
13.2 Ethical
Due to the fact that our project is a simple application to display simpleinfographics representing Afrobarometer’s survey data, no ethical issues wereraised about our project. At the very least, some survey questions could beregarded as ethically inauspicious or pressing (depending on the currentstate of the country or region), but that is not a matter of concern for ourproject.
13.3 Social
This is potentially the most important issue that our project addresses. Theprimary motivation for the development of our application was our concernfor the social nature of Afrobarometer’s surveyed countries. We anticipatethe social impact of our work to be substantial and of good consequence.Since our application will provide thousands of people with powerful andhelpful knowledge, the goal is for users to harness this knowledge to generateprogress and positive change to improve the quality of life in these developingcountries.
13.4 Political
As we’ve discovered from data compiled by Afrobarometer, many of thequestions asked are heavily political. By creating an anonymous platformfor citizens to freely state opinions about local and state leadership andgovernment authorities, our application and the information provided byAfrobarometer could lead to the development of changing opinions, groundsfor political grassroots movements, or increased political interest and in-volvement.
26

13.5 Economic
With our initial project scope we had the economic considerations of pur-chasing a touch screen as well as finding the appropriate computer to run itoff of. However, as our project evolved the need for such purchases disap-peared. The only cost for us to create this project came in the form of ourtime spent on writing code and researching. In terms of the user, they mustown a smart phone capable of running our application as well as having ac-cess to the Internet. We tried to develop this application in the most frugalway possible. We did not end up spending any money on things during thedevelopment of the application.
13.6 Health and Safety
We hope that with the proliferation of the data provided by Afrobarometer’ssurveys, outsiders as well as the citizens of the surveyed countries will bemade aware of the living conditions there. The questions shed light on issuessuch as availability of water and food to the safety of the neighborhoods.While we agree with Afrobarometer’s ultimate goal to give people a voice andalso a say in policy-making, our own goal is that exposure to this informationwill stir people to become involved and take action to better the lives ofothers less fortunate.
13.7 Manufacturability
Due to the fact that our project definition changed late in our developmenttimeline, the application was merely built to provide all the necessary func-tionalities. It can, however, be improved in efficiency and perhaps rebuiltusing better technologies. Since it is purely software, there are no hardwaremanufacturing concerns or costs to consider.
13.8 Sustainability
In narrow terms of sustainability, our application, if used over a long periodof time, will certainly require constant updates so to be useful for our clientand users for a reasonable amount of time. As Afrobarometer projects tocontinue surveying for as long as possible, we suspect that the need for ourapplication will persist equally as long. Since our application will be used ontablets or smartphones, the sustainable impact it will have in the broadersense will be significantly low. We are simply making use of resources –
27
in our case, devices – that already exist and extending their usefulness byproviding important data to the people who would most benefit from it.
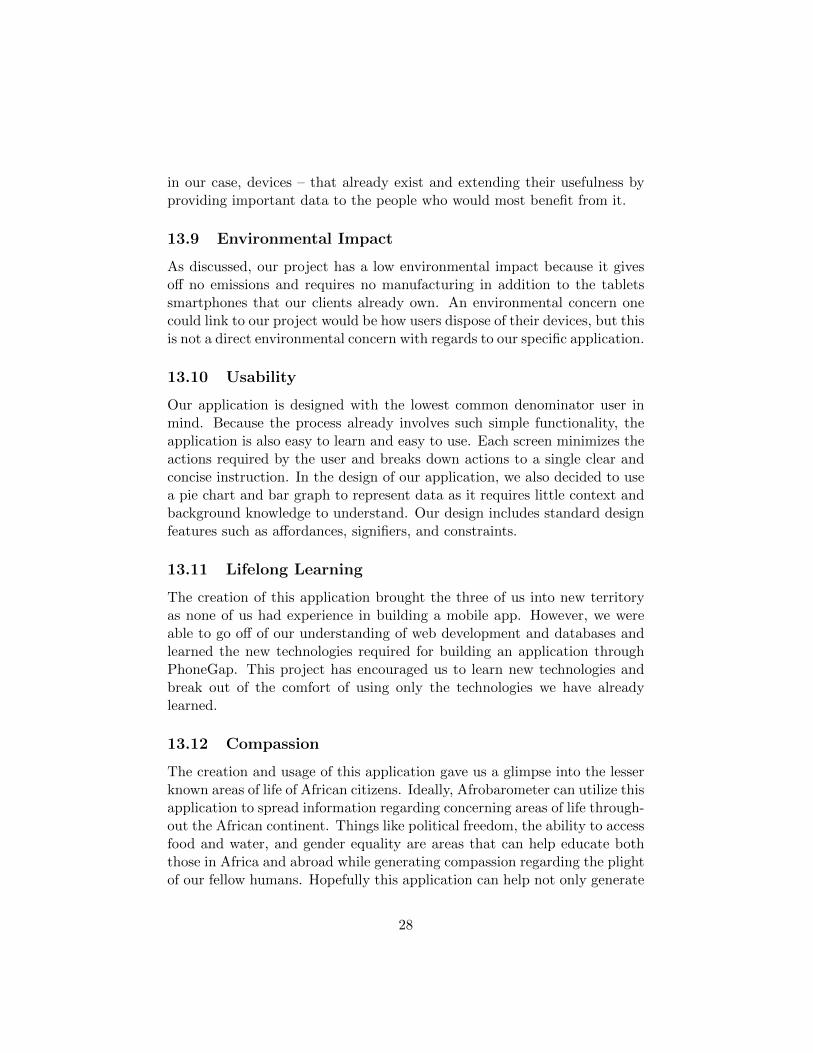
13.9 Environmental Impact
As discussed, our project has a low environmental impact because it givesoff no emissions and requires no manufacturing in addition to the tabletssmartphones that our clients already own. An environmental concern onecould link to our project would be how users dispose of their devices, but thisis not a direct environmental concern with regards to our specific application.
13.10 Usability
Our application is designed with the lowest common denominator user inmind. Because the process already involves such simple functionality, theapplication is also easy to learn and easy to use. Each screen minimizes theactions required by the user and breaks down actions to a single clear andconcise instruction. In the design of our application, we also decided to usea pie chart and bar graph to represent data as it requires little context andbackground knowledge to understand. Our design includes standard designfeatures such as affordances, signifiers, and constraints.
13.11 Lifelong Learning
The creation of this application brought the three of us into new territoryas none of us had experience in building a mobile app. However, we wereable to go off of our understanding of web development and databases andlearned the new technologies required for building an application throughPhoneGap. This project has encouraged us to learn new technologies andbreak out of the comfort of using only the technologies we have alreadylearned.
13.12 Compassion
The creation and usage of this application gave us a glimpse into the lesserknown areas of life of African citizens. Ideally, Afrobarometer can utilize thisapplication to spread information regarding concerning areas of life through-out the African continent. Things like political freedom, the ability to accessfood and water, and gender equality are areas that can help educate boththose in Africa and abroad while generating compassion regarding the plightof our fellow humans. Hopefully this application can help not only generate
28

armchair compassion, but empower people to take action to alleviate thesuffering of the planet’s less fortunate.
29

14 Conclusion
14.1 Summary
Ideally, this project will result in an increased awareness of the Africanpopulation regarding the status of their fellow citizens. The quick spreadof information and in an easily digestible form allows for a more informedpopulation able to enact change. Technology is ubiquitous in developedcountries like the United States, but the developing world lacks the sameexposure to the computerized world. By exposing a larger portion of thepopulation to technology and data regarding their countrymen, more peoplecan understand the needs of their society, and ideally enact changes faster.Researchers studying the usefulness of technology from a social benefit per-spective will likely see increased social awareness stemming from the spreadof information.
If successful, our project would serve as a means for people to learninsightful, statistical information about areas in Africa that Afrobarometerhas surveyed. To provide these people in Africa access to this data wouldbe giving them the power to connect through learned knowledge and themotivation necessary to take positive action. Additionally, our project wouldsignificantly widen the scope of Afrobarometers audience, thus giving themthe power to impact thousands more people than the number currently madepossible by their current website.
We hope for the resulting impact of this project to be exponential. It wasour team’s job to develop the application that would display Afrobarome-ter’s data. Now as we hand our completed work over to Afrobarometer –the final step of our project – the success of the product depends on themanner in which it is deployed. Afrobarometer will take charge of the de-ployment and oversee its use in the countries in which it will be placed.This project was developed under Santa Clara Universitys Frugal Innova-tion Hub, a collaborative space under the School of Engineering that focuseson humanitarian projects and partnering with social enterprises. With thatsaid, our project will participate in the social entrepreneur movement tohopefully inspire more projects of similar nature.
14.2 Lessons Learned
Working with a real-world client was a true challenge and privilege as it pre-pared our team for similar engineering projects in which we will participatein the near future. From working with Afrobarometer, we experienced the
30

setbacks resulting from major specification changes, particularly those latein the project development timeline. This taught our team to be adaptableand versatile. Additionally, because Afrobarometer is based in Africa, weendured the challenge of communicating with a client in a different timezone.This led to delayed communication and also made our project dependent onthe response time of Afrobarometer.
The importance of communication was also made evident when deter-mining the actual specifics of our project. For example, after our first meet-ing with Afrobarometer, we assumed that we had a clear understanding ofwhat was expected of our team. However, we later learned that our under-standing heavily contradicted Afrobarometer’s expectations and this calledfor a reiteration of project specifications and requirements. We attemptedconstant contact with our client to ensure that we were keeping up to theirstandards.
Due to several changes to our project, our team developed a number ofminor prototypes of the interface we were designing. As a result, we wereexposed to a vast assortment of different back-end and front-end technologiesas we experimented to determine with which we preferred to develop. Welearned that technology research was crucial to finding technologies thatwork well together and thus creating an optimized version of a product.
14.3 Disadvantages
Although our project covers the breadth of the desired application’s func-tionality, it is not fully implemented depth-wise. In other words, our teamprioritized showing how our system works from start to finish, but there area number of surveys that have not yet been imported into our database, aswell as a few countries whose surveys are not accounted for. Our main con-cern when developing our application was to show that we could completea full query from selection to data visualization for a sample of Afrobarom-eter’s surveys. In addition, we imported only the most recent round (i.e.survey year) of surveys that Afrobarometer collected. Thus, our database islimited to only a fraction of Afrobarometer’s entire database.
14.4 Future Work
Our Senior Design team has several plans for improving our system. Thesetasks will either be completed by our team or by developers at Afrobarom-eter, depending on the direction Afrobarometer decides to take with ourproject. One such improvement includes expanding our application’s database
31

so that it more closely reflects (or mirrors) the size of Afrobarometer’s com-plete database. To do so, thousands more surveys must be imported forall countries and all rounds. Once multiple rounds are available, the userwould ideally be able to select the exact round he or she would like to in-vestigate. Another improvement would be allowing the application’s user toselect multiple countries at once for a single query in order to compare dataamongst those selected countries for one specific survey. Finally, we hopeto improve the universal usability of our application by increasing the num-ber of languages in our interface. We cannot assume that an applicationdeployed in Africa will be understood by the entire African population ifonly made accessible in English. Ideally, French would be the first languageto implement as it is vastly spoken throughout the continent. Later theselanguages could include those native to specific countries such as Akan orEwe, the two most widely-spoken languages in Ghana.
32

15 References
15.1 Introduction
This section provides a review of the references to which we referred forresearch and background information. Each section contains a summary ofeach cited article in our Senior Design project.
15.2 Current System
This section analyzes the two sources from which we obtained informationabout our client and their current system.
• “Welcome to Afrobarometer.” Welcome to Afrobarometer — Afro-barometer. Afrobarometer, 2016. Web. 15 Oct. 2016.
This webpage provided the necessary background information for ourteam to understand the identity of Afrobarometer in order to imple-ment a system perfectly geared toward their needs.
• “Online Data Analysis.” Online Data Analysis — Afrobarometer. Afro-barometer, 2016. Web. 15 Oct. 2016.
This is the direct webpage containing Afrobarometer’s current system:The Online Data Analysis Tool.
15.3 Infographics and Data Visualization
This section of our literary review contains the sources to which we havereferred for information on creating effective infographics for data visualiza-tion.
• Ashman, Rachel, and Anthony Patterson. “Seeing the Big Picture InServices Marketing Research: Infographics, SEM And Data Visualisa-tion.” Journal of Services Marketing 29.6/7 (2015): 613-621. BusinessSource Complete. Web. 23 Oct. 2016.
This article describes four guidelines for creating effective infographicsthat promise to make quantitative data more accessible and impactful.By following these guidelines, researchers can present the informationsimply without watering down the data too much. The methods inthe article allow researchers to appeal to a broader audience, as wehope to do when the app is deployed to audiences in Africa. Our
33

target audience will range from professionals to children so we needto create infographics that are simple to understand yet maintain asophistication that will appeal to more informed demographics.
• Gamble, Tim and Jon May. “Transitions in Interface Objects: Search-ing Databases.” Advances In Human-Computer Interaction (2016): 1-5. Applied Science & Technology Source. Web. 22 Oct. 2016.
Tim Gamble and Jon May researched different ways to display infor-mation for searching across a database like screen. Their results givevalidity to the claim that close attention needs to be paid when design-ing informational layouts because the design can have a large impacton how easily a user completes a task. In the case of our project, wewill need to closely test and vet different ways to display the infor-mation, as a bad display could ruin the usability of the project. Mayand Gamble mainly focus on the distance that the eye has to travelto find the information in relation to how efficiently participants cancomplete a task. We have used the results of their study to tailor thedesign of the display of our information.
• Godfrey, Parke, Jarek Gryz and Piotr Lasek. “Interactive Visualiza-tion of Large Data Sets.” IEEE Transactions On Knowledge & DataEngineering 28.8 (2016): 2142-2157. Applied Science & TechnologySource. Web. 23 Oct. 2016.
This article identifies interactive visualization as an effective methodfor data analysis as well as the challenges that come with trying to vi-sualize large data sets. The authors focus mainly on the issue of queryprocessing within a database system. This article will help us to formmeaningful queries that are relevant to the way we want to manipulateAfrobarometers database. With the authors acknowledgement of thechallenges of data visualization, their recommendations have helpedus create queries that overcome the difficulties of creating quick queryresponses and showing sufficient data points.
• Kosara, Robert. “Presentation-Oriented Visualization Techniques.”IEEE Computer Graphics & Applications 36.1 (2016): 80-85. AppliedScience & Technology Source. Web. 7 Oct. 2016.
This article focuses on presentation-oriented techniques when display-ing data. Since data visuals are the perfect accompaniment to storiesor random pieces of information to enhance the audiences level of un-derstanding, the presentation of this data is truly important. Histor-
34

ically, traditional visualization techniques have been dismissed as lessimportant to the information it accompanies; however, since our sys-tem will be presenting infographics, i.e. both content and visuals, wewould like to prioritize the visualization aesthetic. This article helpedus pinpoint exactly what makes an infographic presentation-orientedso to create the best user experience possible for our audience.
• Otten, J. J., K. Cheng, and A. Drewnowski. “Infographics And PublicPolicy: Using Data Visualization To Convey Complex Information.”Health Affairs 34.11 (2015): 1901-1907. Global Health. Web. 7 Oct.2016.
This article discusses the concept of data visualization from multi-ple perspectives including psychology, usability, graphic design, andstatistics. The article describes how to portray data in easily accessi-ble and appealing formats, which is precisely the problem our projecthopes to address. The role of infographics in bridging the gap betweenproducers and consumers of information is a key concept detailed inthis article. Our project hopes to present complex information in anabsorbable format so that the users of our system will not only be moreinformed, but they will also feel exceptionally more knowledgeable andcapable of contributing to a particular cause after being informed. Wehope that the users feel as adept as the producers of the information,who are, in this case, representatives of Afrobarometer (our client).
• Parkinson, Mike. “Infographic Tips And Tools.” TD: Talent Develop-ment 70.5 (2016): 26-28. Business Source Complete. Web. 23 Oct.2016.
This article is a basic starting guide to creating infographics and datavisualization. Along with providing tips of its own, the author listsseveral helpful resources to gather inspiration for infographic designand creation. The article discusses different types of charts, graphs,and tables and how best to decide between a graphic method depend-ing on the data in question. The article also takes into considerationthe audience and how to market the information in a way that appealsto them most.
15.4 Databases and Touch Screen Displays
This section analyzes the sources we acquired regarding databases, userinteraction with data, and touch screen displays.
35

• Chen, Travis, and Justin Wong. Tanzania Education Graphing, Rank-ing, and Mapping. BS Thesis, Santa Clara University, 2016.
Chen and Wong have created a website that allows users to interactwith a graph or map page. Users can make selections and queries toview educational data in Tanzania. This senior design thesis is verysimilar to what we hope to achieve through our project. It was helpfulto see how they manipulate data using queries and filters as well asthe way they chose to lay out their navigation. Our project varies inthat ours will be a mobile application spanning a larger data set withmore categories than simply education.
• Clinch, Sarah, Jason Alexander and Sven Gehring. “A Survey of Per-vasive Displays for Information Presentation.” IEEE Pervasive Com-puting 15.3 (2016): 14-22. Applied Science & Technology Source. Web.22 Oct. 2016.
This research details how to utilize pervasive screens in an unobtru-sive way. As screens become more pervasive, it is important to designscreen layouts and information displays in a way that avoids informa-tion overload. The authors suggest focusing keenly on the non-expertuser while placing the screens in an easily accessible yet unobtrusiveplace. The ability to interact with a screen also improves the abilityof the user to digest the data. This information will be important forwhen the application is deployed and used by thousands of users ontheir own devices.
• Coni, Philippe, Jean-Nol Perbert, Lionel Augros, Jean ChristopheAbadie, and Yves Sontag. “A New Application of a Touch ScreenDisplay for Data Transfer.” SID Symposium Digest of Technical Pa-pers 46.1 (2015): 37-40. Applied Science & Technology Source. Web.22 Oct. 2016.
This article details research being done on the transference of datathrough a capacitive touchscreen – that is, a custom touch interfacesystem Although this information will not directly influence our cur-rent project, it is an interesting path that could be taken in the futureto collect data from the touchscreens themselves. By tweaking somesoftware and hardware, users of the screen might be able to transferdata by means of the touchscreen itself, cutting down on the need forexternal hardware. Since this is still developing technology, it can notbe put into use now. However, in the future it could directly apply tothe mission of our project.
36

15.5 Internationalization and Localization
This section of our literary review describes the various sources to which wehave referred for information on implementing a system that incorporatesinternationalization and localization.
• Leiva, Luis A. and Vicent Alabau. “Automatic InternationalizationFor Just In Time Localization Of Web-Based User Interfaces.” ACMTransactions On Computer-Human Interaction (TOCHI) 22.3 (2015):13:1-13:32. Applied Science & Technology Source. Web. 22 Oct. 2016.
This article describes the process of implementing applications thatsupport a multilingual audience. This process consists of two key sub-processes that occur in the following order: internationalization fol-lowed by localization. The article discusses how internationalizationcan be achieved by decoupling translatable text out of the applica-tions source code. Once internationalization is implemented, then thesoftware can be localized to support the requirements of different lo-cales. The two locales specific to our project are English and Frenchinterfaces as the primary language of our audience members will beeither one of these languages. We have referred to the methods de-scribed in this article to successfully implement internationalizationand localization.
• Wang, Xiaoyin, Lu Zhang, Tao Xie, Hong Mei, and Jiasu Sun. “Lo-cating Need-to-Externalize Constant Strings for Software Internation-alization with Generalized String-Taint Analysis.” IEEE TransactionsOn Software Engineering 39.4 (2013): 516-536. Applied Science &Technology Source. Web. 22 Oct. 2016.
This article describes how globalization has affected the software prod-uct industry. In order for software products to meet the requirementsof various local users, the product itself must be internationalized.The article discusses how difficult it is to internationalize an existingproduct due to the need for locating certain strings within the existingdatabase. This article proposes an automatic approach to externaliz-ing data within the strings of the source code of a software product.This documentation will be particularly useful for us later on in ourproject, when we have already successfully implemented our systemin English and we would like to internationalize the system for ourFrench-speaking audiences. Since we are prioritizing the implemen-tation in English and will only internationalize given our time frame,
37

the externalization technique will most likely be of concern if our prod-uct will already be considered a “final product before we add Frenchcapabilities.
38