taking the oath: an analysis of naturalization in
TRANSCRIPT

Taking the Oath:An Analysis of Naturalization in California and the United States
• • •
Hans P. JohnsonBelinda I. ReyesLaura MameeshElisa Barbour
1999
PUBLIC POLICY INSTITUTE OF CALIFORNIA
Library of Congress Cataloging-in-Publication DataJohnson, Hans P.,
Taking the oath: an analysis of naturalization in California andthe United States / Hans P. Johnson . . . [et al.].
p. cm.Includes bibliographical references (p. ).ISBN: 1-58213-012-41. Immigrants—California. 2. Immigrants—United States.
3. Naturalization—United States. I. Johnson, Hans P. JV6920.T34 1999323.6'23'09794—dc21 99-38192
CIP
Research publications reflect the views of the authors and do notnecessarily reflect the views of the staff, officers, or Board ofDirectors of the Public Policy Institute of California.
Copyright © 1999 by Public Policy Institute of CaliforniaAll rights reservedSan Francisco, CA
Short sections of text, not to exceed three paragraphs, may be quotedwithout written permission provided that full attribution is given tothe source and the above copyright notice is included.

iii
Foreword
Over the past 30 years, the number of immigrants in the United
States who have chosen to become citizens has increased dramatically—
from 100,000 in 1969 to over a million in 1996. Yet, in spite of this
large number, over half of all immigrants are not citizens—and the
naturalization rate is even lower in California. Four of PPIC’s
researchers decided to find out why, and they present their results in this
report.
The authors find two primary reasons for California’s lower
naturalization rates. First, many of the state’s immigrants are ineligible
for naturalization because they have entered the country illegally; second,
many of the eligible immigrants have characteristics that are associated
with lower rates of naturalization.
The good news is that over the past several years, naturalization rates
in California have been picking up. The authors attribute this to the
amnesty offered to unauthorized immigrants in the late 1980s and
perhaps to the political environment of the early 1990s. In 1994,

iv
California voters passed Proposition 187, seeking to prevent illegal
immigrants from receiving social services, such as schooling for their
children. There was talk about restricting services and benefits for legal
immigrants as well. In the latter case, immigrants who were eligible for
naturalization may have realized that the best way to protect themselves
from such legislation was to become citizens.
These and other findings in this study provide a much richer picture
of immigration and naturalization in California than has been painted to
date. This portrait, combined with earlier PPIC research estimating the
undocumented immigrant population, identifying the scale of return
migration to Mexico, and measuring the consequences of immigrant
flows for the state’s income disparity, suggests that there is still much to
be learned about the process of immigration to California. It is very
clear, however, that strident characterizations of the state’s economy
either as being in imminent decline due to immigration flows or as
having an infinite capacity to absorb each new wave are much too
simplistic and unrealistic for serious policy debate. This analysis suggests
that there is still much fine-tuning to be done before the picture is
brought into focus.
David W. LyonPresident and CEOPublic Policy Institute of California

v
Summary
Citizenship in the United States is no longer based on membership
in a specific national or ethnic group but is instead conferred on all
people born in the United States as well as on legal immigrants who meet
certain requirements. Naturalization—the conferring of U.S. citizenship
on immigrants—merits analysis for several reasons:
• Naturalization is an indicator of an immigrant’s level ofidentification with and adaptation to life in the United States.
• Naturalization confers the right to vote.
• Citizenship status determines eligibility for certain governmentprograms.
• Naturalization affects future legal immigration flows into theUnited States.
With the arrival of large cohorts of immigrants to the United States
during the past two decades, immigrant adaptation and assimilation have
become key areas of concern for policymakers and researchers. In her
statement to Congress as Chair of the U.S. Commission on Immigration

vi
Reform, Barbara Jordan described the “civic incorporation of
newcomers” as an essential part of immigration policy and claimed that
“naturalization is the most visible manifestation of Americanization.”
Although naturalization is neither a prerequisite for participation in civic
life nor confirmation of economic success, it does serve as an indicator of
an immigrant’s level of identification with and adaptation to life in the
United States. In addition, since naturalization confers the right to vote,
it alters the political landscape of the nation. Furthermore, citizenship
status has been used in recent legislation passed in Washington to restrict
access to various government programs. Finally, because U.S.
immigration law gives priority to family reunification of U.S. citizens,
trends in naturalization affect future patterns and levels of immigration.
Despite its importance, naturalization has received little attention
from policy researchers at the state level. In a state like California, with
large numbers of noncitizens, the lack of such research is particularly
problematic.
Study ObjectivesIn this report, we examine the naturalization of immigrants in
California and the United States. We seek to understand naturalization
behaviors of immigrants in California and in specific California counties
by comparing patterns and trends in naturalization rates in the state with
those in the rest of the country. Our objective is to answer the following
questions:
• What factors are associated with naturalization?
• Do California immigrants have a different propensity tonaturalize? If so, why?

vii
• How and why do naturalization rates vary across counties inCalifornia?
• How has the propensity to naturalize changed over time?
• What role should the state and local governments play inencouraging immigrant naturalization?
Research ApproachWe used numerous data sets and several analytical techniques. Data
used in the study include the 1990 Census Public Use Microdata
Sample, the March Supplements of the Current Population Survey
(CPS) for 1996 and 1997, and Immigration and Naturalization Service
(INS) data on annual naturalizations and legal entries. We also
conducted a survey of county welfare offices in November and December
1997 to identify county efforts to encourage naturalization among
immigrants receiving welfare.
With the census and CPS, it is impossible to identify whether
immigrants are legal or unauthorized residents of the United States.
Some of the people in the sample may not be eligible for naturalization.
This is especially problematic for Mexican immigrants, since Mexico has
a large number of unauthorized immigrants in the United States.
However, in a previous PPIC report on immigrants from Western
Mexico, Reyes (1997) found that most unauthorized immigrants return
to their country of origin soon after migration. Only about one-third
stay in the United States for longer than five years. Hence, restricting the
sample to those who have resided in the country for longer than five
years should eliminate a large proportion of unauthorized immigrants
from the sample. We also restricted the sample to foreign-born people

viii
who were older than 18 at the time of the survey, since that is the
minimum age required for naturalization.
Even with their limitations, the census and the CPS provide the
most comprehensive set of socioeconomic and demographic variables
available for all foreign-born persons in the United States at a particular
moment in time. These data sets are also large nationally representative
surveys, allowing for a careful analysis of naturalization. In the absence
of longitudinal data on legal immigrants, these are the best data sets
available to study naturalization.
We used logistic regression models and 1990 census data to estimate
factors most strongly related to naturalization in the United States,
California, and the counties of the state. We used logistic regression
models with the 1996 and 1997 CPS data to estimate recent temporal
trends in naturalization propensities. We used survival models and INS
administrative data to evaluate long-term trends.
Findings
• Even though the number of immigrants naturalizing in theUnited States has increased over time, the naturalization rateamong eligible immigrants declined substantially from a high of75 percent in 1970 to 55 percent in 1995. Most of the declinecan be attributed to a decrease in the length of time of residencein the United States. In the past few years, however,naturalization rates have increased. The large surge innaturalizations in the 1990s may have been a response toperceived anti-immigrant policies, which might have mobilizedsome immigrants to naturalize and participate in the politicalprocess. The surge in naturalizations is also the result of anincrease in the population eligible to naturalize as a result of the
ix
amnesty program of the Immigration Reform and Control Actof 1986.
• The likelihood of naturalization strongly depends on theimmigrant’s level of adaptation to the United States, but this ismediated by his/her social networks.
• California has one of the lowest rates of naturalization in thenation for two reasons: a greater ineligibility of its immigrantpopulation because of a high concentration of unauthorizedimmigrants, and a population of legal immigrants havingcharacteristics associated with low naturalization rates.
• Naturalization rates vary more across California counties thanacross states. This is largely explained by differences in thecharacteristics of the immigrant population between counties.
• Most California counties engaged in some effort to naturalizetheir immigrant populations after the passage of welfare reformin 1996. However, there is a great deal of variation acrosscounties in terms of naturalization activities, based on eachcounty’s immigrant population, perceived impact of welfarereform, and the number of community-based organizations.
California’s low naturalization rates are not surprising, given the
characteristics of the state’s immigrant population, particularly its high
proportion of unauthorized immigrants. Nevertheless, the very low rates
do suggest that California faces unique challenges. With the largest
immigrant population in the United States and the second lowest
naturalization rate among the states, California has a very large
disenfranchised population. The vast majority of noncitizen immigrants
in California are legal residents of the United States. The inability of
many Californians to participate in the political process means that

x
public policies in the state, especially policies established through the
initiative process, do not adequately represent the views of all
Californians.

xi
Contents
Foreword..................................... iiiSummary..................................... vFigures ...................................... xiiiTables ....................................... xvAcknowledgments ............................... xvii
1. INTRODUCTION ........................... 1
2. WHY DOES NATURALIZATION MATTER? ........ 5
3. RESEARCH APPROACH ...................... 11Data Sources ................................ 11Variables .................................. 15Methodology ............................... 20
4. FACTORS ASSOCIATED WITH NATURALIZATION .. 23Factors Associated with Naturalization in the United States .. 24
Immigrant Adaptation ........................ 25Social Capital .............................. 32Destination and Sending Country Characteristics ....... 37
Do California Immigrants Have a Different Propensity toNaturalize? ............................. 40
How and Why Do Naturalization Rates Vary WithinCalifornia Counties? ....................... 49

xii
5. HOW HAS THE PROPENSITY TO NATURALIZECHANGED OVER TIME? ...................... 53Naturalization Trends: 1960–1996 ................. 53What Explains Recent Trends in Naturalization? ......... 58
6. WHAT ROLE SHOULD STATE AND LOCALGOVERNMENTS PLAY IN ENCOURAGINGIMMIGRANT NATURALIZATION? .............. 65How Has the State Sought to Encourage Naturalization? .... 67How Have the Counties Sought to Encourage
Naturalization? ........................... 68Funding ................................. 69Types of Activities ........................... 70Citizenship Activity by Counties .................. 71Citizenship Efforts and Coordination .............. 78Obstacles to Naturalization ..................... 78
7. CONCLUSIONS AND POLICY IMPLICATIONS ...... 81
AppendixA. Logit Results ................................ 87B. Response Rates to the PPIC Survey of County Welfare
Offices.................................... 97C. Matching of March CPS Records................... 99
References .................................... 101
About the Authors ............................... 105

xiii
Figures
4.1. Simulated Probability of Naturalization by Length ofStay in the United States ..................... 26
4.2. Naturalization Rates by English Proficiency, Controllingfor Other Factors .......................... 27
4.3. Naturalization Rates by Education, Holding OtherFactors Constant .......................... 29
4.4. Naturalization Rates by Income, Controlling for OtherFactors ................................. 30
4.5. The Combined Effect of Education, English Proficiency,and Income on the Probability of Naturalization ...... 30
4.6. Naturalization Rates by Use of Public Assistance,Controlling for Other Factors .................. 31
4.7. The Combined Effect of Spouse and Children’sCitizenship Status on the Probability of Naturalization .. 35
4.8. Ratio of the Probability of Naturalization in Californiato That in the United States by Education .......... 46
4.9. Percentage of Unauthorized Foreign-Born and EligibleForeign-Born Population Who Have Naturalized ...... 48
5.1. Number of Persons Who Naturalized, 1960–1996 ..... 54

xiv
5.2. Number of Legal Immigrants to the United States,1960–1994 .............................. 55
5.3. Estimated Naturalization Rates for Legal PermanentResidents, 1960–1996 ....................... 56
5.4. Average Time Since Becoming Legal PermanentResidents, 1960–1996 ....................... 57
5.5. Estimated Naturalization Rates for Legal Immigrants,Standardized by Time, 1960–1996 ............... 58
5.6. Naturalization Rates by Period of Immigration, 1996and 1997 ............................... 61
6.1. Citizenship Activity by County in California, 1997 .... 73
6.2. Foreign-Born by County in California, 1990 ........ 74
6.3. Percentage Noncitizen by County in California, 1990 ... 75
6.4. Legal Immigrants on SSI as a Share of All SSI Recipientsby County in California, 1996 .................. 76

xv
Tables
2.1. Immigrants by State and Naturalization Status ....... 8
3.1. Definitions of Variables ...................... 17
4.1. Naturalization Rates by Length of Stay in the UnitedStates .................................. 25
4.2. Naturalization Rates by Ability to Speak English ...... 27
4.3. Naturalization Rates by Educational Attainment ...... 28
4.4. Naturalization Rates by Income ................. 29
4.5. Naturalization Rates by Marital Status ............. 33
4.6. Naturalization Rates by Marital Status and Timing ofArrival of Spouse .......................... 34
4.7. Naturalization Rates by Presence and Citizenship Statusof Children .............................. 34
4.8. Naturalization Rates by Country of Origin .......... 38
4.9. Immigrants by State and Naturalization Status ....... 41
4.10. Average of Independent Variables in the Model ....... 43
4.11. Immigrants by County and Naturalization Status ...... 50
5.1. Naturalization Rates in the United States and California,1996 and 1997............................ 60

xvi
5.2. Naturalization Rates by Educational Attainment, 1996and 1997 ............................... 62
6.1. Funding for Citizenship Activities Directed orAssisted by County Welfare Offices in California,1997 and 1998............................ 70
6.2. Types of Citizenship Efforts ................... 71
6.3. Categories of Effort ......................... 72
A.1. Full Model of the Probability of Naturalization, 1990Census ................................. 87
A.2. The Effect of Living in California on the Probability ofNaturalization, 1990 Census ................... 89
A.3. Identifying Trends in Naturalization .............. 93
A.4. Identifying Differences in Naturalization by CaliforniaCounties, 1990 Census ...................... 96

xvii
Acknowledgments
We are grateful to Michael Teitz, Harry Pachon, Susan Martin,
Margaret O'Brien-Strain, and John Ellwood for their thoughtful reviews
of an earlier version of this report. Lina Avidan and Jeff Passel were
generous in sharing their time and expertise. Gary Bjork and Joyce
Peterson proved to be tireless stylistic reviewers, and Patricia Bedrosian
an excellent editor. Although this report reflects the contributions of
many people, the authors are solely responsible for its content.
1
1. Introduction
Citizenship in the United States is no longer based on membership
in a specific national or ethnic group but is instead conferred on all
persons born in the United States as well as on legal immigrants who
meet certain requirements.1 Naturalization—the conferring of U.S.
citizenship on immigrants—merits analysis for several reasons. In the
context of immigration research, naturalization is important because it
serves as a measure of an immigrant’s adaptation to and participation in
broader American society. From a political standpoint, naturalization is
important because it confers the right to vote. Naturalization also affects
future patterns and levels of immigration because U.S. immigration law
gives priority to family reunification of American citizens. Finally,
citizenship has taken on new importance as it now determines eligibility
____________ 1At one time, people of certain nationalities could not become citizens. For
example, the Chinese Exclusionary Act of 1882 banned Chinese immigrants from U.S.citizenship.

2
for certain public assistance programs following welfare reform legislation
passed in 1996.2
Despite its importance, naturalization has received little attention
from policy researchers in California. In a state like California, which has
large numbers of noncitizen immigrants, the lack of such research is
particularly problematic, because a substantial proportion of the state’s
population is disenfranchised from the political process, underrepresented,
and unable to qualify for many social services. We do not understand why
so many immigrants in California have not naturalized, and thus we have
limited knowledge of what can or should be done to encourage
naturalization. In this report, we seek to understand naturalization
behavior by comparing patterns and trends in naturalization in California
with those in the rest of the country. Our objective is to answer the
following questions:
• What factors are associated with naturalization in the UnitedStates, and how do these factors operate in California?
• How has the propensity to naturalize changed over time?
• How and why do naturalization rates vary across counties inCalifornia?
• What role do state and local governments play in encouragingimmigrant naturalization?
In the next chapter, we discuss in greater detail the social and
political importance of naturalization. Chapter 3 presents our data and
____________ 2Naturalization provides immigrants with other benefits as well. For example,
students qualify for financial aid only if they are U.S. citizens; Social Security paymentsfor noncitizens living abroad are reduced by 15 percent; many public safety andgovernment positions require citizenship; and there are even restrictions on the types oftax deductions for surviving spouses of noncitizens.

3
methods. Chapters 4 through 6 present our findings—Chapter 4
identifies immigrant characteristics associated with the propensity to
naturalize, Chapter 5 evaluates temporal trends in naturalization rates,
and Chapter 6 identifies the ways in which the state and county
governments have encouraged naturalization. Finally, Chapter 7
discusses the findings and how they relate to policy.

5
2. Why Does NaturalizationMatter?
Researchers believe that as immigrants adapt to life in the United
States, expand their families, and improve their social and economic
standing, they become more attached to U.S. society. This, in turn,
encourages them to participate in the political process and to become
more socially integrated, leading to naturalization (Bernard, 1936; Liang,
1994). Thus, naturalization serves as a measure of an immigrant’s
adaptation to and participation in broader society. Low rates of
naturalization could indicate that a significant portion of the country’s
and the states’ population is isolated from mainstream society,
disenfranchised from the political process, and underrepresented.
With the arrival of large numbers of immigrants during the past two
decades, immigrant adaptation has become a key area of concern to
policymakers and researchers. In its report to Congress, the U.S.
Commission on Immigration Reform stated that naturalization is “the
most visible manifestation of civic incorporation as well as a crucial

6
component of the Americanization process” (U.S. Commission on
Immigration Reform, 1997). In her letter to Congress, Barbara Jordan,
Chair of the Commission, urged Congress to “provide full support for
efforts to encourage and facilitate the naturalization process” (U.S.
Commission on Immigration Reform, 1997).
Although naturalization is neither a prerequisite for participation in
civic life nor confirmation of economic success, it does serve as an
indicator of an immigrant’s level of identification with and adaptation to
life in the United States. In California, which has a large number of
immigrants, naturalization patterns and trends provide an important
measure of the extent to which all Californians choose and are able to
fully participate in the life of the state.
Because naturalization confers the right to vote, increases in
naturalization alter the political landscape of the nation and especially the
state. Large increases in immigrant naturalization and voting have been
cited as important factors in the outcomes of some recent California
elections.1 The importance of changes in California’s voting population
is apparent to political parties in the state. For example, an internal
report by the staff of the Assembly Republican caucus notes that the
decline in registered Republicans is “indicative of the GOP’s inability to
come to grips with the state’s changing demographics, economics, and
political trends” (Los Angeles Times, Sunday, August 17, 1997). Both the
1998 Democrat and Republican gubernatorial nominees opposed the
June 1998 initiative that restricted bilingual education in the state,
seeking to capture the immigrant vote.
____________ 1Latino and immigrant votes have been cited as key factors in Loretta Sanchez’s win
over Robert Dornan in an Orange County congressional district race in 1996 and in thepassage of a $2.4 billion school bond for the Los Angeles Unified School District in 1997.

7
Naturalization also has implications for immigration trends in the
future (Jasso and Rosenzweig, 1986). Although recent proposals have
called for a reduction in the importance of family reunification in U.S.
immigration law, current law still gives priority to family reunification.
For example, in recent years a large proportion of the immigrants who
were granted legal permanent residency status in this country were
related to a U.S. citizen. Once an immigrant naturalizes, the
immigrant’s spouse, parents, children, and siblings are eligible to
immigrate to the United States and are exempt from any numerical
limitation.
Recently, naturalization has taken on added importance, because
citizenship status is now used to determine eligibility for certain social
benefits. The Personal Responsibility and Work Opportunity
Reconciliation Act of 1996 is the first legislation in decades to make a
distinction between citizens and noncitizens in terms of eligibility to
receive certain social services. Although the legislation mandated
significant cuts in benefits to immigrants, most benefits were reinstated
for current immigrant groups (those who entered the United States
before August 22, 1996). However, except for refugees, new entrants are
no longer eligible to receive most federally funded social services until
after naturalization or after 40 quarters of employment in the United
States. This could eventually affect county programs such as general
assistance, because counties will become the providers of last resort for
immigrants no longer eligible for federally funded social services. Some
counties in California responded to the 1996 legislation by encouraging
naturalization, seeking to shift the burden of providing benefits back to
the federal government.

8
Finally, naturalization is especially important in California, the state
with the largest immigrant population in the country. California is
home to close to one-third of the adult immigrant population in the
United States. Although the vast majority of the immigrant population
in the state are legal immigrants, most of them have not naturalized (see
Table 2.1). Furthermore, naturalization rates for immigrants in
California are substantially lower than those for immigrants in the rest of
the nation: California ranks 49th of the 50 states in terms of
naturalization rates. With the notable exception of Texas, in other high-
immigration states (New York, New Jersey, Florida, and Illinois) over 50
percent of the immigrant population has naturalized, compared to 43
percent in California. One reason for this low rate of naturalization is
the large number of unauthorized immigrants. Other reasons are less
obvious. We explore this in Chapter 4.
Table 2.1
Immigrants by State and Naturalization Status
State NoncitizensNaturalized
CitizensTotal
Immigrants%
NaturalizedU.S. Total 6,437,336 7,149,008 13,586,344 53
Montana 2,434 7,841 10,275 76South Dakota 1,326 3,649 4,975 73West Virginia 3,425 8,972 12,397 72Pennsylvania 77,234 196,731 273,965 72Ohio 55,071 139,284 194,355 72Delaware 4,886 11,327 16,213 70Missouri 17,552 40,349 57,901 70Vermont 4,275 9,585 13,860 69Alaska 4,886 10,905 15,791 69Hawaii 36,884 81,860 118,744 69Indiana 22,859 47,238 70,097 67New Hampshire 10,560 21,786 32,346 67Alabama 9,299 19,115 28,414 67

9
Table 2.1 (continued)
State NoncitizensNaturalized
CitizensTotal
Immigrants%
NaturalizedNorth Dakota 2,255 4,635 6,890 67Nebraska 6,283 12,388 18,671 66Kentucky 6,998 13,614 20,612 66Michigan 94,551 182,530 277,081 66South Carolina 11,760 22,446 34,206 66Maine 10,844 19,730 30,574 65Wisconsin 29,539 53,396 82,935 64Mississippi 5,319 9,303 14,622 64Connecticut 78,520 133,388 211,908 63Arkansas 6,533 10,892 17,425 63Iowa 10,662 17,528 28,190 62New Jersey 263,121 431,482 694,603 62Kansas 14,665 23,801 38,466 62Utah 15,106 24,143 39,249 62Minnesota 27,803 44,021 71,824 61Tennessee 15,429 23,655 39,084 61Washington 89,001 133,764 222,765 60Oregon 36,990 54,747 91,737 60Colorado 39,903 58,986 98,889 60Wyoming 2,500 3,604 6,104 59Massachusetts 166,020 237,266 403,286 59New York 855,359 1,160,260 2,015,619 58Idaho 7,920 10,696 18,616 57North Carolina 32,613 43,617 76,230 57Virginia 85,287 111,753 197,040 57Louisiana 26,787 34,287 61,074 56Oklahoma 19,010 24,058 43,068 56Maryland 92,536 116,655 209,191 56Illinois 300,354 374,322 674,676 55Rhode Island 30,072 36,960 67,032 55Georgia 49,118 59,226 108,344 55Nevada 33,230 39,165 72,395 54Florida 572,110 662,319 1,234,429 54Arizona 91,111 94,910 186,021 51New Mexico 28,446 28,578 57,024 50California 2,396,853 1,777,807 4,174,660 43Texas 612,107 445,423 1,057,530 42
SOURCE: Authors’ tabulations from the 1990 census.
NOTE: Immigrants in the United States less than five years or younger than 18years of age are excluded.

11
3. Research Approach
We examined numerous data sets and employed several methods to
evaluate naturalization rates in California and the United States. To
identify factors related to naturalization, we used descriptive statistics and
regression models with 1990 census data. To evaluate temporal trends in
naturalization, we used Immigration and Naturalization Service (INS)
administrative data and 1996 and 1997 Current Population Surveys
(CPS). To evaluate naturalization patterns across California counties, we
relied on 1990 census data. Finally, to identify county efforts to
encourage naturalization, we conducted our own survey of the state’s 58
counties.
Data SourcesTo estimate and analyze naturalization rates and recent trends, we
used the 5 percent Public Use Microdata Sample (PUMS) for the 1990
census, and the 1996 and 1997 CPS March Supplements. The census
and the CPS contain information on individuals and households, as well

12
as region-specific data. We attached aggregate data on the country of
origin and some characteristics of the destination to the individual
records. In addition to detailed social, economic, and demographic
characteristics for all members of a household, census and CPS data
contain information on period of immigration, country of birth, and
citizenship status.
The census and CPS are the largest and most recent nationally
representative samples of the nation’s population. However, these data
are not without limitations. The naturalization status of immigrants is
overreported in censuses (Passel and Woodrow, 1984; Passel, 1996;
Warren and Passel, 1987) and it is progressively worse for earlier
decennial censuses, rendering unreliable 1970 census data and any census
estimates of long-term trends in naturalization. For this reason, we used
only the 1990 census to identify factors related to naturalization. We
used the 1996 and 1997 CPS data to evaluate the large increases in
naturalization that occurred between those surveys, and we used
administrative data to estimate long-term trends in naturalization. We
could not use earlier years for the CPS because respondents were not
asked about their citizenship status in the CPS until 1994, and there are
substantial problems with the 1994 and 1995 CPS (Passel, 1996).
Census and CPS data do not include information on the timing of
naturalization, only whether or not immigrants had naturalized by the
time of the census or survey. Hence, the causal order between
naturalization and such factors as marriage, childbirth, education,
occupational status, self-employment, and home ownership is
ambiguous. The fact that these factors are strongly associated with
naturalization does not necessarily mean that they are important
determinants of naturalization. They may be consequences of

13
naturalization or may be jointly determined by some other unmeasured
factors. For example, home ownership and naturalization are strongly
positively correlated. It is plausible that home ownership predates
naturalization and represents a long-term investment in the United
States, leading to increased propensities to naturalize. On the other
hand, home ownership might postdate naturalization and might be
partly a result of an enhanced sense of security in the United States that
is a consequence of becoming a citizen. Finally, home ownership and
naturalization might both reflect an improvement in socioeconomic
standing and thus be jointly determined by some other factor. Despite
such problems, our models do allow us to determine the relative
importance of the relationship between naturalization and a host of
personal, institutional, and geographic characteristics. Identifying factors
strongly associated with naturalization are at least suggestive of the
determinants of naturalization.
Finally, with the census and CPS it is impossible to identify whether
immigrants are legal or unauthorized residents of the United States.
Some of the people in the sample may not be eligible for naturalization.
This is especially problematic for Mexican immigrants, since a large
number of them are unauthorized. However, in a previous PPIC report
on immigrants from Western Mexico, Reyes (1997) found that most
unauthorized immigrants return soon after migration. Only about one-
third remain in the United States for longer than five years. Hence,
restricting the sample to those who have been in the United States for
longer than five years should eliminate a large proportion of the
unauthorized immigrants in the sample. We also restricted the sample to
foreign-born people who were older than 18 at the time of the survey,

14
because this is a requirement for naturalization (INS, 1991; Jasso and
Rosenzweig, 1990).1
Even with their limitations, the census and the CPS provide the
most comprehensive set of socioeconomic and demographic variables
available for all foreign-born persons in the United States at a particular
moment in time. These data sets are also large nationally representative
surveys, allowing for a careful analysis of naturalization. In the absence
of longitudinal data on legal immigrants, these are the best data sets
available to study naturalization.
We use CPS data to evaluate short-term recent changes in
naturalization trends, and we use INS administrative data to identify
long-term temporal trends in naturalization. The INS administrative
data provide aggregate information on naturalization and legal
immigration to the United States over a long time period (1907–1996).
Unfortunately, the data on naturalizations do not include information on
year of immigration to the United States, so we are unable to
conclusively estimate naturalization rates for successive cohorts of legal
immigrants (the methodology section that follows discusses our
estimation technique). The data also do not provide individual
socioeconomic or demographic characteristics beyond place of
destination for legal immigrants admitted to the United States and place
of residence of persons naturalizing.
Finally, we conducted our own survey of counties in California to
identify county efforts to encourage naturalization. The survey was
____________ 1To qualify for naturalization, an immigrant must be at least 18 years of age, must
have been lawfully admitted to the United States for permanent residence, and must havelived in the country continuously for at least five years (three years in the case of thespouse of a U.S. citizen) and six months in the state from which he or she is applying forcitizenship.

15
conducted in October and November 1997; participants were designated
by each county welfare office in the state. The survey is discussed in
Chapter 6, and the response rate of the participants is discussed in
Appendix C.
VariablesSeveral hypotheses have emerged to explain differences in
immigrants’ propensities to naturalize. Some studies have focused on the
influence of immigrants’ adaptation experiences and demographic
characteristics (Bernard, 1936; Krassowski, 1963). Others emphasize the
influences of immigrants’ cultural, economic, and structural assimilation
into the host society (Barken and Khokhlov, 1980). Another set of
studies argues that it is also important to examine the influences of
country of origin and country of destination characteristics in the
naturalization process (Portes and Mozo, 1985; Jasso and Rosenzweig,
1986; Yang, 1994b). Despite their differences, all of the studies view
naturalization as an outcome of immigrants’ successful integration into
the host society.
We examine the effect on naturalization of three different sets of
factors:
1. Adaptation-related variables
— demographic characteristics (gender, age at time of migration,marital status, and whether or not the immigrant has childrenliving in the same household), and years in the United States;
— socioeconomic characteristics (education, English proficiency,labor force status, income, and whether or not the person isreceiving public assistance);

16
2. Measures of social and physical capital (percentage foreign-born at thecommunity level, whether or not the spouse and children are U.S.citizens, spouse’s order of arrival, whether or not the country of originis a border country, and whether or not the person owns a house); and
3. Location-specific characteristics
— characteristics of the country of origin (whether or not theimmigrant is from one of the leading countries of origin, whetheror not the country of origin allows dual citizenship, and per capitaincome in the country of origin);
— characteristics of the destination at the community level(unemployment rate, mean income, and whether or not theimmigrant resides in a high immigration state).
All of these variables are described in Table 3.1.
The first set of variables captures socioeconomic, demographic, and
length-of-stay differences across immigrants. Researchers believe that as
immigrants spend time in the United States, become more educated and
more familiar with the culture and language, and are able to succeed
economically, they are more likely to adapt in other aspects of life, such
as naturalization and intermarriage (Liang, 1994). The likelihood of
naturalization rises with improvements in socioeconomic status, and
differences in naturalization across groups are the result of differences in
duration, education, occupation, family income, and other personal
characteristics (Bernard, 1936).
The second set of variables measures social and physical capital.
Social networks are important factors in the naturalization decision and
process. Immigrants who have family members or friends who have
naturalized have easy access to information about naturalization.
Naturalized citizens know more about the benefits and procedures of

17
Table 3.1
Definitions of Variables
EducationGRADE8 =1 if person has fewer than 8 years of education,
otherwise=0NOHS =1 if person has between 9 and 11 years of education,
otherwise=0HS =1 if person graduated from high school,
otherwise=0SOMECOLLEGE =1 if the person has some college education,
otherwise=0COLLEGE =1 if the person graduated from college,
otherwise=0English proficiency
ENGONLY =1 if person speaks only English,otherwise=0
ENGVWELL =1 if person speaks English very well,otherwise=0
ENGWELL =1 if person speaks English well,otherwise=0
ENGNOTWELL =1 if person does not speak English well,otherwise=0
ENGNONE =1 of person does not speak English,otherwise=0
Labor force status
EMPLOYED =1 if the person was employed the week before the census year,otherwise=0
UNEMPLOYED =1 if the person was unemployed the week before the census year,otherwise=0
Income
INC10 =1 if earnings are less than $9,999,otherwise=0
INC10-19 =1 if earnings are between $10,000 and $19,999,otherwise=0
INC20-29 =1 if earnings are between $20,000 and $29,999,otherwise=0
INC30-39 =1 if earnings are between $30,000 and $39,999,otherwise=0
INC40-49 =1 if earnings are between $40,000 and $49,999,otherwise=0
INC50UP =1 if earnings are $50,000 or more,otherwise=0

18
Table 3.1 (continued)
Public assistance =1 if the person was on public assistance,otherwise=0
Gender =1 if male,otherwise=0
Age at migration
ARV18 =1 if immigrant younger than 18 when moved,otherwise=0
ARV18-35 =1 if immigrant between 18 and 35 when moved,otherwise=0
ARV36-53 =1 if immigrant between 36 and 53 when moved,otherwise=0
ARV54UP =1 if immigrant older than 54 when moved,otherwise=0
Married =1 if immigrant married at time of survey,otherwise=0
Children =1 if immigrant has children living in the United States,otherwise=0
Years in U.S. Continuous variable for years in the United States
Years in U.S. squared Square of the number of years in the United States
Percent foreign Percentage of SMSAa who are foreign-born
Citizen spouse =1 if the immigrant’s spouse is a U.S. citizen,otherwise=0
Citizen children =1 if at least one child is a U.S. citizen,otherwise=0
Spouse’s order ofarrival
FIRST =1 if the immigrant’s spouse arrived first,otherwise=0
SAME =1 if the immigrant’s spouse arrived at same time,otherwise=0
AFTER =1 if the immigrant’s spouse arrived afterward,otherwise=0
Citizen spouseSpouse’s order ofarrival
This variable is a interaction of the citizenship status of theimmigrant’s spouse and his or her order of arrival into the UnitedStates
Border country =1 if country of origin is in North or Central America orCaribbean, otherwise=0
Home ownership =1 if immigrant owns a home at time of survey, otherwise=0Dual citizenship =1 if country of origin has dual citizenship,
otherwise=0Per capita income Per capita income in country of origin in 1990

19
Table 3.1 (continued)
Country of origin A set of dummy variables for the leading countries of origin(Canada, Cambodia, China, Cuba, Dominican Republic, ElSalvador, France, Germany, Guatemala, Haiti, Honduras, HongKong, India, Iran, Ireland, Italy, Japan, Laos, Mexico, Nicaragua,Panama, Philippines, South Korea, Taiwan, Thailand, UnitedKingdom, Vietnam, and the rest of the world).
SMSA-unemp Unemployment rate at SMSASMSA-income Mean income at SMSA
aStandard Metropolitan Statistical Area.
naturalization, and they can relieve immigrants’ fears of the INS, thereby
making the naturalization process easier. Marriage to a citizen makes the
process quicker for immigrants, since it reduces the residence
requirements of naturalization from five to three years. Hence, the
greater the number of social ties, and the stronger the connections to
naturalized immigrants or U.S. natives, the higher the propensity to
naturalize.
Possessing physical capital in the United States may also increase
people’s propensity to naturalize. For example, purchasing a house is a
long-term investment; it indicates an immigrant’s determination to stay
for a substantial period of time in the host country, which may lead to
naturalization. It is difficult to determine the direction of causation,
however. The accumulation of physical capital might partly be a
consequence of naturalization rather than naturalization being a
consequence of the accumulation of physical capital.
Other researchers emphasize the importance of residential
segregation patterns in explaining differences in naturalization (Blau,
1977; Marston and Van Valey, 1979; Massey and Denton, 1987).
Residential segregation affects naturalization primarily by reducing the
20
chances for social contact with mainstream society, but it also reinforces
within-group rather than between-group interactions (Blau, 1977). The
more within-group interaction immigrants have, the more likely their
ethnic identity will be reinforced and the less likely they will become
U.S. citizens (Portes, 1984). This hypothesis also predicts that the more
contact immigrants have with sending countries the less likely they are to
naturalize. Immigrants with relatively easy access to their countries of
origin, and therefore more possibilities for frequent visits, have a lower
propensity to naturalize.
Finally, the characteristics of the origin and the destination have
implications for naturalization. Immigrants from different countries may
have different incentives to naturalize. For example, immigrants from
wealthy countries with generous social services packages may be less
willing to give up those benefits for those available in the United States.
And, as proposed above, proximity to country of origin could reduce
immigrants’ propensity to naturalize. Other characteristics of the
country of origin—whether the country allows dual citizenship, its
economic opportunities, and its political stability—could influence
immigrants’ loyalty to their home country and the social and economic
costs of naturalizing in the United States. Finally, the economic
conditions of the destination might affect not only the opportunities for
social mobility for immigrants but also the immigrants’ desire to
naturalize.
MethodologyWe employ various methods with a number of data sets to answer
the questions posed in Chapter 1. In the first part of the analysis, we use
descriptive and econometric techniques in conjunction with 1990 census

21
data to determine the factors associated with naturalization. In the
econometric analysis, the decision to naturalize is modeled in a set of
logit equations as a function of a set of variables described below, with
the dependent variable being whether or not an immigrant has
naturalized by the survey year. Through these models, we are able to
simultaneously evaluate the relative importance of each factor on the
probability of naturalization and determine which are strong predictors
of naturalization. For example, we are able to determine whether Latinos
have low rates of naturalization because they tend to have characteristics
associated with low rates of naturalization (i.e., short stays in the United
States, low levels of education, poor English proficiency, and low
earnings) or whether there is something else about Latino immigrants
that leads them to naturalize at lower rates.
We develop a second set of logit equations based on the 1990 census
to study naturalization propensities in California compared to those in
the rest of the nation, as well as differences between California counties.
Using 1996 and 1997 CPS data, we develop a third set of logit equations
that include a year dummy interacted with other variables to identify and
specify groups most likely to have naturalized between March 1996 and
March 1997. The results of the logit equations are presented in
Appendix A. To more clearly present the results of the multivariate
analysis, we simulate the probability of naturalization for an “average”
immigrant, using the mean value of all independent variables in the
model times their respective coefficients in the logit model (see Appendix
A, Table A.1). The probability of naturalization generated from these
simulations is not the rate of naturalization for the whole population but
a propensity to naturalize for an “average” immigrant with a particular
set of characteristics. These simulations allow us to show the percentage
22
change in naturalization that we would expect for an average individual
when we change one variable at a time, holding all other factors constant,
and are presented in Chapters 3 through 5.
To determine naturalization trends in California and the United
States, we examine INS administrative data on the number of people
naturalizing every year since 1907 and the number of legal immigrants
entering the United States every year since 1902. In this work, we
estimate annual naturalization rates among legal immigrants from 1960
through 1996. To estimate the population of legal immigrants, we age
the immigrants who were admitted to the United States in a particular
year by making assumptions about their rate of return (emigration) and
mortality rates.2 This generates annual estimates of the population
eligible to naturalize, by years since legal admission.3 We age naturalized
populations using a similar approach, generating annual estimates of the
number of naturalized immigrants, by time since naturalization. Finally,
to determine time in the United States for those naturalizing, we assume
a schedule of naturalization rates, by U.S. duration.4
____________ 2We assumed emigration rates of five per 100 for the first five years since legal
admission, and two per 100 for the next five years. The number of emigrants suggestedby these rates is consistent with INS estimates. We assumed mortality rates of two per1,000 for the first 15 years since legal admission, five per 1,000 for the next 10 years, 11per 1,000 for the next 10 years, 28 per 1,000 for the next 10 years, and 85 per 1,000 forsubsequent years. These mortality rates are based on 1980 mortality schedules by age andimplicitly assume that legal immigrants are young adults at the time of their admission tothe United States.
3To ensure that we have considered the large majority of immigrants in our annualestimates, we present our findings only for 1960 and later. By 1960, our estimate of legalimmigrants includes those who have been in the United States for 58 years or less, andour estimate of the naturalized population includes those who have naturalized in the past53 years.
4The schedule was estimated by combining INS estimates of cumulativenaturalization rates over time in the United States for legal immigrants admitted in 1977and 1982 with our own estimates of emigration and mortality. Contact the authors fordetails.

23
4. Factors Associated withNaturalization
The propensity to naturalize depends on a complex set of factors. In
this chapter, we identify factors that are most strongly associated with
naturalization in the United States and in California. This identification
provides us with insight into the decision to naturalize, and allows us to
specify groups that have been especially unlikely to naturalize.
Specifically, we seek to answer the following questions:
• What factors are associated with naturalization?
• Do California immigrants have a different propensity tonaturalize? If so, why?
• How and why do naturalization rates vary within Californiacounties?
To determine which factors are most important, we consider three
sets of variables: measures of immigrants’ human capital and adaptation,
variables that capture immigrants’ social and physical capital, and
variables that consider the characteristics of immigrants’ country of

24
origin and place of destination. In this chapter, we first discuss the factors
most strongly related to naturalization and then examine California’ s
naturalization rates and patterns.1
Factors Associated with Naturalization in theUnited States
We find that the most important predictors of naturalization are
those associated with immigrant adaptation and immigrant social capital.
Immigrants who have been in the United States for long periods of time
and who have high socioeconomic status are more likely to naturalize.
We hypothesize that the importance of social capital is due, in part, to
information sharing; that is, immigrants with social networks that
include citizens are more likely to have knowledge about the process and
benefits of naturalization.2 The importance of adaptation and social
capital suggests that policies that both accelerate immigrants’ economic
progress and integration into U.S. society and provide information about
the requirements, process, and benefits of naturalization may lead to
greater naturalization. However, independent of immigrants’ personal
characteristics, socioeconomic outcomes, and the characteristics of their
destinations, there are substantial differences in the rate of naturalization
by country of origin.
____________ 1Except where noted, all of the tables and figures in this chapter exclude immigrants
who have been in the United States less than five years and immigrants younger than 18years old.
2The positive correlation between social capital and naturalization might also be theresult of selectivity: Immigrants with certain characteristics may be more likely to bothchoose to naturalize and marry citizens. Hence, a greater propensity to naturalize bythose married to citizens may be due not necessarily to information sharing about thebenefits of naturalization but to some other factor not considered in this model (factorsother than education, income, English proficiency, age, gender, country of origin, etc.)that make people both marry citizens and naturalize.

25
Immigrant Adaptation
The most important determinant of naturalization is time in the
United States: The longer an immigrant has resided in this country, the
more likely he or she is to naturalize, holding constant for age at time of
arrival.3 As shown in Table 4.1, recent immigrants are less likely to have
naturalized than immigrants who have resided in this country for some
time. The rate of naturalization increases fairly steadily, with 65 percent
of the immigrants who have been in the United States for 25 to 30 years
becoming naturalized. Controlling for other factors, we still find that
time in the United States is one of the most important predictors of
naturalization, as shown in Figure 4.1. An immigrant who has been in
the country for 20 years is almost twice as likely to naturalize as an
otherwise similar immigrant who has been in the United States for only
nine years.
Table 4.1
Naturalization Rates by Lengthof Stay in the United States
Years in theUnited States
NaturalizationRate (%)
5–8 209–10 2811–15 4116–20 5021–25 5726–30 6531–40 77Over 40 90
SOURCE: 1990 census.
____________ 3Part of the increase in naturalization rates with time spent in the United States
might result from a selection effect, as immigrants who are less successful or less attachedto the United States (including those less likely to have naturalized) may be more likely toleave.

26
Pro
babi
lity
of n
atur
aliz
atio
n (%
)
80
0
10
20
30
40
50
60
16 35299 22
70
26%
38%
49%
61%
71%
Number of years in the United States
Figure 4.1—Simulated Probability of Naturalization by Length of Stayin the United States
In addition to length of stay in the United States, immigrants’
socioeconomic characteristics have a significant effect on naturalization.4
The ability to speak English, high levels of educational attainment, and
higher incomes are all associated with higher rates of naturalization. Of
these variables, the ability to speak English appears to be the most
important predictor of naturalization. This is not especially surprising,
because English proficiency is a requirement of naturalization.5 Even
immigrants who speak only a little English are more likely to become
naturalized than immigrants who do not speak English at all (see Table
____________ 4Many of these socioeconomic indicators are positively correlated. Thus, it is
impossible to completely disentangle their individual effects on the probability ofnaturalization. For this reason, each indicator appears to have a small individual effect onnaturalization, even though the socioeconomic standing of the immigrant is a strongpredictor of naturalization.
5Under INS regulations, some immigrants are allowed to take their naturalizationexam in their native tongue.

27
4.2). Controlling for all other factors, we still find that the ability to
speak English is an important predictor of naturalization (see Figure 4.2).
The average immigrant who speaks English well or very well or speaks
only English is almost twice as likely to have naturalized than an
otherwise similar immigrant who speaks no English. Even an immigrant
who does not speak English well is 50 percent more likely to naturalize
than an otherwise similar immigrant who does not speak English.
Table 4.2
Naturalization Rates by Ability to Speak English
NaturalizationRate (%)
Speaks only English 66Speaks English very well 60Speaks English well 52Speaks English not well 32Does not speak English 16
SOURCE: 1990 census.
Pro
babi
lity
of n
atur
aliz
atio
n (%
)
70
0
10
20
30
40
50
60
Englishvery well
NoEnglish
Englishnot well
Englishwell
Englishonly
55% 54% 52%
42%
28%
Figure 4.2—Naturalization Rates by English Proficiency,Controlling for Other Factors

28
Clearly, a major obstacle to naturalization for many immigrants is their
lack of proficiency in English.
Relatively well-educated immigrants are more likely to naturalize than
immigrants with little education (see Table 4.3). However, much of this
effect can be attributed to other characteristics of well-educated
immigrants—for example, proficiency in English rather than education
itself. As seen in Figure 4.3, controlling for all other factors in our model,
there is little variation in the probability of naturalization by education.
Similarly, immigrants who earn higher incomes in the United States
are more likely to naturalize (see Table 4.4). Workers who earn more
than $50,000 per year are 50 percent more likely to have naturalized
than those who earn less than $10,000 per year. However, when we
control for all other factors, the income effect is not quite as strong (see
Figure 4.4 ).
Although they may not be particularly strong individually, the
combined effect of these measures of adaptation is very strong.6
Table 4.3
Naturalization Rates by EducationalAttainment
Educational AttainmentNaturalization
Rate (%)8th grade or less 40Some high school 47High school graduate 56Some college 59College graduate 63
SOURCE: 1990 census.
____________ 6This discussion assumes that interactions among these variables are not
significantly negative.

29
Pro
babi
lity
of n
atur
aliz
atio
n (%
)
70
0
10
20
30
40
50
60
Some highschool
Collegegraduate
Somecollege
≤ 8thgrade
High schoolgraduate
45%48%
52% 53% 53%
Figure 4.3—Naturalization Rates by Education, Holding Other FactorsConstant
Table 4.4
Naturalization Rates by Income
Income (1989)Naturalization
Rate (%)<10,000 4610,000–19,999 5020,000–29,999 5830,000–39,999 6440,000–49,999 6850,000+ 71
SOURCE: 1990 census.
Figure 4.5 shows that an immigrant who is a college graduate, speaks
English very well, and has an income between $30,000 and $40,000 is
close to two and one-half times more likely to naturalize than an
otherwise similar immigrant with six years of education, who does not
speak English well, and has an income of between $10,000 and $20,000.

30
Pro
babi
lity
of n
atur
aliz
atio
n (%
)
70
0
10
20
30
40
50
60
$10,000–$19,999
> $50,000$40,000–$49,999
$30,000–$39,999
$20,000–$29,999
< $10,000
46%51% 53% 54% 55% 56%
Figure 4.4—Naturalization Rates by Income, Controlling for Other Factors
Pro
babi
lity
of n
atur
aliz
atio
n (%
)
70
0
10
20
30
40
50
College/very well/$30,000–$40,000
6th grade/not well/$10,000–$20,000
60
27%
61%
Figure 4.5—The Combined Effect of Education, English Proficiency, andIncome on the Probability of Naturalization

31
One socioeconomic variable of particular current interest—the
receipt of public assistance—is especially instructive in identifying
potential motivations for naturalizing. Public assistance might be
positively related with naturalization if we think that immigrants
naturalize to apply for and receive benefits. On the other hand, public
assistance might be negatively related with naturalization if we think that
it is a measure of a lack of adaptation.7 We found that receipt of public
assistance had a small negative association with naturalization. As shown
in Figure 4.6, immigrants who received public assistance have
naturalization rates about 5 percent lower than otherwise similar
immigrants who did not receive public assistance. In other words,
compared to other low-income, poorly educated immigrants who have
Pro
babi
lity
of n
atur
aliz
atio
n (%
)
70
0
10
20
30
40
50
AssistanceNo assistance
60
50%
45%
Figure 4.6—Naturalization Rates by Use of Public Assistance,Controlling for Other Factors
____________ 7Noncitizen immigrants may be less likely to apply for public assistance for fear of
becoming a “public charge.” Many noncitizen immigrants who have received or who arereceiving public assistance could theoretically endanger their legal permanent residencystatus by declaring themselves on public assistance.

32
been in the United States for similar amounts of time, those who
received public assistance were less likely to naturalize.8
Social Capital
One of the most important findings of this study is that an
immigrant’ s social capital is a powerful predictor of naturalization.
Immigrants with close ties and contacts with U.S. citizens are much more
likely to become naturalized than otherwise similar immigrants. We
hypothesize that this is because immigrants with close ties and contacts
to U.S. citizens gain a better knowledge of the naturalization process and
its benefits.
Social capital, as measured by the presence and citizenship status of
family members, is a particularly important factor in predicting
naturalization. Marriage to a citizen suggests that an individual has a
strong commitment to the United States and that such an immigrant
may be more integrated into U.S. society. This might also imply that the
immigrant has access to information about the process and benefits of
naturalization, as noted above. Marriage to a U.S. native in particular
could be expected to enhance contact with mainstream society and
encourage naturalization, in addition to making the process quicker for
immigrants, because it reduces the residential requirements of
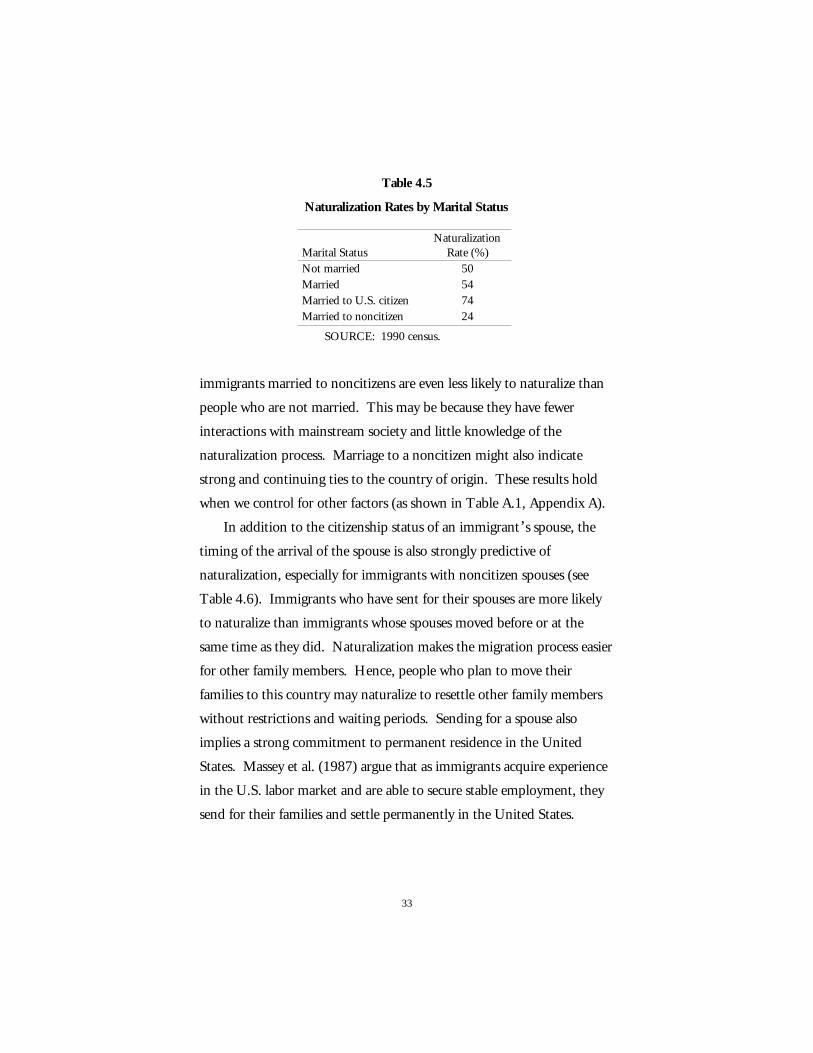
naturalization from five to three years. As shown in Table 4.5,
immigrants married to U.S. citizens are much more likely to have
become naturalized than unmarried immigrants. On the other hand,
____________ 8These findings are based on 1990 data and are, therefore, prior to welfare reform.
However, we ran this same model with the most recent CPS data and obtained resultssimilar to those described in this paragraph. We also interacted the 1997 dummy variablewith public assistance to see if there was an increase in naturalization after welfare reformfor those receiving public assistance. The variable was insignificant.
33
Table 4.5
Naturalization Rates by Marital Status
Marital StatusNaturalization
Rate (%)Not married 50Married 54Married to U.S. citizen 74Married to noncitizen 24
SOURCE: 1990 census.
immigrants married to noncitizens are even less likely to naturalize than
people who are not married. This may be because they have fewer
interactions with mainstream society and little knowledge of the
naturalization process. Marriage to a noncitizen might also indicate
strong and continuing ties to the country of origin. These results hold
when we control for other factors (as shown in Table A.1, Appendix A).
In addition to the citizenship status of an immigrant’ s spouse, the
timing of the arrival of the spouse is also strongly predictive of
naturalization, especially for immigrants with noncitizen spouses (see
Table 4.6). Immigrants who have sent for their spouses are more likely
to naturalize than immigrants whose spouses moved before or at the
same time as they did. Naturalization makes the migration process easier
for other family members. Hence, people who plan to move their
families to this country may naturalize to resettle other family members
without restrictions and waiting periods. Sending for a spouse also
implies a strong commitment to permanent residence in the United
States. Massey et al. (1987) argue that as immigrants acquire experience
in the U.S. labor market and are able to secure stable employment, they
send for their families and settle permanently in the United States.

34
Table 4.6
Naturalization Rates by Marital Status andTiming of Arrival of Spouse
NaturalizationRate (%)
Married to U.S. citizen 74Arrived in U.S. before spouse 85Arrived in U.S. at same time as spouse 85Arrived in U.S. after spouse 63
Married to noncitizen 24Arrived in U.S. before spouse 47Arrived in U.S. at same time as spouse 15Arrived in U.S. after spouse 14
SOURCE: 1990 census.
Similar findings emerge with regard to the presence and citizenship
status of children. Immigrants with noncitizen children in the U.S. are
substantially less likely to naturalize than immigrants with children born
in this country (see Table 4.7). Such immigrants are even less likely to
naturalize than immigrants without children or with children not living
in the same household. But if their children are U.S. citizens,
immigrants are at least as likely to naturalize as immigrants without
children or with children not living in the same household. Holding
constant other variables in the model, we find that immigrants with
Table 4.7
Naturalization Rates by Presence andCitizenship Status of Children
NaturalizationRate (%)
No children 55With U.S. citizen children 54With noncitizen children 13
SOURCE: 1990 census.

35
citizen children are almost twice as likely to have naturalized than are
immigrants with noncitizen children.
The combined effect of these variables is even more dramatic than
their individual effect, as we can see in Figure 4.7. An average immigrant
who is either single or has no spouse present and has no children (or no
children in the household) has a 28 percent probability of naturalization,
compared with an 8 percent probability of naturalization for an
immigrant with the same characteristics but who has a noncitizen wife
and noncitizen children. However, holding all else constant, an average
immigrant with children and a spouse who are U.S. citizens has an 82
percent probability of naturalization.
Less immediate social networks can be explored by considering
populations that an immigrant might have contacts with. From the
Pro
babi
lity
of n
atur
aliz
atio
n (%
)
90
0
10
20
30
40
50
70
Married noncitizen/noncitizen children
Married citizen/citizen children
No spouse present orsingle/no children
80
60
28%
8%
82%
Figure 4.7—The Combined Effect of Spouse and Children’s CitizenshipStatus on the Probability of Naturalization

36
1990 census, we can identify substate populations in the area of
destination for an immigrant. These areas, known as PUMAs (Public
Use Microdata Areas) serve as a proxy for communities. They are often
smaller than counties, although they are much larger than
neighborhoods.9 These communities can give us some sense of the
people that an immigrant is likely to encounter in his or her daily life, in
a social or work context. We find that immigrants in communities with
relatively few immigrants are more likely to have naturalized than
immigrants in communities with relatively high concentrations of
immigrants. However, most of the effect of immigrant concentration on
naturalization disappears when we control for other factors in the model.
The reason for this could be a high correlation between immigrant
concentration and other variables in the model. Latino immigrants,
recent migrants, immigrants with low levels of education, and
immigrants who move to California tend to move to neighborhoods with
a high concentration of immigrants. Such immigrants have low
naturalization rates primarily because they have characteristics that are
associated with low naturalization rates and only secondarily because they
live in neighborhoods with a high concentration of immigrants.
Furthermore, it is difficult to determine whether living in a community
with large numbers of immigrants reduces the probability of
naturalization without taking into account migration out of the
neighborhood. Immigrants who naturalize may be more likely to move
out of communities with high concentrations of foreign-born persons,
explaining the lower rates of naturalization in those neighborhoods. We
____________ 9In California, the average PUMA consists of about 100,000 people.

37
also examined the effect of living in a community with large numbers of
coethnics, but it makes little difference in naturalization.
Destination and Sending Country Characteristics
The decision to naturalize could also depend on the characteristics of
the immigrant’ s sending country as well as characteristics of the
destination. We find that some characteristics of the destination and the
country of origin, as well as specific countries of origin, are important
predictors of naturalization. Of the destination characteristics, only the
community’ s unemployment rate affects the probability of
naturalization, and the effect is small. The lower the unemployment rate
at the destination, the more likely the immigrant is to naturalize. Of the
characteristics of the origin country, only the rules concerning dual
citizenship seem to have an effect on naturalization in the United States.
Immigrants from countries that allow dual citizenship are more likely to
have naturalized than otherwise similar immigrants from countries that
do not allow dual citizenship. We find that per capita income in the
origin country and return migration, as measured by a migration index,10
have little effect on naturalization, once we control for specific countries
of origin and other factors.
We do find significant differences in naturalization rates for specific
countries of origin (see Table 4.8). Less than a third of the immigrants
from El Salvador, Laos, Guatemala, Cambodia, Mexico, Nicaragua, and
Haiti have naturalized by 1990, whereas two-thirds of the immigrants
from Italy, Ireland, Germany, Hong Kong, the Philippines, and France
naturalized by 1990. Some of the differences in naturalization rates are
____________ 10We developed a return migration index from separate census questions on period
of immigration and place of residence five years earlier. Contact the authors for details.

38
Table 4.8
Naturalization Rates byCountry of Origin
CountryNaturalization
Rate (%)Italy 78Ireland 77Germany 77Hong Kong 74Philippines 71France 66China 64Panama 64Canada 60Vietnam 58Taiwan 58South Korea 58United Kingdom 58Cuba 55India 50Japan 50Thailand 42Honduras 38Iran 38Dominican Republic 36Haiti 33Nicaragua 29Mexico 29Cambodia 29Guatemala 25Laos 23El Salvador 22
SOURCE: 1990 census.
NOTE: Immigrants in theUnited States less than five years andimmigrants younger than 18 years ofage have been excluded.
39
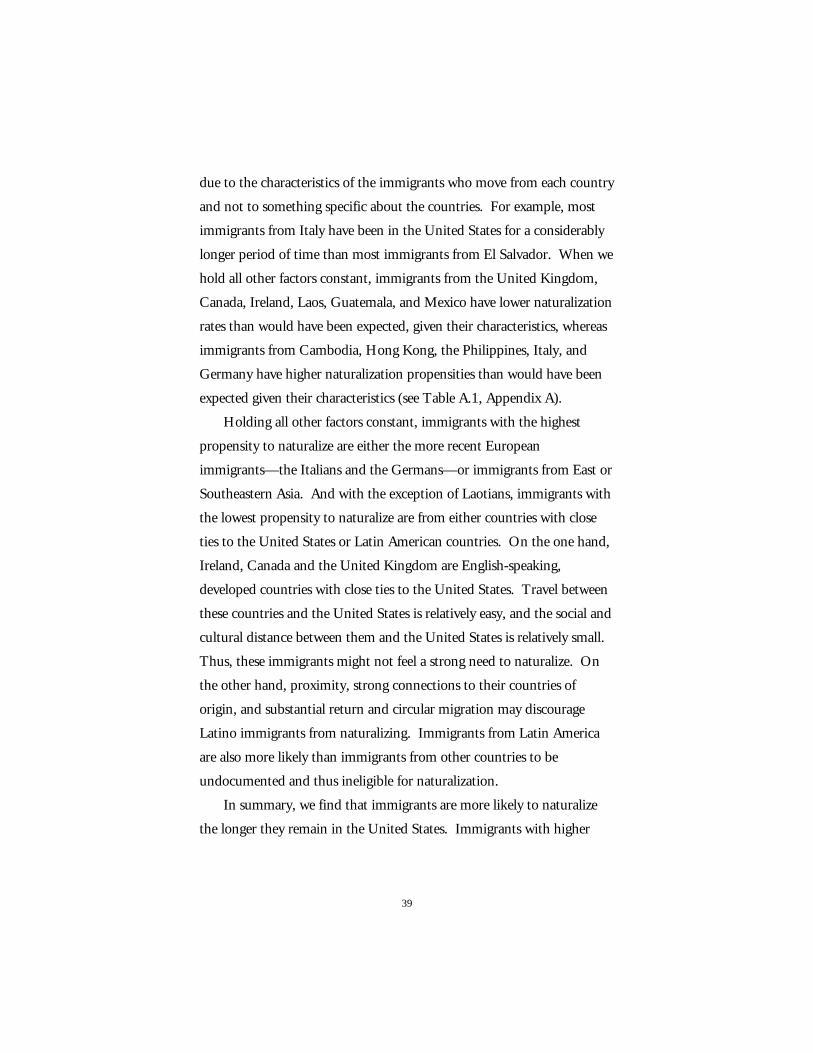
due to the characteristics of the immigrants who move from each country
and not to something specific about the countries. For example, most
immigrants from Italy have been in the United States for a considerably
longer period of time than most immigrants from El Salvador. When we
hold all other factors constant, immigrants from the United Kingdom,
Canada, Ireland, Laos, Guatemala, and Mexico have lower naturalization
rates than would have been expected, given their characteristics, whereas
immigrants from Cambodia, Hong Kong, the Philippines, Italy, and
Germany have higher naturalization propensities than would have been
expected given their characteristics (see Table A.1, Appendix A).
Holding all other factors constant, immigrants with the highest
propensity to naturalize are either the more recent European
immigrants—the Italians and the Germans—or immigrants from East or
Southeastern Asia. And with the exception of Laotians, immigrants with
the lowest propensity to naturalize are from either countries with close
ties to the United States or Latin American countries. On the one hand,
Ireland, Canada and the United Kingdom are English-speaking,
developed countries with close ties to the United States. Travel between
these countries and the United States is relatively easy, and the social and
cultural distance between them and the United States is relatively small.
Thus, these immigrants might not feel a strong need to naturalize. On
the other hand, proximity, strong connections to their countries of
origin, and substantial return and circular migration may discourage
Latino immigrants from naturalizing. Immigrants from Latin America
are also more likely than immigrants from other countries to be
undocumented and thus ineligible for naturalization.
In summary, we find that immigrants are more likely to naturalize
the longer they remain in the United States. Immigrants with higher

40
socioeconomic status are also more likely to naturalize. In addition,
immigrants’ social capital greatly affects the probability of naturalization.
Being connected to a diverse network in terms of not only ethnicity but
also citizenship status may provide the immigrant with information not
only about the benefits of naturalization but also about the process of
naturalization. Such immigrants may also be more exposed to
mainstream society and be “ better” integrated into U.S. society than
immigrants with limited social capital or who live in communities with
high proportions of immigrants. However, even after holding constant
for personal and socioeconomic differences across migrants and the
characteristics of the place of destination, there are substantial differences
in the rate of naturalization by country of origin.
Do California Immigrants Have a DifferentPropensity to Naturalize?
Among the 50 states, California ranks 49th in terms of naturalization
rates (see Table 4.9). Some of this difference can be explained by
differences in the composition of the immigrant population in California
as compared to the immigrant population in the rest of the United
States. For example, since California has a disproportionate number of
recent arrivals, we would expect the rate of naturalization to be lower
than in a state with more long-term immigrants. In this section, we
explore whether low naturalization rates in California are due solely to
this and other composition effects or whether there is something
particular to California that leads to lower naturalization rates in the
state.
Table 4.10 presents the characteristics of the immigrant population
in California and the rest of the United States. California immigrants are
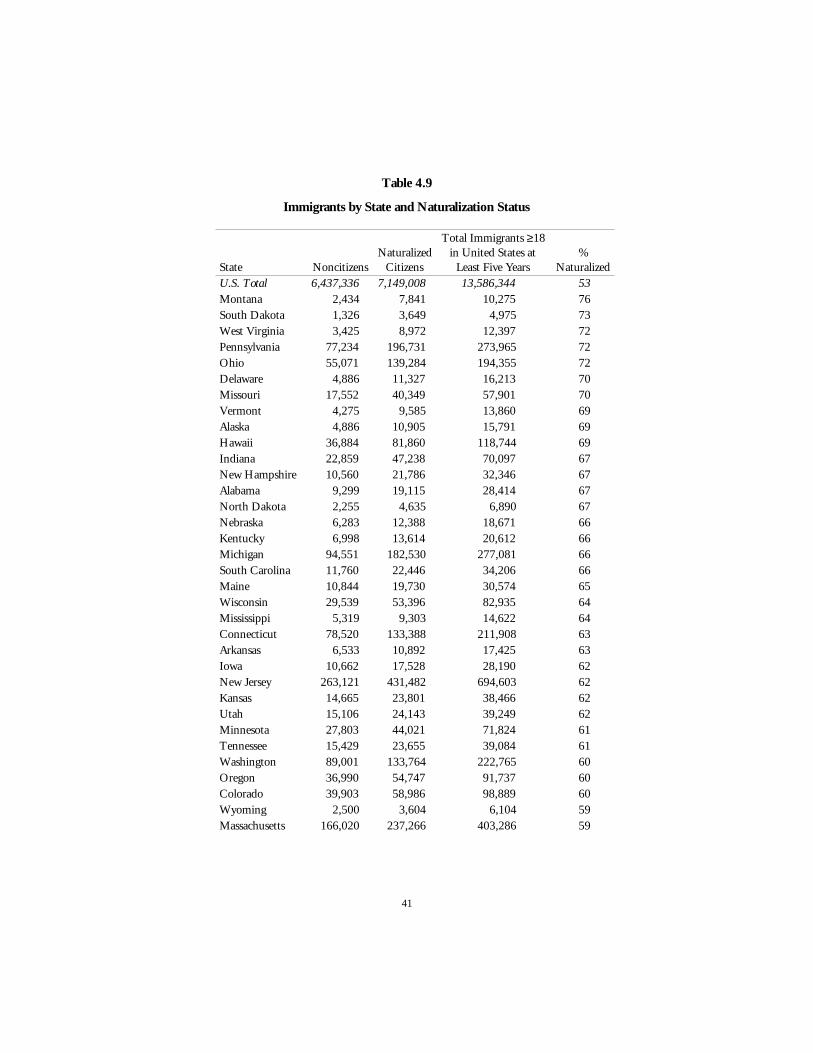
41
Table 4.9
Immigrants by State and Naturalization Status
State NoncitizensNaturalized
Citizens
Total Immigrants ≥18in United States at
Least Five Years%
NaturalizedU.S. Total 6,437,336 7,149,008 13,586,344 53Montana 2,434 7,841 10,275 76South Dakota 1,326 3,649 4,975 73West Virginia 3,425 8,972 12,397 72Pennsylvania 77,234 196,731 273,965 72Ohio 55,071 139,284 194,355 72Delaware 4,886 11,327 16,213 70Missouri 17,552 40,349 57,901 70Vermont 4,275 9,585 13,860 69Alaska 4,886 10,905 15,791 69Hawaii 36,884 81,860 118,744 69Indiana 22,859 47,238 70,097 67New Hampshire 10,560 21,786 32,346 67Alabama 9,299 19,115 28,414 67North Dakota 2,255 4,635 6,890 67Nebraska 6,283 12,388 18,671 66Kentucky 6,998 13,614 20,612 66Michigan 94,551 182,530 277,081 66South Carolina 11,760 22,446 34,206 66Maine 10,844 19,730 30,574 65Wisconsin 29,539 53,396 82,935 64Mississippi 5,319 9,303 14,622 64Connecticut 78,520 133,388 211,908 63Arkansas 6,533 10,892 17,425 63Iowa 10,662 17,528 28,190 62New Jersey 263,121 431,482 694,603 62Kansas 14,665 23,801 38,466 62Utah 15,106 24,143 39,249 62Minnesota 27,803 44,021 71,824 61Tennessee 15,429 23,655 39,084 61Washington 89,001 133,764 222,765 60Oregon 36,990 54,747 91,737 60Colorado 39,903 58,986 98,889 60Wyoming 2,500 3,604 6,104 59Massachusetts 166,020 237,266 403,286 59

42
Table 4.9 (continued)
State NoncitizensNaturalized
Citizens
Total Immigrants ≥18in United States at
Least Five Years%
NaturalizedNew York 855,359 1,160,260 2,015,619 58Idaho 7,920 10,696 18,616 57North Carolina 32,613 43,617 76,230 57Virginia 85,287 111,753 197,040 57Louisiana 26,787 34,287 61,074 56Oklahoma 19,010 24,058 43,068 56Maryland 92,536 116,655 209,191 56Illinois 300,354 374,322 674,676 55Rhode Island 30,072 36,960 67,032 55Georgia 49,118 59,226 108,344 55Nevada 33,230 39,165 72,395 54Florida 572,110 662,319 1,234,429 54Arizona 91,111 94,910 186,021 51New Mexico 28,446 28,578 57,024 50DC 19,930 15,011 34,941 43California 2,396,853 1,777,807 4,174,660 43Texas 612,107 445,423 1,057,530 42
SOURCE: Authors’ tabulations from the 1990 census.
NOTE: Immigrants in the United States less than five years or younger than18 years of age are excluded.
more recently arrived in the United States, have slightly lower levels of
education, are less proficient in English, are more likely to be married to
other noncitizens, and are more likely to come from Latin America,
especially Mexico, than immigrants in the rest of the United States. All
of these characteristics are associated with lower probabilities of
naturalization. Hence, on the basis of these characteristics, we would
expect lower naturalization rates in California than in the rest of the
nation. From our simulations, we find that most of the gap between the
nation and the state disappears when we account for immigrants’
characteristics (see Appendix A). However, a gap still remains between

43
Table 4.10
Average of Independent Variables in the Model
Variables California United States
EducationGRADE8 32% 28%NOHS 17% 17%HS 16% 19%SOMECOLLEGE 14% 14%COLLEGE 21% 22%
English proficiencyENGONLY 14% 23%ENGVWELL 32% 32%ENGWELL 24% 21%ENGNOTWELL 20% 17%ENGNONE 10% 7%
Labor force statusEMPLOYED 94% 95%UNEMPLOYED 6% 5%
IncomeINC10 46% 45%INC10-19 25% 25%INC20-29 13% 13%INC30-39 7% 7%INC40-49 4% 4%INC50UP 5% 6%
Age at migrationARV18 36% 33%ARV18-35 50% 51%ARV36-53 11% 13%ARV54 3% 3%
Public assistance 5% 5%Male 49% 47%Children 52% 50%Married 65% 66%Years in U.S. 19 22Percent foreign 29% 21%Border country 53 48Home ownership 54% 62%Citizen spouse 31% 40%Citizen children 46% 44%
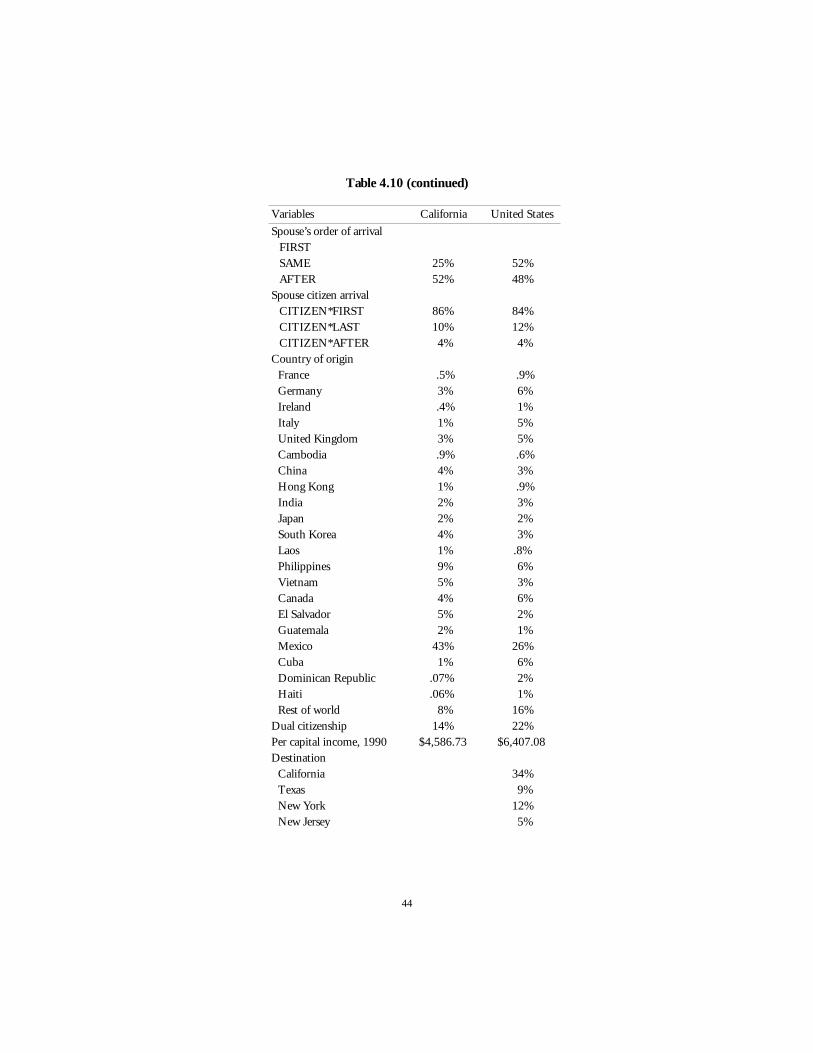
44
Table 4.10 (continued)
Variables California United States
Spouse’s order of arrivalFIRSTSAME 25% 52%AFTER 52% 48%
Spouse citizen arrivalCITIZEN*FIRST 86% 84%CITIZEN*LAST 10% 12%CITIZEN*AFTER 4% 4%
Country of originFrance .5% .9%Germany 3% 6%Ireland .4% 1%Italy 1% 5%United Kingdom 3% 5%Cambodia .9% .6%China 4% 3%Hong Kong 1% .9%India 2% 3%Japan 2% 2%South Korea 4% 3%Laos 1% .8%Philippines 9% 6%Vietnam 5% 3%Canada 4% 6%El Salvador 5% 2%Guatemala 2% 1%Mexico 43% 26%Cuba 1% 6%Dominican Republic .07% 2%Haiti .06% 1%Rest of world 8% 16%
Dual citizenship 14% 22%Per capital income, 1990 $4,586.73 $6,407.08Destination
California 34%Texas 9%New York 12%New Jersey 5%

45
Table 4.10 (continued)
Variables California United States
Illinois 5%Florida 9%Rest of United States 26%
SMSA_income $14,870.00 $14,949.00SMSA_unemp 7% 7%
SOURCE: Authors’ tabulations from the 1990census.
NOTE: Immigrants in the United States less thanfive years or younger than 18 years of age are excluded.
the rate of naturalization of immigrants in California and those in the
rest of the country, even when we control for a host of immigrant
characteristics.
The gap between the nation and the state may be because
immigrants with certain characteristics are less likely to naturalize in
California than in the rest of the United States. When we tested this
hypothesis, we found that immigrants with fewer than eight years of
education are less likely to naturalize in California than in the rest of the
nation. Figure 4.8 shows the ratio of the probability of naturalization in
California to that in the United States. A value of one implies that
immigrants have the same probability of naturalization in the United
States and California. A value greater than one implies that California
immigrants have a higher propensity to naturalize than those in the rest
of the United States, whereas a value lower than one implies lower
naturalization in California than in the rest of the United States.
Immigrants at all levels of education are less likely to naturalize in
California than in the rest of the nation. But immigrants with fewer
than eight years of education are substantially less likely to do so. These

46
Rat
io o
f the
pro
babi
litie
s of
nat
ural
izat
ion .78
.60
.62
.64
.66
.68
.70
.72
Some highschool
Collegegraduate
Somecollege
≤ 8thgrade
High schoolgraduate
.76
.74
0.66
0.69
0.71
0.73
0.77
Figure 4.8—Ratio of the Probability of Naturalization in Californiato That in the United States by Education
immigrants are only two-thirds as likely to have naturalized as similarly
educated immigrants in the rest of the nation.
Also, immigrants with poor English proficiency, immigrants who
have been in the United States for long periods of time, immigrants from
Mexico, immigrants who are single or without a spouse present, and
immigrants with a noncitizen spouse are less likely to naturalize in
California than in the rest of the nation (see Appendix A, Table A.2).
Hence, California immigrants are not only less educated, less proficient
in English, more likely to have a noncitizen spouse or spouse not present,
and more likely to be from Mexico but also are less likely to naturalize
than those in the rest of the nation.
The explanation for the lower propensity to naturalize for
immigrants with certain characteristics in California than for those in the
United States could be the unauthorized population. The number of
unauthorized immigrants in the United States has been increasing

47
substantially since the late 1960s, and California is home to over 40
percent of the country’ s unauthorized immigrants. Because it is
impossible to exclude unauthorized immigrants from census data below
the state level, estimates from the census overstate the difference in
eligible immigrants’ naturalization rates between California and the rest
of the United States. We attempt to capture the effect of the
unauthorized population on the rate of naturalization by estimating the
percentage of the total immigrant population who have naturalized and
then estimating the percentage of the legal population (foreign-born
population excluding unauthorized immigrants) who have naturalized.11
Estimating the naturalization rate among eligible immigrants leads to a
greater increase in naturalization rates in California than it does in the
rest of the United States, reducing the gap between the state and the rest
of the nation from 14 percent to only 4 percent (see Figure 4.9). Thus,
many of the characteristics that are associated with particularly low
naturalization rates in California, as compared to the nation, might
simply reflect greater proportions of unauthorized immigrants with those
characteristics in California, compared to the nation.
In conclusion, three interrelated factors play an important role in
explaining the difference in naturalization rates between California and
the United States. First, California has a disproportionate number of
____________ 11In the previous figures, and throughout the report, we restricted the sample to
immigrants adults who have been in the United States for longer than five years. In thosetables, we could not exclude unauthorized immigrants, because the census does not askimmigrants about their immigration status. In Figure 4.9, we use the total foreign-bornpopulation in the United States and California without exclusions for age and duration ofstay. From this population, we subtract estimates of unauthorized immigrant populationin the country and the state to estimate the legal immigrant population. We also excludedthe population amnestied under the Immigration Reform and Control Act (IRCA), sincethey were not eligible to naturalize in 1990.

48
Rat
e of
nat
ural
izat
ion
(%)
70
0
10
20
30
40
50
Eligible population, 1990Foreign-born, 1990
60
31%
52%
45%
56%CaliforniaRest of United States
Figure 4.9—Percentage of Unauthorized Foreign-Born and EligibleForeign-Born Population Who Have Naturalized
immigrants having characteristics associated with low naturalization
rates—low levels of education, poor proficiency in English, immigrants
married to other noncitizens, and Latino immigrants. Second, these
immigrants are less likely to naturalize in California than in the rest of
the nation, holding other characteristics constant. Finally, there is a
greater proportion of unauthorized immigrants in California who are not
eligible for naturalization than in the rest of the nation. Unauthorized
immigrants tend to have low levels of education and poor English
proficiency and are disproportionately Latinos, which may explain the
lower rates of naturalization for those immigrant groups in California.12
____________ 12Although most unauthorized immigrants and temporary migrants stay in the
United States for fewer than five years, some stay for longer than five years and may havebeen included in our immigrant sample.

49
How and Why Do Naturalization Rates VaryWithin California Counties?
We found that naturalization rates vary even more widely across
California counties than they do across U.S. states (see Table 4.11).
Trinity County has the highest rate of naturalization at 70 percent,
whereas only 13 percent of immigrants in Colusa County have
naturalized. In general, counties with low concentrations of immigrants
tend to have high naturalization rates. In the nine counties with the
highest naturalization rates, fewer than 5 percent of the population are
foreign-born. The counties with low naturalization rates are those in
which agriculture figures prominently and also a few large urban counties
with large immigrant populations. Los Angeles County had among the
highest concentration of immigrants in the state (33 percent of the
county’ s population) and the lowest naturalization rate of any large
urban county in the state (only 27 percent of the county’ s immigrants
had naturalized by 1990).
To analyze differences in naturalization rates across counties, we
developed logistic regression models (see Table A.4 in Appendix A).
Because of data limitations, we were restricted to considering only the
largest 23 counties in California.13 All of the other counties—most of
the northern counties, the Sierra Nevada, and the Sierra foothill
counties—were grouped into a “ rest of California” category. However,
most of the immigrants in California in 1990 were located in the 23
counties we were able to consider.
____________ 13Alameda, Contra Costa, Fresno, Imperial, Kern, Los Angeles, Merced, Orange,
Riverside, Sacramento, San Bernardino, Santa Barbara, Santa Clara, Santa Cruz, SanDiego, San Francisco, San Joaquin, San Mateo, Solano, Stanislaus, Tulare, and Ventura.

50
Table 4.11
Immigrants by County and Naturalization Status
NoncitizenImmigrants
NaturalizedImmigrants
% ofImmigrantsNaturalized
% ofImmigrants
in PopulationAlameda 140,529 89,846 39 18Alpine 9 9 50 2Amador 526 593 53 4Butte 7,050 3,796 35 6Calaveras 307 623 67 3Colusa 2,926 437 13 21Contra Costa 58,883 48,177 45 13Del Norte 1,000 493 33 6El Dorado 4,502 3,260 42 6Fresno 90,523 28,586 24 18Glenn 2,551 678 21 13Humboldt 2,262 2,354 51 4Imperial 23,676 7,892 25 29Inyo 531 325 38 5Kern 45,637 20,504 31 12Kings 9,744 4,586 32 14Lake 1,428 1,267 47 5Lassen 877 358 29 4Los Angeles 2,113,398 781,668 27 33Madera 9,864 3,288 25 15Marin 17,379 13,110 43 13Mariposa 115 256 69 3Mendocino 3,662 1,804 33 7Merced 27,225 8,132 23 20Modoc 184 151 45 3Mono 682 278 29 10Monterey 52,900 23,766 31 22Napa 8,687 4,278 33 12Nevada 1,086 1,699 61 4Orange 402,576 172,532 30 24Placer 4,333 4,163 49 5Plumas 202 317 61 3Riverside 119,890 53,864 31 15Sacramento 62,327 41,551 40 10San Benito 4,763 1,504 24 17
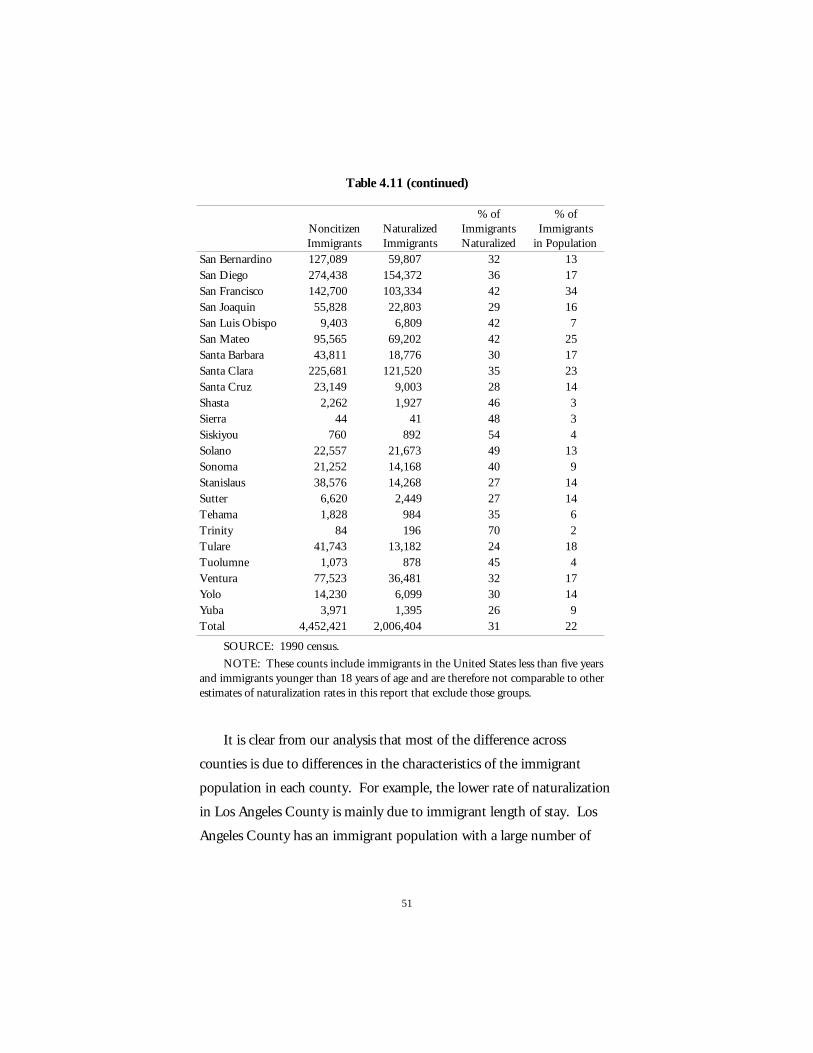
51
Table 4.11 (continued)
NoncitizenImmigrants
NaturalizedImmigrants
% ofImmigrantsNaturalized
% ofImmigrants
in PopulationSan Bernardino 127,089 59,807 32 13San Diego 274,438 154,372 36 17San Francisco 142,700 103,334 42 34San Joaquin 55,828 22,803 29 16San Luis Obispo 9,403 6,809 42 7San Mateo 95,565 69,202 42 25Santa Barbara 43,811 18,776 30 17Santa Clara 225,681 121,520 35 23Santa Cruz 23,149 9,003 28 14Shasta 2,262 1,927 46 3Sierra 44 41 48 3Siskiyou 760 892 54 4Solano 22,557 21,673 49 13Sonoma 21,252 14,168 40 9Stanislaus 38,576 14,268 27 14Sutter 6,620 2,449 27 14Tehama 1,828 984 35 6Trinity 84 196 70 2Tulare 41,743 13,182 24 18Tuolumne 1,073 878 45 4Ventura 77,523 36,481 32 17Yolo 14,230 6,099 30 14Yuba 3,971 1,395 26 9Total 4,452,421 2,006,404 31 22
SOURCE: 1990 census.
NOTE: These counts include immigrants in the United States less than five yearsand immigrants younger than 18 years of age and are therefore not comparable to otherestimates of naturalization rates in this report that exclude those groups.
It is clear from our analysis that most of the difference across
counties is due to differences in the characteristics of the immigrant
population in each county. For example, the lower rate of naturalization
in Los Angeles County is mainly due to immigrant length of stay. Los
Angeles County has an immigrant population with a large number of

52
recent immigrants and, as discussed above, recent immigrants have lower
naturalization rates than immigrants who have been in this country for
many years. This is also true for San Joaquin and San Bernardino
Counties. On the other hand, most of the explanation for the lower rate
of naturalization in Tulare, Stanislaus, and Monterey Counties is not
only the length of stay but also the lower level of education among the
immigrant population. Finally, controlling for personal, family,
community, and country-of-origin characteristics explains the variation
in all but nine counties (Santa Cruz, Kern, Santa Barbara, Orange,
Sonoma, Sacramento, San Diego, San Francisco, and Solano).
Naturalization rates in these counties are higher than what we would
have expected given the characteristics of their immigrant populations.14
Naturalization rates are especially low in agricultural areas of
California. The characteristics of the immigrant population (i.e., length
of stay in the United States, education, English proficiency, and country
of origin), and the disproportionate number of unauthorized immigrants
in the agricultural counties of the San Joaquin Valley, Imperial Valley,
and the coastal counties of California, explain their disadvantage in terms
of rates of naturalization. Although differences in naturalization rates
across counties are primarily due to compositional effects, most
immigrants in California live in counties with low rates of naturalization.
Only nine counties in the state have naturalization rates above 50
percent, and they have very small immigrant populations (Alpine,
Amador, Calaveras, Humboldt, Mariposa, Nevada, Plumas, Siskiyou,
and Trinity Counties).
____________ 14The exception to this is Santa Cruz, which, even after holding constant for the
characteristics of the immigrant population in the county, has naturalization rates belowthose of other counties.

53
5. How Has the Propensity toNaturalize Changed overTime?
In this chapter, we first use administrative data from the INS to
estimate trends in naturalization from 1960 through 1996. We then use
CPS data to analyze the substantial increases in naturalization that
occurred between March 1996 and March 1997.
Naturalization Trends: 1960–1996The number of immigrants naturalizing each year in the United
States is a function of the number of immigrants eligible to naturalize as
well as the rate at which such immigrants choose to naturalize. As shown
in Figure 5.1, the number of immigrants naturalizing in the United
States has been increasing since the 1970s, with a dramatic upturn in the
mid-1990s. The number of naturalizations increased from about
100,000 people in 1969 to over 1,000,000 in 1996. The record in
previous years was 442,000, set in 1944. The increase in naturalizations

54
Num
ber
(tho
usan
ds)
1,100
0
200
300
400
700
1964 1972 1984 1988 1992 1996198019761960 1968
100
1,000
900
800
600
500
Figure 5.1—Number of Persons Who Naturalized, 1960–1996
in the 1990s resulted, in part, from administrative actions by the INS, a
large increase in immigrants eligible to naturalize under IRCA, and
possibly legislative efforts to restrict public benefits to noncitizens.
The Green Card Replacement Program, begun in 1992 by the INS,
required that long-term permanent residents replace their resident cards
with new cards; many immigrants chose to naturalize rather than apply
for new cards (INS, 1997). Also, in 1995 the INS started the program
“Citizenship USA,” which was designed to encourage naturalization and
reduce the backlog in the naturalization process. However, the most
significant change that occurred in this period was the tremendous
increase in the number of immigrants eligible for naturalization, as
formerly unauthorized immigrants were granted amnesty (legal
permanent residency) through the 1986 IRCA. As a result of IRCA, the
number of immigrants granted legal residency in the United States
increased dramatically from 1987 to 1991—in the peak year, 1991, the

55
number of immigrants granted legal admission was three times higher
than just four years earlier.1
Those granted amnesty became eligible for naturalization starting in
1993, and by the end of 1996 almost 2.5 million legalized immigrants
became eligible to naturalize. Figure 5.2 shows the number of
immigrants who entered the United States legally or changed legal status
between 1960 and 1994.
To estimate long-term trends in the propensity to naturalize, we used
INS data to estimate the number of naturalized immigrants and the
number of legal immigrants in the United States.2 As shown in Figure
5.1, the number of immigrants naturalizing has increased over time;
Num
ber
(tho
usan
ds)
2,000
0
400
600
800
1,400
1964 1972 1984 1988 1992198019761960 1968
200
1,800
1,600
1,200
1,000
SOURCE: Authors’ estimates from INS administrative data.
IRCA population
Figure 5.2—Number of Legal Immigrants to the United States, 1960–1994
____________ 1It is important to note that the majority of immigrants granted amnesty under
IRCA had been resident in the United States for many years before becoming legalimmigrants.
2See Chapter 3 for a discussion of our methodological approach.

56
however, as shown in Figure 5.3, the naturalization rate among legal
immigrants declined substantially over the past few decades, falling from
a high of 63 percent in 1965 to 38 percent in 1993 (the upturn in 1995
will be discussed in the next section). Most of this decline can be
attributed to a change in the composition of the legal immigrant
population, from a population that had, on average, resided in the
United States for a long period of time to a much more recently arrived
population. As shown in Figure 5.4, in 1960 the average legal immigrant
had been admitted to the United States over 30 years earlier; by 1990,
the average had declined to just 15 years. These changes simply reflect
historical changes in the number of immigrants admitted to the United
States. In 1960, for example, relatively few immigrants had been
admitted to the United States in the preceding three decades—more
Nat
ural
izat
ion
rate
(%
)
65
30
35
40
45
50
55
1965 19951975 1990198519801960 1970
60
SOURCE: Authors’ estimates from INS administrative data.
Figure 5.3—Estimated Naturalization Rates for Legal Permanent Residents,1960–1996
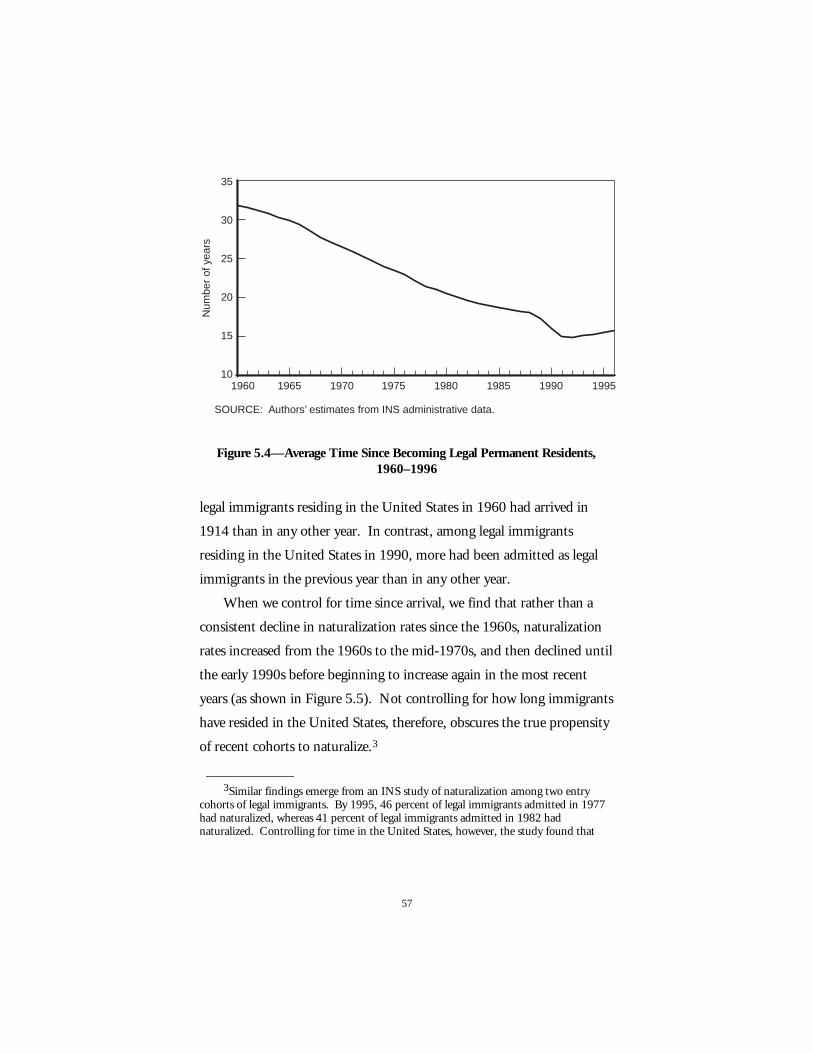
57
Num
ber
of y
ears
35
10
15
20
25
30
1965 19951975 1990198519801960 1970
SOURCE: Authors’ estimates from INS administrative data.
Figure 5.4—Average Time Since Becoming Legal Permanent Residents,1960–1996
legal immigrants residing in the United States in 1960 had arrived in
1914 than in any other year. In contrast, among legal immigrants
residing in the United States in 1990, more had been admitted as legal
immigrants in the previous year than in any other year.
When we control for time since arrival, we find that rather than a
consistent decline in naturalization rates since the 1960s, naturalization
rates increased from the 1960s to the mid-1970s, and then declined until
the early 1990s before beginning to increase again in the most recent
years (as shown in Figure 5.5). Not controlling for how long immigrants
have resided in the United States, therefore, obscures the true propensity
of recent cohorts to naturalize.3
____________ 3Similar findings emerge from an INS study of naturalization among two entry
cohorts of legal immigrants. By 1995, 46 percent of legal immigrants admitted in 1977had naturalized, whereas 41 percent of legal immigrants admitted in 1982 hadnaturalized. Controlling for time in the United States, however, the study found that
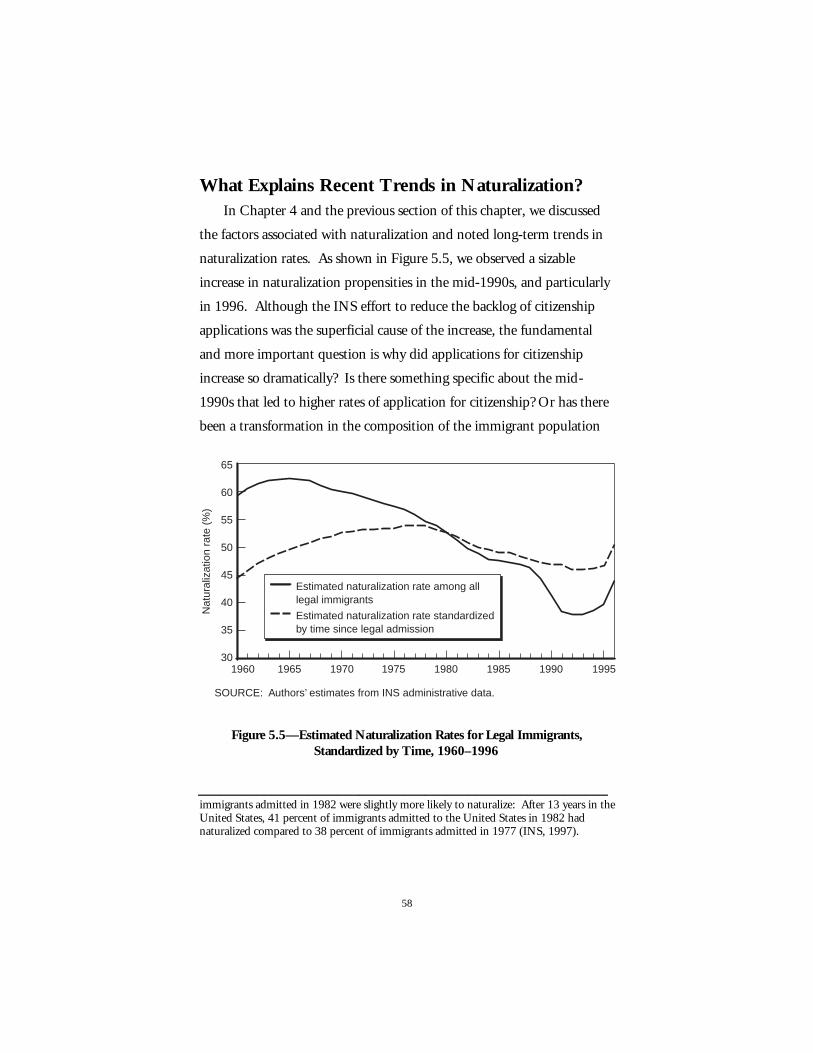
58
What Explains Recent Trends in Naturalization?In Chapter 4 and the previous section of this chapter, we discussed
the factors associated with naturalization and noted long-term trends in
naturalization rates. As shown in Figure 5.5, we observed a sizable
increase in naturalization propensities in the mid-1990s, and particularly
in 1996. Although the INS effort to reduce the backlog of citizenship
applications was the superficial cause of the increase, the fundamental
and more important question is why did applications for citizenship
increase so dramatically? Is there something specific about the mid-
1990s that led to higher rates of application for citizenship? Or has there
been a transformation in the composition of the immigrant population
Nat
ural
izat
ion
rate
(%
)
65
30
35
40
45
50
55
1965 19951975 1990198519801960 1970
60
SOURCE: Authors’ estimates from INS administrative data.
Estimated naturalization rate among all legal immigrants
Estimated naturalization rate standardized by time since legal admission
Figure 5.5—Estimated Naturalization Rates for Legal Immigrants,Standardized by Time, 1960–1996
________________________________________________________ immigrants admitted in 1982 were slightly more likely to naturalize: After 13 years in theUnited States, 41 percent of immigrants admitted to the United States in 1982 hadnaturalized compared to 38 percent of immigrants admitted in 1977 (INS, 1997).

59
in recent years, which has altered naturalization rates? What would this
imply about naturalization in California and the rest of the nation?
In this section, we use the CPS March Supplements from 1996 and
1997 and use the same models discussed in previous chapters to
determine the reasons for the increase in naturalization.4
The naturalization rate in the United States and in California was
significantly higher in March 1997 than in March 1996.5 In the United
States, among adults aged 18 and over, the rate increased from 40
percent to 45 percent, whereas the rate in California increased even more
dramatically—from 31 percent to 39 percent (see Table 5.1). These one-
year increases are remarkable.6 In California, for example, the increase
suggests that the number of naturalized citizens aged 18 and over
increased 24 percent, or by almost 500,000 persons. Much of this
increase is attributable to INS efforts to reduce backlogs of naturalization
applications through its “Citizenship USA” program. The backlogs,
which arose as the INS received record numbers of applications for
citizenship in the 1990s, were particularly large in California. The
“Citizenship USA” program, however, does not explain the reason for
the record numbers of persons applying for citizenship in the early
1990s. To try to explain this, we examined how the factors associated
with naturalization changed from March 1996 to March 1997.
____________ 4We combined the CPS March Supplements from 1996 to 1997 and eliminated
duplicate records of respondents who were in the CPS for both years. See Appendix Cfor an explanation of the matching and elimination process. We performed similaranalyses with 1994 and 1995 CPS data, but problems with coding and reporting of the1994 and 1995 CPS data led us to drop observations from those years.
5We verified that the total number of naturalizations implied in the CPS data isconsistent with INS administrative data.
6The larger increase in the naturalization rate in California than in the United Statesis statistically significant.

60
Table 5.1
Naturalization Rates in the United Statesand California, 1996 and 1997
NaturalizationRate (%)
1996 1997California 31 39
Rest of United States 44 48
Entire United States 40 45
SOURCE: 1996 and 1997 CPS; duplicaterecords omitted.
Through the use of logistic regression models (see Appendix A,
Table A.3), we found that the higher naturalization rates in March 1997
resulted from widespread increases in the propensity to naturalize among
all immigrants. Naturalization rates increased for immigrants who had
arrived in the United States fairly recently as well as for immigrants who
had been here for some time. As shown in Figure 5.6, only immigrants
who had arrived here before 1965 did not experience substantial
increases in naturalization rates between 1996 and 1997, and those
immigrants already had very high naturalization rates.7 Controlling for a
host of personal, social, economic, and institutional factors, we found
that the average immigrant in 1997 was 1.2 times more likely to have
naturalized than an otherwise similar immigrant in 1996.
At the same time, we found that the propensity to naturalize
increased even more dramatically for particular groups of immigrants:
better educated immigrants, Latino immigrants, and immigrants in
____________ 7The vast majority of immigrants in the United States (83 percent) arrived after
1965.

61
Nat
ural
izat
ion
rate
(%
)
SOURCE: Authors’ tabulations from 1999 and 1997 CPS.
NOTES: Immigrants in the United States less than five years or younger than 18 years of age are excluded. Duplicate records are omitted.
90
0
10
20
30
40
50
60
70
80
Before1950
1990–1991
1988–1989
1986–1987
1984–1985
1982–1983
1980–1981
1975–1979
1970–1974
1965–1969
1960–1964
1950–1959
19961997
Figure 5.6—Naturalization Rates by Period of Immigration, 1996 and 1997
California. Better educated immigrants were especially likely to have
naturalized between March 1996 and March 1997 (see Table 5.2). For
example, controlling for a number of socioeconomic and demographic
characteristics, the naturalization rates in California for immigrants with
college degrees or some college were about 15 percentage points higher in
March 1997 than in March 1996. Immigrants with a high school
education or less had naturalization rates about 7 percentage points
higher in March 1997 than otherwise similar immigrants in March 1996.
We also found some evidence suggesting that the increase in the
propensity to naturalize between March 1996 and March 1997 was
greater in California than in the rest of the United States and that the
increase was greater among Latinos than among any other immigrant
group. Although immigrants in California are still less likely to

62
Table 5.2
Naturalization Rates by Educational Attainment,1996 and 1997
NaturalizationRate (%)
1996 1997
California8th grade or less 19 25Some high school 26 32High school graduate 33 40Some college 34 48College graduate 35 50
Rest of United States8th grade or less 26 31Some high school 35 38High school graduate 43 47Some college 44 55College graduate 45 57
SOURCE: Authors’ tabulations from1996 and 1997 CPS.
NOTES: Results are based on logitModel 3 in Appendix A. Simulations arebased on unmarried, non-Latino immigrantsbetween the ages of 18 and 34 (at the time ofarrival) arriving in the United States between1975 and 1979. Controls for income arealso included in the model.
naturalize than immigrants in the rest of the country, and although
Latinos’ naturalization rates remain substantially lower than those of
other immigrant groups, the gap between California and the rest of the
United States and that of Latinos and other immigrants shrank from
March 1996 to March 1997.8
____________ 8It is difficult to disentangle these two effects because they are strongly correlated.

63
Two factors might account for the especially large increases in
naturalization among better educated immigrants, immigrants in
California, and Latinos: an increase in the proportion of immigrants
eligible to naturalize, or an increase in naturalization rates among those
who are eligible. IRCA led to a substantial increase in the proportion of
Latino and California immigrants eligible to naturalize, because a
disproportionate share of those granted amnesty under IRCA were
California residents and Latino immigrants. Also, political events taking
place in the 1990s may have led to the increased naturalization rate
among eligible immigrants. Proposition 187 was passed in California in
1994 in an attempt to curtail social services to unauthorized immigrants,
and in 1995–96, the nation was debating the virtues of restricting
benefits to legal immigrants. The media and many scholars argue that
Proposition 187 and a perceived anti-immigrant sentiment encouraged
many immigrants to naturalize as a way to protect their rights and cast
their vote against anti-immigrant legislation. Our results show some
support for this assertion. Immigrants in California might have felt
especially motivated to naturalize because the anti-immigrant sentiment
was especially strong in the state. Latino immigrants in particular may
have felt especially targeted by Proposition 187 and may have used
naturalization as a way to protect themselves. Finally, better educated
immigrants may have been more likely to react to these policies by
naturalizing because they have better access to information about
political events and political debates.
65
6. What Role Should State andLocal Governments Play inEncouraging ImmigrantNaturalization?
In its final report to the congress, the U.S. Commission on
Immigration Reform urged the government to “Americanize” its
immigrant population and do more to help immigrants integrate into
society.1 The commission sees “naturalization as the most visible
manifestation of civic incorporation as well as a crucial component of the
Americanization process” (U.S. Commission on Immigration Reform,
1997). As argued by the commission, naturalization involves more than
just providing new citizens with benefits; it is meant to ensure “the
vitality of this nation through the inclusion of new members and through
____________ 1By “Americanization,” the commission means “the cultivation of a shared
commitment to the American values of liberty, democracy, and equal opportunity—something that is possible regardless of the nationality or religious background ofimmigrants and their children” (U.S. Commission on Immigration Reform, 1997).

66
cohesion of our nation’s people” (U.S. Commission on Immigration
Reform, 1997).
Given the significance of naturalization for the integration of new
immigrant groups, for social cohesion, and for democratic
representation, it is important to determine what states can do to
encourage naturalization, especially in California, which has a
disproportionate number of noncitizens. Some argue that the
government should not attempt to influence the decision to naturalize,
given the personal nature of that decision. Others fear that a systematic
effort to “Americanize” the immigrant population by way of
naturalization may be synonymous with the old “Anglo-conformism”
and would undermine immigrants’ cultures and values for the sake of
social cohesiveness. However, most observers believe that the
government has an important role to play in helping immigrants to
naturalize and view naturalization as part of the process of integration
into U.S. society, as a means for becoming civically and politically
engaged in society, and as a necessary element in the success of a
participatory democracy.
The importance of naturalization to state and local governments has
also increased since the passage of the Personal Responsibility and Work
Opportunity Reconciliation Act of 1996, which, in essence, made
citizenship a requirement for qualifying for certain benefits. As originally
passed, the welfare reform legislation created large incentives for states to
encourage naturalization among their immigrant populations, thereby
shifting the cost of social programs back to the federal government.
Because county welfare departments are considered service providers of
last resort, many counties were particularly active in fostering the
naturalization of their immigrant populations. In the remainder of this

67
chapter, we discuss what California and its counties have done to
encourage naturalization.
How Has the State Sought to EncourageNaturalization?
Until the last year of former Governor Pete Wilson’ s administration,
the state funded citizenship assistance through federal monies rather than
by creating a state program. The only resources the state allocated to
naturalization instruction and services originated from the Department
of Education’ s adult education funds. In 1997, $12.6 million of the
federal adult education funds were allocated to citizenship education and
naturalization assistance. No general fund resources were allocated for
naturalization services. The monies were used to fund English as a
Second Language (ESL) and citizenship classes for legal permanent
residents, outreach services, assessment of skills, instruction and
curriculum development, staff development, citizenship testing,
naturalization preparation and assistance, and regional and state
coordination and program evaluation. But the need for greater
resources—in part because of the welfare reform legislation—was
apparent. In 1998, the governor approved a bill to allocate $2 million
from the general fund to the Department of Community Services and
Development—in addition to $12.5 million appropriated from the
federal adult education funds—for citizenship education and
naturalization assistance.
Given the large number of immigrants in California, it is not clear
whether the funding levels allocated for naturalization will adequately
provide the amount and type of assistance necessary to encourage
naturalization. The INS estimates that over two million legal permanent

68
residents in California are eligible to naturalize but have not yet done so.
Many of them are hard-to-reach populations: recent arrivals with low
levels of education, poor knowledge of the English language, and limited
social networks to encourage them to naturalize. It is clear that to have
an effective naturalization program, the state must create avenues to
provide as many immigrants as possible with information about
naturalization. It is also clear that to accelerate immigrants’
naturalization, it is necessary to improve their educational attainment,
and particularly their knowledge of the English language. Finally,
refugees from countries such as Laos, Cambodia, Nicaragua, Guatemala,
and El Salvador, as well as Mexican immigrants, have the lowest rates of
naturalization of all immigrant groups, indicating the need to target these
populations in naturalization programs.
How Have the Counties Sought to EncourageNaturalization?
When Congress voted to eliminate legal immigrants’ eligibility for
federal means-tested programs in August 1996, California counties feared
the worst. County welfare departments expected that many of the
immigrants losing benefits would apply for county-financed general
assistance. As a first line of defense, community activists and welfare
departments in many counties embarked on unprecedented programs to
encourage legal immigrants to apply for citizenship, seeking to shield
them from cuts in services as well as to alleviate the effect on county
general assistance funds.
To learn more about this activity, PPIC conducted a phone survey in
October and November 1997 with respondents designated by each
county welfare office in the state. We asked each respondent how welfare

69
reform was affecting legal immigrants in the county and what activities
the county welfare office was undertaking to promote citizenship and
naturalization. By the time of the survey, which occurred just two
months after the federal and state reinstatements of most benefits, most
respondents had concluded that welfare reform would have a minimum
effect on legal immigrants in the county, limited to the termination of
eligibility for federal food stamps (since then, the state has replaced the
lost food stamp assistance for adult food stamp recipients). Survey
respondents explained that as a result of this, advocacy for naturalization
of immigrant welfare clients was no longer viewed with the same urgency
as it had been earlier in the year. However, immigrants who enter the
United States after 1996 are no longer eligible for any federally funded
means-tested programs until they become naturalized or work for 40
quarters. Thus, the risk of a large ineligible immigrant population
demanding general assistance from the counties remains real, if less
immediate. In the remainder of this chapter, we discuss the funding and
activities undertaken by counties to encourage naturalization.
Funding
California counties either directly allocated or helped to leverage over
$5.5 million for citizenship activities in 1997–1998. Of this amount,
$2.3 million was leveraged in foundation grants, mostly for citizenship
services offered by community-based organizations. The remaining $3.2
million was either county-allocated funding or in-kind contributions of
staff time and other resources. In almost every case, the resources were
raised specifically to respond to the effect of welfare reform. Table 6.1
details these expenditures.

70
Table 6.1
Funding for Citizenship Activities Directed or Assisted by County WelfareOffices in California, 1997 and 1998
Type of FundingAmount ofFunding ($)
Grants obtained from foundations or other noncounty agencies for directservices provided by community organizations, for which a county serviceagency acted as the pass-through and monitor
2,188,705
Grants obtained from foundations or other noncounty agencies foradministration purposes of a county department
133,000
Total grants 2,321,705
County-generated direct allocation for services provided by communityorganizations
1,606,000
Other county-generated allocation 45,000
Total county-generated funds 1,651,000
In-kind contribution of county staff time or other resources (no formalallocation of county funding)
1,589,519
Total funding 5,562,224
Types of Activities
Starting as early as the fall of 1996, California county welfare offices
developed initiatives to encourage Supplemental Security Income (SSI)
and food stamp recipients to naturalize. The most common activity to
promote citizenship was to refer affected immigrants to community
organizations for services. Other activities included organizing broad
educational outreach and citizenship events. Table 6.2 summarizes the
types of activities engaged in by county offices.
To better understand how much effort a particular county expended
on citizenship efforts, we created categories that incorporate

71
Table 6.2
Types of Citizenship Efforts
No. ofCounties Type of Citizenship Effort
28 Refer affected clients to community organizations for services15 Provide referrals to clients by phone or in person18 Send mailing to client with citizenship information5 Provide client’ s name to community organizations for follow-up8 Produce information on citizenship to be disseminated in county3 Organize phone hotline to provide citizenship information6 Run/help run public service announcements, or use other media outlets10 Organize or assist in organizing citizenship events11 Hire or assign staff to organize citizenship campaigns
combinations of activities. From our survey, we found that the pattern
of citizenship activity undertaken by county welfare offices falls roughly
into six categories. Table 6.3 describes those categories.2
Citizenship Activity by Counties
The different levels of citizenship activity undertaken by county
welfare offices are closely related to the size of the immigrant population
in the county. However, some counties with a large noncitizen
population did not engage in any efforts to encourage naturalization,
whereas others with a small population did a substantial amount of work
in encouraging their population to naturalize. Figure 6.1 displays
California counties by the level of citizenship activities undertaken in
1997–1998, and Figure 6.2 presents the geographic distribution of the
immigrant population in California. In general, counties with large
numbers of immigrants engaged in high to very high levels of citizenship
____________ 2After the completion of our survey, Santa Clara County entered into a unique
agreement with the INS: Nine county workers will assist INS with clerical tasks andother duties to help reduce the backlog of pending citizenship applications in that county.

72
Table 6.3
Categories of Effort
Activity Level DescriptionNone No activity
Low Provided referrals for affected clients to organizations forcitizenship services with minimal collaboration
Low–medium In addition to referrals, organized citizenship events
Medium Participated in an ongoing coalition with communityorganizations by providing names of affected clients for follow-upby community groups
High Mobilized community groups to provide citizenship assistance toaffected clients, close participation
Very high Played a central leadership role in a broad coalition, organizedoutreach activity to promote citizenship beyond assisting affectedclients.
activity. Most of the counties with over 100,000 immigrants engaged in
at least some citizenship activity. Most of these counties generally
organized or participated in one-time citizenship events such as forums
and citizenship fairs. Counties located in the eastern and north central
portions of the state, where there are few legal immigrants, tended to not
participate in any citizenship activities. Coastal counties, particularly
those with large immigrant populations, tended to be more active in
promoting citizenship than other counties.
Figures 6.3 and 6.4 display the percentage of noncitizens in
California counties and the proportion of SSI recipients who were legal
immigrants at the end of 1996, respectively. The maps indicate that
although there were relatively few noncitizens in north coast counties,
noncitizens represent a relatively high share of SSI recipients in that

73
���������������
���
������������������������������������������������������
None
Low
Low–medium
Medium
High
Very high
Not available
��������
Tehama
Colusa
Stanislaus
Lake
Trinity
Modoc
Lassen
Nevada
Placer
El Dorado
Sonoma
Marin
San Mateo SantaClara
Alameda
Calaveras
AmadorAlpine
TuolumneMono
Mariposa
Madera
Fresno
Inyo
Monterey
Ventura
Los Angeles
San DiegoImperial
Santa Cruz
Tulare
Plumas
Sacra-mento
San Francisco
�������
Sacra-mento
Solano
DelNorteDel
Norte
Humboldt
Butte
Yuba
Merced
Kern
Riverside
San Luis Obispo
Santa Barbara
SanJoaquin
Sutter
Yolo
Sierra
Siskiyou
Shasta
Kings
MendocinoGlenn
Napa
ContraCosta
SanBenito
San Bernardino
Orange
Figure 6.1—Citizenship Activity by County in California, 1997

74
0 to 10k
10k to 50k
50k to 100k
100k to 500k
> 500k
����
San Francisco
SOURCE: 1990 U.S. Census.NOTE: Total number = 6.5 million
Shasta
Tehama
Glenn
Colusa
Sutter
Yolo
Solano
Sacra-mento
ContraCosta
Lake
Mendocino
Humboldt
Trinity
DelNorte
Siskiyou Modoc
Lassen
Sierra
NevadaYuba
Placer
El DoradoSonoma Napa
Marin
San Mateo SantaClara
Alameda
Calaveras
AmadorAlpine
TuolumneMono
Merced
Mariposa
Madera
Fresno
Inyo
Kings
San Luis Obispo
Ventura
Los Angeles2.9 million
San Bernardino
RiversideOrange575k
San DiegoImperial
Santa Cruz
Butte
Plumas
SanBenito
Santa Barbara
Kern
TulareMonterey
Stanislaus
SanJoaquin
Figure 6.2—Foreign-Born by County in California, 1990

75
Less than 6%
6% to 12%
12% to 18%
Greater than 18%
Shasta
Tehama
Glenn
Sutter
Yolo
Solano
Sacra-mento
ContraCosta San
Joaquin
Stanislaus
Lake
Mendocino
Humboldt
Trinity
DelNorte
Siskiyou Modoc
Lassen
Sierra
NevadaYuba
Placer
El DoradoSonoma Napa
Marin
San Mateo
Alameda
Calaveras
AmadorAlpine
TuolumneMono
Mariposa
Madera
Inyo
Kings
San Luis Obispo Kern
Santa Barbara
Ventura
Los Angeles
San Bernardino
Riverside
San DiegoImperial
Santa Cruz
Butte
Plumas
San
San Francisco
SOURCE: 1990 U.S. Census.
Tulare
FresnoSanBenito
Monterey
Orange
SantaClara
Colusa
Merced
Figure 6.3—Percentage Noncitizen by County in California, 1990

76
Less than 8%
8% to 18%
18% to 25%
Greater than 25%
San Francisco
SOURCE: Social Security Administration, December 1996.
Shasta
Tehama
Colusa
Yolo
Sacra-mento
Lake
Mendocino
Humboldt
Trinity
DelNorte
Siskiyou Modoc
Lassen
Sierra
Nevada
Placer
El DoradoSonoma Napa
Marin
San Mateo SantaClara
Alameda
Calaveras
AmadorAlpine
TuolumneMono
Merced
Mariposa
Fresno
Inyo
Kings
San Luis Obispo
Ventura
Los Angeles
Orange
San DiegoImperial
Santa Cruz
Butte
Plumas
Santa Barbara
Kern
TulareMonterey
Stanislaus
SanJoaquin
San Bernardino
Riverside
San Benito
Madera
ContraCosta
Solano
SutterYuba
Glenn
Figure 6.4—Legal Immigrants on SSI as a Share of All SSI Recipients byCounty in California, 1996

77
region. This may explain the higher activity level among north coast
counties compared to other counties with few legal immigrants. For
example, Del Norte, Humboldt, Mendocino, and Sonoma Counties
engaged in medium or high levels of citizenship activities. In contrast,
the Central Valley counties, with relatively high numbers of noncitizens
and a high share of noncitizen SSI recipients, engaged in low levels of
activity.
Most of the counties in which the welfare office engaged in no
citizenship activity have few legal immigrant residents. Important
exceptions are San Diego and Fresno Counties.3 In San Diego, the
welfare office did not respond to our survey but informed us that they
had not engaged in any activity to encourage naturalization. Fresno
County, with one of the largest proportions of noncitizens in the state,
did not engage in any activity to encourage naturalization.
Finally, many of the high activity counties are also those with highest
numbers of noncitizens and very high shares of noncitizen SSI recipients.
They are also likely to contain the urban centers of the state. These very
high activity counties played a central role in directing citizenship
campaigns that promoted naturalization more broadly than just targeting
affected clients. In these cases, county social service departments, in close
cooperation with community groups, organized events such as
citizenship fairs, conferences, training, media outreach, and phone
hotlines; they even lobbied in Sacramento. These counties include Los
Angeles, San Francisco, Santa Clara, Alameda, Ventura, Monterey,
Sacramento, and Santa Cruz.
____________ 3Although Orange County undertook no activity to promote citizenship in 1997, it
organized an effort to target elderly refugees starting in 1998; for this reason, we includedit as a high activity county.
78
Citizenship Efforts and Coordination
For those counties with high levels of citizenship activity,
coordination became the key to success, as welfare offices created a
referral system to assist immigrants in the naturalization process. The
offices served as a nexus for coordinating a broad network of
organizations and advocated for citizenship throughout the county.
Examples of such activity include visiting organizations and centers that
assist immigrants, developing brochures, and lobbying in Sacramento.
The community organizations with which county welfare offices
collaborated were geared primarily to work with specific ethnic groups
and other target populations.
Spillover benefits occurred as a result of county involvement in
coordination and mobilization. Many county welfare departments
developed closer relationships with community organizations than had
existed previously. According to some of the citizenship campaign
coordinators, the increased cooperation provided benefits on both
sides—in the form of enhanced resource sharing for the community
organizations and an enhanced ability to provide services for the welfare
departments.
Obstacles to Naturalization
In many counties, the level of effort diminished after benefits were
restored. However, in other cases, campaigns that were under way
continued. County welfare offices report that more than 95,000 welfare
recipients applied for citizenship in 1997 as a result of the campaigns in
which welfare offices were involved (85 percent of these applications
occurred in Los Angeles County).

79
Partly as a result of these efforts, the INS has experienced a severe
backlog of applications in California. A number of welfare offices have
cited the need to provide follow-up assistance for their immigrant clients.
Anecdotal evidence from Los Angeles County suggests that a substantial
portion of the backlog in Los Angeles is over 15 months old, which
means that the applications have expired and the applicants need to
resubmit fingerprints and other documents.4 In some cases, fingerprints
are resubmitted many times to the INS. The INS is implementing new
approaches to reduce backlogs. Much of the improvement will come in
the form of automation of many of the procedures in the naturalization
process, as well as better tracking systems and methods to counteract
fraudulent documents and applications. However, there is increasing
concern from the public and from immigrant advocates about increasing
numbers of refusals as INS tries to reuce backlogs (Chicago Tribune, July
9, 1999).
In addition to the INS backlog, the issues most commonly cited as
problematic for county welfare offices involved in citizenship efforts are
the difficulty in organizing effective outreach to the elderly and disabled,
problems with access to naturalization services, the difficulty that elderly
immigrants experience in learning English to satisfy citizenship
requirements, and the high cost of citizenship application fees. These
obstacles often make it difficult for the welfare population to naturalize.
____________ 4Conversation with Josie Marquez, Los Angeles County Citizenship Assistance
Campaign, Department of Community and Senior Services, Los Angeles County.

81
7. Conclusions and PolicyImplications
This report has examined trends in naturalization in California and
the United States, the factors associated with naturalization, and the
reasons for low rates of naturalization in California. Our findings
confirm the importance of time in residence and economic progress in
the United States as precursors for naturalization. Social capital also has
a strong effect on the propensity to naturalize. Being connected to a
diverse social network that includes U.S. citizens is more likely to provide
immigrants with information about the naturalization process and the
benefits of naturalization than does belonging to a network of only
noncitizens. But even after holding constant for personal and
socioeconomic characteristics, there are substantial differences in the rate
of naturalization by country of origin—immigrants from the United
Kingdom, Canada, Ireland, Laos, Guatemala, and Mexico have the
lowest rates of naturalization, holding everything else constant.

82
We found that California has a low rate of naturalization, compared
to the rest of the nation, not only because of the characteristics of the
immigrant population in the state—low levels of education, low English
proficiency, disproportionate numbers of recent immigrants, and
disproportionate numbers of immigrants from countries with low rates of
naturalization—but also because certain groups of immigrants in
California have a lower propensity to naturalize than their counterparts
in the rest of the nation. The groups that are less likely to naturalize in
California than in the rest of the nation include recent immigrants,
Mexican immigrants, immigrants with noncitizen spouses, and
immigrants with fewer than eight years of education. Moreover,
California has a disproportionate number of unauthorized immigrants
and temporary migrants; most of the recent immigrants may not qualify
for naturalization, and others may not plan to remain in this country
long enough to naturalize.
Over the past 25 years, naturalization rates have been declining in
the United States. This decline can be largely attributed to a change in
the composition of the immigrant population—from those who had
resided in the United States for long periods of time to those who have
arrived much more recently. However, controlling for time in the
United States, naturalization rates have risen in the 1990s. In 1996, over
one million immigrants naturalized. The increase in the rate of
naturalizations in the 1990s has resulted not only because of a surge in
the number of immigrants eligible to naturalize, primarily those granted
amnesty under IRCA, but also because of the increased political
importance of naturalization.
Immigrants are also naturalizing sooner than in the past. Recent
immigrants—those arriving since 1965—were more likely to naturalize

83
by March 1997 than just one year earlier. Immigrants living in
California, Latino immigrants, and immigrants with at least some college
education were especially more likely to have naturalized by March 1997
as compared to March 1996.
Our findings suggest that naturalization rates vary even more widely
across California counties than they do across other U.S. states. In
general, counties with low concentrations of immigrants have high
naturalization rates, whereas counties with high concentrations of
immigrants have low naturalization rates. In addition, except for a few
large urban counties, the counties with low naturalization rates are
primarily those where agriculture figures prominently. In those counties,
immigrants tend to be recent arrivals and tend to have low
socioeconomic status.
The results from our survey of county welfare offices indicate that,
overall, county welfare offices played a significant role in extensive efforts
undertaken over the past two years to help immigrant welfare clients to
naturalize. However, counties vary widely in the level of activity
undertaken to promote citizenship. Several county welfare offices
provided little naturalization assistance, despite large numbers of affected
immigrant welfare recipients. Our survey results also indicate that most
county welfare offices have not assessed the effect of welfare reform on
legal immigrants beyond the current caseload, in spite of the fact that
changes in welfare eligibility bar newly arrived immigrants from receiving
any major welfare benefits.
It is likely that the efforts of county welfare departments and
community organizations to promote citizenship over the past years have
helped to increase naturalization rates. However, the existing data do not
enable us to verify this. Given the findings of this study and the trends

84
taking place in the nation, we expect an increase in naturalization but not
necessarily for difficult-to-reach or other disadvantaged populations.
These county efforts have also highlighted many of the challenges
involved in naturalization. Many counties complained of significant
barriers. For example, the problems of inadequate English skills among
elderly immigrants, poor access to services, and high citizenship
application fees make citizenship a high hurdle for many.
California is one of the few states to allocate state funds to encourage
naturalization.1 But given the large number of immigrants in California
relative to other states, it is not clear whether these funds will adequately
provide the type of assistance necessary to encourage naturalization. In
our survey, county social service offices emphasized the importance of
coordination with a broad network of organizations. Community-based
organizations tend to be more flexible and responsive to the needs of the
immigrant community than are county agencies. Also, the state’s
method of payment based on classroom hours prevents the allocation of
resources to other important purposes, such as preparation of documents,
assessment, or legal services. A more flexible model may be necessary.
California has a difficult noncitizen population to naturalize. Many
of its immigrants are recent arrivals with low levels of education, poor
knowledge of English, and a lack of the social networks that might
encourage them to naturalize. They tend to live in neighborhoods with
large numbers of immigrants and to have noncitizen spouses and
children. To have an effective naturalization program, the state must
____________ 1Twelve other states have state programs established to assist in immigrant
naturalization—Illinois, Florida, Massachusetts, New Jersey, New York, Arizona,Maryland, Rhode Island, Washington, Hawaii, Nebraska, and Oregon (NationalImmigration Law Center, 1998).
85
create avenues to provide this hard-to-reach population with information
about the benefits of naturalization and the naturalization process. It is
also clear that to accelerate immigrants’ naturalization, it is necessary to
improve their educational attainment and particularly their knowledge of
English. Finally, immigrants from Laos, Cambodia, Nicaragua,
Guatemala, and El Salvador, in addition to Mexican immigrants, have
the lowest rates of naturalization, which indicates the importance of
targeting these populations in naturalization programs.

87
Appendix A
Logit Results
Table A.1
Full Model of the Probability of Naturalization,1990 Census
VariableParameterEstimate
StandardError
INTERCPT –1.6785*** 0.0606ARV18-35 0.00117 0.00847ARV36-53 0.1643*** 0.0131ARV54UP –0.0345 0.0243Years in U.S. 0.0804*** 0.00134Years in U.S. squared –0.00015*** 0.000023MALE –0.0727*** 0.00787GRADE8 –0.2556*** 0.0118NOHS –0.1274*** 0.0116SOMECOLLEGE 0.0425*** 0.00298COLLEGE 0.0577*** 0.00229INC10-19 0.1842*** 0.00914INC20-29 0.2582*** 0.0115INC30-39 0.3201*** 0.015INC40-49 0.3542*** 0.0202

88
Table A.1 (continued)
VariableParameterEstimate
StandardError
INC50UP 0.3669*** 0.0181ENGONLY 0.5179*** 0.0151ENGVWELL 0.4484*** 0.0123ENGWELL 0.389*** 0.0122ENGNONE –0.633*** 0.0190Public assistance –0.2205*** 0.0173UNEMPLOYED –0.0471*** 0.0170Married –0.2276*** 0.0123Citizen spouse 1.4056*** 0.0252SPOUSE_CIT_SAME 1.4506*** 0.0305SPOUSE_CIT_LATER 0.2285*** 0.0354SPOUSE_SAME –0.2259*** 0.0270SPOUSE_LATER 0.8775*** 0.0262Children –0.9753*** 0.0218Citizen children 1.0754*** 0.0218Percent foreign –0.4468*** 0.0304Home ownership 0.0634*** 0.0080PER CAPITA INCOME90 –0.00004*** 0.000003MIGRATION INDEX –0.0181*** 0.0008Dual citizenship 0.0868*** 0.0211France –0.2309*** 0.0579Germany 0.1376*** 0.0381Ireland –0.2318*** 0.0443Italy 0.7647*** 0.0452United Kingdom –0.8207*** 0.0402Cambodia 1.1468*** 0.0651China 0.5271*** 0.0316Hong Kong 1.071*** 0.0481India –0.2453** 0.0294Iran –0.3*** 0.0339Japan –0.2102*** 0.0626South Korea 0.6773*** 0.0247Laos –0.2455*** 0.0455Philippines 0.8124*** 0.0228Thailand –0.198*** 0.0467Vietnam 0.87*** 0.0268Canada –0.5601*** 0.0445Salvador –0.00902 0.0315

89
Table A.1 (continued)
VariableParameterEstimate
StandardError
Guatemala –0.1184*** 0.0418Honduras –0.0462 0.0500Mexico –0.0765*** 0.0261Nicaragua –0.3914*** 0.0483Panama –0.0944** 0.0506Cuba 0.2245*** 0.0230Dominican Republic 0.3092*** 0.0359Haiti 0.4202*** 0.0487California –0.1626*** 0.0114Texas 0.1614*** 0.0148New York 0.0352** 0.0141New Jersey 0.107*** 0.0181Illinois –0.0124 0.0185Florida –0.0497*** 0.0161PUMA INCOME –0.00001*** 0.0000PUMA UNEMP –0.8411*** 0.1826
***Significant at the 1 percent level.
**Significant at the 5 percent level.
*Significant at the 10 percent level.
Table A.2
The Effect of Living in California on the Probabilityof Naturalization, 1990 Census
VariableParameterEstimate
StandardError
INTERCEPT –2.6746*** 0.0419ARV18–35 –0.0345** 0.00927ARV36–53 0.2035*** 0.0139ARV54UP 0.0202 0.0261Years in U.S. 0.0861*** 0.00142Years in U.S. squared –0.00014*** 0.000025Male –0.0714*** 0.00857Married –0.2218*** 0.0136Citizen spouse 1.3037*** 0.0243Citizen children 1.164*** 0.0244Children –1.0532*** 0.0243

90
Table A.2 (continued)
VariableParameterEstimate
StandardError
SPOUSE_CIT_SAME 1.5641*** 0.0277SPOUSE_CIT_LATER 0.2041*** 0.032SPOUSE_SAME –0.3456*** 0.026SPOUSE_LATER 0.8126*** 0.026Home ownership 0.0977*** 0.00869UNEMPLOYED –0.0662*** 0.019GRADE8 –0.2472*** 0.0129NOHS –0.118*** 0.0126SOMECOLLEGE 0.0383*** 0.00321COLLEGE 0.0495*** 0.00238INC10–19 0.1741*** 0.00999INC20–29 0.2688*** 0.0124INC30–39 0.3259*** 0.0161INC40–49 0.3882*** 0.0215INC50UP 0.406*** 0.019ENGONLY 0.4368*** 0.0157ENGVWELL 0.4549*** 0.0139ENGWELL 0.4208*** 0.014ENGNONE –0.7677*** 0.0225Public assistance –0.165*** 0.0199France –0.4701*** 0.0432Germany –0.2265*** 0.0186Ireland –0.1258*** 0.0385Italy 0.1621*** 0.0206United Kingdom –0.9249*** 0.0199Cambodia 0.2103*** 0.0605China 0.8515*** 0.0302Hong Kong 0.9722*** 0.0519India –0.0228 0.0253Iran –0.4311*** 0.0434Japan –0.5385*** 0.0352South Korea 0.7726*** 0.0257Laos –0.0145 0.0512Philippines 0.7825*** 0.0229Taiwan 0.5709*** 0.0306Thailand –0.148*** 0.0544Vietnam 0.9607*** 0.0287Canada –1.0848*** 0.0182

91
Table A.2 (continued)
VariableParameterEstimate
StandardError
Salvador –0.1673*** 0.0403Guatemala –0.3583*** 0.0551Honduras –0.1308** 0.0546Mexico –0.3708*** 0.0141Nicaragua –0.5631*** 0.0635Panama 0.1297** 0.0527Cuba 0.1761*** 0.0186Dominican Republic –0.1037*** 0.0278Haiti –0.3503*** 0.0324California –0.1907*** 0.0534MSAINC –6.02E-06*** 8.54E-07MSAUNEMP –0.6042*** 0.1577Percent foreign –0.3803*** 0.0298CAYRINUS –0.0124*** 0.00256CAYRINSQ –0.00011** 0.000045CAEDGR8 –0.0622*** 0.0234CANOHS –0.0148 0.023CASOMCOL 0.00318 0.00573CACOLL 0.0126*** 0.00437CARV1835 0.0455*** 0.0163CARV3653 –0.0163 0.0256CARV54 –0.0336 0.0453CACHILD 0.109*** 0.0414CASPCIT 0.2367*** 0.0237CAFOREIN 0.2165*** 0.053CAENGNO 0.363*** 0.037CAENGVW 0.0345 0.0237CAENGW –0.0188 0.0235CAENGONL 0.1467*** 0.0295CAPUBASS 0.00179 0.0327CAUK 0.1982*** 0.0571CACANADA 0.1822*** 0.0387CANICA 0.1612* 0.0914CALAOS –0.39*** 0.0902CAHAITI 0.4587* 0.2401CAFRANCE 0.0636 0.0947CAJAPAN –0.1356** 0.0557CAPHILIP –0.0148 0.033

92
Table A.2 (continued)
VariableParameterEstimate
StandardError
CAMEXICO –0.313*** 0.0229CACUBA 0.0147 0.0572CASKOREA –0.2576*** 0.0422CAMALE 0.00615 0.015CAMARRY 0.0252 0.0221CACHCIT –0.0774* 0.0415CASPSAME 0.2366*** 0.0243CASLATER 0.2281*** 0.0288CAHOME 0.00709 0.0152CAUNEMP 0.0604* 0.0323CAY10_19 –0.0156 0.0178CAY20_29 –0.025 0.0221CAY30_39 –0.0468* 0.0282CAY40_49 –0.0567 0.0376CAY50UP –0.0806** 0.0333CADUAL –0.0531 0.0431CAGERMAN 0.0723* 0.0433CAIRELAN –0.1251 0.1064CAITALY 0.2609*** 0.0759CACAMDIA –0.2441*** 0.0935CACHINA –0.1566*** 0.0459CAHKONG –0.00051 0.0862CAINDIA –0.00028 0.0541CAIRAN 0.0374 0.062CATHAI –0.2257** 0.0947CAVIET –0.0635 0.0414CASALVDR –0.2863*** 0.0665CAGUATML –0.223*** 0.075CAHONDU –0.0858 0.1217CAPANA –0.114 0.1238CADOMINC –0.0651 0.2122
***Significant at the 1 percent level.
**Significant at the 5 percent level.
*Significant at the 10 percent level.

Table A.3
Identifying Trends in Naturalization
Model 1 Model 2 Model 3a Model 3b Model 4a Model 4b Model 5a Model 5bIntercept INTERCPT –0.51*** –0.30*** –2.72*** –2.53*** –2.74*** –2.55*** –2.72*** –2.54***Year YR97 0.19*** 0.15*** 0.94*** 0.89*** 0.99*** 0.95*** 0.96*** 0.91***California residence CALIF –0.75*** –0.44*** –0.32*** –0.45*** –0.32*** –0.38*** –0.25*** California residence interacted with year CALIF7 0.17** 0.14 0.15 0.16* 0.16*Latino origin LATINO –0.52*** –0.58*** –0.46*** –0.50*** –0.53*** –0.58***Latino interacted with year LATINO7 0.14 0.18** 0.15* 0.19**Asian origin ASIAN 0.55*** 0.05 0.55*** 0.06 0.55 0.05Age at time of arrival ARV18–34 –0.01*** –0.04 0.00 –0.04 –0.01 –0.04
ARV35–54 0.25*** 0.13* 0.25*** 0.13* 0.24*** 0.12*ARV55–99 0.22 0.00 0.22 0.00 0.22 0.00
Period of immigration PER0050 4.55*** 4.71*** 4.56*** 4.71*** 4.54*** 4.71***PER5060 3.69*** 3.81*** 3.69*** 3.80*** 3.68*** 3.80***PER6064 3.27*** 3.32*** 3.25*** 3.30*** 3.27*** 3.32***PER6569 2.88*** 2.85*** 2.86*** 2.83*** 2.87*** 2.85***PER7074 2.71*** 2.71*** 2.69*** 2.69*** 2.70*** 2.71***PER7579 2.28*** 2.31*** 2.27*** 2.30*** 2.27*** 2.31***PER8081 1.85*** 1.77*** 1.84*** 1.76*** 1.84*** 1.77***PER8283 1.82*** 1.79*** 1.82*** 1.78*** 1.82*** 1.79***PER8485 1.41*** 1.40*** 1.40*** 1.40*** 1.40*** 1.40***PER8687 1.24*** 1.25*** 1.24*** 1.24*** 1.24*** 1.24***PER8889 0.94*** 0.97*** 0.93*** 0.96*** 0.94*** 0.97***
Personal and household characteristics MALE –0.04 –0.03 –0.04 –0.03 –0.04 –0.03MARRIED –0.69*** –0.65*** –0.69*** –0.65*** –0.69*** –0.65***
93

Table A.3 (continued)
Model 1 Model 2 Model 3a Model 3b Model 4a Model 4b Model 5a Model 5bSPCIT 0.96*** 1.01*** 0.97*** 1.01*** 0.96*** 1.01***SPCITS 1.92*** 1.80*** 1.92*** 1.81*** 1.92*** 1.80***SPCITL 0.52*** 0.37** 0.52** 0.37** 0.52*** 0.37**CHCIT 0.77*** 0.79*** 0.77*** 0.79*** 0.77*** 0.78***CHLDRN –0.72*** –0.72*** –0.72*** –0.72*** –0.72*** –0.72***SPSAME –0.64*** –0.65*** –0.64*** –0.65*** –0.64*** –0.65***SPLATER 0.47*** 0.48*** 0.47*** 0.48*** 0.47*** 0.48***OWNHOME 0.18*** 0.23*** 0.18*** 0.23*** 0.18*** 0.23***UNEMP –0.14 –0.16 –0.15 –0.16 –0.14 –0.16
Education GRADE8 –0.74*** –0.67*** –0.75*** –0.68*** –0.74*** –0.67***NOHS –0.34*** –0.32*** –0.35*** –0.33*** –0.34*** –0.32***SOMECOL 0.06*** 0.05*** 0.06*** 0.05*** 0.06*** 0.05***COLL 0.10*** 0.09*** 0.11*** 0.10*** 0.10*** 0.09***INC10–19 0.18*** 0.20*** 0.18*** 0.20*** 0.18*** 0.20***INC20–29 0.26*** 0.27*** 0.26*** 0.27*** 0.26*** 0.26***INC30–39 0.37*** 0.35*** 0.37*** 0.35*** 0.37*** 0.35***INC40–49 0.43*** 0.40*** 0.43*** 0.40*** 0.43*** 0.40***INC50UP 0.38*** 0.36*** 0.38*** 0.36*** 0.38*** 0.37***PUBAST –0.08 –0.18 –0.09 –0.19 –0.08 –0.19
Period of immigration interacted w/year PER70050 –1.13*** –1.11*** –1.16*** –1.14*** –1.13*** –1.11***PER75060 –0.91*** –0.89*** –0.92*** –0.89*** –0.92*** –0.89***PER76064 –0.93*** –0.91*** –0.90*** –0.87*** –0.93*** –0.90***PER76569 –0.58*** –0.62** –0.56** –0.59** –0.58** –0.62**PER77074 –0.70*** –0.66*** –0.67*** –0.62*** –0.69*** –0.65***PER77579 –0.76*** –0.74*** –0.74*** –0.72*** –0.74*** –0.73***
94
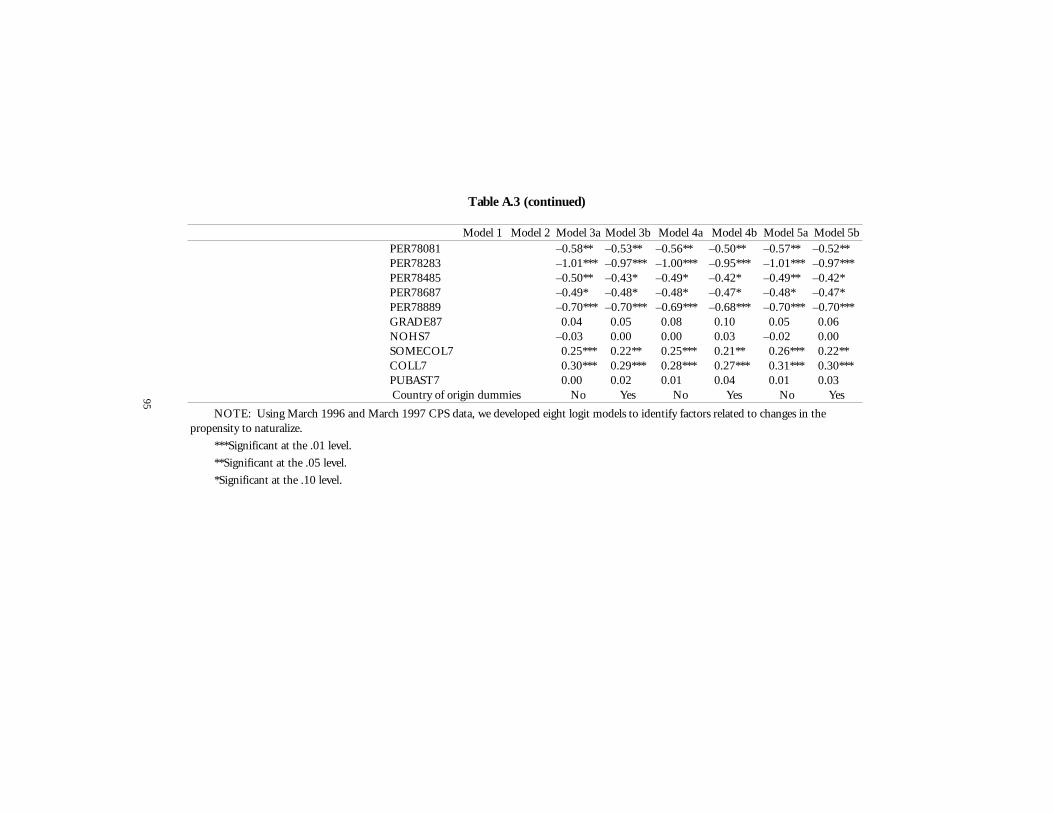
Table A.3 (continued)
Model 1 Model 2 Model 3a Model 3b Model 4a Model 4b Model 5a Model 5bPER78081 –0.58** –0.53** –0.56** –0.50** –0.57** –0.52**PER78283 –1.01*** –0.97*** –1.00*** –0.95*** –1.01*** –0.97***PER78485 –0.50** –0.43* –0.49* –0.42* –0.49** –0.42*PER78687 –0.49* –0.48* –0.48* –0.47* –0.48* –0.47*PER78889 –0.70*** –0.70*** –0.69*** –0.68*** –0.70*** –0.70***GRADE87 0.04 0.05 0.08 0.10 0.05 0.06NOHS7 –0.03 0.00 0.00 0.03 –0.02 0.00SOMECOL7 0.25*** 0.22** 0.25*** 0.21** 0.26*** 0.22**COLL7 0.30*** 0.29*** 0.28*** 0.27*** 0.31*** 0.30***PUBAST7 0.00 0.02 0.01 0.04 0.01 0.03Country of origin dummies No Yes No Yes No Yes
NOTE: Using March 1996 and March 1997 CPS data, we developed eight logit models to identify factors related to changes in thepropensity to naturalize.
***Significant at the .01 level.
**Significant at the .05 level.
*Significant at the .10 level.
95

96
Table A.4
Identifying Differences in Naturalization by California Counties, 1990 Census
Variable
Only theCounty
DummiesLength of
Stay
Length ofStay and
Education
Length of Stay,Education, English
Proficiency, andCountry of Origin Full Model
MERCED –0.7751*** –0.5533*** –0.2825*** –0.1128 –0.113IMPERIAL –0.7167*** –0.7938*** –0.5379*** –0.1074 –0.1107TULARE –0.6628*** –0.4808*** –0.1106* 0.1101 0.048SCRUZ –0.5898*** –0.5801*** –0.5521*** –0.4374*** –0.3368***FRESNO –0.544*** –0.3856*** –0.1346** 0.1006** 0.0525LA –0.3746*** –0.0448* –0.0465* –0.0176 0.0633*STANSLS –0.3739*** –0.2108*** –0.0522 0.0114 –0.1222MONTEREY –0.3553*** –0.2182*** –0.0913* –0.054 –0.0364RIVER –0.3087*** –0.2079*** –0.1714*** –0.0777* –0.0749KERN –0.2575*** –0.0405 0.2067*** 0.35*** 0.2446***VENTURA –0.2146*** –0.11*** –0.1644*** –0.092** –0.0449SANBERN –0.1739*** 0.0252 –0.00857 0.02 –0.0046SJOAQUIN –0.1137 –0.1348 –0.0142 –0.1572 –0.1726SBARBRA –0.0922* –0.0625 –0.0641 0.0393 0.1471**ORANGE –0.086*** 0.2809*** 0.1605*** 0.1108*** 0.1693SCLARA 0.0901** 0.4498*** 0.1832*** –0.0995*** –0.0534SDIEGO 0.0967*** 0.2842*** 0.1971*** 0.1479*** 0.178***SONOMA 0.1901** 0.0292 –0.1611* –0.1862** –0.2017**ALAMEDA 0.2529*** 0.5433*** 0.2992*** –0.0227 –0.0314SAC 0.2927*** 0.4542*** 0.3358*** 0.1056** 0.1347**SMATEO 0.3879*** 0.5733*** 0.3067*** 0.0402 0.0871*SF 0.4027*** 0.6592*** 0.5253*** 0.0902** 0.1706***CCOSTA 0.424*** 0.5921*** 0.2722** 0.077* 0.0438SOLANO 0.6701*** 0.8809*** 0.6438*** 0.2202*** 0.1864***
***Significant at the 1 percent level.
**Significant at the 5 percent level.
*Significant at the 10 percent level.
97
Appendix B
Response Rates to the PPIC Surveyof County Welfare Offices
In the late fall of 1997, PPIC conducted a phone survey with
respondents designated by each county welfare office in the state
concerning the citizenship and naturalization activities undertaken by the
welfare offices over the past year and the participation of legal
immigrants in county-run welfare programs.
Fifty-five county welfare offices participated in the survey. San
Diego, Tulare, and Stanislaus Counties did not. All fifty-five counties
that participated supplied information on the type of citizenship and
naturalization assistance provided by their offices. Fifty-three county
offices provided information on the level of funding devoted to those
services. Napa and San Joaquin Counties did not provide this
information.
Thirty-two counties (55 percent of all counties) provided usable,
recent statistics on legal immigrant AFDC (Aid to Families with

98
Dependent Children) recipients. For counties where this information
was not available, we imputed values by calculating the ratio of AFDC
recipients to noncitizen immigrants for all counties for which the data
were available, and then imputed the same share of noncitizen
immigrants to counties for which the AFDC information was not
available.

99
Appendix C
Matching of March CPS Records
The CPS March Supplement uses a rotation method whereby
households selected for sampling are interviewed for four consecutive
months, dropped from the sample for eight months, and then
reinterviewed for four more consecutive months. This method produces
an overlap of respondents by roughly 50 percent from year to year. To
not double-count records, we needed to remove this overlap for data
pooled from 1994 to 1997. To remove the overlap, we first had to
identify the matching sequence for a pair of CPS years. This was done
by essentially taking the month in survey value for a particular record in
the base year (t) and progressing it by 4 to arrive at the month in survey
value for that same record in the following year (t + 1). For example, if a
record in the 1994 CPS has a month in survey value of 1 then its
corresponding month in survey value in 1995 would be 5.
The next step was to identify corresponding records within the
possible match subsets. The CPS removes entire households from the

100
sample, and not individuals, even though data on each individual in the
household are recorded. The CPS does not use a unique personal
tracking number for each record throughout the two rotations. Thus,
matching person records is accomplished on the basis of personal
characteristics that do not change between rotations. The personal
characteristics chosen were household identification number, sex, race,
year of birth, relationship to household head, marital status, and
educational attainment.
Since our final sample eliminated children under the age of 18 and
full-time students, the last characteristic was not considered to be a
problem. The incidence of nonmatches with and without educational
attainment was under 1 percent of all records. It is possible that some
records were kept that showed a change in marital status and relationship
to household head; however, this effect is considered to be minimal since
many of those records were more likely to leave the household than stay
in another rotation (e.g., if a wife divorces her husband, she is more likely
to leave the sample than stay in). Other possibilities of missed records
include cohabitants who marry, identical twins over the age of 18, and
change in headship (e.g., the household head becomes the wife because
the husband leaves or dies). However, these occurrences were small and
the addition of restrictions were found to add more accuracy than non-
matches.
Finally, only two CPS year pairings were subjected to the overlap
removal process: 1994 with 1995, and 1996 with 1997. Matching is not
possible between March 1995 and March 1996 because the March 1996
file is based entirely on the 1990 census design sample.

101
References
Barken, E. R., and N. Khokhlow, “Socioeconomic Data as Indices ofNaturalization Patterns in the United States: A Theory Revisited,”Ethnicity, Vol. 7, 1980, pp. 159–190.
Bernard, W. S., “Cultural Determinants of Naturalization,” AmericanSociological Review, Vol. 1, 1936, pp. 943–953.
Blau, P. M., Inequality and Heterogeneity, The Free Press, New York,1977.
Branigin, William, “Reform Plan Due for INS,“ Los Angeles Times,February 9, 1998.
Dinnerstein, L., and D. M. Reimers, Ethnic Americans: A History ofImmigration and Assimilation, 2nd ed., Harper & Row Publishers,New York, 1982.
Hanna, M. T., “The Dynamics of Ethnic Boundaries on ModernStates,” in J. W. Mayer and Michael Hanna (eds.), NationalDevelopment and the World System, The University of ChicagoPress, Chicago, Illinois, 1979, pp. 253–275.
Hutchinson, E. P., The Legislative History of American Immigration Policy1798–1965, University of Pennsylvania, Philadelphia, 1981.
102
Immigration and Naturalization Service,1990 Statistical Yearbook, U.S.Government Printing Office, Washington, D.C., 1991.
Immigration and Naturalization Service,1994 Statistical Yearbook, U.S.Government Printing Office, Washington, D.C., 1995.
Immigration and Naturalization Service, 1996 Statistical Yearbook, U.S.Government Printing Office, Washington, D.C., 1997.
Jasso, G., and M. R. Rosenzweig, “Family Reunification and theImmigration Multiplier: U.S. Immigration Law, Origin-CountryConditions, and the Reproduction of Immigrants,” Demography,Vol. 23, 1986, pp. 291–311.
Jasso, G., and M. Rosenzweig, The New Chosen People: Immigrants in theUnited States, Russell Sage Foundation, New York, 1990.
Jeffe, Sherry Bebitch, “California Conservatism’s Worst NightmareRevealed,” Los Angeles Times, August 17, 1997.
Krassowski, W., “Naturalization and Assimilation-Proneness ofCalifornia Immigrant Population: A Statistical Study,”unpublished dissertation, Department of Sociology, University ofCalifornia, Los Angeles, 1963.
Liang, Zai, “Social Contact, Social Capital, and the NaturalizationProcess: Evidence from Six Immigrant Groups,” Social ScienceResearch, Vol. 23, 1994, pp. 407–437.
Mameesh, L., and B. Reyes, “Regional Variation of MexicanImmigration and Settlement,” Working Paper, Public PolicyInstitute of California, San Francisco, California, 1998.
Marston, W. G., and T. L. Van Valey, “The Role of ResidentialSegregation in the Assimilation Process,” The Annals, Vol. 441,1979, pp. 13–25.
Massey, D. S., and N. Denton, “Trends of the Residential Segregation ofBlacks, Hispanics, and Asians: 1970–1980,” American SociologicalReview, Vol. 52, 1987, pp. 802–825.

103
Massey, D. S., et al., Return to Aztlan: The Social Process of InternationalMigration to Western Mexico, University of California Press,Berkeley, 1987.
Moore, J., and H. Pachon, Hispanics in the United States, Prentice Hall,Inc., Englewood Cliffs, New Jersey, 1985.
National Immigration Law Center, Chart: States Providing Benefits toImmigration Under 1996 Welfare and Immigration Laws, 1998.
Olzak, S., “Contemporary Ethnic Mobilization,” Annual Review ofSociology, Vol. 9, 1983, pp. 355–374.
Pachon, H. P., “Naturalization: Determinants and Process in theHispanic Community: An Overview of Citizenship in theHispanic Community,” International Migration Review, Vol. 21,1985, pp. 299–309.
Passel, J. S., “Problems with March 1994 and 1995 CPS Weighting,”internal memorandum, The Urban Institute, Washington, D.C.,1996.
Passel, J. S., and K. A. Woodrow, “Geographic Distribution ofUndocumented Immigrants: Estimates of Undocumented AliensCounted in the 1980 Census by State,” International MigrationReview, Vol. 28, 1984, pp. 642–671.
Portes, A., “The Rise of Ethnicity: Determinants of Ethnic PerceptionAmong Cuban Exiles in Miami, American Sociological Review, Vol.49, 1984, pp. 383–397.
Portes, A., and R. Mozo, “The Political Adaptation Process of Cubansand Other Ethnic Minorities in the United States: A PreliminaryAnalysis,” International Migration Review, Vol. 21, 1985, pp. 352–371.
Portes, A., R. N. Parker, and J. A. Cobas, “Assimilation andConsciousness Perception of U.S. Society Among Recent LatinAmerican Immigrants in the United States,” Social Forces, Vol. 59,1980, pp. 200–224.

104
Reyes, B. I., Dynamics of Immigration: Return Migration to WesternMexico, Public Policy Institute of California, San Francisco, 1997.
Ueda, Reed, “Naturalization and Citizenship,” in Stephen Thernstrom(ed.), Harvard Encyclopedia of American Ethnic Groups, TheBelknap Press of Harvard University, Cambridge, Massachusetts,1980, pp. 734–748.
U.S. Commission on Immigration Reform, Becoming an American:Immigration and Immigrant Policy, Washington, D.C., 1997.
Warren, R., and J. S. Passel, “A Count of the Uncountable: Estimates ofUndocumented Aliens Counted in the 1980 United StatesCensus,” Demography, Vol. 24, 1987, pp. 357–393.
Yang, P. Q., “Examining Immigrant Naturalization,” InternationalMigration Review, Vol. 28, 1994a, pp. 449–477.
Yang, P. Q., “Ethnicity and Naturalization,” Ethnic and Racial Studies,Vol. 17, 1994b, pp. 593–618.

105
About the Authors
HANS P. JOHNSON
Hans Johnson is a research fellow at the Public Policy Institute ofCalifornia. His research interests include international and domesticmigration, population estimates and projections, state and localdemography, and adult literacy. He was previously the seniordemographer at the California Research Bureau, where he conductedresearch for the State Legislature and Governor's Office on populationissues, authoring several publications on migration. He has also workedas a demographer at the California Department of Finance, specializingin population projections. He holds a Ph.D. in demography from theUniversity of California, Berkeley.
BELINDA I. REYES
Belinda Reyes is a research fellow at the Public Policy Institute ofCalifornia. She was previously a post-doctoral fellow with the Researchand Training Program on Poverty, the Underclass, and Public Policy atthe University of Michigan. Her research interests include immigration,the economic progress of immigrants and subsequent generations, andpolicy issues relating to poverty and the underclass among ethnicminorities. She holds a Ph.D. in economics from the University ofCalifornia, Berkeley.
LAURA MAMEESH
Laura Mameesh is a research associate at the Public Policy Instituteof California. She has worked on studies that have examinedimmigration, income inequality, and economic development. She hasalso worked for Los Angeles Mayor Richard Riordan on a business taxrelief policy aimed at retaining targeted industries in Los Angeles. Heranalysis included calculating the cost to the city of providing tax relief aswell as researching the cost of doing business in Los Angeles comparedwith competitor cities. She holds a Master's degree in public policy fromthe University of Southern California.

106
ELISA BARBOUR
Elisa Barbour is a research assistant at the Public Policy Institute ofCalifornia. Before coming to PPIC, she worked on research studies thatexamined local labor markets, welfare reform, and urban poverty. Shealso worked for a trade union and for a number of community andadvocacy organizations. She holds a B.A. in political science fromOberlin College and a Master's in city planning from the University ofCalifornia, Berkeley.