taking tourism seriously for future economic development · tourism satellite account - tsa(2004 -...
TRANSCRIPT

Taking Tourism Seriously For Future Economic Development
The Irish Economy Conference: Learning from Crisis
25th February 2015 Institute of Banking
Professor Jim Deegan University of Limerick

Presentation Outline _____________________________________________________________________________________________
1. Brief introductory remarks
2. Some data on international tourism & comment on current & projected driving forces: technology is now a key driver
3. Performance of Irish Tourism
4. Tourism in Irish Policymaking
5. Conclusion

Some General Factors to Understand
Tourism is significantly affected by
innovations in other sectors
Creative industries being
linked with tourism is
becoming ever more important across the world
The impact of artificial
intelligence will impact on
the tourism labour market but just how?

__________________________________________________________________________________________________________________________________________________________________________________________________________________________________________________________________________________________
PERFORMANCE OF IRISH TOURISM Tourism Proves Yet Again A Good Bellwether For The Overall Economy
__________________________________________________________________________________________________________________________________________________________________________________________________________________________________________________________________________________________

THE QUARTERLY NATIONAL HOUSEHOLD SURVEY
2008Q3
2011Q1 2012Q4 2014Q3
All NACE
Economic Sectors 2,136.4
1,841.8 1,848.9 1,926.9
Agriculture, forestry and fishing (A)
112.5 83.2 90.0 109.7
Accommodation & food service activities (I)
135.5 110.7 118.3 139.8
Person aged 15 years and over in Employment (Thousand) by Sex, NACE Rev 2 Economic Sector and Quarter

World Tourism Arrivals (Millions): 1950 to 1995 and Forecast to 2020
Forecast Made in 1995
25 55 70 110165
210287 327
458564
697
1,018
1,600
0
200
400
600
800
1000
1200
1400
1600
1800
1950 1955 1960 1965 1970 1975 1980 1985 1990 1995 2000 2010 2020
*Actual Arrivals in 2010 Were 940 million

Tourist Arrivals Market Share
1980
2012
2030
Arrivals to Europe: 1980=180m 2012=520m 2030=720m(f)

2030 Predictions Number of International Tourists (mn)
Actual 2014 arrivals 1.14billion
Central prediction for 2030 1,800 (↑ 74%)
Prediction for 2030 with slower economic growth
1,400 (↑ 35%)
Prediction for 2030 with higher costs of transport
1,660 (↑ 60%)
Prediction for 2030 with lower costs of transport
2,000 (↑ 93%)
adapted from UNWTO
Emerging Markets Will Play a Key Role In Tourism Across The World

Total Overseas Visitors to Ireland
0
1,000
2,000
3,000
4,000
5,000
6,000
7,000
8,000
9,000
1960 1963 1966 1969 1972 1975 1978 1981 1984 1987 1990 1993 1996 1999 2002 2005 2008 2011 2014*
Tou
rist
nu
mb
ers
(0
00
's)
Total Overseas Visitors to Ireland (000's)
No. of Visitors

Total Overseas Nominal/Real Revenue 1986-2013 (1986 = Base Year)
0.0
500.0
1,000.0
1,500.0
2,000.0
2,500.0
3,000.0
3,500.0
4,000.0
4,500.0
REV
ENU
E (M
ILLI
ON
S)
YEAR
Nominal
Real

Annual Percentage (%) Change in Overseas Visitors
1986 1987 1988 1989 1990 1991 1992 1993 1994 1995
11.5 15.6 15.6 10.4 -1.5 4.0 5.5 9.0 15.0
1996 1997 1998 1999 2000 2001 2002 2003 2004 2005
10.7 6.9 10.5 7.4 4.0 -5.5 1.4 4.4 3.3 5.9
2006 2007 2008 2009 2010 2011 2012 2013 2014 Total Change
9.7 4.3 -3.9 -11.5 -9.6 5.0 0.8 6.3
9.5 289.3


0
200
400
600
800
1,000
1,200
1,400
1,600
1,800
2,000
2003 2004 2005 2006 2007 2008 2009 2010 2011 2012 2013
Vis
ito
r N
um
be
rs (
oo
o's
)
Year
Main Purpose of Visit: Britain
Holiday
VFR
Business
Other

Comments on Economic Impact
Poor representation of tourism in the national accounts left void to be filled by numerous “Panglossian” economic impact assessments - often by “hired guns”.
From 1990s more “conservative/realistic estimates” produced by Tansey in particular. Nonetheless, the “unusual” nature of the statistical make up arrested serious engagement by officials in Department of Finance - political expediency rather than strong argument led to funding of the sector.
Tourism Satellite Account - TSA(2004 - Deegan et al) pilot gave an employment estimate that was far less than that being quoted by DAST at the time-what was overlooked was the insights on what tourism accounted for in related industries.
Failure to adopt standard UN recommended methodology of a Tourism Satellite Account in Ireland is a significant failing.

Tourism industries accounted for 197,000 persons employed - 12% of all enterprises in Ireland and 11% of all employment
Affected by the downturn since 2007 but more resilient than other sectors
The regions of the North West, West and South West most dependent on tourism for economic activity
A negative pay gap of 35% in tourism compared to other sectors but most likely overestimated because of nature and structure of tourism employment
Tourism employs more females, young people and immigrants than other sectors of the economy
Delaney & McFeally 2015 – Innovative Use of Business Registers

Innovation and Performance in Irish Tourism: An Agenda For Action
Deegan (Forthcoming 2015)
Between 2008-11/12 it was found that 53% of tourism firms introduced one of the 4 measured elements defined as innovation-Product, Process, Marketing or Organisational Innovation(s)
47% of firms open declare no innovation over the period
Study finds very different rates of innovation by sub sector of tourism for the main areas measured in tourism innovation studies
The barriers to innovation similar to Irish industry in general and some particular problems
The “ecosystem” to stimulate tourism innovation is weak

Category of Innovation
(n=395)
n %
Product 183 46
Process 142 36
Organisational 162 28
Marketing 112 41
Any Innovation 211 53
Type of Innovation Introduced By Tourism Enterprises 2008 to 2012

Detailed Innovation Activity Rates By Enterprise Sector,
2008 – 2012 Sector Product Process Organisational Marketing All
enterprises
Hotel/Guesthouse 60 48 47 55 65
B&B 31 24 8 25 33
Self-Catered 32 21 9 14 36
Restaurant/Licensed
Trade
59 47 34 44 69
Tourist Attraction 50 40 35 50 60
Transport Company* 83 67 67 100 100
Festival
Management
42 42 42 42 50
ITO/DMC/PCO 44 29 24 44 53
Total 46 36 28 41 53

Detailed Type of Innovation Activity By Company Size,
2008 – 2012
Type of Activity Micro
<9
(n=282)
Small
(10-49)
(n=74)
Medium
(50-250)
(n=39)
All
enterprises
(n=395)
Product 42 42 86 46
Process 30 38 73 36
Organisational 21 41 60 28
Marketing 35 43 81 41
Any Innovation 48 53 92 53
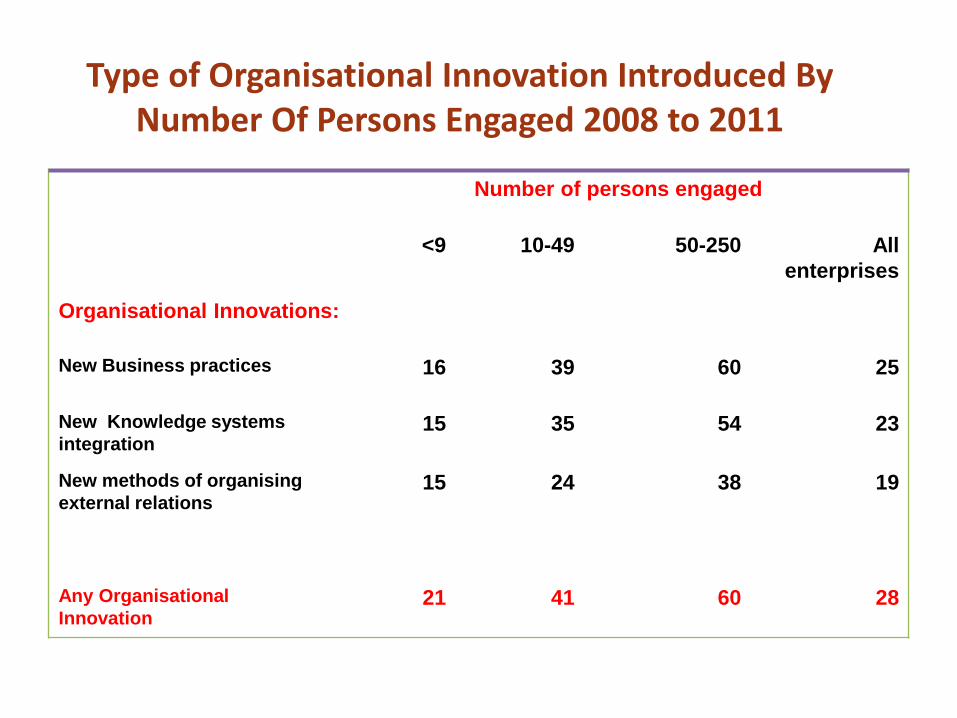
Type of Organisational Innovation Introduced By Number Of Persons Engaged 2008 to 2011
Number of persons engaged
<9 10-49 50-250 All
enterprises
Organisational Innovations:
New Business practices 16 39 60 25
New Knowledge systems
integration 15 35 54 23
New methods of organising
external relations 15 24 38 19
Any Organisational
Innovation 21 41 60 28

Type Of Cooperation Partner By Size Of Enterprise,
2008 – 2011 Number of Persons Engaged
<9 10-49 50-250 Total
Other enterprises within tourism
sector
34 42 58 39
Suppliers of equipment 21 26 21 22
Consultants 7 12 19 10
Clients or Customers 32 39 32 34
Competitors 24 31 30 26
Universities/Colleges 13 29 24 18
Government 12 22 22 15
Failte Ireland 38 40 50 40
Tourism Ireland 15 12 17 15
Any Co-Operation 30 40 63 35

Tourism Does Not Feature In Any Serious Way In National Policymaking For Innovation In
IRELAND Do You Need Proof?

Government Policy: Action Plan For Jobs 14 Areas Identified By Research Prioritisation Report of November 2011
The 14 priority areas are listed below and form the vital components on which Ireland’s future prosperity is being staked. Research/Competence Centres are established and funded following this broad architecture. • Priority Area A - Future Networks & Communications • Priority Area B - Data Analytics, Management, Security & Privacy • Priority Area C - Digital Platforms, Content & Applications • Priority Area D - Connected Health and Independent Living • Priority Area E - Medical Devices • Priority Area F – Diagnostics • Priority Area G - Therapeutics: Synthesis, Formulation, Processing and Drug Delivery • Priority Area H - Food for Health • Priority Area I - Sustainable Food Production and Processing • Priority Area J – Marine Renewable Energy • Priority Area K - Smart Grids & Smart Cities • Priority Area L - Manufacturing Competitiveness • Priority Area M - Processing Technologies and Novel Materials • Priority Area N-Innovation in Services and Business Processes

Rev €m
2002 Prices
2002
Actual
2006
Target
2006
Actual
2012
Target
2012
Actual
Overseas Visitor
Spend
3088 3835 3.80 6000 2.95
No Visitors (m)
Britain 3.5 4.1 3.82 5.5 2.72
M.Europe 1.4 1.7 2.25 2.3 2.24
N.America 0.8 1.0 1.03 1.8 .94
Other Areas 0.2 0.3 0.31 0.5 .43
Total 5.9 7.0 7.41 10.0 6.686
OVERSEAS REVENUE AND VISITOR NUMBER TARGETS FROM TOURISM POLICY REVIEW GROUP 2003 COMPARED WITH ACTUAL OUTCOMES
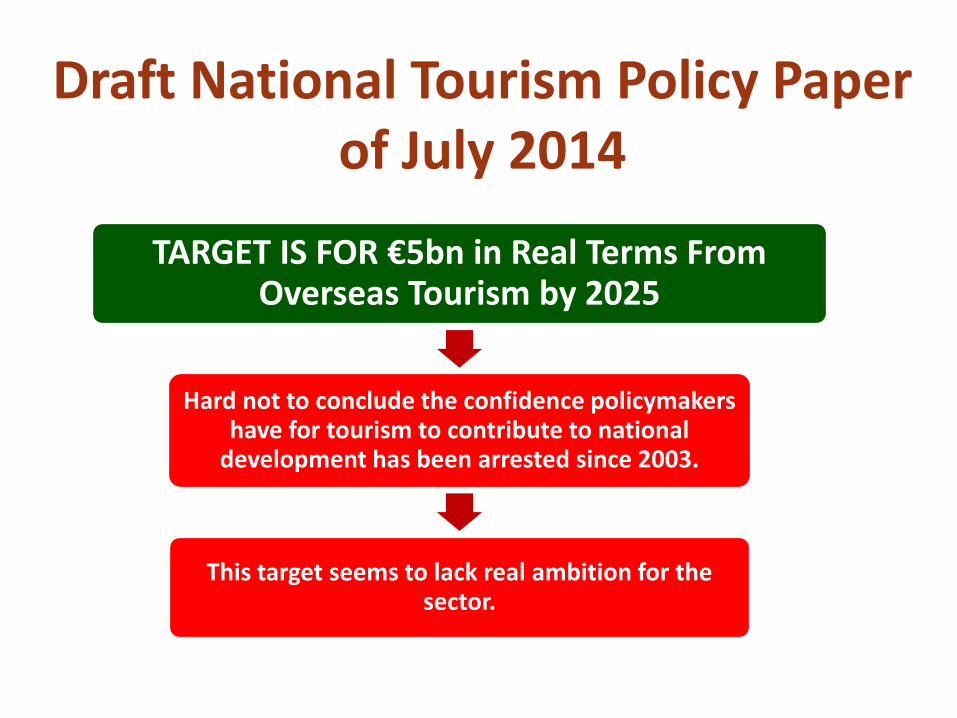
Draft National Tourism Policy Paper of July 2014
TARGET IS FOR €5bn in Real Terms From Overseas Tourism by 2025
Hard not to conclude the confidence policymakers have for tourism to contribute to national
development has been arrested since 2003.
This target seems to lack real ambition for the sector.

:
A more in depth understanding of what the sector contributes (Building a Tourism Satellite Account)
Building on Ireland’s advantages to link tourism and Creative Industries (OECD,2014)
Recognising that ICT and tourism are more entwined than ever and we need to study what opportunities and challenges this will engender-AirBNB -UBer
Recognising that tourism is more likely than other sectors to maintain and grow employment as artificial intelligence expands its reach
Dedicate resources to research the future of tourism for Ireland----”


MAYBE SOMETHING RADICAL LIKE THIS!


THANK YOU FOR YOUR ATTENTION