talent pressures and the aging workforce - boston college · employment as an imperative for the...
TRANSCRIPT
Talent Pressures and the Aging Workforce:
Stephen Sweet, PhD and Marcie Pitt-Catsouphes, PhDwith Elyssa Besen, Shoghik Hovhannisyan, MA, and Farooq Pasha, MA
Industry Sector Report 3.1–June 2010
Responsive Action Steps for the Retail Trade SectorResponsive Action Steps for the Retail Trade Sector
The Sloan Center on Aging & Work at Boston College promotes quality of employment as an imperative for the 21st century multi-generational workforce. The Center integrates evidence from research with insights from workplace experiences to inform innovative organizational decision-making. Collaborating with business leaders and scholars in a multi-disciplinary dialogue, the Center develops the next generation of knowledge and talent management.
The Sloan Center on Aging & Work is grateful for the continued support of the Alfred P. Sloan Foundation.
1The Sloan Center on Aging & Work
The Industry and Aging Workforce Series
The Sloan Center on Aging & Work initiated the Talent Pressures and Aging Workforce Industry Report Series to help employers (and others interested in the aging of the workforce) understand the unique and emerging talent pressures within the leading sectors of the U.S. economy: Accommodation and Food Services; Administration and Support, Waste Management and Remediation Services; Construction; Finance and Insurance; Health Care and Social Assistance; Manufacturing; Professional, Scientific and Tehnical Services; Retail Trade; Transportation and Warehousing; and Wholesale Trade. The reports are designed to offer succinct accounts of five overarching concerns:
What are the contours of employment in the industry and how do they 1. compare to employment in other sectors?How might employee preferences inform strategies of retaining key talent 2. in the industry?How does the age and gender composition of the workforce map onto 3. talent loss risks for employers? What methods do employers in the industry rely on to understand 4. talent loss risks?What steps can employers use to attract and engage talent?5.
The report provides comparisons across time (1998-2008) and between economic sectors. Aging and workforce diversity is also considered.
Our analysis relies on three sources of data:
Information about the U.S. workforce as reported by the United States Bureau πof Labor Statistics,
Information about workers’ experiences as reported in the General Social πSurvey, and
Information about U.S. organizations gathered by the Sloan Center on πAging & Work’s 2009 Talent Management Study.
We anticipate that this information can help employers:
Reflect on the adequacy of workplace practices, π
Identify ways to become more age responsive, and π
Consider strategies that might better align workplace practices with escalating πpressures and opportunities that a diverse and aging workforce may pose for their enterprises.
Each report in this series concludes by considering steps that employers can take to become more responsive to the needs of a diverse and aging workforce.
2 http://www.bc.edu/agingandwork
Table of Contents
Executive Summary 3
Overview of Employment & Compensation in the Retail Sector 5
Employment and Compensation 6
Worker Compensation 8
Worker Composition 8 Essential Occupations 10 Summary 14
Perceptions & Experiences of Employees in the Retail Sector 15 Work Incentives & Organizational Commitment 16 Work-Family Conflict 20 Flexible Work Options & Inclusion in Decision-Making 24 Summary 28
Organizational Responses in the Retail Sector to a Diverse, Multi-Generational Workforce 29
Age Pressure, Talent Needs & Talent Loss Risks 30 Assessment 34 Recruitment & Career Development 35 Flexible Workplace Practices 37 Summary 40
Conclusion—Transferring Knowledge to Action in the Retail Sector 41
Appendix 1.1: Age/Economic Pressure Map 42
Appendix 2.1: General Social Survey (GSS) 47
Appendix 2.2: Sample Size, Distributions and GSS Item Comparisons 49
Appendix 3.1: The Talent Management Study 51
Appendix 3.2: Age Demographics 53
Appendix 3.3: Talent Loss Risks 54
Appendix 3.4: Risk Assessment of Talent Loss in the Retail Sector 55
Appendix 3.5: Talent Management Action Steps in the Retail Sector 56
Appendix 3.6: Entire Talent Management Study Sample, by Sector 58
3The Sloan Center on Aging & Work
Executive Summary
The past decade witnessed profound changes in the economic pressures placed on employers, as well as in age demographics of their labor forces. Like the changes regarding the inclusion of women in organizations and professions in the latter part of the 20th century, the aging of the population has the potential to reshape not only who works, but also how work can be performed.
We advise that employers consider the data presented in this report to better understand what employees desire, as well as the variation in talent management practices evident within (and beyond) the retail sector.
In comparison to other sectors, the retail sector’s demographic profile is disproportionately composed of younger workers. However, with the aging of society, retail employers can anticipate more of their clientele being in older age groups, and the employment of older workers may be a strategic means for providing services to a growing demographic. This may require rethinking longstanding workplace practices. Additionally, the data we present suggest that older workers may facilitate the creation of a positive work environment, as they are more likely to report higher levels of job satisfaction than younger employees.
Our analysis reveals that many retailers have only a limited knowledge of their workforce. Their talent management strategies can benefit immensely by understanding factors – beyond financial compensation – that could attract replacement workers, stem turnover, and facilitate knowledge transfer. Labor turnover for employers operating in this sector can be high, and the likelihood of worker dissatisfaction with their jobs is higher than in other sectors. Work-family conflicts are quite common, and can distract workers from their jobs. In comparison to other sectors, retailers are about as likely to integrate flexible work arrangements in their organizational designs, but they also
4 http://www.bc.edu/agingandwork
commonly exclude employees from decision-making activities that could influence how jobs are scheduled and performed. Increasing workplace flexibility, along with addressing other key interests of employees, can be a means of securing the best workers who possess the best skills.
5The Sloan Center on Aging & Work
Overview of Employment & Compensation in the Retail Trade Sector
introductionAccording to the U.S. Census Bureau, the retail trade sector (NAICS 44-45):
“ … comprises establishments engaged in retailing merchandise, generally without transformation, and rendering services incidental to the sale of merchandise. The retailing process is the final step in the distribution of merchandise; retailers are, therefore, organized to sell merchandise in small quantities to the general public. This sector comprises two main types of retailers: store and non-store retailers. 1. Store retailers operate fixed point-of-sale locations, located and designed to attract a high volume of walk-in customers. In general, retail stores have extensive displays of merchandise and use mass-media advertising to attract customers. They typically sell merchandise to the general public for personal or household consumption, but some also serve business and institutional clients. In addition to retailing merchandise, some types of store retailers are also engaged in the provision of after-sales services, such as repair and installation. 2. Non-store retailers, like store retailers, are organized to serve the general public, but their retailing methods differ. The establishments of this subsector reach customers and market merchandise with methods, such as the broadcasting of “infomercials,” the broadcasting and publishing of direct-response advertising, the publishing of paper and electronic catalogs, door-to-door solicitation, in-home demonstration, selling from portable stalls (street vendors, except food), and distribution through vending machines.”
Key Points:
The 2008-2009 economic downturn had a significant negative impact on the retail 1. trade sector and its employees.
Although the compensation2. 1 costs for most employers rose over the period of 2004-2008 (on average by 9.1% in all industries), there was only a 1.2% increase in the retail trade sector over the same period.
There was no substantial change in the total number of establishments in the 3. retail trade sector over the period of 2000-2006; however, there was an increase in the number of large establishments and a decline in smaller establishments.
Men and women are nearly equally represented in the retail trade sector, but they 4. are not equally represented in all types of jobs within the sector.
The percentage of workers in the retail sector aged 55-64 increased significantly 5. from 2000-2007, while the proportion of workers over age 65 remained fairly stable.
6 http://www.bc.edu/agingandwork
employment and compensation
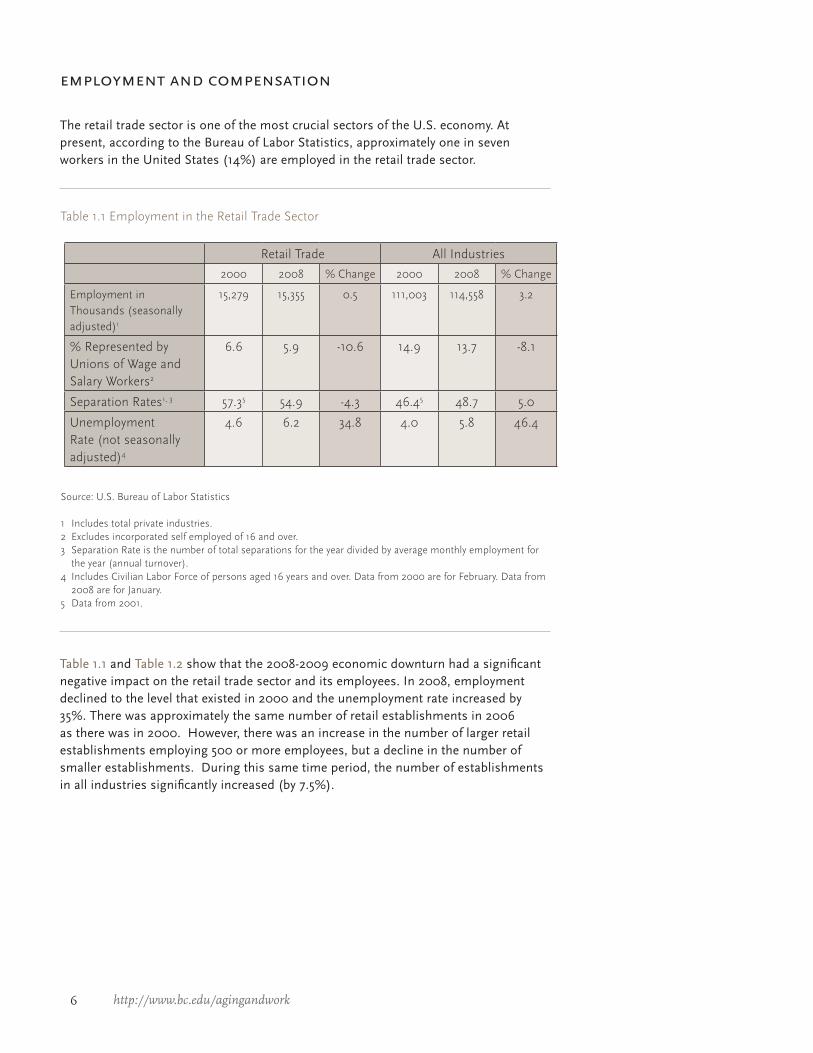
The retail trade sector is one of the most crucial sectors of the U.S. economy. At present, according to the Bureau of Labor Statistics, approximately one in seven workers in the United States (14%) are employed in the retail trade sector.
Table 1.1 Employment in the Retail Trade Sector
Table 1.1 and Table 1.2 show that the 2008-2009 economic downturn had a significant negative impact on the retail trade sector and its employees. In 2008, employment declined to the level that existed in 2000 and the unemployment rate increased by 35%. There was approximately the same number of retail establishments in 2006 as there was in 2000. However, there was an increase in the number of larger retail establishments employing 500 or more employees, but a decline in the number of smaller establishments. During this same time period, the number of establishments in all industries significantly increased (by 7.5%).
Retail Trade All Industries
2000 2008 % Change 2000 2008 % Change
Employment in Thousands (seasonally adjusted)1
15,279 15,355 0.5 111,003 114,558 3.2
% Represented by Unions of Wage and Salary Workers2
6.6 5.9 -10.6 14.9 13.7 -8.1
Separation Rates1, 3 57.35 54.9 -4.3 46.45 48.7 5.0
Unemployment Rate (not seasonally adjusted)4
4.6 6.2 34.8 4.0 5.8 46.4
Source: U.S. Bureau of Labor Statistics
1 Includes total private industries. 2 Excludes incorporated self employed of 16 and over. 3 Separation Rate is the number of total separations for the year divided by average monthly employment for
the year (annual turnover). 4 Includes Civilian Labor Force of persons aged 16 years and over. Data from 2000 are for February. Data from
2008 are for January.5 Data from 2001.
7The Sloan Center on Aging & Work
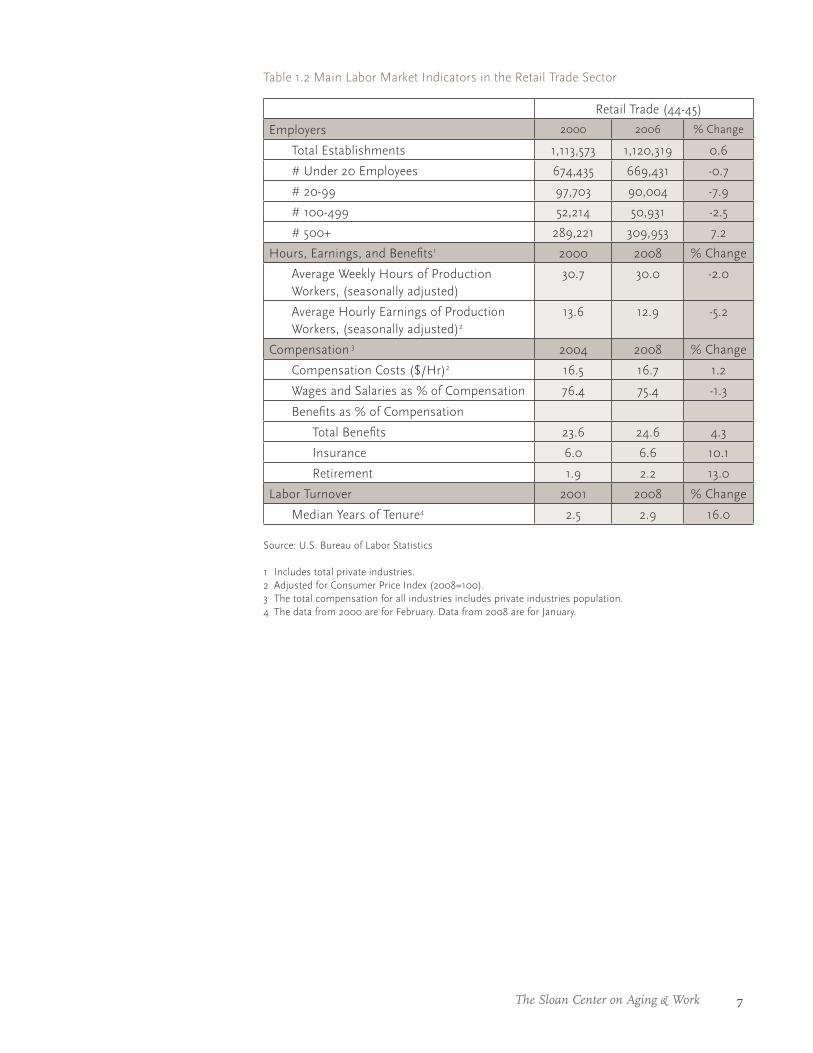
Table 1.2 Main Labor Market Indicators in the Retail Trade Sector
Retail Trade (44-45)
Employers 2000 2006 % Change
Total Establishments 1,113,573 1,120,319 0.6
# Under 20 Employees 674,435 669,431 -0.7
# 20-99 97,703 90,004 -7.9
# 100-499 52,214 50,931 -2.5
# 500+ 289,221 309,953 7.2
Hours, Earnings, and Benefits1 2000 2008 % Change
Average Weekly Hours of Production Workers, (seasonally adjusted)
30.7 30.0 -2.0
Average Hourly Earnings of Production Workers, (seasonally adjusted)2
13.6 12.9 -5.2
Compensation 3 2004 2008 % Change
Compensation Costs ($/Hr)2 16.5 16.7 1.2
Wages and Salaries as % of Compensation 76.4 75.4 -1.3
Benefits as % of Compensation
Total Benefits 23.6 24.6 4.3
Insurance 6.0 6.6 10.1
Retirement 1.9 2.2 13.0
Labor Turnover 2001 2008 % Change
Median Years of Tenure4 2.5 2.9 16.0
Source: U.S. Bureau of Labor Statistics
1 Includes total private industries.2 Adjusted for Consumer Price Index (2008=100). 3 The total compensation for all industries includes private industries population.4 The data from 2000 are for February. Data from 2008 are for January.
8 http://www.bc.edu/agingandwork
workforce composition
About 7% of the workers in the retail trade sector belonged to unions in 2000, compared to 15% of the same indicator for all industries. Union membership declined both in the retail trade sector (by about 11%) and in all industries (by about 8%) from 1998-2008. The compensation1 costs for most employers increased on average by 9% in all industries over the period of 2004-2008, however, minimal changes (only 1%) were observable in the retail trade sector.
In addition, the compensation costs and the benefits available in the retail trade sector in 2008 were much lower than the average in other industries. Shifts in benefits, as part of employer expenditures, were significant over the past decade. For example, the share of insurance covered by the employer increased both in the retail trade and in all industries by 10% and 8%, respectively, over the period of 2004-2008. Retirement payments as a percentage of compensation costs significantly increased in the retail trade sector (by about 13%), while staying fairly constant for employers operating in most sectors.
worker compensation
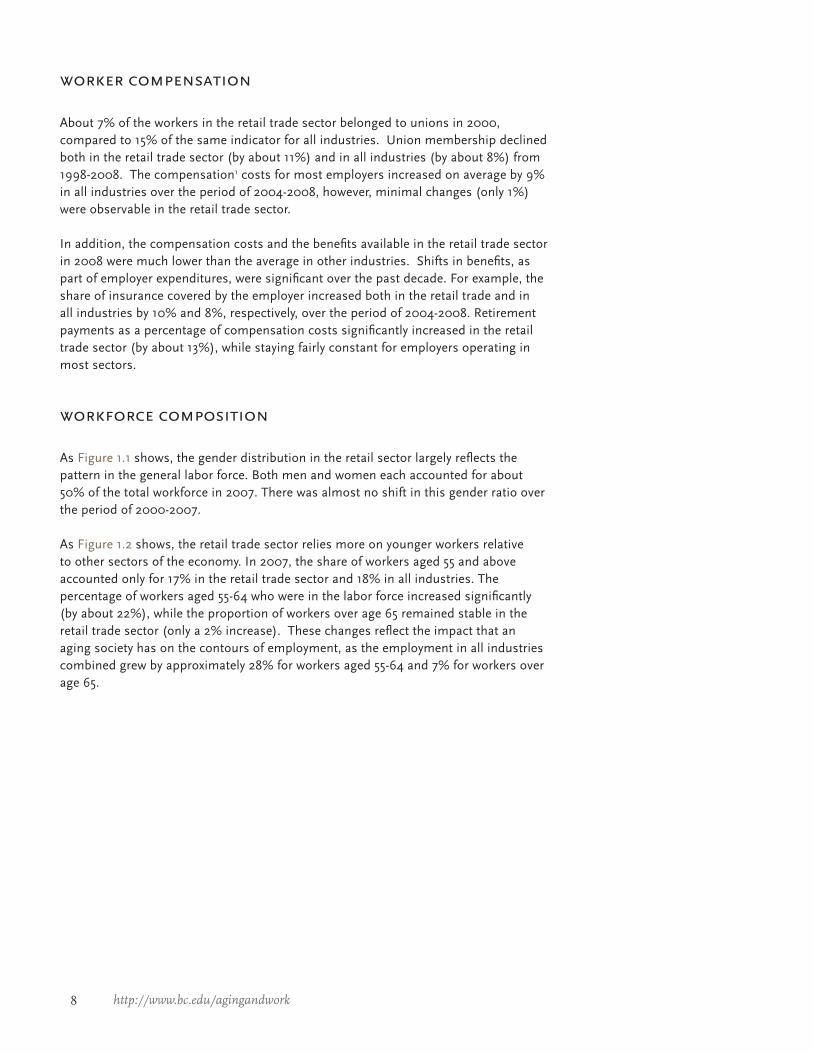
As Figure 1.1 shows, the gender distribution in the retail sector largely reflects the pattern in the general labor force. Both men and women each accounted for about 50% of the total workforce in 2007. There was almost no shift in this gender ratio over the period of 2000-2007.
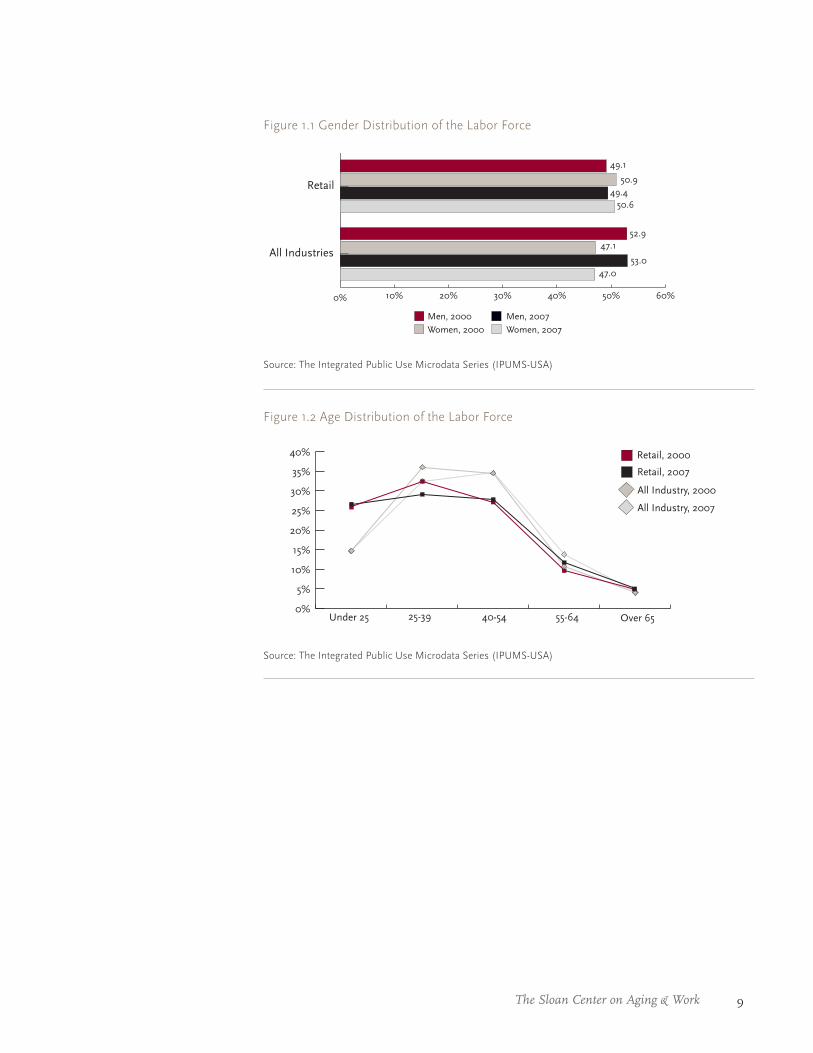
As Figure 1.2 shows, the retail trade sector relies more on younger workers relative to other sectors of the economy. In 2007, the share of workers aged 55 and above accounted only for 17% in the retail trade sector and 18% in all industries. The percentage of workers aged 55-64 who were in the labor force increased significantly (by about 22%), while the proportion of workers over age 65 remained stable in the retail trade sector (only a 2% increase). These changes reflect the impact that an aging society has on the contours of employment, as the employment in all industries combined grew by approximately 28% for workers aged 55-64 and 7% for workers over age 65.
9The Sloan Center on Aging & Work
Figure 1.1 Gender Distribution of the Labor Force
Source: The Integrated Public Use Microdata Series (IPUMS-USA)
0% 10% 20% 30% 40% 50% 60%
All Industries
50.9
49.1
17.2
Retail
47.053.0
47.152.9
50.649.4
Men, 2000Women, 2007Men, 2007
Women, 2000
Figure 1.2 Age Distribution of the Labor Force
Source: The Integrated Public Use Microdata Series (IPUMS-USA)
0%
5%
10%
15%
20%
25%
30%
35%
40% Retail, 2000
Retail, 2007
25-39Under 25
All Industry, 2007
All Industry, 2000
Age
Over 6555-6440-54
10 http://www.bc.edu/agingandwork
Retail Salespersons
Retrieved from the Bureau of Labor Statistics 2010-2011 Occupational
Outlook Handbook
Whether selling shoes, computer equipment, or automobiles, retail salespersons assist customers in finding what they are looking for. They also try to increase sales by describing a product’s features, demonstrating its uses, and promoting its value. In addition to selling, many retail salespersons—especially those who work in department and apparel stores—conduct financial transactions with their customers. This usually involves receiving payments by cash, check, debit card, or credit card; operating cash registers; and bagging or packaging purchases. Depending on the hours they work, retail salespersons may have to open or close cash registers. This work may include counting the money in the register and separating charge slips, coupons, and exchange vouchers. Retail salespersons also may have to make deposits at a cash office.
About 34 percent of retail salespersons worked part time in 2008. Part-time opportunities may vary by setting, however, as many who sell big-ticket items are required to work full time. There usually are no formal education requirements for retail sales positions, but employers often prefer applicants with a high school diploma or its equivalent. This may be especially important for those who sell technical products or “big-ticket” items, such as electronics or automobiles. A college degree may be required for management trainee positions, especially in larger retail establishments. Most retail salespersons receive on-the-job training, which usually lasts anywhere from a few days to a few months. The largest employers were clothing and clothing accessories stores, department stores, building material and supplies dealers, motor vehicle and parts dealers, and general merchandise stores such as warehouse clubs and supercenters. In addition, about 156,500 retail salespersons were self-employed.
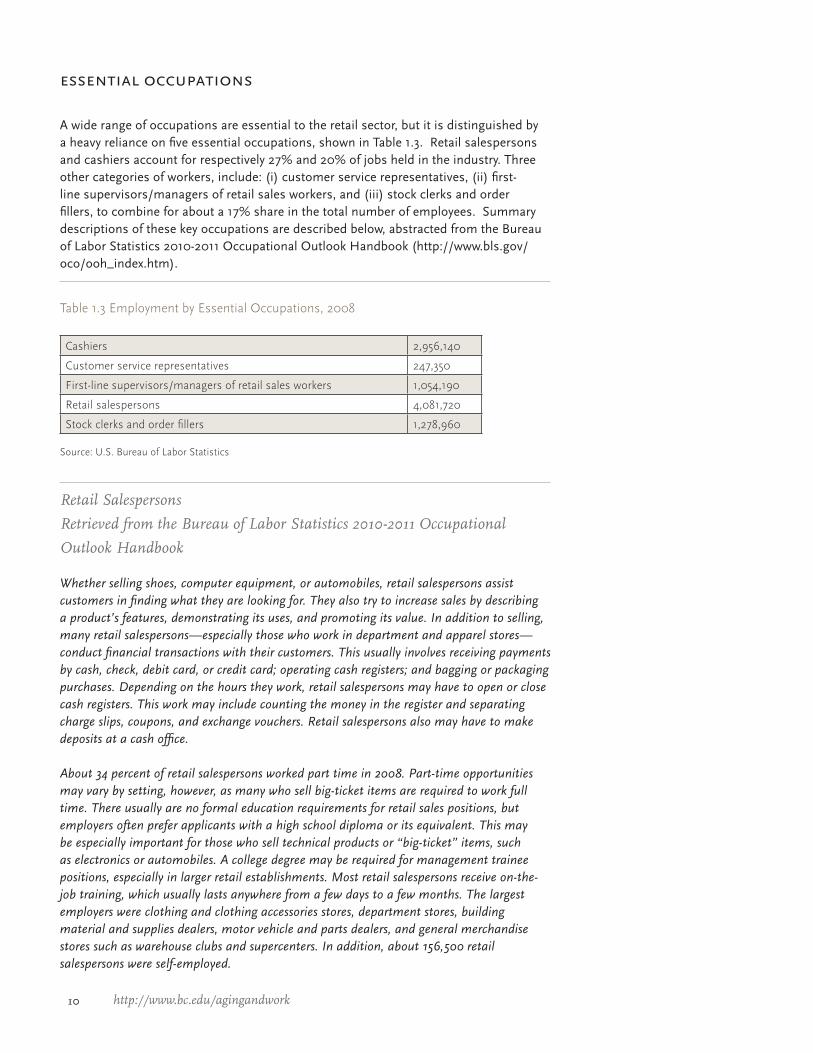
Table 1.3 Employment by Essential Occupations, 2008
Source: U.S. Bureau of Labor Statistics
essential occupations
A wide range of occupations are essential to the retail sector, but it is distinguished by a heavy reliance on five essential occupations, shown in Table 1.3. Retail salespersons and cashiers account for respectively 27% and 20% of jobs held in the industry. Three other categories of workers, include: (i) customer service representatives, (ii) first-line supervisors/managers of retail sales workers, and (iii) stock clerks and order fillers, to combine for about a 17% share in the total number of employees. Summary descriptions of these key occupations are described below, abstracted from the Bureau of Labor Statistics 2010-2011 Occupational Outlook Handbook (http://www.bls.gov/oco/ooh_index.htm).
Cashiers 2,956,140
Customer service representatives 247,350
First-line supervisors/managers of retail sales workers 1,054,190
Retail salespersons 4,081,720
Stock clerks and order fillers 1,278,960
11The Sloan Center on Aging & Work
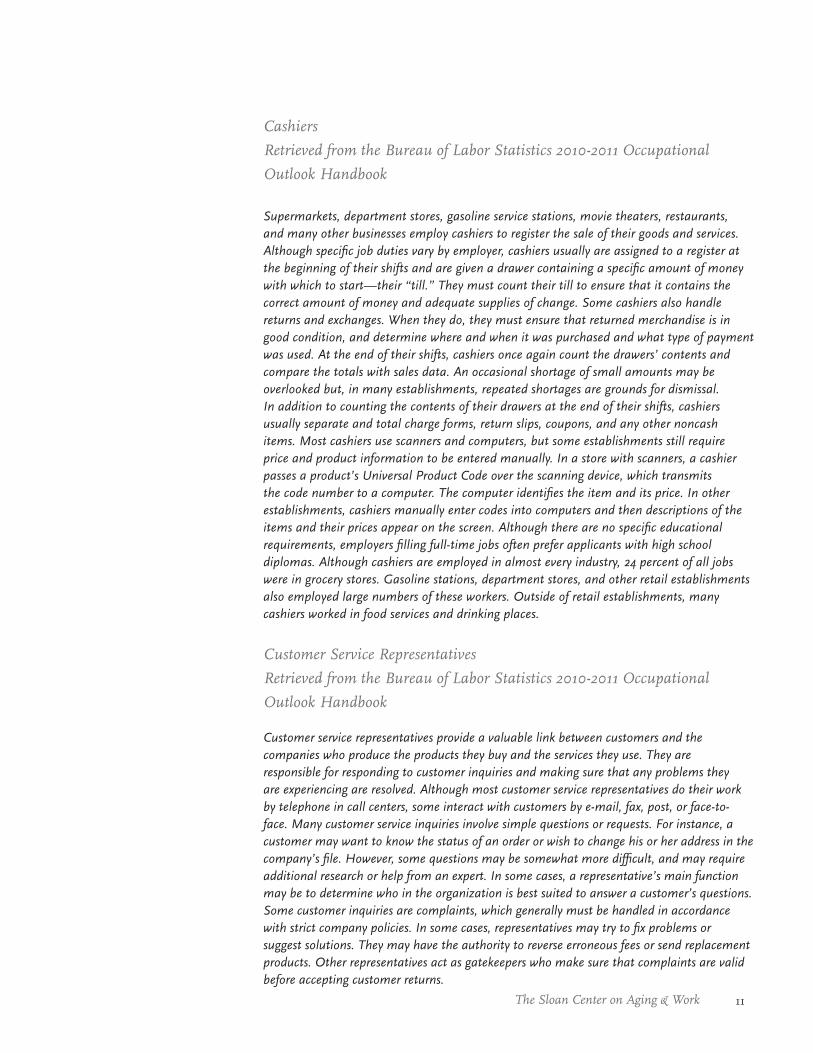
Cashiers
Retrieved from the Bureau of Labor Statistics 2010-2011 Occupational
Outlook Handbook
Supermarkets, department stores, gasoline service stations, movie theaters, restaurants, and many other businesses employ cashiers to register the sale of their goods and services. Although specific job duties vary by employer, cashiers usually are assigned to a register at the beginning of their shifts and are given a drawer containing a specific amount of money with which to start—their “till.” They must count their till to ensure that it contains the correct amount of money and adequate supplies of change. Some cashiers also handle returns and exchanges. When they do, they must ensure that returned merchandise is in good condition, and determine where and when it was purchased and what type of payment was used. At the end of their shifts, cashiers once again count the drawers’ contents and compare the totals with sales data. An occasional shortage of small amounts may be overlooked but, in many establishments, repeated shortages are grounds for dismissal. In addition to counting the contents of their drawers at the end of their shifts, cashiers usually separate and total charge forms, return slips, coupons, and any other noncash items. Most cashiers use scanners and computers, but some establishments still require price and product information to be entered manually. In a store with scanners, a cashier passes a product’s Universal Product Code over the scanning device, which transmits the code number to a computer. The computer identifies the item and its price. In other establishments, cashiers manually enter codes into computers and then descriptions of the items and their prices appear on the screen. Although there are no specific educational requirements, employers filling full-time jobs often prefer applicants with high school diplomas. Although cashiers are employed in almost every industry, 24 percent of all jobs were in grocery stores. Gasoline stations, department stores, and other retail establishments also employed large numbers of these workers. Outside of retail establishments, many cashiers worked in food services and drinking places.
Customer Service Representatives
Retrieved from the Bureau of Labor Statistics 2010-2011 Occupational
Outlook Handbook
Customer service representatives provide a valuable link between customers and the companies who produce the products they buy and the services they use. They are responsible for responding to customer inquiries and making sure that any problems they are experiencing are resolved. Although most customer service representatives do their work by telephone in call centers, some interact with customers by e-mail, fax, post, or face-to-face. Many customer service inquiries involve simple questions or requests. For instance, a customer may want to know the status of an order or wish to change his or her address in the company’s file. However, some questions may be somewhat more difficult, and may require additional research or help from an expert. In some cases, a representative’s main function may be to determine who in the organization is best suited to answer a customer’s questions. Some customer inquiries are complaints, which generally must be handled in accordance with strict company policies. In some cases, representatives may try to fix problems or suggest solutions. They may have the authority to reverse erroneous fees or send replacement products. Other representatives act as gatekeepers who make sure that complaints are valid before accepting customer returns.
12 http://www.bc.edu/agingandwork
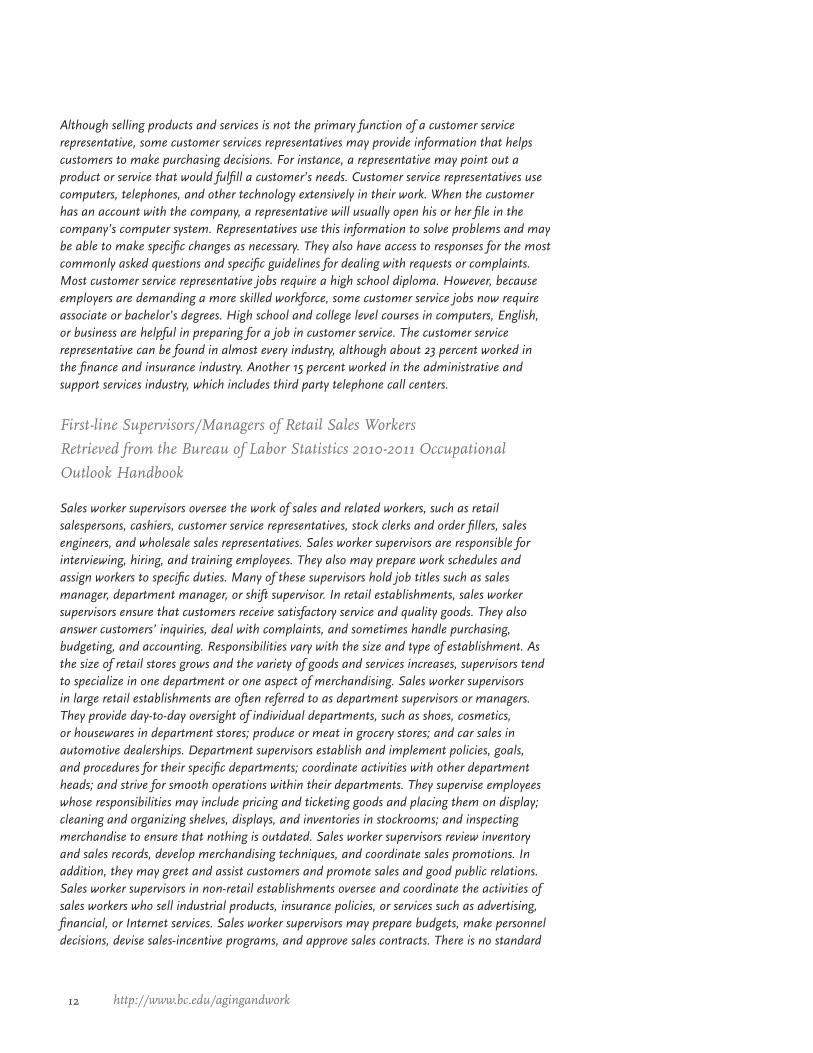
Although selling products and services is not the primary function of a customer service representative, some customer services representatives may provide information that helps customers to make purchasing decisions. For instance, a representative may point out a product or service that would fulfill a customer’s needs. Customer service representatives use computers, telephones, and other technology extensively in their work. When the customer has an account with the company, a representative will usually open his or her file in the company’s computer system. Representatives use this information to solve problems and may be able to make specific changes as necessary. They also have access to responses for the most commonly asked questions and specific guidelines for dealing with requests or complaints. Most customer service representative jobs require a high school diploma. However, because employers are demanding a more skilled workforce, some customer service jobs now require associate or bachelor’s degrees. High school and college level courses in computers, English, or business are helpful in preparing for a job in customer service. The customer service representative can be found in almost every industry, although about 23 percent worked in the finance and insurance industry. Another 15 percent worked in the administrative and support services industry, which includes third party telephone call centers.
First-line Supervisors/Managers of Retail Sales Workers
Retrieved from the Bureau of Labor Statistics 2010-2011 Occupational
Outlook Handbook
Sales worker supervisors oversee the work of sales and related workers, such as retail salespersons, cashiers, customer service representatives, stock clerks and order fillers, sales engineers, and wholesale sales representatives. Sales worker supervisors are responsible for interviewing, hiring, and training employees. They also may prepare work schedules and assign workers to specific duties. Many of these supervisors hold job titles such as sales manager, department manager, or shift supervisor. In retail establishments, sales worker supervisors ensure that customers receive satisfactory service and quality goods. They also answer customers’ inquiries, deal with complaints, and sometimes handle purchasing, budgeting, and accounting. Responsibilities vary with the size and type of establishment. As the size of retail stores grows and the variety of goods and services increases, supervisors tend to specialize in one department or one aspect of merchandising. Sales worker supervisors in large retail establishments are often referred to as department supervisors or managers. They provide day-to-day oversight of individual departments, such as shoes, cosmetics, or housewares in department stores; produce or meat in grocery stores; and car sales in automotive dealerships. Department supervisors establish and implement policies, goals, and procedures for their specific departments; coordinate activities with other department heads; and strive for smooth operations within their departments. They supervise employees whose responsibilities may include pricing and ticketing goods and placing them on display; cleaning and organizing shelves, displays, and inventories in stockrooms; and inspecting merchandise to ensure that nothing is outdated. Sales worker supervisors review inventory and sales records, develop merchandising techniques, and coordinate sales promotions. In addition, they may greet and assist customers and promote sales and good public relations. Sales worker supervisors in non-retail establishments oversee and coordinate the activities of sales workers who sell industrial products, insurance policies, or services such as advertising, financial, or Internet services. Sales worker supervisors may prepare budgets, make personnel decisions, devise sales-incentive programs, and approve sales contracts. There is no standard
13The Sloan Center on Aging & Work
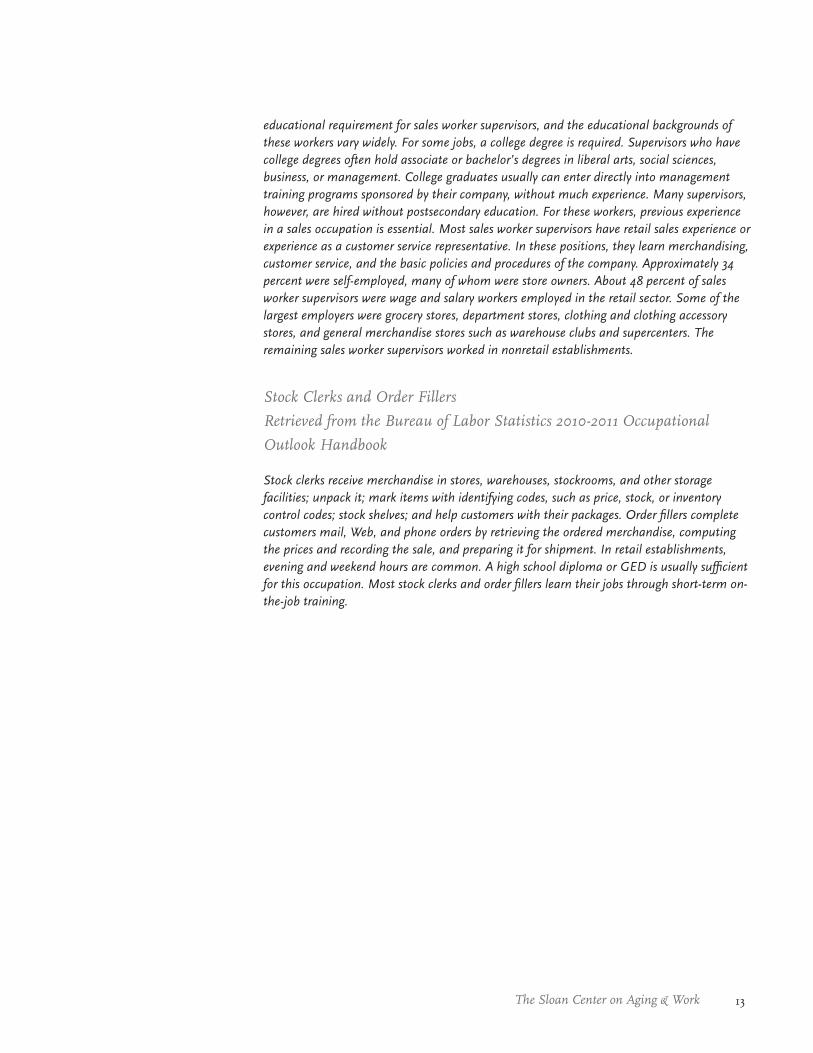
educational requirement for sales worker supervisors, and the educational backgrounds of these workers vary widely. For some jobs, a college degree is required. Supervisors who have college degrees often hold associate or bachelor’s degrees in liberal arts, social sciences, business, or management. College graduates usually can enter directly into management training programs sponsored by their company, without much experience. Many supervisors, however, are hired without postsecondary education. For these workers, previous experience in a sales occupation is essential. Most sales worker supervisors have retail sales experience or experience as a customer service representative. In these positions, they learn merchandising, customer service, and the basic policies and procedures of the company. Approximately 34 percent were self-employed, many of whom were store owners. About 48 percent of sales worker supervisors were wage and salary workers employed in the retail sector. Some of the largest employers were grocery stores, department stores, clothing and clothing accessory stores, and general merchandise stores such as warehouse clubs and supercenters. The remaining sales worker supervisors worked in nonretail establishments.
Stock Clerks and Order Fillers
Retrieved from the Bureau of Labor Statistics 2010-2011 Occupational
Outlook Handbook
Stock clerks receive merchandise in stores, warehouses, stockrooms, and other storage facilities; unpack it; mark items with identifying codes, such as price, stock, or inventory control codes; stock shelves; and help customers with their packages. Order fillers complete customers mail, Web, and phone orders by retrieving the ordered merchandise, computing the prices and recording the sale, and preparing it for shipment. In retail establishments, evening and weekend hours are common. A high school diploma or GED is usually sufficient for this occupation. Most stock clerks and order fillers learn their jobs through short-term on-the-job training.
14 http://www.bc.edu/agingandwork
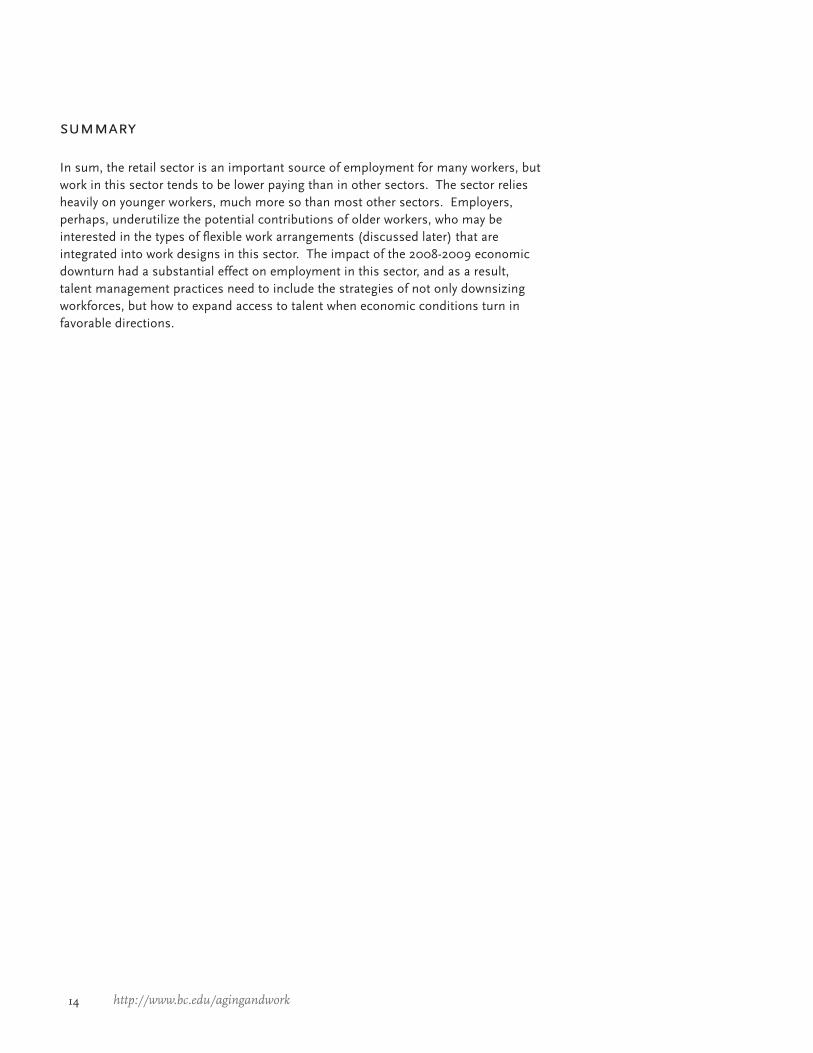
summary
In sum, the retail sector is an important source of employment for many workers, but work in this sector tends to be lower paying than in other sectors. The sector relies heavily on younger workers, much more so than most other sectors. Employers, perhaps, underutilize the potential contributions of older workers, who may be interested in the types of flexible work arrangements (discussed later) that are integrated into work designs in this sector. The impact of the 2008-2009 economic downturn had a substantial effect on employment in this sector, and as a result, talent management practices need to include the strategies of not only downsizing workforces, but how to expand access to talent when economic conditions turn in favorable directions.
15The Sloan Center on Aging & Work
Perspectives & Experiences of Employees in the Retail Trade Sector
One of the most fundamental steps in managing talent is approaching employees from a “whole person” approach: understanding that jobs fit into the lives of individuals in diverse and complex ways. To help understand these dynamics as they map onto
the retail trade sector, we examined data from the 1998-2008 General Social Survey.2 These data are analyzed by age and gender to underscore how employees’ interests and capacities to engage in work vary throughout the life course. This multi-dimensional analysis can facilitate greater understandings of the aspects of work that can attract a diverse workforce, as well as the features of jobs that may lead to talent losses. We also considered how different aspects of workplace practices and job designs can shape employee commitments to employers and their work. The relationships between work incentives and organizational commitments, work-family conflicts, flexible work options, and inclusion in decision-making are also discussed.
introduction
Key Points:
The typical worker in the retail trade sector takes pride in his/her work and is 1. willing to work hard for their employer. However, they are significantly less likely to have this perspective compared to employees in other sectors. Most would consider leaving their current jobs for another with higher pay.
Within the retail trade sector, younger and middle-aged employees put significantly 2. more importance on having a high paying job compared with older employees. Also, women in the retail trade sector are more likely to value a job that has flexible hours compared to men. Women in the retail trade sector also want to have a job that contributes to society.
Two in five employees (40%) in the retail trade sector come home from work too 3. tired to take care of their household chores at least several times a month. One in five employees (22%) in the retail trade sector report that it is difficult to fulfill family responsibilities because of their job at least several times a month.
One in three younger employees (35%) in the retail trade sector find that it is 4. difficult to fulfill family responsibilities because of their job.
Nearly one in two men (48%) and women (44%) in the retail trade sector run out 5. of time before getting things done on their jobs.
Retail trade employers appear to be less invested in developing talent than 6. employers in other sectors, as fewer than one in four retail trade workers are engaged in decision-making task forces (22%). Only one in three employees in the retail trade sector have received formal training from their employers (36%), and slightly greater than one in four workers are involved in self- managed teams (27%). These rates are considerably lower in comparison to the talent management practices in other sectors.
16 http://www.bc.edu/agingandwork
work incentives and organizational commitment
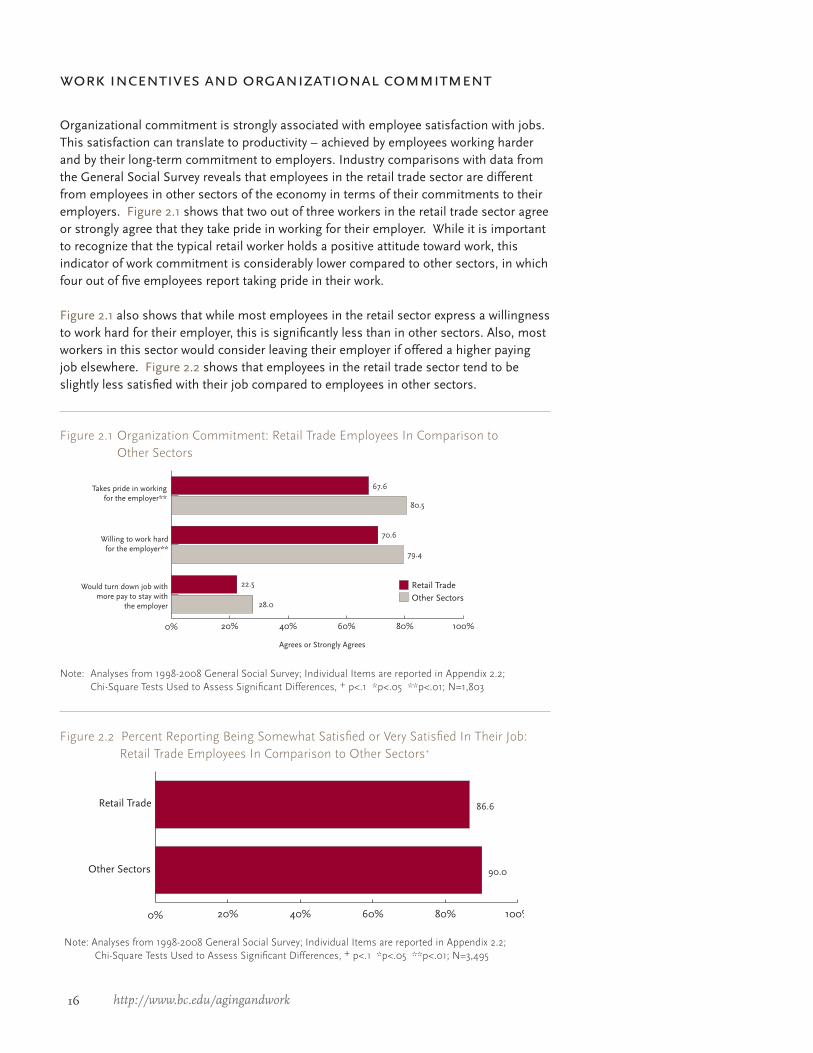
Organizational commitment is strongly associated with employee satisfaction with jobs. This satisfaction can translate to productivity – achieved by employees working harder and by their long-term commitment to employers. Industry comparisons with data from the General Social Survey reveals that employees in the retail trade sector are different from employees in other sectors of the economy in terms of their commitments to their employers. Figure 2.1 shows that two out of three workers in the retail trade sector agree or strongly agree that they take pride in working for their employer. While it is important to recognize that the typical retail worker holds a positive attitude toward work, this indicator of work commitment is considerably lower compared to other sectors, in which four out of five employees report taking pride in their work.
Figure 2.1 also shows that while most employees in the retail sector express a willingness to work hard for their employer, this is significantly less than in other sectors. Also, most workers in this sector would consider leaving their employer if offered a higher paying job elsewhere. Figure 2.2 shows that employees in the retail trade sector tend to be slightly less satisfied with their job compared to employees in other sectors.
Figure 2.1 Organization Commitment: Retail Trade Employees In Comparison to Other Sectors
Note: Analyses from 1998-2008 General Social Survey; Individual Items are reported in Appendix 2.2; Chi-Square Tests Used to Assess Significant Differences, + p<.1 *p<.05 **p<.01; N=1,803
0% 20% 40% 60% 80% 100%
28.0
67.6
79.4
Takes pride in workingfor the employer**
Willing to work hardfor the employer**
Would turn down job withmore pay to stay with
the employer
Agrees or Strongly Agrees
Retail TradeOther Sectors
80.5
70.6
22.5
Figure 2.2 Percent Reporting Being Somewhat Satisfied or Very Satisfied In Their Job: Retail Trade Employees In Comparison to Other Sectors+
Note: Analyses from 1998-2008 General Social Survey; Individual Items are reported in Appendix 2.2; Chi-Square Tests Used to Assess Significant Differences, + p<.1 *p<.05 **p<.01; N=3,495
0% 20% 40% 60% 80% 100%
86.6
90.0Other Sectors
Retail Trade
17The Sloan Center on Aging & Work
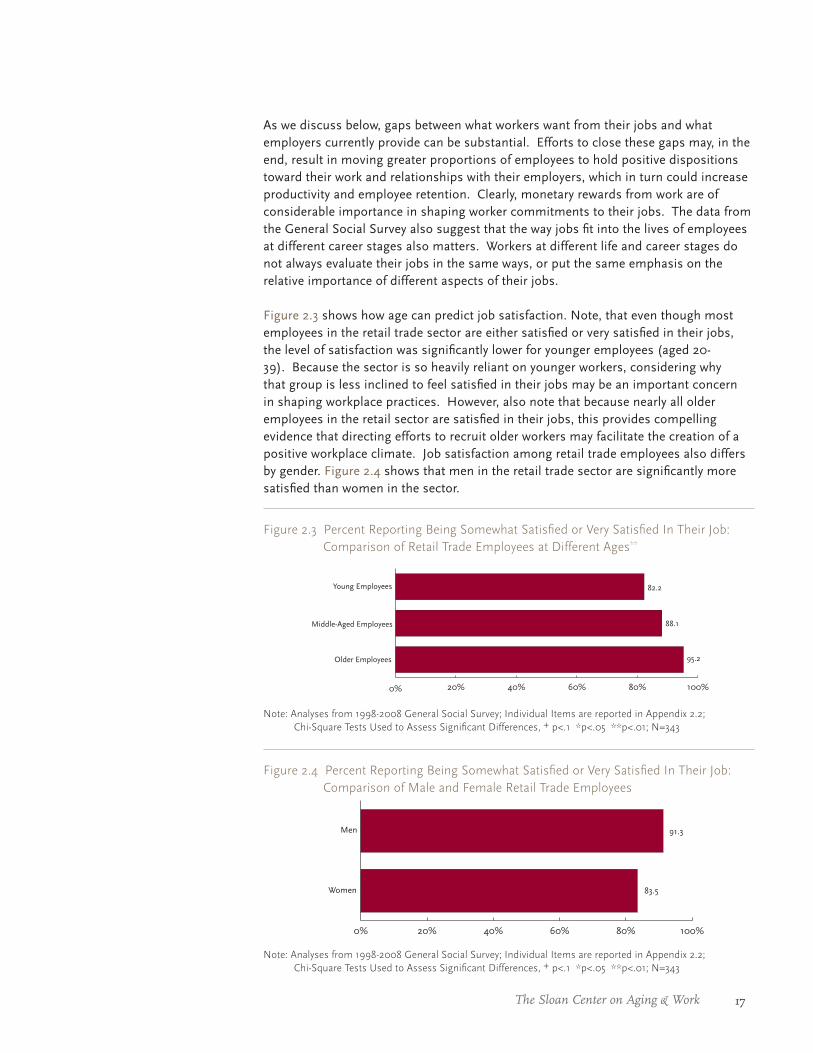
Figure 2.3 Percent Reporting Being Somewhat Satisfied or Very Satisfied In Their Job: Comparison of Retail Trade Employees at Different Ages**
Note: Analyses from 1998-2008 General Social Survey; Individual Items are reported in Appendix 2.2; Chi-Square Tests Used to Assess Significant Differences, + p<.1 *p<.05 **p<.01; N=343
0% 20% 40% 60% 80% 100%
82.2
95.2Older Employees
Young Employees
Middle-Aged Employees 88.1
As we discuss below, gaps between what workers want from their jobs and what employers currently provide can be substantial. Efforts to close these gaps may, in the end, result in moving greater proportions of employees to hold positive dispositions toward their work and relationships with their employers, which in turn could increase productivity and employee retention. Clearly, monetary rewards from work are of considerable importance in shaping worker commitments to their jobs. The data from the General Social Survey also suggest that the way jobs fit into the lives of employees at different career stages also matters. Workers at different life and career stages do not always evaluate their jobs in the same ways, or put the same emphasis on the relative importance of different aspects of their jobs.
Figure 2.3 shows how age can predict job satisfaction. Note, that even though most employees in the retail trade sector are either satisfied or very satisfied in their jobs, the level of satisfaction was significantly lower for younger employees (aged 20-39). Because the sector is so heavily reliant on younger workers, considering why that group is less inclined to feel satisfied in their jobs may be an important concern in shaping workplace practices. However, also note that because nearly all older employees in the retail sector are satisfied in their jobs, this provides compelling evidence that directing efforts to recruit older workers may facilitate the creation of a positive workplace climate. Job satisfaction among retail trade employees also differs by gender. Figure 2.4 shows that men in the retail trade sector are significantly more satisfied than women in the sector.
Figure 2.4 Percent Reporting Being Somewhat Satisfied or Very Satisfied In Their Job: Comparison of Male and Female Retail Trade Employees
0% 20% 40% 60% 80% 100%
91.3
83.5Women
Men
Note: Analyses from 1998-2008 General Social Survey; Individual Items are reported in Appendix 2.2; Chi-Square Tests Used to Assess Significant Differences, + p<.1 *p<.05 **p<.01; N=343
18 http://www.bc.edu/agingandwork
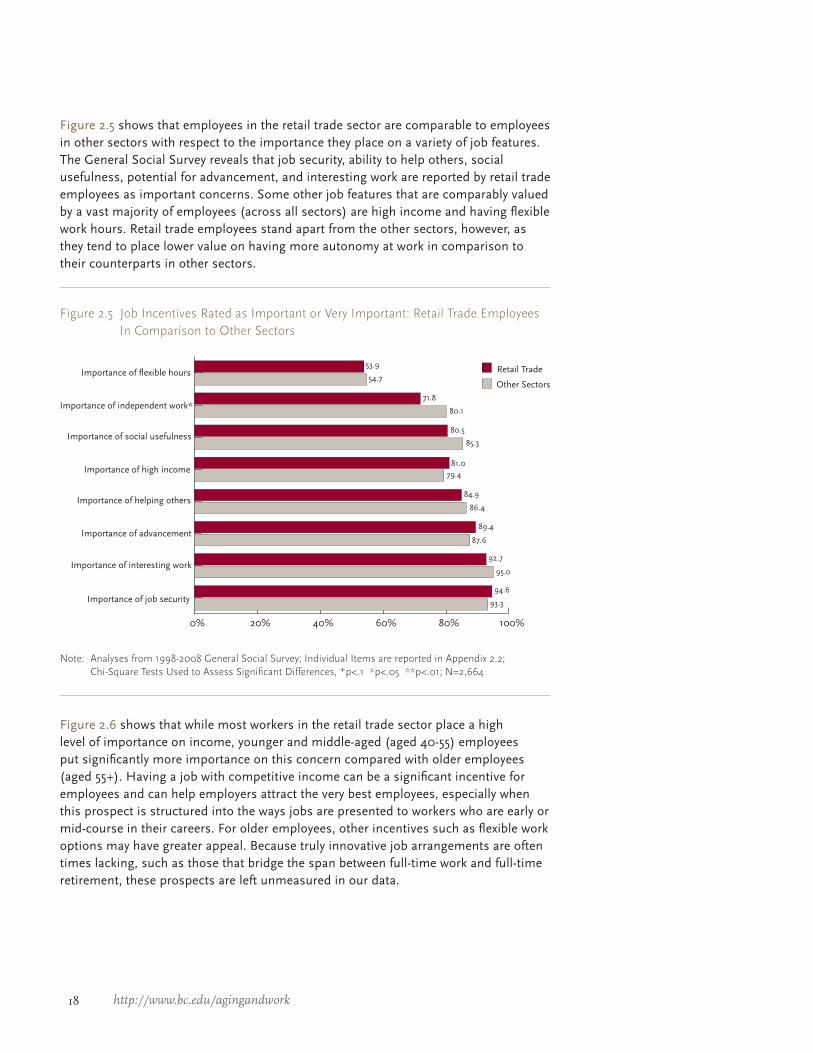
Figure 2.5 Job Incentives Rated as Important or Very Important: Retail Trade Employees In Comparison to Other Sectors
Note: Analyses from 1998-2008 General Social Survey; Individual Items are reported in Appendix 2.2; Chi-Square Tests Used to Assess Significant Differences, +p<.1 *p<.05 **p<.01; N=2,664
Figure 2.5 shows that employees in the retail trade sector are comparable to employees in other sectors with respect to the importance they place on a variety of job features. The General Social Survey reveals that job security, ability to help others, social usefulness, potential for advancement, and interesting work are reported by retail trade employees as important concerns. Some other job features that are comparably valued by a vast majority of employees (across all sectors) are high income and having flexible work hours. Retail trade employees stand apart from the other sectors, however, as they tend to place lower value on having more autonomy at work in comparison to their counterparts in other sectors.
0% 20% 40% 60% 80% 100%
Retail Trade
Other SectorsImportance of flexible hours
Importance of job security
Importance of interesting work
Importance of advancement
Importance of helping others
Importance of high income
Importance of social usefulness
Importance of independent work*
53.9
71.8
80.1
80.5
85.3
81.079.4
86.4
84.9
89.4
87.6
92.7
95.0
94.6
93.3
54.7
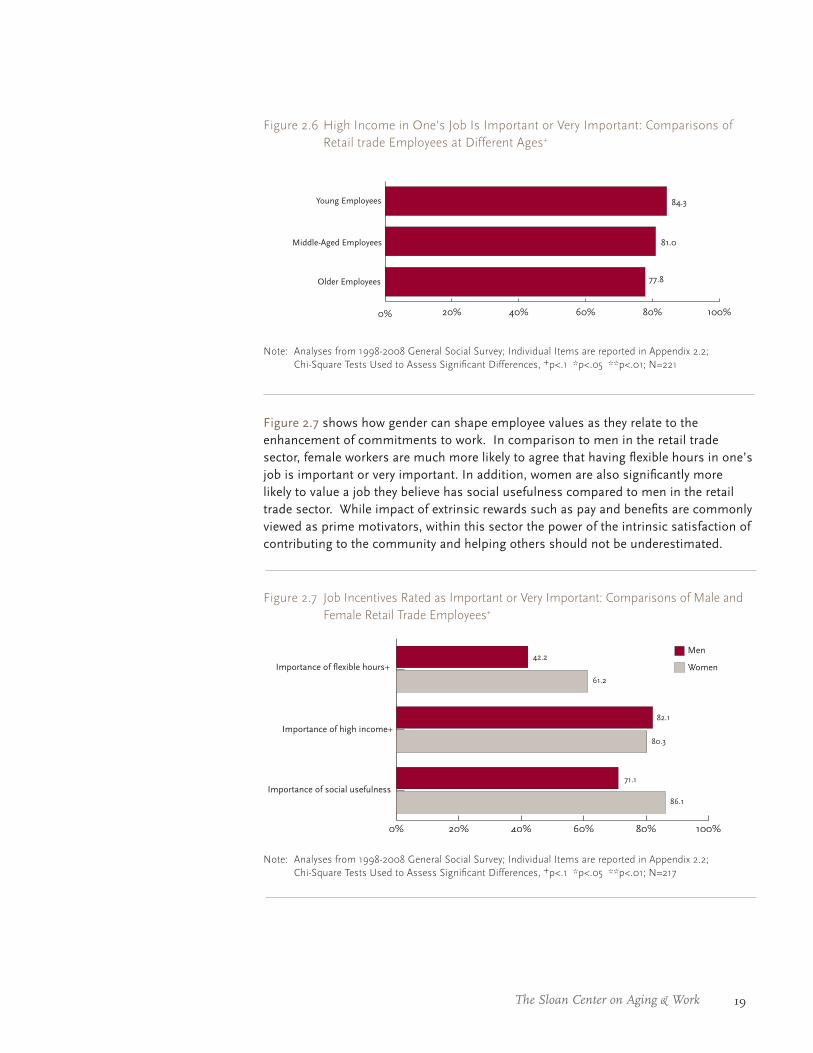
Figure 2.6 shows that while most workers in the retail trade sector place a high level of importance on income, younger and middle-aged (aged 40-55) employees put significantly more importance on this concern compared with older employees (aged 55+). Having a job with competitive income can be a significant incentive for employees and can help employers attract the very best employees, especially when this prospect is structured into the ways jobs are presented to workers who are early or mid-course in their careers. For older employees, other incentives such as flexible work options may have greater appeal. Because truly innovative job arrangements are often times lacking, such as those that bridge the span between full-time work and full-time retirement, these prospects are left unmeasured in our data.
19The Sloan Center on Aging & Work
Figure 2.6 High Income in One’s Job Is Important or Very Important: Comparisons of Retail trade Employees at Different Ages+
Note: Analyses from 1998-2008 General Social Survey; Individual Items are reported in Appendix 2.2; Chi-Square Tests Used to Assess Significant Differences, +p<.1 *p<.05 **p<.01; N=221
0% 20% 40% 60% 80% 100%
84.3
77.8Older Employees
Young Employees
Middle-Aged Employees 81.0
Figure 2.7 shows how gender can shape employee values as they relate to the enhancement of commitments to work. In comparison to men in the retail trade sector, female workers are much more likely to agree that having flexible hours in one’s job is important or very important. In addition, women are also significantly more likely to value a job they believe has social usefulness compared to men in the retail trade sector. While impact of extrinsic rewards such as pay and benefits are commonly viewed as prime motivators, within this sector the power of the intrinsic satisfaction of contributing to the community and helping others should not be underestimated.
Figure 2.7 Job Incentives Rated as Important or Very Important: Comparisons of Male and Female Retail Trade Employees+
Note: Analyses from 1998-2008 General Social Survey; Individual Items are reported in Appendix 2.2; Chi-Square Tests Used to Assess Significant Differences, +p<.1 *p<.05 **p<.01; N=217
0% 20% 40% 60% 80% 100%
71.1
Importance of flexible hours+
80.3
86.1
61.2
42.2
82.1
Importance of high income+
Importance of social usefulness
Women
Men
20 http://www.bc.edu/agingandwork
0% 10% 20% 30% 40% 50%
39.5
Difficult to concentrate on workbecause of family
19.5
40.7
7.5
10.5
21.9Difficult to fulfill family
responsibilities because of work*
Come home from worktoo tired to do household chores
Other Sectors
Retail Trade
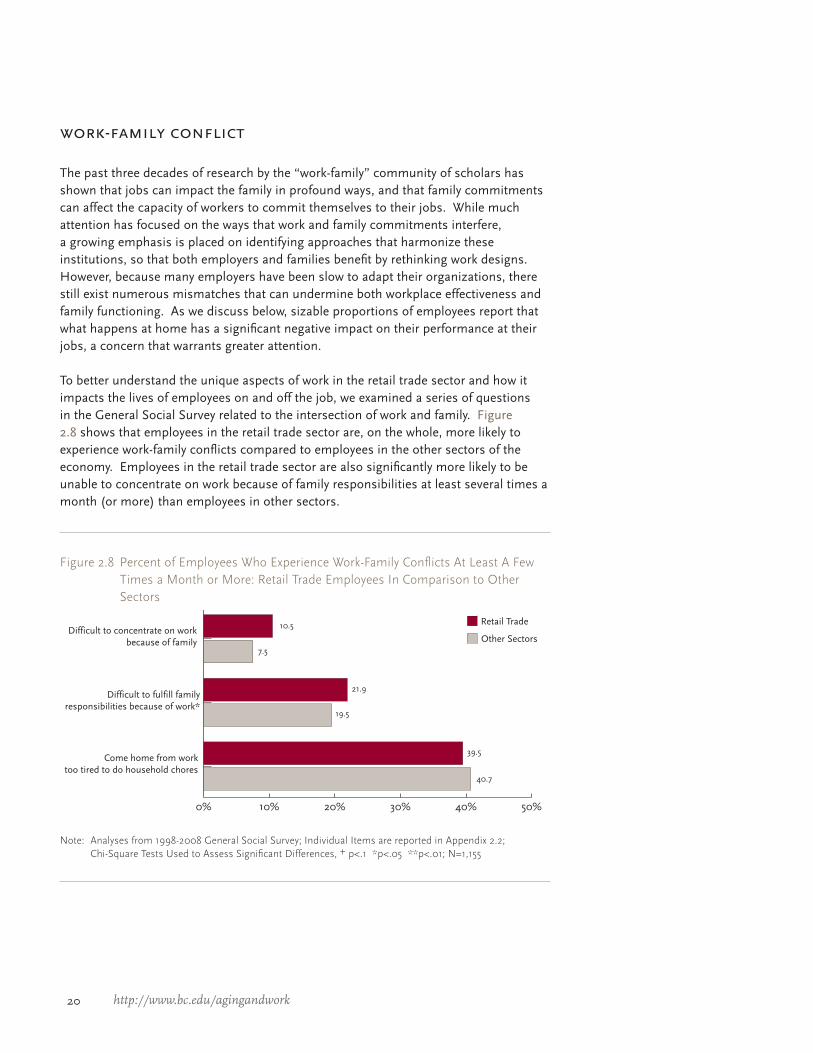
work-family conflict
The past three decades of research by the “work-family” community of scholars has shown that jobs can impact the family in profound ways, and that family commitments can affect the capacity of workers to commit themselves to their jobs. While much attention has focused on the ways that work and family commitments interfere, a growing emphasis is placed on identifying approaches that harmonize these institutions, so that both employers and families benefit by rethinking work designs. However, because many employers have been slow to adapt their organizations, there still exist numerous mismatches that can undermine both workplace effectiveness and family functioning. As we discuss below, sizable proportions of employees report that what happens at home has a significant negative impact on their performance at their jobs, a concern that warrants greater attention.
To better understand the unique aspects of work in the retail trade sector and how it impacts the lives of employees on and off the job, we examined a series of questions in the General Social Survey related to the intersection of work and family. Figure 2.8 shows that employees in the retail trade sector are, on the whole, more likely to experience work-family conflicts compared to employees in the other sectors of the economy. Employees in the retail trade sector are also significantly more likely to be unable to concentrate on work because of family responsibilities at least several times a month (or more) than employees in other sectors.
Figure 2.8 Percent of Employees Who Experience Work-Family Conflicts At Least A Few Times a Month or More: Retail Trade Employees In Comparison to Other Sectors
Note: Analyses from 1998-2008 General Social Survey; Individual Items are reported in Appendix 2.2; Chi-Square Tests Used to Assess Significant Differences, + p<.1 *p<.05 **p<.01; N=1,155
21The Sloan Center on Aging & Work
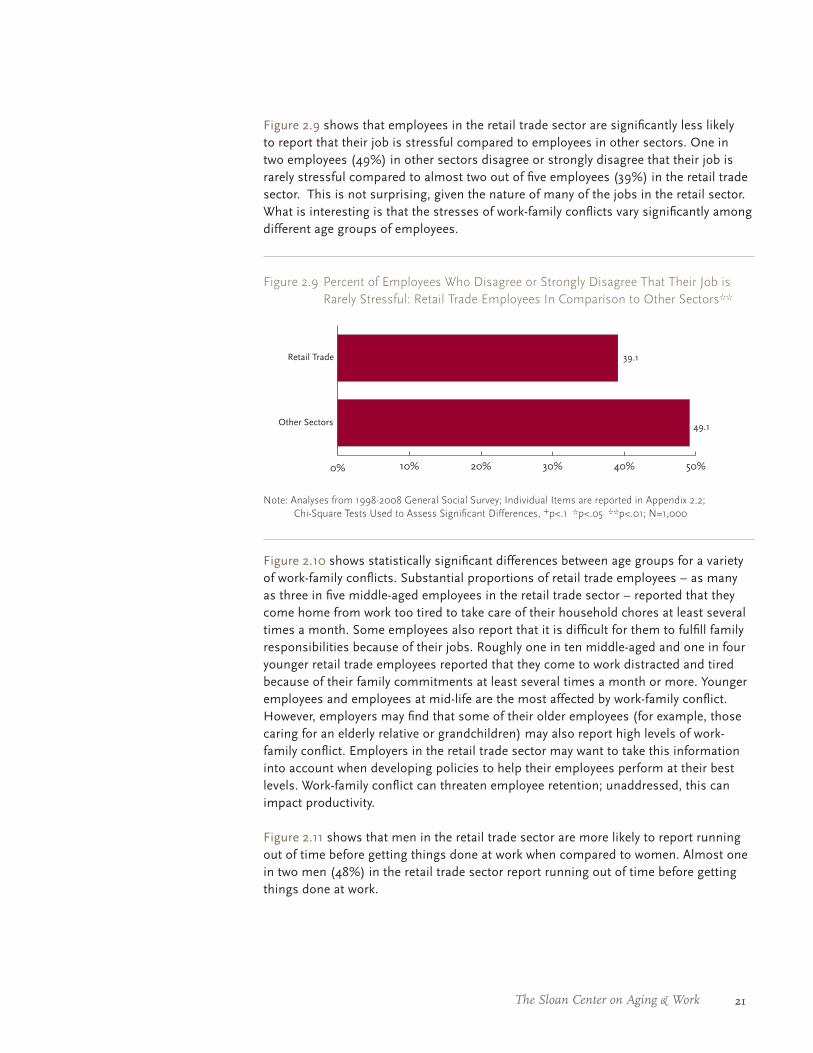
Figure 2.9 Percent of Employees Who Disagree or Strongly Disagree That Their Job is Rarely Stressful: Retail Trade Employees In Comparison to Other Sectors**
Note: Analyses from 1998-2008 General Social Survey; Individual Items are reported in Appendix 2.2; Chi-Square Tests Used to Assess Significant Differences, +p<.1 *p<.05 **p<.01; N=1,000
0% 10% 20% 30% 40% 50%
39.1
49.1Other Sectors
Retail Trade
Figure 2.9 shows that employees in the retail trade sector are significantly less likely to report that their job is stressful compared to employees in other sectors. One in two employees (49%) in other sectors disagree or strongly disagree that their job is rarely stressful compared to almost two out of five employees (39%) in the retail trade sector. This is not surprising, given the nature of many of the jobs in the retail sector. What is interesting is that the stresses of work-family conflicts vary significantly among different age groups of employees.
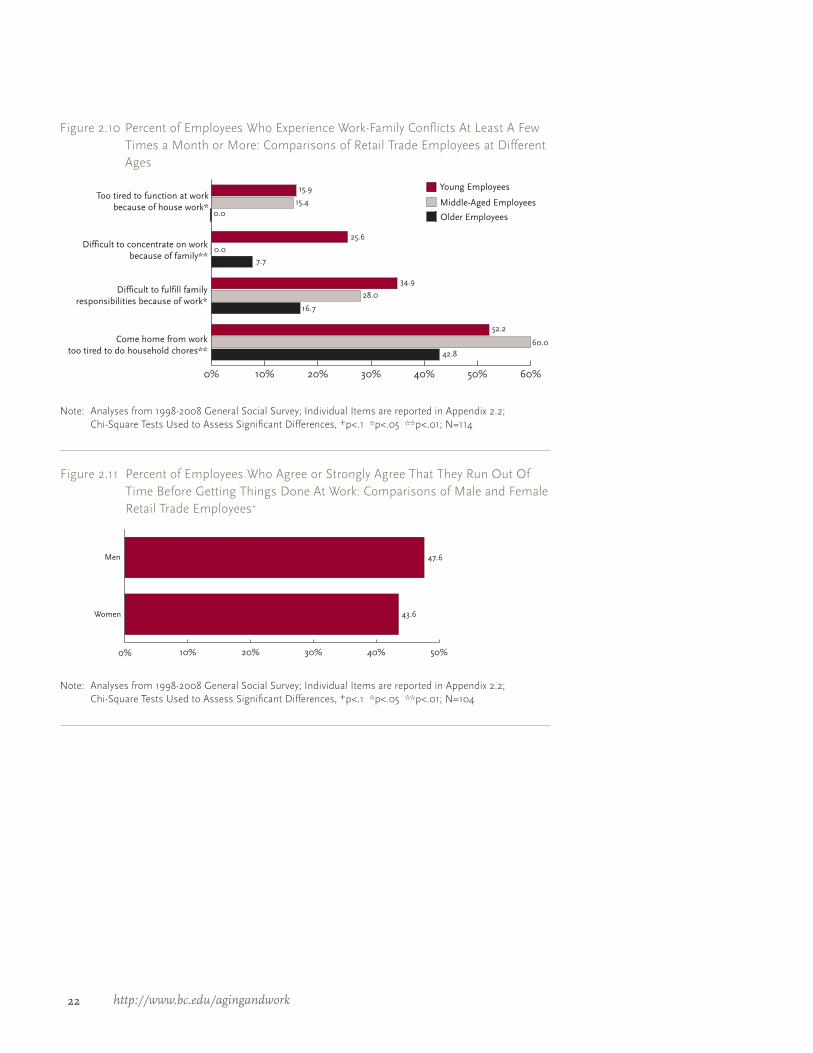
Figure 2.10 shows statistically significant differences between age groups for a variety of work-family conflicts. Substantial proportions of retail trade employees – as many as three in five middle-aged employees in the retail trade sector – reported that they come home from work too tired to take care of their household chores at least several times a month. Some employees also report that it is difficult for them to fulfill family responsibilities because of their jobs. Roughly one in ten middle-aged and one in four younger retail trade employees reported that they come to work distracted and tired because of their family commitments at least several times a month or more. Younger employees and employees at mid-life are the most affected by work-family conflict. However, employers may find that some of their older employees (for example, those caring for an elderly relative or grandchildren) may also report high levels of work-family conflict. Employers in the retail trade sector may want to take this information into account when developing policies to help their employees perform at their best levels. Work-family conflict can threaten employee retention; unaddressed, this can impact productivity.
Figure 2.11 shows that men in the retail trade sector are more likely to report running out of time before getting things done at work when compared to women. Almost one in two men (48%) in the retail trade sector report running out of time before getting things done at work.
22 http://www.bc.edu/agingandwork
Note: Analyses from 1998-2008 General Social Survey; Individual Items are reported in Appendix 2.2; Chi-Square Tests Used to Assess Significant Differences, +p<.1 *p<.05 **p<.01; N=114
0% 10% 20% 30% 40% 50% 60%
52.2
Difficult to concentrate on workbecause of family**
0.0
60.0
15.9
0.0
25.6
Difficult to fulfill familyresponsibilities because of work*
Come home from worktoo tired to do household chores**
Middle-Aged Employees
Young EmployeesToo tired to function at work
because of house work*
34.9
28.0
16.7
7.7
15.4
42.8
Older Employees
Figure 2.10 Percent of Employees Who Experience Work-Family Conflicts At Least A Few Times a Month or More: Comparisons of Retail Trade Employees at Different Ages
Figure 2.11 Percent of Employees Who Agree or Strongly Agree That They Run Out Of Time Before Getting Things Done At Work: Comparisons of Male and Female Retail Trade Employees+
Note: Analyses from 1998-2008 General Social Survey; Individual Items are reported in Appendix 2.2; Chi-Square Tests Used to Assess Significant Differences, +p<.1 *p<.05 **p<.01; N=104
0% 10% 20% 30% 40% 50%
47.6
43.6Women
Men
23The Sloan Center on Aging & Work
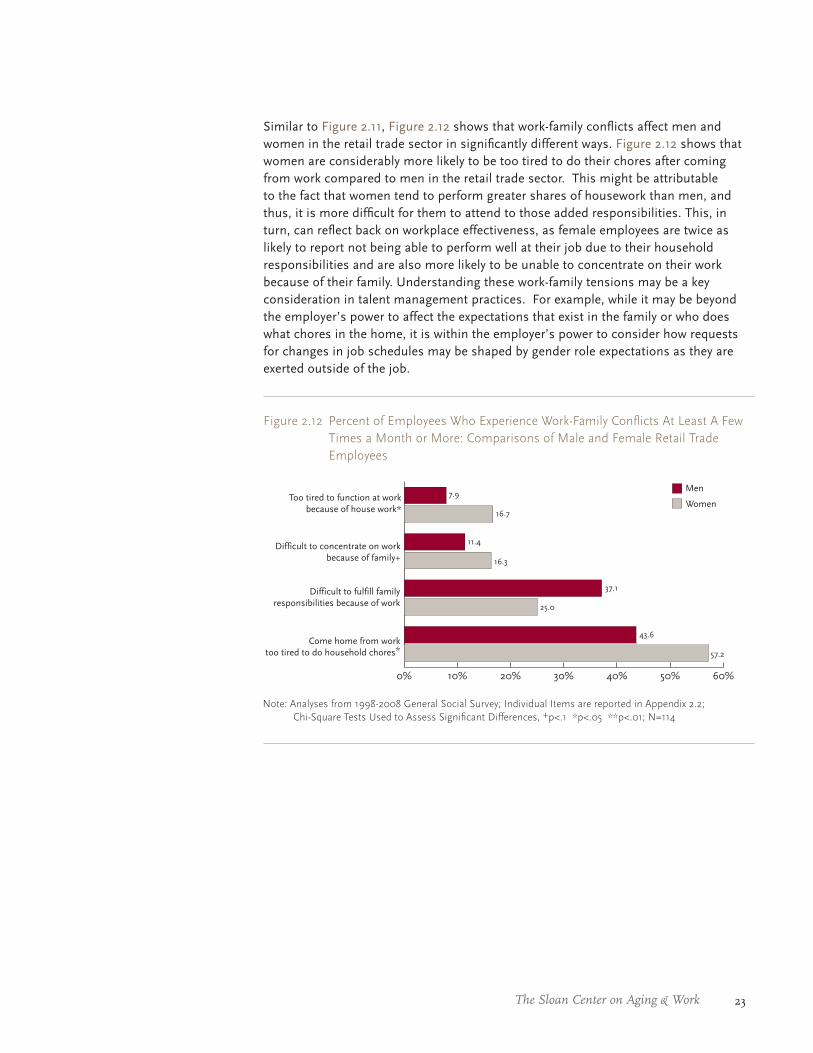
Similar to Figure 2.11, Figure 2.12 shows that work-family conflicts affect men and women in the retail trade sector in significantly different ways. Figure 2.12 shows that women are considerably more likely to be too tired to do their chores after coming from work compared to men in the retail trade sector. This might be attributable to the fact that women tend to perform greater shares of housework than men, and thus, it is more difficult for them to attend to those added responsibilities. This, in turn, can reflect back on workplace effectiveness, as female employees are twice as likely to report not being able to perform well at their job due to their household responsibilities and are also more likely to be unable to concentrate on their work because of their family. Understanding these work-family tensions may be a key consideration in talent management practices. For example, while it may be beyond the employer’s power to affect the expectations that exist in the family or who does what chores in the home, it is within the employer’s power to consider how requests for changes in job schedules may be shaped by gender role expectations as they are exerted outside of the job.
Figure 2.12 Percent of Employees Who Experience Work-Family Conflicts At Least A Few Times a Month or More: Comparisons of Male and Female Retail Trade Employees
Note: Analyses from 1998-2008 General Social Survey; Individual Items are reported in Appendix 2.2; Chi-Square Tests Used to Assess Significant Differences, +p<.1 *p<.05 **p<.01; N=114
0% 10% 20% 30% 40% 50% 60%
Difficult to concentrate on workbecause of family+
57.2
7.9
16.3
Difficult to fulfill familyresponsibilities because of work
Come home from worktoo tired to do household chores*
Women
MenToo tired to function at work
because of house work*
37.1
25.0
11.4
16.7
43.6
24 http://www.bc.edu/agingandwork
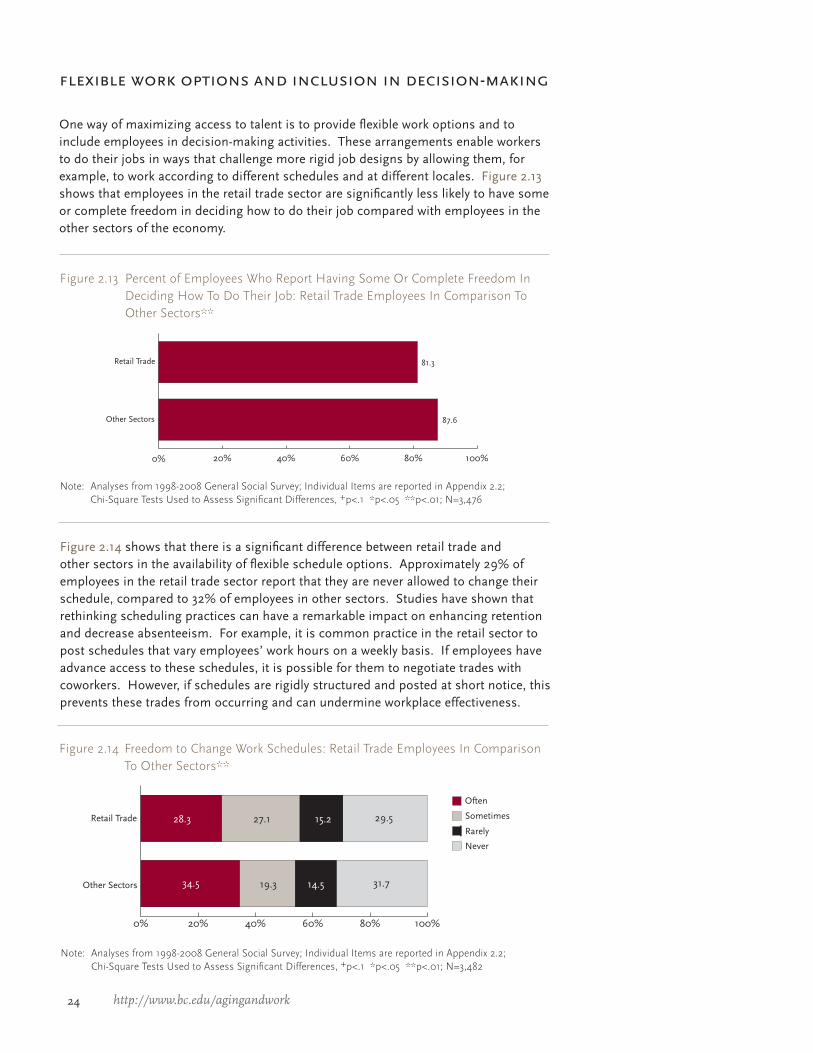
Figure 2.14 Freedom to Change Work Schedules: Retail Trade Employees In Comparison To Other Sectors**
Note: Analyses from 1998-2008 General Social Survey; Individual Items are reported in Appendix 2.2; Chi-Square Tests Used to Assess Significant Differences, +p<.1 *p<.05 **p<.01; N=3,482
0% 20% 40% 60% 80% 100%
Often
Sometimes
Rarely
Other Sectors
Retail Trade 29.5
31.719.3
27.128.3
34.5 14.5
15.2
Never
Note: Analyses from 1998-2008 General Social Survey; Individual Items are reported in Appendix 2.2; Chi-Square Tests Used to Assess Significant Differences, +p<.1 *p<.05 **p<.01; N=3,476
0% 20% 40% 60% 80% 100%
81.3
87.6Other Sectors
Retail Trade
flexible work options and inclusion in decision-making
One way of maximizing access to talent is to provide flexible work options and to include employees in decision-making activities. These arrangements enable workers to do their jobs in ways that challenge more rigid job designs by allowing them, for example, to work according to different schedules and at different locales. Figure 2.13 shows that employees in the retail trade sector are significantly less likely to have some or complete freedom in deciding how to do their job compared with employees in the other sectors of the economy.
Figure 2.13 Percent of Employees Who Report Having Some Or Complete Freedom In Deciding How To Do Their Job: Retail Trade Employees In Comparison To Other Sectors**
Figure 2.14 shows that there is a significant difference between retail trade and other sectors in the availability of flexible schedule options. Approximately 29% of employees in the retail trade sector report that they are never allowed to change their schedule, compared to 32% of employees in other sectors. Studies have shown that rethinking scheduling practices can have a remarkable impact on enhancing retention and decrease absenteeism. For example, it is common practice in the retail sector to post schedules that vary employees’ work hours on a weekly basis. If employees have advance access to these schedules, it is possible for them to negotiate trades with coworkers. However, if schedules are rigidly structured and posted at short notice, this prevents these trades from occurring and can undermine workplace effectiveness.
25The Sloan Center on Aging & Work
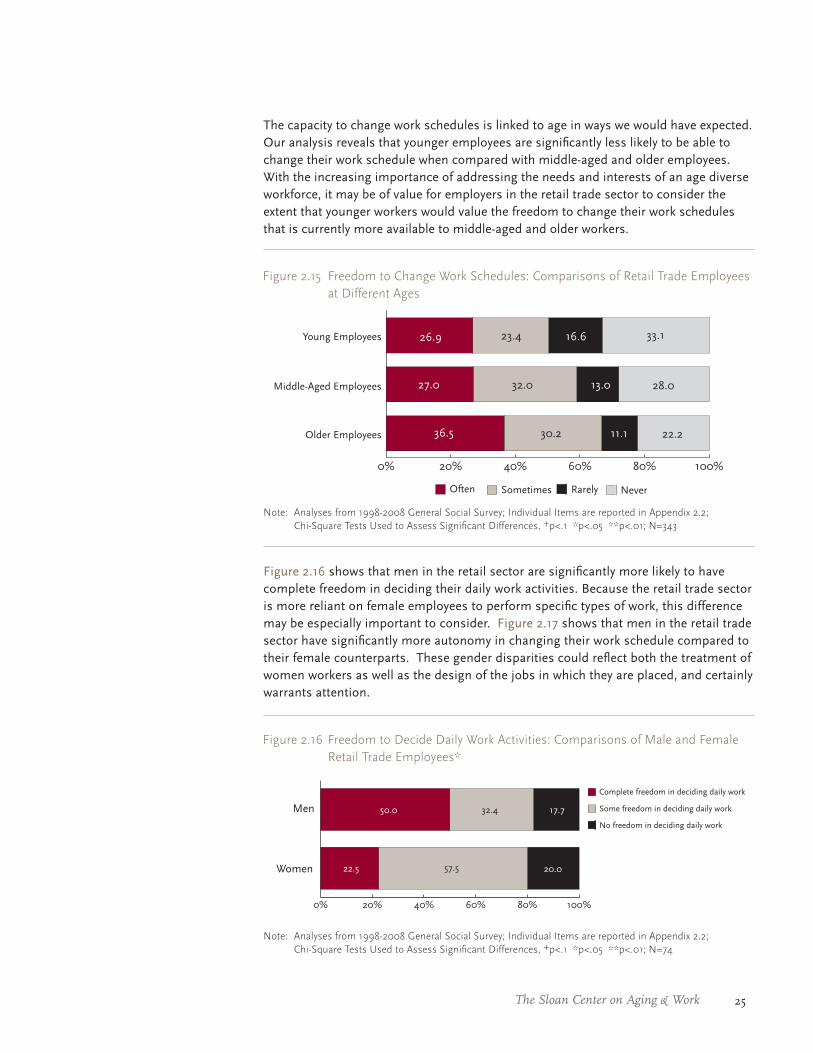
Figure 2.15 Freedom to Change Work Schedules: Comparisons of Retail Trade Employees at Different Ages
Note: Analyses from 1998-2008 General Social Survey; Individual Items are reported in Appendix 2.2; Chi-Square Tests Used to Assess Significant Differences, +p<.1 *p<.05 **p<.01; N=343
0% 20% 40% 60% 80% 100%
Often Sometimes Rarely
Older Employees
Young Employees 33.1
22.230.2
23.426.9
36.5 11.1
16.6
Never
28.032.0 13.027.0Middle-Aged Employees
The capacity to change work schedules is linked to age in ways we would have expected. Our analysis reveals that younger employees are significantly less likely to be able to change their work schedule when compared with middle-aged and older employees. With the increasing importance of addressing the needs and interests of an age diverse workforce, it may be of value for employers in the retail trade sector to consider the extent that younger workers would value the freedom to change their work schedules that is currently more available to middle-aged and older workers.
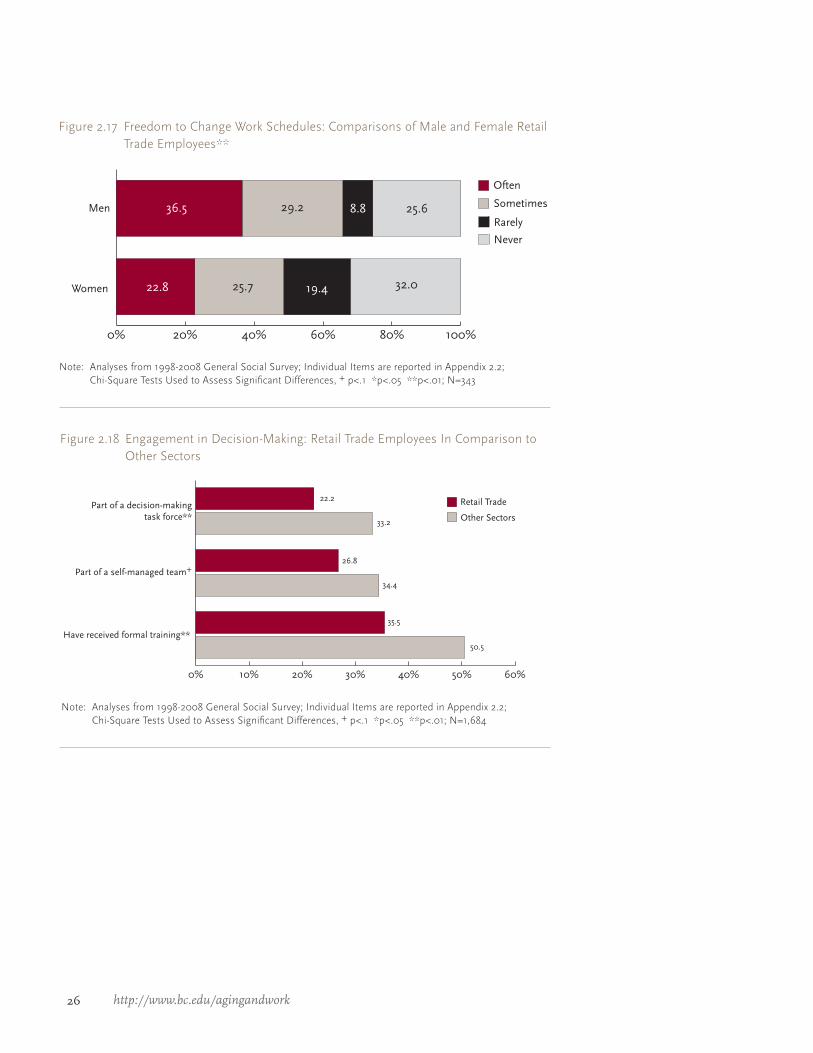
Figure 2.16 shows that men in the retail sector are significantly more likely to have complete freedom in deciding their daily work activities. Because the retail trade sector is more reliant on female employees to perform specific types of work, this difference may be especially important to consider. Figure 2.17 shows that men in the retail trade sector have significantly more autonomy in changing their work schedule compared to their female counterparts. These gender disparities could reflect both the treatment of women workers as well as the design of the jobs in which they are placed, and certainly warrants attention.
Figure 2.16 Freedom to Decide Daily Work Activities: Comparisons of Male and Female Retail Trade Employees*
Note: Analyses from 1998-2008 General Social Survey; Individual Items are reported in Appendix 2.2; Chi-Square Tests Used to Assess Significant Differences, +p<.1 *p<.05 **p<.01; N=74
0% 20% 40% 60% 80% 100%
Complete freedom in deciding daily work
Some freedom in deciding daily work
No freedom in deciding daily work
Women
Men
57.5
32.450.0
22.5 20.0
17.7
26 http://www.bc.edu/agingandwork
Figure 2.17 Freedom to Change Work Schedules: Comparisons of Male and Female Retail Trade Employees**
Note: Analyses from 1998-2008 General Social Survey; Individual Items are reported in Appendix 2.2; Chi-Square Tests Used to Assess Significant Differences, + p<.1 *p<.05 **p<.01; N=343
0% 20% 40% 60% 80% 100%
Often
Sometimes
Rarely
Women
Men
25.7
29.236.5
22.8 19.4
8.8
32.0
25.6
Never
Note: Analyses from 1998-2008 General Social Survey; Individual Items are reported in Appendix 2.2; Chi-Square Tests Used to Assess Significant Differences, + p<.1 *p<.05 **p<.01; N=1,684
0% 10% 20% 30% 40% 50% 60%
Have received formal training**50.5
22.2
26.8Part of a self-managed team+
Part of a decision-makingtask force** Other Sectors
Retail Trade
34.4
33.2
35.5
Figure 2.18 Engagement in Decision-Making: Retail Trade Employees In Comparison to Other Sectors
27The Sloan Center on Aging & Work
In addition to increasing incentives and options for flexible schedules and career paths, workplace effectiveness can potentially be enhanced by increasing employee engagement in decision-making processes. Through this means, employees can identify the aspects of their jobs that make work difficult, as well as inform their work teams and supervisors of alternate approaches to performing jobs. Figure 2.18 shows that there are significant differences between retail trade workers and those employed in other sectors. Only one in three retail trade workers have received formal training from their employers, compared to one in two employees in other sectors. Figure 2.18 also shows that less than one in four employees in the retail trade sector work as a part of a self-managed team or are engaged in a decision-making task force compared to one in three employees in the other sectors. Both of these talent management practices involve investing in workers’ human and social capital.
28 http://www.bc.edu/agingandwork
summary
Although most workers in the retail sector have a strong work ethic, employees in the retail trade sector show lower levels of commitment to their jobs and organizations. There is potential to increase commitment. The lower compensation received in this sector can account for some of the dissatisfaction workers express. Beyond issues of pay and benefits, there are other talent management practices that can enhance commitment. One strategy to accomplish this goal is to structure jobs in ways that minimize work-family conflicts, as well as open opportunities for employees to work on different schedules that suit their unique interests and work-styles. Engagement of employees in decision-making activities can help identify and formulate job designs that suit employee interests and needs, but employers in the retail trade sector are less likely than other employers to engage in this promising practice.
It is evident that many female workers expect more from their jobs than simply a paycheck. For women in the retail trade sector, the prospect of helping others is an important motivator. Therefore, employers wishing to attract and retain women, integrating flexible work options and packaging jobs within a framework that helps workers feel that they are being useful to society through their work, may translate into enhanced commitment and talent stability. Because the experiences and expectations of older workers sometimes depart from those of younger and middle-aged workers, employers in the retail trade sector may benefit by attending to the retention of older workers, as well as capacities to transfer knowledge in advance of their retirements.

29The Sloan Center on Aging & Work
Organizational Responses in the Retail Trade Sector to a Diverse, Multigenerational Workforce
One of the primary considerations for employers in the retail trade sector is the means to access, retain, and motivate key talent. This sector also needs to be able to identify the risks of talent losses, and to anticipate means of addressing those events when
they occur.
In this section, we consider how retail trade employers are responding to the economic and talent pressures identified in the previous sections. To do so, we report analyses of data gathered from the 78 retail trade organizations that participated in the 2009 Talent Management Study (which gathered data from a total of 696 organizations). Variation within this sector, such as how practices vary between small, medium, and large employers, is explored. We also compare the retail sector to general employment practices as exemplified by employers that operate in nine other leading sectors in the economy. Talent management practices of retail employers that reported the aging of the workforce would have a “negative” or “very negative” impact on the economic environment in which they operate in the next three years are compared to other retail employers who reported lower age pressures. A detailed description of methods of studying the 2009 Talent Management Study, its samples and measures, as well as additional relationships, are presented in Appendix 3.1 to Appendix 3.6.
introduction
Key Points:
Retail organizations report less of a shortage of basic literacy in writing and math, 1. skills, human resource skills, and sales/marking skills compared to organizations in other sectors.
Age-pressured retailers report a greater shortage of finance skills, operations skills, 2. legal skills, technical computer skills, and management skills compared to lower pressured retailers.
A lower percentage of retail organizations have assessed the demographic makeup 3. of their workforces (18.4%) or assessed projected retirement rates (14.5%) to a moderate/great extent compared to employers in other industries (33.3% and 24.7%, respectively).
Although they tend to consider talent retention strategies as being important, 4. retailers are less likely to report having too few policies and programs in the areas of retention, career development, and engagement for workers of all ages compared to organizations in other sectors.
Retailers offer flexible work options in ways that are comparable to those offered 5. by other employers in other leading sectors.
30 http://www.bc.edu/agingandwork
age pressures, talent needs and talent loss risks
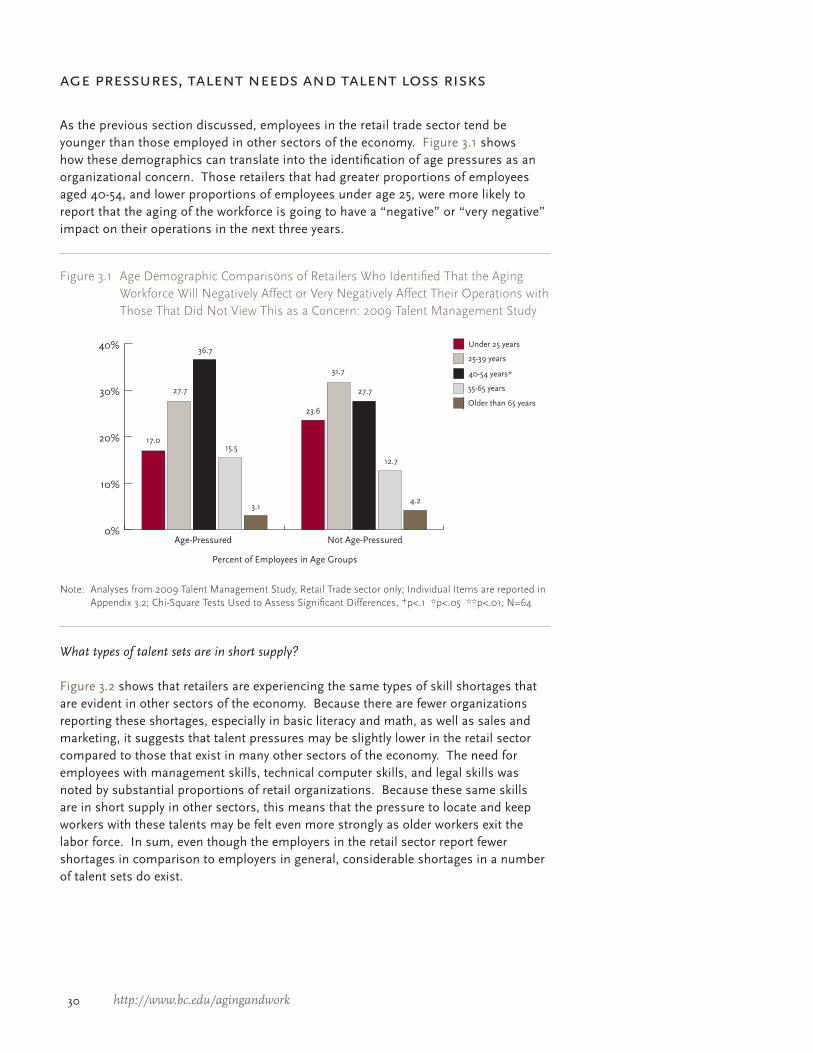
As the previous section discussed, employees in the retail trade sector tend be younger than those employed in other sectors of the economy. Figure 3.1 shows how these demographics can translate into the identification of age pressures as an organizational concern. Those retailers that had greater proportions of employees aged 40-54, and lower proportions of employees under age 25, were more likely to report that the aging of the workforce is going to have a “negative” or “very negative” impact on their operations in the next three years.
Figure 3.1 Age Demographic Comparisons of Retailers Who Identified That the Aging Workforce Will Negatively Affect or Very Negatively Affect Their Operations with Those That Did Not View This as a Concern: 2009 Talent Management Study
0%
10%
20%
30%
40%
Not Age-Pressured
17.2
Age-Pressured
Under 25 years
25-39 years
40-54 years*
55-65 years
Older than 65 years
Percent of Employees in Age Groups
17.0
27.7
36.7
15.5
3.1
23.6
31.7
27.7
12.7
4.2
Note: Analyses from 2009 Talent Management Study, Retail Trade sector only; Individual Items are reported in Appendix 3.2; Chi-Square Tests Used to Assess Significant Differences, +p<.1 *p<.05 **p<.01; N=64
What types of talent sets are in short supply?
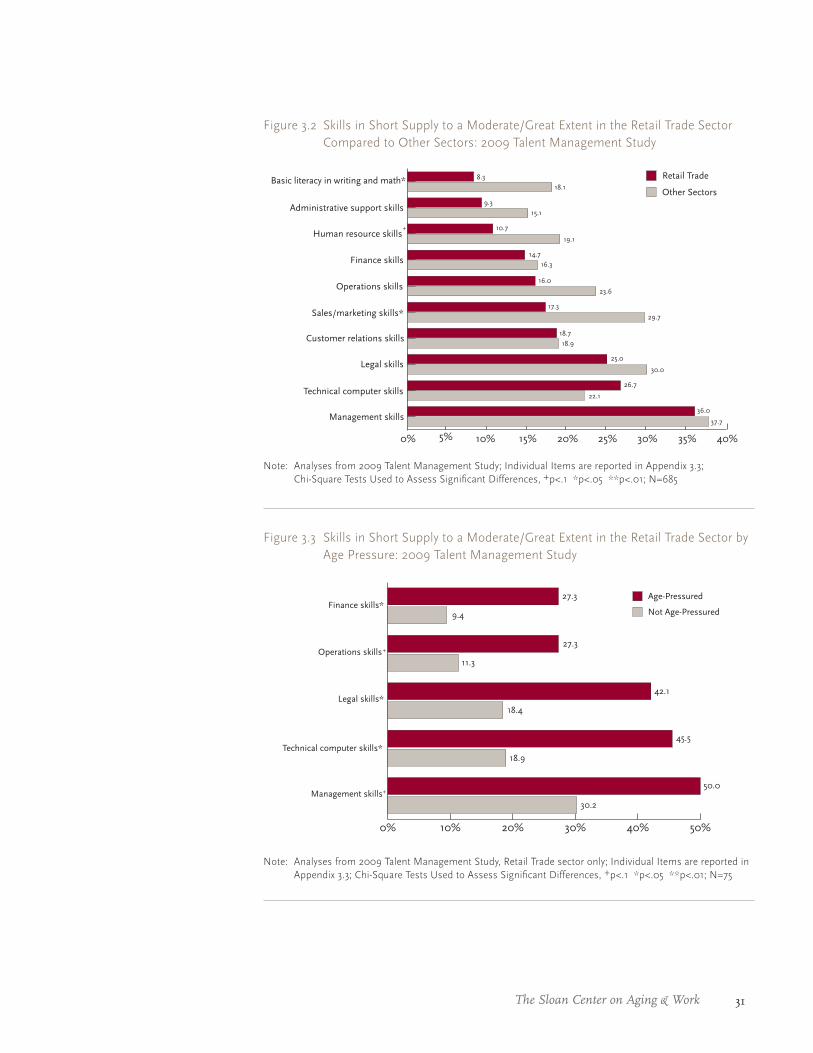
Figure 3.2 shows that retailers are experiencing the same types of skill shortages that are evident in other sectors of the economy. Because there are fewer organizations reporting these shortages, especially in basic literacy and math, as well as sales and marketing, it suggests that talent pressures may be slightly lower in the retail sector compared to those that exist in many other sectors of the economy. The need for employees with management skills, technical computer skills, and legal skills was noted by substantial proportions of retail organizations. Because these same skills are in short supply in other sectors, this means that the pressure to locate and keep workers with these talents may be felt even more strongly as older workers exit the labor force. In sum, even though the employers in the retail sector report fewer shortages in comparison to employers in general, considerable shortages in a number of talent sets do exist.
31The Sloan Center on Aging & Work
Figure 3.3 Skills in Short Supply to a Moderate/Great Extent in the Retail Trade Sector by Age Pressure: 2009 Talent Management Study
0% 10% 20% 30% 40% 50%
Not Age-Pressured
Age-Pressured
Management skills
Technical computer skills*
Legal skills*
Operations skills
Finance skills*
+
+
27.3
50.0
42.1
45.5
30.2
18.9
18.4
27.3
11.3
9.4
Note: Analyses from 2009 Talent Management Study, Retail Trade sector only; Individual Items are reported in Appendix 3.3; Chi-Square Tests Used to Assess Significant Differences, +p<.1 *p<.05 **p<.01; N=75
Figure 3.2 Skills in Short Supply to a Moderate/Great Extent in the Retail Trade Sector Compared to Other Sectors: 2009 Talent Management Study
0% 5% 10% 15% 20% 25% 30% 35% 40%
Other Sectors
Retail Trade
Administrative support skills
Sales/marketing skills*
Operations skills
Technical computer skills
Basic literacy in writing and math*
Human resource skills
Customer relations skills
Finance skills
Management skills
Legal skills
+
8.3
18.1
9.3
15.1
10.7
19.1
14.7
16.3
36.0
22.1
26.7
30.0
25.0
23.6
16.0
17.3
18.9
18.7
29.7
37.7
Note: Analyses from 2009 Talent Management Study; Individual Items are reported in Appendix 3.3; Chi-Square Tests Used to Assess Significant Differences, +p<.1 *p<.05 **p<.01; N=685
32 http://www.bc.edu/agingandwork
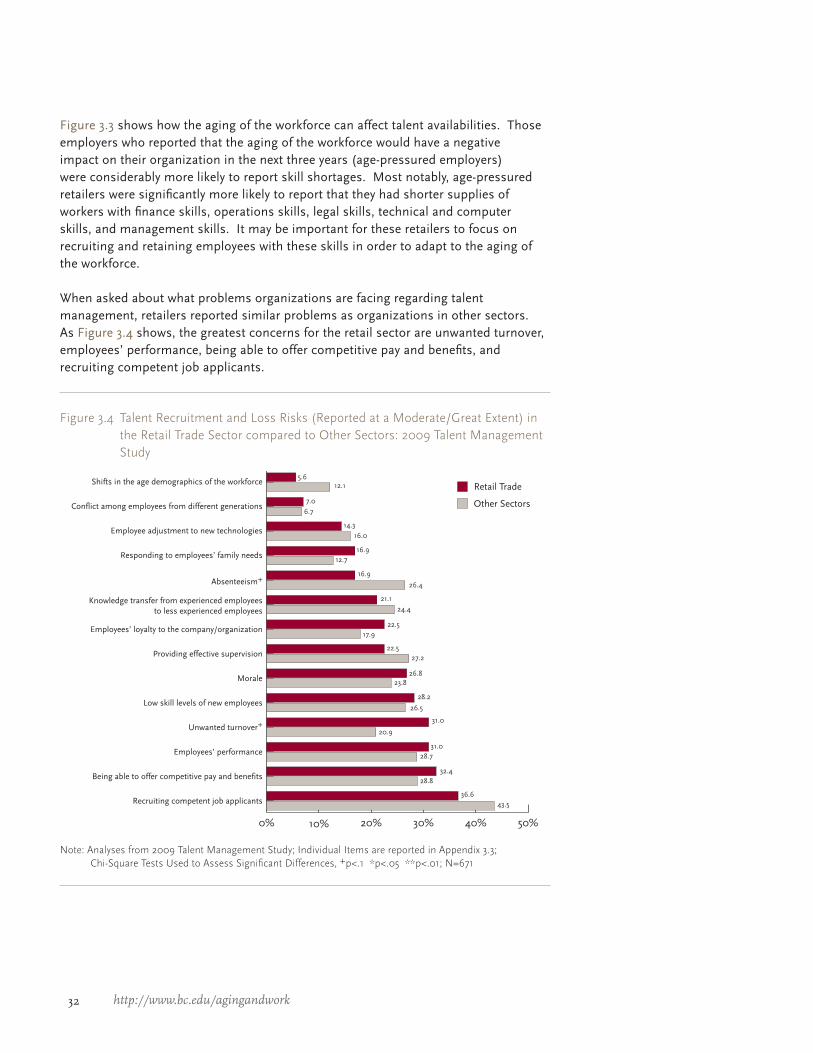
Figure 3.4 Talent Recruitment and Loss Risks (Reported at a Moderate/Great Extent) in the Retail Trade Sector compared to Other Sectors: 2009 Talent Management Study
0% 10% 20% 30% 40% 50%
Recruiting competent job applicants
Being able to offer competitive pay and benefits
Employees’ performance
Unwanted turnover+
Low skill levels of new employees
Morale
Providing effective supervision
Employees’ loyalty to the company/organization
Knowledge transfer from experienced employeesto less experienced employees
Absenteeism+
Responding to employees’ family needs
Employee adjustment to new technologies
Conflict among employees from different generations
Shifts in the age demographics of the workforce
Other Sectors
Retail Trade5.6
22.5
24.4
21.1
26.4
16.9
12.716.9
16.0
14.3
6.7
7.0
12.1
17.9
27.222.5
23.826.8
26.5
28.2
31.0
31.0
20.9
28.7
32.4
43.5
28.8
36.6
Note: Analyses from 2009 Talent Management Study; Individual Items are reported in Appendix 3.3; Chi-Square Tests Used to Assess Significant Differences, +p<.1 *p<.05 **p<.01; N=671
Figure 3.3 shows how the aging of the workforce can affect talent availabilities. Those employers who reported that the aging of the workforce would have a negative impact on their organization in the next three years (age-pressured employers) were considerably more likely to report skill shortages. Most notably, age-pressured retailers were significantly more likely to report that they had shorter supplies of workers with finance skills, operations skills, legal skills, technical and computer skills, and management skills. It may be important for these retailers to focus on recruiting and retaining employees with these skills in order to adapt to the aging of the workforce.
When asked about what problems organizations are facing regarding talent management, retailers reported similar problems as organizations in other sectors. As Figure 3.4 shows, the greatest concerns for the retail sector are unwanted turnover, employees’ performance, being able to offer competitive pay and benefits, and recruiting competent job applicants.
33The Sloan Center on Aging & Work
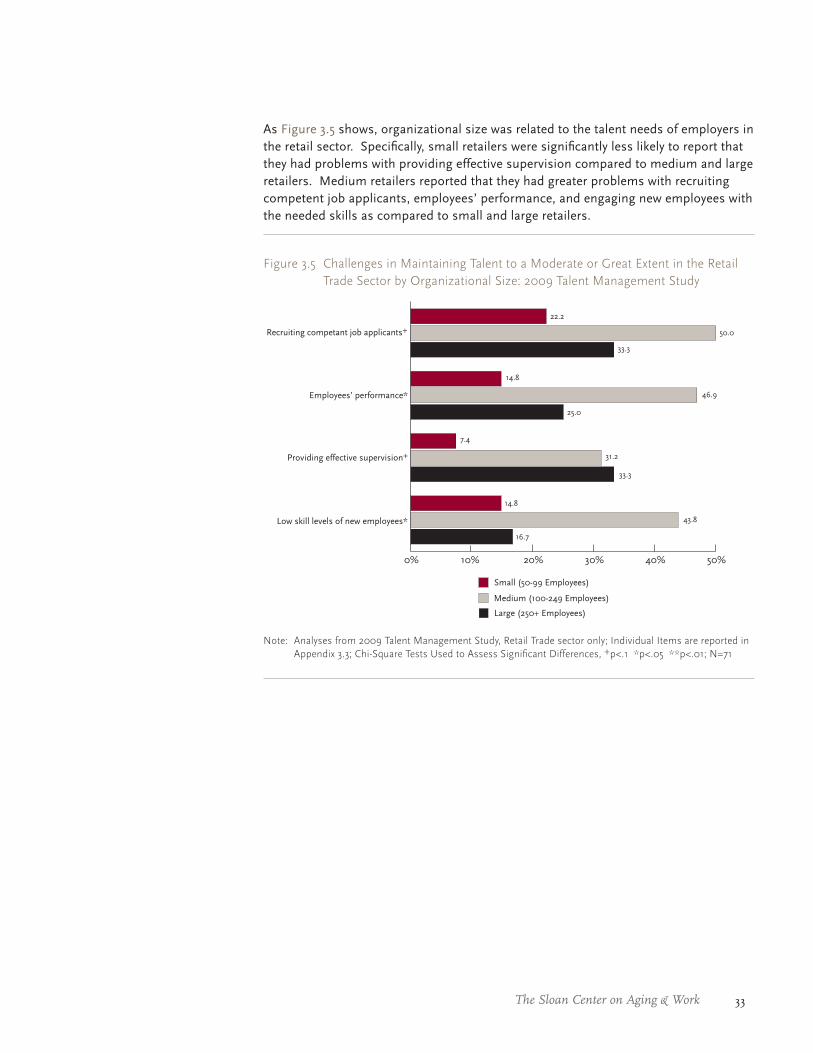
As Figure 3.5 shows, organizational size was related to the talent needs of employers in the retail sector. Specifically, small retailers were significantly less likely to report that they had problems with providing effective supervision compared to medium and large retailers. Medium retailers reported that they had greater problems with recruiting competent job applicants, employees’ performance, and engaging new employees with the needed skills as compared to small and large retailers.
Figure 3.5 Challenges in Maintaining Talent to a Moderate or Great Extent in the Retail Trade Sector by Organizational Size: 2009 Talent Management Study
0% 10% 20% 30% 40% 50%
Medium (100-249 Employees)
Small (50-99 Employees)
Recruiting competant job applicants+
Providing effective supervision+
Employees’ performance*
22.2
14.8
43.8
33.3
16.7
7.4
31.2
50.0
33.3
Large (250+ Employees)
Low skill levels of new employees*
46.9
25.0
14.8
Note: Analyses from 2009 Talent Management Study, Retail Trade sector only; Individual Items are reported in Appendix 3.3; Chi-Square Tests Used to Assess Significant Differences, +p<.1 *p<.05 **p<.01; N=71
34 http://www.bc.edu/agingandwork
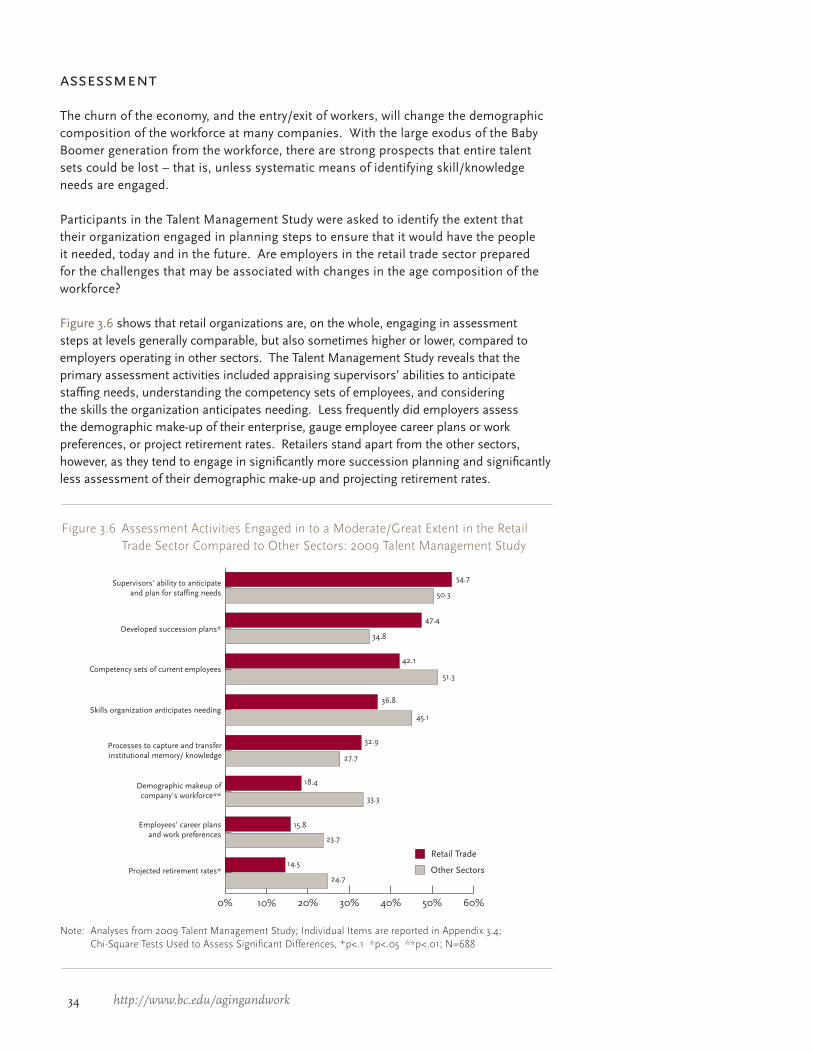
Figure 3.6 Assessment Activities Engaged in to a Moderate/Great Extent in the Retail Trade Sector Compared to Other Sectors: 2009 Talent Management Study
Note: Analyses from 2009 Talent Management Study; Individual Items are reported in Appendix 3.4; Chi-Square Tests Used to Assess Significant Differences, +p<.1 *p<.05 **p<.01; N=688
0% 10% 20% 30% 40% 50% 60%
Projected retirement rates*
Employees’ career plansand work preferences
Demographic makeup ofcompany’s workforce**
Processes to capture and transferinstitutional memory/ knowledge
Skills organization anticipates needing
Competency sets of current employees
Developed succession plans*
Supervisors’ ability to anticipateand plan for staffing needs
Other Sectors
Retail Trade14.5
54.7
50.3
47.4
34.8
42.1
51.3
36.8
45.1
32.9
27.7
33.3
18.4
15.8
23.7
24.7
assessment
The churn of the economy, and the entry/exit of workers, will change the demographic composition of the workforce at many companies. With the large exodus of the Baby Boomer generation from the workforce, there are strong prospects that entire talent sets could be lost – that is, unless systematic means of identifying skill/knowledge needs are engaged.
Participants in the Talent Management Study were asked to identify the extent that their organization engaged in planning steps to ensure that it would have the people it needed, today and in the future. Are employers in the retail trade sector prepared for the challenges that may be associated with changes in the age composition of the workforce?
Figure 3.6 shows that retail organizations are, on the whole, engaging in assessment steps at levels generally comparable, but also sometimes higher or lower, compared to employers operating in other sectors. The Talent Management Study reveals that the primary assessment activities included appraising supervisors’ abilities to anticipate staffing needs, understanding the competency sets of employees, and considering the skills the organization anticipates needing. Less frequently did employers assess the demographic make-up of their enterprise, gauge employee career plans or work preferences, or project retirement rates. Retailers stand apart from the other sectors, however, as they tend to engage in significantly more succession planning and significantly less assessment of their demographic make-up and projecting retirement rates.
35The Sloan Center on Aging & Work
recruitment and career development
In what ways are employers altering the structure of jobs and their approaches to attracting and retaining talent?
Responses from the Talent Management Study indicate that many retail organizations are rethinking their approaches to talent management. The scope of policies and programs designed to recruit and retain employees of different ages is one indicator of organizational attention to the changing workforce.
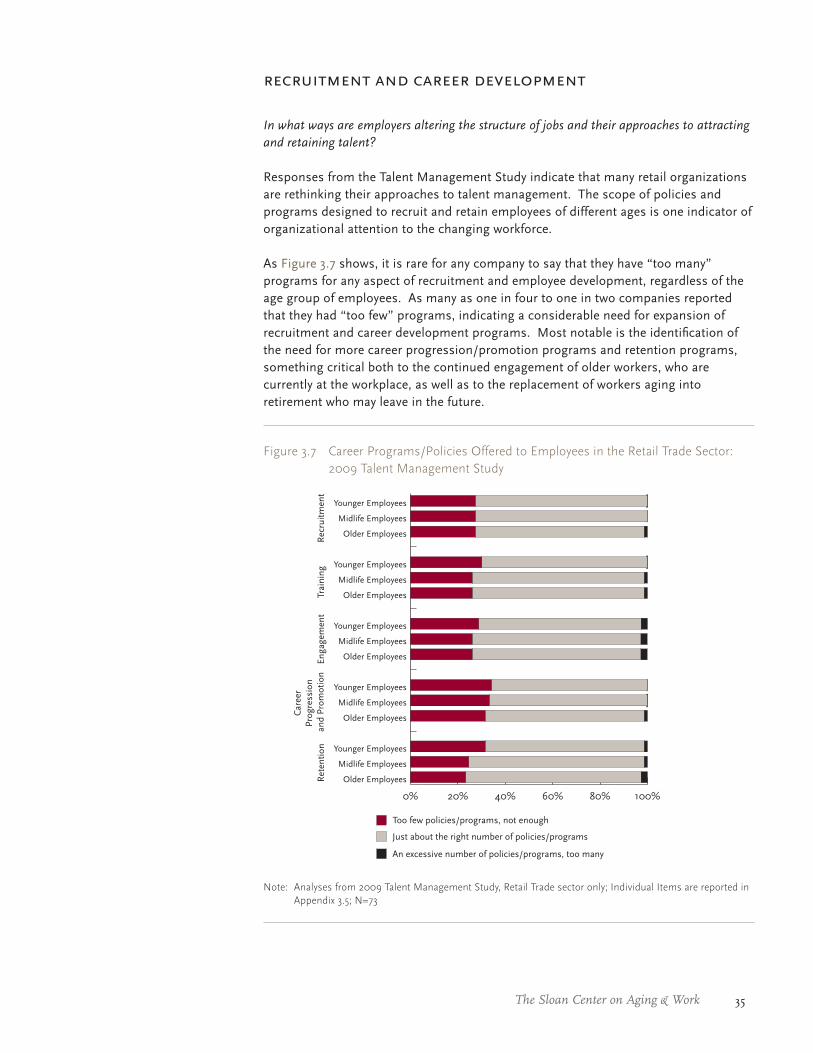
As Figure 3.7 shows, it is rare for any company to say that they have “too many” programs for any aspect of recruitment and employee development, regardless of the age group of employees. As many as one in four to one in two companies reported that they had “too few” programs, indicating a considerable need for expansion of recruitment and career development programs. Most notable is the identification of the need for more career progression/promotion programs and retention programs, something critical both to the continued engagement of older workers, who are currently at the workplace, as well as to the replacement of workers aging into retirement who may leave in the future.
Figure 3.7 Career Programs/Policies Offered to Employees in the Retail Trade Sector: 2009 Talent Management Study
Note: Analyses from 2009 Talent Management Study, Retail Trade sector only; Individual Items are reported in Appendix 3.5; N=73
0% 20% 40% 60% 80% 100%
Older Employees
Midlife Employees
Younger Employees
Older Employees
Midlife Employees
Younger Employees
Older Employees
Midlife Employees
Younger Employees
Older Employees
Midlife Employees
Younger Employees
Older Employees
Midlife Employees
Younger Employees
Rec
ruitm
ent
Trai
ning
Enga
gem
ent
Ret
entio
n
Car
eer
Prog
ress
ion
and
Prom
otio
n
Just about the right number of policies/programs
Too few policies/programs, not enough
An excessive number of policies/programs, too many
36 http://www.bc.edu/agingandwork
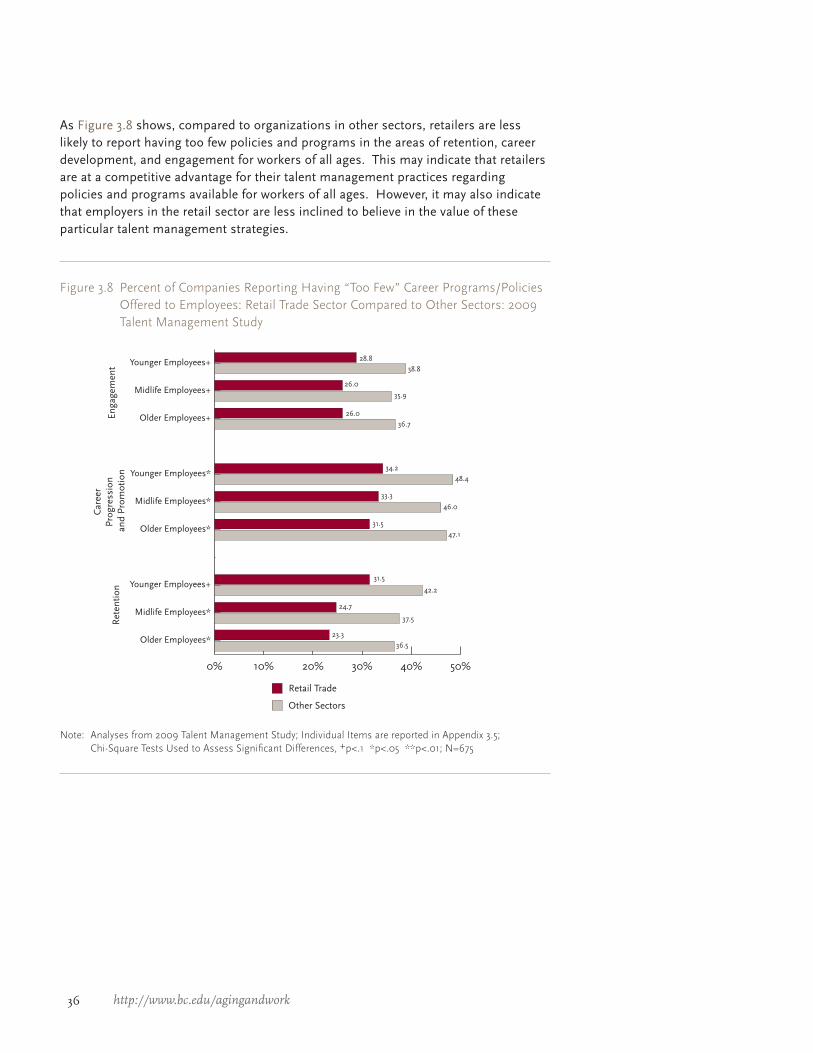
As Figure 3.8 shows, compared to organizations in other sectors, retailers are less likely to report having too few policies and programs in the areas of retention, career development, and engagement for workers of all ages. This may indicate that retailers are at a competitive advantage for their talent management practices regarding policies and programs available for workers of all ages. However, it may also indicate that employers in the retail sector are less inclined to believe in the value of these particular talent management strategies.
Figure 3.8 Percent of Companies Reporting Having “Too Few” Career Programs/Policies Offered to Employees: Retail Trade Sector Compared to Other Sectors: 2009 Talent Management Study
Note: Analyses from 2009 Talent Management Study; Individual Items are reported in Appendix 3.5; Chi-Square Tests Used to Assess Significant Differences, +p<.1 *p<.05 **p<.01; N=675
0% 10% 20% 30% 40% 50%
Older Employees*
Midlife Employees*
Younger Employees+
Older Employees*
Midlife Employees*
Younger Employees*
Older Employees+
Midlife Employees+
Younger Employees+
Enga
gem
ent
Ret
entio
n
Car
eer
Prog
ress
ion
and
Prom
otio
n
Other Sectors
Retail Trade
28.8
36.5
23.3
37.5
24.7
42.2
31.5
26.0
35.9
26.0
36.7
48.4
47.1
46.0
34.2
33.3
31.5
38.8
37The Sloan Center on Aging & Work
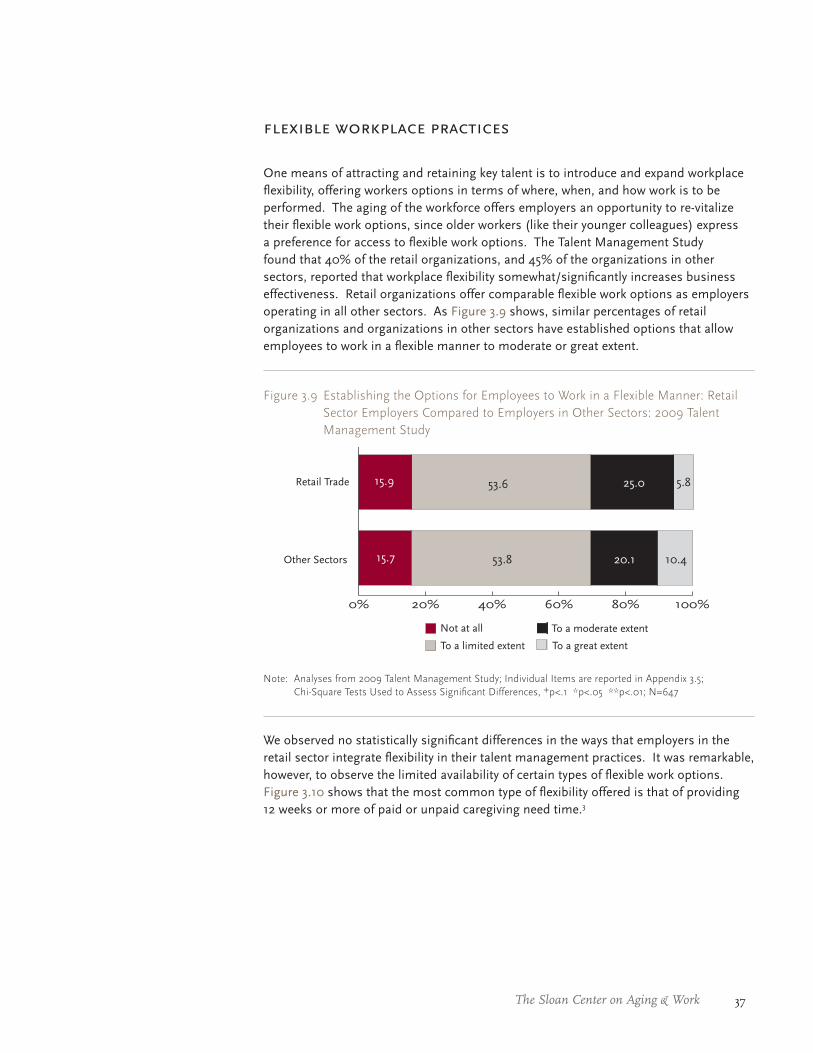
Figure 3.9 Establishing the Options for Employees to Work in a Flexible Manner: Retail Sector Employers Compared to Employers in Other Sectors: 2009 Talent Management Study
Note: Analyses from 2009 Talent Management Study; Individual Items are reported in Appendix 3.5; Chi-Square Tests Used to Assess Significant Differences, +p<.1 *p<.05 **p<.01; N=647
0% 20% 40% 60% 80% 100%
Not at all
To a limited extent
To a moderate extent
Other Sectors
Retail Trade
53.8
53.615.9
15.7 20.1
25.0
10.4
5.8
To a great extent
flexible workplace practices
One means of attracting and retaining key talent is to introduce and expand workplace flexibility, offering workers options in terms of where, when, and how work is to be performed. The aging of the workforce offers employers an opportunity to re-vitalize their flexible work options, since older workers (like their younger colleagues) express a preference for access to flexible work options. The Talent Management Study found that 40% of the retail organizations, and 45% of the organizations in other sectors, reported that workplace flexibility somewhat/significantly increases business effectiveness. Retail organizations offer comparable flexible work options as employers operating in all other sectors. As Figure 3.9 shows, similar percentages of retail organizations and organizations in other sectors have established options that allow employees to work in a flexible manner to moderate or great extent.
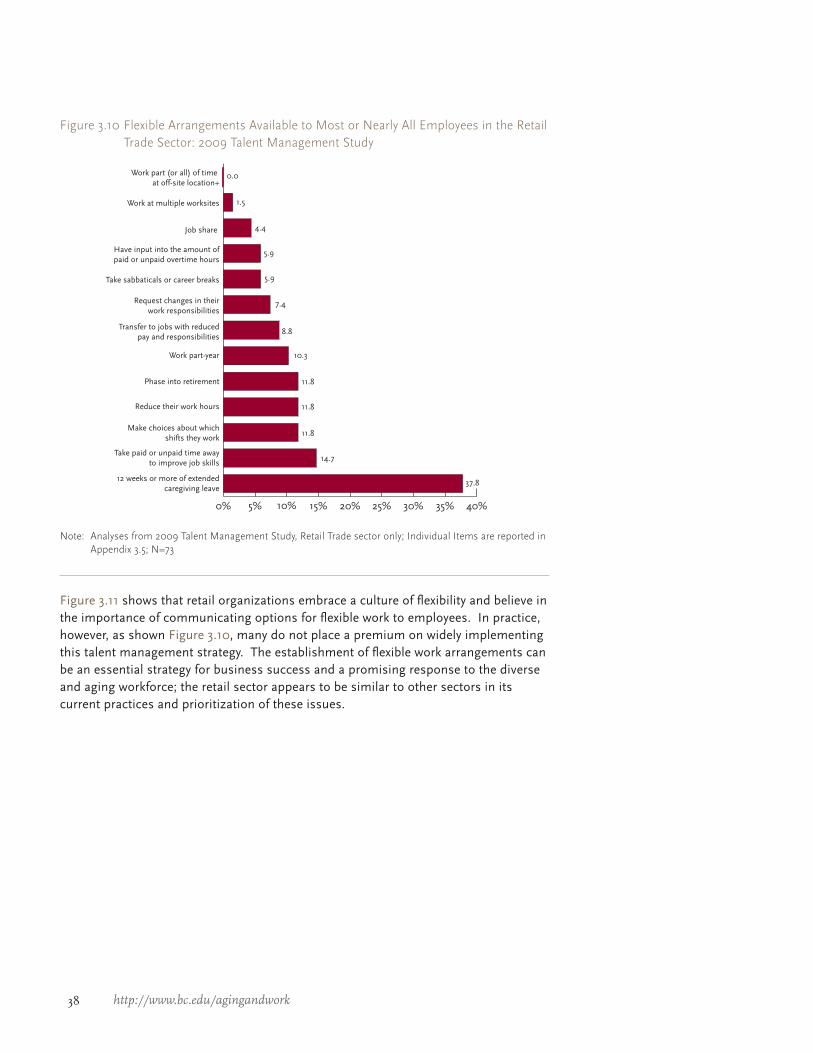
We observed no statistically significant differences in the ways that employers in the retail sector integrate flexibility in their talent management practices. It was remarkable, however, to observe the limited availability of certain types of flexible work options. Figure 3.10 shows that the most common type of flexibility offered is that of providing 12 weeks or more of paid or unpaid caregiving need time.3
38 http://www.bc.edu/agingandwork
Figure 3.11 shows that retail organizations embrace a culture of flexibility and believe in the importance of communicating options for flexible work to employees. In practice, however, as shown Figure 3.10, many do not place a premium on widely implementing this talent management strategy. The establishment of flexible work arrangements can be an essential strategy for business success and a promising response to the diverse and aging workforce; the retail sector appears to be similar to other sectors in its current practices and prioritization of these issues.
Note: Analyses from 2009 Talent Management Study, Retail Trade sector only; Individual Items are reported in Appendix 3.5; N=73
0% 5% 10% 15% 20% 25% 30% 35% 40%
12 weeks or more of extendedcaregiving leave
Take paid or unpaid time awayto improve job skills
Make choices about whichshifts they work
Reduce their work hours
Phase into retirement
Work part-year
Transfer to jobs with reducedpay and responsibilities
Request changes in theirwork responsibilities
Take sabbaticals or career breaks
Have input into the amount ofpaid or unpaid overtime hours
Job share
Work at multiple worksites
Work part (or all) of time at off-site location+
14.7
0.0
4.4
1.5
5.9
5.9
7.4
8.8
10.3
11.8
11.8
11.8
37.8
Figure 3.10 Flexible Arrangements Available to Most or Nearly All Employees in the Retail Trade Sector: 2009 Talent Management Study

39The Sloan Center on Aging & Work
Figure 3.11 Presence of a Culture of Flexibility is Generally True or Very True as Reported by Employers in the Retail Trade Sector: 2009 Talent Management Study
Note: Analyses from 2009 Talent Management Study, Retail Trade sector only; Individual Items are reported in Appendix 3.5; N=73
0% 10% 20% 30% 40% 50% 60% 70% 80%
Supports discussions of flexibility with supervisors
Makes efforts to inform employeesof flexible work options
Clearly communicates the importance of flexibilityfor business/organizational success
Clearly communicates the importance of flexibilityfor employees' lives at work and at home
Rewards supervisors who supportflexible work arrangements
23.5
35.3
44.1
52.9
67.6
40 http://www.bc.edu/agingandwork
summary
When compared to organizations in other sectors, retail organizations have similar skills in short supply and experience some of the same talent management problems; however, retail employers experience less of a shortage of basic literacy in writing and math skills, sales/marketing skills, and human resource skills, and have greater talent management problems regarding unwanted turnover. Within the retail sector, age-pressured employers report a greater shortage of finance, operation, legal, technical and computer, and management skills, than employers who do not report age pressures. Retail organizations are less likely to assess the demographic make-up of their company’s workforce or to assess projected retirement rates; however, they are more likely to develop succession plans than employers in other sectors. The exit of older workers from the retail sector may exacerbate these talent management challenges. Beyond this, the age profile of retail workers suggests that employers in this sector may not be maximizing the prospects of attracting older workers. As the population continues to age, retailers may find strategic advantages in going above and beyond the sometimes limited flexible work practices that are currently available.
41The Sloan Center on Aging & Work
Conclusion: Transferring Knowledge to Action in the Retail Trade Sector
Demographic transformations in the workforce are escalating the pressures exerted on employers to locate key talent. As increasing numbers of older retail workers exit the labor force, the risks of talent deficits are likely to escalate. Retail organizations
face many of the same skill needs and experience many of the same talent need pressures as organizations in other sectors of the economy.
Forward-thinking employers in the retail sector can begin their talent management planning by addressing questions, such as:
What information do we have, and what information do we need, to under- πstand current and future talent needs?
What steps can we take to more fully engage the current multi-generational πworkforce?
How can we facilitate the transfer of knowledge from late- to early-career πemployees?
How will we find and attract new employees to fill our future needs? π
The shifting age demographics of the retail workforce might provide employers in this sector with incentives to re-design their human resource policies and practices, especially in respect to integrating flexible scheduling practices and including employees in decision-making processes. The expansion of flexible work options might help retailers attract new segments of the workforce – especially the prospects of employing older employees, who may be attracted to jobs that offer something other than a traditional full-time, 9-5, work-day schedule. These flexibilities may also help enhance the engagement of current employees and retain experienced employees who have the critical competencies needed for the transition into the next decade.
Many of today’s organizational practices were designed for yesterday’s workforce. The talents of today’s workforce are not being fully engaged and it is inevitable that many talented workers will exit in the forthcoming years. Mobilizing organizations to understand future talent needs, and developing strategies of accessing that talent, may be critical to securing favorable prospects in a diverse and aging society.
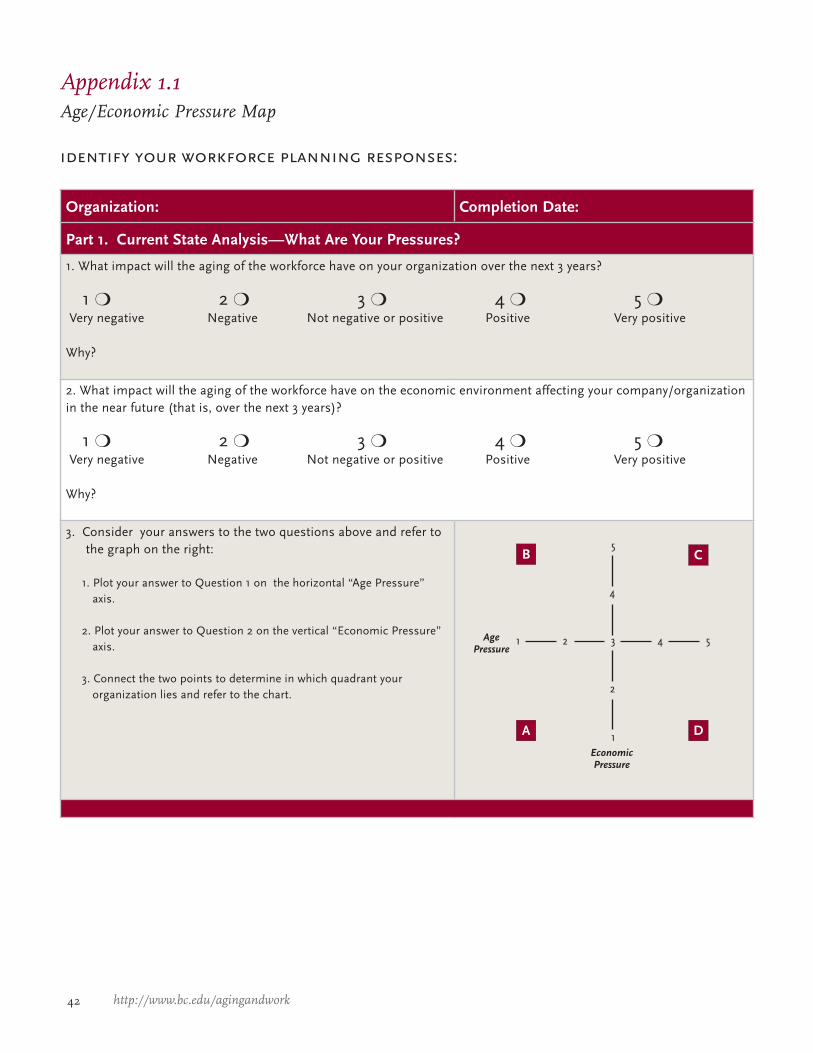
42 http://www.bc.edu/agingandwork
identify your workforce planning responses:
Appendix 1.1Age/Economic Pressure Map
Organization: Completion Date:
Part 1. Current State Analysis—What Are Your Pressures?
1. What impact will the aging of the workforce have on your organization over the next 3 years?
1 ❍ 2 ❍ 3 ❍ 4 ❍ 5 ❍ Very negative Negative Not negative or positive Positive Very positive
Why?
2. What impact will the aging of the workforce have on the economic environment affecting your company/organization in the near future (that is, over the next 3 years)?
1 ❍ 2 ❍ 3 ❍ 4 ❍ 5 ❍ Very negative Negative Not negative or positive Positive Very positive
Why?
3. Consider your answers to the two questions above and refer to the graph on the right:
1. Plot your answer to Question 1 on the horizontal “Age Pressure” axis.
2. Plot your answer to Question 2 on the vertical “Economic Pressure” axis.
3. Connect the two points to determine in which quadrant your organization lies and refer to the chart.
AgePressure
EconomicPressure
1 2 3 4 5
1
2
4
5B
A D
C
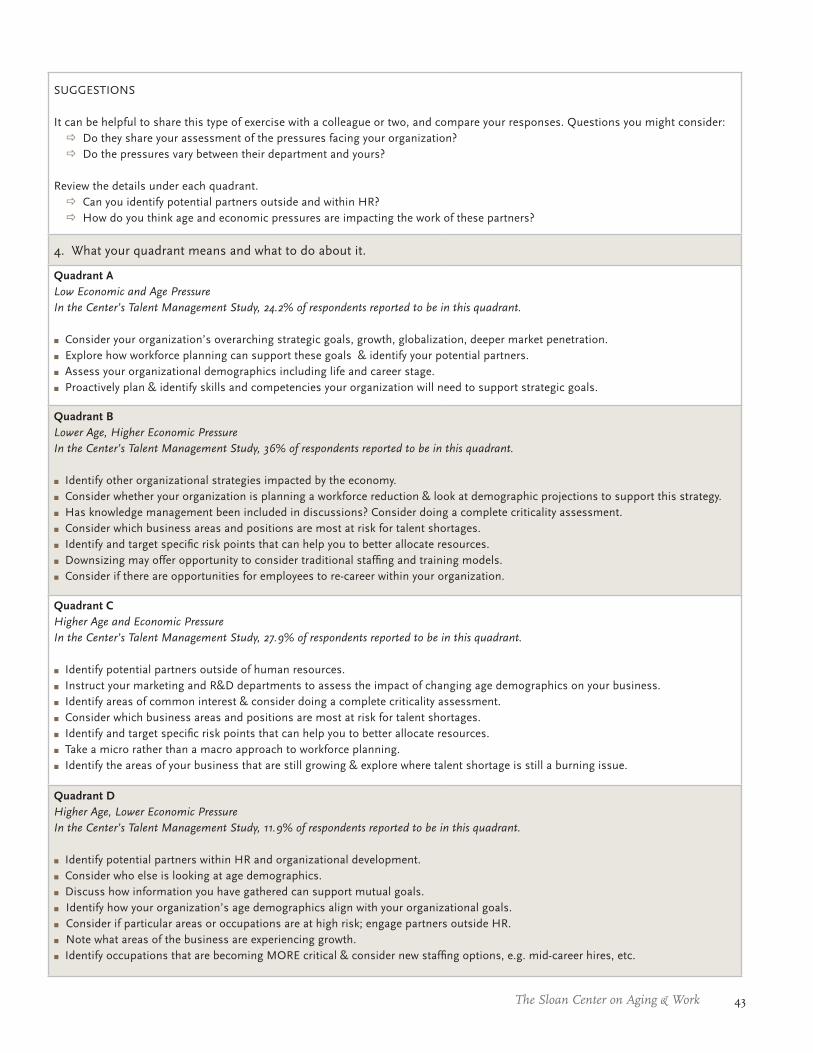
43The Sloan Center on Aging & Work
SUGGESTIONS
It can be helpful to share this type of exercise with a colleague or two, and compare your responses. Questions you might consider: Do they share your assessment of the pressures facing your organization? ÖDo the pressures vary between their department and yours? Ö
Review the details under each quadrant.Can you identify potential partners outside and within HR? ÖHow do you think age and economic pressures are impacting the work of these partners? Ö
4. What your quadrant means and what to do about it.
Quadrant ALow Economic and Age PressureIn the Center’s Talent Management Study, 24.2% of respondents reported to be in this quadrant.
Consider your organization’s overarching strategic goals, growth, globalization, deeper market penetration. ρExplore how workforce planning can support these goals & identify your potential partners. ρAssess your organizational demographics including life and career stage. ρProactively plan & identify skills and competencies your organization will need to support strategic goals. ρ
Quadrant BLower Age, Higher Economic PressureIn the Center’s Talent Management Study, 36% of respondents reported to be in this quadrant.
Identify other organizational strategies impacted by the economy. ρConsider whether your organization is planning a workforce reduction & look at demographic projections to support this strategy. ρHas knowledge management been included in discussions? Consider doing a complete criticality assessment. ρConsider which business areas and positions are most at risk for talent shortages. ρIdentify and target specific risk points that can help you to better allocate resources. ρDownsizing may offer opportunity to consider traditional staffing and training models. ρConsider if there are opportunities for employees to re-career within your organization. ρ
Quadrant CHigher Age and Economic PressureIn the Center’s Talent Management Study, 27.9% of respondents reported to be in this quadrant.
Identify potential partners outside of human resources. ρInstruct your marketing and R&D departments to assess the impact of changing age demographics on your business. ρIdentify areas of common interest & consider doing a complete criticality assessment. ρConsider which business areas and positions are most at risk for talent shortages. ρIdentify and target specific risk points that can help you to better allocate resources. ρTake a micro rather than a macro approach to workforce planning. ρIdentify the areas of your business that are still growing & explore where talent shortage is still a burning issue. ρ
Quadrant DHigher Age, Lower Economic PressureIn the Center’s Talent Management Study, 11.9% of respondents reported to be in this quadrant.
Identify potential partners within HR and organizational development. ρConsider who else is looking at age demographics. ρDiscuss how information you have gathered can support mutual goals. ρ Identify how your organization’s age demographics align with your organizational goals. ρ Consider if particular areas or occupations are at high risk; engage partners outside HR. ρ Note what areas of the business are experiencing growth. ρIdentify occupations that are becoming MORE critical & consider new staffing options, e.g. mid-career hires, etc. ρ
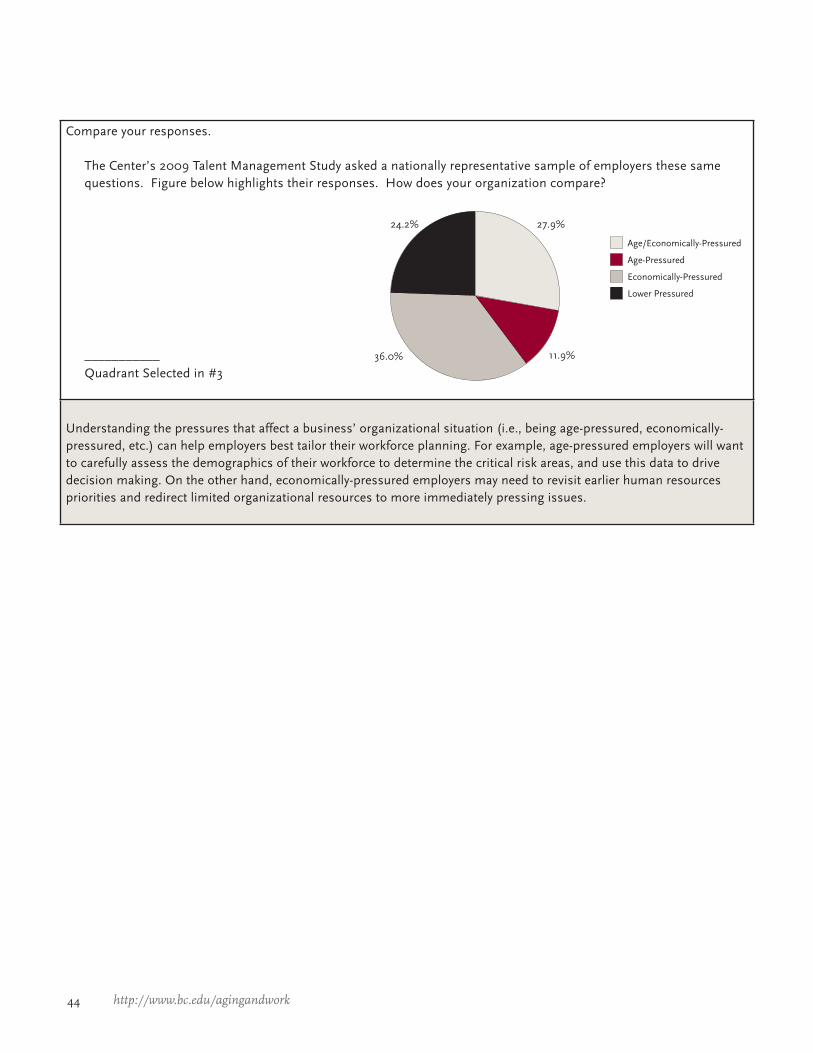
44 http://www.bc.edu/agingandwork
Compare your responses.
The Center’s 2009 Talent Management Study asked a nationally representative sample of employers these same questions. Figure below highlights their responses. How does your organization compare?
___________Quadrant Selected in #3
Understanding the pressures that affect a business’ organizational situation (i.e., being age-pressured, economically-pressured, etc.) can help employers best tailor their workforce planning. For example, age-pressured employers will want to carefully assess the demographics of their workforce to determine the critical risk areas, and use this data to drive decision making. On the other hand, economically-pressured employers may need to revisit earlier human resources priorities and redirect limited organizational resources to more immediately pressing issues.
Age/Economically-Pressured
Age-Pressured
Economically-Pressured
Lower Pressured
11.9%
24.2%
36.0%
27.9%
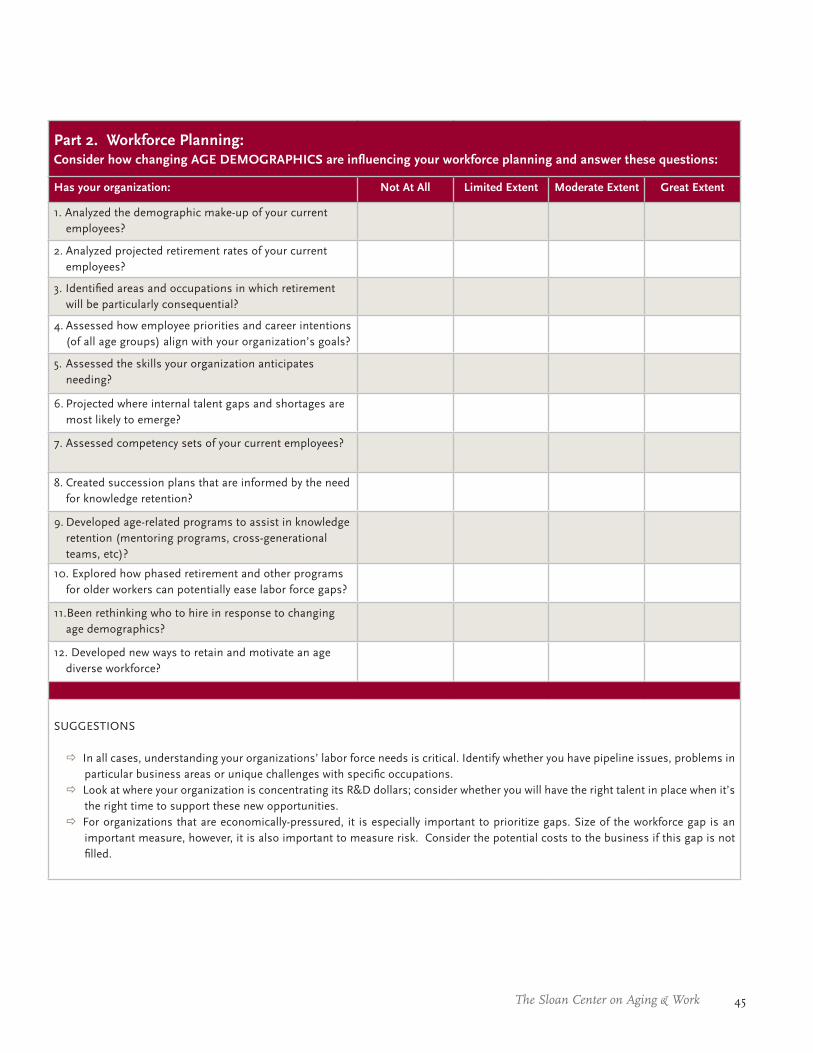
45The Sloan Center on Aging & Work
Part 2. Workforce Planning:Consider how changing AGE DEMOGRAPHICS are influencing your workforce planning and answer these questions:
Has your organization: Not At All Limited Extent Moderate Extent Great Extent
1. Analyzed the demographic make-up of your current employees?
2. Analyzed projected retirement rates of your current employees?
3. Identified areas and occupations in which retirement will be particularly consequential?
4. Assessed how employee priorities and career intentions (of all age groups) align with your organization’s goals?
5. Assessed the skills your organization anticipates needing?
6. Projected where internal talent gaps and shortages are most likely to emerge?
7. Assessed competency sets of your current employees?
8. Created succession plans that are informed by the need for knowledge retention?
9. Developed age-related programs to assist in knowledge retention (mentoring programs, cross-generational teams, etc)?
10. Explored how phased retirement and other programs for older workers can potentially ease labor force gaps?
11.Been rethinking who to hire in response to changing age demographics?
12. Developed new ways to retain and motivate an age diverse workforce?
SUGGESTIONS
In all cases, understanding your organizations’ labor force needs is critical. Identify whether you have pipeline issues, problems in Öparticular business areas or unique challenges with specific occupations.Look at where your organization is concentrating its R&D dollars; consider whether you will have the right talent in place when it’s Öthe right time to support these new opportunities.For organizations that are economically-pressured, it is especially important to prioritize gaps. Size of the workforce gap is an Öimportant measure, however, it is also important to measure risk. Consider the potential costs to the business if this gap is not filled.
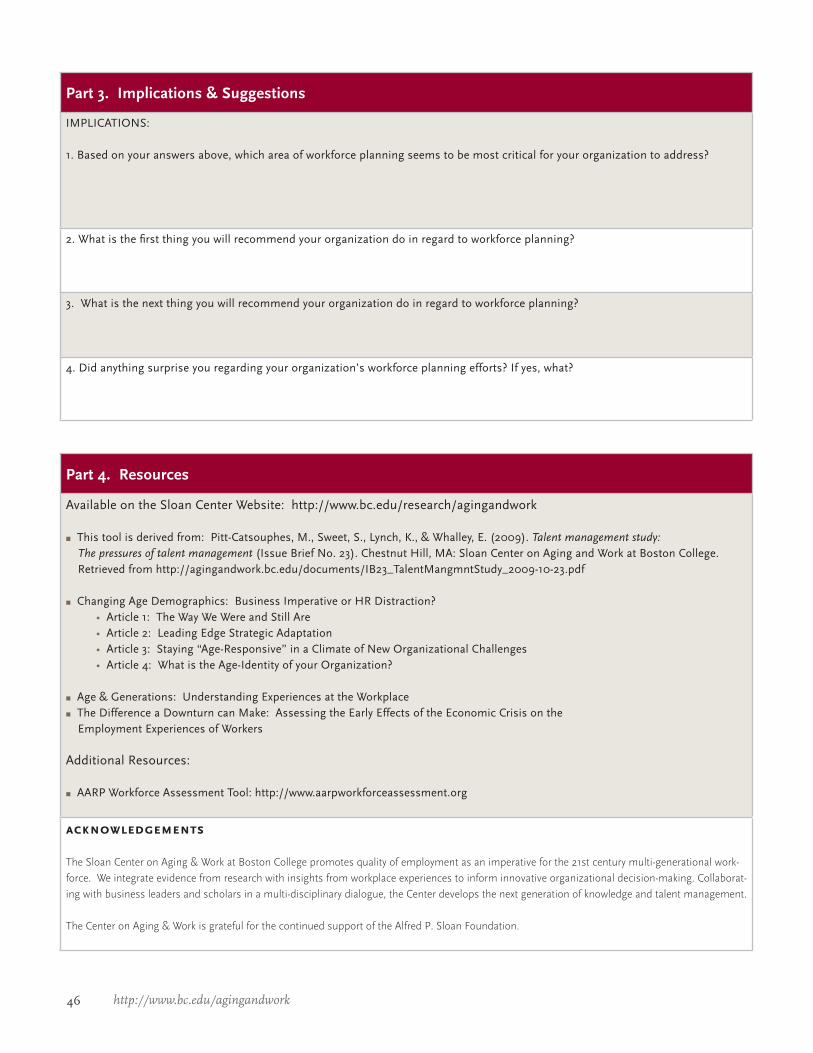
46 http://www.bc.edu/agingandwork
Part 3. Implications & Suggestions
IMPLICATIONS:
1. Based on your answers above, which area of workforce planning seems to be most critical for your organization to address?
2. What is the first thing you will recommend your organization do in regard to workforce planning?
3. What is the next thing you will recommend your organization do in regard to workforce planning?
4. Did anything surprise you regarding your organization’s workforce planning efforts? If yes, what?
Part 4. Resources
Available on the Sloan Center Website: http://www.bc.edu/research/agingandwork
This tool is derived from: Pitt-Catsouphes, M., Sweet, S., Lynch, K., & Whalley, E. (2009). ρ Talent management study: The pressures of talent management (Issue Brief No. 23). Chestnut Hill, MA: Sloan Center on Aging and Work at Boston College.Retrieved from http://agingandwork.bc.edu/documents/IB23_TalentMangmntStudy_2009-10-23.pdf
Changing Age Demographics: Business Imperative or HR Distraction? ρArticle 1: The Way We Were and Still Are• Article 2: Leading Edge Strategic Adaptation• Article 3: Staying “Age-Responsive” in a Climate of New Organizational Challenges• Article 4: What is the Age-Identity of your Organization?•
Age & Generations: Understanding Experiences at the Workplace ρThe Difference a Downturn can Make: Assessing the Early Effects of the Economic Crisis on the ρEmployment Experiences of Workers
Additional Resources:
AARP Workforce Assessment Tool: http://www.aarpworkforceassessment.org ρ
acknowledgements
The Sloan Center on Aging & Work at Boston College promotes quality of employment as an imperative for the 21st century multi-generational work-
force. We integrate evidence from research with insights from workplace experiences to inform innovative organizational decision-making. Collaborat-
ing with business leaders and scholars in a multi-disciplinary dialogue, the Center develops the next generation of knowledge and talent management.
The Center on Aging & Work is grateful for the continued support of the Alfred P. Sloan Foundation.
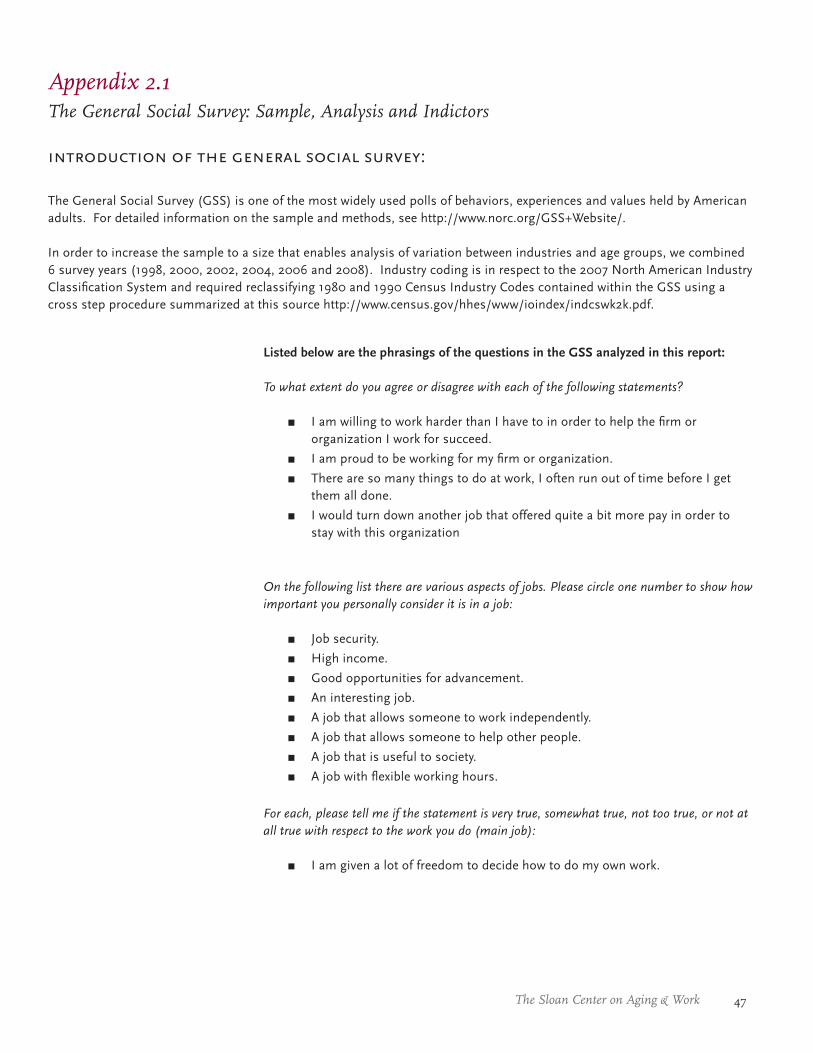
47The Sloan Center on Aging & Work
The General Social Survey (GSS) is one of the most widely used polls of behaviors, experiences and values held by American adults. For detailed information on the sample and methods, see http://www.norc.org/GSS+Website/.
In order to increase the sample to a size that enables analysis of variation between industries and age groups, we combined 6 survey years (1998, 2000, 2002, 2004, 2006 and 2008). Industry coding is in respect to the 2007 North American Industry Classification System and required reclassifying 1980 and 1990 Census Industry Codes contained within the GSS using a cross step procedure summarized at this source http://www.census.gov/hhes/www/ioindex/indcswk2k.pdf.
introduction of the general social survey:
Listed below are the phrasings of the questions in the GSS analyzed in this report:
To what extent do you agree or disagree with each of the following statements?
I am willing to work harder than I have to in order to help the firm or πorganization I work for succeed.
I am proud to be working for my firm or organization. π
There are so many things to do at work, I often run out of time before I get πthem all done.
I would turn down another job that offered quite a bit more pay in order to πstay with this organization
On the following list there are various aspects of jobs. Please circle one number to show how important you personally consider it is in a job:
Job security. π
High income. π
Good opportunities for advancement. π
An interesting job. π
A job that allows someone to work independently. π
A job that allows someone to help other people. π
A job that is useful to society. π
A job with flexible working hours. π
For each, please tell me if the statement is very true, somewhat true, not too true, or not at all true with respect to the work you do (main job):
I am given a lot of freedom to decide how to do my own work. π
Appendix 2.1The General Social Survey: Sample, Analysis and Indictors
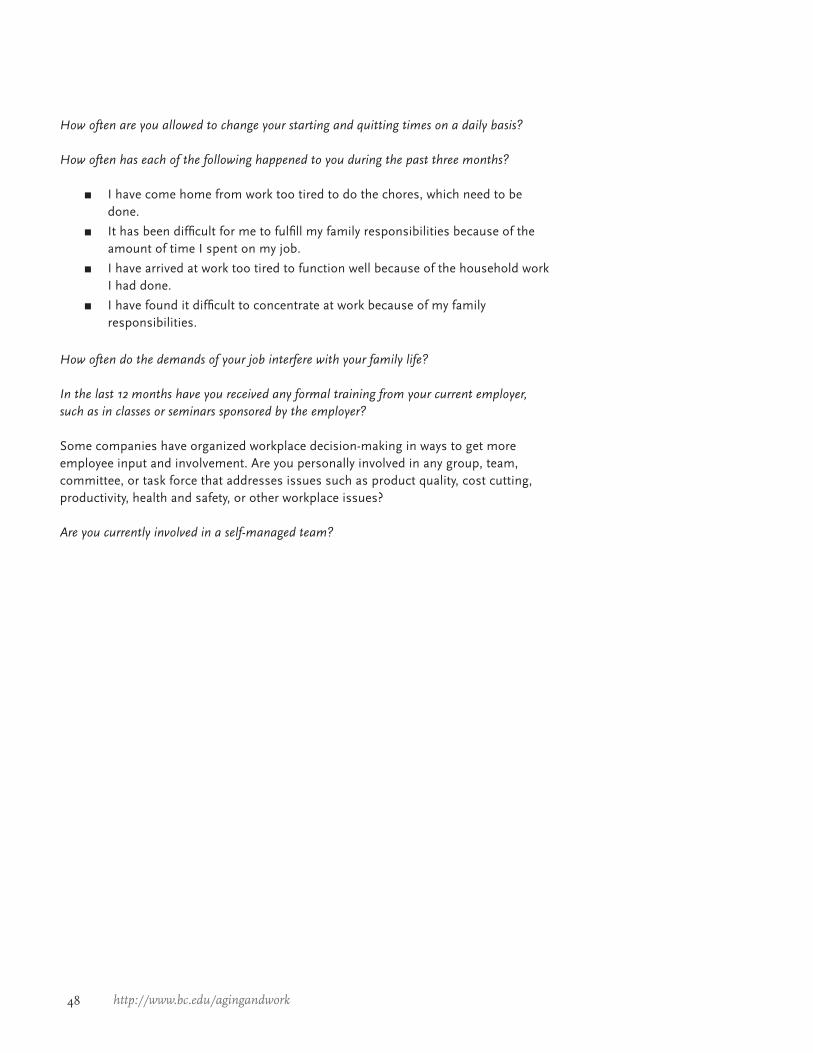
48 http://www.bc.edu/agingandwork
How often are you allowed to change your starting and quitting times on a daily basis?
How often has each of the following happened to you during the past three months?
I have come home from work too tired to do the chores, which need to be πdone.
It has been difficult for me to fulfill my family responsibilities because of the πamount of time I spent on my job.
I have arrived at work too tired to function well because of the household work πI had done.
I have found it difficult to concentrate at work because of my family πresponsibilities.
How often do the demands of your job interfere with your family life?
In the last 12 months have you received any formal training from your current employer, such as in classes or seminars sponsored by the employer?
Some companies have organized workplace decision-making in ways to get more employee input and involvement. Are you personally involved in any group, team, committee, or task force that addresses issues such as product quality, cost cutting, productivity, health and safety, or other workplace issues?
Are you currently involved in a self-managed team?
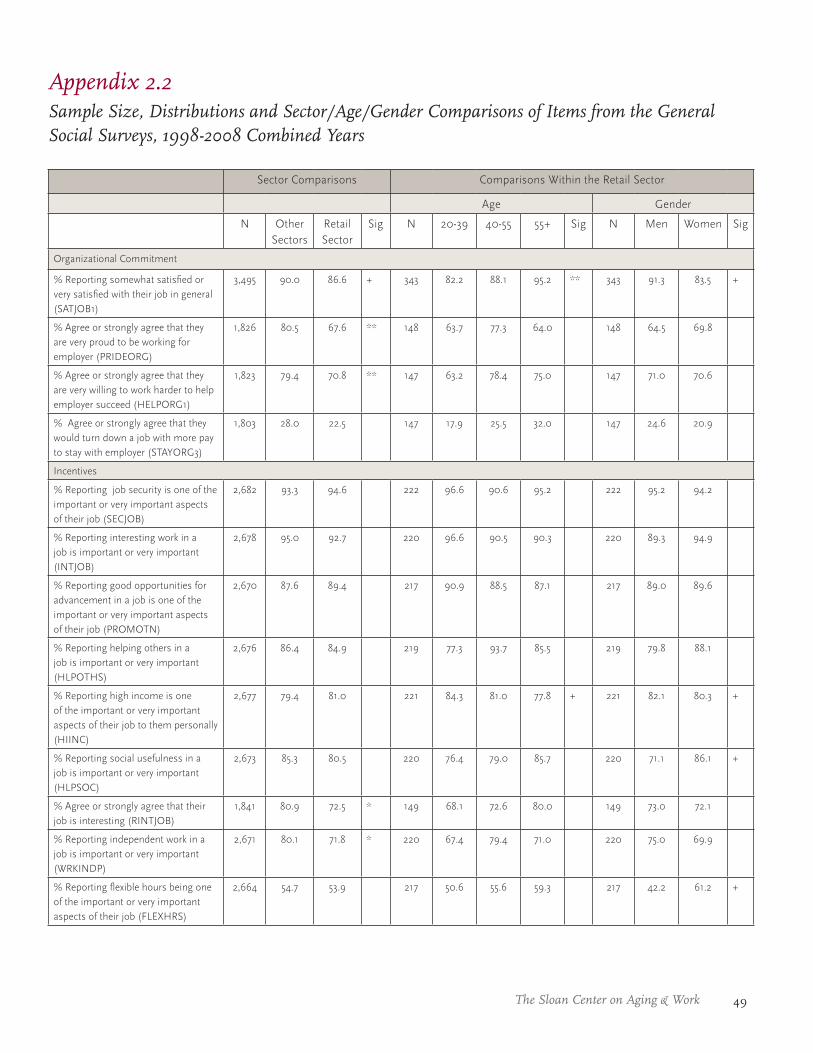
49The Sloan Center on Aging & Work
Appendix 2.2Sample Size, Distributions and Sector/Age/Gender Comparisons of Items from the General Social Surveys, 1998-2008 Combined Years
Sector Comparisons Comparisons Within the Retail Sector
Age Gender
N Other Sectors
Retail Sector
Sig N 20-39 40-55 55+ Sig N Men Women Sig
Organizational Commitment
% Reporting somewhat satisfied or very satisfied with their job in general (SATJOB1)
3,495 90.0 86.6 + 343 82.2 88.1 95.2 ** 343 91.3 83.5 +
% Agree or strongly agree that they are very proud to be working for employer (PRIDEORG)
1,826 80.5 67.6 ** 148 63.7 77.3 64.0 148 64.5 69.8
% Agree or strongly agree that they are very willing to work harder to help employer succeed (HELPORG1)
1,823 79.4 70.8 ** 147 63.2 78.4 75.0 147 71.0 70.6
% Agree or strongly agree that they would turn down a job with more pay to stay with employer (STAYORG3)
1,803 28.0 22.5 147 17.9 25.5 32.0 147 24.6 20.9
Incentives
% Reporting job security is one of the important or very important aspects of their job (SECJOB)
2,682 93.3 94.6 222 96.6 90.6 95.2 222 95.2 94.2
% Reporting interesting work in a job is important or very important (INTJOB)
2,678 95.0 92.7 220 96.6 90.5 90.3 220 89.3 94.9
% Reporting good opportunities for advancement in a job is one of the important or very important aspects of their job (PROMOTN)
2,670 87.6 89.4 217 90.9 88.5 87.1 217 89.0 89.6
% Reporting helping others in a job is important or very important (HLPOTHS)
2,676 86.4 84.9 219 77.3 93.7 85.5 219 79.8 88.1
% Reporting high income is one of the important or very important aspects of their job to them personally (HIINC)
2,677 79.4 81.0 221 84.3 81.0 77.8 + 221 82.1 80.3 +
% Reporting social usefulness in a job is important or very important (HLPSOC)
2,673 85.3 80.5 220 76.4 79.0 85.7 220 71.1 86.1 +
% Agree or strongly agree that their job is interesting (RINTJOB)
1,841 80.9 72.5 * 149 68.1 72.6 80.0 149 73.0 72.1
% Reporting independent work in a job is important or very important (WRKINDP)
2,671 80.1 71.8 * 220 67.4 79.4 71.0 220 75.0 69.9
% Reporting flexible hours being one of the important or very important aspects of their job (FLEXHRS)
2,664 54.7 53.9 217 50.6 55.6 59.3 217 42.2 61.2 +
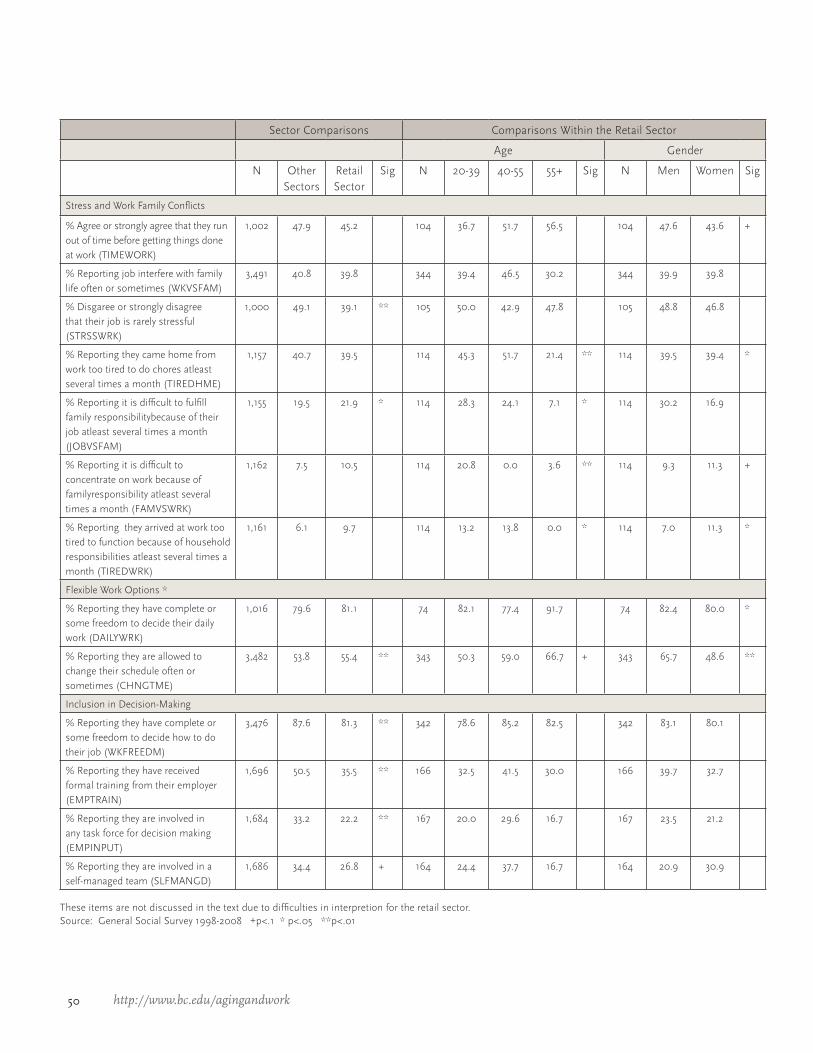
50 http://www.bc.edu/agingandwork
Sector Comparisons Comparisons Within the Retail Sector
Age Gender
N Other Sectors
Retail Sector
Sig N 20-39 40-55 55+ Sig N Men Women Sig
Stress and Work Family Conflicts
% Agree or strongly agree that they run out of time before getting things done at work (TIMEWORK)
1,002 47.9 45.2 104 36.7 51.7 56.5 104 47.6 43.6 +
% Reporting job interfere with family life often or sometimes (WKVSFAM)
3,491 40.8 39.8 344 39.4 46.5 30.2 344 39.9 39.8
% Disgaree or strongly disagree that their job is rarely stressful (STRSSWRK)
1,000 49.1 39.1 ** 105 50.0 42.9 47.8 105 48.8 46.8
% Reporting they came home from work too tired to do chores atleast several times a month (TIREDHME)
1,157 40.7 39.5 114 45.3 51.7 21.4 ** 114 39.5 39.4 *
% Reporting it is difficult to fulfill family responsibilitybecause of their job atleast several times a month (JOBVSFAM)
1,155 19.5 21.9 * 114 28.3 24.1 7.1 * 114 30.2 16.9
% Reporting it is difficult to concentrate on work because of familyresponsibility atleast several times a month (FAMVSWRK)
1,162 7.5 10.5 114 20.8 0.0 3.6 ** 114 9.3 11.3 +
% Reporting they arrived at work too tired to function because of household responsibilities atleast several times a month (TIREDWRK)
1,161 6.1 9.7 114 13.2 13.8 0.0 * 114 7.0 11.3 *
Flexible Work Options *
% Reporting they have complete or some freedom to decide their daily work (DAILYWRK)
1,016 79.6 81.1 74 82.1 77.4 91.7 74 82.4 80.0 *
% Reporting they are allowed to change their schedule often or sometimes (CHNGTME)
3,482 53.8 55.4 ** 343 50.3 59.0 66.7 + 343 65.7 48.6 **
Inclusion in Decision-Making
% Reporting they have complete or some freedom to decide how to do their job (WKFREEDM)
3,476 87.6 81.3 ** 342 78.6 85.2 82.5 342 83.1 80.1
% Reporting they have received formal training from their employer (EMPTRAIN)
1,696 50.5 35.5 ** 166 32.5 41.5 30.0 166 39.7 32.7
% Reporting they are involved in any task force for decision making (EMPINPUT)
1,684 33.2 22.2 ** 167 20.0 29.6 16.7 167 23.5 21.2
% Reporting they are involved in a self-managed team (SLFMANGD)
1,686 34.4 26.8 + 164 24.4 37.7 16.7 164 20.9 30.9
These items are not discussed in the text due to difficulties in interpretion for the retail sector.Source: General Social Survey 1998-2008 +p<.1 * p<.05 **p<.01
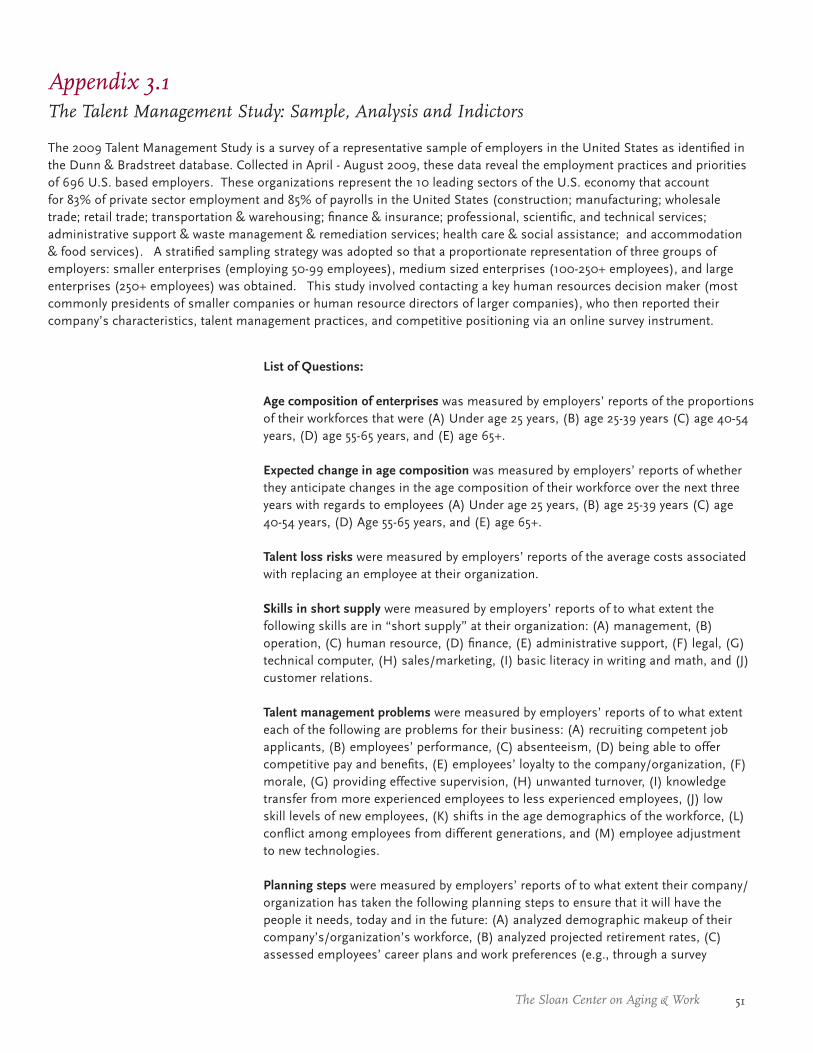
51The Sloan Center on Aging & Work
The 2009 Talent Management Study is a survey of a representative sample of employers in the United States as identified in the Dunn & Bradstreet database. Collected in April - August 2009, these data reveal the employment practices and priorities of 696 U.S. based employers. These organizations represent the 10 leading sectors of the U.S. economy that account for 83% of private sector employment and 85% of payrolls in the United States (construction; manufacturing; wholesale trade; retail trade; transportation & warehousing; finance & insurance; professional, scientific, and technical services; administrative support & waste management & remediation services; health care & social assistance; and accommodation & food services). A stratified sampling strategy was adopted so that a proportionate representation of three groups of employers: smaller enterprises (employing 50-99 employees), medium sized enterprises (100-250+ employees), and large enterprises (250+ employees) was obtained. This study involved contacting a key human resources decision maker (most commonly presidents of smaller companies or human resource directors of larger companies), who then reported their company’s characteristics, talent management practices, and competitive positioning via an online survey instrument.
Appendix 3.1The Talent Management Study: Sample, Analysis and Indictors
List of Questions:
Age composition of enterprises was measured by employers’ reports of the proportions of their workforces that were (A) Under age 25 years, (B) age 25-39 years (C) age 40-54 years, (D) age 55-65 years, and (E) age 65+.
Expected change in age composition was measured by employers’ reports of whether they anticipate changes in the age composition of their workforce over the next three years with regards to employees (A) Under age 25 years, (B) age 25-39 years (C) age 40-54 years, (D) Age 55-65 years, and (E) age 65+.
Talent loss risks were measured by employers’ reports of the average costs associated with replacing an employee at their organization.
Skills in short supply were measured by employers’ reports of to what extent the following skills are in “short supply” at their organization: (A) management, (B) operation, (C) human resource, (D) finance, (E) administrative support, (F) legal, (G) technical computer, (H) sales/marketing, (I) basic literacy in writing and math, and (J) customer relations.
Talent management problems were measured by employers’ reports of to what extent each of the following are problems for their business: (A) recruiting competent job applicants, (B) employees’ performance, (C) absenteeism, (D) being able to offer competitive pay and benefits, (E) employees’ loyalty to the company/organization, (F) morale, (G) providing effective supervision, (H) unwanted turnover, (I) knowledge transfer from more experienced employees to less experienced employees, (J) low skill levels of new employees, (K) shifts in the age demographics of the workforce, (L) conflict among employees from different generations, and (M) employee adjustment to new technologies.
Planning steps were measured by employers’ reports of to what extent their company/organization has taken the following planning steps to ensure that it will have the people it needs, today and in the future: (A) analyzed demographic makeup of their company’s/organization’s workforce, (B) analyzed projected retirement rates, (C) assessed employees’ career plans and work preferences (e.g., through a survey
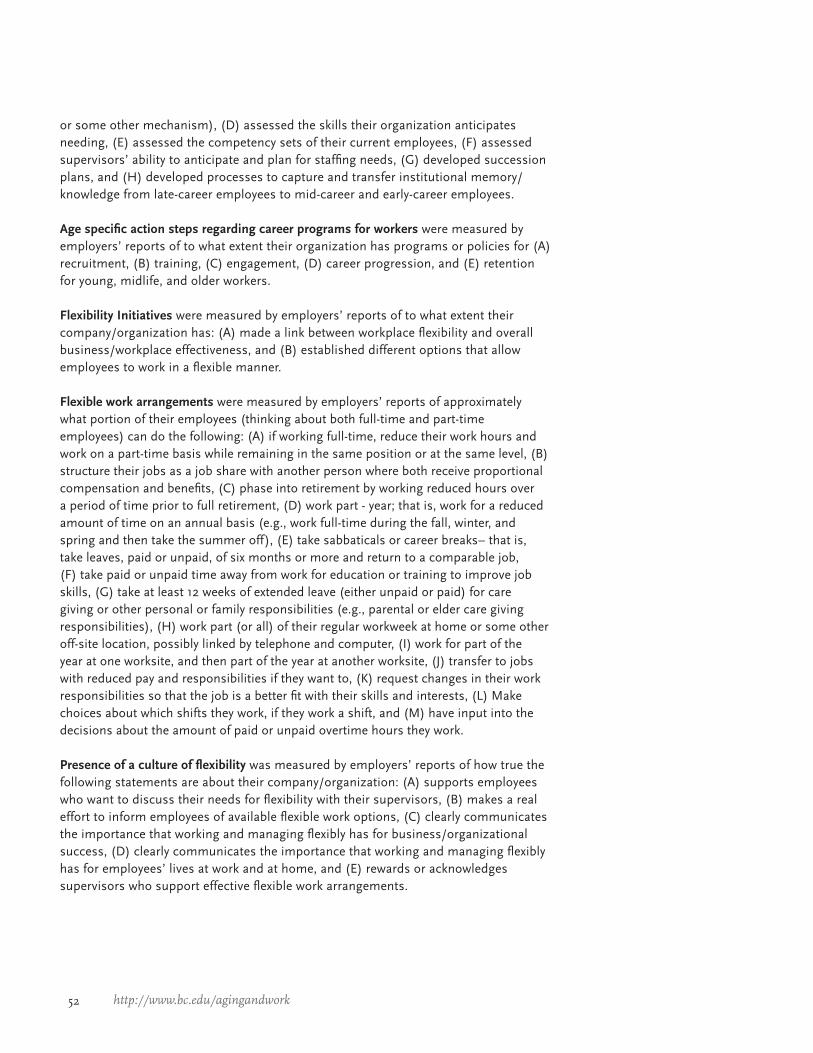
52 http://www.bc.edu/agingandwork
or some other mechanism), (D) assessed the skills their organization anticipates needing, (E) assessed the competency sets of their current employees, (F) assessed supervisors’ ability to anticipate and plan for staffing needs, (G) developed succession plans, and (H) developed processes to capture and transfer institutional memory/ knowledge from late-career employees to mid-career and early-career employees.
Age specific action steps regarding career programs for workers were measured by employers’ reports of to what extent their organization has programs or policies for (A) recruitment, (B) training, (C) engagement, (D) career progression, and (E) retention for young, midlife, and older workers.
Flexibility Initiatives were measured by employers’ reports of to what extent their company/organization has: (A) made a link between workplace flexibility and overall business/workplace effectiveness, and (B) established different options that allow employees to work in a flexible manner.
Flexible work arrangements were measured by employers’ reports of approximately what portion of their employees (thinking about both full-time and part-time employees) can do the following: (A) if working full-time, reduce their work hours and work on a part-time basis while remaining in the same position or at the same level, (B) structure their jobs as a job share with another person where both receive proportional compensation and benefits, (C) phase into retirement by working reduced hours over a period of time prior to full retirement, (D) work part - year; that is, work for a reduced amount of time on an annual basis (e.g., work full-time during the fall, winter, and spring and then take the summer off), (E) take sabbaticals or career breaks– that is, take leaves, paid or unpaid, of six months or more and return to a comparable job, (F) take paid or unpaid time away from work for education or training to improve job skills, (G) take at least 12 weeks of extended leave (either unpaid or paid) for care giving or other personal or family responsibilities (e.g., parental or elder care giving responsibilities), (H) work part (or all) of their regular workweek at home or some other off-site location, possibly linked by telephone and computer, (I) work for part of the year at one worksite, and then part of the year at another worksite, (J) transfer to jobs with reduced pay and responsibilities if they want to, (K) request changes in their work responsibilities so that the job is a better fit with their skills and interests, (L) Make choices about which shifts they work, if they work a shift, and (M) have input into the decisions about the amount of paid or unpaid overtime hours they work.
Presence of a culture of flexibility was measured by employers’ reports of how true the following statements are about their company/organization: (A) supports employees who want to discuss their needs for flexibility with their supervisors, (B) makes a real effort to inform employees of available flexible work options, (C) clearly communicates the importance that working and managing flexibly has for business/organizational success, (D) clearly communicates the importance that working and managing flexibly has for employees’ lives at work and at home, and (E) rewards or acknowledges supervisors who support effective flexible work arrangements.
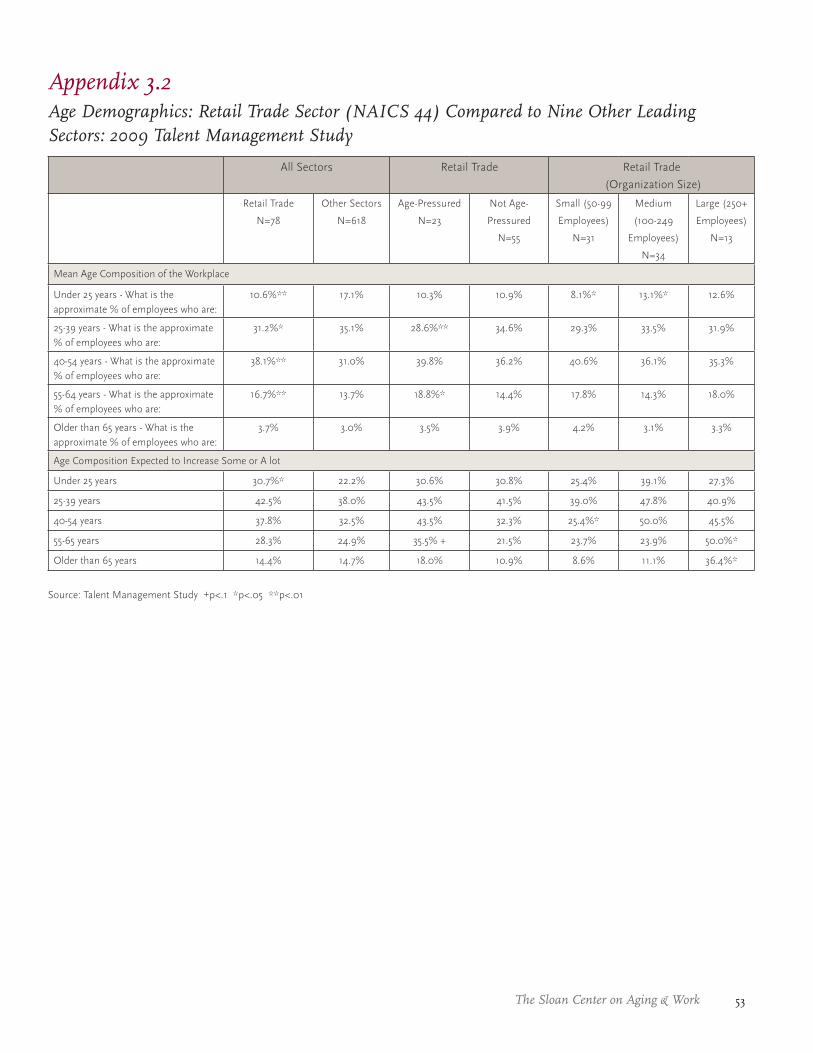
53The Sloan Center on Aging & Work
Appendix 3.2Age Demographics: Retail Trade Sector (NAICS 44) Compared to Nine Other Leading Sectors: 2009 Talent Management Study
All Sectors Retail Trade Retail Trade
(Organization Size)
Retail Trade
N=78
Other Sectors
N=618
Age-Pressured
N=23
Not Age-
Pressured
N=55
Small (50-99
Employees)
N=31
Medium
(100-249
Employees)
N=34
Large (250+
Employees)
N=13
Mean Age Composition of the Workplace
Under 25 years - What is the approximate % of employees who are:
10.6%** 17.1% 10.3% 10.9% 8.1%* 13.1%* 12.6%
25-39 years - What is the approximate % of employees who are:
31.2%* 35.1% 28.6%** 34.6% 29.3% 33.5% 31.9%
40-54 years - What is the approximate % of employees who are:
38.1%** 31.0% 39.8% 36.2% 40.6% 36.1% 35.3%
55-64 years - What is the approximate % of employees who are:
16.7%** 13.7% 18.8%* 14.4% 17.8% 14.3% 18.0%
Older than 65 years - What is the approximate % of employees who are:
3.7% 3.0% 3.5% 3.9% 4.2% 3.1% 3.3%
Age Composition Expected to Increase Some or A lot
Under 25 years 30.7%* 22.2% 30.6% 30.8% 25.4% 39.1% 27.3%
25-39 years 42.5% 38.0% 43.5% 41.5% 39.0% 47.8% 40.9%
40-54 years 37.8% 32.5% 43.5% 32.3% 25.4%* 50.0% 45.5%
55-65 years 28.3% 24.9% 35.5% + 21.5% 23.7% 23.9% 50.0%*
Older than 65 years 14.4% 14.7% 18.0% 10.9% 8.6% 11.1% 36.4%*
Source: Talent Management Study +p<.1 *p<.05 **p<.01
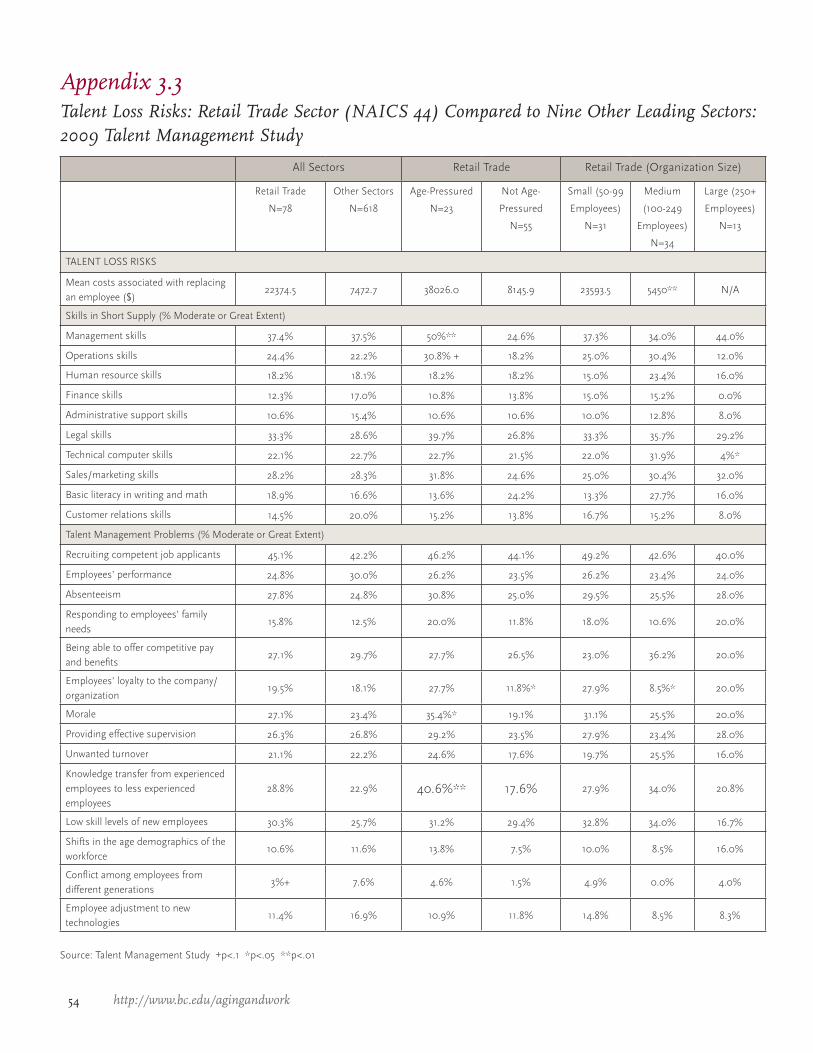
54 http://www.bc.edu/agingandwork
Appendix 3.3Talent Loss Risks: Retail Trade Sector (NAICS 44) Compared to Nine Other Leading Sectors: 2009 Talent Management Study
All Sectors Retail Trade Retail Trade (Organization Size)
Retail Trade
N=78
Other Sectors
N=618
Age-Pressured
N=23
Not Age-
Pressured
N=55
Small (50-99
Employees)
N=31
Medium
(100-249
Employees)
N=34
Large (250+
Employees)
N=13
TALENT LOSS RISKS
Mean costs associated with replacing an employee ($)
22374.5 7472.7 38026.0 8145.9 23593.5 5450** N/A
Skills in Short Supply (% Moderate or Great Extent)
Management skills 37.4% 37.5% 50%** 24.6% 37.3% 34.0% 44.0%
Operations skills 24.4% 22.2% 30.8% + 18.2% 25.0% 30.4% 12.0%
Human resource skills 18.2% 18.1% 18.2% 18.2% 15.0% 23.4% 16.0%
Finance skills 12.3% 17.0% 10.8% 13.8% 15.0% 15.2% 0.0%
Administrative support skills 10.6% 15.4% 10.6% 10.6% 10.0% 12.8% 8.0%
Legal skills 33.3% 28.6% 39.7% 26.8% 33.3% 35.7% 29.2%
Technical computer skills 22.1% 22.7% 22.7% 21.5% 22.0% 31.9% 4%*
Sales/marketing skills 28.2% 28.3% 31.8% 24.6% 25.0% 30.4% 32.0%
Basic literacy in writing and math 18.9% 16.6% 13.6% 24.2% 13.3% 27.7% 16.0%
Customer relations skills 14.5% 20.0% 15.2% 13.8% 16.7% 15.2% 8.0%
Talent Management Problems (% Moderate or Great Extent)
Recruiting competent job applicants 45.1% 42.2% 46.2% 44.1% 49.2% 42.6% 40.0%
Employees’ performance 24.8% 30.0% 26.2% 23.5% 26.2% 23.4% 24.0%
Absenteeism 27.8% 24.8% 30.8% 25.0% 29.5% 25.5% 28.0%
Responding to employees’ family needs
15.8% 12.5% 20.0% 11.8% 18.0% 10.6% 20.0%
Being able to offer competitive pay and benefits
27.1% 29.7% 27.7% 26.5% 23.0% 36.2% 20.0%
Employees’ loyalty to the company/organization
19.5% 18.1% 27.7% 11.8%* 27.9% 8.5%* 20.0%
Morale 27.1% 23.4% 35.4%* 19.1% 31.1% 25.5% 20.0%
Providing effective supervision 26.3% 26.8% 29.2% 23.5% 27.9% 23.4% 28.0%
Unwanted turnover 21.1% 22.2% 24.6% 17.6% 19.7% 25.5% 16.0%
Knowledge transfer from experienced employees to less experienced employees
28.8% 22.9% 40.6%** 17.6% 27.9% 34.0% 20.8%
Low skill levels of new employees 30.3% 25.7% 31.2% 29.4% 32.8% 34.0% 16.7%
Shifts in the age demographics of the workforce
10.6% 11.6% 13.8% 7.5% 10.0% 8.5% 16.0%
Conflict among employees from different generations
3%+ 7.6% 4.6% 1.5% 4.9% 0.0% 4.0%
Employee adjustment to new technologies
11.4% 16.9% 10.9% 11.8% 14.8% 8.5% 8.3%
Source: Talent Management Study +p<.1 *p<.05 **p<.01
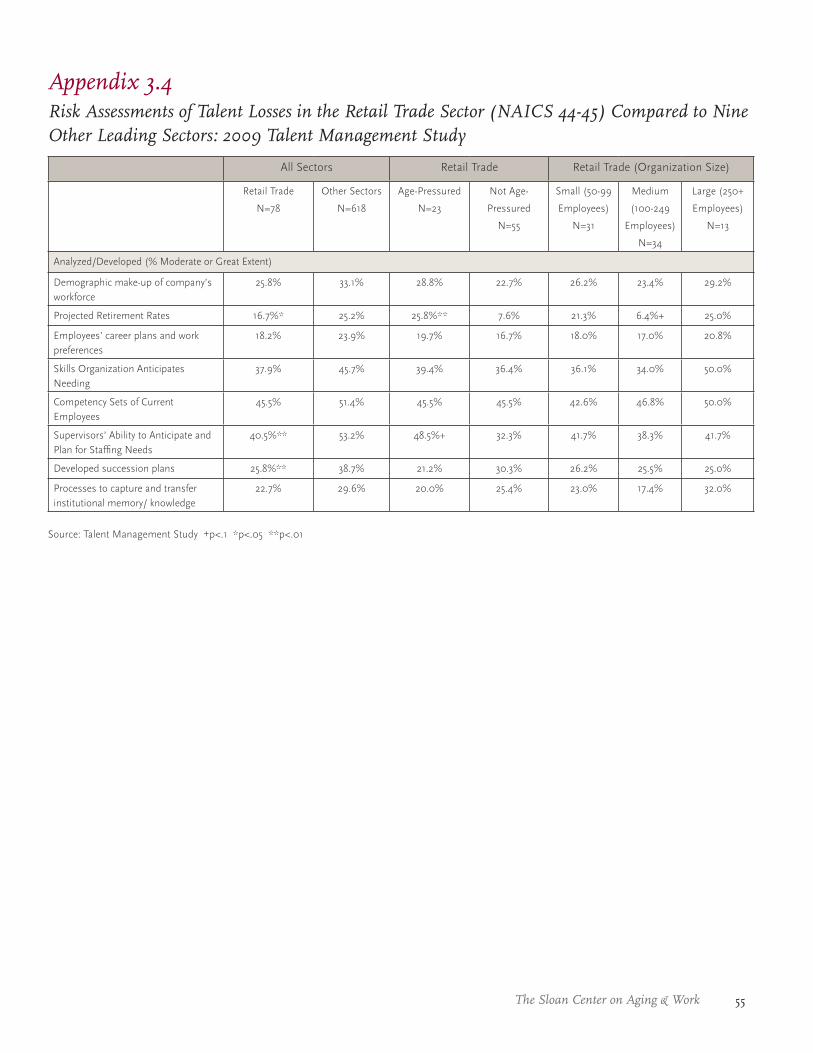
55The Sloan Center on Aging & Work
Appendix 3.4Risk Assessments of Talent Losses in the Retail Trade Sector (NAICS 44-45) Compared to Nine Other Leading Sectors: 2009 Talent Management Study
All Sectors Retail Trade Retail Trade (Organization Size)
Retail Trade
N=78
Other Sectors
N=618
Age-Pressured
N=23
Not Age-
Pressured
N=55
Small (50-99
Employees)
N=31
Medium
(100-249
Employees)
N=34
Large (250+
Employees)
N=13
Analyzed/Developed (% Moderate or Great Extent)
Demographic make-up of company’s workforce
25.8% 33.1% 28.8% 22.7% 26.2% 23.4% 29.2%
Projected Retirement Rates 16.7%* 25.2% 25.8%** 7.6% 21.3% 6.4%+ 25.0%
Employees’ career plans and work preferences
18.2% 23.9% 19.7% 16.7% 18.0% 17.0% 20.8%
Skills Organization Anticipates Needing
37.9% 45.7% 39.4% 36.4% 36.1% 34.0% 50.0%
Competency Sets of Current Employees
45.5% 51.4% 45.5% 45.5% 42.6% 46.8% 50.0%
Supervisors’ Ability to Anticipate and Plan for Staffing Needs
40.5%** 53.2% 48.5%+ 32.3% 41.7% 38.3% 41.7%
Developed succession plans 25.8%** 38.7% 21.2% 30.3% 26.2% 25.5% 25.0%
Processes to capture and transfer institutional memory/ knowledge
22.7% 29.6% 20.0% 25.4% 23.0% 17.4% 32.0%
Source: Talent Management Study +p<.1 *p<.05 **p<.01
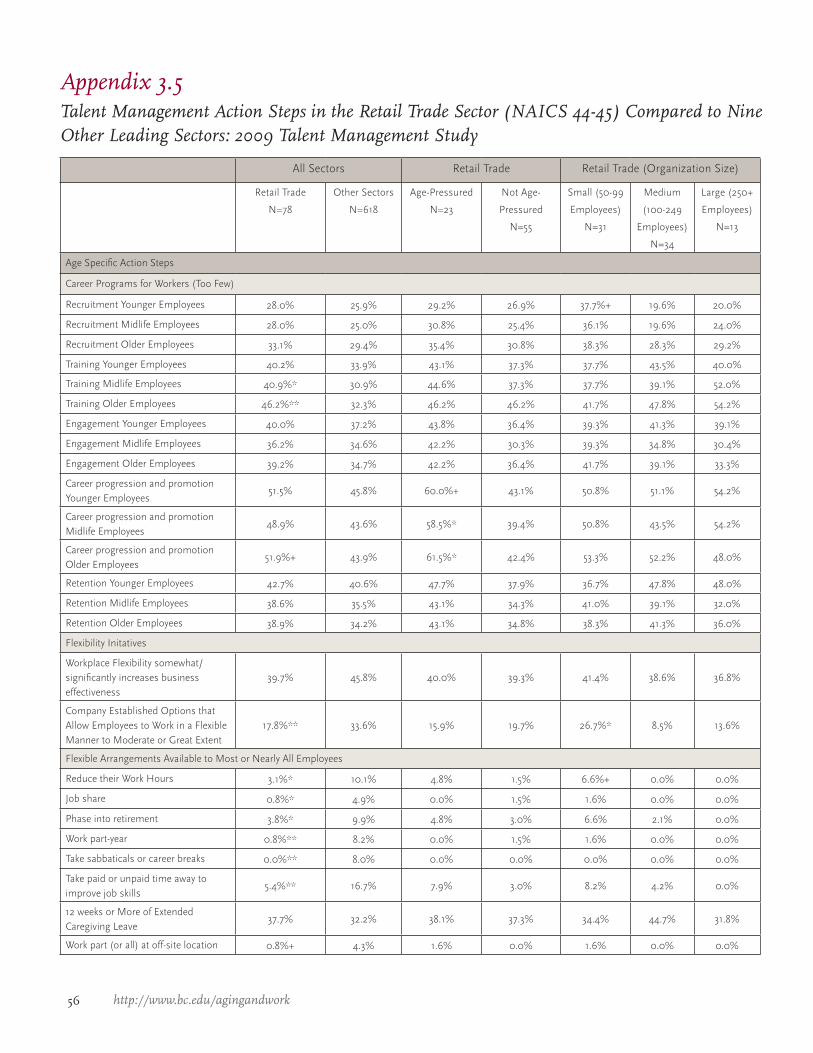
56 http://www.bc.edu/agingandwork
All Sectors Retail Trade Retail Trade (Organization Size)
Retail Trade
N=78
Other Sectors
N=618
Age-Pressured
N=23
Not Age-
Pressured
N=55
Small (50-99
Employees)
N=31
Medium
(100-249
Employees)
N=34
Large (250+
Employees)
N=13
Age Specific Action Steps
Career Programs for Workers (Too Few)
Recruitment Younger Employees 28.0% 25.9% 29.2% 26.9% 37.7%+ 19.6% 20.0%
Recruitment Midlife Employees 28.0% 25.0% 30.8% 25.4% 36.1% 19.6% 24.0%
Recruitment Older Employees 33.1% 29.4% 35.4% 30.8% 38.3% 28.3% 29.2%
Training Younger Employees 40.2% 33.9% 43.1% 37.3% 37.7% 43.5% 40.0%
Training Midlife Employees 40.9%* 30.9% 44.6% 37.3% 37.7% 39.1% 52.0%
Training Older Employees 46.2%** 32.3% 46.2% 46.2% 41.7% 47.8% 54.2%
Engagement Younger Employees 40.0% 37.2% 43.8% 36.4% 39.3% 41.3% 39.1%
Engagement Midlife Employees 36.2% 34.6% 42.2% 30.3% 39.3% 34.8% 30.4%
Engagement Older Employees 39.2% 34.7% 42.2% 36.4% 41.7% 39.1% 33.3%
Career progression and promotion Younger Employees
51.5% 45.8% 60.0%+ 43.1% 50.8% 51.1% 54.2%
Career progression and promotion Midlife Employees
48.9% 43.6% 58.5%* 39.4% 50.8% 43.5% 54.2%
Career progression and promotion Older Employees
51.9%+ 43.9% 61.5%* 42.4% 53.3% 52.2% 48.0%
Retention Younger Employees 42.7% 40.6% 47.7% 37.9% 36.7% 47.8% 48.0%
Retention Midlife Employees 38.6% 35.5% 43.1% 34.3% 41.0% 39.1% 32.0%
Retention Older Employees 38.9% 34.2% 43.1% 34.8% 38.3% 41.3% 36.0%
Flexibility Initatives
Workplace Flexibility somewhat/significantly increases business effectiveness
39.7% 45.8% 40.0% 39.3% 41.4% 38.6% 36.8%
Company Established Options that Allow Employees to Work in a Flexible Manner to Moderate or Great Extent
17.8%** 33.6% 15.9% 19.7% 26.7%* 8.5% 13.6%
Flexible Arrangements Available to Most or Nearly All Employees
Reduce their Work Hours 3.1%* 10.1% 4.8% 1.5% 6.6%+ 0.0% 0.0%
Job share 0.8%* 4.9% 0.0% 1.5% 1.6% 0.0% 0.0%
Phase into retirement 3.8%* 9.9% 4.8% 3.0% 6.6% 2.1% 0.0%
Work part-year 0.8%** 8.2% 0.0% 1.5% 1.6% 0.0% 0.0%
Take sabbaticals or career breaks 0.0%** 8.0% 0.0% 0.0% 0.0% 0.0% 0.0%
Take paid or unpaid time away to improve job skills
5.4%** 16.7% 7.9% 3.0% 8.2% 4.2% 0.0%
12 weeks or More of Extended Caregiving Leave
37.7% 32.2% 38.1% 37.3% 34.4% 44.7% 31.8%
Work part (or all) at off-site location 0.8%+ 4.3% 1.6% 0.0% 1.6% 0.0% 0.0%
Appendix 3.5Talent Management Action Steps in the Retail Trade Sector (NAICS 44-45) Compared to Nine Other Leading Sectors: 2009 Talent Management Study
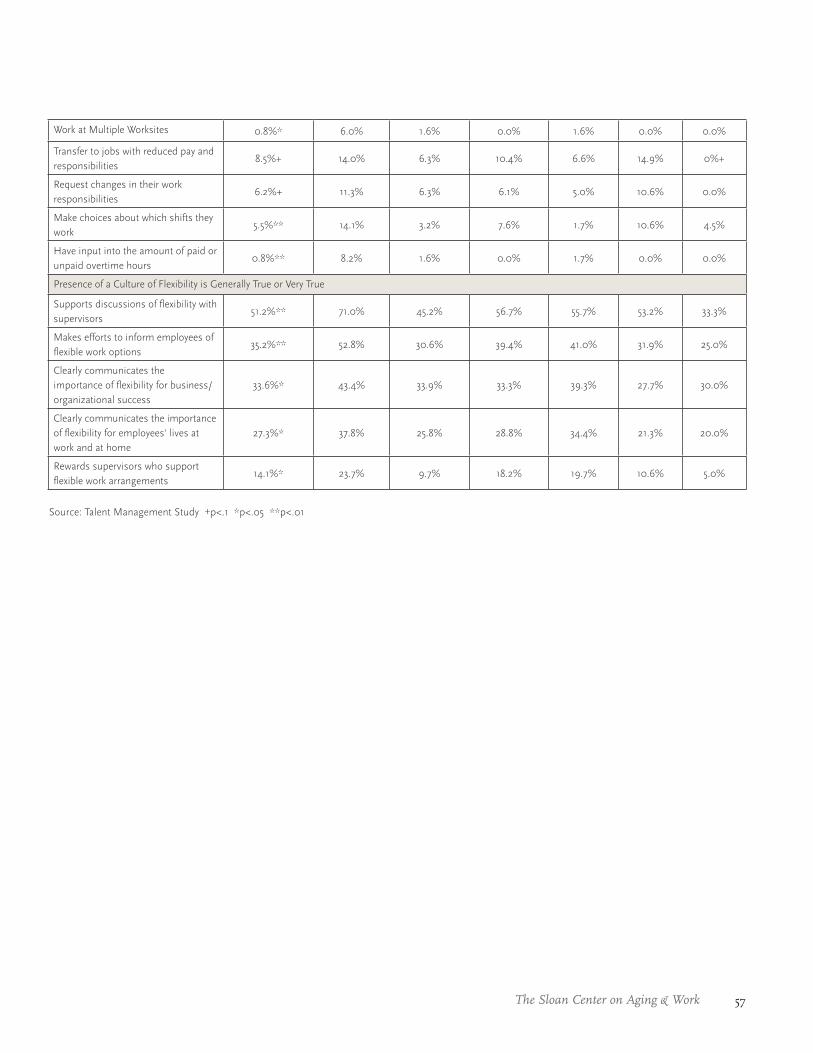
57The Sloan Center on Aging & Work
Work at Multiple Worksites 0.8%* 6.0% 1.6% 0.0% 1.6% 0.0% 0.0%
Transfer to jobs with reduced pay and responsibilities
8.5%+ 14.0% 6.3% 10.4% 6.6% 14.9% 0%+
Request changes in their work responsibilities
6.2%+ 11.3% 6.3% 6.1% 5.0% 10.6% 0.0%
Make choices about which shifts they work
5.5%** 14.1% 3.2% 7.6% 1.7% 10.6% 4.5%
Have input into the amount of paid or unpaid overtime hours
0.8%** 8.2% 1.6% 0.0% 1.7% 0.0% 0.0%
Presence of a Culture of Flexibility is Generally True or Very True
Supports discussions of flexibility with supervisors
51.2%** 71.0% 45.2% 56.7% 55.7% 53.2% 33.3%
Makes efforts to inform employees of flexible work options
35.2%** 52.8% 30.6% 39.4% 41.0% 31.9% 25.0%
Clearly communicates the importance of flexibility for business/organizational success
33.6%* 43.4% 33.9% 33.3% 39.3% 27.7% 30.0%
Clearly communicates the importance of flexibility for employees' lives at work and at home
27.3%* 37.8% 25.8% 28.8% 34.4% 21.3% 20.0%
Rewards supervisors who support flexible work arrangements
14.1%* 23.7% 9.7% 18.2% 19.7% 10.6% 5.0%
Source: Talent Management Study +p<.1 *p<.05 **p<.01
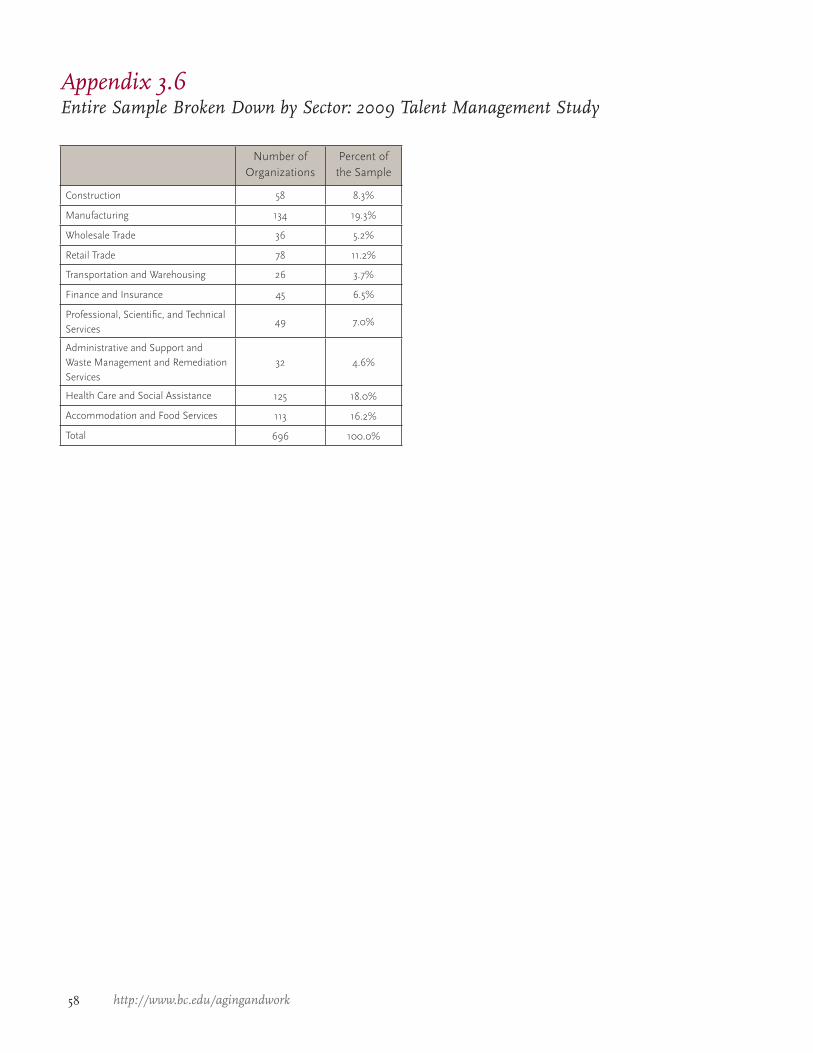
58 http://www.bc.edu/agingandwork
Appendix 3.6Entire Sample Broken Down by Sector: 2009 Talent Management Study
Number of Organizations
Percent of the Sample
Construction 58 8.3%
Manufacturing 134 19.3%
Wholesale Trade 36 5.2%
Retail Trade 78 11.2%
Transportation and Warehousing 26 3.7%
Finance and Insurance 45 6.5%
Professional, Scientific, and Technical Services
49 7.0%
Administrative and Support and Waste Management and Remediation Services
32 4.6%
Health Care and Social Assistance 125 18.0%
Accommodation and Food Services 113 16.2%
Total 696 100.0%
59The Sloan Center on Aging & Work
End Notes
Authors
1 Compensation (National Compensation Survey) is a term used to encompass the entire range of wages and
benefits, both current and deferred, that employees receive in return for their work. In the Employment
Cost Index (ECI), compensation includes the employer’s cost of wages and salaries, plus the employer’s
cost of providing employee benefits.
2 These surveys, generated from face-to-face interviews, offer a window on the perspectives and values of a
representative sample of Americans laboring within and beyond the health care and social assistance sector.
A description of methods of studying the 1998-2008 General Social Survey, samples and measures, as well
as additional relationships, are presented in Appendix 2.1 and Appendix 2.2.
3 The Family Medical Leave Act requires that employees have access to 12 weeks unpaid leave to accommodate
their own or other family members’ needs – such as for the birth of a child or to address the care needs of
a spouse or an aging parent. Eligibility varies, however, depending on factors such as the establishment
size, full time work status, and tenure, and thus a sizable proportion of the labor force is not entitled to this
leave.G
Stephen Sweet is Associate Professor of Sociology at Ithaca College and a visiting scholar at the Sloan Center on Aging & Work at Boston College. He has published widely on work-family concerns. His most recent books are Changing Contours of Work (2008), The Work and Family Handbook: Interdisciplinary Perspectives, Methods and Approaches (2005), and Data Analysis with SPSS: A First Course in Applied Statistics (2008, 2003, 1998). His current research focuses on the intersecting concerns of job security, talent retention, and the changing composition of the workforce.
Marcie Pitt-Catsouphes, Ph.D., is Director of the Sloan Center on Aging & Work at Boston College. She is an Associate Professor at the Boston College Graduate School of Social Work and also holds appointments at the Boston College Carroll School of Management as well as the Middlesex University Business School in London. Dr. Pitt-Catsouphes received the 2006 Work-Life Legacy Award from the Families and Work Institute.
Elyssa Besen is Research Assistant at the Sloan Center on Aging & Work and a doctoral student in the Applied Development Psychology Program in the Lynch School of Education at Boston College. She earned her BA in Psychology from Brandeis University. She is interested in studying the impact of work on adult development.
Farooq Pasha is currently a doctoral student in Economics at Boston College. A native of Pakistan, he is presently working as a Research Affiliate with the Sloan Center on Aging & Work, where he is helping to develop the Country Context Study.
Shoghik Hovhannisyan, a native of Armenia, majored in Economic Cybernetics at the Yerevan State Institute of National Economy. Working with the Armenian Ministry of Finance and Economy for six years, she ultimately functioned as Head of Working Groups, coordinating the work of twelve regional units. Shoghik also attended the Terry Sanford School of Public Policy at Duke University and, since 2005, has consulted for various organizations including the World Bank, Urban Institute, the Duke Center for International Development, and the Center for Retirement Research at Boston College. Shoghik is currently pursuing a PhD in Economics at Boston College while actively collaborating with the Sloan Center on Aging & Work.