talley et al., 2011. descriptive physical oceanography · (a) track of the fram (1893 -1896). (b)...
TRANSCRIPT

Talley et al., 2011. Descriptive Physical Oceanography
http://booksite.elsevier.com/DPO/figureppt.php

FIGURE 1.1b
(b) Franklin-Folger map of the Gulf Stream. Source: From Richardson (1980a).
TALLEY Copyright © 2011 Elsevier Inc. All rights reserved

FIGURE 12.7a FIGURE 12.7b(a) Track of the Fram (1893-1896). (b) The ship was intentionally frozen into the ice in 1893 and drifted with the pack until 1896. © www.frammuseum.no. Source: From Frammuseet (2003).
TALLEY Copyright © 2011 Elsevier Inc. All rights reserved
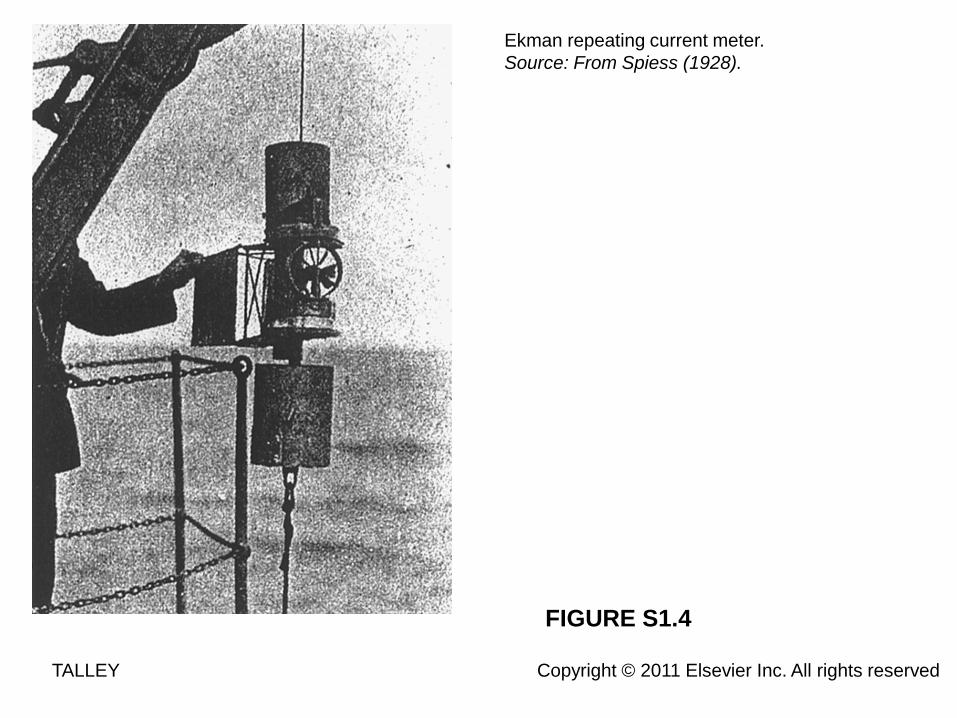
FIGURE S1.4
Ekman repeating current meter. Source: From Spiess (1928).
TALLEY Copyright © 2011 Elsevier Inc. All rights reserved

FIGURE 13.10
Track of the Endurance (1914-1916). Source: From Stone (1914); © Royal Geographical Society.
TALLEY Copyright © 2011 Elsevier Inc. All rights reserved

FIGURE S1.3
Meteor after refit. Source: From Spiess (1928).
TALLEY Copyright © 2011 Elsevier Inc. All rights reserved

FIGURE 1.2Time and space scales of physical oceanographic phenomena from bubbles and capillary waves to changes in ocean circulation associated with Earth’s orbit variations.
TALLEY Copyright © 2011 Elsevier Inc. All rights reserved

FIGURE 2.1
TALLEY Copyright © 2011 Elsevier Inc. All rights reserved
Map of the world based on ship soundings and satellite altimeter derived gravity at 30 arc-second resolution. Data from Smith & Sandwell (1997); Becker et al. (2009); and SIO (2008).

FIGURE 2.5
(a) Schematic section through ocean floor to show principal features. (b) Sample of bathymetry, measured along the South Pacific ship track shown in (c).
TALLEY Copyright © 2011 Elsevier Inc. All rights reserved

FIGURE 2.2Areas of Earth’s surface above and below sea level as a percentage of the total area of Earth (in 100 m intervals). Data from Becker et al. (2009).
TALLEY Copyright © 2011 Elsevier Inc. All rights reserved
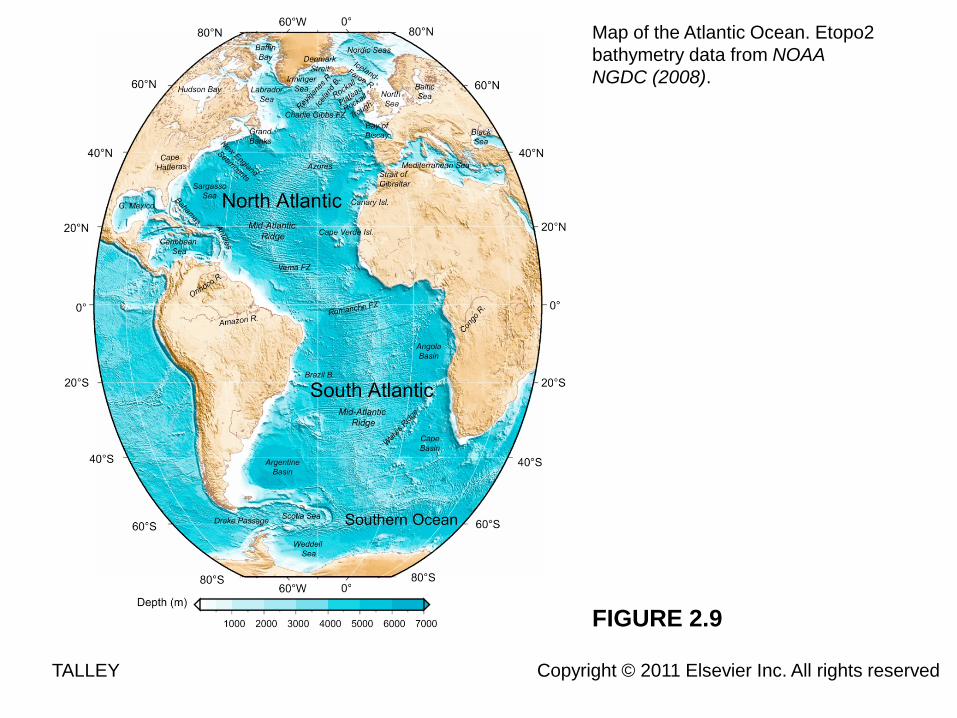
Map of the Atlantic Ocean. Etopo2 bathymetry data from NOAA NGDC (2008).
TALLEY Copyright © 2011 Elsevier Inc. All rights reserved
FIGURE 2.9

FIGURE 2.8
Map of the Pacific Ocean. Etopo2 bathymetry data from NOAA NGDC (2008).
TALLEY Copyright © 2011 Elsevier Inc. All rights reserved

FIGURE 2.10
Map of the Indian Ocean. Etopo2 bathymetry data from NOAA NGDC (2008).
TALLEY Copyright © 2011 Elsevier Inc. All rights reserved

FIGURE 2.11
The Arctic Ocean. Etopo2 bathymetry data from NOAA NGDC (2008).
TALLEY Copyright © 2011 Elsevier Inc. All rights reserved

FIGURE 2.12
The Southern Ocean around Antarctica. Etopo2 bathymetry data from NOAA NGDC (2008).
TALLEY Copyright © 2011 Elsevier Inc. All rights reserved

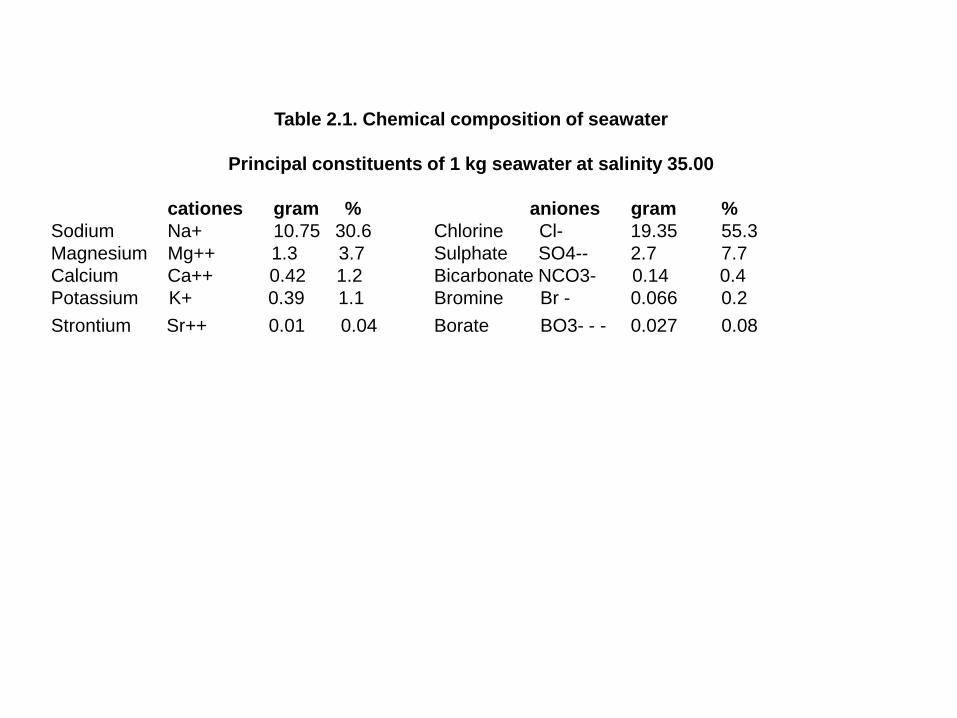
Table 2.1. Chemical composition of seawater
Principal constituents of 1 kg seawater at salinity 35.00
cationes gram % aniones gram % Sodium Na+ 10.75 30.6 Chlorine Cl- 19.35 55.3 Magnesium Mg++ 1.3 3.7 Sulphate SO4-- 2.7 7.7 Calcium Ca++ 0.42 1.2 Bicarbonate NCO3- 0.14 0.4 Potassium K+ 0.39 1.1 Bromine Br - 0.066 0.2 Strontium Sr++ 0.01 0.04 Borate BO3- - - 0.027 0.08

Salts obtained after 1 kg of seawater has evaporated gram %
Sodium chloride NaCl 27.213 77.758 Magnesium chloride MgCl 1.3807 10.878 Magnesium sulphate MgSO4 1.658 4.737 Calcium sulphate CaSO4 1.26 3.600 Potassium sulphate K2SO4 0.863 2.465 Calcium carbonate CaCO2 0.123 0.345 Magnesium bromide MgBr2 0.0766 0.217 Total 35.000 100.000

Table 2.2 Solubility of oxygen in seawater in ml l-1
S T 0 35 0 °C 10.3 8.4 20 °C 6.6 5.4
