taming data complexity in lifelogs: exploring visual cuts ...jfogarty/publications/dis2014.pdf ·...
TRANSCRIPT

Taming Data Complexity in Lifelogs: Exploring Visual Cuts of Personal Informatics Data
Daniel A. Epstein1, Felicia Cordeiro1, Elizabeth Bales1,2, James Fogarty1, Sean A. Munson2
1Computer Science & Engineering 2Human Centered Design & Engineering DUB Group, University of Washington
{depstein, felicia0, lizbales, jfogarty}@cs.washington.edu, [email protected]
ABSTRACT As people continue to adopt technology-based self-tracking devices and applications, questions arise about how personal informatics tools can better support self-tracker goals. This paper extends prior work on analyzing and summarizing self-tracking data, with the goal of helping self-trackers identify more meaningful and actionable findings. We begin by surveying physical activity self-trackers to identify their goals and the factors they report influence their physical activity. We then define a cut as a subset of collected data with some shared feature, develop a set of cuts over location and physical activity data, and visualize those cuts using a variety of presentations. Finally, we conduct a month-long field deployment with participants tracking their location and physical activity data and then using our methods to examine their data. We report on participant reactions to our methods and future design opportunities suggested by our work.
Author Keywords Personal informatics; reflection; routines; physical activity sensing; lifelogs; self-monitoring; self-tracking.
ACM Classification Keywords H.5.m. Information Interfaces and Presentation (e.g., HCI).
INTRODUCTION A wide variety of devices and applications are becoming increasingly popular for collecting and tracking personal data. Personal informatics tools have been developed and studied in a variety of domains, including physical activity (e.g., FitBit, JawBone UP, [6,7]), sleep (e.g., SleepCycle, [15]), location (e.g., FourSquare, [14]), food consumption (e.g., MyFitnessPal, [27]), expenses (e.g., Mint, [25]), and media consumption (e.g., last.fm, [22]). Tools can also combine and track multiple types of data. For example, the smartphone applications Moves and Saga passively record location and physical activity. Such tools have already begun to enter the mainstream and are likely to become even more ubiquitous and important: 69% of U.S. adults report tracking a health factor with 14% using technology to do so [11].
Many questions remain regarding how to support interactive analysis and interpretation of collected data. Current tools are generally limited to simple presentations based on minimal interpretation, such as extremely low-level data views (e.g., step counts for every 15 minute interval), high-level aggregation over time (e.g., step count for a day or a month), or long historical event streams (e.g., steps with location traces). These place the burden of synthesis on the self-tracker. Although experienced trackers may notice high-level patterns (e.g., “I get the most walking done to and from work” [18]), this may not be the case for all trackers. Tools to support or automate this synthesis and help people extract more complex or actionable correlations may allow self-trackers to gain more value from their collected data.
Higher-level inference is an important topic in both industry and research. Saga includes a traits feature, which reports basic findings the application has made based on a tracker’s location history. However, these traits tend to emphasize information the tracker is already likely to know. Examples include the type of building a person lives in (e.g., “Saga has determined that you live in an apartment or condo.”) or a type of place they frequently visit (e.g., “Saga has noticed that you visit bus stations.”). Bentley et al. present trackers with day-level correlations identified in their activities (e.g., “You walk significantly more on Fridays.”) [2]. However, participants often reported these were “obvious”.
Our current work aims to identify meaningful or actionable findings in self-tracking data. We begin by defining a cut as a subset of the collected data with some shared feature. Most prior work focuses on temporal cuts (e.g., [2,12]), but other more nuanced cuts are possible. For example, a cut may focus on data from whenever a tracker visits a particular type of location (e.g., a restaurant, a gym) or follows a transit pattern (e.g., commuting to work). Cuts can also be projected onto each other to explore how one factor influences another. Importantly, cuts characterize a subset of data that can then be presented in different ways. Prior work has been relatively ad-hoc, considering visualization techniques including maps [12,26], one-sentence summaries [2,16], graphs [2,8], and abstract pictures [7,9]. We therefore begin by conducting a formative survey to help identify cuts that people might find valuable in exploring their self-tracking data. Based on our identified cuts, we consider visualizations that can help support tracker goals. Finally, we evaluate these ideas in a month-long field deployment with 14 self-trackers.
Permission to make digital or hard copies of all or part of this work for personal or classroom use is granted without fee provided that copies are not made or distributed for profit or commercial advantage and that copies bear this notice and the full citation on the first page. Copyrights for components of this work owned by others than ACM must be honored. Abstracting with credit is permitted. To copy otherwise, or republish, to post on servers or to redistribute to lists, requires prior specific permission and/or a fee. Request permissions from [email protected]. DIS 2014, June 21–25, 2014, Vancouver, BC, Canada. Copyright ©ACM 978-1-4503-2902-6/14/06...$15.00. http://dx.doi.org/10.1145/2598510.2598558/

The specific contributions of this work include:
• Improved understanding of motivations for casual self-tracking, as enabled by continuing technology advances. Specifically, we conducted a survey of 113 physical activity self-trackers to identify their goals and the factors that influence their physical activity.
• Examination of new methods to support self-trackers in discovering potentially valuable correlations in their data. Specifically, we introduce our notion of cuts, develop a set of cuts over location and physical activity data, and present those cuts using a variety of visualizations.
• Investigation of the reactions of casual self-trackers to correlations uncovered using our methods. Specifically, we conduct a field deployment using Moves for one month to collect location and physical activity data. We use our methods to present participants with analyses of their data, and we discuss their reactions in terms of identifying opportunities for behavior change, discovering patterns and routines, and practices around socializing. Finally, we present future design opportunities distilled from our work and the reactions of our participants.
BACKGROUND AND MOTIVATION Data collection is critical to self-tracking, but extracting value from collected data also requires tools for synthesis.
Data Collection As sensors continue to become smaller and more capable, self-trackers gain new abilities to capture data about themselves. Prior work has focused on lifelogging, which aims to record aspects of a person’s life. Technology-supported lifelogging was first explored in MyLifeBits, pursuing the Memex vision of a complete historical log of all documents, email, and other artifacts a person encounters [13]. A key component was the SenseCam, which automatically captured images throughout a day. Although several systems have improved data collection, our current focus is on recent commercial phone applications that enable some of the lifelogging vision. For example, Moves continuously records locations visited and transportation modes between them, providing an API for accessing this data. Saga similarly records locations and other data, comparing a self-tracker’s patterns to those of the entire Saga community.
Data Synthesis
Self-Tracker Motivations Understanding the goals and motivations of self-trackers can help designers create better data synthesis tools. However, limited research has examined how fine-grained tracking supports self-tracker goals or why they track this data.
Li et al. present a survey of 68 self-trackers as part of developing a five-stage model of personal informatics [17]. They briefly summarize primary motivations of these self-trackers, including natural curiosity and interest in data. In subsequent work, Li et al. interview people who manually track activities, finding many motivated by behavior change, but also people motivated by sharing and reminiscing [19].
In analyzing practices of people in the Quantified Self community, Choe et al. divide tracker motivations into improving health, improving other aspects of life, and finding new life experiences [5]. Health-motivated trackers had very specific goals (e.g., identifying an allergy trigger). This contrasts with more general and high-level descriptions of goals (e.g., behavior change, being healthier).
Lindqvist et al. examine why people use FourSquare [20]. They categorize it as a primarily social application, with much of the benefit coming from sharing location check-ins. But some participants were motivated by having a record of the places they check-in for their later reflection.
Visualizing and Describing Routines Self-tracking tools create new challenges for people making sense of rich data streams. Unprocessed life streams, as presented by Saga and Moves, require paging through days of detailed data to attempt to find trends, correlations, or opportunities for change. High-level views, as in the FitBit dashboard, can present a sense of progress but generally lack detail that could be used to help identify opportunities for changes that might help reach a target behavior.
Researchers have therefore examined visualizations that can better support reflection and behavior change. Vrotsou et al. visualized patterns in manually-logged diary data, showing that patterns of similar transitions between locations can be discovered [28]. Begole et al. explored visualizing temporal patterns using gradients and aligning multiple days [1]. Noulas et al. showed simply plotting FourSquare check-ins against time of day allowed visually determining which types of check-ins are common at particular times of day [21]. Biagioni and Krumm use clustering to group similar days based on location traces, with participants reporting they believed the groupings were accurate [3]. Nick Feltron artistically rendered his detailed self-tracking logs into an annual reports from 2005-2012, posted to feltron.com.
Prior work has examined the use of maps to visualize routines. Kalnikaite et al. visualize GPS and SenseCam logs on maps, highlighting opportunities to support recollection of events and habits [26]. Gemmell et al. present a map-based story authoring tool using pictures and GPS traces [12]. While Moves and Saga enable storytelling through social network integration, they only enable sharing life streams.
Short textual summaries have also been examined as an approach for summarizing patterns. Khovanskaya et al. use one-sentence critical design summaries of browsing data (e.g., “In the time you spent on the web, Apollo 11 would have gone to the moon and back 1.729 times!”) [16]. Bentley et al. present summaries of high-level trends found in Health Mashup data (e.g., “On weekdays you are less happy than on weekends.”), and describe a need for future work examining which summaries should be presented to self-trackers [2].
EXAMINING LOCATION AND ACTIVITY DATA We extend prior work by examining designs to help self-trackers synthesize and examine data collected from
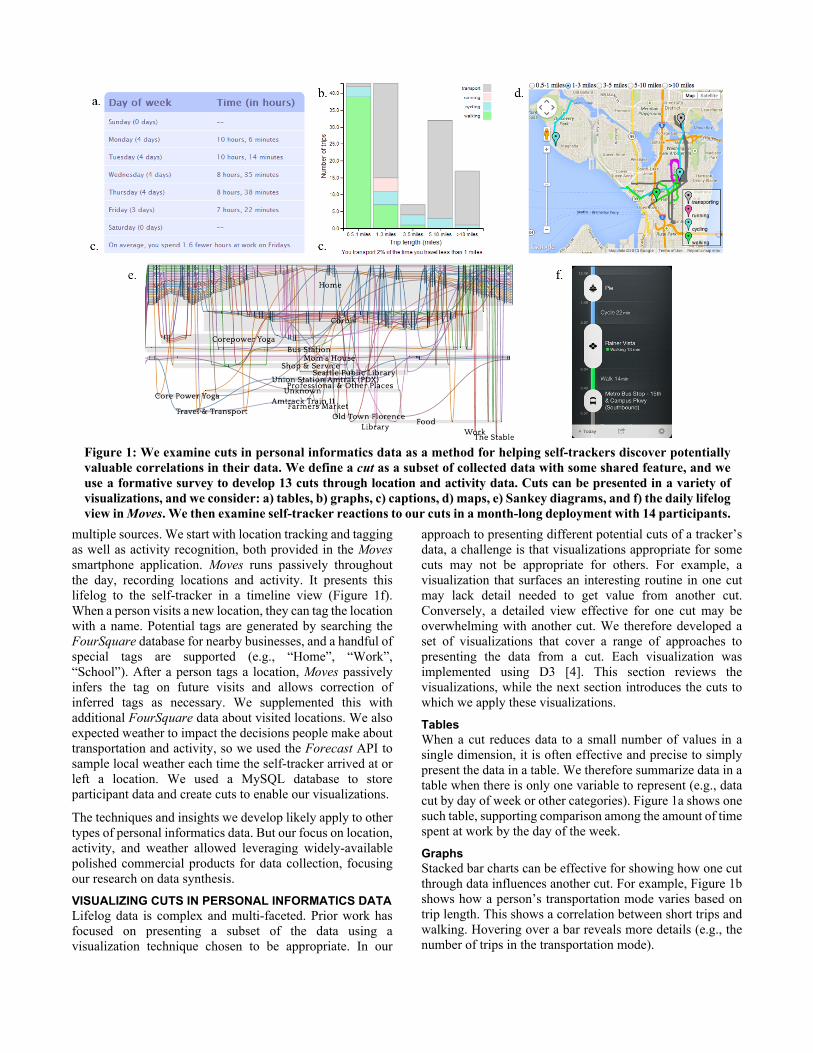
multiple sources. We start with location tracking and tagging as well as activity recognition, both provided in the Moves smartphone application. Moves runs passively throughout the day, recording locations and activity. It presents this lifelog to the self-tracker in a timeline view (Figure 1f). When a person visits a new location, they can tag the location with a name. Potential tags are generated by searching the FourSquare database for nearby businesses, and a handful of special tags are supported (e.g., “Home”, “Work”, “School”). After a person tags a location, Moves passively infers the tag on future visits and allows correction of inferred tags as necessary. We supplemented this with additional FourSquare data about visited locations. We also expected weather to impact the decisions people make about transportation and activity, so we used the Forecast API to sample local weather each time the self-tracker arrived at or left a location. We used a MySQL database to store participant data and create cuts to enable our visualizations.
The techniques and insights we develop likely apply to other types of personal informatics data. But our focus on location, activity, and weather allowed leveraging widely-available polished commercial products for data collection, focusing our research on data synthesis.
VISUALIZING CUTS IN PERSONAL INFORMATICS DATA Lifelog data is complex and multi-faceted. Prior work has focused on presenting a subset of the data using a visualization technique chosen to be appropriate. In our
approach to presenting different potential cuts of a tracker’s data, a challenge is that visualizations appropriate for some cuts may not be appropriate for others. For example, a visualization that surfaces an interesting routine in one cut may lack detail needed to get value from another cut. Conversely, a detailed view effective for one cut may be overwhelming with another cut. We therefore developed a set of visualizations that cover a range of approaches to presenting the data from a cut. Each visualization was implemented using D3 [4]. This section reviews the visualizations, while the next section introduces the cuts to which we apply these visualizations.
Tables When a cut reduces data to a small number of values in a single dimension, it is often effective and precise to simply present the data in a table. We therefore summarize data in a table when there is only one variable to represent (e.g., data cut by day of week or other categories). Figure 1a shows one such table, supporting comparison among the amount of time spent at work by the day of the week.
Graphs Stacked bar charts can be effective for showing how one cut through data influences another cut. For example, Figure 1b shows how a person’s transportation mode varies based on trip length. This shows a correlation between short trips and walking. Hovering over a bar reveals more details (e.g., the number of trips in the transportation mode).
Figure 1: We examine cuts in personal informatics data as a method for helping self-trackers discover potentially valuable correlations in their data. We define a cut as a subset of collected data with some shared feature, and we use a formative survey to develop 13 cuts through location and activity data. Cuts can be presented in a variety of visualizations, and we consider: a) tables, b) graphs, c) captions, d) maps, e) Sankey diagrams, and f) the daily lifelog view in Moves. We then examine self-tracker reactions to our cuts in a month-long deployment with 14 participants.

Captions Similar to Bentley et al. [2], we distill correlations into single sentence natural language summaries called captions. We present these with tables and graphs (see Figure 1c), but explicitly seek participant feedback on captions separate from their table or graph. Captions highlight either the most significant difference in the visualization (e.g., “On average, you take 2402 more steps on Wednesdays”) or a potential reason for the difference (e.g., “On your most active days, you went to 4 more Resorts than usual”). The caption in Figure 1b notes a person uses transit on few of their short trips, a potential opportunity for an increase in walking.
Maps Extensive prior work uses maps to visualize location data (e.g., [12,26]). Maps can highlight places visited, routes taken, or other cuts. For example, Figure 1d shows transportation mode for all trips of lengths in a given range. The mapped locations and routes can be clicked for more detail, such as the location name or the route length. Maps were created using the Google Maps API.
Sankey Sankey diagrams can be used to visualize energy flow [24], and we apply them to show trends in a person’s movements. Figure 1e shows an overall flow of starting the day at home, visiting Corbis in the middle of the day (a work location), and returning home. Single trips are visible, as are infrequent clusters (e.g., a few days spent at Mom’s house). To remove some clutter and help surface patterns, we combined locations that were visited once, were of the same high-level FourSquare category, and were visited at approximately the same time of day (within two hours, either within the same day or on different days at the same time). Figure 1e’s “Food” and “Shop & Service” correspond to visiting different locations of those types at approximately the same time. Trackers can also add or remove days of the week from a cut to use the Sankey diagram to find day-specific patterns.
Daily Lifelog Moves and other lifelogging applications provide streaming lifelog views, as in Figure 1f. A self-tracker can move between days, viewing activity for each day. To enable comparison within our cuts, we implemented daily lifelog visualization as a selectable calendar. We did not re-implement the Moves timeline, but asked participants to consider it when interacting with the daily lifelog (participants were already highly familiar with the view after using Moves for approximately one month). While other visualizations of lifelogs exist in prior work [12,26], we asked participants to consider the timeline for familiarity.
CHOOSING CUTS THROUGH DATA With these visualizations in mind, we looked to develop a set of meaningful cuts to present to self-trackers. Cuts should correspond to information that self-trackers are interested in learning about themselves, highlighting factors that influence their activity. We therefore sought a better understanding of the motivations of current self-trackers.
Formative Survey We recruited survey respondents from a variety of sources, including university mailing lists and FitBit and Quantified Self forums. Our formative survey was completed by 139 people who use commercial self-tracking applications, the vast majority using physical activity tracking tools (81.3% of respondents). As a result, we concentrated on the goals of the physical activity trackers. Respondents who tracked other categories had different goals, and our discussion comments on extending our findings to other types of tracking tools.
The survey consisted of free response questions which we coded into discrete categories. Respondents indicated what factors they believed impacted their activity level. To help stimulate identification, we asked participants to use a Likert scale to rate how their activity or location was impacted by several factors. We encouraged respondents to list at least three other factors. Table 1 summarizes results.
Of 113 respondents who track physical activity, 68 (60%) were female. Median age was 46 (mean 44.7, stdev 13.0). This suggests our survey reached a broader variety of self-trackers than prior work. For example, Choe et al. report their trackers were 79% male [5], though Pew Research says men and women are equally likely to track physical activity [11]. Similarly, Li et al. report a median age of 26 to 30 [17], younger than our participants, with Pew Research reporting older adults also use technology in their self-tracking [11].
Previous literature draws conclusions about the motivations of early adopters who create their own tools and perform their own analyses [5,17], but there is limited understanding of what motivates many other people. We included casual self-trackers to help design for a broad range of motivations.
Respondents identified an average of 1.6 goals, typically in two categories: tracking goals (e.g., having a record of activity, finding patterns) and long-term health goals (e.g., maintaining or improving activity and weight).
The most commonly described daily activity was commuting to and from work (44 respondents). Work schedule was the activity with the greatest perceived impact on physical
Question Most Common Responses (# Responses) Tracking tools used
FitBit (104), RunKeeper (9), Nike+ (7), MapMyRun (5), other (17), multiple tools (24)
Length of time tracking
Less than a month (23), 1-3 months (27), 4-6 months (12), 7-12 months (22), more than 12 months (29)
Goals for Self-Tracking
Maintain / Increase Activity (41), Maintain / Lose Weight (35), Awareness of Activity Levels (34), Increase Motivation (14), Be Held Accountable (10), Have a Record of Activity (8), Find Patterns (7), Competition (6)
Factors that Impact Activity Level
Work Schedule (35), Weather (29), Travel (21), Injury and Fatigue (20), Changes in Daily Schedule (18), Sleep Amount and Quality (16), Schedule of Partners and Children (13), Stress and Mood (13), Socializing (12), Food Consumption (11), Errands (7)
Daily Activities
Commuting To and From Work (44), Gym (25), Take Care of Pets or Children (18), Errands (6)
Table 1: Our formative survey respondents reported a wide variety of self-tracking goals, factors they believed impacted their activity level, and daily routines.

activity (35 respondents). This indicates the importance of commuting in daily activity, and that this is important to people when they consider their physical activity trends.
Respondents said their typical activity varied by the day of the week. 50% of participants believed that “Being a weekend” increased their activity, but 24% of participants also believed that weekends decreased their activity. Day-specific activities respondents mentioned included running or going to the gym, meetings or lunch events in distant buildings, and scheduled errands (e.g., grocery store). Participants mentioned additional sources of activity related to walking pets and activities with children (e.g., going to a park, picking children up from daycare).
Variations in the weather, one’s routine, or a partner or child’s schedule also created or limited opportunities for physical activity (29, 21, 18, 13 respondents). Respondents indicated poor weather negatively impacted activity and abnormally good weather motivated outdoor exercise.
Internal factors were also perceived as influential, such as injury and fatigue, sleep quantity and quality, and stress and mood (20, 16, and 13 respondents). Some respondents used physical activity as a stress relief mechanism, while others reported that physical activity caused them stress.
Respondents also mentioned socializing and food consumption (12 and 11 respondents). 44% said that “Being with friends” increased their activity, but 28% of participants also said being with friends decreased their activity. Eating also influenced activity patterns, with respondents not wanting to exercise immediately after eating or feeling the need to exercise more after unhealthy eating.
Cuts Selected Based on the results of our formative survey, we developed 13 cuts through location and activity data to evaluate in a field deployment. These are summarized in Table 2. They represent a variety of tracker motivations and were designed to offer interesting points for self-tracker reflection.
Transit Type and Physical Activity Cuts TT1, TT2, and TT3 focus on transit types and their relation to physical activity. TT1 overviews transit by day of the week, motivated by respondents identifying day-specific activities (e.g., going running on certain days). TT2 attempts to capture activities like pet walks and running routes (common daily activities in our formative survey), which often start and end in the same location. TT3 showed differences in transit mode by length of the trip. We expected participants to walk and bike more often on short trips and use transit for longer trips (i.e., cars, public transit). The caption for TT3 showed for what percentage of trips less than one mile the participant had used transit (a threshold selected as a generally “walkable” trip for our participants).
Commutes We included cuts for home / work commute due to work schedule being the top respondent-identified impact on
physical activity as well as the large number of respondents who mentioned their commutes when describing their physical activity. CM1 shows average time spent at work and home, while CM2 shows average arrival and departure time from work. For both, the average excludes days where trackers do not go to work at all. CM3 presents differences in commute time by weather, based on the expectation that commutes will generally take longer in unfavorable weather.
Food Places Survey respondents included food consumption as a factor impacting activity (e.g., overeating, not eating). We also anticipated that, apart from home and work, places that serve food would be the most common type of location for trackers to visit (e.g., restaurants, cafés). We therefore created two food place cuts, showing patterns in food places by the day of the week in FD1 and by the time of the day in FD2.
Abnormal Days Survey respondents noted that changes in daily schedule and deviations from routine to run errands influenced their physical activity, leading us to design cuts to try to highlight such days. AB1 is based on the intuition that the number of places visited in a day could serve as a proxy for how busy a person was with errands and other location-based tasks, so the cut can help reveal their most busy and least busy days. AB2 shows days a tracker was most active, highlighting their accomplishments and potentially helping them identify good aspects of those days they may want to repeat more regularly.
Week-to-Week Summaries Finally, we created cuts that summarize activity from week to week. WW1 showed total physical activity levels by week, surfacing particularly active or inactive weeks. WW2 helped identify potentially abnormal weeks by comparing the number of unique places visited each week. WW3 showed places only visited on weekdays or weekends, a distinction survey respondents made when describing their routines.
TT1 Average time in different modes of transit (walking, running, cycling, and transporting) by the day of week. G,M
TT2 All trips to and from the same location by transit type. G,MTT3 Number of trips in each transit mode by trip distance. G,M
CM1 Amount of time spent at each of home and work by the day of the week. T
CM2 Average arrival time at work and departure time from work by the day of the week. T,M
CM3 Time taken to commute to and from work by the type of weather (e.g., clear, partly cloudy, rainy). G,M
FD1 Categories of food places visited by day of week. G,MFD2 Categories of food places visited by time of day. G,MAB1 5 days with the most and least number of places visited. G,MAB2 10 days with the most physical activity. G,MWW1 Total minutes of physical activity by week. G,MWW2 Number of unique places visited by week. G,MWW3 All places visited only on weekdays or weekends. G,MDL Daily Lifelog view of all activity and locations.SD Sankey diagram of all activity.
Table 2: Informed by our formative survey, we selected 13 cuts through location and activity data. These were visualized using graphs (G), tables (T), and maps (M). Each also included a caption.

FIELD DEPLOYMENT We next conducted a field deployment to examine self-tracker response to complex cuts and to better understand how to visualize cuts in an interpretable manner. Each tracker’s participation lasted approximately one month and included three interviews. During the first, we installed Moves on their personal phone and asked about their initial expectations of our system. After two weeks, we interviewed again to gather initial reactions to using Moves. Finally, after one month we interviewed participants, presented our visualizations of cuts in their data, and gathered feedback. Cuts were presented only at the end of the study. This ensured they were populated with substantial data, and it allowed us to interview participants regarding their experiences with the streaming presentation in Moves.
Study Design and Participants We recruited participants from university mailing lists, other local mailing lists, and local self-tracking groups. We sought to examine self-tracking on typical days, so we excluded participants likely to have many abnormal days, specifically any who expected more than four days of travel during the study period or who expected to move or change jobs. We also excluded participants who had previously used Moves, ensuring all had equal experience with the application.
We recruited with the goal of obtaining a diverse group of participants (see Table 3), including in gender (4 male, 10 female) and age (average: 36.2, stdev: 12.1). One additional participant dropped out of the study after 11 days due to unanticipated long-term travel (and is not in Table 3).
We asked participants to select or create self-tracking goals, and we provided a list of potential goals developed from prior literature and responses to our formative survey. All 14 indicated they wanted to increase or maintain their level of physical activity. 11 wanted a record of their activity, while 10 wanted to find patterns. Other goals were healthier food choices (4 participants), visiting new places (3 participants), finding opportunities to save money (2 participants), and spending more time with friends (2 participants).
We asked participants to launch Moves at least once per day during the study. This ensured participant data was sent to our servers and also that participants were reflecting on the
data Moves collected. Participants reported checking Moves an average of 3.2 times per day (min: 1, max: 10, stdev: 2.8).
Moves Usage We captured Moves logs from participants for an average of 29.7 days (min: 27, max: 36, stdev: 2.2). Participants visited an average of 4.8 locations per day (min: 2.6, max: 6.1, stdev: 1) and tagged an average of 88% of the locations they were at for longer than 10 minutes (min: 67.6%, max: 100%, stdev: 11.1%). They tagged an average of 38 unique locations (min: 18, max: 63, stdev: 14.9). They tagged an average of 9.6 unique food places (min: 0, max: 20, stdev: 8.9), visiting each food place an average of 1.2 times (min: 0, max: 2, stdev: 0.5), with 3 visiting less than one food place per week. We recorded at least one walk and transit event for every participant, at least one run for 7 participants, and at least one cycling event for 8 participants. 11 had no trips to and from the same location (which we expected for activities like pet walks and running routes). 13 had a dedicated work location, while 1 participant worked from home.
RESULTS We next present participant reactions to seeing their tracking data presented through our cuts and visualizations.
Feedback on Cuts During the final interview, participants gave feedback on our cuts in a talk-aloud format, speaking freely as they examined each cut. At the end of the interview, we asked them to select up to 5 cuts they thought were most valuable, and up to 1 from which they received no value. Participants were only presented with cuts appropriate to their activity (e.g., FD1 and FD2 would be very sparse for participants who visited less than one food place per week). Results are in Figure 2.
TT1, CM1, CM2, CM3, and WW1 were valued by nearly half of participants. Participants wanted overviews of their physical activity and were interested in learning more about their work habits. Because every participant stated a goal of maintaining or increasing their level of physical activity, it was perhaps not surprising they wanted to see their activity patterns. 11 mentioned their work schedules influenced their activity, so it is perhaps similarly unsurprising they reacted positively to work-related visualizations.
Age Gender Self-Tracking Experience Occupation Self-Tracking Goals (Beyond Increase/Maintain Physical Activity)P1 50 F Infrequently recorded bike route Researcher Healthier foodP2 27 M Daily FitBit wearer Graduate student Recording, finding patternsP3 40 M Infrequent FourSquare user Researcher Visiting new places, recording, finding patterns, time with friendsP4 26 F Daily FitBit wearer Software engineer Recording, finding patternsP5 31 F Daily JawBone UP wearer Researcher Healthier food, saving money, recording, finding patternsP6 31 F Daily FitBit wearer Graduate student RecordingP7 25 F Infrequent sleep tracker Graduate student RecordingP8 31 M Daily FitBit wearer Part-time designer Recording, finding patternsP9 44 F Infrequent RunKeeper user Librarian Visiting new places, recording, finding patterns P10 27 M Infrequent FitBit wearer Software engineer Recording, finding patternsP11 23 F Never tracked Brokerage assistant Saving money, visiting new places, finding patterns, time with friendsP12 66 F Daily FitBit wearer Systems business analyst Healthier food, finding patternsP13 42 F Daily ActiveLink wearer Lawyer Healthier food, recordingP14 44 F Never tracked Fundraiser Recording, finding patterns
Table 3: We conducted a one-month field deployment with 14 people of varying background, experience, and goals.

TT3, DL, and SD were more divisive. Some saw TT3 as an opportunity to find ways of incorporating activity into their routine, such as P13: “Yep, [my husband and I] should be walking on short trips more and biking on medium trips more.” P4 did not appreciate the caption highlighting short trips where she transported instead of walking: “Is this trying to say, ‘look punk, you should have been walking there?” Some were intrigued by SD highlighting patterns and anomalies. P12 said “I could quickly compare what days were different, what Thursdays were different.” Not all participants agreed. P7 stated “I don’t know exactly how a view like [the Sankey diagram] would help me understand my patterns.” P1 summarized participant opinions on the Sankey diagram: “The Sankey had lots of potential, but was hard to interpret.”
Trends in food places displayed in FD1 and FD2 were not received as well as the other cuts. P13, who had the goal of making healthier food choices, suggested perhaps visiting a food place is not the right metric to support her goal: “I’m more interested in what I’m eating than where I’m eating.” P5 noted a specific goal supported by FD2: “Some people have goals about eating past 8pm or things like that. Something like this could help me with that.”
We intended TT2 to show dog walks, running routes, and short errands, which survey respondents said impacted their activity. It was often misunderstood and typically left participants confused. P5 said “So I guess I’m having a hard time understanding this view… I’m not sure what I would use it for.” Explanation helped participants begin to understand its purpose, but they ultimately still found it uninspiring.
Participants found value in reflecting on multiple cuts together, rather than one in isolation, gaining a more complete picture of activity. P12 supported this: “I think that the total of all of the [cuts] make it really interesting… it’s like a full picture of what my activity level is and what I’ve been doing.” This suggests designers should present a swath of cuts, rather than relying on one to summarize activity.
Cuts and Goals Participants selected a variety of cuts as most valuable. Apart from the previously discussed TT2, every cut was selected as among the most valuable by at least one participant. This variety among participants suggests personalization of cuts.
We did not find any correlations between valued cuts and the reported goals of participants, despite designing some cuts to support specific goals identified in our formative survey. Our participants varied in experience, and may not have had a strong attachment to their goals. We additionally suspect participants may have been intrigued by cuts they had not previously considered and marked them as valuable because they learned something new and unexpected. This suggests personalization will need to do more than simply generate cuts corresponding to stated goals, as that could deprive trackers of potentially interesting discoveries in their data.
Support from Visualizations Participants responded to Likert scales comparing the different visualizations (see Figure 3). The formative survey identified common goals of finding patterns, awareness of activity, and having a record of activity, so we asked participants to compare the visualization types in each of these. We also asked about social sharing, as it has served as a common motivational tool in self-tracking [6,8,12,20].
Participants generally preferred table and graph presentation, which summarized cuts in easily-consumable formats. We examined where participants felt visualizations supported common goals better or worse than the daily lifelog visualization in Moves. Because we had ordinal data with multiple measures per participant, we performed a Friedman test for each goal. Where it indicated different distributions, we performed paired Wilcoxon tests correcting for multiple comparisons (treating each question as a family, correcting for six comparisons). Participants found table and graphs more useful than Moves at discovering factors that influence their behavior (p<0.01) and for finding patterns (p<0.01). This validates our cuts as an aggregation tool, highlighting higher-level factors and patterns in a way the Moves daily lifelog does not. We also found captions were less effective than Moves for serving as a diary (p<0.05) or helping people recall what they do (p<0.05). This is expected, as captions are too distilled to reasonably serve as a diary.
Participants offered insights into the effectiveness of each visualization. P2 said the graphs were more effective than the maps for learning patterns, “I think I am finding more information from these charts… the maps are good to view the data… but to get something that you didn’t know, I think that is much easier in these charts.” Some of the aggregate data we presented offered views that better supported visualizing progress toward specific goals. While reading the caption to WW2, P11 stated “Oh, that’s cool. 38% of my unique places are food places. That’s been a goal of mine, trying to be at different restaurants, try something new.”
Figure 2. Participants rated the value of each cut,selecting up to 5 most valuable and up to 1 least valuable.

DISCUSSION AND CONCLUSION We now discuss other findings from our interviews and present the technical and study limitations of our findings.
Supporting Goals and Interests Participants found cuts were more effective at supporting their goals than Moves. During both the two-week interview and the final interview, P10 said he did not receive any value from tracking with Moves. However, at the end of the final interview P10 stated, “All of these graphs totally changed my perspective on this. I was ready to just tell you ‘yeah, [Moves] was totally useless’, but actually just seeing this at the end I’m like ‘oh, ok. I can see where you’re taking this.’ I can see how I might actually want to use this in my every day.”
However, not all participants had the same reaction. P12, a FitBit wearer, stated “None of [the visualizations] were really surprising for me, it was just more of a confirmation than anything… since I bought the FitBit I’m more aware of what I’m doing.” This supports our prior belief that experienced self-trackers might be more aware of their habits than new trackers, even though neither had experience with Moves. By regularly reflecting on sensed data, experienced self-trackers seem to gain an intuition of their habits.
We presented each visualization for each cut, but some were not valued for specific cuts. The maps for CM1, CM2, and CM3 showed the participant commuting route, which was typically a predictable home / work route. P9 commented “I’m not really getting the map, it’s not really relevant to me. I know where home is and where work is.” However, participants found the map valuable when the cut emphasized either routes or locations. They explored the map in FD1 and FD2 when reminiscing about the food places they visited and their weekday / weekend practices in WW3.
Identifying Opportunities for Change When reflecting on their cuts and visualizations, participants found opportunities to increase their activity or otherwise change their behavior. P8 stated “Maybe on average on Tuesdays I don’t cycle much. Maybe there was a day that I did. To be able to think about why that was so I could maybe think about how to change what I was doing.” P10 felt similarly “If I notice that I’m most active on Tuesdays, then obviously there’s something about Tuesdays that I should
start doing on other days. That’s actionable data.” Both quotes highlight the value of surfacing positive deviations from routines as potential opportunities for behavior change.
Our participant experiences show how visualizations can help trackers at various stages of behavior change [23]. While viewing TT1, P13 suggested having a conversation with her husband about spending less time at home, even though she may not have previously considered this something that she wanted to change. People contemplating behavior change might benefit from an understanding of their baseline routines and activities, while those who are preparing to change or taking action can use cuts to identify specific ways to effectively change. Highlighting aspects of their routines that are counter to their goals may also help identify good targets for change. Showing positive anomalies from routines might build self-efficacy and also suggest how the routines can change.
Discovery All participants had moments of discovery, learning something about which they were previously unaware. Many discoveries were previously difficult for participants to quantify on their own, as stated by P10: “I guess I work 11 to 8, that’s my schedule… this is good to keep track of, actually. These are questions I’ve always wondered.” Similarly, P11 noticed a pattern in her transportation behavior: “If it’s over 3 miles, I usually drive. It’s interesting to see the breaking point between where I decide it’s [too far] to walk.”
Participants often used storytelling to try to reason about patterns. When looking at how her arrival and departure times vary by day, P11 said “I guess it’s because I feel guilty for leaving work early [on Tuesdays], so I come in a little bit earlier on Wednesdays. Huh, I didn’t even know that.” Through this process, participants were able to incorporate data they observed into their beliefs about themselves.
Participants typically looked at the chart and caption, then used the map to further explore their data. P10 described this: “The map was sort of secondary. I would look at the table, and then I would play around with the map, and be like, oh, alright… I already knew that.” Participants also commented the graphs were easier to parse quickly. P5 said “I find that I don’t really look at the map showing my routes. I just like to
Figure 3. Participants generally preferred tables and graphs based on our cuts through their location and activity data.They found these significantly better than the Moves daily lifelog for finding high-level patterns in their data.

see the high-level overview of ‘you went here, you were here for 10 minutes’… looking at the map is overwhelming.” P9 commented the regularity of her schedule limits the value of the map: “Because I go pretty much to the same places all the time, the map wasn’t really that telling to me. Even when I go for a walk in the morning, I walk the same route.”
Socializing Participants also found opportunities for socializing that were not motivated by self-improvement. 10 showed Moves to at least one other person during the study (7 to a family member or partner, 4 to a friend, 2 to a co-worker). All did so in person, versus via social network. Their reasons varied. P5 showed Moves to her husband after an active day together, stating “it helped us remember and appreciate the fun activities we had engaged in.” Others showed Moves to explain how it worked, such as P1: “[I] showed it to friends I was hiking with to see how many steps we’d taken.”
8 participants felt visualizations were potentially shareable. P10 saw the captions as particularly shareable, saying “the captions do seem very tweetable. That might be the kind of thing that you would share easily on a social network.” We believe higher-level visualizations are more likely to be shared online than raw daily lifelogs, as summaries are more likely to get social feedback and to not reveal private or overwhelming details [8]. Further investigation of social sharing of cuts in personal data is an important opportunity.
Limitations Participants found clear value, but our study and technology both have limitations that may be addressed in future work.
We inferred the purpose of locations using their high-level FourSquare categories, which is not always an effective proxy for a person’s activity. For example, coffee shops typically serve multiple roles: places to work, socialize, read, or even just obtain coffee. These differences were not captured, and participants also noted other incorrect categorizations (e.g., P3’s gym was adjacent to his office). Moves also cannot sense all physical activity, as people do not always carry their phone and some activities are impractical with a phone (e.g., swimming). Our participants did not see these limitations as problematic for their goals.
Our deployment was conducted during summer on the west coast of the U.S., with typically temperate and consistent weather. 6 participants mentioned that changes in weather would influence their activity. Deployments that are longer, at different times of year, or in a different region might highlight the influence of weather and related cuts. A longer deployment would also enable participant interest in seeing other longer-term trends or seasonal shifts. We waited until our study conclusion to present participants with cuts and visualizations, with the goal of ensuring we had collected enough data to show patterns. A longer study would also allow participants to continue interacting with visualizations, notice changes as data collection continued, and perhaps suggest additional cuts to highlight long-term change.
Design Considerations and Opportunities We have identified several considerations and opportunities for future designers and developers based on our work.
Contextually Aware Feedback Presenting visualizations after a month of collection led to storytelling and reminiscing about previous events, but did not enable in-the-moment decisions based on prior patterns. Real-time recommendations could be inferred from prior days. For example, upon arriving home a tracker might be presented a context-aware notification: “On days when you came home from work at this time, you typically do not reach your step goal. Consider going for a walk this evening.”
It is unrealistic to think casual self-trackers will regularly inspect a large number of cuts, and some participants expressed this sentiment. However, we saw that selecting a single small set of cuts is not the right solution either, as participants valued different cuts and the discovery of unexpected cuts. One approach to this challenge may be to show cuts appropriate for the current context. Perhaps immediately after arriving at work is an appropriate time to highlight average commute times. Or perhaps immediately after a short drive is a good time for a cut highlighting transit choices for trips by distance. Presenting recommendations at an opportune time for behavior change is prevalent in persuasive technology [10]. Positive anomalies could also be highlighted in the moment, helping a tracker identify and celebrate their successes in adding more activity.
Data Driven Techniques Captions generally summarize their corresponding figure. We found that some participants read the captions before consulting the visualization, expecting it to serve as an explanation and identification of actionable changes. Although some were able to find actionable data within the visualizations, others expected the captions to provide this insight and had difficulty synthesizing visualizations.
We recruited participants with a wide range of self-tracking experience, none of whom identified with the Quantified Self community. Quantified Selfers tend to be more data-driven than the casual audience [5], and thus may feel more comfortable analyzing a graph. Designing for a broader self-tracking audience requires further exploration, and what level of synthesis is best for this audience remains a question.
People Value Different Cuts Most participants had goals of increasing or maintaining physical activity and having a record. However, Figure 2 shows the cuts that participants valued varied dramatically, with all cuts except for TT2 marked as most valuable. We did not find correlation between participant goals and the cuts they valued most or least. As a result, we recommend future designs do not attempt to limit cuts based on stated goals and instead offer a variety of cuts. Future work should explore incorporating feedback on cut value, such as adding a “like” button to a cut and then generating additional cuts with similar traits, or predicting which cuts will be most value for a given person at a given time and context.

Extension to Other Domains 10 of our survey respondents tracked their finance patterns using Mint. Similar to the physical activity trackers, they varied in their beliefs of how factors influenced spending patterns (e.g., mood, weather). Visualizing these factors and behavior could help lead trackers to new discoveries and potential behavior change. Combining multiple streams might also help self-trackers form a better understanding of patterns and how they relate. 3 finance respondents believed travel influenced their spending habits, which could be examined with cuts surfacing spending by location.
We focused on physical activity and goals which could be inferred from location, but believe many other potential goals can be supported through high-level visualizations. A visualization showing spending by location, neighborhood, or commute route might help a tracker identify less expensive places to socialize with friends or surface how much they spend on their commuting coffee routine. A mobile or flexible worker seeking to be more efficient might examine not only when and where they work, but also what kind of work they perform at various times and locations.
We have shown meaningful cuts in personal informatics data can help self-trackers identify correlations and opportunities for self-improvement. We have also found that people can value information revealed in cuts even if it does not align to existing goals. There are opportunities for examining our methods and results in other data domains. There are also important challenges in considering how to better support self-trackers in assembling data across multiple domains to enable their self-tracking goals and opportunities.
ACKNOWLEDGMENTS We thank Ian Li for early discussions, Caitlin Bonnar for help in testing, and Danielle Bragg, Eun Kyoung Choe, and Matthew Kay for thoughts on early drafts. This work is funded by the ISTC-PC and by the National Science Foundation under awards OAI-1028195 and SCH-1344613.
REFERENCES 1. Begole, J.B., Tang, J.C., and Hill, R. Rhythm Modeling,
Visualizations and Applications. CSCW 2002, 11-20. 2. Bentley, F., Tollmar, K., Stephenson, P., Levy, L., Jones, B.,
Robertson, S., Price, E., Catrambone, R., and Wilson, J. Health Mashups : Presenting Statistical Patterns Between Wellbeing Data and Context in Natural Language to Promote Behavior Change. (2013). TOCHI, 20(5), 1-27.
3. Biagioni, J. and Krumm, J. Days of Our Lives: Assessing Day Similarity from Location Traces. UMAP 2013, 89-101.
4. Bostock, M., Ogievetsky, V., and Heer, J. D3: Data-Driven Documents. InfoVis 2011, 2301-2309.
5. Choe, E.K., Lee, N.B., Lee, B., Pratt, W., and Kientz, J.A. Understanding Quantified-Selfers’ Practices in Collecting and Exploring Personal Data. CHI 2014, to Appear.
6. Consolvo, S., Everitt, K., Smith, I., and Landay, J.A. Design Requirements for Technologies that Encourage Physical Activity. CHI 2006, 457-466.
7. Consolvo, S., McDonald, D.W., Toscos, T., Chen, M.Y., Froehlich, J., Harrison, B., Klasnja, P., LaMarca, A., LeGrand, L., Libby, R., Smith, I., and Landay, J.A. Activity Sensing in the Wild: a Field Trial of UbiFit Garden. CHI 2008, 1797-1806.
8. Epstein, D.A., Borning, A., and Fogarty, J. Fine-Grained Sharing of Sensed Physical Activity : A Value Sensitive Approach. UbiComp 2013, 489-498.
9. Fan, C., Forlizzi, J., and Dey, A. A Spark Of Activity: Exploring Informative Art As Visualization For Physical Activity. UbiComp 2012, 81-84.
10. Fogg, B.J. Persuasive Techology: Using Computers to Change What We Think and Do. (2002). Ubiquity, 89-120.
11. Fox, S. and Duggan, M. Tracking for Health. (2013). Pew Internet, 1-32.
12. Gemmell, J., Aris, A., and Lueder, R. Telling Stories with MyLifeBits. ICME 2005, 1536-1539.
13. Gemmell, J., Bell, G., and Lueder, R. MyLifeBits: A Personal Database for Everything. (2006). Communications of the ACM, 49(1), 88-95.
14. Iachello, G., Smith, I., Consolvo, S., Abowd, G.D., Howard, J., Potter, F., Scott, J., Sohn, T., Hightower, J., and LaMarca, A. Control, Deception, and Communication: Evaluating the Deployment of a Location-Enhanced Messaging Service. UbiComp 2005, 213-231.
15. Kay, M., Choe, E., Shepherd, J., Greenstein, B., Watson, N., Consolvo, S., and Kientz, J.A. Lullaby: A Capture & Access System for Understanding the Sleep Environment. UbiComp 2012, 226-234.
16. Khovanskaya, V., Baumer, E.P.S., Cosley, D., Voida, S., and Gay, G. “Everybody Knows What You’re Doing”: A Critical Design Approach to Personal Informatics. CHI 2013, 3403-3412.
17. Li, I., Dey, A., and Forlizzi, J. A Stage-Based Model of Personal Informatics Systems. CHI 2010, 557-566.
18. Li, I., Dey, A.K., and Forlizzi, J. Using Context to Reveal Factors that Affect Physical Activity. (2012). TOCHI, 19(1), 1-21.
19. Li, I., Dey, A.K.A., and Forlizzi, J. Understanding My Data, Myself: Supporting Self-Reflection with Ubicomp Technologies. UbiComp 2011, 405-414.
20. Lindqvist, J., Cranshaw, J., Wiese, J., Hong, J., and Zimmerman, J. I’m the Mayor of My House: Examining Why People Use Foursquare-A Social-Driven Location Sharing Application. CHI 2011, 2409-2418.
21. Noulas, A., Scellato, S., Mascolo, C., and Pontil, M. An Empirical Study of Geographic User Activity Patterns in Foursquare. AAAI 2010, 570-573.
22. Peesapati, S.T., Schwanda, V., Schultz, J., Lepage, M., Jeong, S., and Cosley, D. Pensieve : Supporting Everyday Reminiscence. CHI 2010, 2027-2036.
23. Prochaska, J.O. and Velcier, W.F. The Transtheoretical Model of Health Behavior Change. (1997). American Journal of Health Promotion, 12(1), 38-48.
24. Riehmann, P., Hanfler, M., and Froehlich, B. Interactive Sankey Diagrams. InfoVis 2005, 233-240.
25. Schwarz, J., Mankoff, J., and Matthews, H.S. Reflections of Everyday Activities in Spending Data. CHI 2009, 1737-1740.
26. Street, P., Sheffield, S., Sellen, A., Whittaker, S., Kirk, D., and Kalnikaite, V. Now Let Me See Where I Was: Understanding How Lifelogs Mediate Memory. CHI 2010, 2045-2054.
27. Tsai, C.C., Lee, G., Raab, F., Norman, G.J., Sohn, T., Griswold, W.G., and Patrick, K. Usability and Feasibility of PmEB: A Mobile Phone Application for Monitoring Real Time Caloric Balance. (2007). Mobile Networks and Applications, 12(2-3), 173-184.
28. Vrotsou, K., Ellegard, K., and Cooper, M. Everyday Life Discoveries : Mining and Visualizing Activity Patterns in Social Science Diary Data. InfoVis 2007, 130-138.