tandem for 3d corridor mapping - gim international · report page 26 turning uav and ......
TRANSCRIPT
I N T E R N A T I O N A L
THE GLOBAL MAGAZINE FOR GEOMATICSWWW.GIM-INTERNATIONAL.COM
ISSUE 8 • VOLUME 31 • AUGUST 2017
Tandem for 3D Corridor MappingSimultaneous Geo-data Capture from the Ground and from the Air
SCAN-TO-BIM IN THE PRE-DESIGN PHASE..
MOBILE LASER SCANNING POINT CLOUDS..
SPATIAL INTELLIGENCE IN THE CONTEXT OF BIG DATA..
01_cover.indd 1 25-07-17 14:13


CONTENTS
ADVERTISERS INDEX
3AUGUST 2017 | INTERNATIONAL |
REPORT PAGE 26Turning UAV and Lidar into Something Beautiful YellowScan International User Conference 2017
REPORT PAGE 29‘Location’ Forms Ubiquitous Part of Big Data AnalyticsIBM Shows a Mainstream Direction for Spatial IT
FEATURE PAGE 32Thriving Bucharest Presents Mapping ChallengesRomanian Geoportal to Serve Multiple Users
COMPANY’S VIEW PAGE 38Hyperspectral Remote Sensing: From Aviris to EveryoneResonon
News & Opinion pageEditorial 5Insider’s View 6News 7GIM Perspectives 13
OrganisationsFIG 40GSDI 40IAG 41ICA 41ISPRS 42
OtherAdvertisers index 3Agenda 42
INTERVIEW PAGE 14
Maximising the Benefit of Geospatial InformationGIM International interviews Dave Lovell
FEATURE PAGE 18
Mobile Laser Scanning Point CloudsStatus and Prospects of Automatic 3D Mapping of Road Objects
FEATURE PAGE 23
Tandem for 3D Corridor Mapping Simultaneous Geo-data Capture from the Ground and from the Air
The front cover of this issue of GIM International shows the challenging task of surveying a tunnel. Switzerland-based company Amberg Technologies supports tunnelling in all construction phases. The company combines precise measuring instruments with task-specific software. In this issue we focus on the very latest technologies used in professional land surveying. (Image courtesy: Amberg Technologies)
FEATURE PAGE 34
Scan-to-BIM in the Pre-design Phase3D Laser Scanning and Modelling of Existing Conditions
ComNav Technology, www.comnavtech.com 4
FOIF, www.foif.com 43
Gintech, www.gintec.cn 28
Hi-Target Surveying, en.hi-target.com.cn 7, 9, 11
Kolida, www.kolidainstrument.com 12
Leica Geosystems, www.leica-geosystems.com 10
LidarUSA, www.lidarusa.com 36
MicroSurvey, www.microsurvey.com 2
Racurs, www.racurs.ru 8
Ruide, www.ruideinstrument.com 28
Siteco, www.sitecoinf.it 12
South Surveying, www.southsurveying.com 22
Texcel, www.texcelinstrument.com 36
TI Asahi, www.pentaxsurveying.com 44
TI Linertec, www.tilinertec.com 21
03_contents.indd 3 25-07-17 14:48

THE NEXT LEVEL RTK
THE NEXT GENERATION CORS RECEIVER
THE NEW GENERATION K FAMILY GNSS BOARDS

5august 2017 | international |
editorial durk haarsma, publishing director
Maps are making the world a better place! This
was the motto of Professor Menno-Jan Kraak
during his keynote at the opening of the 28th
International Cartographic Conference (ICC) in
Washington, DC. The conference, held from
2-7 July in the national capital of the United
States, brought close to a 1,000 cartographers
together from all over the world. In the midst
of summer, Washington is a hot place and the
fact that 4 July, the national holiday, fell in this
week, made it a happening place as well. The
conference was centred around numerous
themes that were all highlighted in a great
number of presentations. The themes included
big data, remotely-sensed data for mapping
and feature extraction from Lidar, open source
mapping, cadastral mapping, geospatial intel,
geo-visualisation, spatial analysis, 3D mapping
and design of maps.
The beauty of maps has always amazed
me. In my office I am surrounded by maps,
although I have to admit they’re all old, but
still… I am always looking at maps on the
internet, in magazines and newspapers,
because one map can say more than a
thousand words. I am always aware though
that every map could have been designed in
another way or projection and that colour,
size or scale has an effect on how the map is
perceived. That effect, which is indeed very
Good mapmaking for small and big
Publishing director Durk HaarsmaFinancial director Meine van der Bijlsenior editor Dr ir. Mathias lemmenscontributing editors Dr ir. Christiaan lemmen, Dr rohan Bennett, Martin Kodde Msc, Huibert-Jan lekkerkerk, Frédérique Coumans, ir. sabine de Millianocontent Manager Wim van WegencoPy-editor lynn radford, englishproof.nlKey account Manager sybout Wijmaaccount Manager sharon robson, Myrthe van der schuitMarKeting assistant trea Fledderuscirculation Manager adrian Hollanddesign ZeeDesign, Witmarsum, www.zeedesign.nl
regional corresPondentsulrich Boes (Bulgaria), Prof. Dr alper Çabuk (turkey), Papa oumar Dieye (niger), Dr olajide Kufoniyi (nigeria), Dr Dmitry Kurtener (russia), Dr Jonathan li (Canada), Dr Carlos lopez (uruguay), Dr B. Babu Madhavan (Japan), Dr Wilber ottichilo (Kenya), Dr Carl reed (usa), Dr aniruddha roy (india), Prof. Dr Heinz rüther (south africa), Dr tania Maria sausen (Brazil)
giM internationalGIM Inter na tion al, the global mag a zine for geo mat ics, is pub lished each month by geomares Publishing. the mag azine and related e-newsletter pro vide top i cal over views and ac cu rate ly presents the lat est news in geo mat ics, all around the world. GIM Inter na tion al is or ien tat ed towards a pro fes sion al and man a ge ri al read er ship, those lead ing de ci sion mak ing, and has a world wide cir cu la tion.
Paid subscriPtions GIM International is available monthly on a subscription basis. the annual subscription rate for GIM International is €72. You can subscribe at any time via https://geomares-education.com/shop/subscriptions/gim-international.subscriptions will be automatically renewed upon expiry, unless geomares Publishing receives written notification of cancellation at least 60 days before expiry date. Prices and conditions may be subject to change. Multi-year subscriptions are available visiting https://geomares-education.com/shop/subscriptions/gim-international.
ad ver tise Mentsin for ma tion about ad ver tising and dead lines are avail able in the Me dia Plan ner. For more in for ma tion please con tact our key account man ag er: [email protected].
ed i to ri al con tri bu tions all ma te ri al sub mit ted to geomares Publishing and re lat ing toGIM Inter na tion al will be treat ed as un con di tion al ly as signed for pub li ca tion under copy right sub ject to the editor’s un re strict ed right to ed it and of fer ed i to ri al com ment. geomares Publishing as sumes no re spon sibil ity for un so lic it ed ma te ri al or for the ac cu ra cy of in for ma tion thus re ceived. geomares Publishing as sumes, in ad di tion, no ob li ga tion to return ma te ri al if not ex pli cit ly re quest ed. Con tri bu tions must be sent for the at ten tion of the content manager: [email protected].
geomares PublishingP.o. Box 112, 8530 aC lem mer, the neth er lands t: +31 (0) 514-56 18 54 F: +31 (0) 514-56 38 [email protected]. gim-international.com
no ma te ri al may be re pro duced in whole or in part with out writ ten per mis sion of geomares Publishing.Copy right © 2017, geomares Publishing, the neth er lands all rights re served. issn 1566-9076
big, is an effect which is taken very seriously
by the cartographic community. Rightfully so.
The number of errors in maps can increase
dramatically if cartographers are no longer
well educated or don’t understand the basics
of geography, geodesy, visualisation, maybe
even psychology and user design. Needless to
say, this makes good cartographic education
necessary also in the future, but also complex.
Surely the cartographer-to-be needs to be
educated in all those fields, will need to gather
skills to be able to combine the factors and
absolutely needs to be trained in his position
as gatekeeper when it comes to quality of
maps.
Throughout the week, the whole ICC
conference emphasised the importance of
all this and the higher goal it serves. Because
when it comes to establishing higher goals,
the fair distribution of resources, food security,
welfare, yes even securement of democracy
(when maps can no longer be trusted, what
does that say about the governments who
issue them?) even the most insignificant
map published needs to be correct. Every
visualisation of demographics in newspapers
or online such as the prevalence of certain
conditions or ageing of population or the
outcome of elections, for instance, is required
to give the right impression of the facts.
Monitoring the progress in reaching the
Sustainable Development Goals set by the
United Nations, is an example of where good
mapmaking will come into place. Giving
policymakers all over the globe insight into
how they are doing, implementing new policy
to meet the goals as soon as possible, and
helping them to adjust where necessary.
There’s no big or small in the necessity of good
mapmaking, every good map will make the
world a better place.
bayesmap.
Durk Haarsma, publishing director.
Phot
ogra
phy:
Arie
Bru
insm
a
05_editorial.indd 5 25-07-17 14:48

news insider’s view
66 | international | august 2017
eabthe editorial advisory Board (eaB) of GIM
International consists of profes sionals
who, each in their discipline and with an
independent view, assist the editorial
board by making recommen dations on
potential authors and specific topics. the
eaB is served on a non- committal basis
for two years.
PROF ORhan aLtanistanbul technical university, turkey
PROF DeRen LiWuhan university, China
MR SantiagO bORReROCoordinator, geosur Programme
PROF Stig eneMaRkHonorary President, Fig, Denmark
DR ayMan habib, PengProfessor, Purdue university, united states
DR gabOR ReMetey-FüLöPPPast secretary general, Hungarian
association for geo-information (Hunagi),
Hungary
PROF PauL van DeR MOLentwente university, the netherlands
PROF DR iR MaRtien MOLenaaRtwente university, the netherlands
PROF DaviD RhinDret. Vice-Chancellor, the City university, uK
MR keeS De ZeeuwDirector, Kadaster international,
the netherlands
PROF JOhn C tRinDeRFirst Vice-President isPrs, school of
surveying and sis, the university of new
south Wales, australia
MR RObin MCLaRenDirector, Know edge ltd, united Kingdom
Within the land sector, we all know the stories
about ambitious land administration projects
that have generally failed … they were too
costly, too time consuming and too
demanding in terms of capacity. It was not
possible to keep up the political momentum,
and the push for change to existing legal and
institutional arrangements eventually faded.
Barriers also relate to vested interests from
land professionals.
However, we are facing new times. Over the
last ten years a whole range of new land tools
have emerged, and technology developments
have fostered opportunities for quick and
affordable land parcel mapping as well as
easy management of large-scale land infor-
mation.
Today we have reached a global consensus
around the continuum of land rights as
promoted by GLTN/UN-Habitat, and the
Social Tenure Domain Model (and other
similar tools) enables registration of informal
and legitimate land rights at local level that
can eventually be recognised and registered
as formal and legal rights. Furthermore, the
Gender Evaluation Criteria offer a flexible tool
to improve the rights of women and other
vulnerable groups.
The UN Committee on World Food Security,
through FAO, has developed and promoted
the Voluntary Guidelines on Responsible
Governance of Tenure that provide interna-
tionally accepted standards and best
practices for dealing with rights in land, land
value, land use, and land development. The
Guidelines are globally recognised and set the
scene for building sound and sustainable land
institutions.
Mapping techniques, whether photogram-
metry, satellite, drones, or hand-held GPS, are
developed to a stage where traditional land
parcel surveys are no longer a constraint in
large-scale land projects. Time as well as
costs have been seriously reduced.
Furthermore, the Open Geospatial Consortium
is taking the lead in creating new standards
for comprehensive land information
management in support of sustainable land
administration.
The World Bank has developed a framework
for assessing national land administration
systems as a basis for innovation,
improvement and capacity development.
Finally, a comprehensive ‘Fit-For-Purpose’ tool
has emerged that provides an overall
framework for quickly delivering affordable,
nationwide land administration solutions. The
tool was developed by FIG and the World
Bank and further unfolded by the recent
publication from GLTN / UN-Habitat providing
advisory guidelines for country implemen-
tation. This comprehensive tool looks at
applying the spatial, legal and institutional
methodologies that are most fit for the
purpose of providing secure tenure for all by
addressing the current constraints and
allowing for incremental improvement over
time.
Against this backdrop, it looks like the land
toolbox is full and ready for use – and the
timing is apt. The 2030 Global Agenda, the
Sustainable Development Goals, have
highlighted the key role of secure land rights
in achieving many of the global objectives.
Land issues are currently high on the political
agendas. Therefore, the timing appears to be
right to initiate a global campaign to close the
security of tenure gap.
Let’s get to work.
By Stig EnEmark, honorary president, FiG
The Land Toolbox Is Full
Stig Enemark.
06_insider39;sview.indd 6 25-07-17 14:49

news
V90 Plus
High-end RTK receiver with multi technology integrated
BD970 GNSS engine
Support GPS, GLONASS, BDS, GALLILEO
Tilt sensor and electronic bubble integrated
NFC and WiFi functionality
7august 2017 | international | 7
OGC Publishes Results of International Arctic Spatial Data PilotThe Open Geospatial Consortium has published the
results from the Arctic Spatial Data Pilot (Arctic SDP).
The results, including reports, demonstration videos
and interviews, are available at the consortium’s
website. Additionally, the OGC is now exploring options
for the next phase of the Pilot. The Arctic SDP, an 18 -
month project, was initiated to demonstrate the
diversity, richness and value of providing geospatial
data using international standards in support of
seamless spatial data exchange with application to a
range of Arctic topics. Eight scenarios were used to
demonstrate a solution to a key aspect of environ-
mental and resource management in the Arctic: from
permafrost melt, to shipping routes, from search &
rescue, to food security, and more.
http://bit.ly/2ugvnsf
Esri and Microsoft Join Forces on Artificial IntelligenceLand cover mapping is a critical part of conservation planning, but current methods for collecting detailed
geographic data are highly labour-intensive. Advanced technologies like artifi cial intelligence (AI) can help but are
not yet widely accessible to those on the front lines of conser-
vation and mapping. That is why Esri announced a collabo-
ration with Microsoft to provide greater access to these
technologies through a newly aligned grant process. Spatial
analytics is a crucial part of conservation, because it is an
inherently geographic fi eld, said Jack Dangermond, Esri
founder and president. Understanding environmental data in
the context of location is necessary when making decisions
about protecting fragile ecosystems. The ability to analyse the
vast quantities of data present in our environment is critical,
and this collaboration allows conservationists to do their job
more accurately than ever before on a wider scale.
http://bit.ly/2taB4xl
Bluesky Launches Nationwide Map of Building HeightsAerial mapping company Bluesky has
launched the fi rst UK nationwide map
providing accurate height measurements for
around 40 million buildings. Created from a
combination of remote sensing surveys,
including data from aircraft mounted lasers
(Lidar), the Bluesky Heighted Building dataset
covers the whole of England, Wales and
Scotland, and will help to change the way we
visualise and understand the built
environment. By applying height values to
41,083,111 buildings, Bluesky is giving
planners, developers, local government, utility
companies and the emergency services a
brand new perspective. Including multiple
values for every residential, leisure, retail,
commercial and industrial structure in
mainland UK, the Bluesky Heighted Building
dataset will provide new intelligence to
underpin decision making and service delivery.
http://bit.ly/2uP8d1M
Microsoft will deliver AI technology to Esri.
Bluesky Heighted Building dataset.Arctic seen from space (Courtesy: NASA).
07-08-09-11_news.indd 7 25-07-17 13:11
news
88 | international | august 2017
Galileo satellites.
WorldDEM imagery.
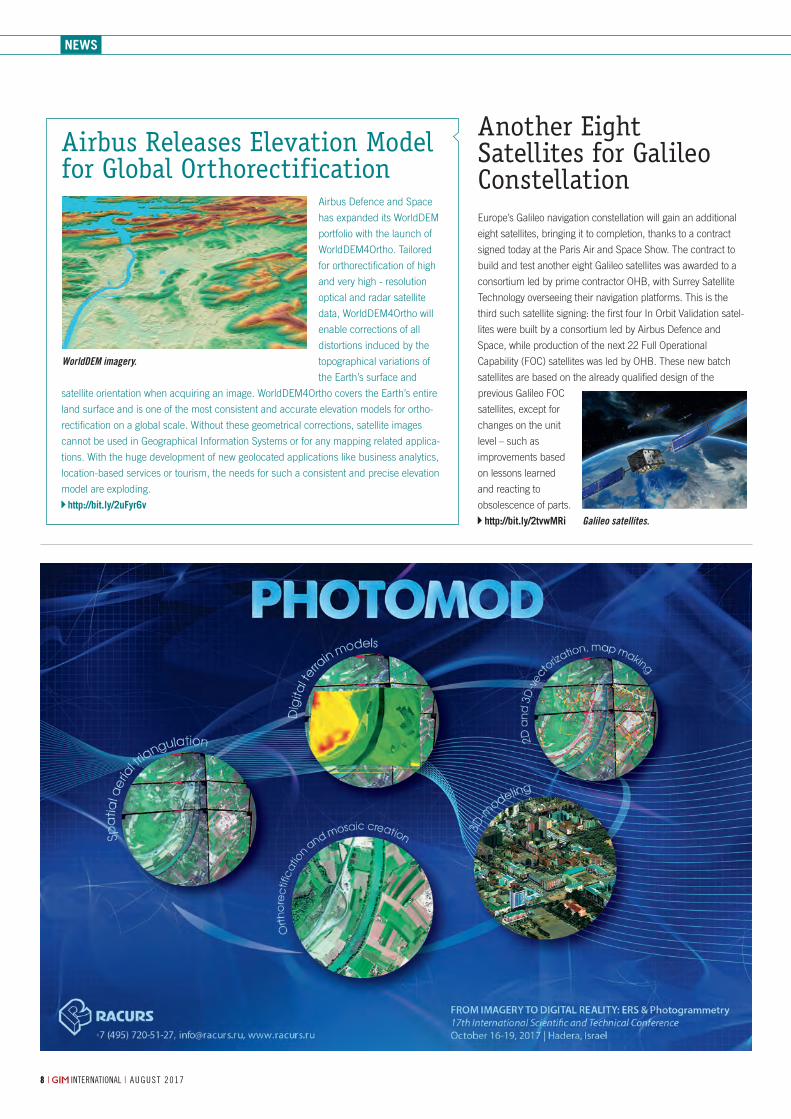
Airbus Releases Elevation Model for Global Orthorectification
Airbus Defence and Space
has expanded its WorldDEM
portfolio with the launch of
WorldDEM4Ortho. Tailored
for orthorectification of high
and very high - resolution
optical and radar satellite
data, WorldDEM4Ortho will
enable corrections of all
distortions induced by the
topographical variations of
the Earth’s surface and
satellite orientation when acquiring an image. WorldDEM4Ortho covers the Earth’s entire
land surface and is one of the most consistent and accurate elevation models for ortho-
rectification on a global scale. Without these geometrical corrections, satellite images
cannot be used in Geographical Information Systems or for any mapping related applica-
tions. With the huge development of new geolocated applications like business analytics,
location-based services or tourism, the needs for such a consistent and precise elevation
model are exploding.
http://bit.ly/2uFyr6v
Another Eight Satellites for Galileo ConstellationEurope’s Galileo navigation constellation will gain an additional
eight satellites, bringing it to completion, thanks to a contract
signed today at the Paris Air and Space Show. The contract to
build and test another eight Galileo satellites was awarded to a
consortium led by prime contractor OHB, with Surrey Satellite
Technology overseeing their navigation platforms. This is the
third such satellite signing: the first four In Orbit Validation satel-
lites were built by a consortium led by Airbus Defence and
Space, while production of the next 22 Full Operational
Capability (FOC) satellites was led by OHB. These new batch
satellites are based on the already qualified design of the
previous Galileo FOC
satellites, except for
changes on the unit
level – such as
improvements based
on lessons learned
and reacting to
obsolescence of parts.
http://bit.ly/2tvwMRi
07-08-09-11_news.indd 8 25-07-17 13:11

Intelligent USV with brilliant mobility
Auto-return while low battery or dropped signal
Manual or autopilot ,switchover by one step
Professional soundingmodule guarantees sounding range 0.15~300m
Ducted propellers avoid beingtwined by aquatic plants
0.15m
300m
9august 2017 | international | 9
MORE NEWS GIM-INTERNATIONAL.COM
Trimble Catalyst application.Overview of the data collected in Wales.
Carbomap to Map with Advanced Lidar UAS SolutionCarbomap, an environmental survey company, in
collaboration with high-performance Lidar manufac-
turer RIEGL, UAVE and the University of Edinburgh,
have announced the fi rst successful demonstration
fl ight of a RIEGL VUX-1LR survey-grade waveform laser
scanner on a fi xed wing, long range unmanned aerial
vehicle (UAV). This is likely the fi rst time that such a
high-performance scanner has ever fl own on a fi xed
wing UAV with such an advanced specifi cation for long
duration (8 hrs) and long range (1,000km). With
centimeter-scale 3-dimensional accuracy, this break-
through development will greatly increase the
worldwide accessibility to high-quality laser scanning.
Throughout the world, Lidar data is used for mapping
infrastructure, conducting forest inventory, and deter-
mining fl ood risk in river basins, for example. However,
obtaining such high-quality 3D data can be very
expensive to obtain using conventional airborne
surveys. It is diffi cult to process without specialised
software, and as a consequence, it is rarely available in
most developing nations. By bringing such instruments
together into a single UAV system (named Forest-Lux
or F-Lux, for short), together with its own solution-
focused software, it is now possible to get a system that
can be a local asset, under local stakeholder control,
and be operated at an affordable price in any country
in the world.
http://bit.ly/2uFH6FZ
On-Demand Positioning-as-a-Service with Trimble CatalystTrimble has announced that its Trimble
Catalyst software-defi ned Global Navigation
Satellite System (GNSS) receiver for Android
devices is now available through Trimble’s
global distribution network. Customers can
now access Positioning-as-a-Service to collect
geo-location data with Trimble or third-party
apps on smartphones, tablets and mobile
handhelds. When combined with a small, light-
weight, plug-and-play digital antenna and
subscription to the Catalyst service, the
receiver provides on-demand GNSS positioning
capabilities to transform consumer devices into
centimeter-accurate mobile data collection
systems. Catalyst extends the accessibility of
Trimble’s high-accuracy positioning to a
broader base of users easily and with only a
few components, which include any location-
enabled mobile app, a Catalyst subscription,
with accuracy options ranging from one-metre
to centimeter level and Trimble’s small, light-
weight DA1 antenna that plugs directly into
Android smartphones and tablets.
http://bit.ly/2ugwUTi
World’s Densest Urban Aerial Lidar Dataset ReleasedNew York University’s Center for Urban Science and Progress (NYU CUSP) Professor Debra F. Laefer has released
the world’s densest urban aerial laser scanning (Lidar) dataset. At over 300 points per square metre, this is more
than 30 times denser than typical Lidar data and is an order of magnitude denser than any other aerial Lidar
dataset. The dataset also includes the fi rst ever urban scan with the full-wave form version of the data, as well as
affi liated imagery and video. The unprecedented comprehensiveness of this multi-layered dataset enables new
opportunities in exploration and modelling. It also sets a new standard for what can be collected and used by cities
around the world. The data and affi liated information is now publicly available through New York University’s Spatial
Data Repository (SDR) for both personal and commercial use.
http://bit.ly/2uHOyjI
07-08-09-11_news.indd 9 25-07-17 13:11

Leica Geosystems AGleica-geosystems.com
©2017 Hexagon AB and/or its subsidiaries and affiliates.Leica Geosystems is part of Hexagon. All rights reserved.
Leica Cyclone Smarter Registration, Visualisation, Collaboration
Leica CycloneA smarter way to view the world
Are you ready to view the world from a
smarter perspective?
Leica Cyclone brings a new dimension to surveying
infrastructure. Fuse the real and digital worlds to deliver
smarter registration, visualisation and collaboration for
enhanced efficiency, productivity and interaction.
Explore more: cyclone.leica-geosystems.com

11AUGUST 2017 | INTERNATIONAL |
MORE NEWS GIM-INTERNATIONAL.COM
UrtheCast and Esri Bring Satellite Imagery to Life in ArcGIS UrtheCast and its subsidiary, the Earth Observation
company Deimos Imaging, have entered a broad
partnership with Esri, starting with a new UrtheCast
imagery service that is powered by Esri: Kanvas. The
service will enable all Esri users to access timely,
reliable and quality assured imagery, directly into their
apps and desktops. The on-the-fl y imagery service
curated by Deimos imaging, is a precursor to the
upcoming UrtheDaily constellation, which is expected
to image the entire Earth daily at 5m resolution, compli-
menting Sentinel-2 and Landsat applications. From
now on, anyone with the ArcGIS platform will have free
access for three months to the multi-season time series
of medium and veryhigh - resolution satellite imagery,
over the whole of Spain and California. Hosted in
Amazon Web Services using ArcGIS, Esri users can
utilise the multi-temporal imagery service and start
building valuable apps for monitoring, change
detection, precision insights and more.
http://bit.ly/2tlgg21
Best Practices to Take Centre Stage at the IASEXPO Forum From 26 to 28 September 2017, the international UAV sector will be demonstrating its potential at Interaerial
Solutions in Berlin. Europe’s largest drone show will form part of Intergeo, the world’s leading trade fair for geodesy,
geoinformation and land management. IASEXPO has the clear aspiration of becoming established as the number one
industry gathering for commercial and civil drone applications in Europe. Advance tickets can now be purchased
online. The IASEXPO practical forum will cover the very latest topics and feature renowned experts, an international
outlook and direct practical relevance. Visitors don’t have to walk far
to switch back and forth between market overviews and expert
presentations on user-group-targeted clusters of topics. The aim is
to effi ciently combine trade fair and talks. As Germany’s drone
regulations come into force this year, the legal aspects of using and
operating this kind of equipment forms a key focus of the IASEXPO
practical forum. First-hand reports will also abound at the forum –
providing examples of best practice in using drones for surveying
and inspecting buildings and industrial complexes, above all.
http://bit.ly/2uHYvO8
senseFly Launches Package to Keep UAV Operators Flying senseFly, the Switzerland-based producer of
mapping drones, has announced Always On, a
new service package designed to keep profes-
sional UAV operators working and ensure
business continuity. Businesses are increas-
ingly professionalising their drone operations,
with UAV data acquisition developing in line
with this change, marking a move from using
drones in pilot projects only to integrating the
technology into companies’ business models
and processes. To address the growing
demand for turnkey solutions that come with
professional grade service and support,
senseFly has developed its Always On service
package. Available as a bundle option
alongside every new eBee Plus drone
purchase, Always On provides operators with
an advanced level of professional support and
peace of mind. In the event of a drone
hardware problem –whether the result of user
error, a naturally occurring event or a technical
issue – customers can simply contact their
local senseFly representative to have their
drone replaced for free within 48 hours, no
questions asked.
http://bit.ly/2uHKf80
Integrated high-accuracy mobile mapping system
Fully integrated solution
High-density, high-accuracy point cloud
Fully matched point cloud and panorama images
Interaerial Solutions.
senseFly eBee Plus.UrtheCast Earth imagery.
07-08-09-11_news.indd 11 25-07-17 13:12

ROAD-SCANNERC
www.sitecoinf.it [email protected]
T h e m o s t c o m p a c t a n d c o s t - e f f e c t i ve l a s e r m a p p i n g s y s t e m p ow e r e d by FA RO
T h e m o s t c o m p a c t a n d c o s t e f f e c t i ve l a s e r m a p p i n g
s y s t e m
Portable and self-calibrating Post-processing software AutoCAD/ArcGIS/Microstation plugins Road Assets and PMS High accuracy INS & spherical camera Detachable FARO Focus laser scanner
p ow e r e d by FA RO

GIM PERSPECTIVES
13august 2017 | international |
By Pedro J. ortiz, GeoProPiedad, SPain
I am sure that most of the readers of GIM
International know what the word ‘boundary’
means. I’m not a native English speaker, but,
in everyday terms, the usual understanding of
the word ‘boundary’ is related to international
borders rather than private property borders.
However, if we add the adjective ‘cadastral’ to
the word ‘boundary’, perhaps it will help us get
into the topic a little bit more. In my country,
Spain, the word cadastre is related to real estate
tax and once again this can create confusion.
A generally accepted definition for ‘boundary’
is: An imaginary line which marks the mutual
extent and limits of two adjacent parcels of land.
This definition clarifies the way in which the
main characteristic of a boundary becomes,
‘the legal line where the ownership rights of one
person meets those of another’.
Because of the inherent legal and non-physical
characteristic, intensive surveying data capture
is not really the best way to ensure security of
ownership. Furthermore, the legal boundary
may be delineated on the ground by physical
features such as boundary marker-stones,
fences, walls, ditches, etc.
It is important, in the first instance, to have a
look at where the boundary lines originate:
• Asaresultofanagreementbetween
adjacent neighbours, it could be clearly stated
where the boundary line lies. That is known
as an ‘agreed boundary’ and shall then be
registered at the proper real estate registry.
• Becauseofaparcelsubdivision,inwhich
case we must firstly have administrative
permission, and then the real estate must be
legally divided, as a division or segregation and
the precise location of that sub-division must be
recorded for future reference.
Cadastral Boundaries or Legal Boundaries
Pedro J. Ortiz.
In both cases, there is a technical act that
determines the precise location of the
boundary, but if this boundary is described
in the title deeds or any other kind of legal
document, the physical feature could well have
disappeared but the recording of that boundary
as a clear legal aspect remains the sole aim.
Once the boundary has been recorded on the
legal document, i.e. title deeds, and then by the
land registry, the land owner needs to physically
fence the property (although, occasionally, due
to the topographic nature of the land, a fence
may be built as an offset from the true line). At
other times, transit purposes require a gap to
be left between the boundary and roads, rivers,
railways, etc.
There are several circumstances that do
not require erecting a fence, because there
is a natural boundary feature (a riverbed, a
watershed, etc). These kinds of boundary
features are not easy to determine with a flat
orthophoto, and would ideally require a digital
terrain model (DTM) as well. Nevertheless, the
most important aspect is that the DTM shall
represent/capture the date that the boundary
definition took place if it differs from the survey
date.
In order to represent the boundaries in a map
or a geospatial database, there is one critical
aspect, namely, the liability on this data. It
should be remembered that there are three
main parties involved in this issue; the land
owner, the land surveyor, and the Authority in
charge of recognising the overall legality of the
process.
In some countries, the Land Surveyor and
the Authority are merged into the same entity,
which is an advantage in terms of security,
economic agility and finally, the overall
responsibility. It should be borne in mind that a
GIS operator (interpreting the captured data),
will not, and should not, be responsible for
any misinformation or mistakes caused by the
boundary interpretation.
Those involved in the above process should
never forget that the object of the exercise is
to ensure certainty for property owners in the
future.
Pedro J. Ortiz is a geometry expert and real
estate geo-consultant, who has his own
company, GeoPropiedad in Marbella, Spain,
with more than 20 years of experience in the
surveying industry.
www.twitter.com/ortiz_pedroj
13_perspectives.indd 13 25-07-17 14:49

14 | international | august 2017 august 2017 | international |
The Global Spatial Data Infrastructure (GSDI) Association was formed in 2004 as an inclusive networking organisation of academic and research institutions, government agencies, commercial geomatics firms, national and regional geographic information associations and individuals from around the world. What are the latest trends and developments when it comes to spatial data? GIM
International talked with Dave Lovell, president of the GSDI, about topics ranging from knowledge sharing and capacity building to big data.
The GSDI Association’s vision is a world where everyone can readily discover, access and apply geographic information to improve their daily lives. Where do we stand now?The simple answer is that, at the moment, no
one truly knows, that’s why we are working on
a new approach to creating a global index of
National Spatial Data Infrastructure (NSDI)
implementation. It’s an approach which will
allow all actors, users, suppliers, consultants
and the academic community to contribute.
The index consolidates and condenses a
large body of scholarship and experience of
NSDIs into a set of key components that can
be assessed and benchmarked using six
indicators. The index will provide a top-level
assessment and ultimately the scoring will
support investment and decision making to
be directed towards any weak or problematic
areas of NSDI development.
After testing in the coming weeks, the index
will be made available in an online platform
where the results, without weighting, analysis
or conclusions being drawn, will be made
available dynamically by sector and as an
overall averaged score from all responders to
give the index value for each country. To
maximise contributions to scoring we will be
seeking support from the UN-GGIM thematic
networks and Regions.
As an added value we believe that the
process and results will promote collaboration
and motivation between government
departments and other stakeholders to
improve their spatial data quality,
management and availability. There is also the
potential for the Index to raise awareness of
potential barriers to a country effectively
reporting spatial data evidence to the
Sustainable Development Goals and other
international agreements.
Your Association is also on a mission, namely to advance geo-information best practices, knowledge sharing and capacity building. Are you satisfied with where you are today?GSDI has achieved a great deal since its
inception; nearly USD300,000 has been
granted to support 117 completed projects
which advanced the understanding,
implementation, development and use of
Spatial Data Infrastructures across the world.
15 global conferences have been organised
which have been attended by thousands of
delegates, a ‘how to’ SDI Cookbook has been
published, updated and translated into
multiple languages, and a wealth of other
resources made available at our website.
We’ve funded a number of development
projects, attended many conferences,
supported GEO and CEOS and contributed to
establishing the UN Committee of Experts on
Global Geospatial Information Management.
In fact, I think that we can claim that the
pioneering work of GSDI and its members has
contributed significantly to this development.
But until a job is done or an outcome is
delivered, I’m not satisfied. A great deal has
been achieved by GSDI, and others of course,
to advance understanding of the role and
benefits of applying geospatial information
and technologies to real world challenges and
problems be they in the environment, the
economy or wherever, but there is still much
more that needs to be done in order to realise
the full potential of geospatial information and
technologies.
You have been making Small Grants Programme awards available since 2003. How can a grant of USD2,500 make a difference in geospatial data infrastructure?If you’ll forgive me for saying so, the question
embodies a very developed world
perspective. In many countries in the world,
USD2,500 is a significant sum of money and
the appetite for receiving a grant continues
unabated. Since 2004 GSDI has supported
117 projects. This year’s call for proposals
stimulated 31 applications from 27 countries
in Africa, Asia-Pacific, Europe, North and
South America, covering a wide range of SDI
and GI/GIS related project work. In addition to
cash awards, some of the proposals also
requested support from the GISCorps of
URISA’s volunteer network.
Supported projects this year include:
Unlocking Government Environmental Data in
Kenya, Support for Working Group on
Formulating the SDI Act in Mongolia, SDI to
Support Sustainable Energy Planning in West
Africa, Translating the GSDI SDI Cookbook
and a number of SDI promotion and training
projects.
This year, the cash awards are made from
GSDI’s own reserve funds. I’m disappointed
that we can’t provide more funding so that
others of the more deserving proposals can
be funded in 2017. If readers wish to
Maximising the Benefit of Geospatial Information
GIM InTernATIonAl InTervIeWS DAve lovell
By Wim van Wegen, content manager, gIm InternatIonal
14-15-17_interview.indd 14 25-07-17 14:49
INTERVIEW
15| international | august 2017 august 2017 | international |
2. Machine learning – which gives computers
the ability to learn without being explicitly
programmed, particularly within the field of
data and predictive analytics, has the
potential I believe to help us move from a
spatial data infrastructure to the more
powerful spatial knowledge infrastructure
which is envisioned in the Australia and New
Zealand Cooperative Research Centre for
Spatial Information’s white paper www.crcsi.
com.au/spatial-knowledge-infrastructure-
white-paper/.
The european Union has its InSPIre Directive, which establishes an infrastructure for spatial information in europe to support Community environmental policies. Is the GSDI Association involved?GSDI members, particularly EuroGeographics,
National Land Survey of Finland, Kadaster
(The Netherlands), KU Leuven, TU Delft and
others have contributed immensely since its
inception, and continue to do so. The recently
completed European Location Framework and
current transitional programme towards
European Location Services project provide
excellent examples of their practical work to
provide the single access point for international
users of harmonised, pan-European,
authoritative geospatial information and
services; and enable national mapping,
cadastral and land registry authorities to be
recognised in their international effort to
contribute to the wider public good.
Members have also contributed at a number of
INSPIRE Conferences and will do so again this
year. For example, Abi Page, chair of the
Association for Geographic Information (AGI)
and Technical Product Development Manager
at EuroGeographics, presents on the role of
open data in the journey to operational
European Location Services. Our Secretary
General, Roger Longhorn, will present one of
our current projects in the Marine SDI, INSPIRE
and the EU Marine Directives Workshop and will
report on Multiple Agency Cooperation for
Implementing the EU Maritime Spatial Planning
Directive. One of our key founding members,
the Open Geospatial Consortium, has also been
directly involved in several projects relating to
INSPIRE implementation.
You organise GSDI World Conferences – and other events – around the globe. What makes these conferences/events so relevant?For me, the sheer variety of topics covered
and the diversity of presenters and
presentations differentiates GSDI Global
Conferences from the rest. Our conferences
aren’t stage-managed platforms for global
companies to promote themselves and their
products, but rather a platform for everyone
from early career professionals to people with
decades of experience to present their latest
research, report new and exciting uses of
geospatial information and technologies or
project achievements. At our fifteenth and
most recent conference in Taipei in
December 2016, simultaneously in different
streams, our member PSMA Australia Ltd
with Digital Globe delivered a workshop on
the development of the ‘ground breaking’
Geoscape product whilst in another room an
assessment of building evacuation scenarios
considering panic and knowledge of exits
using a 3D GIS agent-based model was
presented.
By choosing a different location around the
globe for each conference, we provide
opportunities to people and companies
unable to travel to ‘far flung’ international
destinations to showcase their work and
receive feedback from the expert knowledge
our delegates represent.
contribute they can do so, without becoming
a member of GSDI if they so wish, by sending
an email to [email protected].
Spatial data infrastructure allows nations to better address social, economic, and environmental issues of pressing importance, including sustainable development. Can you give some eye-catching examples?I find it impossible to select just two, as there
are already many thousands of case studies
that address these issues, where ‘location’ is
a key aspect of the challenges being faced.
Another challenge is one faced by all
stakeholders who engage in pre- and
post-SDI implementation cost-benefit studies.
That is, are you measuring the societal
benefit achieved by the specific application(s)
or the additional benefit achieved due to
having a robust spatial data infrastructure in
place, i.e. one in which the required data can
be created, managed, publicised, accessed,
shared, used and re-used with greatest
efficiency and at least cost. Research has
been ongoing for over two decades now, and
the challenges are well described in
‘Assessing the impacts of SDIs: A report of
the international workshop on spatial data
infrastructures’ cost-benefit / return on
investment’ held at the EC’s Joint Research
Centre in 2006 – see http://cordis.europa.eu/
publication/rcn/200718878_en.pdf.
Research carried out by our Secretary
General has identified cost benefit ratios
ranging from 1.8:1 to as high as 27:1 for
different sectors and applications in nations
across the globe, in areas such as cadastre,
land management, remote sensing, census
statistics, managing local government, and
many, many more.
Geospatial big data is a hot topic in the geomatics industry. Which developments do you foresee when it comes to managing the data?I’m not really the right person to ask given my
interests are principally in association
management and articulating the benefit of
the use of geospatial information, but from
the many things that I’ve recently been
exposed to the following two stand out:
1. Blockchain - which allows for records
between different parties to be recorded and
managed in an efficient, verifiable and
permanent way with records held in a
database distributed across multiple
computers, has I think real potential in land
registry and land information systems;
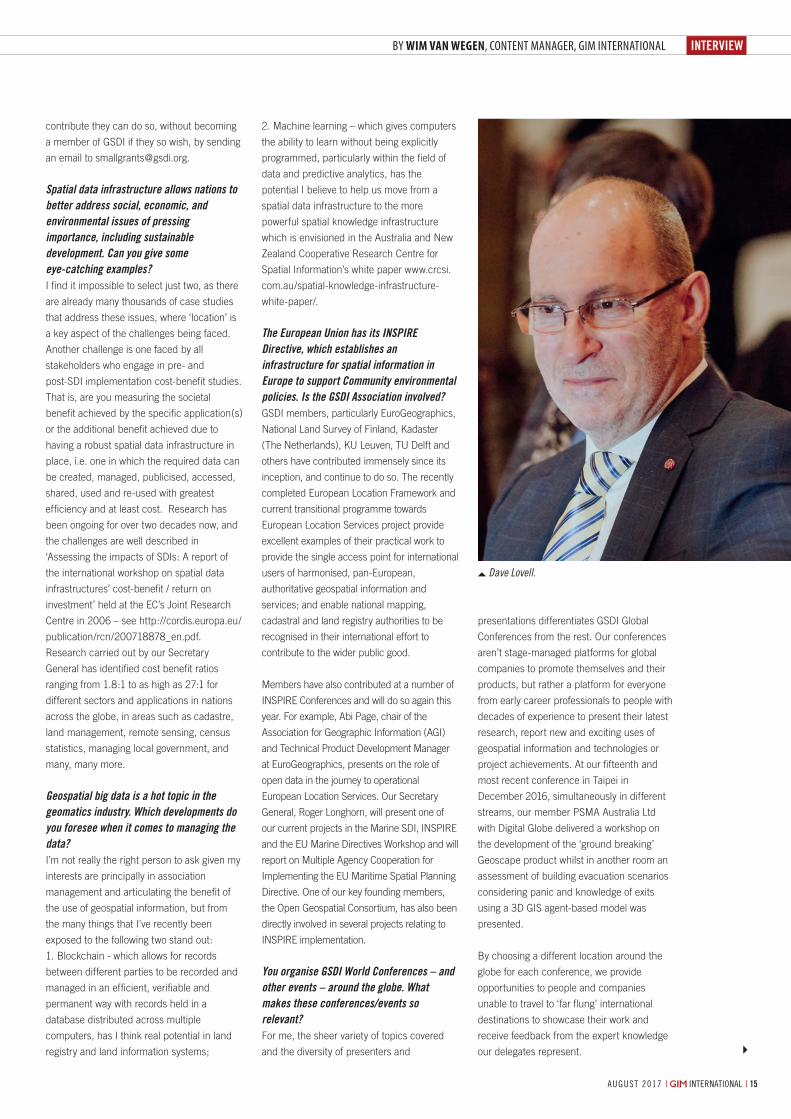
Dave Lovell.
By Wim van Wegen, content manager, gIm InternatIonal
14-15-17_interview.indd 15 25-07-17 14:49


INTERVIEW
august 2017 | international | 17
work is crucial to implementing SDIs, but also
eight universities in Europe, North America
and Australia, plus UNIGIS, the global GI
Science distance learning network that boasts
9 university partners, 15 study centres, 4,000
active students and over 10,000 alumni. We
have also been implementing an expanded
Capacity Building Programme since 2016,
which includes many webinars relating to the
work of our Strategic Projects, such a Marine
SDI Best Practice and developing the global
index of National Spatial Data Infrastructure
(NSDI) mentioned earlier. In 2017, we are
delivering specific webinars focusing on SDI
issues that are often not covered by others in
the geo sector, such as data policy, IPR and
licensing practices, open data and big data
challenges. GSDI also maintains a major
online resource of open access publications
directly related to SDI implementation, best
practice, case studies, webinars, cookbooks,
etc. at our website.
How do you foresee the future when we zoom in on the geospatial sector? Are there any developments that will change the industry in the coming years?We can be sure that there are developments
that will change the industry in the coming
years; only time and hindsight will tell us if we
were able to predict them!
It seems that everybody I meet professionally
at the moment is talking about the potential of
Geospatial Platforms. When I looked for a
definition, I found the one from FGDC the
simplest to consume - ‘The Geospatial
Platform will be a portfolio of common
geospatial data, services, and applications,
managed, contributed and administered by
authoritative sources and hosted on a shared
infrastructure’. What struck me was that this
was in a document published in June 2011. If
this is the future, it’s a long time coming!
Most recently I’ve been struck by the
conversations about the future of national
mapping authorities, and given the first forty
years of my career were happily spent in a
variety of roles with Ordnance Survey (GB), I
guess that’s inevitable. Nowhere is this better
covered than in an output from the recently
held Cambridge Conference. I recommend
reading the story ‘Mainstreaming geospatial
data: an exercise in market satisfaction’ from
the CEO of one of our members.
So, fundamentally, I see the biggest need and
the biggest change coming from the greater
integration of information and technologies
driven by people with similar ambition,
foresight and passion to maximise the benefit
of geospatial (location) information as was the
vision of those who founded GSDI in the first
place.
The Proceedings of the GSDI 15 World
Conference are available for downloading
from the GSDI website.
GSDI has signed several Memorandums of Understanding with partner organisations such as FIG, ICA and ISPRS. What are the benefits of these partnerships?GSDI has MoUs with FIG, ISPRS, ICA, ISDE
(International Society for Digital Earth), and
CDMPS (the Centre for Disaster Management
and Public Safety) of our member Univ. of
Melbourne, the earliest dating back to 2010.
The main benefits are sharing geo-related
news and ensuring participation on themes
related directly or indirectly to SDI at multiple
international conferences and workshops of
our MoU Partners. As well as joint promotion,
over the years we have seen an SDI focus
appearing in the structures of the
organisations, such as ISPRS Commission 4,
Working Group WG IV/6 - SDI: Internet of
Things and Spatial Decision Support, the ICA
Commission on SDI and Standards and FIG
Commission 3 – Spatial Information
Management.
A good example of how all the MoU Partners
work together is demonstrated by the
International Workshop on the Role of Land
Professionals and SDI in Disaster Risk
Reduction in the context of Post 2015 Nepal
Earthquake held in Kathmandu, Nepal, 25
– 27 November 2015, directly supported by
our Nepal member, NGIID (National
Geospatial Information Infrastructure
Department, Nepal) and jointly organised by
FIG Commission 2 (Professional Education)
and ISPRS Technical Commission IV (Spatial
Information Science), supported also by FIG
Commission 7 (Cadastre and Management).
This level of cross pollination of skills and
expertise would be much more difficult to
achieve without the existence of the MoUs –
and we wish to thank all of our MoU Partners
for their continued work with GSDI.
You are also involved with education focused on SDI development and implementation, and related geomatics technologies. Can you give some examples?The joint GSDI / FIG / ISPRS workshop
mentioned above is one good example. Many
different GSDI members have also been
directly involved in implementing SDIs
nationally and at trans-national level, such as
for INSPIRE in Europe. Our members include
not only the Open Geospatial Consortium
(OGC), whose international geo specifications
AboUt DAve LoveLLDave lovell is currently president of the global spatial Data infrastructure association, chair of un-ggiM geospatial societies, a member of the un-ggiM expanded Bureau, a Board member of the association for geographic information and until 2014 a member of the British geological survey advisory committee. lovell started his career with ordnance survey (great Britain) and spent forty years with them in a variety of roles in surveying, sales and Marketing and concluded his time with them as their head of Public affairs. Between september 2007 and october 2015 he was secretary general and executive Director of eurogeographics the international not-for-profit association now representing 63 national Mapping, Cadastre and land registry authorities in 46 countries in europe.
14-15-17_interview.indd 17 25-07-17 14:49

august 2017 | international || international | august 20171818 august 2017 | international |18
By Mathias LeMMens, Senior editor, GiM international
Management of roads, their maintenance
or reconstruction, requires inventories on
pavement conditions, road markings and
objects in the vicinity of the road including
utility poles, traffic signs, lamp posts and
speed guidance boards. The high point
density of point clouds acquired by mobile
The demand for 3D maps of cities and road networks is steadily increasing and mobile mapping systems are often the preferred geo-data acquisition method for capturing such scenes. Manual processing of point clouds is labour intensive and thus time consuming and expensive. This article focuses on the state of the art of automatic classification and 3D mapping of road objects from point clouds acquired by mobile mapping systems and considers the feasibility of exploiting scene knowledge to increase the robustness of classification.
mapping systems (MMSs) allows mapping
of traffic guidance arrows and road lines
painted on the pavement, vertical road
objects, cracks and holes in the pavement,
cavity and sagging. Vertical road objects are
known as pole-like objects (PLOs), because
of their profoundly elongated shape usually
extending in vertical direction. While carrying
out the survey at traffic speed, there is no
interference with other road users, which
contributes to safety. As a result, MMSs have
evolved into an increasingly popular geo-data
acquisition technology for conducting road
inventories over the last fifteen years.
Mobile Mapping SySteMSA Mobile Mapping System is usually mounted
on a car, van or other vehicle that can move
with traffic speed over roads and highways. An
MMS consists of a positioning and orientation
system (POS), one or more laser scanners,
one or more digital cameras and a control unit.
The setup of an MMS is schematically shown
in Figure 1, depicting the components of the
Riegl VMX-1HA. The part of the MMS without
cameras is called Mobile Laser Scanning
(MLS) system. The POS continuously acquires
data for calculating the exterior orientation
parameters (three coordinates and three
attitude angles) using a GNSS receiver and
an Inertial Measurement Unit (IMU), often
complemented with a wheel rotation counter.
Each laser scanner emits pulses, presently
up to one million pulses per second, to
capture road surfaces and objects above and
alongside the road. From the pulse travel times
the distances between sensor and object
is calculated. The laser scanner primarily
measures: (1) range – that means distance
from the sensor to the first surface hit by the
laser pulse – (2) scan angle and (3) intensity
of the return. Combining these measurements
with those from a GNSS receiver, IMU and
wheel counter provides 3D coordinates of
Mobile Laser Scanning Point Clouds
StatuS and ProSPectS of automatic 3d maPPing of road objectS
Figure 1, Components of the mobile mapping system of Riegl.
18-19-20-21_featurelemmens.indd 18 25-07-17 14:50
feature
19august 2017 | international || international | august 2017 august 2017 | international |
By Mathias LeMMens, Senior editor, GiM international
parameters of these segments are used as
features for further grouping, classification
and mapping. The same type of object may
appear in road scenes in different lengths,
widths and/or heights. The multiscale
approach takes account of size variations
of objects through combining features
computed at various point densities.
The three categories discussed above heavily
rely on the computation of geometric features
through exploiting the local geometric structure.
Automated classification attempts on MLS
point clouds have mainly focused on assigning
pre-specified classes to individual points. Point-
based approaches are more robust to occlusion
and clutter compared to the segmentation-
based approaches but the latter are more
robust to noise and varying point densities.
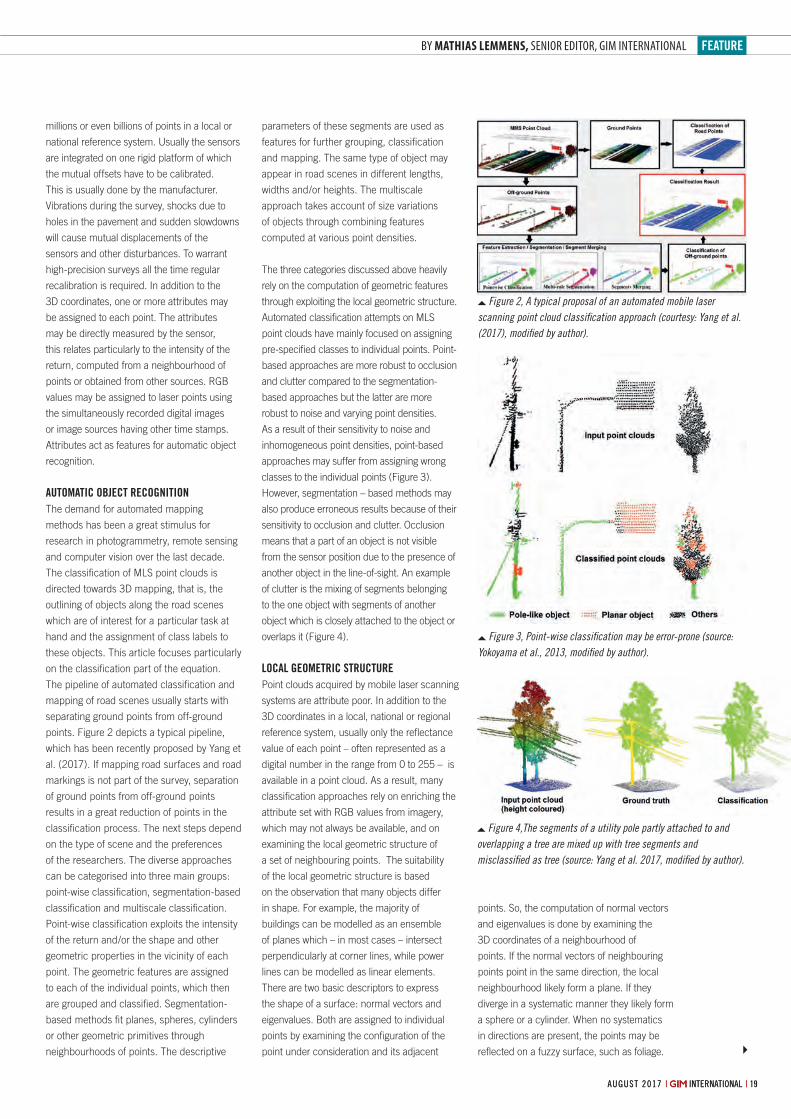
As a result of their sensitivity to noise and
inhomogeneous point densities, point-based
approaches may suffer from assigning wrong
classes to the individual points (Figure 3).
However, segmentation – based methods may
also produce erroneous results because of their
sensitivity to occlusion and clutter. Occlusion
means that a part of an object is not visible
from the sensor position due to the presence of
another object in the line-of-sight. An example
of clutter is the mixing of segments belonging
to the one object with segments of another
object which is closely attached to the object or
overlaps it (Figure 4).
local geoMetric StructurePoint clouds acquired by mobile laser scanning
systems are attribute poor. In addition to the
3D coordinates in a local, national or regional
reference system, usually only the reflectance
value of each point – often represented as a
digital number in the range from 0 to 255 – is
available in a point cloud. As a result, many
classification approaches rely on enriching the
attribute set with RGB values from imagery,
which may not always be available, and on
examining the local geometric structure of
a set of neighbouring points. The suitability
of the local geometric structure is based
on the observation that many objects differ
in shape. For example, the majority of
buildings can be modelled as an ensemble
of planes which – in most cases – intersect
perpendicularly at corner lines, while power
lines can be modelled as linear elements.
There are two basic descriptors to express
the shape of a surface: normal vectors and
eigenvalues. Both are assigned to individual
points by examining the configuration of the
point under consideration and its adjacent
points. So, the computation of normal vectors
and eigenvalues is done by examining the
3D coordinates of a neighbourhood of
points. If the normal vectors of neighbouring
points point in the same direction, the local
neighbourhood likely form a plane. If they
diverge in a systematic manner they likely form
a sphere or a cylinder. When no systematics
in directions are present, the points may be
reflected on a fuzzy surface, such as foliage.
millions or even billions of points in a local or
national reference system. Usually the sensors
are integrated on one rigid platform of which
the mutual offsets have to be calibrated.
This is usually done by the manufacturer.
Vibrations during the survey, shocks due to
holes in the pavement and sudden slowdowns
will cause mutual displacements of the
sensors and other disturbances. To warrant
high-precision surveys all the time regular
recalibration is required. In addition to the
3D coordinates, one or more attributes may
be assigned to each point. The attributes
may be directly measured by the sensor,
this relates particularly to the intensity of the
return, computed from a neighbourhood of
points or obtained from other sources. RGB
values may be assigned to laser points using
the simultaneously recorded digital images
or image sources having other time stamps.
Attributes act as features for automatic object
recognition.
autoMatic object recognitionThe demand for automated mapping
methods has been a great stimulus for
research in photogrammetry, remote sensing
and computer vision over the last decade.
The classification of MLS point clouds is
directed towards 3D mapping, that is, the
outlining of objects along the road scenes
which are of interest for a particular task at
hand and the assignment of class labels to
these objects. This article focuses particularly
on the classification part of the equation.
The pipeline of automated classification and
mapping of road scenes usually starts with
separating ground points from off-ground
points. Figure 2 depicts a typical pipeline,
which has been recently proposed by Yang et
al. (2017). If mapping road surfaces and road
markings is not part of the survey, separation
of ground points from off-ground points
results in a great reduction of points in the
classification process. The next steps depend
on the type of scene and the preferences
of the researchers. The diverse approaches
can be categorised into three main groups:
point-wise classification, segmentation-based
classification and multiscale classification.
Point-wise classification exploits the intensity
of the return and/or the shape and other
geometric properties in the vicinity of each
point. The geometric features are assigned
to each of the individual points, which then
are grouped and classified. Segmentation-
based methods fit planes, spheres, cylinders
or other geometric primitives through
neighbourhoods of points. The descriptive
Figure 2, A typical proposal of an automated mobile laser scanning point cloud classification approach (courtesy: Yang et al. (2017), modified by author).
Figure 3, Point-wise classification may be error-prone (source: Yokoyama et al., 2013, modified by author).
Figure 4,The segments of a utility pole partly attached to and overlapping a tree are mixed up with tree segments and misclassified as tree (source: Yang et al. 2017, modified by author).
18-19-20-21_featurelemmens.indd 19 25-07-17 14:50
| international | august 20172020 august 2017 | international |20
Also eigenvalues of the 3x3 covariance matrix
of the three coordinates of neighbouring
points indicate shape. If one eigenvalue is
large and the other two close to zero, the
neighbourhood forms a line. A plane is
indicated by two eigenvalues which have
approximately the same value and one
eigenvalue close to zero. Spherical and fuzzy
surfaces will have three large eigenvalues. It
is common practice to derive measures from
the eigenvalues which indicate the type of
local structure. Examples of such measures
are: linearity, planarity, sphericity, anisotropy,
eigenentropy and local surface variation.
Deep learningRecent innovations in computer vision and
artificial intelligence include the development
of deep learning algorithms based on
Convolutional Neural Networks (CNNs). The
development of this type of machine learning
methods have been inspired by the working
of the human brain. In the popular science
literature it is often suggested that a CNN
simulates the brain but that is not true in
the same way as it is false to state that an
aeroplane would simulate the flight of birds.
CNNs have been successfully applied in self-
driving cars, robotics and object recognition
from images. However, classification of point
clouds appears to be a hard issue because of
the sheer amount of points and the complexity
of outdoor scenes. Added to this the points are
not inherently structured as on an image raster
while the distribution of points over space is
irregular and non-homogenous. By feeding a
CNN with data of an abundance of prototype
objects, the algorithm can recognise objects
across a broad variety of scenes. However,
the training data has to be manually selected,
which is more time-costly for 3D models
than for 2D models. Recently, ETH Zurich,
Switzerland, has released a large-scale point
cloud classification benchmark with over four
billion manually labelled points, acquired with
terrestrial laser scanners (semantic3d.net).
The benchmark contains urban and rural
scenes, captured in Central Europe, depicting
typical European architecture including town
halls, churches, railway stations, market
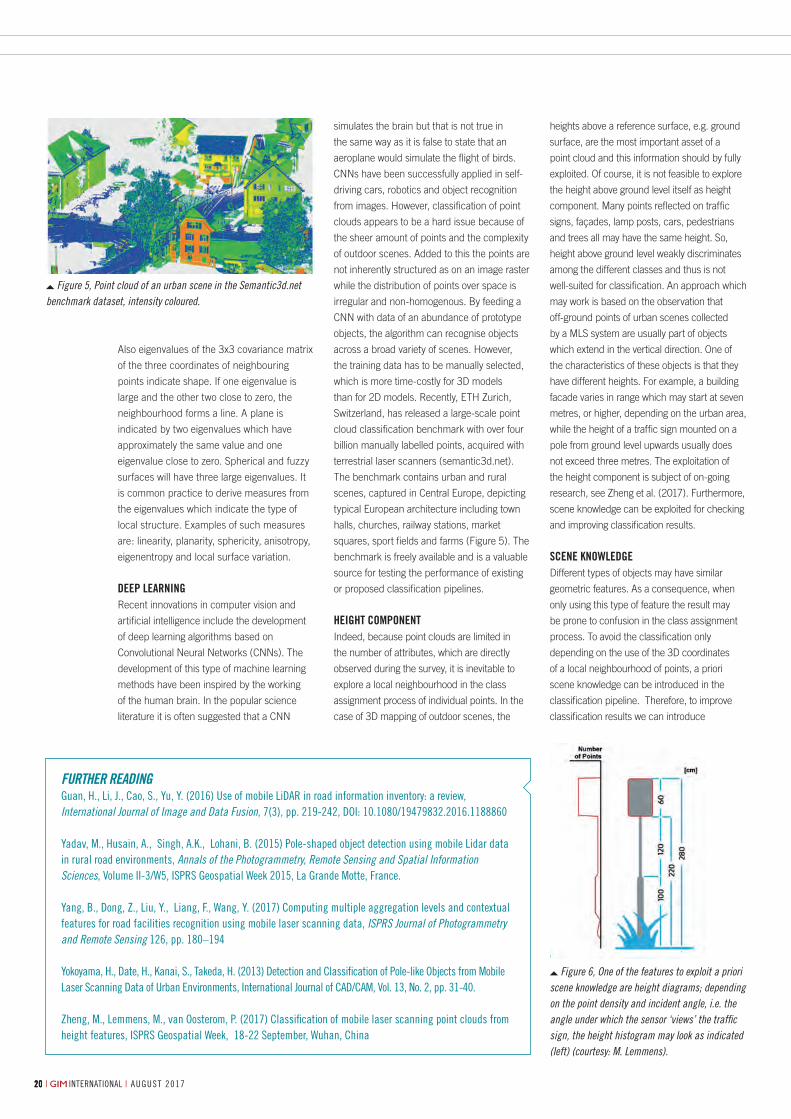
squares, sport fields and farms (Figure 5). The
benchmark is freely available and is a valuable
source for testing the performance of existing
or proposed classification pipelines.
HeigHt coMponentIndeed, because point clouds are limited in
the number of attributes, which are directly
observed during the survey, it is inevitable to
explore a local neighbourhood in the class
assignment process of individual points. In the
case of 3D mapping of outdoor scenes, the
heights above a reference surface, e.g. ground
surface, are the most important asset of a
point cloud and this information should by fully
exploited. Of course, it is not feasible to explore
the height above ground level itself as height
component. Many points reflected on traffic
signs, façades, lamp posts, cars, pedestrians
and trees all may have the same height. So,
height above ground level weakly discriminates
among the different classes and thus is not
well-suited for classification. An approach which
may work is based on the observation that
off-ground points of urban scenes collected
by a MLS system are usually part of objects
which extend in the vertical direction. One of
the characteristics of these objects is that they
have different heights. For example, a building
facade varies in range which may start at seven
metres, or higher, depending on the urban area,
while the height of a traffic sign mounted on a
pole from ground level upwards usually does
not exceed three metres. The exploitation of
the height component is subject of on-going
research, see Zheng et al. (2017). Furthermore,
scene knowledge can be exploited for checking
and improving classification results.
Scene KnowleDgeDifferent types of objects may have similar
geometric features. As a consequence, when
only using this type of feature the result may
be prone to confusion in the class assignment
process. To avoid the classification only
depending on the use of the 3D coordinates
of a local neighbourhood of points, a priori
scene knowledge can be introduced in the
classification pipeline. Therefore, to improve
classification results we can introduce
Figure 5, Point cloud of an urban scene in the Semantic3d.net benchmark dataset, intensity coloured.
Figure 6, One of the features to exploit a priori scene knowledge are height diagrams; depending on the point density and incident angle, i.e. the angle under which the sensor ‘views’ the traffic sign, the height histogram may look as indicated (left) (courtesy: M. Lemmens).
further readingguan, H., li, J., Cao, s., Yu, Y. (2016) use of mobile liDar in road information inventory: a review, International Journal of Image and Data Fusion, 7(3), pp. 219-242, Doi: 10.1080/19479832.2016.1188860
Yadav, M., Husain, a., singh, a.K., lohani, B. (2015) Pole-shaped object detection using mobile lidar data in rural road environments, Annals of the Photogrammetry, Remote Sensing and Spatial Information Sciences, Volume ii-3/W5, isPrs geospatial Week 2015, la grande Motte, France.
Yang, B., Dong, Z., liu, Y., liang, F., Wang, Y. (2017) Computing multiple aggregation levels and contextual features for road facilities recognition using mobile laser scanning data, ISPRS Journal of Photogrammetry and Remote Sensing 126, pp. 180–194
Yokoyama, H., Date, H., Kanai, s., takeda, H. (2013) Detection and Classification of Pole-like objects from Mobile laser scanning Data of urban environments, international Journal of CaD/CaM, Vol. 13, no. 2, pp. 31-40.
Zheng, M., lemmens, M., van oosterom, P. (2017) Classification of mobile laser scanning point clouds from height features, isPrs geospatial Week, 18-22 september, Wuhan, China
18-19-20-21_featurelemmens.indd 20 25-07-17 14:50

feature
| international | august 2017 august 2017 | international | 21
scene-specific rule number one: roads and
their vicinity are man-made, meaning that
the placing of objects, their shape, size and
orientation, have to obey road traffic regulations,
master plans and other official restrictions.
As a result road objects, such as guardrails
and traffic signs, appear in zones which are
approximately parallel to the main direction of
the road, while the distance to the road only
varies within a certain range. Added to this, the
orientation of traffic signs mounted on poles
is usually perpendicular to the road direction.
A second useful rule is that everything is
connected to something else and ultimately to
the surface of the Earth. This generic rule can
be further specified in the form of a geometric
constraint, reading: road objects usually expand
in the vertical direction, while their height
lies within a specific range. Furthermore, the
distribution of the number of returns from a
traffic sign depends on its shape and size.
Figure 6 depicts schematically how the height
constraint and the distribution of points along
the height of the object can be exploited for
classifying a traffic sign. Road objects are often
placed in regular patterns. This knowledge can
be used for improving assignment of classes.
For example, along the road lamp posts are
placed at regular distances. Recently, Yang et
al. (2017) used scene knowledge together with
combining the point-based approach with the
segment-based approach as described above
and found that their classification pipeline
resulted in an improved class label assignment
compared to other methods.
concluDing reMarKSAround the year 2003 mobile laser scanning
systems became operational for surveying
and 3D mapping of road scenes. Today MLS
systems are used for capturing roads and
their vicinity aimed at road inventories on a
regular basis. In the meantime, interesting
innovations are ongoing, one of these is
increasing awareness that point clouds should
be treated as a third type of data model
along raster and vector representations. The
point acquisition rate as well as the number
of commercial MLS systems in operation
are steadily increasing. However, data is not
yet information – the conversion of data to
information requires careful processing of
which the specifications of the various steps
depend on the application domain as well
as scene type. Before the sheer amount of
points can be mapped fully automatically a
long and winding road still lies ahead of us.
biograPhy of the authorMathias lemmens gained a PhD degree from Delft university of technology, the netherlands. He is an international consultant
and is the author of the book Geo-information – Technologies, Applications and the Environment published by springer in 2011. Currently he is working on a book on Point Clouds, provisionally entitled: An Introduction to Pointcloudmetry.
acknowledgementSthanks are due to Prof Konrad schindler, etH Zurich, switzerland, for allowing the presentation of the semantic3d.net benchmark and providing valuable input for the Deep learning paragraph.
18-19-20-21_featurelemmens.indd 21 25-07-17 14:50

feature
23august 2017 | international |
By Pere Molina, isMael ColoMina and Jan skaloud
mapKITE EnablEs corrIdor survEys aT a lowEr cosT whIlE maInTaInIng hIgh accuracy
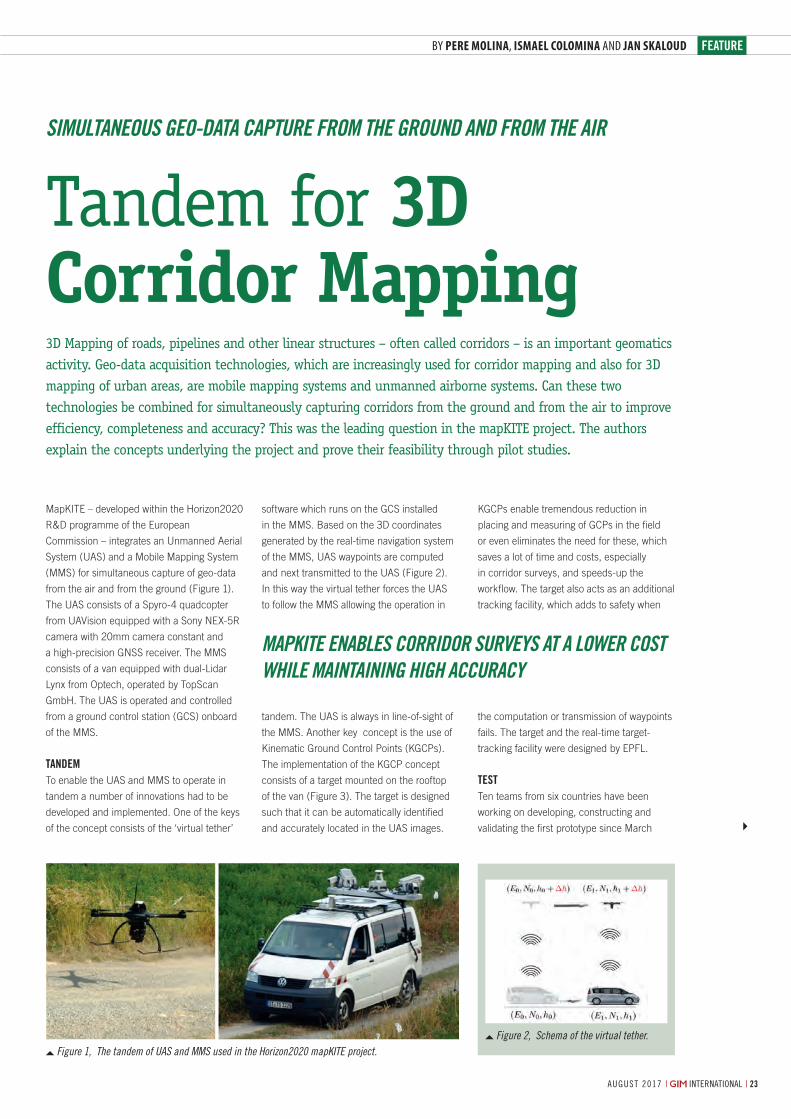
Figure 1, The tandem of UAS and MMS used in the Horizon2020 mapKITE project.
MapKITE – developed within the Horizon2020
R&D programme of the European
Commission – integrates an Unmanned Aerial
System (UAS) and a Mobile Mapping System
(MMS) for simultaneous capture of geo-data
from the air and from the ground (Figure 1).
The UAS consists of a Spyro-4 quadcopter
from UAVision equipped with a Sony NEX-5R
camera with 20mm camera constant and
a high-precision GNSS receiver. The MMS
consists of a van equipped with dual-Lidar
Lynx from Optech, operated by TopScan
GmbH. The UAS is operated and controlled
from a ground control station (GCS) onboard
of the MMS.
TandemTo enable the UAS and MMS to operate in
tandem a number of innovations had to be
developed and implemented. One of the keys
of the concept consists of the ‘virtual tether’
3D Mapping of roads, pipelines and other linear structures – often called corridors – is an important geomatics activity. Geo-data acquisition technologies, which are increasingly used for corridor mapping and also for 3D mapping of urban areas, are mobile mapping systems and unmanned airborne systems. Can these two technologies be combined for simultaneously capturing corridors from the ground and from the air to improve efficiency, completeness and accuracy? This was the leading question in the mapKITE project. The authors explain the concepts underlying the project and prove their feasibility through pilot studies.
software which runs on the GCS installed
in the MMS. Based on the 3D coordinates
generated by the real-time navigation system
of the MMS, UAS waypoints are computed
and next transmitted to the UAS (Figure 2).
In this way the virtual tether forces the UAS
to follow the MMS allowing the operation in
tandem. The UAS is always in line-of-sight of
the MMS. Another key concept is the use of
Kinematic Ground Control Points (KGCPs).
The implementation of the KGCP concept
consists of a target mounted on the rooftop
of the van (Figure 3). The target is designed
such that it can be automatically identified
and accurately located in the UAS images.
KGCPs enable tremendous reduction in
placing and measuring of GCPs in the field
or even eliminates the need for these, which
saves a lot of time and costs, especially
in corridor surveys, and speeds-up the
workflow. The target also acts as an additional
tracking facility, which adds to safety when
the computation or transmission of waypoints
fails. The target and the real-time target-
tracking facility were designed by EPFL.
TesTTen teams from six countries have been
working on developing, constructing and
validating the first prototype since March
Tandem for 3D Corridor Mapping
sImulTanEous gEo-daTa capTurE from ThE ground and from ThE aIr
Figure 2, Schema of the virtual tether.
23-24-25_featuremolina.indd 23 25-07-17 14:50

| international | august 20172424 august 2017 | international |24
2015. In June 2016, several test surveys
were conducted at the BCN Drone Centre
in Moià, Barcelona, Spain. This UAS testing
facility covers 2,500 hectares of segregated
airspace. A non-paved road through a rural
landscape was captured over a length of
2.3km. The height of the UAS varied from 80
to 90m above ground resulting in a ground
sampling distance (GSD) of 2cm. The images
were captured with an along-track overlap of
80% yielding a base-to-height ratio of 0.156.
This guarantees good geometric precision
and robustness even when there are gusts
of wind or large terrain variations. As the test
aimed at validation of components rather than
on testing performance under full operational
condition, the survey was conducted at low
speed, ranging from 10 to 30 km/h. The next
section focuses on the accuracy assessment
of the test.
accuracyTo assess the potential of KGCPs as input in
the triangulation and geo-referencing of the
images, 37 GCPs were evenly distributed
along the corridor. To simulate a conventional
UAS corridor survey a one-way strip
consisting of 149 images was selected. Using
tie points, the GNSS coordinates of the UAS
trajectory and 19 evenly distributed GCPs the
interior and exterior orientation parameters of
the 149 images were calculated. The same
images were also geo-referenced using 136
KGCPs complemented with two GCPs at each
end of the strip, i.e. four GCPs in total. Figure
4 shows the distribution of GCPs and KGCPs
over the test area. Using the remaining part
of the GCPs, 18 in total, as checkpoints,
the accuracy of both the conventional UAS
survey and the mapKITE survey have been
calculated. The accuracy statistics show that
the accuracy of the mapKITE survey slightly
outperforms the conventional UAS survey
(Table 1). The accuracy of the conventional
approach can be improved at the cost of
adding GCPs. So, the mapKITE concept
enables corridor surveys at a lower cost while
maintaining high accuracy standards.
Business OppOrTuniTiesMapKITE focuses on corridor mapping,
which appears to be a growth market.
Indeed, there is an increasing demand for 3D
mapping of roads, railways and waterways;
inspection of powerlines and oil and gas
pipelines; and coastal monitoring. Geo-data
simultaneously collected from ground and
airborne viewpoints complement each
other. Roofs not visible in an MMS dataset
and occluded objects are captured from an
airborne perspective (Figure 5). Line-of-sight
limitations between GCS and UAS usually
dictated by regulations disappear within the
mapKITE concept as it is kept continuously
within standard specifications. Of course,
there are constraints on the survey duration
particularly introduced by the need to change
Conventional UAS Survey mapKITE SurveyEast [mm] North [mm] Height [mm] East [mm] North [mm] Height
[mm]Max 164 110 245 103 76 212
Min -59 -71 -103 -4 -64 -122
Mean 3 14 31 0 -5 7
Std. Dev 49 48 87 32 36 86
RMS 49 50 92 32 36 87
RMS (px) 2.46 2.52 4.61 1.61 1.82 4.33
Table 1, Accuracy statistics obtained from confronting the computed coordinates of check points with the reference values.
Figure 3, Coded optical target mounted on the vehicle roof (left) and real-time target-tracking.
Figure 4, Distribution of 19 GCPs (white pins) used in the conventional UAS test survey (top) and the four GCPs and 136 KGCPs (red squares) used in the mapKITE test survey.
Figure 5, Point clouds derived from the MMS data only (top) and from the tandem datasets.
23-24-25_featuremolina.indd 24 25-07-17 14:50

feature
| international | august 2017 august 2017 | international | 25
batteries and the limitations of UAS speed,
which is lower than for MMS.
FuTure The navigation systems onboard the UAS and
MMS collect redundant data, the capability of
which is not yet fully exploited. Although the
MMS navigation system is more accurate than
the UAS system, data from the latter may be
beneficially exploited in case of blocking or
multipath of GNSS signals. Also here the target
mounted on the van plays a key role. Laser
scanners, digital cameras and other sensors
continue to become smaller and lighter,
which enables their combined use in one
and the same UAS. The UAS developments
concern fixed-wings with Vertical Take-Off
and Landing (VTOL) capability, operation in
swarms and longer battery charge endurance.
Together with global regulations relief these
developments will trigger more efficient and
robust UAS operations. When EU’s Galileo
and the Chinese Beidou GNSS become fully
deployed, around 100 GNSS satellites will be
available by 2020. With new wideband signals,
improved multipath mitigation and more
precise code-based ranging the precision of
the KGCPs will steadily increase supporting the
feasibility of our approach.
cOncluding remarksNow our concept has proven its feasibility,
we are working on making it operational for
corridor mapping by cooperating with system
integrators and survey companies who aim
to extend their portfolios. The concept and
prototype were presented at a workshop held
in June 2016. The event was attended by the
world’s leading mapping service companies
and technology integrators. On the MapKITE
concept GeoNumerics holds patents in Spain
(ES2394540) and United States (14/417,435)
while patents are pending in Europe and Brazil.
bIographIEs of ThE auThorspere molina is manager of advanced applications at geonumerics, based in Castelldefels, spain. He is an expert in
trajectory determination, remote sensing and unmanned aircraft applications and leads the mapKite project.
Dr ismael colomina is chief scientist at geonumerics, and holds over 30 years of experience in geomatics specialised in sensor
orientation and calibration and trajectory determination. [email protected]
Prof Jan skaloud is an expert in sensor integration for navigation and mobile mapping. He teaches and researches at École
Polytéchnique Fédéral de lausanne (ePFl), switzerland, on satellite positioning, inertial navigation, sensor calibration and photogrammetry.
morE InformaTIonMolina, P., Blázquez, M., Cucci, D.a., Colomina, i. (2016) First results of a tandem terrestrial-unmanned aerial mapKite system with Kinematic ground Control Points for Corridor Mapping.remote sensing 9 (1), 60.Video: https://vimeo.com/181634599
23-24-25_featuremolina.indd 25 25-07-17 14:50

2626 | international | august 2017 august 2017 | international |26
The venue – Château de Flaugergues, built
between 1696 and 1730 – added an extra
dimension to the two-day conference, held
on 29 and 30 June. The conference included
demonstrations, workshops and presentations
on geo-data collection with UAS-Lidar as well
as the processing and analysis of the acquired
point clouds. Various challenging case studies
were presented. The participants were also
provided with an update on what’s new and
what’s forthcoming at YellowScan.
YellowScanThe conference was kicked off by Pierre
d’Hauteville, head of sales and marketing at the
company. Next, Michel Assenbaum, president
of YellowScan and its mother company L’Avion
Jaune, highlighted the history of the company.
L’Avion Jaune was founded in 2005, with the
Mounting Lidar on an unmanned airborne vehicle (UAV) is called the next geospatial frontier but gradually the barriers are levelled. Scientists and Lidar and UAV adopters from surveying companies gathered at the second YellowScan User Conference in Montpellier, France, to discuss the future of this novel and promising geo-data acquisition technology. The diverse backgrounds of the over 80 attendees reflect the potential of equipping UAVs with Lidar sensors, resulting in what may be called UAS-Lidar.
aim of developing aerial high-end imaging
services in France. Having observed a market
for UAS geo-data acquisition technologies
Assenbaum together with Tristan Allouis,
both engineers holding a PhD degree, started
YellowScan in 2012. In 2013, a first prototype
of an airborne Lidar system mounted on a
UAS was tested resulting in the commercial
launch of the YellowScan Mapper in 2014 and
followed by the Surveyor UAS-Lidar system
in 2016. This was also the year in which the
first international user conference was held.
YellowScan aims at designing, developing and
producing unmanned airborne Lidar systems
for professionals across the world.
KeYnote and worKShopOmar-Pierre Soubra, director of marketing
communications for Trimble, delivered a
keynote entitled ‘The Future of Geospatial’,
bringing us from the history of Lidar, via self-
driving cars, data processing with artificial
intelligence to new infrastructures and the
hyperloop. The latter is a proposed solution for
transporting people and freight in a pod-like
vehicle propelled through a reduced-pressure
tube at airliner speed. He ended with looking
at geomatics companies that will survey the
planet Mars. A workshop by Arttu Soininen
of Terrasolid was one of the highlights. Mr
Soininen focused on the capabilities of
TerraScan for automatic classification of roof,
roof structures, walls, wall structures, trees,
vegetation, poles and cars. The underlying
method is based on grouping of points to
segments and objects through exploring the
local geometric structure. In this way adjacent
points lying on a planar surface are grouped as
Turning UAV and Lidar into Something Beautiful
YellowScan InternatIonal USer conference 2017
The conference was packed with presentations on geo-data collection with UAS-Lidar. The Château de Flaugergues added an extra dimension to the conference.
26-27_reportyellowscan.indd 26 25-07-17 16:44
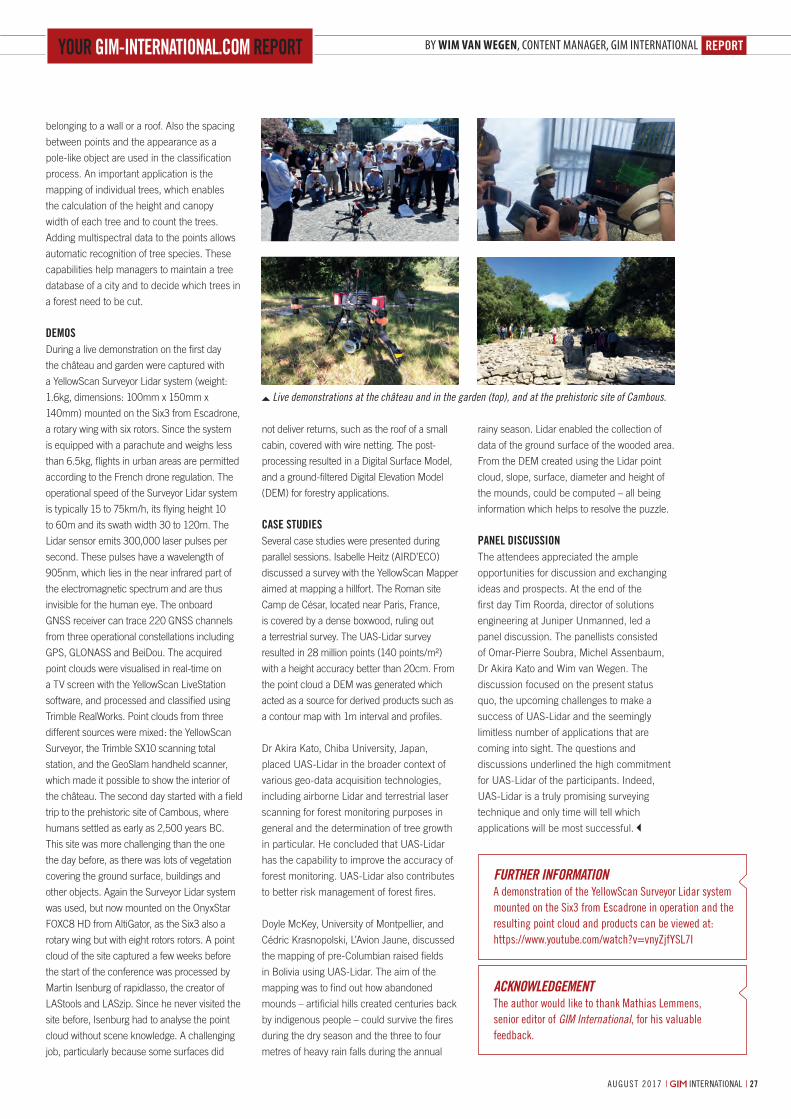
reportBy Wim van Wegen, content manager, gIm InternatIonalYoUr gim-international.com report
| international | august 2017 27august 2017 | international |
Turning UAV and Lidar into Something Beautiful
not deliver returns, such as the roof of a small
cabin, covered with wire netting. The post-
processing resulted in a Digital Surface Model,
and a ground-filtered Digital Elevation Model
(DEM) for forestry applications.
caSe StUdieSSeveral case studies were presented during
parallel sessions. Isabelle Heitz (AIRD’ECO)
discussed a survey with the YellowScan Mapper
aimed at mapping a hillfort. The Roman site
Camp de César, located near Paris, France,
is covered by a dense boxwood, ruling out
a terrestrial survey. The UAS-Lidar survey
resulted in 28 million points (140 points/m²)
with a height accuracy better than 20cm. From
the point cloud a DEM was generated which
acted as a source for derived products such as
a contour map with 1m interval and profiles.
Dr Akira Kato, Chiba University, Japan,
placed UAS-Lidar in the broader context of
various geo-data acquisition technologies,
including airborne Lidar and terrestrial laser
scanning for forest monitoring purposes in
general and the determination of tree growth
in particular. He concluded that UAS-Lidar
has the capability to improve the accuracy of
forest monitoring. UAS-Lidar also contributes
to better risk management of forest fires.
Doyle McKey, University of Montpellier, and
Cédric Krasnopolski, L’Avion Jaune, discussed
the mapping of pre-Columbian raised fields
in Bolivia using UAS-Lidar. The aim of the
mapping was to find out how abandoned
mounds – artificial hills created centuries back
by indigenous people – could survive the fires
during the dry season and the three to four
metres of heavy rain falls during the annual
rainy season. Lidar enabled the collection of
data of the ground surface of the wooded area.
From the DEM created using the Lidar point
cloud, slope, surface, diameter and height of
the mounds, could be computed – all being
information which helps to resolve the puzzle.
panel diScUSSionThe attendees appreciated the ample
opportunities for discussion and exchanging
ideas and prospects. At the end of the
first day Tim Roorda, director of solutions
engineering at Juniper Unmanned, led a
panel discussion. The panellists consisted
of Omar-Pierre Soubra, Michel Assenbaum,
Dr Akira Kato and Wim van Wegen. The
discussion focused on the present status
quo, the upcoming challenges to make a
success of UAS-Lidar and the seemingly
limitless number of applications that are
coming into sight. The questions and
discussions underlined the high commitment
for UAS-Lidar of the participants. Indeed,
UAS-Lidar is a truly promising surveying
technique and only time will tell which
applications will be most successful.
belonging to a wall or a roof. Also the spacing
between points and the appearance as a
pole-like object are used in the classification
process. An important application is the
mapping of individual trees, which enables
the calculation of the height and canopy
width of each tree and to count the trees.
Adding multispectral data to the points allows
automatic recognition of tree species. These
capabilities help managers to maintain a tree
database of a city and to decide which trees in
a forest need to be cut.
demoSDuring a live demonstration on the first day
the château and garden were captured with
a YellowScan Surveyor Lidar system (weight:
1.6kg, dimensions: 100mm x 150mm x
140mm) mounted on the Six3 from Escadrone,
a rotary wing with six rotors. Since the system
is equipped with a parachute and weighs less
than 6.5kg, flights in urban areas are permitted
according to the French drone regulation. The
operational speed of the Surveyor Lidar system
is typically 15 to 75km/h, its flying height 10
to 60m and its swath width 30 to 120m. The
Lidar sensor emits 300,000 laser pulses per
second. These pulses have a wavelength of
905nm, which lies in the near infrared part of
the electromagnetic spectrum and are thus
invisible for the human eye. The onboard
GNSS receiver can trace 220 GNSS channels
from three operational constellations including
GPS, GLONASS and BeiDou. The acquired
point clouds were visualised in real-time on
a TV screen with the YellowScan LiveStation
software, and processed and classified using
Trimble RealWorks. Point clouds from three
different sources were mixed: the YellowScan
Surveyor, the Trimble SX10 scanning total
station, and the GeoSlam handheld scanner,
which made it possible to show the interior of
the château. The second day started with a field
trip to the prehistoric site of Cambous, where
humans settled as early as 2,500 years BC.
This site was more challenging than the one
the day before, as there was lots of vegetation
covering the ground surface, buildings and
other objects. Again the Surveyor Lidar system
was used, but now mounted on the OnyxStar
FOXC8 HD from AltiGator, as the Six3 also a
rotary wing but with eight rotors rotors. A point
cloud of the site captured a few weeks before
the start of the conference was processed by
Martin Isenburg of rapidlasso, the creator of
LAStools and LASzip. Since he never visited the
site before, Isenburg had to analyse the point
cloud without scene knowledge. A challenging
job, particularly because some surfaces did
Live demonstrations at the château and in the garden (top), and at the prehistoric site of Cambous.
fUrther InformatIona demonstration of the Yellowscan surveyor lidar system mounted on the six3 from escadrone in operation and the resulting point cloud and products can be viewed at: https://www.youtube.com/watch?v=vnyZjfYsl7i
acknowledgementthe author would like to thank Mathias lemmens, senior editor of GIM International, for his valuable feedback.
26-27_reportyellowscan.indd 27 25-07-17 16:44

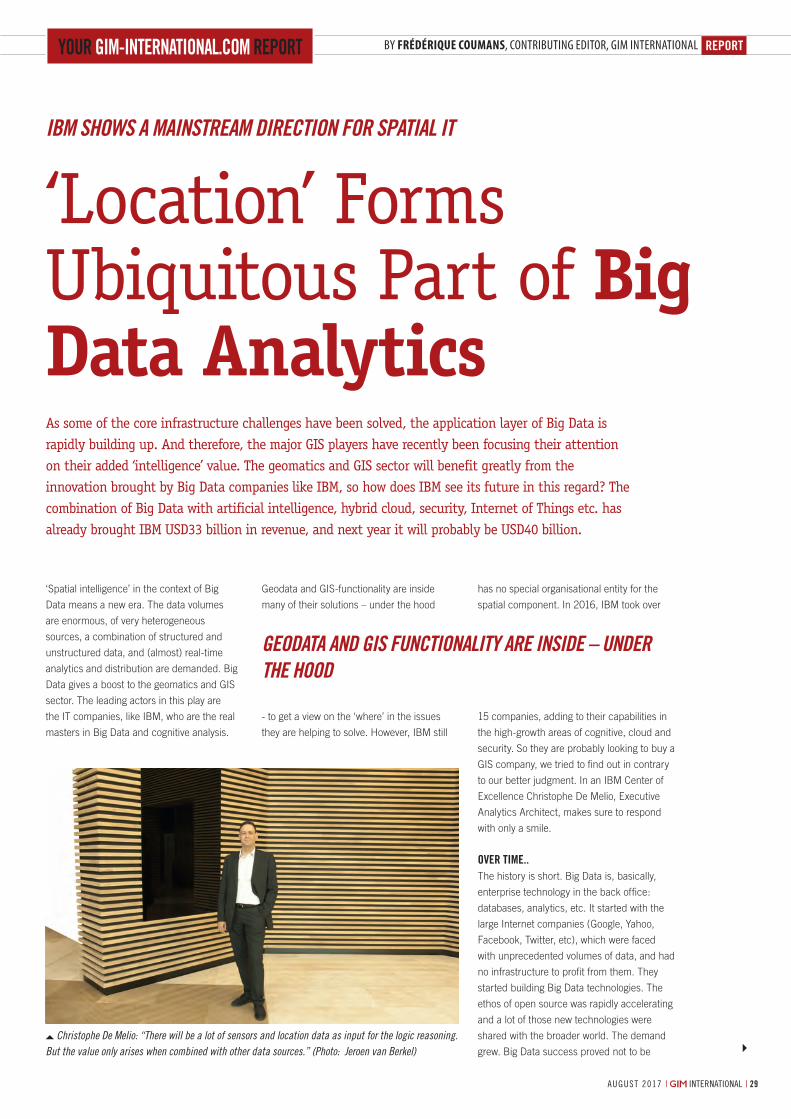
RepoRtBy Frédérique Coumans, contriButing editor, giM internationalYoUR gim-inteRnational.com RepoRt
29august 2017 | international |
As some of the core infrastructure challenges have been solved, the application layer of Big Data is rapidly building up. And therefore, the major GIS players have recently been focusing their attention on their added ‘intelligence’ value. The geomatics and GIS sector will benefit greatly from the innovation brought by Big Data companies like IBM, so how does IBM see its future in this regard? The combination of Big Data with artificial intelligence, hybrid cloud, security, Internet of Things etc. has already brought IBM USD33 billion in revenue, and next year it will probably be USD40 billion.
‘Location’ Forms Ubiquitous Part of Big Data Analytics
IBM ShowS a MaInStreaM DIrectIon for SpatIal It
Geodata and GIS-functionality are inside
many of their solutions – under the hood
- to get a view on the ‘where’ in the issues
they are helping to solve. However, IBM still
has no special organisational entity for the
spatial component. In 2016, IBM took over
15 companies, adding to their capabilities in
the high-growth areas of cognitive, cloud and
security. So they are probably looking to buy a
GIS company, we tried to find out in contrary
to our better judgment. In an IBM Center of
Excellence Christophe De Melio, Executive
Analytics Architect, makes sure to respond
with only a smile.
oveR time..The history is short. Big Data is, basically,
enterprise technology in the back office:
databases, analytics, etc. It started with the
large Internet companies (Google, Yahoo,
Facebook, Twitter, etc), which were faced
with unprecedented volumes of data, and had
no infrastructure to profit from them. They
started building Big Data technologies. The
ethos of open source was rapidly accelerating
and a lot of those new technologies were
shared with the broader world. The demand
grew. Big Data success proved not to be
‘Spatial intelligence’ in the context of Big
Data means a new era. The data volumes
are enormous, of very heterogeneous
sources, a combination of structured and
unstructured data, and (almost) real-time
analytics and distribution are demanded. Big
Data gives a boost to the geomatics and GIS
sector. The leading actors in this play are
the IT companies, like IBM, who are the real
masters in Big Data and cognitive analysis.
GeoData anD GIS functIonalIty are InSIDe – unDer the hooD
Christophe De Melio: “There will be a lot of sensors and location data as input for the logic reasoning. But the value only arises when combined with other data sources.” (Photo: Jeroen van Berkel)
29-30-31_reportcoumans.indd 29 25-07-17 16:47

august 2017 | international || international | a u g u s t 2017303030
about implementing one piece of technology,
but required the entire company to commit
to building a data-driven culture. Over time,
the more forward-thinking large companies
such as banks, crime-fighters, airlines and
Telcos, started experimentation with Big Data
technologies. A lot of the infrastructural work
has now been done, and the phase where
applications are deployed on top of the core
architecture is starting. The Big Data firms
offer more mature products, including the
tech giants - Amazon, Google and IBM in
particular. The trend in Big Data analytics
is the focus on Artificial Intelligence (AI)
to help analyse huge amounts of data and
derive predictive insights. The algorithms
behind deep learning can now be applied to
massive amounts of data cheaply and quickly.
Increasingly, machine intelligence is assisting
data scientists: just by crunching the data,
emerging products can extract mathematical
formulas or automatically build the data
science model that is most likely to yield the
best results. Big productivity gains are the
result, also from the real-time intelligence
capabilities. Many of those applications are
(partly) in the cloud; customers can leverage
Big Data without having to deploy underlying
Big Data technologies in their data centres.
“Within the new solutions, geodata and
geographic analyses are ubiquitous. Location
data are one of the most interesting data for
various industries”, says Christophe De Melio.
That makes that not only the GIS sector but
also the photogrammetry sector is heading
for new markets where data from diverse
image sources are used to identify changes
in scenes and patterns by cognitive systems.
Images, more and more from sensors from
the Internet of Things, drones and satellites
are now being evaluated in automated
processes with the utmost precision at near-
real-time speed.
WatsonIBM is now a global cloud platform and
cognitive solutions company, which has
continually evolved over the past century
to remain at the forefront of technological
innovation. Last year, USD6 billion went into
R&D and 8000 patents were granted. “The
mission is to help organisations unlock new
insights and usher in a new era of cognitive
business”, De Melio points out. Cognitive
computing or Artificial Intelligence represents
a new class of systems. Rather than being
explicitly programmed, they learn (to reason)
from their interactions with people and from
their experiences with their environment.
“Cognitive systems can make sense of the
80 percent of the world’s data that computer
scientists call unstructured, to provide more
context and details on the data and define
trends in a more automatic way.” Over
the last five years IBM invested heavily in
integration of (secure) cloud computing,
big data and cognitive analysis. Now these
contribute USD33 billion or 41 percent of
the annual revenue. It is expected to be USD
40 billion next year. The central stage is for
their Artificial Intelligence core engine called
Watson, trained for specific enterprise / sector
solutions. Watson is used in all the cloud
platforms that IBM offers. De Melio: “We
help clients to take advantage of our cloud
platforms with industry-focused use cases
and applications, using IBM but also other
components. The platforms are hybrid: you
can deploy modules on your own premises
in combination with your legacy applications,
mainframes, etc., and not everybody wants to
have all data in the cloud. The architecture is
set explicitly for data analytics and cognitive
capabilities.” The global IBM platforms
work on 50 IBM cloud data centres in 20
countries. The company is world market
leader in cloud computing.
aUgmented RealitY“An important difference with competitors
like Google and Amazon is that we do
not monetise the value of the data of our
customers, i.e the benefit of the analytics
is for them”, sketches Christophe De Melio.
This is an important IBM business ethic. Also
crucial for him is that the Watson cognitive
engine is defined as a help to users, not that
it takes over. “It augments the clients reality.
If you want, you can follow the reasoning, ask
Watson questions and it might respond with
additional questions for you.” An often used
dataset to augment the clients reality is about
weather. In 2016, IBM bought The Weather
Company, not only for their data, but also for
their high volume, high performing platform
for doing analysis. Vestas, Denmark, is
using these to define where to put windmills
on the sea. The oil and gas companies
use sea streams, iceberg-movements and
temperature to know where to place their
drilling platforms. The capital of Ireland,
Dublin, close to the sea, predicts traffic by
combining weather data and other data on
the IBM smart city platform. The sources
are not only data about weather and tides,
but also data from cars, traffic lights and the
municipal wastewater systems. They know
now where the sewer system would react less
not only the GIS Sector But alSo the photoGraMMetry Sector IS heaDInG for new MarketS
The new Watson IoT Global Headquarters in Munich. It represents IBM’s largest investment in Europe in more than two decades.
29-30-31_reportcoumans.indd 30 25-07-17 16:47

RepoRt
august 2017 | international || international | a u g u s t 2017 31
Location data are everywhere, certainly in smart city solutions. But GIS companies will have a hard job keeping themselves visible to end-users.
IBM haS no SpecIal orGanISatIonal entIty for the SpatIal coMponent
well when more rain is forecasted while the
tide is high (so the rainwater is not pumped
easily into the sea). Traffic could then be
hindered. They combine that with events
happening in the city such as a football match
and with knowledge about the way people
behave then. All this is transformed into alert
messages to the citizens.
Esri is inside the Weather platform that
IBM took over. Esri communicates: “The
Weather Company integrated Esri basemaps,
demographic and business data, and deep
proximity analytic tools to provide powerful
location-based insights that spur cognitive
thinking and event-specific action.” Esri
ArcGIS is integrated with many Watson
platforms providing location analytics
functionality, proximity search tools, and
map visualisation as well as integration of
clients’ spatial data. It is used, for example,
to support link analysis, fraud detection, and
identity determination for government public-
safety agencies as well as banking, insurance,
and retail organisations. In addition to being
in cognitive computing platforms, Esri is
also in IBM business intelligence & reporting
products like Cognos – as are others. Since
last year, World Boundaries Data from Pitney
Bowes are embedded directly in Cognos
and Watson. They are used to examine
the financial services of various branches,
for example, and to frame a list of under-
performing ones to enable ATM locators at
such places. The global spatial data provider
looks ahead: ”It is the first step for a deeper
analytics partnership with IBM.”
inteRnet of things The new investment zone is the combination
of Artificial Intelligence and the Internet
of Things (IoT). “IoT analytics will have a
lot of value in the same areas where GIS
companies are playing”, confirms De Melio,
such as supply-chain optimalisation, energy
optimisation in smart grids, location-based
commercial services and precision farming.
There are more than 9 billion connected
devices operating in the world today,
generating 2.5 quintillion bytes of new data
daily. Making sense of data embedded in
intelligent devices, in real-time, is creating
a significant market opportunity that is
expected to reach USD1.7 trillion by 2020.
IBM opened the global headquarters for
its new Watson IoT unit, as well as its first
European Watson Innovation Center in
Munich, Germany in December 2015. Now
1,500 people focus on this exploding stream
of information and build new solutions at the
intersection of cognitive computing and the
IoT. “An issue with IoT devices is that they
function in very decentralised infrastructures
while the need for local analytics and local
decisions is important”, which he sees as a
challenge. “So we have to put ‘the analytics
on the edge’. That means that as much
context information and logic has to be put
as close as possible to the IoT devise to make
the wanted big data analysis on the spot.”
He gives an example of a large retail client
who uses IoT data from the clothes tags,
social media data, location data, but also
behavioural data and others for his in-store
marketing. ”A girl is testing her new outfit.
She sends a text message from the fitting
room to her mother to ask if she could buy
it. The mother goes online to see if the shop
gives a discount. There is no discount, so
she says no to her daughter. The girl leaves,
but as she passes the cash desk she is
offered a push message on her cellphone
with a discount offer. To give one more
example, now from the smart city and energy
platforms: IoT / Watson / cloud combinations
monitor the energy balance of individual
buildings, and can regulate lighting, shading,
electricity storage and distribution depending
on the position of one building or part of a
building amidst others. “There will be a lot
of sensors and location data as input for the
logic reasoning. But the value only arises if
you combine them very fast with other data
sources – at best in our cognitive platforms.”
Which we, of course, answer only with a
smile.
29-30-31_reportcoumans.indd 31 25-07-17 16:47
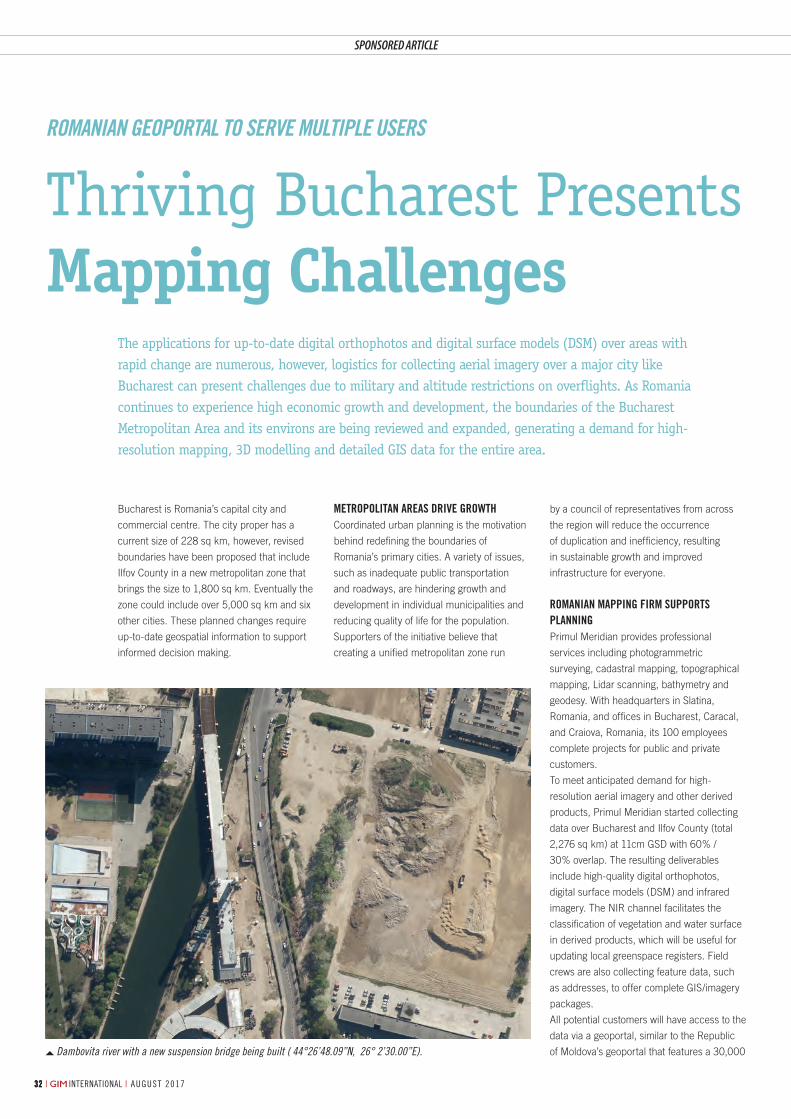
| international | august 20173232 august 2017 | international |32
By Vicentiu eftimie, Primul meridian, romania
Dambovita river with a new suspension bridge being built ( 44°26’48.09”N, 26° 2’30.00”E).
Bucharest is Romania’s capital city and
commercial centre. The city proper has a
current size of 228 sq km, however, revised
boundaries have been proposed that include
Ilfov County in a new metropolitan zone that
brings the size to 1,800 sq km. Eventually the
zone could include over 5,000 sq km and six
other cities. These planned changes require
up-to-date geospatial information to support
informed decision making.
The applications for up-to-date digital orthophotos and digital surface models (DSM) over areas with rapid change are numerous, however, logistics for collecting aerial imagery over a major city like Bucharest can present challenges due to military and altitude restrictions on overflights. As Romania continues to experience high economic growth and development, the boundaries of the Bucharest Metropolitan Area and its environs are being reviewed and expanded, generating a demand for high-resolution mapping, 3D modelling and detailed GIS data for the entire area.
Metropolitan areas Drive GrowthCoordinated urban planning is the motivation
behind redefining the boundaries of
Romania’s primary cities. A variety of issues,
such as inadequate public transportation
and roadways, are hindering growth and
development in individual municipalities and
reducing quality of life for the population.
Supporters of the initiative believe that
creating a unified metropolitan zone run
by a council of representatives from across
the region will reduce the occurrence
of duplication and inefficiency, resulting
in sustainable growth and improved
infrastructure for everyone.
roManian MappinG FirM supports planninGPrimul Meridian provides professional
services including photogrammetric
surveying, cadastral mapping, topographical
mapping, Lidar scanning, bathymetry and
geodesy. With headquarters in Slatina,
Romania, and offices in Bucharest, Caracal,
and Craiova, Romania, its 100 employees
complete projects for public and private
customers.
To meet anticipated demand for high-
resolution aerial imagery and other derived
products, Primul Meridian started collecting
data over Bucharest and Ilfov County (total
2,276 sq km) at 11cm GSD with 60% /
30% overlap. The resulting deliverables
include high-quality digital orthophotos,
digital surface models (DSM) and infrared
imagery. The NIR channel facilitates the
classification of vegetation and water surface
in derived products, which will be useful for
updating local greenspace registers. Field
crews are also collecting feature data, such
as addresses, to offer complete GIS/imagery
packages.
All potential customers will have access to the
data via a geoportal, similar to the Republic
of Moldova’s geoportal that features a 30,000
Thriving Bucharest Presents Mapping Challenges
Romanian GeopoRtal to SeRve multiple uSeRS
SponSored article
32-33_articlevexcel.indd 32 25-07-17 14:51
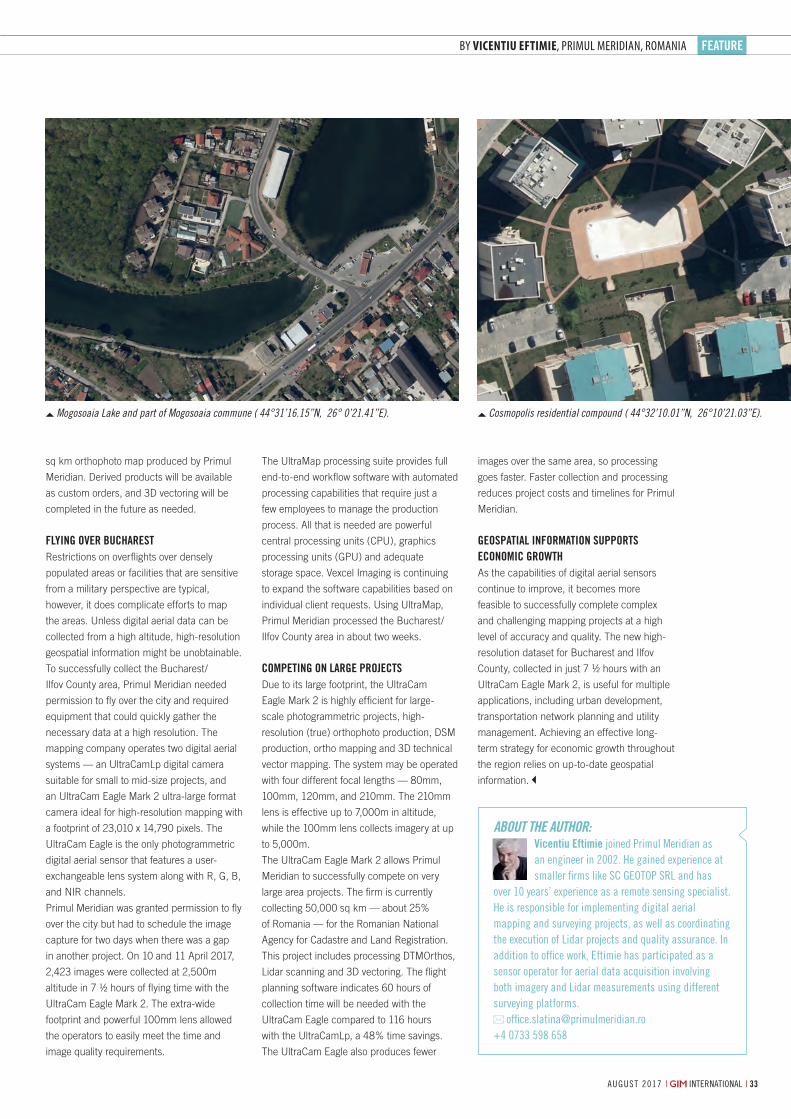
feature
33| international | august 2017 august 2017 | international |
By Vicentiu eftimie, Primul meridian, romania
Mogosoaia Lake and part of Mogosoaia commune ( 44°31’16.15”N, 26° 0’21.41”E). Cosmopolis residential compound ( 44°32’10.01”N, 26°10’21.03”E).
Thriving Bucharest Presents Mapping Challenges
The UltraMap processing suite provides full
end-to-end workflow software with automated
processing capabilities that require just a
few employees to manage the production
process. All that is needed are powerful
central processing units (CPU), graphics
processing units (GPU) and adequate
storage space. Vexcel Imaging is continuing
to expand the software capabilities based on
individual client requests. Using UltraMap,
Primul Meridian processed the Bucharest/
Ilfov County area in about two weeks.
CoMpetinG on larGe projeCtsDue to its large footprint, the UltraCam
Eagle Mark 2 is highly efficient for large-
scale photogrammetric projects, high-
resolution (true) orthophoto production, DSM
production, ortho mapping and 3D technical
vector mapping. The system may be operated
with four different focal lengths — 80mm,
100mm, 120mm, and 210mm. The 210mm
lens is effective up to 7,000m in altitude,
while the 100mm lens collects imagery at up
to 5,000m.
The UltraCam Eagle Mark 2 allows Primul
Meridian to successfully compete on very
large area projects. The firm is currently
collecting 50,000 sq km — about 25%
of Romania — for the Romanian National
Agency for Cadastre and Land Registration.
This project includes processing DTMOrthos,
Lidar scanning and 3D vectoring. The flight
planning software indicates 60 hours of
collection time will be needed with the
UltraCam Eagle compared to 116 hours
with the UltraCamLp, a 48% time savings.
The UltraCam Eagle also produces fewer
images over the same area, so processing
goes faster. Faster collection and processing
reduces project costs and timelines for Primul
Meridian.
Geospatial inForMation supports eConoMiC GrowthAs the capabilities of digital aerial sensors
continue to improve, it becomes more
feasible to successfully complete complex
and challenging mapping projects at a high
level of accuracy and quality. The new high-
resolution dataset for Bucharest and Ilfov
County, collected in just 7 ½ hours with an
UltraCam Eagle Mark 2, is useful for multiple
applications, including urban development,
transportation network planning and utility
management. Achieving an effective long-
term strategy for economic growth throughout
the region relies on up-to-date geospatial
information.
sq km orthophoto map produced by Primul
Meridian. Derived products will be available
as custom orders, and 3D vectoring will be
completed in the future as needed.
FlyinG over BuCharestRestrictions on overflights over densely
populated areas or facilities that are sensitive
from a military perspective are typical,
however, it does complicate efforts to map
the areas. Unless digital aerial data can be
collected from a high altitude, high-resolution
geospatial information might be unobtainable.
To successfully collect the Bucharest/
Ilfov County area, Primul Meridian needed
permission to fly over the city and required
equipment that could quickly gather the
necessary data at a high resolution. The
mapping company operates two digital aerial
systems — an UltraCamLp digital camera
suitable for small to mid-size projects, and
an UltraCam Eagle Mark 2 ultra-large format
camera ideal for high-resolution mapping with
a footprint of 23,010 x 14,790 pixels. The
UltraCam Eagle is the only photogrammetric
digital aerial sensor that features a user-
exchangeable lens system along with R, G, B,
and NIR channels.
Primul Meridian was granted permission to fly
over the city but had to schedule the image
capture for two days when there was a gap
in another project. On 10 and 11 April 2017,
2,423 images were collected at 2,500m
altitude in 7 ½ hours of flying time with the
UltraCam Eagle Mark 2. The extra-wide
footprint and powerful 100mm lens allowed
the operators to easily meet the time and
image quality requirements.
aBout tHe autHoR:vicentiu eftimie joined Primul Meridian as an engineer in 2002. He gained experience at smaller firms like sC geotoP srl and has
over 10 years’ experience as a remote sensing specialist. He is responsible for implementing digital aerial mapping and surveying projects, as well as coordinating the execution of lidar projects and quality assurance. in addition to office work, eftimie has participated as a sensor operator for aerial data acquisition involving both imagery and lidar measurements using different surveying platforms.
[email protected]+4 0733 598 658
32-33_articlevexcel.indd 33 25-07-17 14:51

august 2017 | international || international | august 2017343434
By Galina Slavova, NEWBIM, DENMark
Figure 1, Point cloud of the former cemetery and the existing building (Autodesk ReCap Pro).
Effective planning, coordination and sharing
of expert knowledge and relevant project
information are essential to architects,
engineers and contractors in any type of
construction project and at any stage of the
The high demand for energy-efficiency of buildings nowadays has triggered the need for gathering documentation on existing construction conditions. This information is then used to design buildings with high consideration to the site or to allow the renovation of old buildings that can no longer meet the requirements for energy performance or comfortable living. The documentation required for this type of situation is often outdated or missing, and to create an optimal design the existing conditions need to be registered and analysed using advanced technological methods, such as Building Information Modelling (BIM) and 3D laser scanning.
project life cycle. Sustainability and energy-
efficiency, on the other hand, are demands
that can no longer be met using traditional
architectural design methodologies. Thus,
BIM and 3D laser scanning together
play an important role in the creation of
reliable models of existing conditions for
further development of projects; intelligent
parametric building models that can be used
to perform various types of simulations early
in the design process and ensure compliance
with energy demands and other regulations,
and are a strong platform for communication
with the rest of the project team.
Copenhagen CaseOn the main shopping street in Copenhagen
(Denmark) a construction site has been
hidden behind plastic covers for about 10
years. At the location of the cemetery of the
oldest church in Copenhagen, Saint Clements
Church (built in 1192), in a building dating
back to more than 400 years ago, the first
Shawarma restaurant and the famous disco
Absalon opened its doors. When this building
was demolished in 2008 to make room for
a new one, construction workers started
digging into the basement of the former disco
and came across hundreds of skeletons of
children from the Middle Ages. This was
followed by archaeologists investigating the
place and due to the financial crisis, no new
construction processes have been initiated
since.
Now, a new commercial building is to be built
at the location of the former cemetery, while
the existing construction will be renovated
and converted into an office building by Zeso
Architects – a renowned Danish architectural
Scan-to-BIM in the Pre-design Phase
3D Laser scanning anD MoDeLLing of existing conDitions
34-35-37_featureslavova.indd 34 25-07-17 14:52
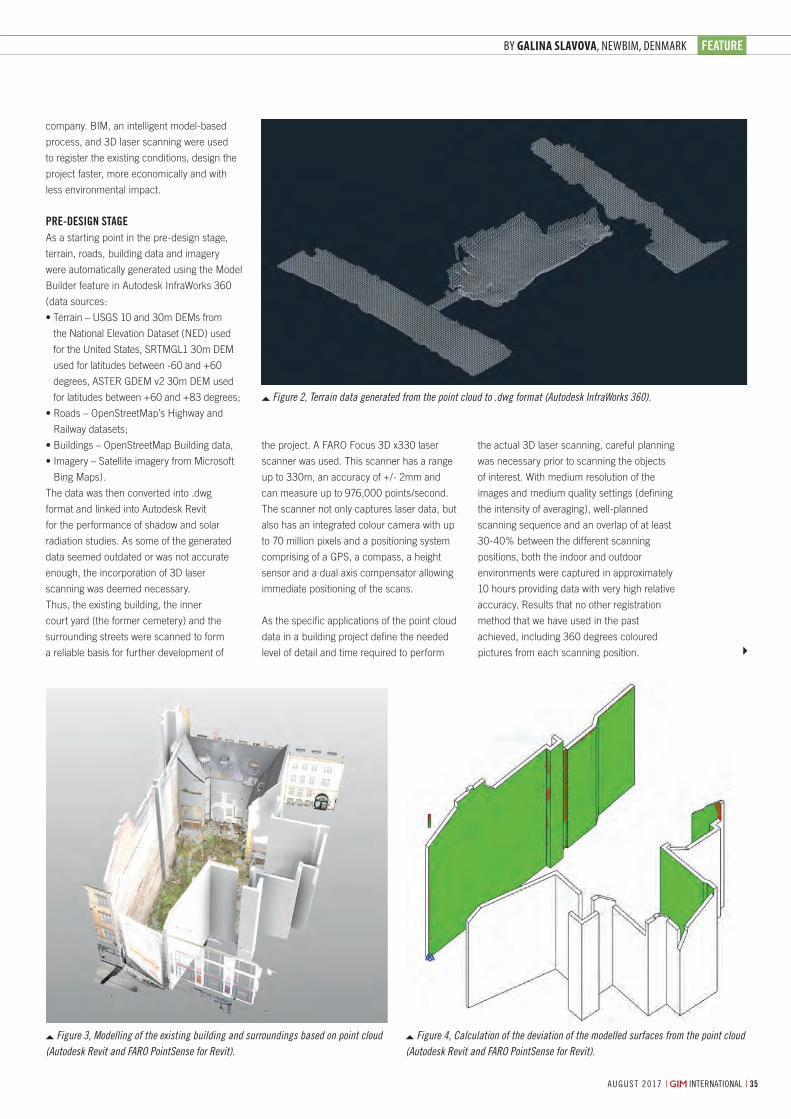
feature
august 2017 | international | 35| international | august 2017
By Galina Slavova, NEWBIM, DENMark
Figure 2, Terrain data generated from the point cloud to .dwg format (Autodesk InfraWorks 360).
Figure 3, Modelling of the existing building and surroundings based on point cloud (Autodesk Revit and FARO PointSense for Revit).
Figure 4, Calculation of the deviation of the modelled surfaces from the point cloud (Autodesk Revit and FARO PointSense for Revit).
the project. A FARO Focus 3D x330 laser
scanner was used. This scanner has a range
up to 330m, an accuracy of +/- 2mm and
can measure up to 976,000 points/second.
The scanner not only captures laser data, but
also has an integrated colour camera with up
to 70 million pixels and a positioning system
comprising of a GPS, a compass, a height
sensor and a dual axis compensator allowing
immediate positioning of the scans.
As the specific applications of the point cloud
data in a building project define the needed
level of detail and time required to perform
the actual 3D laser scanning, careful planning
was necessary prior to scanning the objects
of interest. With medium resolution of the
images and medium quality settings (defining
the intensity of averaging), well-planned
scanning sequence and an overlap of at least
30-40% between the different scanning
positions, both the indoor and outdoor
environments were captured in approximately
10 hours providing data with very high relative
accuracy. Results that no other registration
method that we have used in the past
achieved, including 360 degrees coloured
pictures from each scanning position.
company. BIM, an intelligent model-based
process, and 3D laser scanning were used
to register the existing conditions, design the
project faster, more economically and with
less environmental impact.
pre-design stageAs a starting point in the pre-design stage,
terrain, roads, building data and imagery
were automatically generated using the Model
Builder feature in Autodesk InfraWorks 360
(data sources:
• Terrain – USGS 10 and 30m DEMs from
the National Elevation Dataset (NED) used
for the United States, SRTMGL1 30m DEM
used for latitudes between -60 and +60
degrees, ASTER GDEM v2 30m DEM used
for latitudes between +60 and +83 degrees;
• Roads – OpenStreetMap’s Highway and
Railway datasets;
• Buildings – OpenStreetMap Building data,
• Imagery – Satellite imagery from Microsoft
Bing Maps).
The data was then converted into .dwg
format and linked into Autodesk Revit
for the performance of shadow and solar
radiation studies. As some of the generated
data seemed outdated or was not accurate
enough, the incorporation of 3D laser
scanning was deemed necessary.
Thus, the existing building, the inner
court yard (the former cemetery) and the
surrounding streets were scanned to form
a reliable basis for further development of
34-35-37_featureslavova.indd 35 25-07-17 14:52

www.lidarusa.com
www.lidarusa.com256-274-1616
Upload your LAS or LAZ - Supports ANY vendor - FIRST MONTH FREE - Share with anybody, maintain control, restrict accessTake measurements - Scalable Solutions - Works with any PointCloud (LiDAR or image derived)
myPointClouds.compowered by LiDARUSA
SNOOPY
H 2O
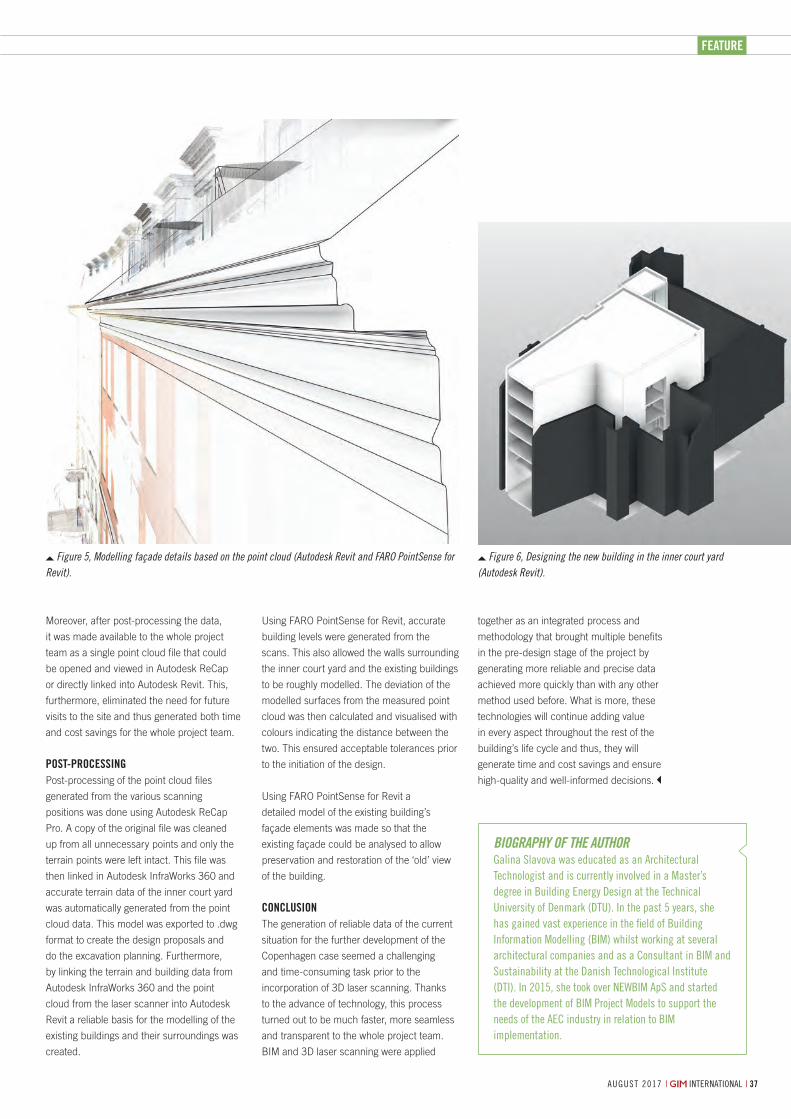
feature
august 2017 | international | 37
Moreover, after post-processing the data,
it was made available to the whole project
team as a single point cloud file that could
be opened and viewed in Autodesk ReCap
or directly linked into Autodesk Revit. This,
furthermore, eliminated the need for future
visits to the site and thus generated both time
and cost savings for the whole project team.
Post-ProcessingPost-processing of the point cloud files
generated from the various scanning
positions was done using Autodesk ReCap
Pro. A copy of the original file was cleaned
up from all unnecessary points and only the
terrain points were left intact. This file was
then linked in Autodesk InfraWorks 360 and
accurate terrain data of the inner court yard
was automatically generated from the point
cloud data. This model was exported to .dwg
format to create the design proposals and
do the excavation planning. Furthermore,
by linking the terrain and building data from
Autodesk InfraWorks 360 and the point
cloud from the laser scanner into Autodesk
Revit a reliable basis for the modelling of the
existing buildings and their surroundings was
created.
Using FARO PointSense for Revit, accurate
building levels were generated from the
scans. This also allowed the walls surrounding
the inner court yard and the existing buildings
to be roughly modelled. The deviation of the
modelled surfaces from the measured point
cloud was then calculated and visualised with
colours indicating the distance between the
two. This ensured acceptable tolerances prior
to the initiation of the design.
Using FARO PointSense for Revit a
detailed model of the existing building’s
façade elements was made so that the
existing façade could be analysed to allow
preservation and restoration of the ‘old’ view
of the building.
conclusionThe generation of reliable data of the current
situation for the further development of the
Copenhagen case seemed a challenging
and time-consuming task prior to the
incorporation of 3D laser scanning. Thanks
to the advance of technology, this process
turned out to be much faster, more seamless
and transparent to the whole project team.
BIM and 3D laser scanning were applied
together as an integrated process and
methodology that brought multiple benefits
in the pre-design stage of the project by
generating more reliable and precise data
achieved more quickly than with any other
method used before. What is more, these
technologies will continue adding value
in every aspect throughout the rest of the
building’s life cycle and thus, they will
generate time and cost savings and ensure
high-quality and well-informed decisions.
Biography of the authorgalina slavova was educated as an architectural technologist and is currently involved in a Master’s degree in Building energy Design at the technical university of Denmark (Dtu). in the past 5 years, she has gained vast experience in the field of Building information Modelling (BiM) whilst working at several architectural companies and as a Consultant in BiM and sustainability at the Danish technological institute (Dti). in 2015, she took over neWBiM aps and started the development of BiM Project Models to support the needs of the aeC industry in relation to BiM implementation.
Figure 5, Modelling façade details based on the point cloud (Autodesk Revit and FARO PointSense for Revit).
Figure 6, Designing the new building in the inner court yard (Autodesk Revit).
34-35-37_featureslavova.indd 37 25-07-17 14:52
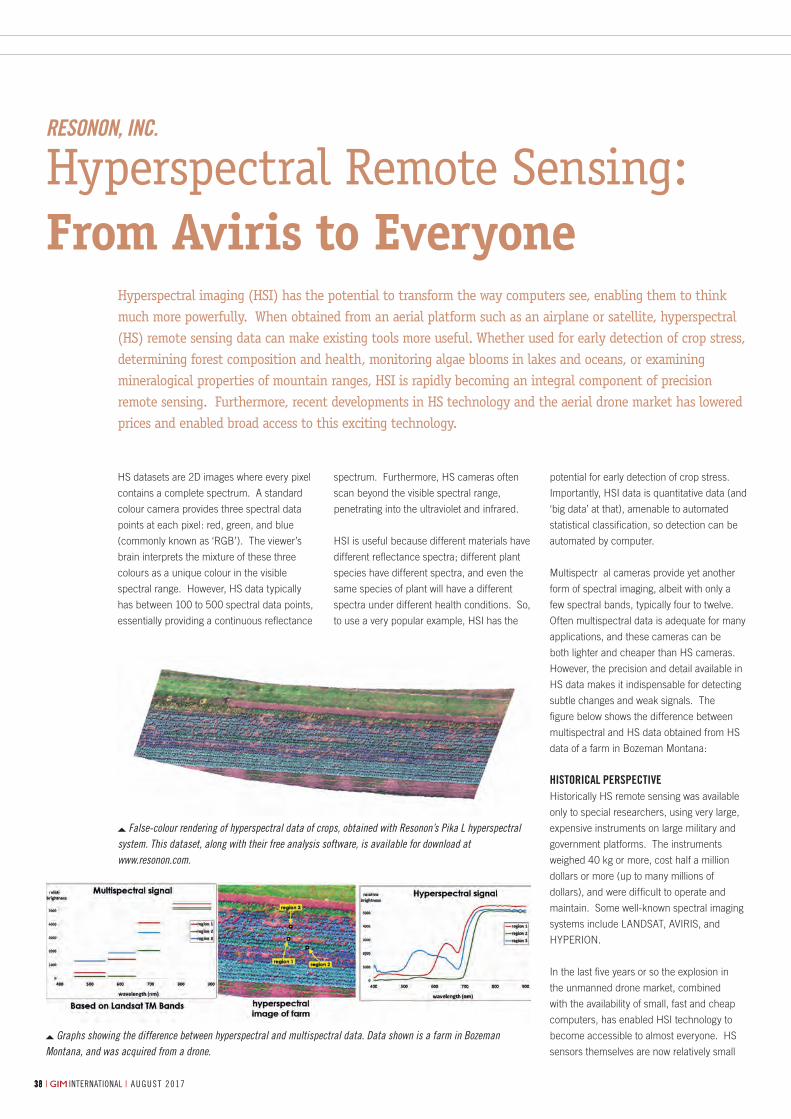
AUGUST 2017 | INTERNATIONAL || INTERNATIONAL | AUGUST 2017383838
BY ADAM STERN, SENIOR SCIENTIST, RESONON
Hyperspectral imaging (HSI) has the potential to transform the way computers see, enabling them to think much more powerfully. When obtained from an aerial platform such as an airplane or satellite, hyperspectral (HS) remote sensing data can make existing tools more useful. Whether used for early detection of crop stress, determining forest composition and health, monitoring algae blooms in lakes and oceans, or examining mineralogical properties of mountain ranges, HSI is rapidly becoming an integral component of precision remote sensing. Furthermore, recent developments in HS technology and the aerial drone market has lowered prices and enabled broad access to this exciting technology.
HS datasets are 2D images where every pixel
contains a complete spectrum. A standard
colour camera provides three spectral data
points at each pixel: red, green, and blue
(commonly known as ‘RGB’). The viewer’s
brain interprets the mixture of these three
colours as a unique colour in the visible
spectral range. However, HS data typically
has between 100 to 500 spectral data points,
essentially providing a continuous refl ectance
Hyperspectral Remote Sensing: From Aviris to Everyone
RESONON, INC.
potential for early detection of crop stress.
Importantly, HSI data is quantitative data (and
‘big data’ at that), amenable to automated
statistical classifi cation, so detection can be
automated by computer.
Multispectr al cameras provide yet another
form of spectral imaging, albeit with only a
few spectral bands, typically four to twelve.
Often multispectral data is adequate for many
applications, and these cameras can be
both lighter and cheaper than HS cameras.
However, the precision and detail available in
HS data makes it indispensable for detecting
subtle changes and weak signals. The
fi gure below shows the difference between
multispectral and HS data obtained from HS
data of a farm in Bozeman Montana:
HISTORICAL PERSPECTIVEHistorically HS remote sensing was available
only to special researchers, using very large,
expensive instruments on large military and
government platforms. The instruments
weighed 40 kg or more, cost half a million
dollars or more (up to many millions of
dollars), and were diffi cult to operate and
maintain. Some well-known spectral imaging
systems include LANDSAT, AVIRIS, and
HYPERION.
In the last fi ve years or so the explosion in
the unmanned drone market, combined
with the availability of small, fast and cheap
computers, has enabled HSI technology to
become accessible to almost everyone. HS
sensors themselves are now relatively small
spectrum. Furthermore, HS cameras often
scan beyond the visible spectral range,
penetrating into the ultraviolet and infrared.
HSI is useful because different materials have
different refl ectance spectra; different plant
species have different spectra, and even the
same species of plant will have a different
spectra under different health conditions. So,
to use a very popular example, HSI has the
False-colour rendering of hyperspectral data of crops, obtained with Resonon’s Pika L hyperspectral system. This dataset, along with their free analysis software, is available for download at www.resonon.com.
Graphs showing the difference between hyperspectral and multispectral data. Data shown is a farm in Bozeman Montana, and was acquired from a drone.
38-39_company39;sview.indd 38 25-07-17 14:52

COMPANY’S VIEW
AUGUST 2017 | INTERNATIONAL | 39| INTERNATIONAL | AUGUST 2017
BY ADAM STERN, SENIOR SCIENTIST, RESONON
Hyperspectral Remote Sensing: From Aviris to Everyone
(< 1kg) and inexpensive (USD10-20k), and
there are quite a few commercial packages
specifi cally designed for drones. For
example, the entire system we manufacture
at Resonon weighs 1.6kg and costs less than
USD35,000. Assuming the price of a high-
quality multicopter is about USD20-USD30k
(with gimbal and controller), a researcher or
consultant can acquire HS remote sensing
data for under USD70k, which fi ts many
research and development budgets.
BUSINESS ENVIRONMENTNot only is producing HS cameras a strong
technical challenge, but incorporating the
camera into a complete autonomous remote
sensing system is a strong business challenge.
In the case of our airborne system, a small
computer fl ies with the system and operates
the imager, GPS/IMU, and point spectrometer
that measures solar illumination. After fl ight,
the raw data is geocorrected for the GPS/IMU
and solar information, and the fi nal output
is georegistered HS data. Integrating the
components into a user-friendly tool requires
specialised knowledge of spectral imaging and
remote sensing, lots of software development,
and familiarity with customer needs.
The importance of agriculture and
environmental monitoring is driving strong
demand for HSI across the world, particularly
in Asia. These topics address persistent critical
global issues and the use of HS data to solve
these problems is expected to grow. Additional
HSI applications include animal science, food
science, plant science and geology. This
More informationResonon, Inc.Bozeman, MT 59047 USA+1 (406) 586-3356 [email protected]
growing demand is fueling an increase in the
number of companies supplying HS equipment
along with advances in HS technology itself.
FUTURE CHALLENGESHowever, despite a vast array of scientifi c studies
showing potential benefi ts, HS remote sensing
is still largely a research topic, and the analytical
techniques required to transform this technology
to commercially viable products remain to be
developed. To revisit the example of precision
agriculture, while there is much published
research correlating HS signals to specifi c crop
stresses, it is currently unclear how to deploy HS
cameras on commercial tractors and sprayers.
The hope is that HSI will eventually lead to
precise and location-specifi c applications of
pesticides, herbicides and fertilisers. These tools
will likely be available to commercial farmers
in the next fi ve to ten years, but at this time it
remains an outstanding problem.
COMPANY PROFILEFounded in 2002, Resonon, Inc. is a high-
tech optics company located in Bozeman
Montana and specialising in HSI systems.
Over the last four years we have transitioned
from a grant-based research company to a
market-driven enterprise supplying products
to customers worldwide.
Resonon is a vertically integrated company,
including optical design, engineering,
machining and software development
capabilities, currently employing 13
individuals. We design, manufacture and
integrate the HS systems entirely in our own
facility. Our strengths are high-precision
user-friendly products, affordable pricing and
excellent customer support.
“We have designed our systems for users that
wants to focus on their research – they do not
have to be experts in HS imaging or remote
sensing,” says Rand Swanson, president
of Resonon. “Because they are turnkey
systems, the user can literally pull it out of the
box and begin collecting data right away.”
“Research funds are diffi cult to come by, and
researchers do not have any money to waste,
so our customers are very price-sensitive,”
continues Swanson. “We at Resonon have
worked diligently to keep costs down so
our sensor packages can be available to
everyone.”
Every month GIM International invites a company to introduce itself in these pages. The resulting article, entitled Company’s View, is subject to the usual copy editing procedures, but the publisher takes no responsibility for the content and the views expressed are not necessarily those of the magazine.
Resonon’s Pika L hyperspectral system, ready for mounting in a UAV.
Resonon’s Pika L hyperspectral system, ready for mounting in a UAV.
38-39_company39;sview.indd 39 25-07-17 14:52

OrganisatiOns
| international | a u g u s t 2017404040 august 2017 | international |
Volunteer Community Surveyor Programme
Arctic Spatial Data Pilot
More informationwww.fig.net
Together with Global Land Tool Network
(GLTN), the FIG Young Surveyors Network
(FIG YSN) established a competence based
volunteer programme for young surveyors
also known as Volunteer Community Surveyor
Programme (VCSP). VCSP is an innovative
volunteer programme that intends to be a
powerful driver for both social impact and
professional development. The VCSP
leverages on the skills, experience, talents
and education of young surveyors, matches
this competence with
the needs of GLTN,
particularly in GLTN’s
county level
implementation plans
and programmes.
VCSP represents
opportunities for
young surveyors to
touch a particular cause, or bring surveying
skills and knowledge to contribute and impact
communities through one’s volunteered
capacity. VCSP is about matching the right
person with the right skills and knowledge, at
the right time, to the right opportunity through
GLTN with the overriding aim to achieve
greater impact.
The VCSP is inspired by the conviction that
volunteerism is a powerful means of engaging
people in tackling development challenges
worldwide. Every young surveyor can be a VCS
by contributing their time, skills and knowledge
through volunteerism, and their combined
efforts can be a significant force for achieving
development on the ground. The young
surveyor will be challenged to transfer useful
knowledge and contribute at the community
level while gaining a greater understanding of
the issues affecting these communities that are
often marginalised and vulnerable.
The Volunteer Community Surveyor
Programme is a pilot programme. It is a
small-scale, short-term pilot that helps GLTN/
UN-Habitat and FIG YSN to learn how a
large-scale programme might work in
practice. It provides a platform for all
stakeholders to test logistics, prove value and
reveal benefits. “
Eva-Maria Unger, Chair Young Surveyors
Network
Natural Resources Canada (NRCan) and the
United States Geological Survey (USGS)
co-sponsored a recently completed Arctic
Spatial Data Pilot, executed by the Open
Geospatial Consortium (OGC). The objective
of the Pilot was to show how geospatial data
can be used as a tool for making more
informed decisions and providing more
efficient administration of the Arctic region.
The Pilot tested interoperability of standards,
increased access to Arctic data, and
demonstrated the diverse, rich and valuable
potential of providing geospatial data using
standards.
The idea behind the Arctic Spatial Data
Infrastructure (Arctic SDI) is to bring together
data and information – the most authoritative
information available – to aid in our
understanding of what is happening in the
Arctic environment and to allow smart
decisions to be made as a result. The Arctic
SDI is an invaluable opportunity to bring
together geospatial experts and scientists in a
voluntary cooperation between the eight
national mapping agencies of the Arctic
countries (Canada, Denmark, Finland,
Iceland, Norway, Russia, Sweden, and the
United States) in direct support of the
priorities of the Arctic Council and other
important stakeholders.
GSDI commends both NRCan and USGS for
providing financial resources to influence and
support international geospatial initiatives and
the formation of compatible spatial data
infrastructures. The Arctic Spatial Data Pilot
had a North American focus, yet is scalable to
the circumpolar community. The Arctic region
is of increasing interest to the whole world as a
result of its linkage to global climate systems,
opportunities for economic development,
geo-political strategic importance, and its
environmental importance as homes to
indigenous populations and other residents
and sensitive ecosystems. To be successful,
the Arctic Spatial Data Pilot took particular
requirements into account, including
responding to priorities of Northerners and
Aboriginal Communities, working in zero/low
bandwidth regions, and considering the
realities of frontier economies.
The final demonstration of the Arctic Spatial
Data Pilot, held in March 2017, showcased
data intensive scenarios including sea ice
evolution, caribou migration analysis, effects
of new shipping routes, food security and
landslide susceptibility mapping. Videos and
the Final Engineering Report, which will be
evaluated by Arctic SDI to inform ongoing
strategic priorities, can be found online.
More informationwww.gsdiassociation.org www.opengeospatial.org/pub/arcticsDP/index.htmlhttps://arctic-sdi.org
40-41-42_organisations.indd 40 25-07-17 14:53

| international | a u g u s t 2017
OrganisatiOns
41august 2017 | international |
The Onsala Twin Telescopes
National Societies and Worldwide Experiences
The Onsala Space Observatory, Chalmers
University of Technology, and the International
VLBI Service for Geodesy and Astrometry (IVS)
are proud to announce the inauguration of a
new pair of twin telescopes for geodetic and
astrometric VLBI. More than 200 international
and national guests, including veterans of the
first transatlantic VLBI observations in 1968,
as well as the regional governors and
representatives of Chalmers, participated in
the inauguration ceremony on 18 May 2017.
The two new telescopes have dishes of 13.2m
diameter, and follow the design specifications
for the VLBI Global Observing System – the
next generation geodetic VLBI network with
ultra-fast telescopes and wide bandwidth
recording. The telescopes will allow continuous
observations by at least one of them, but will
also permit exploitation of innovative observing
scenarios with other stations, so offering new
opportunities for VLBI research.
The new telescopes join a number of other
co-located VLBI instruments at Onsala.
Together with the exisiting 25m and 20m
radio telescopes they are part of the Onsala
Telescope Cluster. The 25m radio telescope
was installed in 1964 and is the first
European telescope to be involved in VLBI,
with observations commencing in 1968. The
20m radio telescope was installed in 1976
and has been used with the MarkIII geodetic
VLBI system since 1979. Today it has one of
the longest time series in the IVS database.
Other cO-lOcated instruments The GNSS station ONSA was established in
1987 as part of the CIGNET network, several
years before the International GNSS Service
(IGS) was founded. ONSA has had a
pioneering role in the early days of GNSS, and
has the longest continuous time series in the
IGS network. There is also a gravimeter
laboratory with a superconducting gravimeter,
and a tide gauge site with several
independent sensors. The observatory is one
of the small number of fundamental space
geodetic sites that have direct access to sea
level and have co-located VLBI, GNSS, and
gravimetry instrumentation. Onsala is
therefore a very important co-location site for
IAG’s Global Geodetic Observing System.
More informationwww.ggos.org
The 28th International Cartographic Conference
took place last month in the impressive
surroundings of the Wardman Hotel in
Washington DC. The next ICA GIM International
column will reflect on the conference as a whole,
and its impact on the cartographic community
worldwide. One of the many fringe meetings,
including gatherings of ICA Commissions across
Washington in the preceding days, was an
inaugural meeting of a ‘World Cartographic
Forum’. This initiative, promoted by Alex Kent,
president of the British Cartographic Society, is
intended to collect the experiences and practices
of national cartographic societies from around
the world to address common problems of
purpose, governance, services, membership
retention, establishment and relations with
kindred organisations.
In introductory remarks, the ICA president
reflected on the nature of membership of an
organisation (such as a national cartographic
society): previously membership used to be
taken as a firm, long-term commitment; today
with the rise of social media, making it very easy
to ‘unfriend’ or withdraw from engagement, the
concept of belonging to a society is much more
fluid, and the commitment to such a society is
much more irregular. Many societies have an
ageing profile, and difficulty in recruiting
younger cartographers: membership is not
perceived as important by young people.
It was agreed that the attracting, retaining and
offering of benefits to members is crucial.
Here, publications have a particular
importance, with formal journals of record and
informal newsletters being equally valued. In
some cases, differing membership categories
can be created with variable access to
materials of direct interest. The monitoring of
membership, characteristics of members,
events and their impact, are also critical to
meet expectations and assess impact.
Conferences are regarded as important
information conduits, but are also vitally
important for networking and maintaining an
engagement with the society. One society’s
experience was to insist on membership as a
pre-requisite for conference attendance. For
another society, a lot of work goes into
ensuring the conference goes well, student
discount is large, the conference recognises
professional/commercial sectors, travel awards
go to members from across the field, the
conference is open to all, and is abstract-
based only. In this case, the representative
suggested that >50% of the conference effort
was devoted to non-academic activities.
Focusing on young people with alternative, less
formal, models of conference activity such as
‘hackathons’ (with pizza and beer supplied)
was considered as the way forward.
It was pointed out that some conferences only
succeed due to sponsorship by engaged
commercial companies: this is a vital
component for some, but others experienced
conferences as being a source of funds rather
than a drain on resources.
Other experiences presented were less generic,
and covered experiences in recruitment,
accreditation, maintaining quality in outputs,
and jointly working with national sister societies.
Summarising, Dr Kent solicited thoughts on the
future for the Forum, an online presence, the
role of the Forum in future ICA conferences,
and initiatives for getting young people engaged.
More informationwww.icaci.org
40-41-42_organisations.indd 41 25-07-17 14:53

OrganisatiOns
| international | a u g u s t 2017424242
More informationwww.isprs.orgwww.acrs2017.org
agenda
internatiOnal land use sympOsium (ilus) 2017Dresden, Germany
from 30 October-3 November
For more information:
ilus2017.ioer.info
2017 septemBer
uaV-g 2017Bonn, Germany
from 4-7 September
For more information:
uavg17.ipb.uni-bonn.de
cmrt17 - city mOdels, rOads and trafficHannover, Germany
from 6-9 september
For more information:
www.ipi.uni-hannover.de/hrigi17
isprs geOspatial WeekWuhan, China
from 18-22 September
For more information:
zhuanti.3snews.net/2016/ISPRS
2nd geOint and Open sOurce analytics summitAlexandria, Virginia, USA
from 19-20 September
For more information:
geoint.dsigroup.org
intergeOBerlin, Germany
from 26-28 September
For more information:
www.intergeo.de
i3s 2017 - 5th internatiOnal sympOsium On sensOr scienceBarcelona, Spain
from 27-29 September
For more information:
sciforum.net/conference/
i3s2017Barcelona
OctOBergeOmatic and geOspatial technOlOgy asia 2017Johor Bahru, Malaysia
from 4-5 October
For more information:
www.geoinfo.utm.my/ggt2017
esri eastern africa user cOnferenceDar es Salaam, Tanzania
from 4-6 October
For more information:
www.esriea.co.ke/user-
conference-2017
racurs cOnference - frOm imagery tO digital realityHadera, Israel
from 16-19 October
For more information:
conf.racurs.ru/conf2017/eng
Calendar notiCesPlease send notices at least 3 months before the event date to: trea Fledderus, marketing assistant, email: [email protected]
For extended information on the shows mentioned on this page, see our website: www.gim-international.com.
The Prepublication of Papers in Public Archives
the issueThere is a growing tendency in neighbouring
disciplines to post manuscripts in public
repositories such as arXiv or on the authors’
home page while submitting the manuscript
for publication to a conference and/or
scientific journal. The reasons are not exactly
clear, but certainly include:
(a) authors want to prove that they are the
originator of a certain idea,
(b) the formal reviewing process is at times
too long, in particular for some PhD students,
(c) public repositories are part of the
open-access publication policy.
This policy is encouraged (and sometimes
enforced) by many donors and universities,
partly due to the high price of scientific
journals, partly with the argument that
research results which are obtained with
public money need to be available to the
public for free, while at the same time authors
need publications with a high impact factor.
isprs pOlicy On pre-prints in puBlic repOsitOriesISPRS recognises the increase in popularity
of publishing technical reports in public,
non-commercial repositories. As a result, a
paper submitted to an ISPRS Journal or an
ISPRS scientific meeting may already be
available to the community, and during the
review process the authors of a paper may be
known to the reviewer. The ISPRS policy is
that papers posted in such repositories,
including the home page of the authors, are
not considered prior work. As a consequence,
authors are not required to declare whether or
not they have posted a paper in such
repositories.
A reviewer should review such a paper as if
the paper in the repository did not exist.
Citations to papers in the repository are not
required and failing to cite them or beat the
performance of algorithms etc. described
therein are not grounds for rejection.
Reviewers should make every effort to treat
papers fairly whether or not they know (or
suspect) who wrote them, while at the same
time not giving away their own identity.
More information on this important topic and
a rationale for the ISPRS policy decisions can
be found in the July edition of the ISPRS
eBulletin at www.isprs.org/news/
newsletter/2017-03/index.html.
Christian Heipke, President ISPRS
40-41-42_organisations.indd 42 25-07-17 14:53
SUZHOU FOIF CO.,LTD.
New-generation EDM lauched for all FOIF total stations
Easy assembly and maintenance
Factory code option controllingreflectorless range
Reflectorless mode:600m min.,1000m or more.
Innovative design and stable performance
Advanced EDM head
Easy operationReeectorless 600m
RTS100 High-performance QVGAscreen(-40℃ working condition)
RTS340 Construction operationRoad program
OTS680 WinCE 7.0 system(SurvCE,FieldGenius supported)
RTS360
NEW
ARRIVAL

Aiming at the future together!
R-1500N
Reflectorless Total StationTotal surveying solution
W-1500N
Windows CE Total StationA truly integrated system
S-3180V
Scanning System3D laser measurement system
www.pentaxsurveying.com/en/
TI Asahi Co., Ltd.International Sales Department 4-3-4 Ueno Iwatsuki-Ku, Saitama-ShiSaitama, 339-0073 Japan
Tel.: +81-48-793-0118Fax: +81-48-793-0128E-mail: [email protected]
GNSS ReceiversPrecision Satellite Surveying with wireless communications
G6 Ti |Ni G5 Tw|Nw|Tt|Nt G2100 T |N
D-600
Precise Aerial Imaging System6 Rotor Multicopter with Autopilot