tanel jalakas, valery vodovozov, dmitri vinnikov · 2008. 6. 13. · tanel jalakas, valery...
TRANSCRIPT

TALLINN UNIVERSITY OF TECHNOLOGY Department of Electrical Drives and Power Electronics
Tanel Jalakas, Valery Vodovozov, Dmitri Vinnikov
POWER ELECTRONICS Laboratory works
Tallinn 2008

2
Tanel Jalakas, Valery Vodovozov, Dmitri Vinnikov. Power Electronics. Laboratory works Tallinn University of Technology Department of Electrical Drives and Power Electronics Tallinn, 2008 Preparation and publication of this study material was supported by SA Innove Tallinn University of Technology Department of Electrical Drives and Power Electronics Ehitajate tee 5, Tallinn 19086 Telefon 620 3700 Fax 620 3701 http://www.ene.ttu.ee/elektriajamid/ Cover designed by Ann Gornischeff Copyright: Tanel Jalakas, Valery Vodovozov, Dmitri Vinnikov, Tallinn University of Technology, Department of Electrical Drives and Power Electronics, 2008 ISBN 978-9985-59-791-0

3
Contents 1. Introduction ..................................................................................................5 2. Power electronics laboratory internal and safety regulations .......................6
2.1. Safety arrangements .............................................................................6 2.2. Implementation of the laboratory task ...................................................7 2.3. Preparation of the report .......................................................................8 2.4. Report submission and defence of the tasks.........................................8
3. Laboratory stand of diode rectifiers..............................................................9 4. Laboratory equipment ................................................................................12
4.1 Measuring devices ...............................................................................12 4.2 EPE 10 and EPE 20 laboratory setups.................................................13
5. Laboratory works .......................................................................................16 5.1 Work no. 1. Half-wave rectifier .............................................................16 5.2 Work no. 2. Single-phase bridge rectifier .............................................18 5.3 Work no. 3. Single-phase midpoint rectifier ..........................................20 5.4 Work no. 4. Three-phase bridge rectifier ..............................................22 5.5 Work no. 5. Controlled rectifiers ...........................................................24 5.6 Work no. 6. Pulsewidth modulator........................................................27
References ....................................................................................................29 Annexes.........................................................................................................30

4

5
1. Introduction These regulations are intended for use as a tutorial aid to implement laboratory tasks in the framework of AAV0020 Power Electronics. The laboratory of power electronics is based in the Power Engineering Building, Mustamäe, Ehitajate tee 5, room VII-101. The subject of power electronics should provide required theoretical knowledge about conversion and control of electrical parameters of electrical energy by means of electron devices. Today’s power electronics covers conversion, switching, control and adjustment of electrical energy by means of converters based on power semiconductor devices. By drafting the regulations it was assumed that the students have derived relevant theoretical knowledge from of lectures and manuals. These instructions contain six laboratory tasks on different diode rectifiers (half-wave rectifier, single-phase bridge rectifier), one laboratory task with a fully controlled thyristor rectifier and another with a pulse width modulator. No experimental diagrams are provided in the instructions, as the students are expected to understand required diagrams of converters and select measurement and auxiliary devices required when composing an experimental circuit without outside assistance. Student pass in the course of power electronics requires that the student has performed required experiments for each task, has prepared proper reports and has successfully defended the tasks.

6
2. Power electronics laboratory internal and safety regulations
2.1. Safety arrangements The connection must be composed to enable free access to the feeder board, experiment stand, emergency switch and test devices, which are adjusted in the run of the experiment. Measurement devices and appliances should be in the right stand and their scales well visible. Long-hanging conductor entanglement could lead to a possibility of getting an electric shock; displacement of the devices or pulling them down from the table, should be avoided. Sticking the conductors wilfully is prohibited. Measurement devices, the frames of which are connected electrically (oscilloscopes, electronic voltmeters etc.) must be connected to the earthed terminal of the mains. While taking oscillograms in AC circuits the galvanic isolation is to be provided positively, using a separating transformer or the differential end piece of the oscilloscope. The circuit could be switched on upon permission of the instructor, preliminarily warning the members of the working group. Changes in the circuit could be made only when the voltage is switched off. In live only the measurement range of the voltmeter could be changed and the measurement conductors of the voltmeter and oscilloscope be replaced. Thereby special caution must be applied by dangerous voltages (over 50 V). While working with electrical machines precautions must be taken to ensure that rotating machines do not grip clothes, hair or hanging conductors. Before starting the machine the members of he working group must be warned. If the device is functioning improperly (overheating, goes smelly, sparkles or electric arc appears between contacts), the device must be switched off immediately. In the case of an accident the sufferer must be set free of voltage, using the safety switch, placed at each working table. Thereafter the rescue service must be informed and first aid provided before the arrival of the rescue service. It is prohibited to
• touch non-isolated live parts;
• connect conductors in the live circuit;
• switch loaded circuits by switches of open construction;
• switch the main board switches without supervisor’s instruction;
• lean and sit on the electrical devices, hang clothes on them, place bags, cases etc. on the working place;
• leave the laboratory for a longer time without supervisor’s permission;
• touch other devices not needed for the given task;

7
• implement the experiment alone; • eat, drink and smoke in the laboratory.
2.2. Implementation of the laboratory task The tutorial process consists of the preparation of the laboratory task; implementation of the required tests, preparation of the report and its defence. A working group may be composed of four students as a maximum.
The students shall be engaged in the study in the power electronics laboratory and all activities interfering with it are prohibited Authorization to the laboratory task is provided to the student who:
• is aware of the given safety and internal regulations and has verified that with his/her signature on the checklist;
• is familiar with the feeder circuits of the laboratory;
• is prepared for the task, i.e. has carefully read the description of the laboratory task, drawn up the required experimental diagram, calculated the required values, prepared the tables and is able to answer checking questions;
• has submitted the report of the previous task. First the student will compose the required circuit. At the start, measurement devices shall be placed properly, instruments must be placed on the table so, that all scales are well visible. If possible, the order of the principal electrical diagram should be followed in circuit element placement. The device regulating the main voltage of the circuit and measuring voltmeter should be placed side-by-side, thus making it easy to follow voltmeter’s readings while regulating the voltage when the experimental circuit is being composed, circuits indicated by bold lines on the diagrams are connected first. Next the voltage and control circuits represented by thin lines are connected. It is always possible to compose the switching circuit so that there will not be more than two-three conductor ends connected to less than one terminal or socket. Before switching on the voltage, control whether arms of all measurement devices are on zero or not, and whether the measuring ranges correspond to the expected values of the variables to be measured. If required, the readings are corrected by means of correctors and proper measurement ranges will be selected. At the beginning of the first experiment, the circuit may be switched on only upon supervisors acceptance.
At the end of the experiment the students shall: • submit the notebook of the laboratory tasks to the supervisor to verify
results of the experiments;
• after permission of the supervisor, take off the circuits, place instruments and measurement devices onto their permanent places and set the workspace in order.
The experiments are considered as completed if the supervisor has verified the results and has given permission to terminate the laboratory work.

8
2.3. Preparation of the report The report shall consist of a title page, the legend and tables, and a graphical part. On top of the title page the formal header is located (Fig.1). The connection diagram is drawn under this header. If there are several circuits, then they could be presented on the following pages and supplied with corresponding captures. The requirements for the preparation of the legend, formulas, tables and graphics are provided in the instructions Preparation of student graduation papers, accessible in the Internet on the page http://wwww.ene.ttu.ee/elektriajamid/. You have to click “õppetöö ja lõpetamine”.
Tallinn University of Technology
Department of Electrical Drives and Power Electronics
Student: Group: Task implemented (date)
Report submitted (date)
AAV0020 Power electronics
Task no. (Title of the task)
Objects of the experiment Devices used
Figure 1. Header of the title page
The final part of the report is an abstract. The abstract must contain a critical analysis and evaluation of the results. Therefore compliance of the results with theoretical aspects, data of the experiments object and valid standards are compared and appropriateness of the measurement methods and measuring devices is evaluated. Special attention must be paid to the differences of the experimental and theoretical results, errors of experiments, incorrect measurement readings and their reasons. It is helpful to study over the questions given at the end of the task, to be well equipped for the defence of the task.
2.4. Report submission and defence of the tasks The student shall prepare a report on the task accomplished, according to the requirements of the instructions. The report must be submitted before the following task. If the report is not submitted or it is inadequate the supervisor has the right remove the student from the next laboratory task. Defence of each laboratory task involves answering the questions to assess the preparation of the student for the laboratory task, practical knowledge shown in the laboratory and activity in solving the problems that arose as well as the evaluation of the content and organization of the report.

9
3. Laboratory stand of diode rectifiers
3.1. Description of the principal electrical diagram of the stand
The stand is placed in a feeder switchboard and the front panel of the board represents field of the circuit composition. The principal electrical diagram of the laboratory stand Diode Rectifiers is given in annex 1 to this manual. Also, a diagram is available in the pocket placed on the inner left side of the switchboard. There are four such stands in the laboratory altogether. The stand is supplied with voltage 400 V from the three-phase network via feeder cable and plug X1. To reduce voltage, a three-phase Y0 /Y0 –connected transformer T1 and a single-phase transformer T2 with central tapping are used Main technical data of the transformer T1:
1. apparent power: s = 400 VA, 2. primary voltage: u1 = 400 V, 3. secondary voltage: u2 = 24 V, 4. primary current: i1 = 0.6 A, 5. secondary current: i2 = 10 A, 6. number of phases: 3, 7. interconnection: y0/y0.
Main technical data of the transformer t2: 1. apparent power: s = 120 VA, 2. primary voltage: u1 = 230 V, 3. secondary voltage: u2 = 24 V, 4. primary current: i1 = 0,5 A, 5. secondary current: i2 = 5 A, 6. number of phases: 1.
According to the technical data of the transformers both a three-phase and a single-phase voltage system are used in the experiment with voltages: Ul = 24 V (phase to phase between terminals X3 and X4, X4 and X5, X5 and X3, or between terminals of the single-phase transformer with central tapping X7 and X8 or X8 and X9), Uf = 14 V (phase to neutral voltage between terminals X7 and X8 or X8 and X9) and U7-9 = 48 V (between terminals X7 and X9 of the single-phase centrally tapped transformer). By switching on the stand, a green signal light H1 (230 V) illuminates. After switching on the stand, the circuit composed for the laboratory task does not get live. The stand gets live by the switch S1 (main switch) and then lights on another green signal light H2 (230 V stand is live).

10
On the front panel a red safety push-button (S2 emergency switch) is located. In case of an emergency situation you have to press this button and the magnetic switch K1 switches off the voltage from the stand ‘s board and the red emergency light H3 (emergency) shows. After clearing off the emergency, to restore voltage, you have to pull out the emergency push-button (by some stands you have to turn the button in the indicated direction). The primary circuits of the transformers T1 and T2 are protected against short-circuit and overloading by automatic circuit-breaker F1 (In = 4 A). The secondary circuit of the transformer T1 is protected by the automatic circuit breaker F2 (In = 10 A), and the secondary circuit of the transformer T2 by the automatic circuit breaker F3 (In = 5 A). The circuit breakers are placed inside the feeder switchboard. To avoid the switching of the primary circuits protection F1 from the great current pulses that arise by switching on the transformer, NTC thermistor (posistor) R1 is sequentially connected into the primary circuit of the transformer T2. In the circuit of the laboratory stand Diode rectifier there are six power diodes model 25F60 (D1…D6) with a permitted on-state current IF = 25 A and with a maximal reverse voltage UR = 600 V. Therefore is it possible to compose all possible different diode rectifier connections. The diodes have three connection sockets both on the cathode and on the anode terminals (X11…X22) whereto the conductors of the composed circuit are connected. In addition, there are eight connection sockets in the circuit to connect the conductors of “+” polarity X25, X24 (four sockets are connected sequentially with each-other). Also, three sockets X10 are brought out for the connection of the fourth wire.
3.2. Front panel of the stand The diagram of the front panel is given in Annex 2 to these regulations. On the front panel the following is placed: main switch S1, green signal light (230 V “Stand live”), push-button of the safety switch (Emergency), red emergency light and yellow indicating light (230 V), also terminals (sockets) of the secondary circuit of the three-phase transformer (Transformer T1), terminals of the secondary circuit of the transformer with central tapping (Transformer T2), and terminals of the six diodes – three from anodes and three from cathodes. Also, on the front panel there the networks neutral N (tree blue sockets) is brought out.
The sockets of the negative polarity or AC sockets are black and the sockets of positive polarity are red. The cord set of special safety wires of different length and colour belong to the outfit of the stand. There are six black wires with a length of 0.5 m, three blue wires with a length of 0.5 m, four red wires with a length 0.5 m, four black wires with a length of 2 m, and four red wires with a length of 2 m.

11
On the front panel, graphical symbols of the transformers and diodes are drawn, by which the corresponding sockets are placed. The laboratory stand goes live when the three-phase network of 400 V is switched on. The experimental circuit is switched on by turning the main switch into position 1.
3.3 Rules of procedure on the stand Before switching on the laboratory stand you have to carefully get across the principal electrical diagram of the stand and the connection diagram on the front panel. Thereby study particularly carefully, where the supply and emergency switches are located. It is extremely important to know the technical data of the transformers and diodes, in order not to give rise to overloads and short-circuits by the composition of the experimental circuit. To switch on the experimental circuit, you can only use the main switch, not the emergency switch. Before the experimental circuit is put together the stand will be switched on and verified whether all voltages to be used correspond to the standards. By the sockets of positive polarity only the red wires and sockets of negative polarity use black wires. For the connection of the networks neutral only blue wires are used. In that part of the experimental circuit, on the front panel, the use of wires of 0.5 m length is recommended to avoid tackling in the longer wires and pulling down the measuring instrument or de-ices from the table. After completion of the experiment the stand must be switched off, the network plug pulled out, the circuit dismounted and the wires must be placed on the peg on the rear wall of the stand. It is prohibited to
• open the switchbox door without lecturer’s permission;
• place the measurement instrument and devices on the experimental stand;
• use wires unsuitable for composing the circuits;
• use a measuring instrument and devices unsuitable for connection with the cord set belonging to the outfit of the experimental stand;
• make connection inside of the circuit wilfully;
• actuate the experimental circuit using the emergency switch.

12
4. Laboratory equipment
4.1 Measuring devices In the laboratory tasks the following measuring devices are used:
• Lutron DV-101 DC voltmeter,
• Lutron DA 137 DC ampermeter,
• Lutron AV 102 AC voltmeter. When using digital measuring devices in the laboratory take the following precautions:
• Be sure that the laboratory wires are in the right sockets, according to the needed measuring range and the polarity is right (Fig 2. sockets 3–5).
• Use switch 6 to select the measuring range.
• Switch the measuring device on with switch 2 and take the needed measurements.
Figure 2. Educational DC ampermeter A) and DC voltmeter B)
In Fig. 2. all the important elements of digital laboratory measuring devices are listed. These are as follows:
• 1 – LCD display,
• 2 – supply,

13
• 3 – ampermeters (max 250 mA positive signal), voltmeters (positive signal),
• 4 – ground connection,
• 5 – ampermeters (max 5 A positive signal),
• 6 – selection of the measuring range. Ampermeters (2 mA – 5 A) and voltmeters (200 mV – 200 V).
Absolute maximum ratings for the measuring devices are:
• maximum input voltage for the DC voltmeter – 250 V
• maximum input voltage for the AC voltmeter – 600 V
• maximum input current for the DC ampermeter – 5 A (NB! be careful when regulating current with the rheostat)
The accuracy of the measuring devices is 1,5%.
4.2 EPE 10 and EPE 20 laboratory setups EPE 10 and EPE 20 are educational equipment produced by Lucas Nylle company. This equipment is used in laboratory practice of power electronics. EPE 10 enables you to assemble controllable and non-controllable rectifiers. The testing module consists of diodes and thyristors. The testing module of EPE 20 contains transistors (IGBT). EPE20 laboratory setup allows for assembling pulsewidth modulators, one- or three-phase inverters and investigation of the switching process of an IGBT. Both educational devices are modular construction laboratory setups (Fig 3.). The laboratory setup consists of:
• galvanic isolation modul (differential measurement amplifier), • power supply for the control system, • Microcontroller-based control system, • testing module (diodes and thyristors or transistors), • power supply, • load module (R, L, C), • universal measuring device (current, voltage, power, cosφ).
When you finish your work, please switch the measuring devices off, using switch 2.

14
Figure 3. Locations of modules in EPE10 and EPE20 laboratory setups
To operate the laboratory setup you need a PC with special software package. This software enables you to collect, store and process measured values. The data can be displayed either in numerical or in graphical form. Some laboratory tasks do not need a PC. The control system can operate in a limited mode as a stand-alone device. The measured signals can be observed with an external oscilloscope. To make it easyer for students to use the laboratory setup, it is possible to use changeable overlay masks with different drawings on the testing module.
Figure 4. Connecting the differential amplifier and universal control module with the power supply

15
When you work with an EPE 10 and EPE 20 educational laboratory setups, you should do the following:
• Read all the required theoretical material and relevant manuals.
• Make needed connections with applied laboratory wires.
• Control the wiring and be sure that all wires and connection bridges are in right sockets.
• Check the positions of switches on the differential measuring amplifier module.
• Power up the power supply for the control system.
• Switch on the main power supply.
• Start the PC program relevant to the laboratory work
• Set up all needed parameters
• Calibrate the measuring system by using externeal measuring devices
• Turn the switch run/stop on the control system module to run position
• Measure and record needed values according to the manual laboratory task.
• Switch off all thedevices.
• Remove the laboratory wires and connection bridges. It is prohibited to:
• touch non-isolated live parts;
• connect conductors in the live circuit;
• switch the main board switches without supervisor’s instruction;
• lean and sit on the electrical devices, hang clothes on them; place bags, cases etc. on the working space;
• leave the laboratory without supervisor’s permission for a longer time;
• touch other devices not needed for the given task;
• implement the experiment alone. Software The software needed in the following laboratory tasks with EPE10 and EPE20:
• Phacon (EPE10, thyristor rectifier and voltage regulator control), • PWM (EPE20, pulsewidth modulator and inverter control).

16
5. Laboratory works
5.1 Work no. 1. Half-wave rectifier
Objective To determine the characteristic quantities of the half-wave rectifier, investigate the shape of the output voltage, take up the voltage-current characteristic and get acquainted with the possibilities rectifier use.
Test devices 1. Test stand with power diodes 25F60, 2. AC-voltmeter V3, 3. magnetoelectric dc voltmeters V1, V2, 4. DC ampermeter A, 5. potentiometer Rk, 6. inductor L, 7. oscilloscope OS, 8. connection wires.
Preparation Look for the technical data and characteristics of the power diode 25F60 (datasheet could be found in the Internet). Study the electrical diagram of the test stand. Draw up test diagrams no. 1 (active load) and no. 2 (active- inductive load) and explain their functioning. Calculate the dc component of the output voltage Ud and the mean value of the output voltage Ur of the half-wave rectifier if the secondary voltage of the transformer Us = 24 V.
Procedure 1. Familiarize yourself with the test devices, write down the data of the
measuring instruments (type, accuracy class, etc.). 2. Select the potentiometers, resistors, inductor and measuring
instruments according to the parameters of the diodes 3. Put together test circuit no. 1. 4. Connect the measuring instruments in accordance with the electrical
diagram of the rectifier: magnetoelectric ampermeter A and voltmeters V1 and V2, diode-voltmeter V3 and the oscilloscope.
5. Adjust the resistance of potentiometer Rk of the maximum. 6. To take up the voltage-current characteristic Ud = f (Id) change the
value of the rectified current Id with the potentiometer Rk from maximum to minimum (5-6 measurements), whereby the maximal current must not exceed 5 A. Write the dc components of voltage and current, voltage drops of the diode UF ja ac components of the voltage Ua in the table.

17
7. To determine the ripple of dc voltage, measure the pulsation voltage Ua, i.e. alternating component of the rectified voltage, with the diode voltmeter V3. If the voltmeter measures rms value, then, assuming that the alternating component of the voltage to be sinusoidal, calculate the dc ripple factor by the equation:
%,1002⋅=
d
ap U
UK
8. Based on the test data chart, the voltage-current characteristic Ud = f (Id) of the rectifier, calculate the rms-ripple factors for all loads and take up the shapes of the ac voltage, rectified voltage and voltage on the diode from the oscilloscope’s display and supply them with time and voltage scales.
9. Put together test circuit no. 2. 10. Take up the voltage-current characteristic, as described in item 5. 11. Measure the dc ripple factor by the active-inductive load and calculate
the smoothing factor:
.vдlj
sis
KKq =
12. The value of the dc-ripple factor of the voltage Ksis, which you have determined in test 7, is equal for all.
13. Take up the shapes of the ac voltage, rectified voltage and voltage on the diode from the oscilloscope’s display and supply them with time and voltage scales.
14. How do you explain the smoothing effect of the inductor on the rectified voltage?
15. Conclusions.
Questions 1. What kind of useful knowledge and skills has this task given to you? 2. Which rectifier connections are used? 3. How do you select the characteristics of the diode for a given rectifier? 4. How do the characteristics of the inductor influence the shape of the
output voltage? 5. Why is the application of the half-wave rectifier very limited?

18
5.2 Work no. 2. Single-phase bridge rectifier
Objective To determine the characteristic values of the single-phase bridge rectifier, to investigate the shape of the output voltage, to take up the voltage-current characteristic and get acquainted with the possibilities of rectifier use.
Test devices 1. Test stand with power diodes 25F60, 2. AC voltmeter (diode voltmeter) V1, 3. DC magnetoelectric voltmeter V2, 4. DC ampermeter A, 5. potentiometer Rk, 6. inductor L, 7. polar electrolytic capacitor C, 8. oscilloscope OS, 9. connection wires.
Preparation Draw up the test diagrams no. 1 (without filter), no. 2 (with C-filter) and no. 3 (with Г-shape LC filter). Calculate the dc component of a single-phase bridge rectifier Ud if the secondary voltage of the transformer Us = 24 V.
Course of the work 1. Familiarize yourself with the test devices, write down the data of
measuring instruments (type, class of accuracy etc.). 2. Select the potentiometers, resistors, inductor, capacitor and measuring
instruments according to the diodes' characteristics. 3. Put together test circuit no. 1. 4. Connect the measuring instruments in accordance with the electric
diagram of the rectifier: magnetoelectric ampermeter A and voltmeter V2, diode voltmeter V1 and oscilloscope.
5. Adjust the resistance of potentiometer Rk to the maximum. 6. To take up the voltage-current characteristic Ud = f (Id) change the
value of rectified current Id with the potentiometer Rk from the maximum to the minimum (5–6 measurements), whereby the maximum current must not exceed 5 A. Write the dc components of voltage and current and alternating components of voltage (ripple voltage) Ua into the table.
7. Calculate the dc ripple factor by the equation given in the task no. 1.

19
8. Put together test circuit No. 2. For this, connect the rectifier to the input of the output filter. Connect the magnetoelectric voltmeter and diode voltmeter to the output of the filter.
9. Calculate the dc ripple factor and the smoothing factor of the C-filter. 10. The value of the dc ripple factor, that you have calculated in test 7 is
equal for all. 11. Take up the shapes of the ac voltage, rectified voltage and voltage on
the diode from the oscilloscope’s display and supply them with time and voltage scales.
12. Put together test circuit no. 3. 13. Make the same measurements and calculations that you have made
for test circuit no. 2. 14. Compare the smoothing properties of different filters 15. Conclusions.
Questions 1. What kind of knowledge and skills has this task given to you? 2. Which is the best filter? 3. How does the capacity of the capacitor influence the smoothing
properties of the filter? 4. Why is it required to smooth the rectified voltage? 5. How do you explain the smoothing effect of the filter an the rectified
voltage? 6. What else are the filters used for?

20
5.3 Work no. 3. Single-phase midpoint rectifier
Objective To determine the characteristic quantities of the one-phase midpoint rectifier, investigate the shape of the output voltage, to take up the voltage-current characteristic and get acquainted with the application possibilities of the rectifier.
Test devices 1. Test stand with power diodes 25F60, 2. AC voltmeter (diode voltmeter) V1, 3. DC magnetoelectric voltmeter V2, 4. DC ampermeter A, 5. potentiometer Rk, 6. inductor L, 7. polar electrolytic capacitor C, 8. oscilloscope OS, 9. connection wires, 10. Low voltage dc motor.
Preparation Draw up test diagrams no. 1 (active load), no. 2 (active load with C-filter) and no. 3 (active-inductive load). All the test diagrams have the common anode connection. Calculate the dc component of the output voltage of the one-phase midpoint rectifier Ud, for the secondary voltage of the transformer Us = 24 V.
Course of the work 1. Familiarize yourself with the test equipment, write down the data of
measuring instruments (type, class of accuracy etc.). 2. Select the potentiometers, resistors, inductor, capacitor and measuring
instruments according to the parameters of the diodes. 3. Put together test circuit no. 1. 4. Connect the measuring instruments in accordance with the electrical
diagram of the rectifier: magnetoelectric ampermeter A and voltmeter V2, diode voltmeter V1 and oscilloscope.
5. Adjust the resistance of potentiometer Rk at the maximum. 6. To take up the voltage-current characteristic Ud = f (Id) change the
value of the rectified current Id with potentiometer Rk from maximum to the minimum (5-6 measurements), whereby the maximum value must not exceed 5 A. Write the dc components of the voltage and current, and AC components of the voltage (ripple voltage) Ua into the table.

21
7. Calculate the dc ripple factor by the equation given in the task no. 1. 8. Put together test circuit no. 2. Connect the rectifier to the input of the
output filter. Connect the magnetoelectric and diode voltmeters to the output of the filter. Calculate the dc ripple factor of the C-filter and the smoothing factor.
9. The dc ripple factor Ksis that you found in test 7 is the same for all cases.
10. Take up the shapes of the rectified voltage of AC voltage and the voltage of the diode from the oscilloscope’s display and supply them with time and voltage scales.
11. Do the same measurements and calculations as by the test circuit no. 2.
12. Compare the results obtained. 13. Take off the rheostat Rk, inductor L and connect low-voltage motor of
small capacity to the output of the rectifier, and take up the shape of the voltage on the diode and the shapes of the voltage and current (from the ampermeter) on the motor terminals from the oscilloscope display.
14. Explain why the results are different from the results of previous tests. 15. Conclusions.
Questions 1. What kind of knowledge and skills has this task given to you? 2. Witch are the advantages and imperfections of the one-phase midpoint
rectifier? 3. How is the functioning of the rectifier influenced by the value of the
inductor? 4. Compare the results with the results of task no. 2. Where do the
differences lie? 5. Which filter is employed in the output of the one-phase midpoint
rectifier usually? 6. In which power range and why is the one-phase midpoint rectifier
applied?

22
5.4 Work no. 4. Three-phase bridge rectifier
Objective To determine the characteristic quantities of the three-phase of the three-phase bridge rectifier, to investigate the shape of the output voltage, to take the voltage-current characteristic and get acquainted with the possibilities of rectifier use.
Test devices 1. test stand with power semiconductors, 2. AC voltmeter (diode voltmeter) V1, 3. DC voltmeter V2, 4. DC ampermeter A, 5. potentiometer Rk, 6. inductor L, 7. polar electrolytic capacitor C, 8. oscilloscope OS, 9. connection wires.
Preparation Draw up test diagrams no. 1 (without filter), no. 2 (with C-filter) and no. 3 (with a Г-shape L-C filter). Calculate the dc component of the three-phase bridge rectifier if the secondary voltage of the transformer Us = 24 V.
Course of the work 1. Familiarize yourself with the test devices, write down the data of
measuring instruments (type, class of accuracy etc.). 2. Select potentiometers, resistors, an inductor, a capacitor and
measuring instruments according to the parameters of the diodes, 3. Put together test circuit no.1. 4. Connect the measuring instruments in accordance with the electrical
diagram of the rectifier: magnetoelectric ampermeter A and voltmeter V2, diode voltmeter V1 and oscilloscope.
5. Adjust the resistance of the potentiometer Rk at the maximum. 6. To take up the voltage-current characteristic Ud = f (Id), change the
rectified current Id with the potentiometer Rk from maximum to minimum (5–6 measurements), whereby the maximal current must not exceed 5 A. Write the dc components of the voltage and current, alternating components of the voltage (ripple voltage Ua) in the table.
7. Calculate the dc ripple factor by the equation, that is given in task no. 1.

23
8. Put together test circuit no. 2. Therefore connect the rectifier to the input of the output filter. Connect an AC and DC voltmeter to the output of the filter.
9. Calculate the dc ripple factor and the smoothing factor of the filter. 10. The dc ripple factor Ksis, that you found in test 7, is the same for all
cases. 11. Take up the shapes of the voltage of ac voltage’s rectified and the
voltage of the diode from the oscilloscope’s display and supply them with time and voltage scales.
12. Put together test circuit no. 3. 13. Do the same measurements and calculations as in test circuit no. 2. 14. Compare smoothing properties of both filters. 15. Conclusions.
Questions 1. What kind of knowledge and skills has this task given to you? 2. What determines output voltage Ud of the rectifier? 3. Compare the ripple of the output voltage of three-phase bridge rectifier
(without filter) with that of all other rectifier types. 4. Is it necessary to smooth the output voltage of a three-phase bridge
rectifier? 5. What is the power factor of a three-phase bridge rectifier? 6. Which power range is the three-phase bridge rectifiers used for?

24
5.5 Work no. 5. Controlled rectifiers
Objective The aim of this laboratory work is to investigate controlled two pulse rectifiers. Collect output voltage and current vaweforms, control and output characteristics, calculate power components and draw vector diagrams.
Test devices 1. LUCAS NÜLLE EPE 10 laboratory setup, 2. computer,
a. PHACON program 3. connection bridges, 4. laboratory wires.
Preparation 1. Study instructional materials and hardware manuals, record the
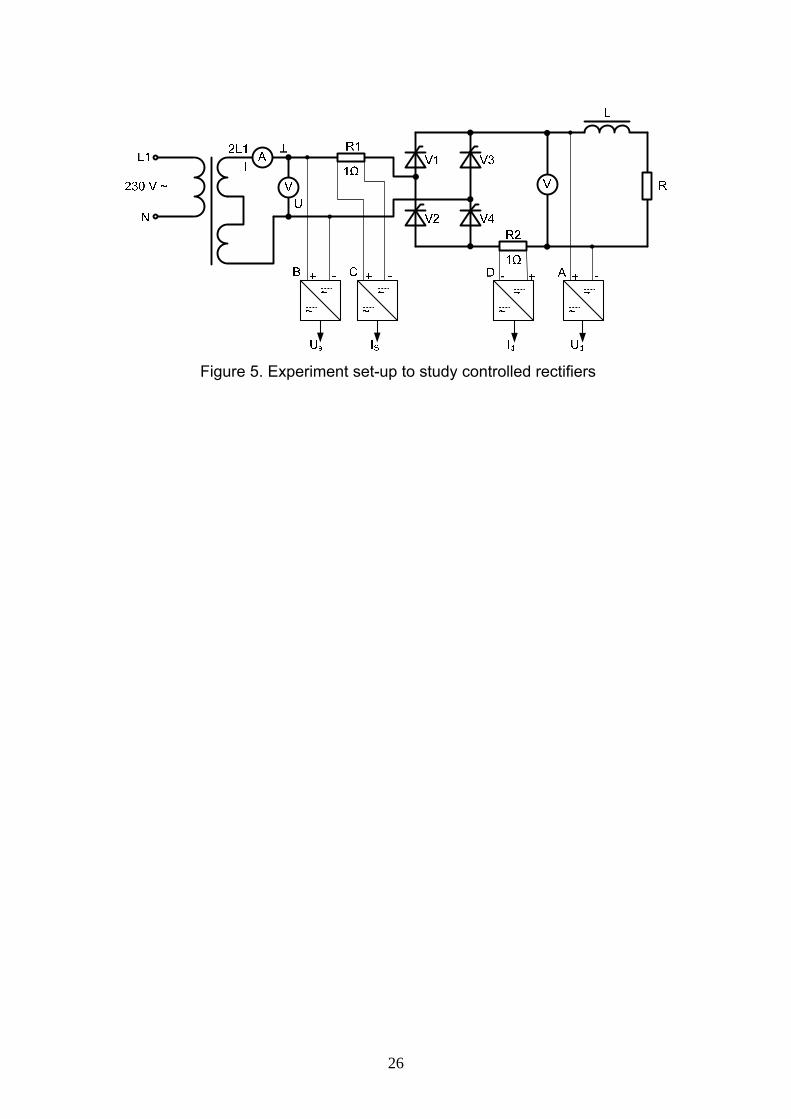
needed data about the measuring devices (type, accuracy, range). 2. Study the circuit before assembling. 3. Assemble the circuit in Fig. 5, (load 270 Ω).
Course of the work 1. Turn the control mode switch knob on the control system module to
position RS232. 2. Switch on the control module power supply. 3. Switch on the main power supply. 4. Switch on the universal measuring device. 5. Run the PC program PHACON (start menu, power electronics
submenu). 6. In the program PHACON, select submenu settings, settings, mode,
1 phase control (multipulse). 7. In the differential measuring module push the switches into positions
according to Table 1. Table 1
8. Switch the run/stop switch on the control unit into run position. Start the device with the PHACON program by clicking the triangle-shaped button on the toolbar.
Switch Value Switch position (measuring range) A Output voltage 150 V B Input voltage 150 V C Input current 2.5 V D Output current 2.5 V

25
9. Draw two periods of the input voltage, output voltage and output current waveforms (resistive load, control angle α = 900 ,R = 270 Ω).
10. Draw two periods of the input voltage, output voltage and input current waveforms (inductive-resistive load, L = 1.2 H, control angle α = 900, R = 270 Ω).
11. Answer the following questions.
• What influence does resistive and resistive-inductive load have on the output voltage of the controllable rectifier. How do the inductive load, the voltage and current vaweforms change.
• In what mode does the rectyifier operate when output voltage value is negative?
12. Collect and draw the graph of control characteristics (control angle α = 900 ,R = 270 Ω).
13. Collect and draw the graph of control characteristics (control angle α = 900, L = 1.2 H, R = 270 Ω).
14. Compare both control characteristics. Find differences and explain, why those differences occur.
15. Calculate the real power, apparent power, reactive power and the power of the first fundamental harmonics.
16. Use PHACON software and draw the power vector diagram (resistive load, control angle α = 900 ,R = 270 Ω).
17. Draw the power vector diagram (resistive – inductive load, control angle α = 900 ,L = 1.2 H, R = 270 Ω).
18. Compare and analyze the graphs drawn.
Questions 1. What kind of knowledge and skills has this task given to you to you? 2. Why is reactive power generated with the resistive-inductive load? 3. What were the output voltage, when the output inductance were
infinitely high?
26
Figure 5. Experiment set-up to study controlled rectifiers

27
5.6 Work no. 6. Pulsewidth modulator
Objective The aim of this laboratory work is to study the pulsewidth modulators, the operation of a pulsewidth modulator with different kinds of loads (R, RL), calcuiate average values for voltages and currents, and analyze the influence of induction on the output current.
Test devices 1. LUCAS NÜLLE EPE 20 laboratory set-up, 2. computer,
a. PWM program 3. connection bridges, 4. laboratory wires.
Preparation 1. Study instruction materials and hardware manuals, record the needed
data about the measuring devices (type, accuracy, range) 2. Study the circuit before assembling. 3. Assemble the circuit in Fig 6, (load 810 Ω).
Procedure 1. Turn the control mode switch knob on the control system module to
position RS232. 2. Switch on the control module power supply. 3. Switch on the main power supply. 4. Switch on the universal measuring device. 5. Run the PC program PWM (dtart menu, power electronics submenu). 6. In program PWM select Low Frequency 112Hz in the setup. 7. In the differential measuring module push the switches into positions
according to Table 2. Table 2
8. Switch the run/stop switch on the control unit into run position. Start the device with the PWM program by clicking the triangle-shaped button on the toolbar.
Switch Value Switch position (measuring range) A Output voltage 400 V B Not used Not used C Not used Not used D Output current 2.5 V

28
9. Draw the output voltage and current vaweform graphs for duty factors 25%, 50% and 75%.
10. Analyze the influence of the duty factor to the output voltage and current.
11. Calculate the average value of the output voltage for all duty factor values and draw the calculated average value on the graph.
12. Calculate the average value of output current for all duty factor values and draw the calculated average value on the graph.
13. Draw the output voltage and current vaweforms (duty cycle 50%, inductance 1.2 H and switching frequency 112 Hz).
14. Draw the output voltage and current vaweforms (duty cycle 50%, inductance 1.2 H and switching frequency 1800 Hz).
15. Analyze those waveforms. 16. Calculate the average value of the output voltage and compare it with
values calculated before. 17. Calculate the average value of the output current and compare it with
the values calculated before.
Questions 4. What kind of knowledge and skills has this task given to you to you? 5. Where can the pulsewidth modulator be used? 6. How does the inductive load influence the output current and voltage? 7. How does the swiching frequency influence the voltage and current
waveforms?
Figure 6. Experiment set-up to study the pulsewidth modulator

29
References 1. Vodovozov, V., Jansikene, R. Power Electronic Converters, TUT, Dept.
of Electrical Drives and Power Electronics, Tallinn 2006, ISBN 9985-69-038-9.
2. Joller, J. Jõuelektroonika, TTÜ elektriajamite ja jõuelektroonika instituut, Tallinn 1996.
3. http://www.ene.ttu.ee/elektriajamid/oppeinfo/AAR3320/AAR3320_ elektroonika.pdf.
4. Abo, L. Elektroonikakomponendid, Tallinn 1997, ISBN 9985-60-358-3. 5. Hiiob, L. Elektroonika ja raadiotehnika VII (elektriseadmete montaaž ja
valmistamine), Tallinn, Eesti õppekirjanduse keskus. 1991. 6. Issakov, I jt. Tööstuselektroonika alused, Tallinn, Valgus, 1982. 7. Руденко В. С., и др. Основы преобразовательной техники. Учебник
для вузов. 2-е изд., перераб. и доп. М., Высшaя школа, 1980.

30
Annexes

31
Annex 1. Principal electrical diagram of the stand Diode rectifiers

32
Annex 2. Front panel of the stand