tank tarc lextran transportation budget review committee feb. 16, 2006
TRANSCRIPT

TANK • TARC • LEXTRANTransportation Budget Review Committee
Feb. 16, 2006

Trends
• Aging population
• Increasing fuel
prices
• Aging vehicles/
infrastructure
• Increased
demand

Benefits
ACCESS
• Jobs
• Healthcare
• Education
• Community
Alternatives
Independence

• 15.5 million customers/year
• $57 million Annual budget
• 258 buses
• 75 paratransit vans
TARC at a Glance
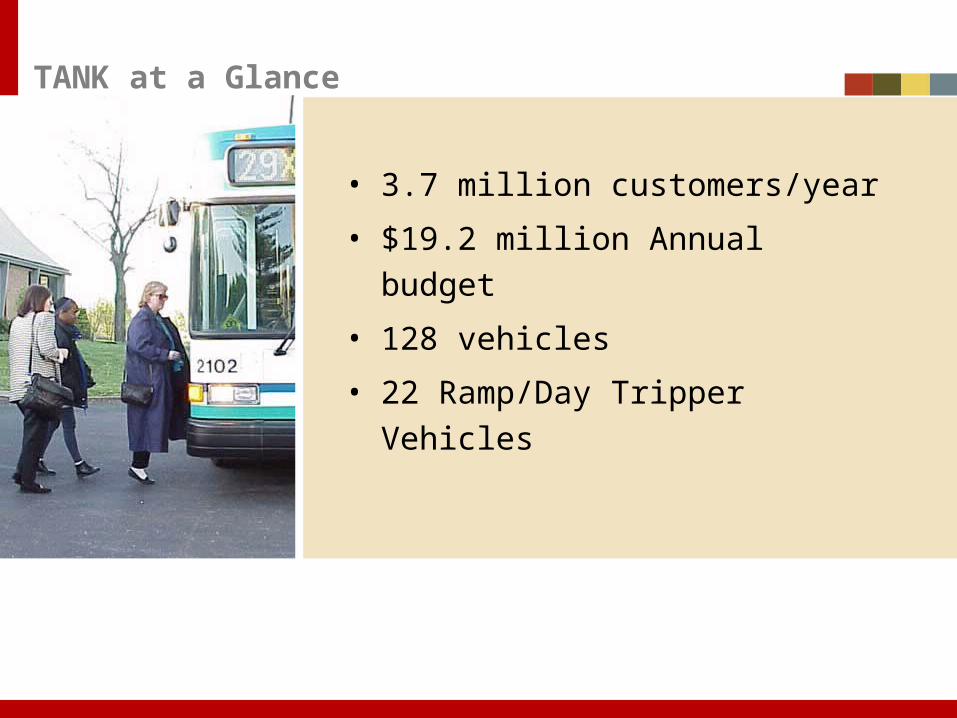
• 3.7 million customers/year
• $19.2 million Annual budget
• 128 vehicles
• 22 Ramp/Day Tripper Vehicles
TANK at a Glance

LEXTRAN at a Glance
• 1.1 million
customers/year
• $11.1 million
annual budget
for FY ’05
• 42 buses

Budget

Public Transportation State Budget Funds available for federal matching
Recommended FY 2007
Recommended FY 2008
General Fund $5,203,500 $5,203,400
Less Non-Public Schools Transp.
$2,950,000 $2,950,000
Less Multi- Modal Transp.
$582,800 $582,800
Total $1,670,700 $1,670,700

Public Transportation Projected Federal Funds
FY2007 10% Match FY 2008 10% Match
Federal Funds 40,042,000 5 m 40,042,000 5 m
TARC/TANK/LEXTRAN 20 m 2.5 m 20 m 2.5 m
Smaller Urban Systems/Rural
20 m 2.5 m 20 m 2.5 m
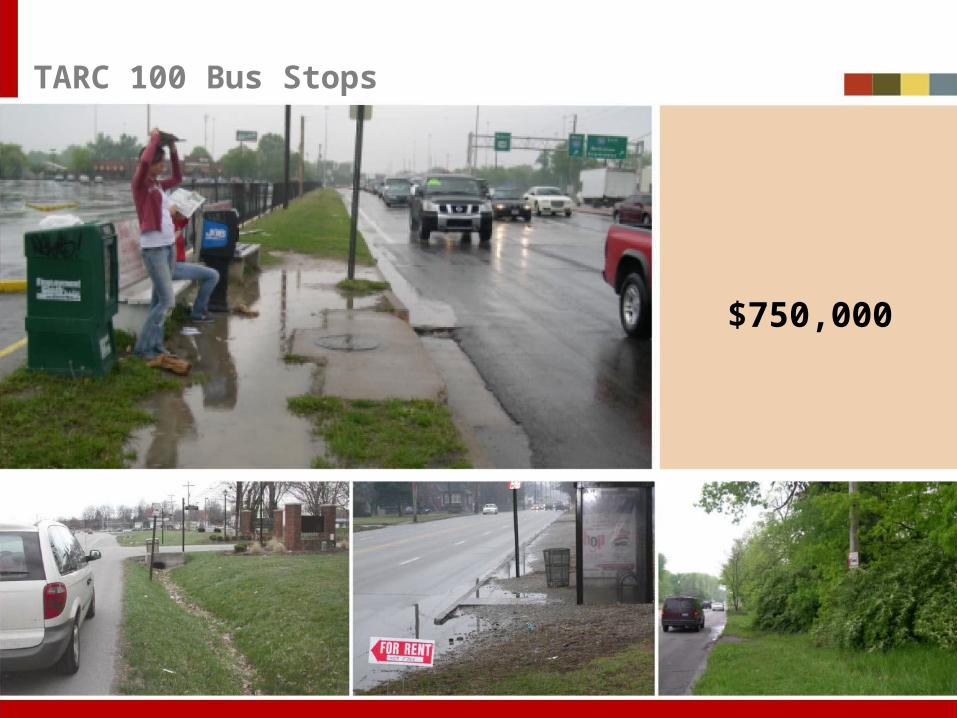
TARC 100 Bus Stops
$750,000

Faces of Public Transportation
“I’m very active. I believe that whatever you can do for yourself you should. But finding wheelchair transportation to keep these commitments is really hard.”
--Cathy Edwards
“I have always led a very active life and when I began to lose my sight I became concerned I would not be able to continue all my activities. I am so grateful to be able to contribute to the community and for WHEELS taking me.”
-- Bob Davis
“It drops me off right at my classes. It’s very quick and I don’t have to search for parking.”
--Chad Rimpsey

Federal Funds Management
Large Urban >200,000
Small Urban
50,000-199,999
Rural
<50,000
Allocated To Agencies To MPOs To State
Administered Federal State State

FY2002 Rank FY 2002
(per capita)
Illinois
Indiana
Tennessee
Ohio
W. Virginia
Kentucky
$737 million
$37 million
$26.4 million
$24.4 million
$2.1 million
$1.4 M
7th
15th
19th
23rd
29th
36th
$59.00
$6.00
$4.55
$1.96
$1.16
$0.34
Where Kentucky ranked in state funding (of 47 reporting – most recent year available)
