tanzania climate change strategy/media/tanzania/documents/environment/tanzania... · strategy will...
TRANSCRIPT
i
UNITED REPUBLIC OF TANZANIAVICE PRESIDENT’S OFFICE
NATIONAL CLIMATE CHANGE STRATEGY
2012
Division of Environment
ii
FOREWORD
Tanzania is vulnerable to the increased climate variability and climate change. The development of an effective strategic and institutional framework is crucial to enhance the country’s expertise, governance, technological and infrastructural capacities. Although some of the existing environmental planning in the context of the Environmental Management Act, 2004 addresses certain aspects of climate change, enhancement of climate change existing governance strategies and institutional arrangements is still required to address all aspects of climate change mitigation and adaptation. To address the challenge, the government has undertaken several efforts including undertaking a Quick Scan on the Impacts of Climate Change in 2009; preparation of the National Adaptation Programme of Action in 2007, CDM Guide for Investors in 2004 and the Initial National Communication to the UNFCCC in 2003. These have contributed to better understanding of the present and future impacts of climate change and possible opportunities. In this regard a need for a better institutional arrangement has been underscored. .
The National Climate Change Strategy therefore presents Tanzania with an opportunity to address climate change adaptation and participate in the global efforts to reduce GHG emissions in the context of sustainable development. The Strategy outlines initiatives to build a critical mass of climate change experts to address adaptation challenges and proactively exploit available opportunities to address both adaptation and mitigation, thereby enhancing Tanzania’s participation in the international climate change agenda.
This Strategy also reiterates Tanzania’s commitment to address climate change in consideration of the fact that the country is amongst the highly vulnerable group of countries globally. The challenge of climate change mitigation requires the commitment and participation of all countries. Under the auspices of the United Nations Framework Convention on Climate Change (UNFCCC), the United Republic of Tanzania will effectively participate provided there is adequate and sustained support.
The Strategy underscores the fact that, all countries have to play a role in addressing climate change consistent with their unique national circumstances. Tanzania will do its part, in particular by improving the energy availability to reduce deforestation, improve energy diversifi cation and effi ciency of her major energy consuming sectors, including, power generation, manufacturing, and transportation. Sustainable production and use of coal will remain central to ensuring the availability of affordable and reliable energy sources in the country.

iii
With over 33.5 million hectares of forestry reserves and sizable rural land under forest cover, Tanzania’s commitment to the conservation of its forests is timely, considering that these contribute to sustainable development and act as a sink of greenhouse gases produced elsewhere. The Strategy provides strategic interventions to ensure that the communities and the nation as a whole benefi t from such global services.
It’s my sincere hope that the Strategy will be useful in providing more insight to enable Tanzania to effectively adapt to climate change and participate in global efforts to mitigate climate change with a view to achieving sustainable development in line with the national efforts and development goals. I therefore call upon each and every of you to participate in implementing the National Climate Change Strategy. The Government is committed to effectively meet the objectives of the Strategy and engage to the international processes in order to support the implementation of same from the international context.
Dr. Terezya Luoga Huvisa (MP)MINISTER OF STATE
VICE PRESIDENT’S OFFICE (ENVIRONMENT)
iv
ACKNOWLEDGEMENT
The development of this National Climate Change Strategy has enlisted the assistance, participation and cooperation of various key stakeholders and experts in both the public and private sector and I would like to acknowledge their efforts.
It would be impossible to list all whose support and comments proved valuable in preparing this Strategy. However, I would like to take this opportunity to thank all the sectoral ministries, government departments, local government authorities, research and academic institutions, private sector, non-governmental organizations, civil society and other institutions for participating in the development of this Strategy. Their proactive commitment to contribute in one way or another in the collection of baseline information, participatory stakeholder consultations (formal and informal) and building a national consensus for this Strategy captures the national aspirations of the country to address the impacts of climate change.
Special recognition is extended to the team of experts Eng. L. Kyaruzi; P. Ndaki; E. Adam; C. Shengena; C. Msangi; Dr. L. Changá; Prof. R. Kangalawe; T.W. Massoy; Eng. T. Ngulika; Eng. P. Marwa; F. K. Manyika; P. Kisina; W. Mrema; A. Tillya; E. Kibona; J. Kubena; and A. Mapinduzi who worked diligently under R.S. Muyungi, the Assistant Director of Environment responsible for Environmental Assessment. The general guidance of the Director of Environment, Dr. Julius Ningu under the leadership of Eng. Ngosi C.X. Mwihava, the Deputy Permanent Secretary that has made this work possible is also highly appreciated. I also recognize and acknowledge contributions from other stakeholders and development partners at various stages during development of this Strategy. Finally, I wish to thank the Government of the Kingdom of Denmark, for fi nancing the development of this Strategy.
Sazi B. SalulaPERMANENT SECRETARY
VICE PRESIDENT’S OFFICE
v
EXECUTIVE SUMMARY
This Strategy has been developed in response to the growing concern of the negative impacts of climate change and climate variability on the country’s social, economic and physical environment. Its overall aim is to enhance the technical, institutional and individual capacity of the country to address the impacts of climate change. The Strategy covers adaptation, mitigation and cross-cutting interventions that will enable Tanzania the benefi t from the opportunities available to developing countries in their efforts to tackle climate change. These opportunities were recognized under the Copenhagen Accord, Cancun Agreement and Durban Platform for Enhanced Action, and they include technology transfer to developing countries under the proposed Technology Mechanism; opportunities offered by the Reducing Emissions from Deforestation and Forest Degradation Plus (REDD+) Mechanism; and fi nancing for both adaptation and mitigation activities under the proposed ‘Fast Start Climate Fund (of up to USD($) 30 billion in 2012), rising gradually to USD($) 100 billion annually by 2020 and last but not least, the Green Climate Fund, whose aim is to promote the paradigm shift towards low emission and climate resilient development pathways by providing support to developing countries to limit their greenhouse gas (GHG) emissions and adapt to the impacts of climate change.
Climate may change more rapidly than expected and is expected to have complex, long term consequences for the environment, and for our production systems. The adverse impacts of climate change are now far reaching and evident in most parts of the world. It is a serious risk to poverty reduction and threatens to undo decades of development efforts. The impacts are more pronounced in poor countries such as Tanzania with the least adaptive capacity.
The IPCC Fourth Assessment Report, 2007, confi rmed an increase of mean temperature of approximately 0.74oC and the sea level rise of about 17cm over the past 100 years. Further projections also provide that sea levels will continue to rise for at least another century due to thermal expansion, even if GHG concentrations could be reduced (Meehl et al., 2007). If GHG concentrations remain at the constant levels of the year 2000, global temperature is likely to rise from 0.3°C to 0.9°C per decade. Mitigation to climate change is therefore of paramount importance to limit adverse temperature increases. It is imperative that the public sector and all major stakeholders have a central role to plan, implement, enforce, monitor and evaluate the implication of climate change through strategic interventions, plans and programmes (Ehler, C.N., et al., 1997), to be implemented at national level.
vi
The development of this strategy responds to the above needs by ensuring that there is more coordination and complementarity between key economic sectors in implementing climate change activities. Moreover this Strategy makes it easier for the country to benefi t from global climate change mitigation and adaptation opportunities while contributing signifi cantly to the international community efforts to address climate change. International cooperation as a key tool in addressing climate change challenges at national and regional level. The approach and methodology employed in the development of this Strategy involved extensive literature review and analysis, which was undertaken to identify the linkages between climate change, natural resource management and socio-economic systems. This was augmented by national consultations with various stakeholders ranging from zonal workshops which were undertaken to collect and collate views from individuals at community level, create awareness on climate change impacts and the need for a Strategy to harmonize on-going and future activities. The fi ve zonal workshops were conducted in: Mtwara representing the Southern zone (31 January - 2 February 2011); Arusha representing the Northern zone (6 - 9 March 2011); Mwanza representing the Lake Zone 26 - 29 May 2011); and Mpanda representing the Western zone (20 - 21 June 2011). Additionally, the national stakeholder workshop held in January 2012 with representation from the private sector, public sector, development partners as well as the academia was undertaken to support the validation of the fi nal draft this Strategy.
A multidisciplinary team of experts was selected and worked closely with the National Climate Change Focal point, the Division of Environment, Vice President’s Offi ce (VPO) to prepare initial drafts of this Strategy. The team was drawn from various governmental ministerial departments and agencies (MDAs), research institutions, academia and civil society. The team also received, reviewed and integrated stakeholders’ views in the Strategy. The team of experts held a number of working sessions towards accomplishment of this document.
The goal of the Strategy is to enable Tanzania to effectively adapt to climate change and participate in global efforts to mitigate climate change with a view to achieving sustainable development in line with the Five Years National Development plan; the Tanzania Development Vision 2025, as well as national sectoral policies. It is expected that this Strategy will reduce vulnerability and enhance resilience to the impacts of climate change. The implementation of the Strategy will enable the country to put in place measures to adapt to climate change and mitigate GHG emissions in order to achieve sustainable national development through climate resilient pathways.
vii
The specifi c objectives of this Strategy are:
a) To build the capacity of Tanzania to adapt to climate change impacts.
b) To enhance resilience of ecosystems to the challenges posed by climate change.
c) To enable accessibility and utilization of the available climate change opportunities through implementation.
d) To enhance participation in climate change mitigation activities that lead to sustainable development.
e) To enhance public awareness on climate change.
f) To enhance information management on climate change.
g) To put in place a better institutional arrangement to adequately address climate change.
h) To mobilize resources including fi nance to adequately address climate change.
The Strategy is divided into four (4) chapters:
Chapter 1 (Introduction): This Chapter provides essential background information on climate change, including Tanzania’s actions to address climate change by ratifying the UNFCCC and the Kyoto Protocol, the supporting environmental management framework and the general existing national policies in relation to promotion of climate resilience and economic growth. It also contains a brief overview of global climate change interventions, opportunities and challenges, as well as provides rationale for the development of this Strategy, including the need to develop a comprehensive framework that takes into account the national adaptation and mitigation needs at all levels of development and a monitoring and evaluation framework to ensure the achievement of proposed strategic interventions. The development and implementation of this Strategy will contribute signifi cantly to the country’s efforts to adapt and mitigate to the impacts of climate change. Additionally, this Strategy provides a broader nationally based guidance on the integration of climate change activities into national development initiatives by establishing platforms for continued research and development (R&D) on climate change, as well as empowering the government to take appropriate measures to address climate change impacts by enforcing statutory requirements as stipulated in the Environmental Management Act, Chapter 191 of the Laws of Tanzania (EMA), among others.
viii
Chapter 2 (Country Situational Analysis): This Chapter provides the country’s situational analysis and profi le which includes geographical location, physical features and climatic conditions; social economic status of the country including summary performance of various sectors of the economy. It also contains relevant information on climate trends and projections (temperature and rainfall), which is demonstrate through the analysis of recent climatological data and observational evidence from local communities signalling the increased effects of climate variability and climate change. For instance, there has been observed increased temperature over the highland areas, as well as decreasing rainfall amounts and seasonal shifts in rainfall patterns in most parts of the country. The chapter contains information on time series analysis of both mean annual maximum and minimum temperature, which have revealed signifi cant increase in temperature trends in all meteorological stations across the country as depicted by temperature trends from a few randomly selected stations. It is demonstrated in this chapter that due to climate change, mean annual temperature for Tanzania is projected to increase by 1.7°C in North Eastern areas of the country and by 2.5°C in Western parts of the country. The frequency and severity of extreme climatic events in the last 40 years, notably drought and fl oods have been demonstrated and more than 70% of all natural disasters in Tanzania are hydro-meteorological, and are linked to droughts and fl oods. The environmental and ecological impacts of these on agriculture, livestock, wildlife, infrastructure, industry, human settlement and social services such as, energy and water are demonstrated.
The chapter further outlines climate change initiatives, both adaptation and mitigation being undertaken in Tanzania, which are implemented in line with national development initiatives geared towards reducing poverty and supporting sustainable economic development at a national and community level. The linkage between this Strategy and other important national development initiatives is made. For instance the links with implementation of existing national policies including the National Environmental Policy 1997, EMA, Tanzania’s Vision 2025; the Millennium Development Goals (MDGs); the National Strategy for Growth and Reduction of Poverty II (MKUKUTA II); Tanzania Five Years Plan (2011-2015) is made. Tanzania’s Vision 2025, among other things, aims at attaining high quality livelihood for its people and development of a strong and competitive economy. Some of the strategies toward attaining these objectives are:
(i) Ensuring food self-suffi ciency and security;
(ii) Universal access to safe water;
ix
(iii) Eradicating abject poverty;
(iv) Reduction in infant and maternal mortality rates;
(v) Increasing economic growth rate by 8% per annum or more;
(vi) Attainment of macroeconomic stability; and
(vii) Provision adequate physical and social infrastructure.
Climate change governance is undertaken within the context of the National Environmental Policy of 1997 and the EMA and other related policies and legislations.
Chapter 3 (The Climate Change Strategy): This Chapter contains the goal, objectives and scope of this Strategy. It details the strategic adaptation, mitigation and cross- cutting interventions in key economic sectors. Adaptation is emphasized as the highest priority for Tanzania being an Least Developed Country (LDC). Adaptation strategies identifi ed in this section are built on and extend beyond National Programme of Adaptation to climate change (NAPA) as they have been prepared in a strategic approach that covers key sectors of social-economic growth of the country. The overall objective of this Strategy is to enable Tanzania to effectively adapt to climate change and participate in global efforts to mitigate climate change with a view to achieving sustainable development in the context of the Tanzania Development Vision 2025, Five Years National Development plan, as well as national cross sectoral policies in line with established international climate change agenda.
Although the country is not obliged to reduce GHG emissions, since it has minimal contribution to global GHG concentrations, this Strategy establishes a case for achieving sustainable development while participating in mitigation initiatives, such as the Clean Development Mechanism (CDM), Nationally Appropriate Mitigation Actions (NAMAs), REDD+, and other carbon markets or trading activities.
This Strategy has identifi ed the need to build the capacity of key economic sectors and relevant institutions to address climate change adaptation and mitigation. Cross-cutting issues, including the establishment and implementation of awareness creation programmes to sensitize the public on climate change impacts, as well as adaptation and mitigation options; establishment of adequate research capacity for various R&D and training institutions to address issues related to climate change; building suffi cient capacities of social facilities to address climate change related health risks; supporting acquisition of appropriate disaster risk management technologies (for example, enhancing
x
early warning systems and weather forecasting systems); and promoting effective documentation of indigenous knowledge on climate change adaptation and mitigation in diverse sectors.
Chapter 4 (Implementation Arrangements): This Chapter outlines the implementation arrangements required to effectively implement this Strategy. The National Climate Change Technical Committee (NCCTC) and National Climate Change Steering Committee (NCCSC) will guide the coordination and implementation of this Strategy. The NCCTC shall provide technical advice to the National Climate Change Focal Point (NCCFP), while the NCCSC shall provide policy guidance and ensure coordination of actions as well as cross sectoral participation.
Notably, the Strategy will follow the government fi nancial management guidelines and systems established under the Ministry of Finance to ensure effective resource and fi nancial mobilisation. However, special arrangement will be made to cope with emerging complexity in accessing additional fi nancial support for addressing climate change. Although the actual cost of implementing this Strategy has not been established, the key determinant in estimating the cost of climate change impacts can be indirectly derived from the climate change interventions outlined, that is, adaptation mitigation, capacity building and cross-cutting interventions. Without an accurate and static future scenario, it is diffi cult to cost the necessary strategic actions needed to address climatic changes. This challenge is demonstrated by a UNFCCC report that provides a range as opposed to specifi c numbers that estimate the additional funding needed for adaptation by 2030. The report projects a need equivalent to between USD ($) 49 to 171 billion per annum globally (UNFCCC, 2007)1.
Moreover a recent study2 estimates that the cost of building adaptive capacity and enhancing resilience against future climate change in Tanzania is USD ($) 100 to 150 million per year. The Stockholm Environment Institute report3 projects that an that additional USD ($) 500 million per year (but probably more) is required to address current climate risks, in reducing future impacts and building resilience to future climate change. The report further states that aggregate models indicate that net economic costs could be equivalent to a further 1 to 2 % of GDP per year by 2030. With such uncertainty, it is diffi cult to arrive at a defi nitive cost of executing this Strategy.
1 UNFCCC (2007), Investment and Financial Flows to Address Climate Change, Climate Change Secretariat, Bonn2 SEI 2010: The Economics of Climate Change in the United Republic of Tanzania3 SEI 2010: The Economics of Climate Change in the United Republic of Tanzania
xi
A less inaccurate formula for arriving at the cost of implementing the action plan of this Strategy is to estimate the cost of climate change interventions outlined herein for each sector, together with on-going programmes. This will involve:
i. Rating line activities based on sensitivity to climate change impacts on a four point scale (that is, no impact; low impact; medium impact and high impact);
ii. Estimating a climate mark-up factor for each rating;
iii. Applying the climate mark-up factor to each line budget item and;
iv. Escalating annual cost to account for infl ation.
The climate mark-up indices are comparable to those used in the UNFCCC report on investment and fi nancial fl ows to address climate change. No impact, low-impact, medium-impact and high-impact correspond to a mark-up of 0%, 5%, 10% and 15% respectively. Additionally, the United States average infl ation rate of 2%4 can be used to escalate the subsequent annual estimates after the base year since the indicative budget estimates are in US dollars terms, or if the costs are in Tanzania shillings (TShs) the prevailing infl ation rate in the country will be used.
The Strategy will follow government standard monitoring and evaluation processes and procedures. The monitoring plan has been designed to ensure that the Vice President’s Offi ce in conjunction with other key stakeholders are empowered to monitor this Strategy at three levels:
(i) Input; (ii) Process; and (iii) Output.
At the input level VPO will focus on determination of the cost effectiveness of the activities, projects and programmes to be undertaken. This is will be undertaken through review of reports periodically submitted by sectors programmes and projects to the VPO. At the process level VPO shall review and analyse the success of climate change mainstreaming in existing and planned activities which have been and/or are about to be implemented within the given time frame in the country through key economic sectors. The output level shall be determined by the achievement of the interventions and actions in the direction of the desired results.
4 US Federal Reserve System (2012), Historical data, US Annual Infl ation available at http://www.federalreserve.gov/econresdata/statisticsdata.htm
xii
TABLE OF CONTENTS
FOREWORD...................................................................... ii
ACKNOWLEDGEMENT.................................................... iv
EXECUTIVE SUMMARY.................................................... v
LIST OF TABLES............................................................... xiv
LIST OF FIGURES............................................................. xv
ACROYNYMS.................................................................... xvi
1.0 INTRODUCTION................................................................ 1
1.1 Background........................................................................ 1
1.2 Rationale for the Climate Change Strategy........................ 6
1.3 Methodology....................................................................... 6
2.0 COUNTRY SITUATIONAL ANALYSIS............................... 9
2.1 Country Profi le.................................................................... 9
2.1.1 Geographical Location........................................................ 9
2.1.2 Main Physical features........................................................ 10
2.1.3 Climatic Condition............................................................... 10
2.1.4 Natural Resources and economic activities........................ 12
2.1.5 Population Dynamics.......................................................... 20
2.1.6 Economic........................................................................... 21
2.2 Climate Trends and Projections.......................................... 22
2.2.1 Temperature....................................................................... 23
2.2.2 Rainfall............................................................................... 24
2.3 Impacts, Risks and Vulnerabilities of Climate Change....... 25
2.3.1 Impacts of Climate Change................................................ 25
2.3.2 Vulnerability........................................................................ 45
2.4 Climate Change Initiatives and Governance...................... 46
2.4.1 Climate Change Initiatives.................................................. 46
xiii
2.4.2 Legal and Institutional Framework...................................... 50
3.0 THE CLIMATE CHANGE STRATEGY............................... 52
3.1 Goal.................................................................................... 52
3.2 Objectives.......................................................................... 52
3.3 Scope.................................................................................. 52
3.4 Strategic Interventions........................................................ 53
3.4.1 Adaptation strategies.......................................................... 53
3.4.2 Mitigation strategies............................................................ 63
3.4.3 Strategies on Cross-Cutting Issues.................................... 68
4.0 IMPLEMENTATION ARRANGEMENTS............................ 76
4.1 Implementation Plan.......................................................... 76
4.1.1 Coordination....................................................................... 77
4.1.2 Information and Communication Arrangement................... 77
4.1.3 Reporting Arrangements..................................................... 78
4.2 Financing Climate Change................................................. 78
4.2.1 Financing Plan................................................................... 78
4.2.2 Estimating the Cost of Climate Interventions...................... 79
4.2.3 International Funds............................................................. 80
4.2.4 Multilateral Agreement Funds............................................. 83
4.2.5 National Funds.................................................................... 844.3 Monitoring and Evaluation Framework............................... 84
4.3.1 Monitoring plan................................................................... 84
4.3.2 Evaluation plan................................................................... 85
REFERENCES................................................................... 86
ANNEXES.......................................................................... 90
Agro-ecological zones of Tanzania..................................... 90
xiv
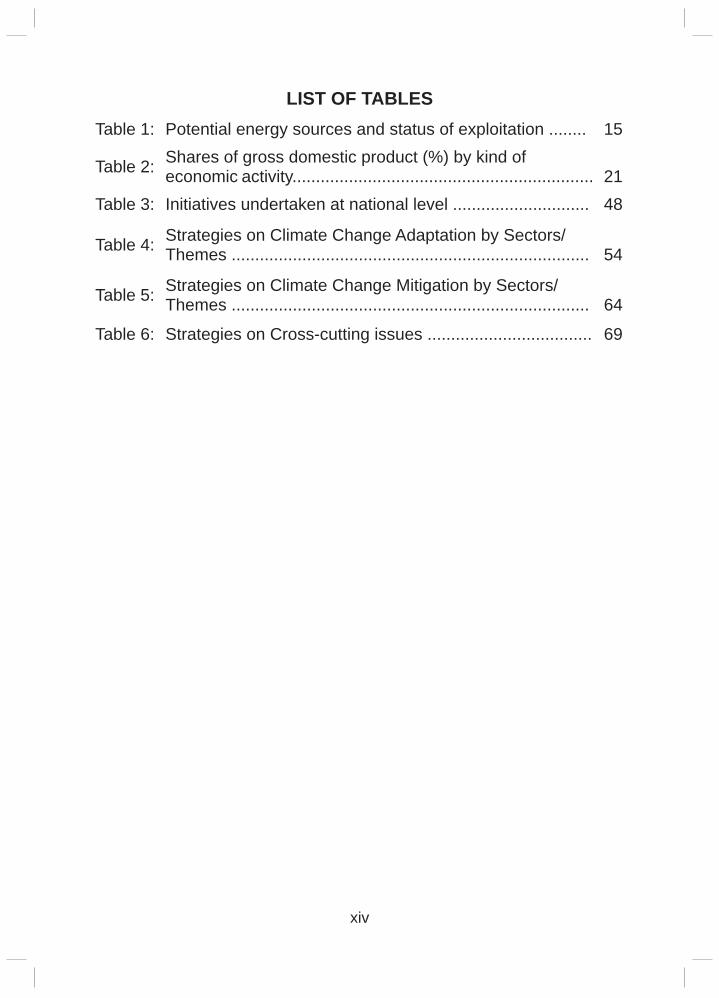
LIST OF TABLESTable 1: Potential energy sources and status of exploitation ........ 15
Table 2: Shares of gross domestic product (%) by kind of economic activity................................................................ 21
Table 3: Initiatives undertaken at national level ............................. 48
Table 4: Strategies on Climate Change Adaptation by Sectors/Themes ............................................................................ 54
Table 5: Strategies on Climate Change Mitigation by Sectors/Themes ............................................................................ 64
Table 6: Strategies on Cross-cutting issues ................................... 69
xv
LIST OF FIGURES
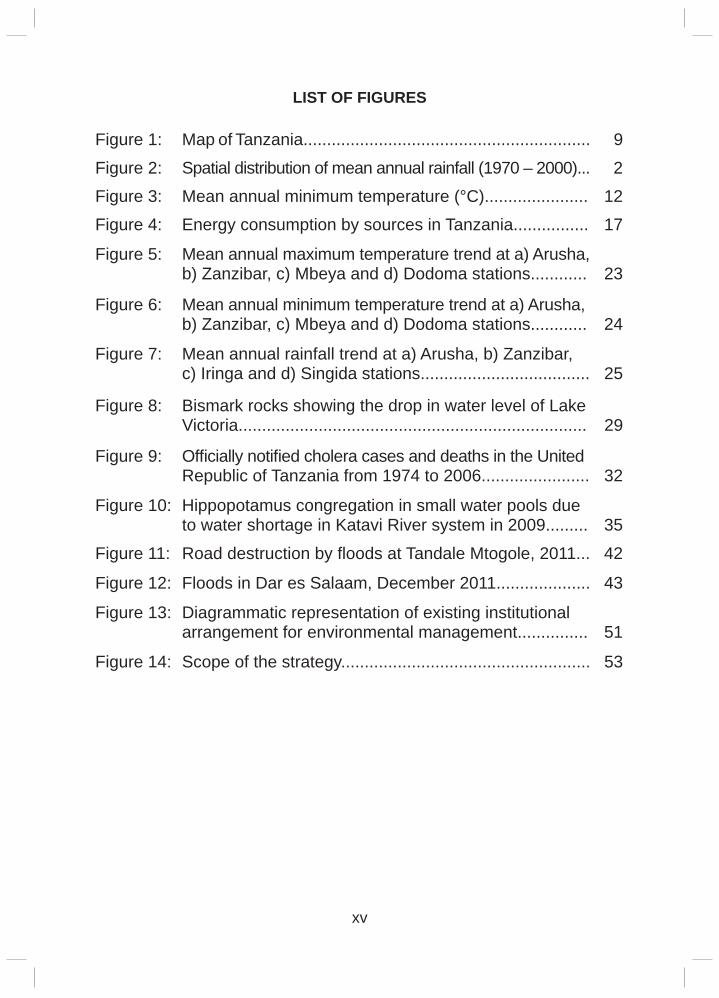
Figure 1: Map of Tanzania............................................................. 9
Figure 2: Spatial distribution of mean annual rainfall (1970 – 2000)... 2
Figure 3: Mean annual minimum temperature (°C)...................... 12
Figure 4: Energy consumption by sources in Tanzania................ 17
Figure 5: Mean annual maximum temperature trend at a) Arusha, b) Zanzibar, c) Mbeya and d) Dodoma stations............ 23
Figure 6: Mean annual minimum temperature trend at a) Arusha, b) Zanzibar, c) Mbeya and d) Dodoma stations............ 24
Figure 7: Mean annual rainfall trend at a) Arusha, b) Zanzibar, c) Iringa and d) Singida stations.................................... 25
Figure 8: Bismark rocks showing the drop in water level of Lake Victoria.......................................................................... 29
Figure 9: Offi cially notifi ed cholera cases and deaths in the United Republic of Tanzania from 1974 to 2006....................... 32
Figure 10: Hippopotamus congregation in small water pools due to water shortage in Katavi River system in 2009......... 35
Figure 11: Road destruction by fl oods at Tandale Mtogole, 2011... 42
Figure 12: Floods in Dar es Salaam, December 2011.................... 43
Figure 13: Diagrammatic representation of existing institutional arrangement for environmental management............... 51
Figure 14: Scope of the strategy..................................................... 53
xvi
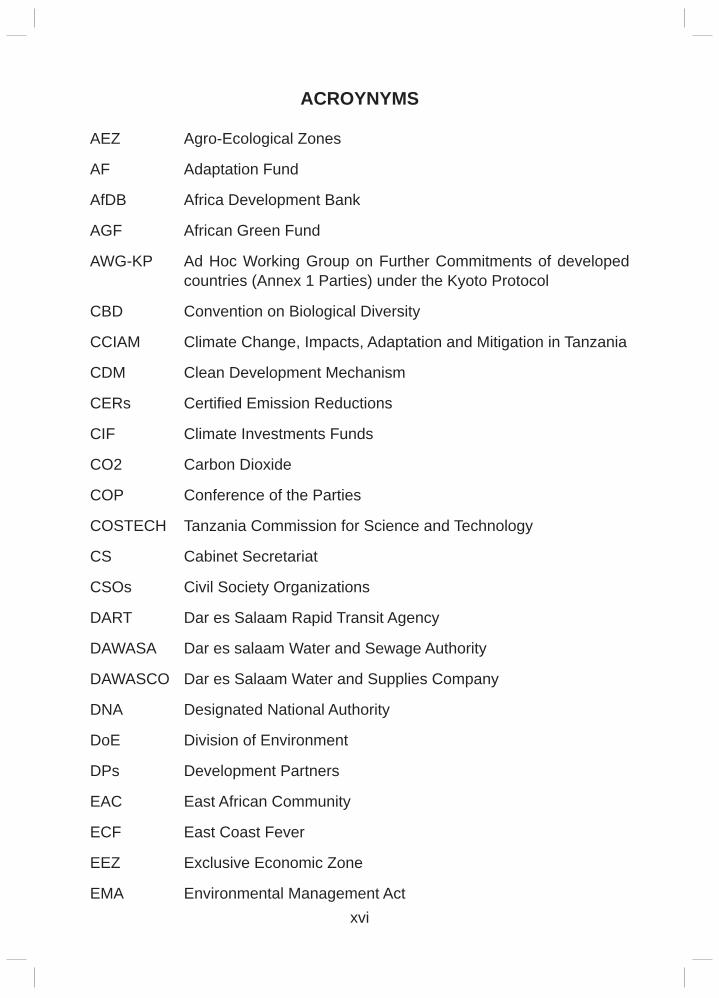
ACROYNYMS
AEZ Agro-Ecological Zones
AF Adaptation Fund
AfDB Africa Development Bank
AGF African Green Fund
AWG-KP Ad Hoc Working Group on Further Commitments of developed countries (Annex 1 Parties) under the Kyoto Protocol
CBD Convention on Biological Diversity
CCIAM Climate Change, Impacts, Adaptation and Mitigation in Tanzania
CDM Clean Development Mechanism
CERs Certifi ed Emission Reductions
CIF Climate Investments Funds
CO2 Carbon Dioxide
COP Conference of the Parties
COSTECH Tanzania Commission for Science and Technology
CS Cabinet Secretariat
CSOs Civil Society Organizations
DART Dar es Salaam Rapid Transit Agency
DAWASA Dar es salaam Water and Sewage Authority
DAWASCO Dar es Salaam Water and Supplies Company
DNA Designated National Authority
DoE Division of Environment
DPs Development Partners
EAC East African Community
ECF East Coast Fever
EEZ Exclusive Economic Zone
EMA Environmental Management Act
xvii
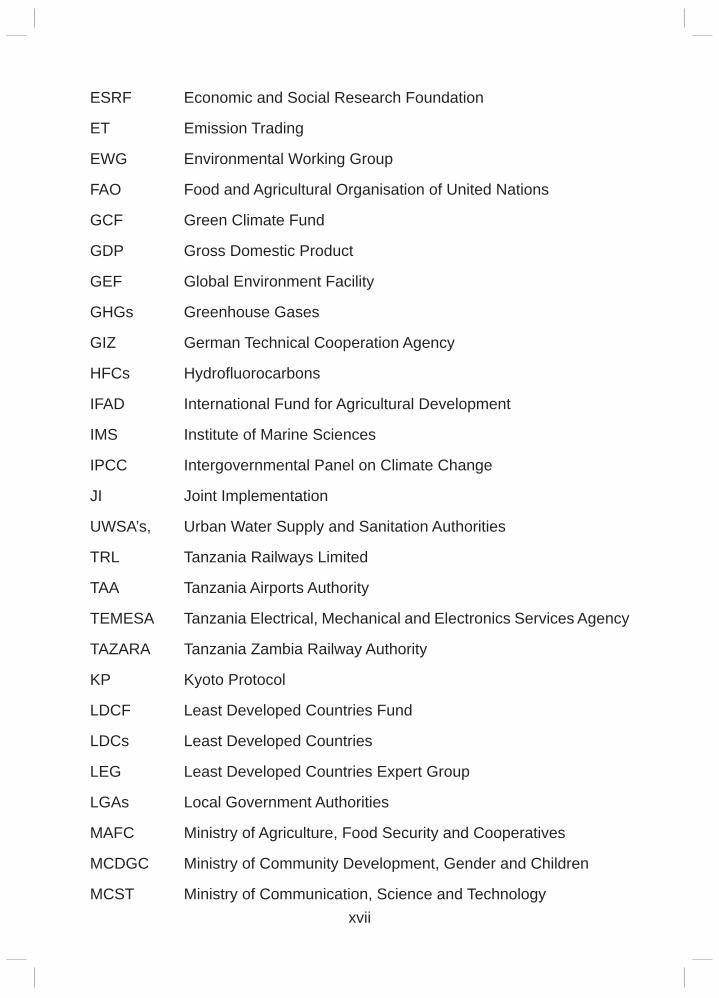
ESRF Economic and Social Research Foundation
ET Emission Trading
EWG Environmental Working Group
FAO Food and Agricultural Organisation of United Nations
GCF Green Climate Fund
GDP Gross Domestic Product
GEF Global Environment Facility
GHGs Greenhouse Gases
GIZ German Technical Cooperation Agency
HFCs Hydrofl uorocarbons
IFAD International Fund for Agricultural Development
IMS Institute of Marine Sciences
IPCC Intergovernmental Panel on Climate Change
JI Joint Implementation
UWSA’s, Urban Water Supply and Sanitation Authorities
TRL Tanzania Railways Limited
TAA Tanzania Airports Authority
TEMESA Tanzania Electrical, Mechanical and Electronics Services Agency
TAZARA Tanzania Zambia Railway Authority
KP Kyoto Protocol
LDCF Least Developed Countries Fund
LDCs Least Developed Countries
LEG Least Developed Countries Expert Group
LGAs Local Government Authorities
MAFC Ministry of Agriculture, Food Security and Cooperatives
MCDGC Ministry of Community Development, Gender and Children
MCST Ministry of Communication, Science and Technology
xviii
MDAs Ministries, Departments and Agencies
MDB Multilateral Development Banks
MDGs Millennium Development Goals
MEM Ministry of Energy and Minerals
MFAIC Ministry of Foreign Affairs and International Cooperation
MIT Ministry of Industry and Trade
MKUKUTA II Mkakati wa Pili wa Kukuza Uchumi na Kuondoa Umaskini Tanzania
MLFD Ministry of Livestock and Fisheries Development
MLHHSD Ministry of Lands, Housing and Human Settlements Development
MNRT Ministry of Natural Resources and Tourism
MoEVT Ministry of Education and Vocational Training
MOF Ministry of Finance
MOHSW Ministry of Health and Social Welfare
MOT Ministry of Transport
MoW Ministry of Water
MTEF Medium Term Expenditure Framework
N2O Nitrous Oxide
NAMAs Nationally Appropriate Mitigation Actions
NAPA National Adaptation Programme of Action
NAPs National Adaptation Plans
NCCFP National Climate Change Focal Point
NCCS National Climate Change Strategy
NCCSC National Climate Change Steering Committee
NCCTC National Climate Change Technical Committee
NCF National Climate Change Fund
NDC National Development Cooperation
xix
NEMC National Environment Management Council
NF3 Nitrogen trifl uoride
NFP National Forest Programme
NFRA National Food Reserve Agency
NHC National Housing Corporation
NIMR National Institute for Medical Research
NSGRP II Second National Strategy for Growth and Reduction of Poverty
PAF Performance Assessment Framework
PES Payment for Ecosystem Services
PMO Prime Minister’s Offi ce
PMO-RALG Prime Minister’s Offi ce-Regional Administration and Local Government
PO President’s Offi ce
POPs Persistent Organic Pollutants
PPP Public Private Partnership
PS Private Sector
RAHCO` Reli Assets Holding Company
R&D Research and Development
REA Rural Energy Agency
REDD Reduced Emissions from Deforestation and Forest Degradation
REPOA Research on Poverty Alleviation
SCCF Special Climate Change Fund
SF Special Fund
SF6 sulphur hexafl uoride
SSA Sub-Saharan Africa
SUA Sokoine University of Agriculture
SUMATRA Surface and Marine Transport Regulatory Authority
xx
TAA Tanzania Airports Authority
TANAPA Tanzania National Parks
TANESCO Tanzania Electricity Supply Company
TANROADS Tanzania Roads Agency
TBS Tanzania Bureau of Standards
TFDA Tanzania Food and Drugs Agency
TIC Tanzania Investment Centre
TIRDO Tanzania Industrial Research and Development Organisation
TMA Tanzania Meteorological Agency
TNA Technology Needs Assessment
TPA Tanzania Ports Authority
TPDF Tanzania people’s Defence Force
TRL Tanzania Railways Limited
UDSM University of Dar es Salaam
UNCCD United Nations Convention to Combat Desertifi cation
UNDP United Nations Development Programme
UNEP United Nations Environment Programme
UNFCCC United Nations Framework Convention on Climate Change
UNIDO United Nations Industrial Development Organization
URT United Republic of Tanzania
VETA Vocational Education and Training Authority
VPO Vice President’s Offi ce
WHO World Health Organization
WMO World Meteorological Organization
xxi
DEFINITION OF TERMS AND TERMINOLOGIES
Adaptation: Adaptation to global warming refers to actions aimed at coping with climatic changes that cannot be avoided and at reducing their negative effects. Adaptation measures include the prevention, tolerance or sharing of losses, changes in land use or activities, changes of location and restoration.
Adaptive capacity: The ability of a system to adjust to climate change (including climate variability and extremes) to moderate potential damages, to take advantage of opportunities, or to cope with the consequences.
Capacity building: Capacity building and capacity development for climate change refers to the development or strengthening of personnel skills, expertise, and relevant institutions and organisations to reduce GHG emissions and/or to reduce vulnerability and adapt to climate-related impacts.
Carbon markets/trading: An international market regime in which carbon emission reductions allowances or credits are bought and sold.
Clean Development Mechanism (CDM): As defi ned in Article 12 of the Kyoto Protocol, allows a country with an emission-reduction or emission-limitation and commitments under the Kyoto Protocol (Annex B Party) to implement an emission-reduction project in developing countries. Such projects can earn saleable certifi ed emission reduction (CER) credits, each equivalent to one metric ton of CO2, which can be counted towards meeting Kyoto targets. It is one of the three fl exible mechanisms under the Protocol (the others being Emissions Trading-ET, and Joint Implementation-JI).
Climate: Climate encompasses the statistics of meteorological conditions, that is, temperature, humidity, atmospheric pressure, wind, rainfall, atmospheric particle count and other meteorological elements in a given region over long periods of time (usually 30 years).
Climate change: A change of climate which is attributed directly or indirectly to human activity that alters the composition of the global atmosphere and which is in addition to natural climate variability observed over comparable time periods.
xxii
Climate variability: Variations in the mean state and other statistics (such as standard deviations, the occurrences of extremes, etc) of the climate on temporal and spatial scales beyond that of individual weather events. Variability may be due to natural internal processes within the climate system (internal variability), or to variations in natural or anthropogenic external forcing (external variability).
Conference of the Parties (COP): Is the “Supreme Body” of the Convention, that is, the highest decision making authority. It is a meeting of all the parties that have ratifi ed or acceded to the Convention.
Emissions: Means the release of greenhouse gases and/or their precursors into the atmosphere over a specifi ed area and period of time.
Global warming: The intensifi cation of the greenhouse effect, which results from anthropogenic actions, where the consequence is an increase in the concentration of greenhouse gases, aerosols and their predecessors in the atmosphere. These absorb and retain part of the infrared radiation emitted by the Earth’s surface, thus increasing the average temperature on the earth and causing adverse climatic phenomena.
Greenhouse gases (GHGs): Greenhouse gases are those gaseous constituents of the atmosphere, both natural and anthropogenic, that absorbs and re-emits infrared radiation. The Kyoto Protocol deals with six anthropogenic greenhouse gases, namely; carbon dioxide (CO2), methane (CH4), nitrous oxide (N2O), sulphur hexafl uoride (SF6) and two groups of gases: hydro fl uorocarbons (HFCs e.g. HFC-23), and perfl uorocarbons (e.g. CF4) and Nitrogen trifl uoride (NF3).
Intergovernmental Panel on Climate Change (IPCC): Is a body or institution formed jointly by the United Nations Environment Programme (UNEP) and the World Meteorological Organization (WMO) in 1988 to provide broad and balanced information about climate change.
Kyoto Protocol: The Kyoto Protocol is an international legally binding agreement linked to the United Nations Framework Convention on Climate Change. It was adopted at the 3rd Conference of the Parties to the UNFCCC in Kyoto, Japan.
xxiii
Mitigation: Mitigation refers to efforts that seek to prevent or slow down the increase of atmospheric GHG concentrations by limiting current and future emissions and enhancing potential sinks for greenhouse gases
National Adaptation Plans (NAPs): These are medium and long term national plans to enable LDCs and other developing countries adapt to climate change.
National Adaptation Programmes of Action (NAPAs): Is an initiative to enable Least Developed Countries (LDCs) identify priority activities that respond to their urgent and immediate needs to adapt to climate change
Nationally Appropriate Mitigation Actions (NAMAs): Refers to set of policies and actions undertaken by developing country Parties in the context of sustainable development, supported and enabled by technology, fi nancing and capacity-building, aimed at achieving a deviation in emissions relative to ‘business as usual’ emissions.
Reducing Emissions from Deforestation and Forest Degradation plus (REDD+): Is a mechanism that seeks to reduce emissions of GHGs from deforestation and forest degradation as well as to enhance forest carbon stocks. REDD+ currently operates under the voluntary carbon markets, but will likely be entrenched in a future climate change agreement under the UNFCCC.
Resilience: The ability of a system to adapt to climate change, whether by taking advantage of the opportunities, or by dealing with their consequences.
Sink: Any process or activity that removes greenhouse gases or aerosols and their precursors from the atmosphere (or that does not result into further emissions).
Sustainable development: Is development which meets the needs of current generations, without compromising the ability of the future generations to meet theirs.
Technology transfer: A broad set of processes covering the fl ows of know-how, experience and equipment for mitigating and adapting to climate change amongst different
xxiv
stakeholders such as governments, private sector entities, fi nancial institutions, non-governmental organisations and research/education institutions
United Nations Framework Convention on Climate Change (UNFCCC) ‘The Convention’: Is a non-binding global agreement on climate change, which sets an overall framework for intergovernmental efforts to tackle the challenge posed by climate change. It recognises that the climate system is a shared resource whose stability can be affected by industrial and other emissions of carbon dioxide and other greenhouse gases. It was adopted in Rio de Janeiro, Brazil in June 1992.
Vulnerability: The degree of susceptibility to the negative effects of climate change. It is a function of the type, magnitude and frequency of climate events to which a system is exposed to (exposure) as well as sensitivity and capacity for adaptation (adaptive capacity).
1
1. INTRODUCTION
This Strategy has been developed in response to the growing concern of the negative impacts of climate change and climate variability on the country’s social, economic and physical environment. Its overall aim is to enhance the technical, institutional and individual capacity of the country to address the impact of climate change. The Strategy covers adaptation, mitigation and cross-cutting interventions that will enable Tanzania to benefi t from the opportunities available to developing countries in their efforts to tackle climate change. These opportunities were recognized under the Copenhagen Accord, Cancun Agreement and Durban Platform for Enhanced Action, and they include technology transfer to developing countries under the proposed Technology Mechanism; opportunities offered by the Reducing Emissions from Deforestation and Forest Degradation Plus (REDD+) Mechanism; and fi nancing for both adaptation and mitigation activities under the proposed ‘Fast Start Climate Funding’ (of up to USD ($) 30 billion in 2012), rising gradually to USD ($) 100 billion annually by 2020, and last but not least, the Green Climate Fund, whose aim is to promote the paradigm shift towards low emission and climate resilient development pathways by providing support to developing countries to limit or reduce their greenhouse gas emissions and adapt to the impacts of climate change.
1.1 BackgroundIt is widely agreed by the global community that the world’s climate is changing and will continue to change at unprecedented rates. Climate change is increasingly becoming a global concern as it poses a challenge to sustainable livelihoods, economic development and global security. This concern is based on scientifi c fi ndings and observational evidence provided in existing United Nations reports, IPCC reports and other related documents on impacts of climate change. The Fourth Assessment Report of the Intergovernmental Panel on Climate Change (IPCC) shows an increase of global average air and ocean temperatures leading to wide spread melting of snow and ice, as well as rising global average sea level (IPCC, 2007; Norcia, 2008). The IPCC report also projects a further increase of mean temperatures to approximately 0.74oC and sea level increase at approximately 17cm.
Notably, the risks associated with climate change are already evident in various economic sectors essential for Tanzania’s livelihood and sustenance, including water resources, energy generation, food security, ecosystems/biodiversity and human health. In the most vulnerable communities, the impacts of climate change pose a direct threat to people’s survival. Climate change is already having signifi cant impacts in developing countries and will affect their ability
2
to achieve the Millennium Development Goals (MDGs) (IPCC, 2007; UNDP, 20085). Recent studies project that the frequency and intensity of extreme weather events will increase, causing severe socio-economic consequences particularly to the marginalised groups in society. Developing countries, such as Tanzania, are particularly vulnerable because of their high dependence on climate sensitive livelihood activities and low adaptive capacity.
Dealing with climate change is an economic necessity to avoid serious disruption to global and national socio-economic development. While adaptation is an overriding priority for developing countries like Tanzania, mitigation is also a concern. Economic assessments indicate that the cost of inaction will exceed the cost of taking early action (Stern, 20066). The participation of Tanzania in global efforts to mitigate climate change provides an opportunity for Tanzania to build climate resilience and promote sustainable economic growth. Recent development in climate change discussions, including the Cancun Agreement has shown that Nationally Appropriate Mitigation Actions (NAMAs) in developing countries are important contributions to global mitigation efforts, provided such actions are supported technologically, fi nancially and with appropriate capacity building.
Tanzania’s ratifi cation of the United Nations Framework Convention on Climate Change (UNFCCC) and Kyoto Protocol in 1996 and 2002 respectively, is a step towards ensuring that climate change issues are addressed at the national level. The ultimate objective of the UNFCCC is to achieve stabilization of GHG concentrations in the atmosphere at a level that would prevent dangerous anthropogenic interference with the climate system. To effectively meet the objectives of the UNFCCC, the international community subsequently adopted the Kyoto Protocol to provide legally binding emission reductions commitments for developed countries, in addition to those included in the UNFCCC. Owing to the high costs involved to reduce the emissions by developed countries domestically, three fl exible mechanisms were established under the Kyoto Protocol to assist the developed country parties to meet their commitments. The mechanisms are: (i) Emission Trading (ET); (ii) Clean Development Mechanism (CDM); and (iii) Joint Implementation (JI).
At a national level, the implementation of the UNFCCC and Protocol is further supported by the existing environmental frameworks in the country, namely
5 UNDP (2007). Human Development Report 2007/2008: Fighting climate change: human solidarity in a divided world. Palgrave Macmillan, New York.
6 Stern, N. (2006). What is the economics of climate change? World Economics 7(2): April-June 2006.
3
the National Environment Policy (1997) and the Environment Management Act No. 20 of 2004. Both environmental arrangements endeavour to maintain sustainable environmental coordination and natural resource management. Additionally, the implementation of the various adaptation and mitigation initiatives, programmes, strategies and plans (Table 3) demonstrates the national commitment in addressing the impacts of climate change. This Strategy will strengthen implementation of such climate change initiatives and enhance national contributions to the overall national socio-economic development agenda.
In subsequent Conference of Parties (COPs) various Working Groups were established to enhance the implementation of the UNFCCC. For example, COP 11 of UNFCCC held in Montreal, Canada in 2005 established an Ad Hoc Working Group on Further Commitments of developed countries (Annex I Parties) under the Kyoto Protocol (AWG-KP) on the basis of Article 3.9 of the Protocol, which mandated the consideration of Annex I Parties’ further commitments at least seven years before the end of the fi rst commitment period. In addition, during COP 13 held in Bali, Indonesia in 2007, established an Ad Hoc Working Group on Long-term Cooperative Actions on the implementation of the Convention (AWG–LCA) and mandated it to formulate an agreed outcome on how to enhance long-term cooperative actions after two years. Furthermore, in 2011 the Ad Hoc Working Group on the Durban Platform (ADP) for Enhanced Action was established to develop another legally binding instrument or an agreed outcome with legal force under the UNFCCC applicable to all Parties.
In the context of the UNFCCC and Kyoto Protocol, climate change at global level presents a number of opportunities including the following:
a) Transfer of technology through implementation of mitigation related activities, such as REDD+ CDM and NAMAs;
b) Financial support through available funding opportunities under the UNFCCC, Kyoto Protocol, as well as various other multilateral and bilateral arrangements;
c) Transformation of the energy sector through initiatives, such as NAMAs, which if implemented effectively can support adequate generation and availability of energy in the country;
d) Enhance national and local initiatives to conserve forests and biodiversity through programmes, such as REDD+ and NAMAs in the forest sector; and
4
e) Enhance international cooperation between sovereign countries and various organizations.
While the international community is proactively addressing climate change challenges pursuant to the UNFCCC agenda, a number of challenges remain unaddressed. These include increasing GHG emissions, limited access to fi nance, insuffi cient technology transfer and development, low adaptive capacity, inadequate institutional arrangement, poor information management and low level of climate change awareness.
Greenhouse gas increase:Despite having the Kyoto Protocol in place, GHGs emissions continue to increase and many developed countries have not adequately taken stringent measures to reduce emissions in line with scientifi c fi ndings and recommendations of the Protocol and related climate discussions.
Access to fi nance: For developing countries to address climate change challenges adequate fi nancial support is necessary. The international community however, has not been able to allocate and make available suffi cient fi nancial resources for this purpose. In addition, some of the resources are provided in the form of loans which adds more diffi culty to developing countries. Repayment of climate change related loans is diffi cult due to increasing global interest and infl ation rates, which is further compounded by climate change impacts affecting climate sensitive sectors which correspond to key economic development drivers.
Technology transfer and development: For countries like Tanzania to be able to adapt and undertake appropriate mitigation actions, accessing appropriate clean technologies is a prerequisite, however, there are barriers in such endeavours. Most of these technologies are very expensive to acquire and with restrictive intellectual property rights of ownership. It is important therefore, for the international community to remove such barriers and make such technologies readily available to LDCs to enable them to successfully address the impacts of climate change.
Adaptive capacity: Enhancing global adaptive capacity has been the most important area in addressing climate change. However the adaptive capacity of developing countries, including countries like Tanzania, remains a challenge. Adaptation to climate change requires various technical resources, such as clean technologies, fi nancial resources, expertise, as well as appropriate institutional arrangements to build an enabling environment for climate resilience.
5
Institutional arrangements: Addressing climate change should be undertaken with a long term perspective. This will enable Tanzania to build resilience and achieve sustainable development. The challenge is that there is an inadequate institutional arrangement to effectively address climate change. As a result there is a need to strengthen the existing national institutional frameworks to enhance the conducive environment for addressing long term climate change adaptation, resilience building and achieving sustainable development.
Low level of information and awareness: Although numerous efforts have been undertaken to raise awareness on climate change at global, regional and national levels, not every individual has suffi cient knowledge and information of the problem posed by climate change and the reactive/proactive measures required to address the problem. More efforts are still needed to enhance climate information sharing and raise the public awareness on climate change.
Climate change and security: While the challenges of climate change relate mainly to sustainable development, there is an emerging security dimension. The economic growth of developing countries, particularly LDCs, depend on climate sensitive sectors such as agriculture, livestock, forestry, water, tourism, transport, energy and health. The impacts of climate change shall adversely affect vulnerable sectors causing possible resources confl ict within countries, and across borders for transboundary resources. That said it is important for developing countries policy makers and experts at national level, to understand the climate change security dimension and the related geopolitics issues. The fi ndings of the IPCC demonstrate that even if by 2050 emissions would be reduced to below half of 1990 levels, a temperature rise of up to 2ºC above pre-industrial levels will be diffi cult to avoid. Such a temperature increase will pose serious security risks that would increase if global warming continues. Unmitigated climate change beyond 2ºC will lead to unprecedented sustainable development impacts and security concerns as it is likely to trigger a number of tipping points that would lead to further accelerated, irreversible and largely unpredictable climate changes. The measures to adapt to the unavoidable effects of climate variability need to work in conjunction with addressing national issues (due to increased resource confl ict) and international security threats (due to climatic geopolitics) created by climate change.
Climate change is best viewed as a threat multiplier which exacerbates existing trends, tensions and instability. The core challenge is that climate change threatens to overburden countries and areas which are already fragile and
6
confl ict prone such as pastoral-farmer interfaces. It is important to recognize that the risks are not just of a humanitarian nature; they also include political and security risks that directly affect the global geopolitics that could have infl uence national level interests. For example, the attainment of the MDGs for LDC countries like Tanzania would be at considerable risk, because the adverse effects of climate change could undermine years of national development efforts. There is also need to enhance capacity for approaches related to confl ict prevention, disaster crisis management and post- disaster confl ict reconstruction as it relates to climate change. Additionally LDC countries, such as Tanzania, should understand climate change geopolitics from a security perspective and strengthen the capacity of security systems in this regard.
1.2 Rationale for the Climate Change Strategy
The impacts of climate change are already being felt across the country and are projected to increase both in frequency and severity leading to severe socio-economic implications. Tanzania’ ability to address the current and projected impacts of climate change is strongly hindered by a number of climatic and non-climatic factors. Non-climatic factors include poverty, inadequate institutional arrangement, lack of adequate fi nancial resources, lack of suffi cient human resource and technological capacities, low awareness and lack of adequate climate change information management.
Notably, climatic factors such as incidences of sporadic extreme weather events and slow onset events are increasing in many parts of the country with severe consequences on food production, water access and energy generation. The recent food shortages resulting in widespread hunger, water scarcity and acute power shortages signify the vulnerability of the country to impacts of climate change. Analysis of climate change projection indicates that Tanzania will continue to face future development challenges as a result of increased climate variability and climatic changes.
That said the rationale for this Strategy is to provide an enabling mechanism that will enable the country to effectively address the impacts of climate change and support national adaptation as well as mitigation initiatives. The development of this Strategy is an important milestone for the country in providing a framework that will facilitate and harmonize national efforts to address climate change.
1.3 MethodologyThe process for the preparation of this Strategy commenced in 2008 when the VPO implemented the project to strengthen national capacity to adapt to the impacts of climate change. The process was performed in two phases, namely:
7
(i) Consultation with key stakeholders; and (ii) Work by multidisciplinary expert’s team.
The consultation phase included assessments of locally based climate change impacts conducted in six thematic areas in selected regions of Tanzania, including Zanzibar, and zonal consultative workshops. Assessments of locally based climate change impacts were undertaken in 2008/2009, in six thematic areas in selected regions of Tanzania, including Zanzibar (URT, 20097). The overall objective of these assessments was to reveal and document both the key locally based impacts of climate change and their cultural, socio-economic and environmental implications to the local communities and to the country as a whole. These assessments further sought to collect and consolidate pictorial and textural materials that could facilitate comparability of the past and present physical environment so as to reveal the magnitude of change where possible. The assessment addressed the impacts of climate change on health, coastal environment, water resources, crop and livestock production systems, animal and plant diseases and pests, and biodiversity. The assessments were undertaken using four main techniques: public meetings, fi eld observations, secondary data, focus group discussions and interviews with key informants at regional and district levels, selected institutions, and households in selected villages. Moreover, zonal workshops were used as dialogue sessions with stakeholders from the private and public sectors where initial ideas on the process of preparing the National Climate Change Strategy were collected and discussed. Five workshops were conducted between January and June 2011, in southern zone (31 January-2 February 2011) in Mtwara; northern zone (6-9 March 2011) in Arusha; Lake Zone 26-29 May 2011) in Mwanza; and western (20-21 June 2011) in Mpanda. Consultation on fi nal draft was also undertaken through a national stakeholder workshop held in January 2012 with representation from the private, public sector, NGOs/CBOs development partners as well as the academia.
The second phase involved formation of a multidisciplinary team of experts comprising of members from various government MDAs, research institutions, academia and selected NGOs with a special task of preparing this strategy. The team of experts working with the National Climate Change Focal point, held a number of working sessions towards accomplishment of the task. The team made use of the data and relevant information gathered during the preliminary assessment and zonal workshops. Furthermore a rigorous literature review was undertaken to identify key linkages between climate change and various natural and social systems and how such systems respond to climate change
7 United Republic of Tanzania – URT (2009). Climate Change Impacts Assessment Report - 2009. Vice President’s Offi ce - Division of Environment, Dar es Salaam
8
impacts. Literature on how other countries have prepared their strategies was also consulted.
The draft Strategy was then subjected for review by civil society organisations, private sectors, development partners and Climate Change Technical and Steering Committees, among others, through national stakeholder workshops. Relevant comments from all stakeholders were then incorporated in this Strategy.
9
2. COUNTRY SITUATIONAL ANALYSIS
2.1 Country Profi le
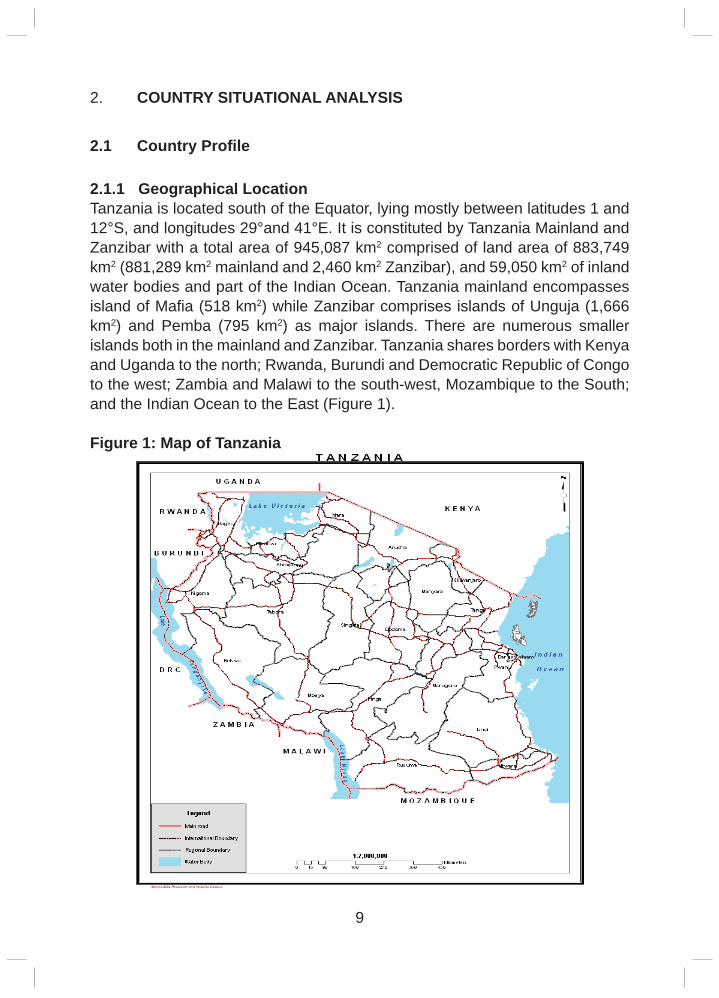
2.1.1 Geographical LocationTanzania is located south of the Equator, lying mostly between latitudes 1 and 12°S, and longitudes 29°and 41°E. It is constituted by Tanzania Mainland and Zanzibar with a total area of 945,087 km2 comprised of land area of 883,749 km2 (881,289 km2 mainland and 2,460 km2 Zanzibar), and 59,050 km2 of inland water bodies and part of the Indian Ocean. Tanzania mainland encompasses island of Mafi a (518 km2) while Zanzibar comprises islands of Unguja (1,666 km2) and Pemba (795 km2) as major islands. There are numerous smaller islands both in the mainland and Zanzibar. Tanzania shares borders with Kenya and Uganda to the north; Rwanda, Burundi and Democratic Republic of Congo to the west; Zambia and Malawi to the south-west, Mozambique to the South; and the Indian Ocean to the East (Figure 1).
Figure 1: Map of Tanzania
10
2.1.2 Main Physical features There is a wide variety of physical features extending from a narrow coastal belt of the western Indian Ocean with sandy beaches to an extensive plateau with altitude ranging from 1000 to 2000 meters above sea level. The plateau is fringed by narrow belts of highlands, including Mount Meru (4,566m), Mount Kilimanjaro (5,895m) the highest mountain in Africa, and other mountain ranges such as Livingstone, Kipengere, Udzungwa, Uluguru, Nguu, Usambara and Pare. Tanzania has several fresh water bodies, including Lake Victoria, the largest in Africa; Lake Tanganyika, the longest and deepest in Africa; and Lake Nyasa. The country also has many large rivers, draining into nine drainage basins. The major rivers include Rufi ji, Kagera, Mara, Ruaha, Pangani, Ruvuma and Malagarasi. The nine water basins are Wami-Ruvu, Pangani, Lake Victoria, Lake Nyasa, Lake Tanganyika, Lake Rukwa, Rufi ji, Ruvuma and the internal drainage basin around Singida.
Tanzania is also traversed by the spectacular Great Rift Valley system with two arms. The western arm in which Lake Nyasa, Tanganyika and Rukwa fall in runs along the western part of the country, while the eastern crosses in the central part with Lake Eyasi, Manyara and Natron in it. There are also other spectacular physical features including the diverse vegetation types such as extensive savannah and bushy vegetation that are fringed by narrow belts of forested highlands, the Itigi thickets, the Masai steppes, the miombo woodlands covering a greater part of the land area, and the mangrove systems along the coast. These ecosystems are famous habitats for diverse types of wildlife.
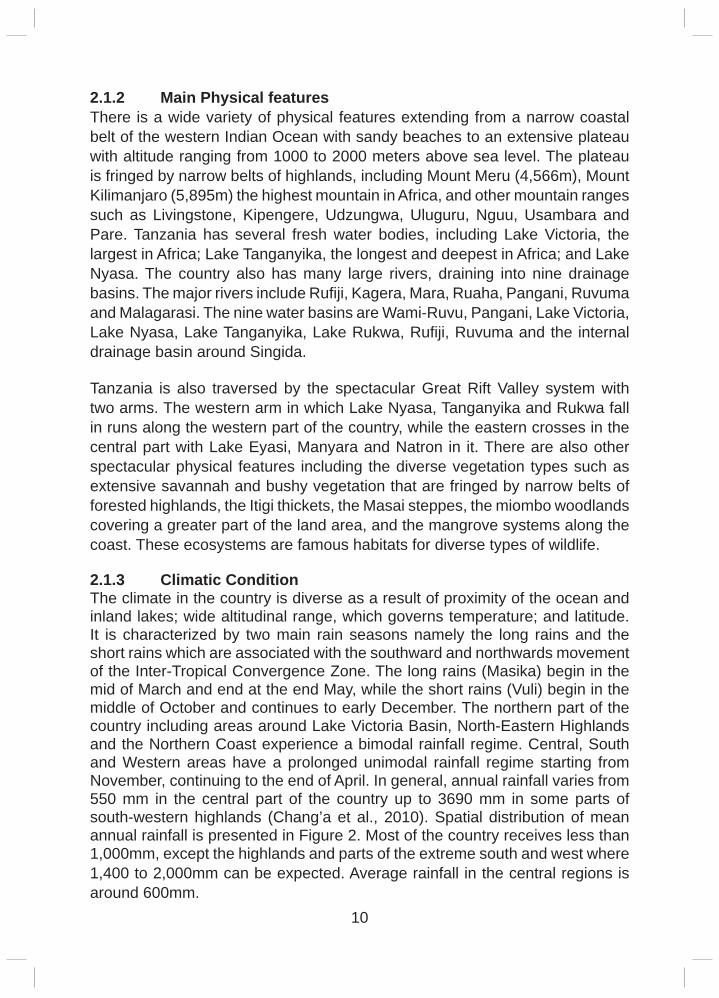
2.1.3 Climatic ConditionThe climate in the country is diverse as a result of proximity of the ocean and inland lakes; wide altitudinal range, which governs temperature; and latitude. It is characterized by two main rain seasons namely the long rains and the short rains which are associated with the southward and northwards movement of the Inter-Tropical Convergence Zone. The long rains (Masika) begin in the mid of March and end at the end May, while the short rains (Vuli) begin in the middle of October and continues to early December. The northern part of the country including areas around Lake Victoria Basin, North-Eastern Highlands and the Northern Coast experience a bimodal rainfall regime. Central, South and Western areas have a prolonged unimodal rainfall regime starting from November, continuing to the end of April. In general, annual rainfall varies from 550 mm in the central part of the country up to 3690 mm in some parts of south-western highlands (Chang’a et al., 2010). Spatial distribution of mean annual rainfall is presented in Figure 2. Most of the country receives less than 1,000mm, except the highlands and parts of the extreme south and west where 1,400 to 2,000mm can be expected. Average rainfall in the central regions is around 600mm.
11
Figure 2: Spatial distribution of mean annual rainfall (1970 – 2000)
30 31 32 33 34 35 36 37 38 39 40 41
12
10
8
6
4
2
Arusha
Bukoba
Dar es SalaamDodoma
Handeni
Iringa
Pemba
Kigoma
Kilimanjaro
MahengeMbeya
Morogoro
Moshi
Mtwara
Musoma
Mwanza
Pemba
Same
Shinyanga
Singida
Songea
Sumbawanga
Tabora Tanga
Zanzibar
S
E
Source: Technical Team 2012
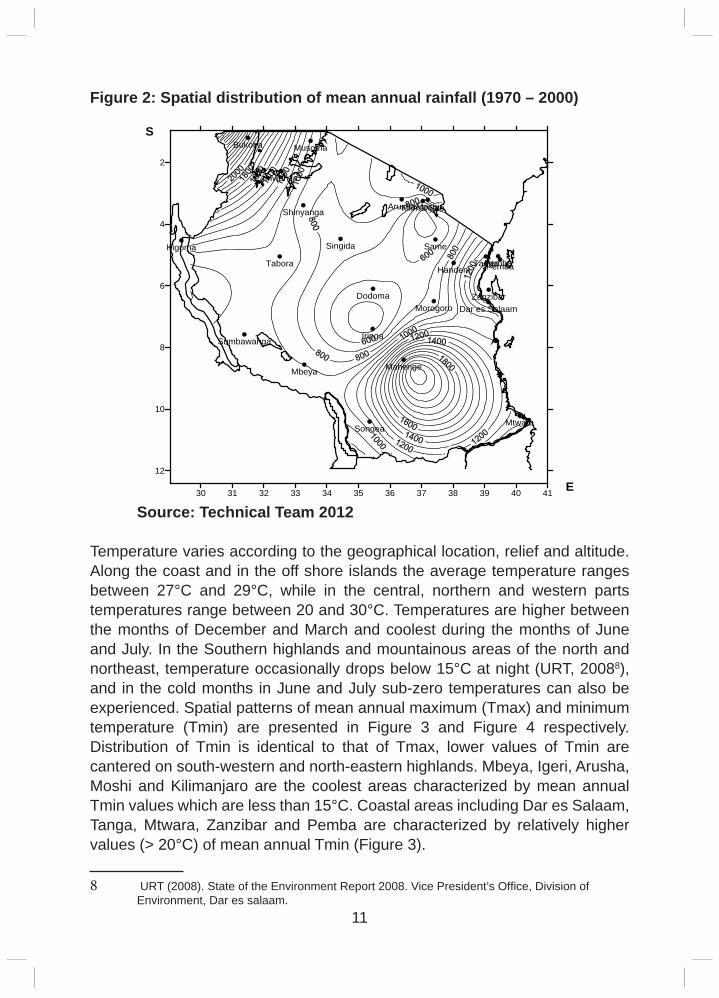
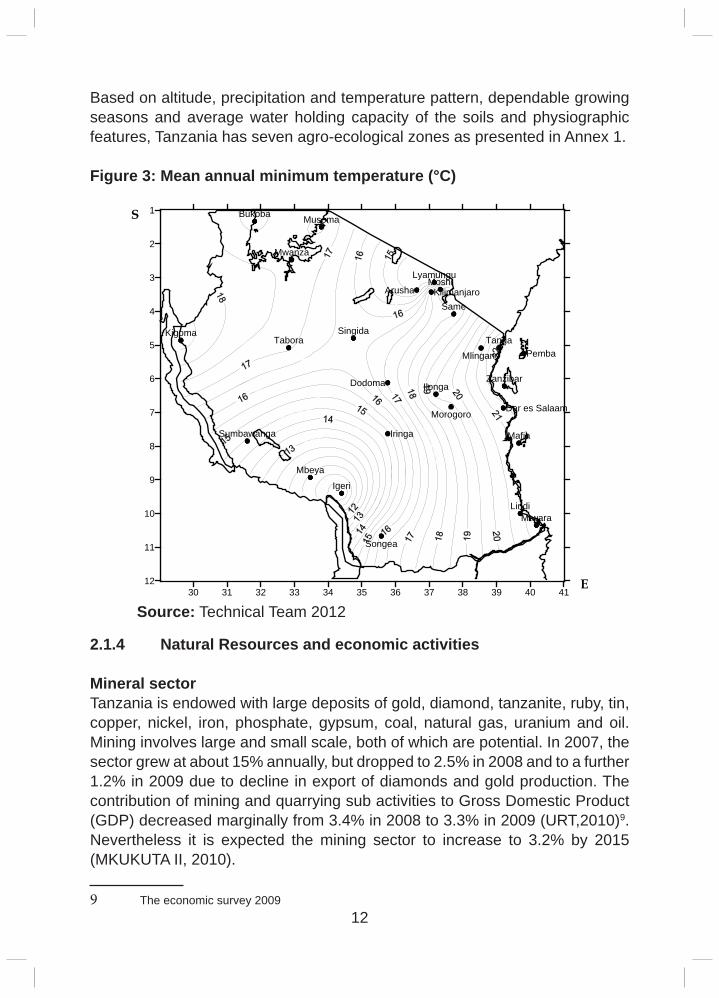
Temperature varies according to the geographical location, relief and altitude. Along the coast and in the off shore islands the average temperature ranges between 27°C and 29°C, while in the central, northern and western parts temperatures range between 20 and 30°C. Temperatures are higher between the months of December and March and coolest during the months of June and July. In the Southern highlands and mountainous areas of the north and northeast, temperature occasionally drops below 15°C at night (URT, 20088), and in the cold months in June and July sub-zero temperatures can also be experienced. Spatial patterns of mean annual maximum (Tmax) and minimum temperature (Tmin) are presented in Figure 3 and Figure 4 respectively. Distribution of Tmin is identical to that of Tmax, lower values of Tmin are cantered on south-western and north-eastern highlands. Mbeya, Igeri, Arusha, Moshi and Kilimanjaro are the coolest areas characterized by mean annual Tmin values which are less than 15°C. Coastal areas including Dar es Salaam, Tanga, Mtwara, Zanzibar and Pemba are characterized by relatively higher values (> 20°C) of mean annual Tmin (Figure 3).
8 URT (2008). State of the Environment Report 2008. Vice President’s Offi ce, Division of Environment, Dar es salaam.
12
Based on altitude, precipitation and temperature pattern, dependable growing seasons and average water holding capacity of the soils and physiographic features, Tanzania has seven agro-ecological zones as presented in Annex 1.
Figure 3: Mean annual minimum temperature (°C)
30 31 32 33 34 35 36 37 38 39 40 4112
11
10
9
8
7
6
5
4
3
2
1 Bukoba
Mwanza
Musoma
Moshi
Same
Igeri
Ilonga
Lyamungu
Tanga
Zanzibar
Mtwara
Tabora
Mbeya
Sumbawanga
Kigoma
Lindi
Mafia
Singida
Morogoro
Mlingano
Songea
Kilimanjaro
Pemba
Dar es Salaam
Iringa
Arusha
Dodoma
S
E
Source: Technical Team 2012
2.1.4 Natural Resources and economic activities
Mineral sectorTanzania is endowed with large deposits of gold, diamond, tanzanite, ruby, tin, copper, nickel, iron, phosphate, gypsum, coal, natural gas, uranium and oil. Mining involves large and small scale, both of which are potential. In 2007, the sector grew at about 15% annually, but dropped to 2.5% in 2008 and to a further 1.2% in 2009 due to decline in export of diamonds and gold production. The contribution of mining and quarrying sub activities to Gross Domestic Product (GDP) decreased marginally from 3.4% in 2008 to 3.3% in 2009 (URT,2010)9. Nevertheless it is expected the mining sector to increase to 3.2% by 2015 (MKUKUTA II, 2010).
9 The economic survey 2009
13
Forestry sector Tanzania has a total area of about 94.5 million hectares out of which 88.6 million hectares are covered by landmass and the rest is water bodies. The country has a total of 35.3 million hectares of forests out of which 16 million hectares comprise of reserve forests, 2 million hectares are forests in national parks and the rest, 17.3 million hectares (49% of all forestland), are unprotected forests in general land. This is one of the highest forest cover in the Eastern and Southern Africa. The forests contribution to the national GDP is estimated to be between 2.3% and 10% of the country’s total GDP. This contribution is underestimated because of unrecorded consumption of wood fuels, bee products, catchment and environmental values and other forest products10. The forest sector act as a carbon sink, absorbing all emissions produced at national level and more, making Tanzania a net sink of GHGs.
Wildlife sectorThe wildlife sector has an important contribution to the national development, mainly from activities of tourism such as photographic sceneries, wild animal hunting and licensing of trophy business. The sector is rapidly growing. For instance, in 2009, receipts from wildlife sector increased to TShs 23,575.7 million from TShs 18,387.4 million in 2008, equivalent to an increase of 22% (URT, 2010). This sector like other sectors of the economy is constrained by the impacts of climate change. Many species around the country are affected by the combined impacts of climate factors, anthropogenic factors such as the encroachment, land fragmentation and destruction of natural habitats. Such changes in natural habitats may alter wildlife distribution patterns, and compounded by climate change, such situation may increase confl ict for resources. This may be the case particularly amongst migratory species, which use a network of sites, and may constrain their ability to adapt to changes. Conversely, anthropogenic factors are likely to exacerbate the impacts of climate change on wildlife. For example, increased water abstraction for rice irrigation upstream Katuma River system has already contributed signifi cantly to water shortage for wild animals in Katavi National Park (Elisa at al., 201111). A similar experience is also reported for the Great Ruaha River ecosystem.
Wetlands Wetlands in Tanzania cover 10% of the total land area, of which 5.5% is presently for the four Ramsar sites. Among them include Malagarasi-Moyovosi (32,500 km²), Lake Natron Basin (2250 km²), Kilombero valley fl oodplain (7,950 km²) and Rufi ji-Mafi a-Kilwa (5,969.7 km²). Millions of people depend on wetlands for fi shing and related livelihood activities (Dixon, 2003; MNRT, 2003). They are also important ecosystems, which in their natural state play
10 See: http://www.tanzania.go.tz/naturalresources.html11 Elisa at al., 2011
14
an important role in the water cycle through numerous functions. By way of ground water recharge, wetlands and fi lter underground aquifers for potable water. The same would then move out of the aquifer to become surface water through Ground water discharge. Wetlands also store large volumes of rain water which subsequently run slowly into rivers. This diminishes the destructive effects of fl ooding downstream. As for coastal areas, wetland vegetation such as mangroves stabilizes shorelines by reducing the energy of waves, currents, or other erosive forces.
Agriculture and food security Agriculture is the mainstay of the Tanzanian economy contributing about 23.7% of GDP in the year 2011, 30.9% of export earnings and employs about 75% of the total labour force. Over the past decade, the agricultural sector grew at an average rate of 4.4%. The rate of growth in agriculture is higher than the average annual population growth rate of 2.9%, implying growth in incomes. However, the above average agricultural growth rate is insuffi cient to lead to signifi cant wealth creation and reduction of poverty given the very low level of agricultural development. Attaining poverty reduction would require an annual agricultural growth rate of about 10% (URT, 2009a12).
The agricultural sector comprises of crops and livestock sub sectors. Policy wise, the agricultural sector relates to crop production taking into account the synergies with other closely related policies like that of livestock, marketing and irrigation. On average, crop production contributes about 19.0% of GDP and grows at 4.1% (URT, 2008a13) while livestock production contributed about 5.9% of the GDP and grow at 4.3%. Food crop production is growing at a rate of about 2.8%, accounting for about 65% of agricultural GDP while cash crops account for about 10%. Maize is the most important crop accounting for over 20% of total GDP. Food and cash crops account for about 70% of rural incomes.
Tourism sectorTanzania’s tourism sector is among the sectors with great economic potential. The country has many tourist attractions that include 14 national parks and 31 game reserves with large herds of wildlife, such attractions, include Ngorongoro Conservation Area, as well as Serengeti and Ruaha National Parks - Tanzania’s largest national parks. Other tourist attractions include mountains, islands, beaches, historical sites, cultures and traditions, some of which are world heritage sites such as Mountain Kilimanjaro, the highest mountain in Africa
12 United Republic of Tanzania - URT (2009a). Climate change and agriculture policy brief. Vice President’s Offi ce, Division of Environment, Dar es Salaam13 United Republic of Tanzania - URT (2008a). Economic Survey, 2007. The Ministry of Finance and Economic Affairs, Dar es Salaam
15
while Kilwa Kisiwani, Songo Mnara and Zanzibar are among the most beautiful islands in the world. The sector contributes about 17.5% in GDP (MNRT, 2011). Notably tourism performance shows that the number of international visitors has increased from 501,669 in 2000 to 770,376 in 2008. Likewise, receipts accruing from international visitors have increased signifi cantly from USD ($) 376.1 million to USD ($)1,269.68 million within the same timeframe.
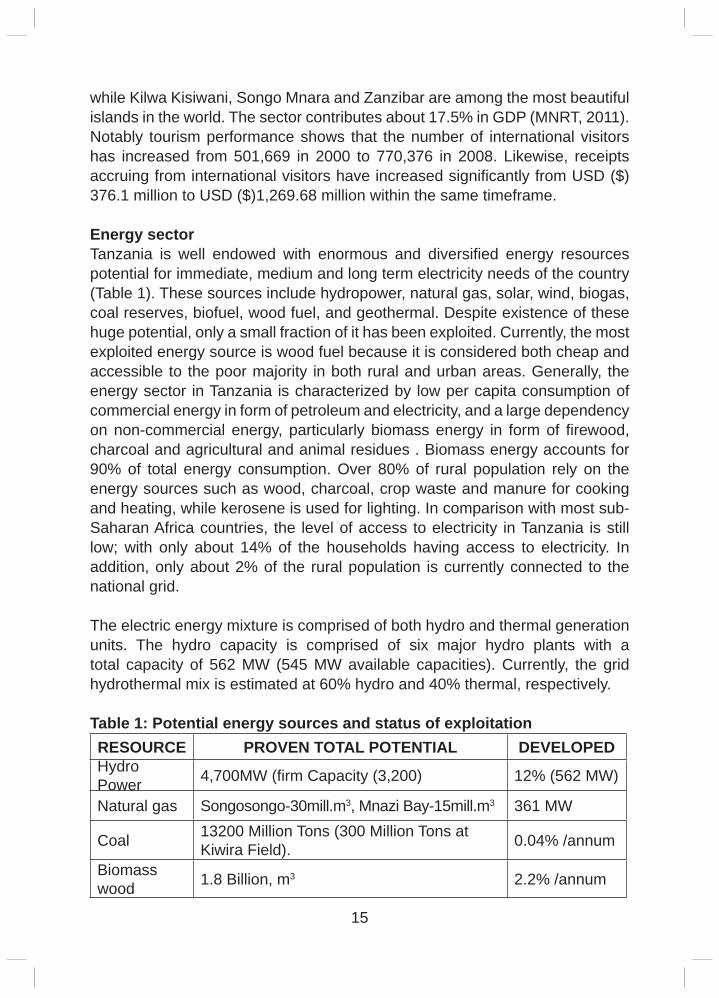
Energy sectorTanzania is well endowed with enormous and diversifi ed energy resources potential for immediate, medium and long term electricity needs of the country (Table 1). These sources include hydropower, natural gas, solar, wind, biogas, coal reserves, biofuel, wood fuel, and geothermal. Despite existence of these huge potential, only a small fraction of it has been exploited. Currently, the most exploited energy source is wood fuel because it is considered both cheap and accessible to the poor majority in both rural and urban areas. Generally, the energy sector in Tanzania is characterized by low per capita consumption of commercial energy in form of petroleum and electricity, and a large dependency on non-commercial energy, particularly biomass energy in form of fi rewood, charcoal and agricultural and animal residues . Biomass energy accounts for 90% of total energy consumption. Over 80% of rural population rely on the energy sources such as wood, charcoal, crop waste and manure for cooking and heating, while kerosene is used for lighting. In comparison with most sub-Saharan Africa countries, the level of access to electricity in Tanzania is still low; with only about 14% of the households having access to electricity. In addition, only about 2% of the rural population is currently connected to the national grid.
The electric energy mixture is comprised of both hydro and thermal generation units. The hydro capacity is comprised of six major hydro plants with a total capacity of 562 MW (545 MW available capacities). Currently, the grid hydrothermal mix is estimated at 60% hydro and 40% thermal, respectively.
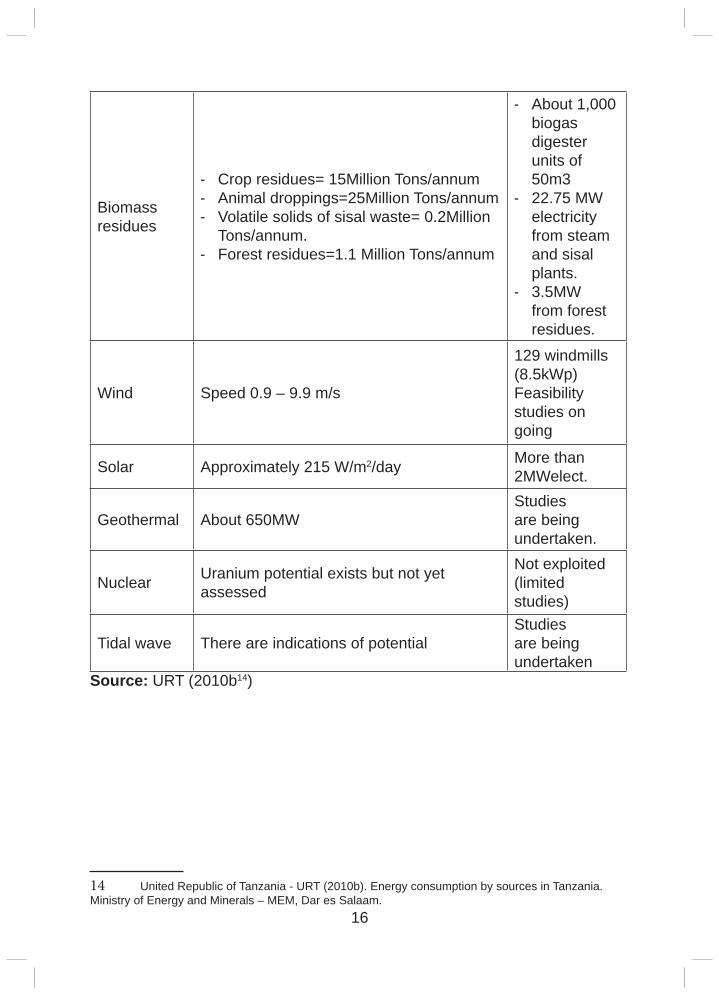
Table 1: Potential energy sources and status of exploitationRESOURCE PROVEN TOTAL POTENTIAL DEVELOPEDHydro Power 4,700MW (fi rm Capacity (3,200) 12% (562 MW)
Natural gas Songosongo-30mill.m3, Mnazi Bay-15mill.m3 361 MW
Coal 13200 Million Tons (300 Million Tons at Kiwira Field). 0.04% /annum
Biomass wood 1.8 Billion, m3 2.2% /annum
16
Biomass residues
- Crop residues= 15Million Tons/annum- Animal droppings=25Million Tons/annum- Volatile solids of sisal waste= 0.2Million
Tons/annum.- Forest residues=1.1 Million Tons/annum
- About 1,000 biogas digester units of 50m3
- 22.75 MW electricity from steam and sisal plants.
- 3.5MW from forest residues.
Wind Speed 0.9 – 9.9 m/s
129 windmills (8.5kWp)Feasibility studies on going
Solar Approximately 215 W/m2/day More than 2MWelect.
Geothermal About 650MWStudies are being undertaken.
Nuclear Uranium potential exists but not yet assessed
Not exploited (limited studies)
Tidal wave There are indications of potentialStudies are being undertaken
Source: URT (2010b14)
14 United Republic of Tanzania - URT (2010b). Energy consumption by sources in Tanzania. Ministry of Energy and Minerals – MEM, Dar es Salaam.
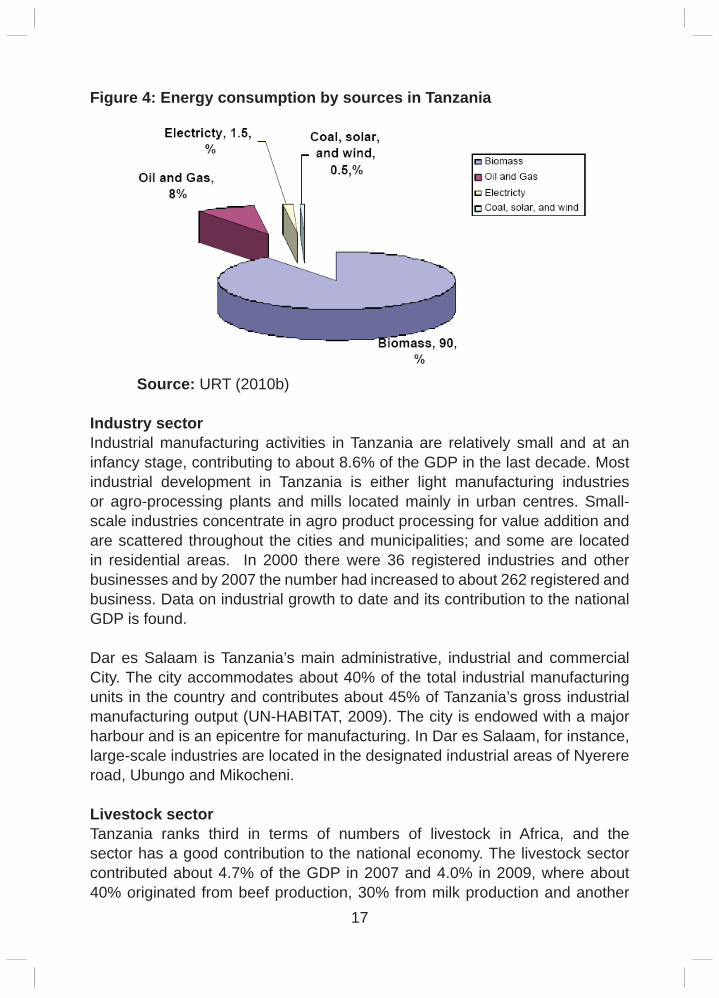
17
Figure 4: Energy consumption by sources in Tanzania
Source: URT (2010b)
Industry sectorIndustrial manufacturing activities in Tanzania are relatively small and at an infancy stage, contributing to about 8.6% of the GDP in the last decade. Most industrial development in Tanzania is either light manufacturing industries or agro-processing plants and mills located mainly in urban centres. Small-scale industries concentrate in agro product processing for value addition and are scattered throughout the cities and municipalities; and some are located in residential areas. In 2000 there were 36 registered industries and other businesses and by 2007 the number had increased to about 262 registered and business. Data on industrial growth to date and its contribution to the national GDP is found.
Dar es Salaam is Tanzania’s main administrative, industrial and commercial City. The city accommodates about 40% of the total industrial manufacturing units in the country and contributes about 45% of Tanzania’s gross industrial manufacturing output (UN-HABITAT, 2009). The city is endowed with a major harbour and is an epicentre for manufacturing. In Dar es Salaam, for instance, large-scale industries are located in the designated industrial areas of Nyerere road, Ubungo and Mikocheni.
Livestock sectorTanzania ranks third in terms of numbers of livestock in Africa, and the sector has a good contribution to the national economy. The livestock sector contributed about 4.7% of the GDP in 2007 and 4.0% in 2009, where about 40% originated from beef production, 30% from milk production and another
18
30% from poultry and small stock production (URT, 2009b, 2010a15). Tanzania is estimated to have about 18.5 million cattle, 13.1 million goats, 3.6 million sheep, 1.2 million pigs and 30 million local chickens (Ministry of Livestock Development and Fisheries, Statistical Year Book, 2005). Approximately 95% of ruminant livestock in Tanzania are kept under traditional production systems depending mostly on pastures and crop residues as the main feed resources. In this system, limited inputs such as feed additives, supplementary feeds are offered. This system produces about 93% of the milk and 99% of the meat consumed in the country.
Fisheries sectorMarine fi sheries contribute about 15% of the total fi sh production in the country with the rest coming from freshwater. The annual marine fi sh catches increased from 36,684 tonnes in 1993 to 44,838.2 tonnes in 2009, while the corresponding quantities for freshwaters were 294,782 and 299,729 tonnes in 1993 and 2009 respectively. The contribution of fi sheries both fresh water and marine to the GDP varied from 1.7% in 1998 to 1.4% in 2009 (URT, 2010a).
Infrastructure
Por tsTanzania Ports Authority (TPA) administers a diverse system of Tanzania’s mainland sea and inland water ways. The major sea ports are Dar es Salaam, Tanga and Mtwara while smaller sea ports are Kilwa, Lindi, Mafi a, Pangani; Bagamoyo and Mikindani. The lake ports are formally operated by the Marine Services Company Limited (MSCL) under TPA mandate and are situate on Lake Victoria, including Mwanza North and South Ports, Nansio, Kemondo Bay, Bukoba and Musoma; Lake Tanganyika, including Kigoma and Kasanga; and Lake Nyasa including Itungi Port, Manda Liuli and Mbamba Bay.
Railway NetworkTanzania Railway systems have a total track length of 3,676km out of which 2,701km are owned by Rail Asset Holding Company (RAHCO) and operated by Tanzania Railways Limited (TRL). The remaining 975km are operated by the Tanzania - Zambia Railway Authority (TAZARA) co-owned by the governments of Tanzania and Zambia. TAZARA network covers a total track length of 1860km out of which 975km are on the Tanzania side and the remaining 885km on the Zambia side. The two railway systems link 14 out of the 22 regions on the mainland.
15 URT (2009b). Climate change and livestock policy brief. Vice President’s Offi ce, Division of Environment, Dar es Salaam; and URT (2010a). The Economic Survey 2009. The Ministry of Finance and Economic Affairs, Dar es Salaam
19
a) RAHCO
The RAHCO network has a gauge of 1,000mm and consists basically of two main lines. The Central line running from Dar es Salaam to Tabora (840 km) and from Tabora to Kigoma (411 km) and a major branch from Tabora to Mwanza (378 km); and the Tanga line which starts from Tanga to Moshi and Arusha with total length of 438km. The two lines are connected by a link line between the Ruvu Junction Station on the Central line and Mnyuzi Junction on the Tanga line (188 km). Also, the system has four branch lines, that is, Kilosa-Kidatu (107 km), Kaliua-Mpanda (214 km), Manyoni-Singida (115 km), and Kahe-Border (16 km). The RAHCO railway has a design capacity of carrying 5 million tons of freight per annum.
b) TAZARA
TAZARA operates a railway line between the port of Dar es Salaam and New Kapiri Mposhi in Zambia over a distance of 1860km of which 975km are on the Tanzanian territory. TAZARA has a gauge of 1,067mm, which conforms to other Central and Southern African railway networks. The railway has a design capacity of carrying 5.0 million tons of freight per annum, that is, 2.5 million tons in each direction and 3.0 million passengers per annum.
Air TransportTanzania has a total of 368 aerodromes which are owned, managed and operated by different entities. Tanzania Airports Authority (TAA) owns, manages, operates and develops 58 airports. There are four international Airports namely, Mwalimu Julius Kambarage Nyerere Airport, Kilimanjaro Airport, Mwanza International Airport and Zanzibar Airport. Out of four International Airports, two of them are managed by TAA (namely Mwl. J. K. Nyerere and Mwanza International Airports). Zanzibar International Airports is managed by The Revolutionary Government of Zanzibar. Kilimanjaro A has been leased to a private operator since 1998.
Road NetworkIn Tanzania, road transport is the dominant mode and accounts for over 80% of passenger traffi c and over 95% of freight traffi c. The trunk and regional roads in Tanzania are estimated to be 34,263.1 km, out of which trunk roads are 12,205.4 km, regional roads 21,979 km and designated roads 78.6 km. This classifi cation is based on the Road Act, 2007 and subsequent re-classifi cation of roads in 2009, 2010 and 2012. 42.8% of the Trunk Road network are paved and 3.9% of Regional Road network are paved The district, urban, and feeder road network is 52,241 km of which only 1.5% is paved and 5,796km are
20
unclassifi ed rural and community roads. The road network density in Tanzania is 96.5m per square km (or 5.0 m per square km for paved roads). Tanzania has one of the lowest road densities in Africa, for example, Kenya has 261.9m and Uganda 330.8m according to statistics in 2007. This means a large part of Tanzania is inaccessible. The inaccessibility, especially in the rural areas, makes travel cumbersome and expensive.
Pipeline Transport Tanzania has three long-distance pipelines: the TAZAMA Pipeline is the fi rst with a distance of 1,710km transporting crude oil from Dar es Salaam to Ndola refi nery terminal in Zambia; the second pipeline with a distance of 232 km, including a submarine part transports gas from Songo-Songo Island to Dar es Salaam; and the third pipeline with a distance of 28km transports gas from Mnazi Bay Field to the power generation facility in the Mtwara region. There is a short distance pipeline network in Dar es Salaam that connects each depot of oil marketing companies to the Kurasini Oil Jetty (of the Dar es Salaam Port.
TAZAMA PipelineThe TAZAMA Pipeline with a distance of 1,710 km of 8 inch (200 mm) and 769 km of 12 inch (300mm) loops transports crude oil from the single point mooring at the outer anchorage of Dar es Salaam port in Tanzania through TIPER refi nery that is not operational in Dar es Salaam to the Indeni Refi nery Facility at Ndola in Zambia. The pipeline was designed for a throughput of 1.1 million metric tonnes per annum. Currently the optimum operating capacity is 700,000 metric tons per annum. The diameter of pipeline varies between 8 and 12 inches (and 300 mm).
2.1.5 Population DynamicsBased on the 2002 Population and Housing Census, the country was reported to have about 34,569, 232 people: 33,584,607 from mainland Tanzania with an annual average intercensal growth rate (1988 to 2002) of 2.9% (URT, 2002b). By 2011 the country had about 44.5 million people (of which 21.9 million were males and 22.6 million werefemales)16. The average household size was estimated at 4.9 and the population density was estimated to be 39 persons per sq.km.
Rapid urbanization is a common phenomenon in many cities in developing countries. Whilst urban population was only 4% of the national population of Tanzania at independence in 1961, it rose to 23% during the 2002 national population census and is projected to be about 34% for this year. With this trend it is estimated that by the year 2030, 50% of the national population will
16 Economic Survey, 2011
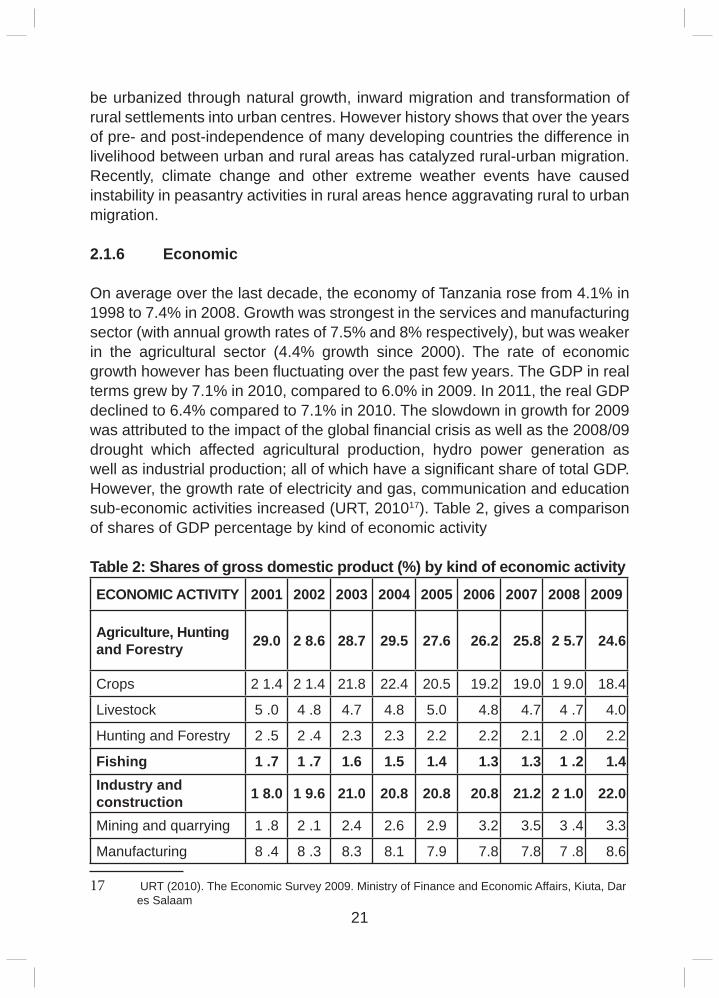
21
be urbanized through natural growth, inward migration and transformation of rural settlements into urban centres. However history shows that over the years of pre- and post-independence of many developing countries the difference in livelihood between urban and rural areas has catalyzed rural-urban migration. Recently, climate change and other extreme weather events have caused instability in peasantry activities in rural areas hence aggravating rural to urban migration.
2.1.6 Economic
On average over the last decade, the economy of Tanzania rose from 4.1% in 1998 to 7.4% in 2008. Growth was strongest in the services and manufacturing sector (with annual growth rates of 7.5% and 8% respectively), but was weaker in the agricultural sector (4.4% growth since 2000). The rate of economic growth however has been fl uctuating over the past few years. The GDP in real terms grew by 7.1% in 2010, compared to 6.0% in 2009. In 2011, the real GDP declined to 6.4% compared to 7.1% in 2010. The slowdown in growth for 2009 was attributed to the impact of the global fi nancial crisis as well as the 2008/09 drought which affected agricultural production, hydro power generation as well as industrial production; all of which have a signifi cant share of total GDP. However, the growth rate of electricity and gas, communication and education sub-economic activities increased (URT, 201017). Table 2, gives a comparison of shares of GDP percentage by kind of economic activity Table 2: Shares of gross domestic product (%) by kind of economic activity
ECONOMIC ACTIVITY 2001 2002 2003 2004 2005 2006 2007 2008 2009
Agriculture, Hunting and Forestry 29.0 2 8.6 28.7 29.5 27.6 26.2 25.8 2 5.7 24.6
Crops 2 1.4 2 1.4 21.8 22.4 20.5 19.2 19.0 1 9.0 18.4
Livestock 5 .0 4 .8 4.7 4.8 5.0 4.8 4.7 4 .7 4.0
Hunting and Forestry 2 .5 2 .4 2.3 2.3 2.2 2.2 2.1 2 .0 2.2
Fishing 1 .7 1 .7 1.6 1.5 1.4 1.3 1.3 1 .2 1.4Industry and construction 1 8.0 1 9.6 21.0 20.8 20.8 20.8 21.2 2 1.0 22.0
Mining and quarrying 1 .8 2 .1 2.4 2.6 2.9 3.2 3.5 3 .4 3.3
Manufacturing 8 .4 8 .3 8.3 8.1 7.9 7.8 7.8 7 .8 8.6
17 URT (2010). The Economic Survey 2009. Ministry of Finance and Economic Affairs, Kiuta, Dar es Salaam
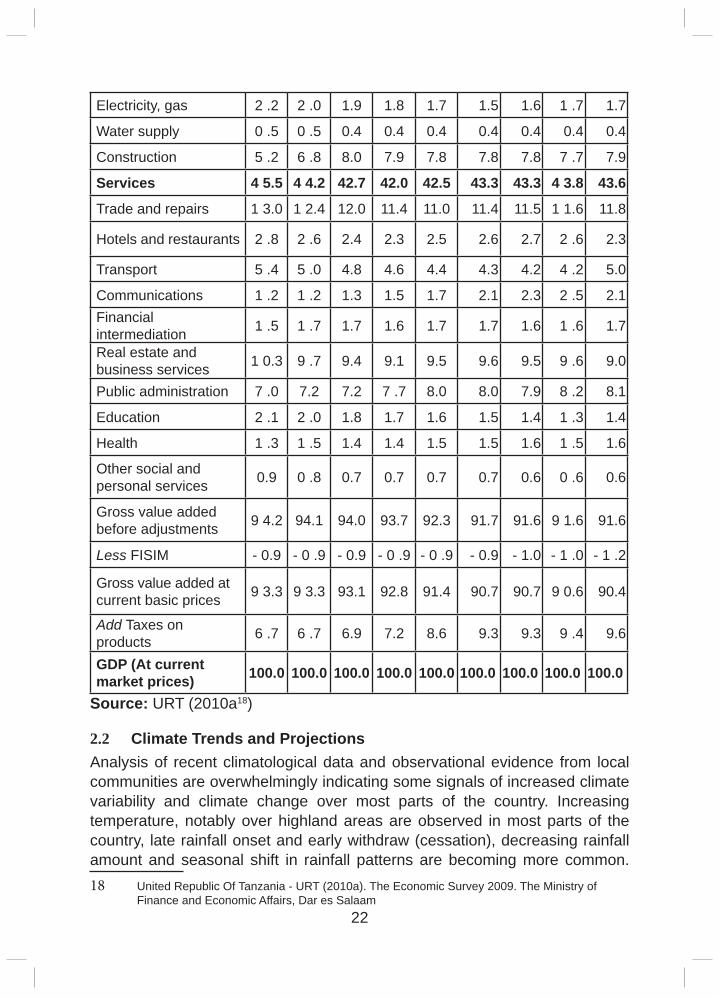
22
Electricity, gas 2 .2 2 .0 1.9 1.8 1.7 1.5 1.6 1 .7 1.7
Water supply 0 .5 0 .5 0.4 0.4 0.4 0.4 0.4 0.4 0.4
Construction 5 .2 6 .8 8.0 7.9 7.8 7.8 7.8 7 .7 7.9
Services 4 5.5 4 4.2 42.7 42.0 42.5 43.3 43.3 4 3.8 43.6
Trade and repairs 1 3.0 1 2.4 12.0 11.4 11.0 11.4 11.5 1 1.6 11.8
Hotels and restaurants 2 .8 2 .6 2.4 2.3 2.5 2.6 2.7 2 .6 2.3
Transport 5 .4 5 .0 4.8 4.6 4.4 4.3 4.2 4 .2 5.0
Communications 1 .2 1 .2 1.3 1.5 1.7 2.1 2.3 2 .5 2.1Financial intermediation 1 .5 1 .7 1.7 1.6 1.7 1.7 1.6 1 .6 1.7
Real estate and business services 1 0.3 9 .7 9.4 9.1 9.5 9.6 9.5 9 .6 9.0
Public administration 7 .0 7.2 7.2 7 .7 8.0 8.0 7.9 8 .2 8.1
Education 2 .1 2 .0 1.8 1.7 1.6 1.5 1.4 1 .3 1.4
Health 1 .3 1 .5 1.4 1.4 1.5 1.5 1.6 1 .5 1.6
Other social and personal services 0.9 0 .8 0.7 0.7 0.7 0.7 0.6 0 .6 0.6
Gross value added before adjustments 9 4.2 94.1 94.0 93.7 92.3 91.7 91.6 9 1.6 91.6
Less FISIM - 0.9 - 0 .9 - 0.9 - 0 .9 - 0 .9 - 0.9 - 1.0 - 1 .0 - 1 .2
Gross value added at current basic prices 9 3.3 9 3.3 93.1 92.8 91.4 90.7 90.7 9 0.6 90.4
Add Taxes on products 6 .7 6 .7 6.9 7.2 8.6 9.3 9.3 9 .4 9.6
GDP (At current market prices) 100.0 100.0 100.0 100.0 100.0 100.0 100.0 100.0 100.0
Source: URT (2010a18)
2.2 Climate Trends and Projections Analysis of recent climatological data and observational evidence from local communities are overwhelmingly indicating some signals of increased climate variability and climate change over most parts of the country. Increasing temperature, notably over highland areas are observed in most parts of the country, late rainfall onset and early withdraw (cessation), decreasing rainfall amount and seasonal shift in rainfall patterns are becoming more common. 18 United Republic Of Tanzania - URT (2010a). The Economic Survey 2009. The Ministry of
Finance and Economic Affairs, Dar es Salaam
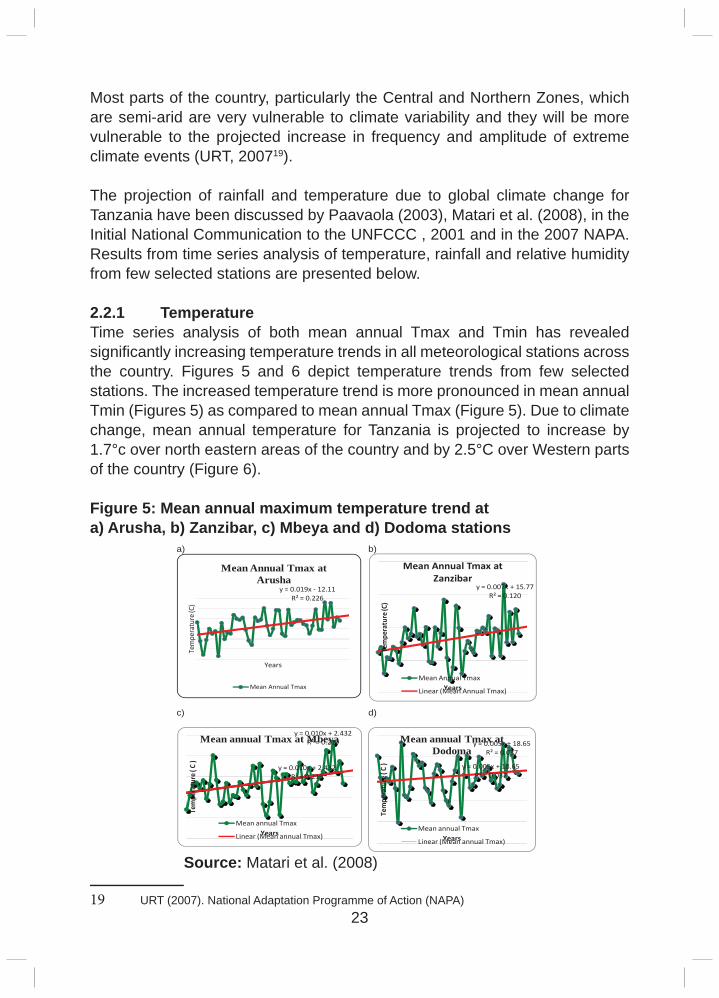
23
Most parts of the country, particularly the Central and Northern Zones, which are semi-arid are very vulnerable to climate variability and they will be more vulnerable to the projected increase in frequency and amplitude of extreme climate events (URT, 200719).
The projection of rainfall and temperature due to global climate change for Tanzania have been discussed by Paavaola (2003), Matari et al. (2008), in the Initial National Communication to the UNFCCC , 2001 and in the 2007 NAPA. Results from time series analysis of temperature, rainfall and relative humidity from few selected stations are presented below.
2.2.1 TemperatureTime series analysis of both mean annual Tmax and Tmin has revealed signifi cantly increasing temperature trends in all meteorological stations across the country. Figures 5 and 6 depict temperature trends from few selected stations. The increased temperature trend is more pronounced in mean annual Tmin (Figures 5) as compared to mean annual Tmax (Figure 5). Due to climate change, mean annual temperature for Tanzania is projected to increase by 1.7°c over north eastern areas of the country and by 2.5°C over Western parts of the country (Figure 6).
Figure 5: Mean annual maximum temperature trend at a) Arusha, b) Zanzibar, c) Mbeya and d) Dodoma stations
a) b)
c) d)
y = 0.019x - 12.11R² = 0.226
Tem
pera
ture
(C)
Years
Mean Annual Tmax at Arusha
Mean Annual Tmax
y = 0.007x + 15.77R² = 0.120
Tem
pera
ture
(C)
Years
Mean Annual Tmax at Zanzibar
Mean Annual Tmax
Linear (Mean Annual Tmax)
y = 0.010x + 2.432R² = 0.219
y = 0.010x + 2.432R² = 0.219
Tem
pera
ture
( C )
Years
Mean annual Tmax at Mbeya
Mean annual Tmax
Linear (Mean annual Tmax)
y = 0.005x + 18.65R² = 0.037
y = 0.005x + 18.65R² = 0.037
Tem
pera
ture
( C )
Years
Mean annual Tmax at Dodoma
Mean annual Tmax
Linear (Mean annual Tmax)
Source: Matari et al. (2008)
19 URT (2007). National Adaptation Programme of Action (NAPA)
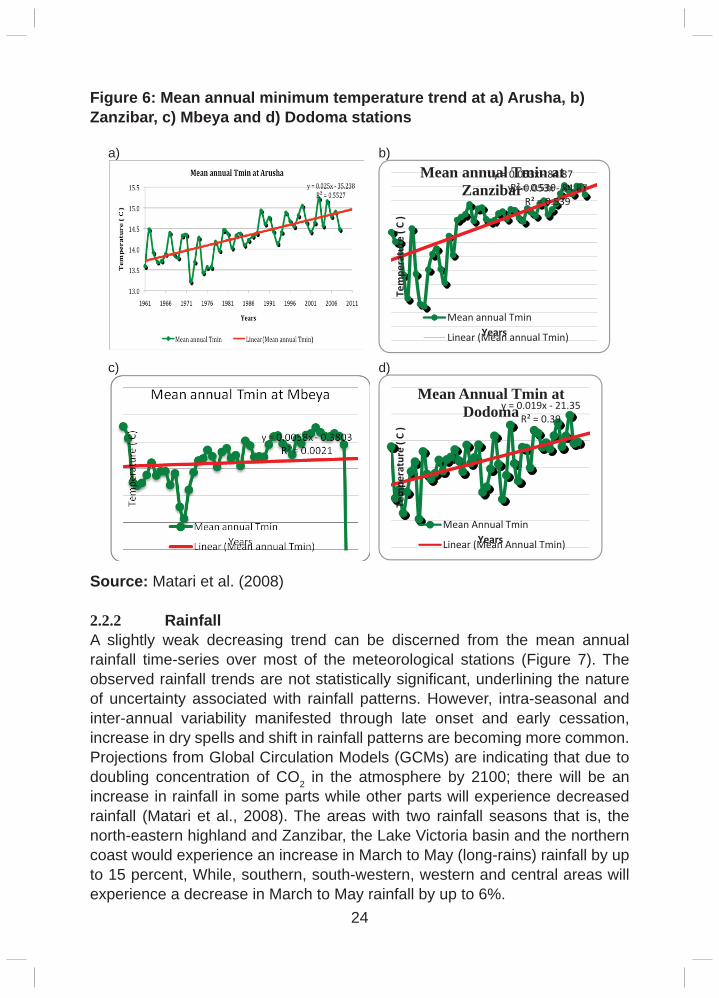
24
Figure 6: Mean annual minimum temperature trend at a) Arusha, b) Zanzibar, c) Mbeya and d) Dodoma stations
a) b)
c) d)
y = 0.053x - 84.87R² = 0.539y = 0.053x - 84.87
R² = 0.539
Tem
pera
ture
( C
)
Years
Mean annual Tmin at Zanzibar
Mean annual Tmin
Linear (Mean annual Tmin)
y = 0.019x - 21.35R² = 0.39
Tem
pera
ture
( C
)
Years
Mean Annual Tmin at Dodoma
Mean Annual Tmin
Linear (Mean Annual Tmin)
Source: Matari et al. (2008)
2.2.2 RainfallA slightly weak decreasing trend can be discerned from the mean annual rainfall time-series over most of the meteorological stations (Figure 7). The observed rainfall trends are not statistically signifi cant, underlining the nature of uncertainty associated with rainfall patterns. However, intra-seasonal and inter-annual variability manifested through late onset and early cessation, increase in dry spells and shift in rainfall patterns are becoming more common. Projections from Global Circulation Models (GCMs) are indicating that due to doubling concentration of CO2 in the atmosphere by 2100; there will be an increase in rainfall in some parts while other parts will experience decreased rainfall (Matari et al., 2008). The areas with two rainfall seasons that is, the north-eastern highland and Zanzibar, the Lake Victoria basin and the northern coast would experience an increase in March to May (long-rains) rainfall by up to 15 percent, While, southern, south-western, western and central areas will experience a decrease in March to May rainfall by up to 6%.
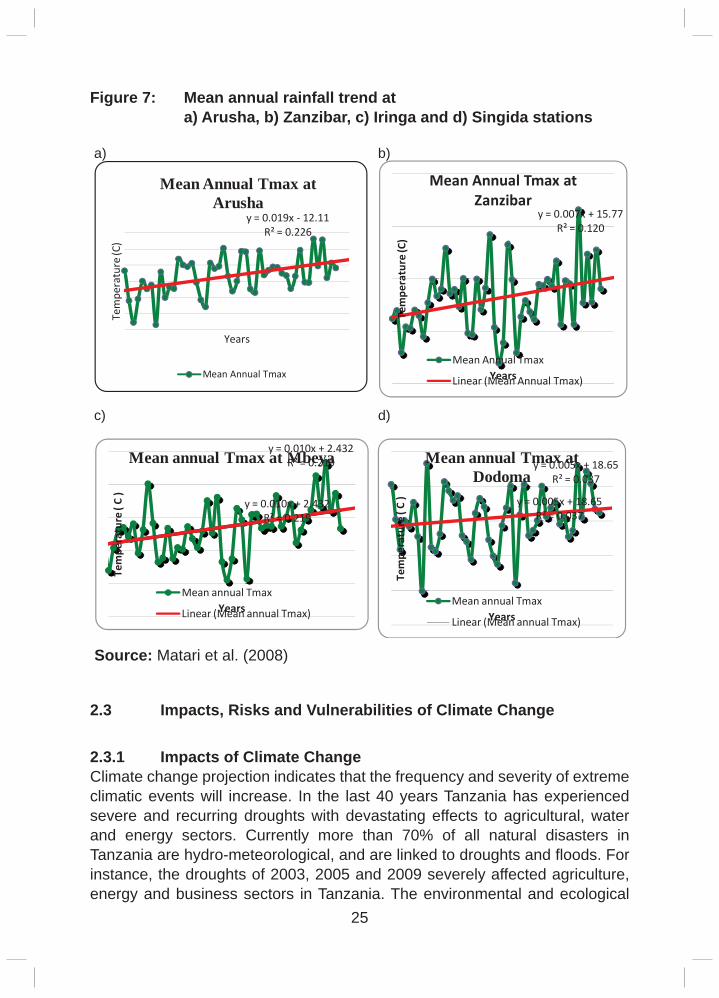
25
Figure 7: Mean annual rainfall trend at a) Arusha, b) Zanzibar, c) Iringa and d) Singida stations
a) b)
c) d)
y = 0.019x - 12.11R² = 0.226
Tem
pera
ture
(C)
Years
Mean Annual Tmax at Arusha
Mean Annual Tmax
y = 0.007x + 15.77R² = 0.120
Tem
pera
ture
(C)
Years
Mean Annual Tmax at Zanzibar
Mean Annual Tmax
Linear (Mean Annual Tmax)
y = 0.010x + 2.432R² = 0.219
y = 0.010x + 2.432R² = 0.219
Tem
pera
ture
( C
)
Years
Mean annual Tmax at Mbeya
Mean annual Tmax
Linear (Mean annual Tmax)
y = 0.005x + 18.65R² = 0.037
y = 0.005x + 18.65R² = 0.037
Tem
pera
ture
( C
)
Years
Mean annual Tmax at Dodoma
Mean annual Tmax
Linear (Mean annual Tmax)
Source: Matari et al. (2008)
2.3 Impacts, Risks and Vulnerabilities of Climate Change
2.3.1 Impacts of Climate ChangeClimate change projection indicates that the frequency and severity of extreme climatic events will increase. In the last 40 years Tanzania has experienced severe and recurring droughts with devastating effects to agricultural, water and energy sectors. Currently more than 70% of all natural disasters in Tanzania are hydro-meteorological, and are linked to droughts and fl oods. For instance, the droughts of 2003, 2005 and 2009 severely affected agriculture, energy and business sectors in Tanzania. The environmental and ecological
26
impacts of these droughts were alarming. Agriculture in the affected areas was crippled, a lot of livestock and wildlife perished due to starvation and lack of water. Following these droughts, Tanzania suffered serious energy crisis which had severe social and economic implications. The fl oods of 2009, for instance, were particularly devastating on humans, property and infrastructure. Some of these impacts are further elaborated in the following sections.
Agriculture and Food Security
Agricultural development is strongly dependent on environmental resources, such as land, forest, air, water and other resources. Thus sustainable utilization of these resources is vital for the growth and sustainability of the sector. However, agriculture is vulnerable to the effects of climate change associated with global warming (URT, 2008b20, URT, 2009a21).
Changing climate has resulted in a general decline in agricultural productivity, including changes in agro-diversity. The prevalence of crop pest and diseases is also reported to have increased, posing more challenge to agriculture. Recent studies by the Tanzania Meteorological Agency (TMA, 2009) indicated that some of the previous highly productive areas such as the southern and northern highlands will continue to be affected by declining rainfall, frequent droughts and signifi cant increase in spatial and temporal variability of rainfall with long term implications in the agricultural sector planning and resources allocation, such as seeds, pesticides and even the shifts in types of agricultural produce (URT, 2009a).
A study by the Ministry of Agriculture, Food and Cooperatives to establish strategies for addressing the negative effects of climate change in food insecure areas of Tanzania indicated considerable changes in the types of crops grown in agro-ecological zones with declining production trends (URT, 2008). For instance, the study indicated a declining trend in productivity of maize and sorghum, that led to the introduction of drought tolerant crops such as cassava in Muheza and Vanilla in Muleba districts.
There is a general perception by the majority of farmers that incidences of crop pests have increased over the past few decades, and that the pests have become more prevalent with time. As a result, emerging diseases such as batobato, banana xanthomonas wilt, panama, elihuka, coffee wilt, headsmuts, fusarium wilt, maize streak, cassava mosaic, cassava purple stripes, cassava root rot, and rust particularly in green grams have become more prevalent (URT,
20 United Republic of Tanzania - URT (2008b). Study on strategies for addressing negative effects of climate change in food insecure areas of Tanzania. Ministry of Agriculture, Food and Cooperatives. Ministry of Agriculture, Food and Cooperatives, Dar es Salaam.21 URT, 2009a
27
2008). Generally most farmers acknowledge increased plant diseases. Such incidences are locally perceived to have considerably affected the productivity. With changing climate farmers have also observed new diseases at different stages of the plant growth. For instance, in some parts of the country cassava diseases were not serious for many years, but since the 1980s this crop is facing more damage due to increased diseases. Similar experiences are reported for crops like coffee that seem to succumb to increasing incidences of pests and diseases emerging as a result of changing climate. Furthermore, increase in temperatures has led to increased incidences of some of plant species (for example, striga spp), a noxious weed particularly for cereal crops; insect pests (for example, prostephanus truncatus, and bemisia tabacci); and vermins such as the mole rats and an increase in the prevalence of crop pests and diseases which in turn has caused increased demand for pesticides and herbicides.
The National Food Security Policy (1997) recognizes food availability, accessibility and utilization as three major pillars of food security. Improved food security leads to improved human capital that leads to higher agricultural productivity and wages in the labour market. Food security is, therefore a development issue that must be streamlined in the development agenda to ensure a healthy and productive nation. It has been noted however, that food availability is greatly affected by low production and productivity due to factors that are linked to climate change, e.g. high incidence of pests and diseases, and unreliable rainfall that leads to recurrent droughts or fl oods in some parts of Tanzania. Tanzania’s NAPA ranked agriculture and food security as the most vulnerable and important sector that is severely impacted by climate change and advocated that studies on the impact of climate change in the sector and on food security be a priority activity. Addressing the impacts of climate change for ensured community livelihoods is thus of paramount importance as reiterated by the Heads of State of the East African Community (EAC) in 2010 (EAC, 201022). The assessment of food security undertaken by the Ministry of Agriculture, Food and Cooperatives (URT, 2008) revealed that semi-arid areas experienced more food shortages and insecurity compared to other districts. Climate related factors signifi cantly contribute to the reported food shortages and insecurity, with much of the food shortage being experienced in years with drought and fl oods. Major causes for the food shortages included drought, crop pests and diseases, low soil fertility, livestock diseases, and low household incomes.
Evidences have shown that there is a shift of agro ecological zones (AEZ) as results of climate change (URT, 2007). Change in crop performance in some
22 East African Community (EAC)(2010). Declaration of the 12th summit of EAC heads of state on food security and climate change. East African Community, Arusha.
28
parts of the country may be considered as detective of AEZ shift. In general, there is need to undertake further studies aimed at rigorous review of the AEZ. Present evidence of climate change supporting the shift paradigm is the observed shift in rainfall patterns from bimodal to unimodal rainfall regimes in some areas. For example Manyara and some parts of Morogoro and Kigoma regions which have long been characterised by bimodal rainfall distribution are now experiencing a shift towards unimodal rainfall regime (URT, 2008).
Productivity of most crops seems to have declined due to changing climate, particularly due to the increasing unreliability of rainfall. However, the production of some crops seems to have improved with the changing climate. For example, the productivity of mangoes and oil palm in the western plateau of Tanzania has increased considerably during the last 20 years, than in earlier years. Warming of the environment has favoured production of both mango and oil palm in these highland areas. The local experience indicates further that some twenty years ago mango and oil palm trees produced only fl owers without bearing fruits, because of cold weather but today reasonable harvests can be realised from these crops (Kangalawe et al., 2009). The major concern is however, on how such emerging opportunities could be effectively utilised.
Fresh Water Resources
Concerns on climate change and climate variability have created new demands for scientifi c, economic and social information to understand their impacts on water resources. Water resources in the country include rivers, lakes, wetlands, springs, reservoirs groundwater aquifers, and many water bodies that are shared with neighbouring countries. Increasing rainfall variability and prolonged droughts cause serious pressure in the country’s available water resources. Severe and recurrent droughts in the past few years triggered a decrease in water fl ows in rivers, hence shrinkage of receiving lakes, declines of water levels in satellite lakes and hydropower dams. Furthermore, some of the perennial rivers have changed to seasonal rivers and some wetlands have dried up.
Thus, as water is a fi nite resource is under pressure because of increasing climate change and variability, degradation due to pollution, over-abstraction, and encroachment of water catchments for various land uses (e.g. agriculture, urbanisation and industrial development). This scarcity and vulnerability has negative impacts on important watershed and recharge areas, as well as wetlands.
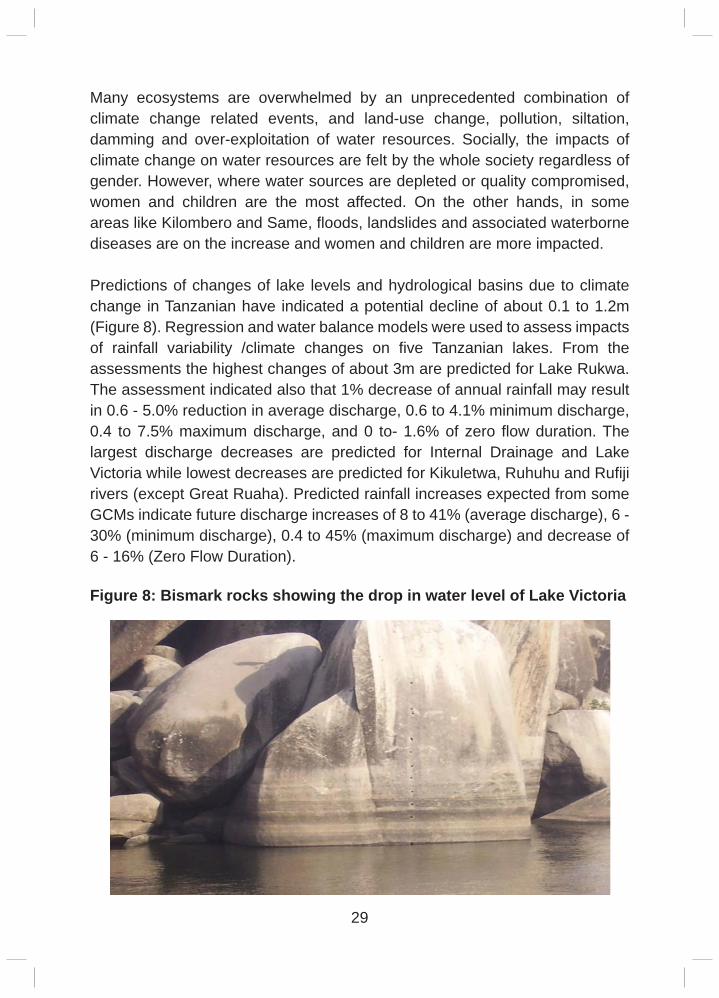
29
Many ecosystems are overwhelmed by an unprecedented combination of climate change related events, and land-use change, pollution, siltation, damming and over-exploitation of water resources. Socially, the impacts of climate change on water resources are felt by the whole society regardless of gender. However, where water sources are depleted or quality compromised, women and children are the most affected. On the other hands, in some areas like Kilombero and Same, fl oods, landslides and associated waterborne diseases are on the increase and women and children are more impacted.
Predictions of changes of lake levels and hydrological basins due to climate change in Tanzanian have indicated a potential decline of about 0.1 to 1.2m (Figure 8). Regression and water balance models were used to assess impacts of rainfall variability /climate changes on fi ve Tanzanian lakes. From the assessments the highest changes of about 3m are predicted for Lake Rukwa. The assessment indicated also that 1% decrease of annual rainfall may result in 0.6 - 5.0% reduction in average discharge, 0.6 to 4.1% minimum discharge, 0.4 to 7.5% maximum discharge, and 0 to- 1.6% of zero fl ow duration. The largest discharge decreases are predicted for Internal Drainage and Lake Victoria while lowest decreases are predicted for Kikuletwa, Ruhuhu and Rufi ji rivers (except Great Ruaha). Predicted rainfall increases expected from some GCMs indicate future discharge increases of 8 to 41% (average discharge), 6 - 30% (minimum discharge), 0.4 to 45% (maximum discharge) and decrease of 6 - 16% (Zero Flow Duration).
Figure 8: Bismark rocks showing the drop in water level of Lake Victoria
30
In spite of the numerous benefi ts and their contribution to socio-economic development, wetlands are facing increasing challenges of climate change, particularly frequent droughts. Furthermore, with increasing evapo-transpiration because of increased temperature, wetland water characteristics will change with catastrophic consequences for the biodiversity within, for example increased pH levels in Lake Natron is affecting the breeding sites of fl amingos. The change in pH is associated with increased temperature and changed rainfall regime in the Lake Natron catchment areas. It is most likely that there will be increased encroachment on wetlands due increased drought and desertifi cation as result of climate change.
Human Health
The tropical African climate is favourable to most major vector-borne diseases, including malaria, schistosomiasis, onchocerciasis, trypanosomiasis, fi lariasis, leishmaniasis, plague, Rift Valley fever, yellow fever and tick-borne haemorrhagic fevers. The continent has a high diversity of vector-species complexes that have the potential to redistribute themselves to new climate driven habitats leading to new disease patterns. These organisms have different sensitivities to temperature and precipitation.
Vectors, pathogens and hosts reproduce within certain optimal climate conditions and changes in these conditions can modify greatly properties of disease transmission. The most infl uential climatic factors for vector borne diseases include temperature and precipitation. Extreme temperatures are often lethal to the survival of disease causing pathogens but incremental changes in temperature may exert varying effects. Where a vector lives in an environment where mean temperatures approach the limit of physiological tolerance for the pathogen, a small increase in temperature may be lethal to the pathogen. Alternatively, where a vector lives in an environment of low mean temperature, a small increase in temperature may result in increased development, incubation and replication of the pathogen.
Variability in precipitation may have direct consequences in infectious disease outbreaks. Increased precipitation may increase the presence of disease vectors by expanding the size of existent larval habitat and creating new breeding grounds. In addition, increased precipitation may support growth in food supplies, which in turn support a greater population of vertebrate reservoirs. Alternatively, fl ooding may force insect or rodent vectors into houses and increase the likelihood of vector-human contact. From a different dimension, heavy rains can contaminate water systems by transporting human and animal faecal products and other wastes in the surface and ground water which are associated with diarrhoeal disease outbreaks.
31
IPCC, 2001 indicates that many vector, food and water-borne diseases are sensitive to changes in climatic conditions. Results of predictive models have shown that under climate change scenarios, there would be a net increase in the geographical range of potential transmission of malaria and dengue fever (Tonnang et al., 2010). IPCC states further that while climate change is unequivocal the impacts will fall disproportionately upon developing countries and the poor persons within all countries, thereby exacerbating inequities in health status and access to adequate food, clean water and other resources. Climate change is likely to also seriously undermine the health-related Millennium Development Goals to reduce child mortality, improve maternal health and combat HIV/AIDS, malaria and other diseases.
In Tanzania there are already reported incidences of epidemic malaria especially in highland areas that were traditionally free from mosquitoes and malaria (Yanda et al., 2006; URT, 2009; Wandiga et al., 2010). Malaria has been common in high temperature and humid lowland areas especially during and after rainy seasons but with changes in temperature and rainfall regimes, the disease has been observed in non-traditional malaria areas such as highland areas of Tanga, Kilimanjaro, Iringa, Kagera and Mbeya, among others, where it was not prevalent before. The epidemics in these areas are mostly linked with El Niño events. This is a signifi cantly dramatic increase in malaria spread in a place it was not such prevalent. Whilst indicative, it is estimated that the potential costs to address the increased disease burden in Tanzania could be USD ($) 20 to 100 million per year by 2030, rising to USD ($) 25 to 160 million per year by 2050 – the range refl ecting different climate and development assumptions (Global Climate Adaptation Partnership and Partners, 201123).
Studies undertaken in the Lake Victoria basin indicate that incidences of other diseases such as cholera have increased as a result of climate change (Yanda et al., 2006; Wandiga et al., 2010). Others experiences (Figure 9) show that prevalence of cholera, has over the past few decades coincided with El Nino events. The fi rst cholera outbreak were reported in 1974 and since 1977, cases were reported each year with a case fatality rate averaging 10.5% between 1977 and 1992 (WHO, 2008). Prevalence elevates in rainy seasons and becomes even higher during fl oods (URT, 200624).
Humidity has also been blamed for increased risk of upper and lower respiratory infections in many parts of the country. In dry areas of the country, prolonged dry spells have caused increased outbreaks of respiratory diseases and eye infections. Incidences of food-borne and water borne diseases such as
23 Global Climate Adaptation Partnership and Partners, 2011). The Economics of Climate Change in the United Republic of Tanzania.24 United Republic of Tanzania - URT (2006). Annual Health Statistical Abstract. Ministry of Health, Dar es Salaam
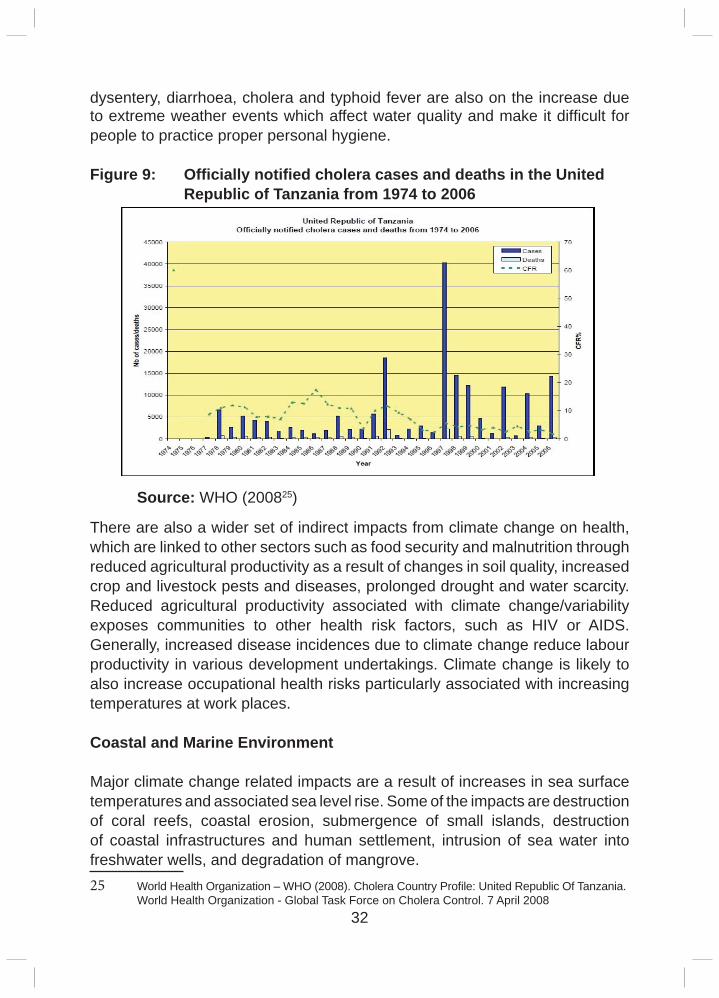
32
dysentery, diarrhoea, cholera and typhoid fever are also on the increase due to extreme weather events which affect water quality and make it diffi cult for people to practice proper personal hygiene.
Figure 9: Offi cially notifi ed cholera cases and deaths in the United Republic of Tanzania from 1974 to 2006
Source: WHO (200825)
There are also a wider set of indirect impacts from climate change on health, which are linked to other sectors such as food security and malnutrition through reduced agricultural productivity as a result of changes in soil quality, increased crop and livestock pests and diseases, prolonged drought and water scarcity. Reduced agricultural productivity associated with climate change/variability exposes communities to other health risk factors, such as HIV or AIDS. Generally, increased disease incidences due to climate change reduce labour productivity in various development undertakings. Climate change is likely to also increase occupational health risks particularly associated with increasing temperatures at work places.
Coastal and Marine Environment
Major climate change related impacts are a result of increases in sea surface temperatures and associated sea level rise. Some of the impacts are destruction of coral reefs, coastal erosion, submergence of small islands, destruction of coastal infrastructures and human settlement, intrusion of sea water into freshwater wells, and degradation of mangrove.25 World Health Organization – WHO (2008). Cholera Country Profi le: United Republic Of Tanzania. World Health Organization - Global Task Force on Cholera Control. 7 April 2008
33
One of the most striking signs that climate change is impacting marine ecosystem is the growing incidence of coral bleaching which is due to prolonged exposure of corals to warmer than normal water temperatures. The loss of coral reefs is likely to have impacts on the marine and coastal resources in particular fi shes that depend on coral reef ecosystem as breeding, nursery and feeding habitat.
Sea level rise impacts are increasingly manifested by accelerated coastal erosion in many parts of the coastal areas and in some cases destruction of mangroves caused by strong sea waves. It has also lead to intrusion of sea water into fresh water wells and crop fi elds. This is vivid in Bagamoyo, Pangani, Rufi ji and Zanzibar. Other impacts include submergence of small islands like Maziwe in Pangani and Fungu la Nyani in Rufi ji; destruction of coastal infrastructures (for example, some beach hotels in northern Dar es Salaam, Pangani wall); and some human settlement. Thus sea level rise can be among the most challenging climate change issues since it threatens the destruction of key coastal infrastructure and costal livelihoods.
Climate change also has impact on sea currents and waves due to variations in sea surface temperature. Variation on sea currents and waves is likely to impact fi shing activities due to change of water movement pattern favourable for fi shing. A vivid example is the low fi sh catches during south eastern monsoon which is associated with cold waters. This situation could be accelerated by climate change.
Energy
Frequent and persistent droughts evident in the past decade have caused drying up of major hydropower dams consequently the energy mix has progressively been declining in recent years. With acerbated impacts of climate change, these traditional sources of energy are under threat. It is estimated that, the grid hydro-thermal power mix will reach 39% hydroelectricity and 61% thermal, respectively, by year 2031.
As a result of increasing climate variability, over the last years, the country has experienced increasing incidents of recurrent and prolonged droughts with severe implications on hydro power generation. Power rationing and black outs have become a common phenomena in Tanzania. This affects individuals’ household and industrial income generating activities. Consequently, additional resources which were committed for other development programmes are sometimes being reallocated for thermal electricity generation. This undermines national efforts to attain the MDGs and place poverty reduction efforts at jeopardy.
34
Forestry
Climate change impacts on forest ecosystems and biodiversity are expected to vary depending on vegetation species. The common impacts to all forests types include loss of biodiversity; disappearance of wildlife habitats, increased risk of bush fi res, limited availability of forest products (timber and non timber products) and ecosystem shift (for example, forest to woodlands, or woodlands to grasslands). The NAPA, 2007 forecasts change to drier forests and ecosystems as a result of climate change. Species that are expected to be more vulnerable are those with limited geographical range and heat intolerant; low germination rates; low survival rate of seedlings; and limited seed dispersal/migration capabilities. However, knowledge on the magnitude of effects on individual species is still limited.
Forests and woodlands are the sources for most of the wood and non-wood products. Wood products include timber, poles, fi rewood and charcoal. Non-wood products include ropes, resins, tie and dye colourings, wildlife, game meat, fruits, traditional or natural medicines, natural vegetables, palm leaves for making baskets/mats, honey and beeswax, mushrooms. Furthermore, forests and woodlands do provide other goods and services to people such as food and water. Also biomass is the main source of fuel for rural population and accounts for 92% of the total energy consumption in the country. A number of intangible benefi ts also do exist as outcomes of presence of forests and woodlands. Such benefi ts include unique natural ecosystems and genetic resources, depository of biodiversity, amelioration of climate (microclimate), carbon sequestration, habitat to wildlife and cultural and religious values (URT, 200826). Increased temperature and changes in rainfall regime will seriously affect the variability of such goods and services from the forestry sector.
Biodiversity
According to the IPCC (200727a), any increase in global average temperature above the range of 1.5 - 2.5°C is likely to result in signifi cant alterations in the structure, function and geographical ranges of ecosystems, thus negatively infl uencing species distribution and survival. Many of the impacts of a changing climate are likely to be species specifi c and related to particular ecological aspects of individual taxa, necessitating a species-based management approach. However, some impacts will be important across all, or some, species
26 United Republic of Tanzania - URT (2008). State of the environment report 2008. Vice President’s Offi ce, Division of Environment, Dar es salaam.27 IPCC, 2007a
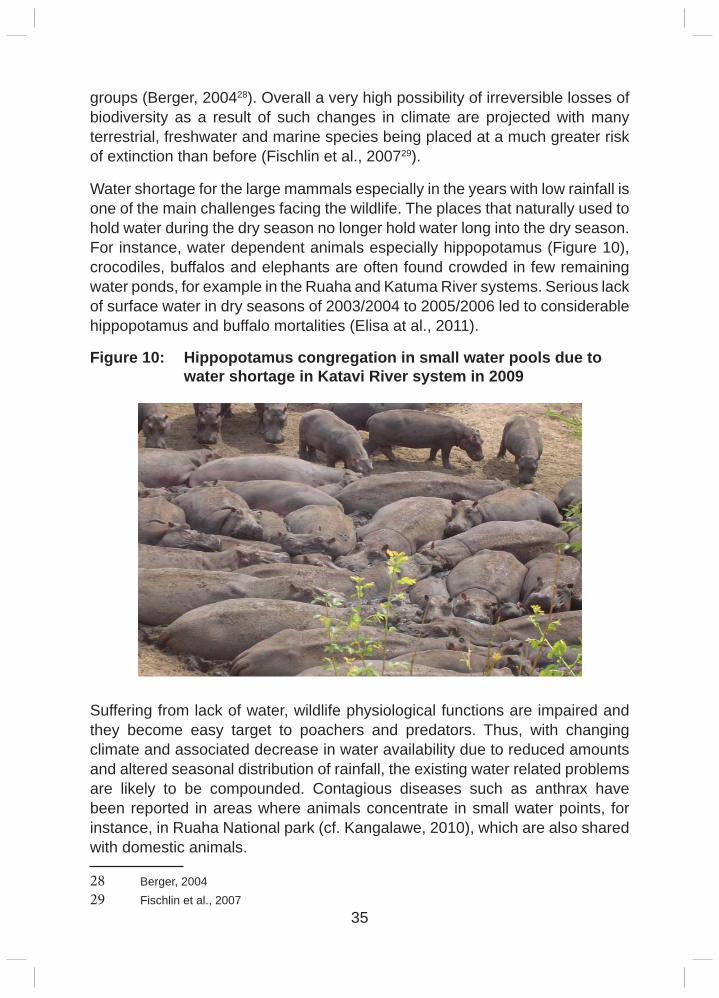
35
groups (Berger, 200428). Overall a very high possibility of irreversible losses of biodiversity as a result of such changes in climate are projected with many terrestrial, freshwater and marine species being placed at a much greater risk of extinction than before (Fischlin et al., 200729).
Water shortage for the large mammals especially in the years with low rainfall is one of the main challenges facing the wildlife. The places that naturally used to hold water during the dry season no longer hold water long into the dry season. For instance, water dependent animals especially hippopotamus (Figure 10), crocodiles, buffalos and elephants are often found crowded in few remaining water ponds, for example in the Ruaha and Katuma River systems. Serious lack of surface water in dry seasons of 2003/2004 to 2005/2006 led to considerable hippopotamus and buffalo mortalities (Elisa at al., 2011).
Figure 10: Hippopotamus congregation in small water pools due to water shortage in Katavi River system in 2009
Suffering from lack of water, wildlife physiological functions are impaired and they become easy target to poachers and predators. Thus, with changing climate and associated decrease in water availability due to reduced amounts and altered seasonal distribution of rainfall, the existing water related problems are likely to be compounded. Contagious diseases such as anthrax have been reported in areas where animals concentrate in small water points, for instance, in Ruaha National park (cf. Kangalawe, 2010), which are also shared with domestic animals.
28 Berger, 200429 Fischlin et al., 2007
36
Human - wildlife confl icts are a common occurrence in wildlife areas, especially in years with drought. The main reason for these confl icts was reported to be crop raiding while wild animals roam around in search for pastures and water. The animals commonly involved in these confl icts are hippopotamus, elephants and buffaloes. This may be aggravated with changing climate conditions.
Tourism
Tourism has close connections to the environment and is considered to be a highly climate sensitive sector. Climate variability determines the length and quality of tourism seasons thus plays a major role in the destination choice and tourist spending. Climate affects a wide range of the environmental resources that are key attractions for tourism, such as snow conditions over Mount Kilimanjaro, wildlife productivity and biodiversity, water levels and quality. Climate also has an important infl uence on environmental conditions that can deter tourists, including infectious disease, wildfi res, insect or waterborne pests, and extreme events such as tropical cyclones.
Like elsewhere in the world, the sector is already being impacted by climate change. The manifestations of climate change are highly relevant for tourism destinations and tourists alike. For instance, Mountain Kilimanjaro has lost 80% of its ice cover between 1912 and 2005. It is envisaged that such melting of ice on Mountain Kilimanjaro; sea level rise; submerging small islands and destruction of costal investments and infrastructures (for example, hotels and recreation facilities), beaches, as well as coral reef bleaching will continue to impact negatively the tourism sector by changing the scenic view of the natural environment (Mushi, 200930).
Apart from the impacts of sea level rise, which have destroyed cultural, historical, archaeological and heritage sites along coastal areas in the country, heat stress and drought have also caused massive wildlife deaths in the northern tourist zone. Destruction of infrastructure such as roads and bridges is devastating. Road maintenance becomes particularly diffi cult and expensive during prolonged heavy rains in many parts of the country. For example the 2006 El Niño rains, left many park roads impassable for a long period of time, and resulted in reduced tourist visits and loss of revenue. In places like Ruaha National Park ecosystem, droughts have had signifi cant impacts on wildlife and hence tourism (URT, 200231; Kangalawe 201032). Tourism in the Ruaha
30 Mushi, R. S (2009): Climate Change and its Impact on Coastal Tourism, A case of Bagamoro District. Msc Dissertation, University of Dar es Salaam31 United Republic of Tanzania - URT (2002). National Water Policy. Ministry of Water and Livestock
Development, Dar es Salaam.32 Kangalawe, R.Y.M. (2010). Mainstreaming climate change adaptation in the management
37
National Park, for instance, depends on the presence of water in the Great Ruaha River and its catchments. However, the Great Ruaha River where the park is located is threatened by the persistent dryness of the basic natural resource that supports livelihoods in the area.
Industries
Most industrial development in Tanzania is either light manufacturing industries or agro-processing plants and mills located mainly in urban centres. In 2000 there were 36 registered industries and other businesses and by 2007 the number had increased to about 262.
Most of the industries concentrate in manufacturing of simple consumer goods including food, beverages, tobacco, textiles and furniture, as well as wood and allied products of which they depend much on agro-products. The large dependence on agricultural raw materials means that the industrial sector, like agriculture, is vulnerable to the impacts of climate change. Despite the agro-based nature of most of these industries, power supply is mainly from hydro sources which are again vulnerable to climate change impacts, particularly drought. Therefore climate change adversely affects the sector and peoples wellbeing at large. The effects include:
a) Decrease in industrial production due to unstable power supply, water supply, low or inadequate supply of agricultural raw materials, damage of infrastructure, which mean limited infl ow of foreign currency;
b) Increase of costs for imported materials and technology, which would mean more capital fl ight;
c) Increased occupational health risk due to high temperatures and inadequate water for sanitary activities;
d) Failure to expand industrial investments due to increased uncertainty;
e) Decrease in GDP, hence, low revenue collection by government; and
f) Increase in unemployment rate due to decreased industrial investment and production.
of freshwater resources in the Rufi ji Basin. A consultancy report submitted to the Ruaha Water Programme. WWF-Tanzania Country Offi ce, Dar es Salaam.
38
Livestock
Most of the livestock are concentrated in the semi-arid areas (including, Arusha, Dodoma, parts of Iringa, Kilimanjaro, Manyara, Shinyanga, Mwanza, Singida, Mara, Tabora and parts of Rukwa) which are more suitable for livestock than any other form of agriculture. These areas are characterized by relatively low mean annual rainfall with stronger spatial and temporal variability, and therefore not very reliable for production of food and cash crops. Concentration of ruminant livestock in these areas is also attributed to low prevalence of tsetse fl ies and less competition for land for arable agriculture. However, the sector is affected by various climate change impacts, drought being the most serious. There has been as a result of severe and recurrent droughts, particularly in the northern parts of the country.
Changes in the mean temperature and rainfall, and the increased variability of rainfall, have resulted to prolonged length of dry seasons and increased severity of periodic droughts that reduces water and pastures availability for the livestock. It has been noted that warming shortens the growing seasons and, together with reduced rainfall, reduces water availability, and can also increase livestock diseases. On the other hand, this reduced the availability of crop residues, which are important sources of feed for livestock especially during the dry seasons. Limited availability of pastures and water has often resulted into resource use confl icts between crop cultivators and livestock keepers, particularly in the catchment areas and crater basins.
Availability of animal feed resources for poultry, non-ruminants and other non- conventional animal industry are affected by climate change due to extreme reduction in agricultural and industrial production for products such as seed cakes and molasses.
It has been noted in some parts of the country that climate change, particularly increasing temperature, increased frequency and intensity of wildfi res inducing shifts in geographical distribution of biodiversity. For example, non-palatable and toxic plant species are replacing the palatable and nutritious plant species, thus affecting the livestock industry. The intensifi ed wildfi res also cause more damage to biomass growth, thereby reducing availability of both pasture and water for livestock. Also, savannah grassland is likely to replace forests and woodlands in many places. While this may have positive impacts on the availability of fodder for the livestock, the reported fi res and species changes may limit the quality and productivity of these areas.
Warming is predicted to increase disease vectors which will consequently increase the incidences of vector-borne diseases of livestock, such as
39
trypanosomiasis, East Coast Fever, and Rift Valley Fever. The increases of livestock mortality due to diseases and starvation (due to droughts) may have considerable impacts on the local economies and the overall community livelihoods, particularly given the shortages of livestock dips and low fi nancial capacity of people to afford various livestock medications (Kangalawe et al., 200933).
Fisheries
The impact of climate change in fi sheries is mainly associated with destruction/degradation of fi sh nursery grounds, breeding and feeding areas. One of the most striking signs that climate change has an impact to marine fi sheries is the destruction of coral reefs which is a critical habitat for fi shes in the coastal environments. Destruction of coral reefs due to coral bleaching caused by rise of sea surface temperature is among the factors impacting marine fi sheries. Sea level rise which is associated with global warming may cause sea water to rise above optimal levels of some corals. Too deep for example, can restrict amount of sunlight needed for coral growth. Further climate change is impacting fi sh migration patterns thereby affecting fi sh recruitment and stocks in traditional fi shing sites, especially for artisanal fi sher folks. Sedimentation in freshwaters is negatively affecting fi sheries in fresh water bodies, for example, by destroying breeding and feeding sites. This problem is aggravated by drought and frequent fl oods resulting from climate change.
Infrastructure
Increased rainfall due to climate change may cause fl ood damage to transport, communications and buildings infrastructures. For instance, in December 2009 and January 2010, unusual heavy rainfall associated with El Niño event saw widespread fl ooding in Morogoro (Kilosa) and Dodoma (Mpwapwa and Kongwa) Regions which led to severe damage on road, bridges, water dams, railway, electricity poles, drainage networks, water supply, and human settlements. In April 2011 also in Morogoro (Kilombero) region heavy rains caused fl ood which destroyed six bridges, several roads and several human settlements. In all these cases the costs of addressing the fl ood situation were enormous.
Sea level rise, coastal inundation can force modifi cation to port facilities with high cost to the government. For example, the Tanzania’s Initial National
33 Kangalawe, R.Y.M., Mung’ong’o, C.G., Yanda, P.Z., Mwakaje, A.G., Kalumanga, E. (2009). Climate change and variability impacts, vulnerability and adaptive capacity in Kasulu District, Tanzania. Chapter 2. In: Kangalawe, R.Y.M., Mung’ong’o, C.G. and Yanda, P.Z. (Eds.). People’s Perceptions and Community Response to Climate Change and Variability: Selected Cases from Tanzania. Institute of Resource Assessment, University of Dar es Salaam.
40
Communication to UNFCCC (URT, 200334) reported that for the Dar es Salaam coastline the loss of important structures is estimated to cost TShs 49.83 billion for a sea level rise of 0.5m and TShs 85.97 billion for a sea level rise of 1.0m. Similar costs are likely to be incurred by other coastal cities of Tanzania. Despite aesthetic value and other unique natural resources which have attracted populations, coastal areas are most vulnerable to climate change due to the anticipated rise in sea level, fl oods and other consequences. Unfortunately, the impact of sea level rise is already being experienced in Coast Region. In Bagamoyo District, for instance, sea level rise has already resulted into inundation of some traditional water sources (URT, 2007). This indicates how the country will be forced to transfer a signifi cant amount of annual expenditures to offset the effects of climate change on various infrastructures. The overall impact could be economic loss and growth volatility, reduced reliability of and hydroelectric power.
Human Settlements
Cities and other human settlements are at the forefront of climate change. Simultaneously, due to their concentration of population and infrastructure, cities are especially vulnerable to the impacts of climate change. In Tanzania, the majority of the settlements in urban and semi urban areas are not planned. In Dar es Salaam city, for instance, the unplanned and unserviced settlements accommodate about 70 to 75% of the city’s population while the planned settlements occupy an area of 25 to 30% (URT, 200235; UN-HABITAT, 200936:11; URT, 201137). Similar situations exist in other urban areas in the country. In addition, these urban areas are exposed to a wide range of threats related to climate change including sea-level rise and coastal erosion, fl ooding, drought and water scarcity, and the disruption of hydro-electricity generation. These are exacerbated by poor socio-economic and environmental conditions caused by low levels of economic growth, mismanagement of the process of urbanization, and inadequate social services.
Given the level of economy of the country, the poor are the ones residing in most of these unplanned, hazardous areas. Most of the houses are built without
34 United Republic of Tanzania - URT (2003). Initial National Communication under the United Nations Framework Convention on Climate Change (UNFCCC). Vice president’s Offi ce, Dar es Salaam.
35 United Republic of Tanzania - URT (2002). Population and Housing Census 2002. United Republic of Tanzania. National Bureau of Statistics, Dar es Salaam
36 United Nations Human Settlements Programme - UN-HABITAT (2009). Tanzania: Dar es Salaam City Profi le. United Nations Human Settlements Programme, Regional and Technical Cooperation Division, Nairobi.
37 United Republic of Tanzania – URT (2011). The Dar es Salaam City Environment Outlook 2011. Vice President’s Offi ce, Division of Environment, Dar es Salaam. Draft.
41
proper arrangement, which make it even diffi cult to do informal settlement upgrading; this enhances residents’ vulnerability to disease, environmental degradation and poor sanitation facilities.
On the East African coast, sea-level rise will increase fl ooding with potential adaptation including that related to human settlement costs of up to 10% of GDP (IPCC, 2007). For instance, a rise in sea level would aggravate the already existing ecological problems through increased rates of coastal erosion, more persistent fl ooding, loss of wetlands, increased salinization of groundwater and soil as well as greater infl ux of diverse pollutants (Awosika et al., 1991). As is the case with infrastructure, sea level rise is likely to have considerable impact on human settlements through inundation of coastal areas as well as coastal erosion. In some areas such as Dar es Salaam the problem of coastal erosion is already widespread. In some areas, the beaches have been gradually eroded by about 200m during the last 50 years due to the strength of headwater waves, resulting in considerable damage to infrastructure and settlements. In Pangani Town, the sea wall that was built to protect the town from ocean currents is gradually being overwhelmed thus threatening the coastal settlements.
Similar effects of sea level rise are reported for islands of Zanzibar, where some settlements such were abandoned. In the northern part of Ras Mkumbuu peninsular near Chake Chake there are several submerged ruins believed to represent an ancient commercial and religious centre. The ruins at Ras Mkumbuu included a settlement with a large mosque, a number of elaborate and decorated pillar tombs, several abandoned wells and foundations of houses estimated to date from 14th to 15th century (URT, 2009). While there is no clear explanation regarding the factors that caused these ruins to be submerged, it could have been due climate change and associated sea level rise.
Excessive rainfall has led to frequent fl ooding in various settlements, causing damage to infrastructure and property and disrupting economic activities. Heavy rainfall have been disrupting and causing substantial losses both socially and economically, including damage to smaller bridges and roads, fl ooding of homes, schools and the deaths of several children (Figure 11).
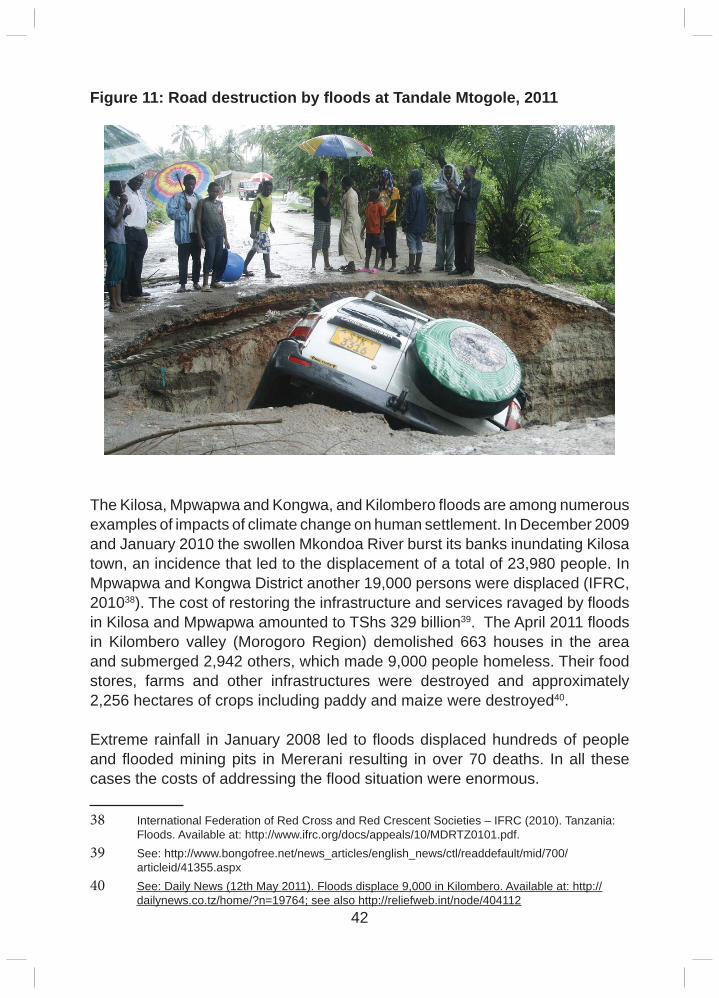
42
Figure 11: Road destruction by fl oods at Tandale Mtogole, 2011
The Kilosa, Mpwapwa and Kongwa, and Kilombero fl oods are among numerous examples of impacts of climate change on human settlement. In December 2009 and January 2010 the swollen Mkondoa River burst its banks inundating Kilosa town, an incidence that led to the displacement of a total of 23,980 people. In Mpwapwa and Kongwa District another 19,000 persons were displaced (IFRC, 201038). The cost of restoring the infrastructure and services ravaged by fl oods in Kilosa and Mpwapwa amounted to TShs 329 billion39. The April 2011 fl oods in Kilombero valley (Morogoro Region) demolished 663 houses in the area and submerged 2,942 others, which made 9,000 people homeless. Their food stores, farms and other infrastructures were destroyed and approximately 2,256 hectares of crops including paddy and maize were destroyed40.
Extreme rainfall in January 2008 led to fl oods displaced hundreds of people and fl ooded mining pits in Mererani resulting in over 70 deaths. In all these cases the costs of addressing the fl ood situation were enormous.
38 International Federation of Red Cross and Red Crescent Societies – IFRC (2010). Tanzania: Floods. Available at: http://www.ifrc.org/docs/appeals/10/MDRTZ0101.pdf.
39 See: http://www.bongofree.net/news_articles/english_news/ctl/readdefault/mid/700/articleid/41355.aspx
40 See: Daily News (12th May 2011). Floods displace 9,000 in Kilombero. Available at: http://dailynews.co.tz/home/?n=19764; see also http://reliefweb.int/node/404112

43
Figure 12: Floods in Dar es Salaam, December 2011
On the other hand, human settlements in Tanzania have been experiencing water scarcity for many years. The sight of women carrying water buckets on their heads remains a common occasion, as does that of vendors pushing carts fi lled with containers of water. Yet even this inadequate supply of water is not provided regularly. Broken pipes are frequent, and residents sometimes have to go for over three days without water. In many rural areas faced with droughts and water shortage migrations have become a common phenomenon, with people moving with their livestock. In many instances this has been a cause for abandoning their old settlements and establishing new ones in areas with better opportunities. This has particularly been the case with the agro-pastoral communities. Even in urban settlements, there is serious water shortage that predisposes the communities to diseases such as cholera, mainly associated with drinking unsafe water. Climate change is poised to aggravate the situation.
Land use
There are different types of land use including areas under human settlements, forest, game reserves, and livestock grazing. Land use change is a major threat to Tanzania ecosystems. Increasing human populations, coupled with changing land tenure systems, are fragmenting once open and dynamic ecological systems. The interaction of climate change and land-use change presents new challenges to policy makers, managers and local communities pursuing
44
sustainable natural resource management strategies for human welfare and conservation of biodiversity. Agricultural expansion into key resource areas, such as swamps and the riverside strips eliminates important dry season grazing reserves. Wildlife and livestock vulnerability to drought due to the loss of these forage reserves is exacerbated by the loss of landscape scale connectivity associated with agricultural expansion creating land use confl icts.
On the other hand, man alters the planet surfaces in diverse ways trough urbanization, deforestation, foresting former grasslands, irrigating drylands for crops, damming rivers to create man-made lakes and reservoirs, and reclaiming swamps and marshlands, among others. These factors affect the climate on scales ranging from the macro to micro scales. The opportunities rising from reforestation, afforestation and forest conservation in the context of climate change have not yet been tapped by Tanzanians. Therefore, the increased awareness and capacity to ensure that land use need to be enhanced.
Education
Drought, fl oods and other natural disasters reduce opportunities for employment due to disruption of livelihood systems. Those who are expected to provide for their family have to migrate elsewhere to look for work or sometimes the whole family has to migrate away from areas where education is provided. This increases the possibility of children not to access education and be provided with necessities which can help them to obtain school needs such as uniforms, stationery as well as psychosocial support. Hence deny their right to access education. Furthermore, for the pastoralists and peasanty societies, drought often force them to migrate into areas with better weather conditions which support pastoral and agricultural activities. This means that the family will migrate with all their children, which disrupts the continuity of children education and in some cases they miss it completely.
In 2009 the northern part of the country, where most of rural dwellers are pastoralists, particularly Manyara and Arusha experienced severe drought. Households could not depend on income from selling their livestock as buyers demanded very low price. They became increasingly reliant on food aid and sometimes had to sell their animals at that very low price in order to have money for family use and send their children to school. The drought exposed country to poverty and food insecure as most of the livestock died due to lack of pastures and water. Children were taken out of school to work in order to increase household income and enhance food security, thereby affecting school attendance.
45
Increased instances of fl ooding and other natural phenomena also results in their houses, school buildings and other infrastructure such as roads and bridges, etc. being damaged, impacting on children’s right to receive education. Floods lead to waterborne diseases which normally affect children incapacitating them from attending school. For example, when Kilosa district was hit by fl oods in December 2009 and January 2010), three primary schools were destroyed and permanently closed. Eight schools were closed for several weeks in order to provide temporary accommodation for fl ood victims, thus not allowing children access to education in such premises. Similar experiences were reported for the fl oods in Kongwa and Mpwapwa between December 2009 and January 2010, and in Kilombero valley in January to February 2011 (Daily News, 12th May 2011). In March 2006, a cyclone hit Liwale district where fi ve classrooms and two offi ces were damaged affecting 225 pupils. Such incidences of extreme weather conditions due to climate change are expected to continue.
2.3.2 Vulnerability
Tanzania is experiencing the impacts of extreme weather events, such as drought and fl ood events that have had signifi cant impact to both the people and the economy. Severe droughts are increasingly being felt in many parts of the country with negative consequences on, among others, food production and water scarcity. Droughts have seriously affected most vulnerable sectors including agriculture, forestry, fi sheries, energy, health, water, industry, business/trade, tourism and services.
The livelihoods of about 80% of Tanzanians depend on the agriculture, forestry and fi sheries resources. Small-scale farmers are more vulnerable as they are highly dependent upon rain fed production. In addition to the effects of prolonged dry spells or droughts on crops and livestock, periods of increased rainfall (with associated increase in pests and diseases) will negatively affect agricultural output. High rainfall intensity also infl uences soil degradation.
The major portion of Tanzania’s electricity supply comes from hydro-generation. Rainfall variability has affected power generation and supply, changing the energy mix from over 60% hydro ten years ago to less than 50% hydro to date.
Tanzania’s industries are mainly agro-based, dealing mainly with processing of agricultural and wood products, and manufacturing of agrochemicals. These products are vulnerable to climate change. Some manufacturing industries aligned to the agricultural sector will be affected by the climate change-impacted agricultural economy.
46
Infrastructure is highly vulnerable to climate change impacts, e.g. through damage caused by fl ooding. Such disruptions may act as disincentives to investment, and sustainable economic growth and poverty reduction. Similarly, various service sectors are vulnerable to the impacts of climate change and may require rapid response to be able to avert the needed resiliencies.
Agricultural development is strongly dependent on environmental resources such as land, forest, air, water and other resources. Thus sustainable utilization of these resources is vital for the growth and sustainability of the sector. However, as noted earlier, agriculture is vulnerable to the effects of climate change associated with global warming. The increased vulnerability of this sector is the biggest challenge for sustained economic development and improved livelihood in the rural communities.
2.4 Climate Change Initiatives and Governance
2.4.1 Climate Change Initiatives
In addressing climate change at national level, various initiatives and programmes have been undertaken in Tanzania in the context of UNFCCC and its Kyoto Protocol. As the fi rst step, Tanzania ratifi ed UNFCCC and its Kyoto Protocol in 1996 and 2002, respectively to ensure that climate change issues are addressed at the national level supported by national policies and legislation. Therefore, implementation of the UNFCCC and the Kyoto Protocol is further supported by the enabling environment including the National Environment Policy (1997) and the EMA.
Various adaptation and mitigation initiatives and programmes, strategies and plans as shown in Table 3 demonstrates the national commitment in addressing climate change issues and its contribution to global efforts to adapt and mitigate climate change. Formulation of NAPA in 2007 formed a clear basis for identifying and implementing adaptation actions at both sectoral and local levels. Furthermore, several mitigation initiatives have been implemented in the context of CDM and other emerging mitigation opportunities such as REDD+. Ongoing national REDD+ initiatives are expected to enhance the contribution of Tanzania as the net sink through its forests in various forms.
Generally, all initiatives at both national and local levels are geared towards enhancing Tanzania’s participation in addressing climate change in order to build resilience and achieve sustainable development. Tanzania will continue to explore all emerging opportunities under the Convention and its Kyoto Protocol in the subsequent commitment periods to be agreed upon by the Parties. It
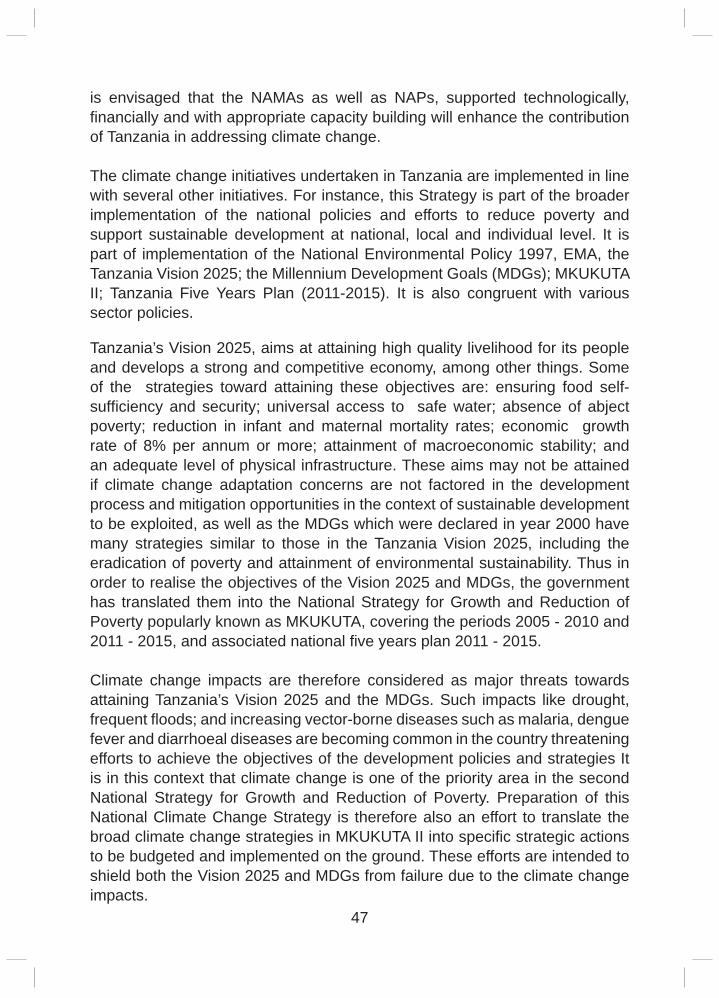
47
is envisaged that the NAMAs as well as NAPs, supported technologically, fi nancially and with appropriate capacity building will enhance the contribution of Tanzania in addressing climate change.
The climate change initiatives undertaken in Tanzania are implemented in line with several other initiatives. For instance, this Strategy is part of the broader implementation of the national policies and efforts to reduce poverty and support sustainable development at national, local and individual level. It is part of implementation of the National Environmental Policy 1997, EMA, the Tanzania Vision 2025; the Millennium Development Goals (MDGs); MKUKUTA II; Tanzania Five Years Plan (2011-2015). It is also congruent with various sector policies.
Tanzania’s Vision 2025, aims at attaining high quality livelihood for its people and develops a strong and competitive economy, among other things. Some of the strategies toward attaining these objectives are: ensuring food self-suffi ciency and security; universal access to safe water; absence of abject poverty; reduction in infant and maternal mortality rates; economic growth rate of 8% per annum or more; attainment of macroeconomic stability; and an adequate level of physical infrastructure. These aims may not be attained if climate change adaptation concerns are not factored in the development process and mitigation opportunities in the context of sustainable development to be exploited, as well as the MDGs which were declared in year 2000 have many strategies similar to those in the Tanzania Vision 2025, including the eradication of poverty and attainment of environmental sustainability. Thus in order to realise the objectives of the Vision 2025 and MDGs, the government has translated them into the National Strategy for Growth and Reduction of Poverty popularly known as MKUKUTA, covering the periods 2005 - 2010 and 2011 - 2015, and associated national fi ve years plan 2011 - 2015.
Climate change impacts are therefore considered as major threats towards attaining Tanzania’s Vision 2025 and the MDGs. Such impacts like drought, frequent fl oods; and increasing vector-borne diseases such as malaria, dengue fever and diarrhoeal diseases are becoming common in the country threatening efforts to achieve the objectives of the development policies and strategies It is in this context that climate change is one of the priority area in the second National Strategy for Growth and Reduction of Poverty. Preparation of this National Climate Change Strategy is therefore also an effort to translate the broad climate change strategies in MKUKUTA II into specifi c strategic actions to be budgeted and implemented on the ground. These efforts are intended to shield both the Vision 2025 and MDGs from failure due to the climate change impacts.
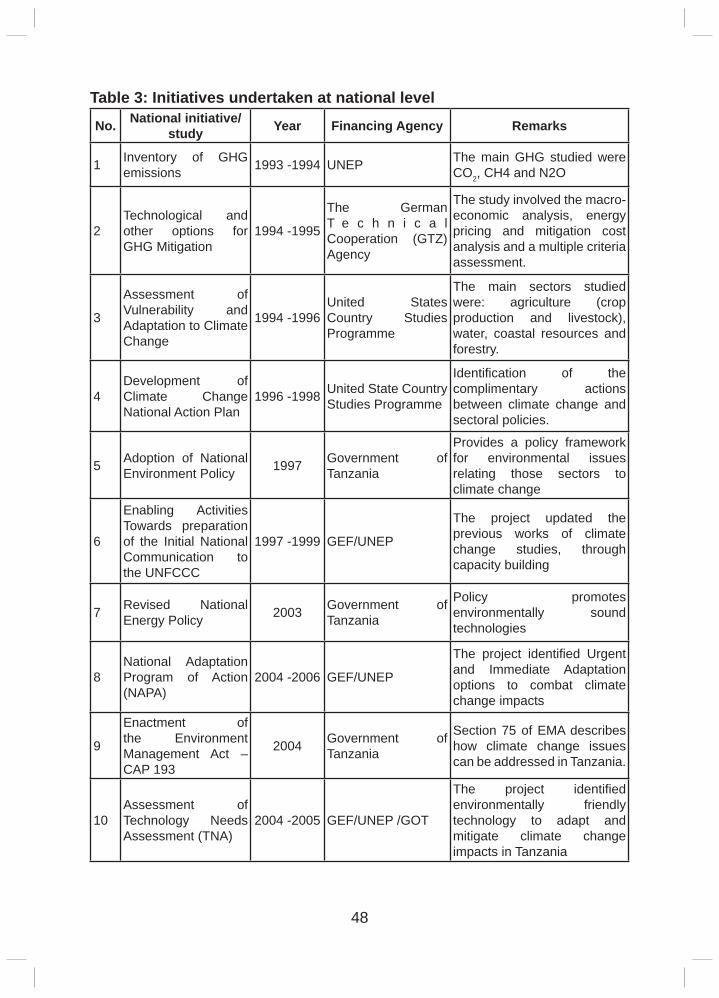
48
Table 3: Initiatives undertaken at national level
No. National initiative/ study Year Financing Agency Remarks
1 Inventory of GHG emissions 1993 -1994 UNEP The main GHG studied were
CO2, CH4 and N2O
2Technological and other options for GHG Mitigation
1994 -1995
The German T e c h n i c a l Cooperation (GTZ) Agency
The study involved the macro-economic analysis, energy pricing and mitigation cost analysis and a multiple criteria assessment.
3
Assessment of Vulnerability and Adaptation to Climate Change
1994 -1996United States Country Studies Programme
The main sectors studied were: agriculture (crop production and livestock), water, coastal resources and forestry.
4Development of Climate Change National Action Plan
1996 -1998 United State Country Studies Programme
Identifi cation of the complimentary actions between climate change and sectoral policies.
5 Adoption of National Environment Policy 1997 Government of
Tanzania
Provides a policy framework for environmental issues relating those sectors to climate change
6
Enabling Activities Towards preparation of the Initial National Communication to the UNFCCC
1997 -1999 GEF/UNEP
The project updated the previous works of climate change studies, through capacity building
7 Revised National Energy Policy 2003 Government of
Tanzania
Policy promotes environmentally sound technologies
8National Adaptation Program of Action (NAPA)
2004 -2006 GEF/UNEP
The project identifi ed Urgent and Immediate Adaptation options to combat climate change impacts
9
Enactment of the Environment Management Act – CAP 193
2004 Government of Tanzania
Section 75 of EMA describes how climate change issues can be addressed in Tanzania.
10Assessment of Technology Needs Assessment (TNA)
2004 -2005 GEF/UNEP /GOT
The project identifi ed environmentally friendly technology to adapt and mitigate climate change impacts in Tanzania
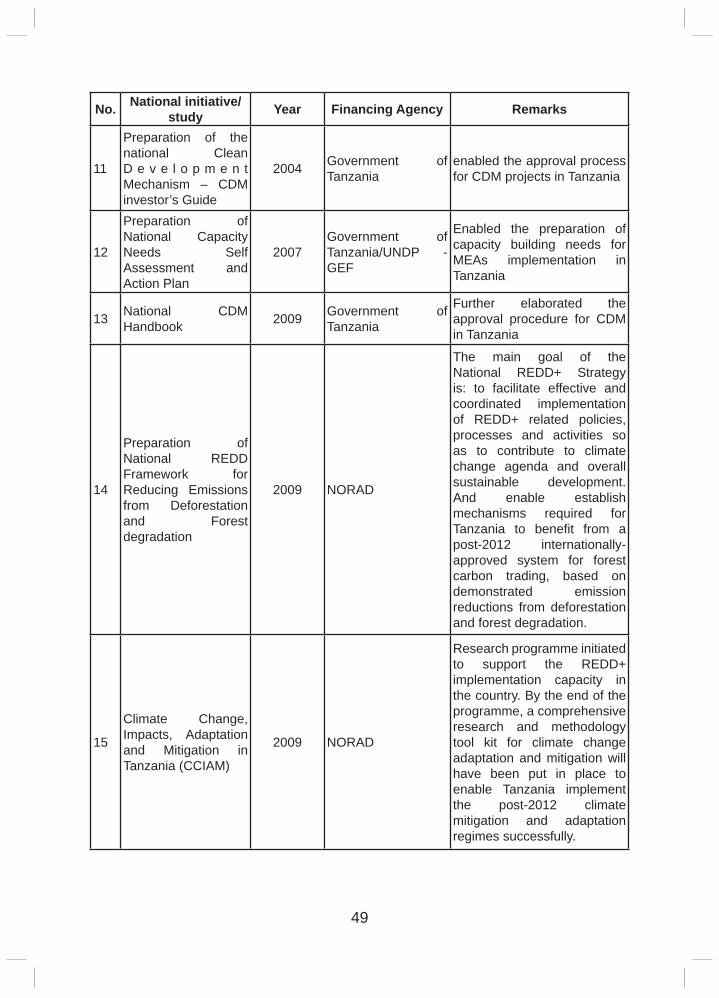
49
No. National initiative/ study Year Financing Agency Remarks
11
Preparation of the national Clean D e v e l o p m e n t Mechanism – CDM investor’s Guide
2004 Government of Tanzania
enabled the approval process for CDM projects in Tanzania
12
Preparation of National Capacity Needs Self Assessment and Action Plan
2007Government of Tanzania/UNDP - GEF
Enabled the preparation of capacity building needs for MEAs implementation in Tanzania
13 National CDM Handbook 2009 Government of
Tanzania
Further elaborated the approval procedure for CDM in Tanzania
14
Preparation of National REDD Framework for Reducing Emissions from Deforestation and Forest degradation
2009 NORAD
The main goal of the National REDD+ Strategy is: to facilitate effective and coordinated implementation of REDD+ related policies, processes and activities so as to contribute to climate change agenda and overall sustainable development. And enable establish mechanisms required for Tanzania to benefi t from a post-2012 internationally-approved system for forest carbon trading, based on demonstrated emission reductions from deforestation and forest degradation.
15
Climate Change, Impacts, Adaptation and Mitigation in Tanzania (CCIAM)
2009 NORAD
Research programme initiated to support the REDD+ implementation capacity in the country. By the end of the programme, a comprehensive research and methodology tool kit for climate change adaptation and mitigation will have been put in place to enable Tanzania implement the post-2012 climate mitigation and adaptation regimes successfully.
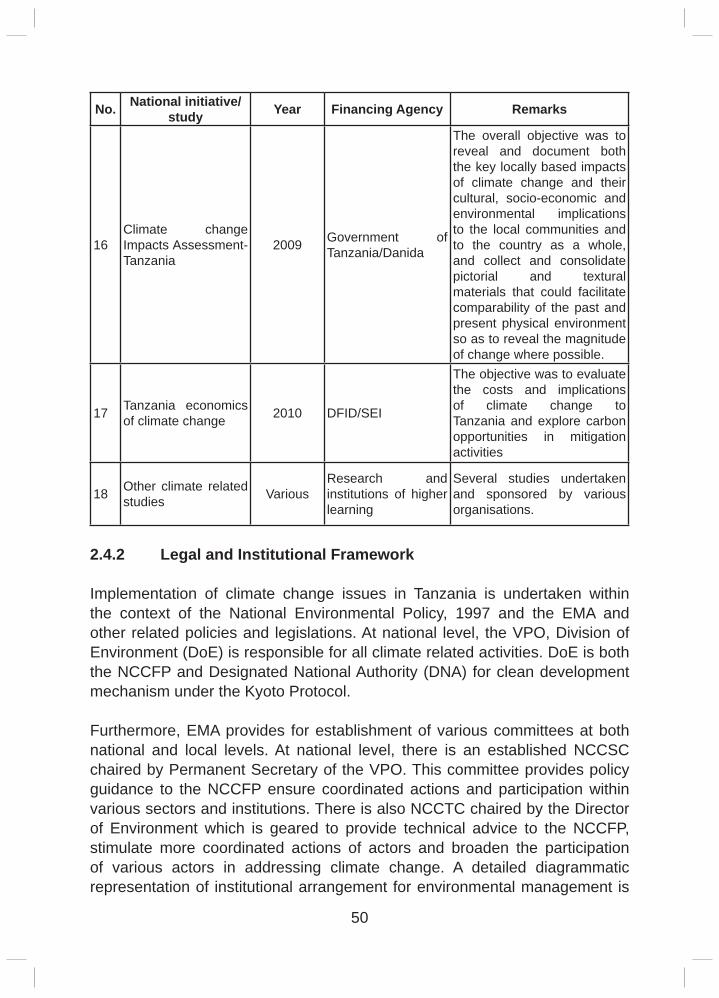
50
No. National initiative/ study Year Financing Agency Remarks
16Climate change Impacts Assessment-Tanzania
2009 Government of Tanzania/Danida
The overall objective was to reveal and document both the key locally based impacts of climate change and their cultural, socio-economic and environmental implications to the local communities and to the country as a whole, and collect and consolidate pictorial and textural materials that could facilitate comparability of the past and present physical environment so as to reveal the magnitude of change where possible.
17 Tanzania economics of climate change 2010 DFID/SEI
The objective was to evaluate the costs and implications of climate change to Tanzania and explore carbon opportunities in mitigation activities
18 Other climate related studies Various
Research and institutions of higher learning
Several studies undertaken and sponsored by various organisations.
2.4.2 Legal and Institutional Framework
Implementation of climate change issues in Tanzania is undertaken within the context of the National Environmental Policy, 1997 and the EMA and other related policies and legislations. At national level, the VPO, Division of Environment (DoE) is responsible for all climate related activities. DoE is both the NCCFP and Designated National Authority (DNA) for clean development mechanism under the Kyoto Protocol.
Furthermore, EMA provides for establishment of various committees at both national and local levels. At national level, there is an established NCCSC chaired by Permanent Secretary of the VPO. This committee provides policy guidance to the NCCFP ensure coordinated actions and participation within various sectors and institutions. There is also NCCTC chaired by the Director of Environment which is geared to provide technical advice to the NCCFP, stimulate more coordinated actions of actors and broaden the participation of various actors in addressing climate change. A detailed diagrammatic representation of institutional arrangement for environmental management is
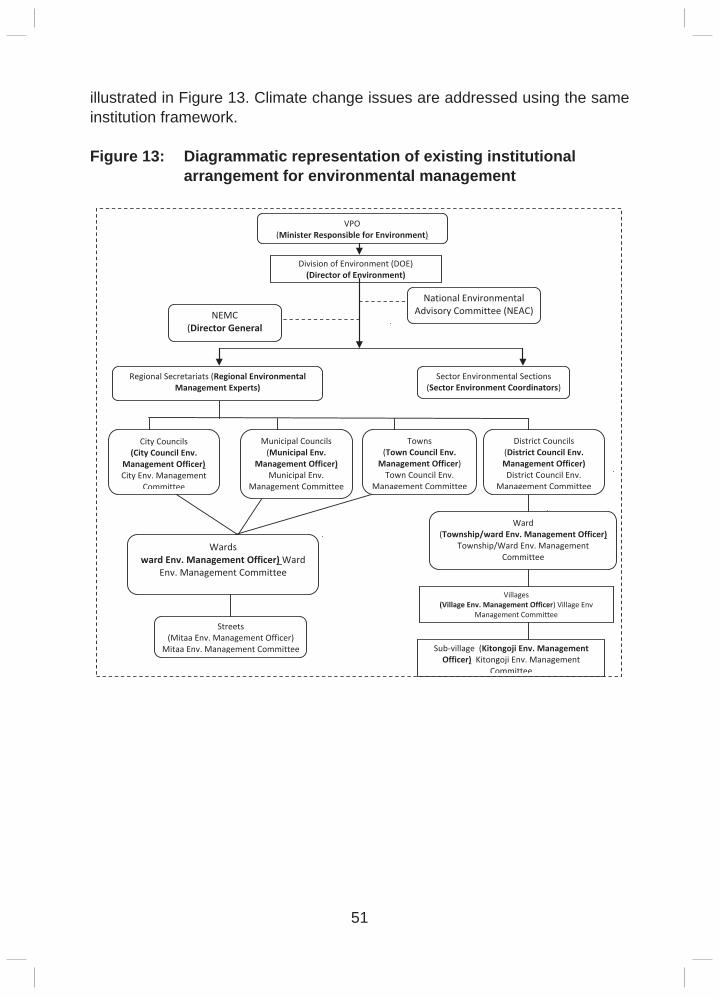
51
illustrated in Figure 13. Climate change issues are addressed using the same institution framework.
Figure 13: Diagrammatic representation of existing institutional arrangement for environmental management
Ward (Township/ward Env. Management Officer)
Township/Ward Env. Management Committee
Villages (Village Env. Management Officer) Village Env
Management CommitteeStreets
(Mitaa Env. Management Officer) Mitaa Env. Management Committee
City Councils (City Council Env.
Management Officer) City Env. Management
Committee
Municipal Councils (Municipal Env.
Management Officer) Municipal Env.
Management Committee
Towns (Town Council Env.
Management Officer) Town Council Env.
Management Committee
District Councils (District Council Env. Management Officer) District Council Env.
Management Committee
Division of Environment (DOE) (Director of Environment)
NEMC (Director General
VPO (Minister Responsible for Environment)
National Environmental Advisory Committee (NEAC)
Sector Environmental Sections (Sector Environment Coordinators)
Regional Secretariats (Regional Environmental Management Experts)
Wards ward Env. Management Officer) Ward
Env. Management Committee
Sub-village (Kitongoji Env. Management Officer) Kitongoji Env. Management
Committee
52
3. THE CLIMATE CHANGE STRATEGY
This Strategy has been developed with a Vision to enhance climate resilience in Tanzania and reduce the vulnerability of natural and social systems to climate change. The Mission is to establish effi cient and effective mechanisms to address climate change adaptation and achieve sustainable national development through mitigation actions with enhanced international cooperation.
3.1 GoalThe goal of this Strategy is to enable Tanzania to effectively adapt to and participate in global efforts to mitigate to climate change with a view to achieving sustainable economic growth in the context of the Tanzania’s national development blueprint, Vision 2025; Five Years National Development plan; and national cross sectoral policies in line with established international policy frameworks.
3.2 Objectives To achieve the stated goal, the following specifi c objectives have been set.
a) To build the capacity of Tanzania to adapt to climate change impacts.
b) To enhance resilience of ecosystems to the challenges posed by climate change.
c) To enable accessibility and utilization of the available climate change opportunities.
d) To enhance participation in climate change mitigation activities that lead to sustainable development.
e) To enhance public awareness on climate change.
f) To strengthen information management on climate change.
g) To enhance institutional arrangements to adequately address climate change.
h) To enhance mobilization of resources in particular fi nance to address climate change.
3.3 Scope This Strategy covers broader areas strategic interventions which indicate strategic actionable objectives that need to be implemented. The broader strategic areas are related to adaptation, mitigation and cross-cutting issues. For implementation purposes, this Strategy includes coordination, resource
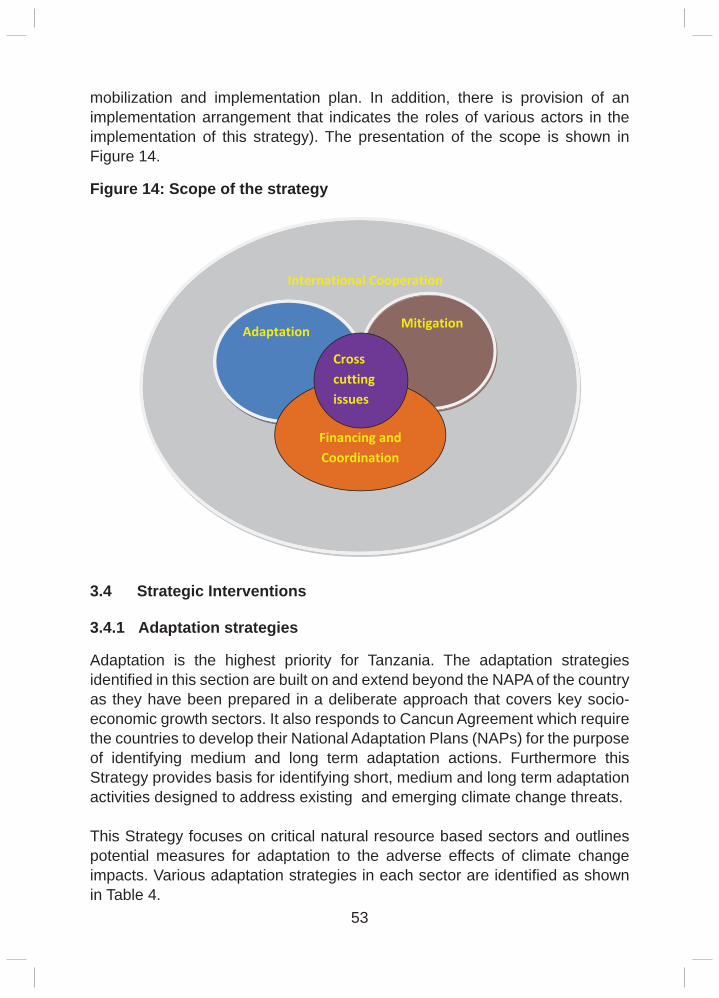
53
mobilization and implementation plan. In addition, there is provision of an implementation arrangement that indicates the roles of various actors in the implementation of this strategy). The presentation of the scope is shown in Figure 14.
Figure 14: Scope of the strategy
International Cooperation
Adaptation Mitigation
Financing and Coordination
Cross cutting issues
3.4 Strategic Interventions
3.4.1 Adaptation strategies
Adaptation is the highest priority for Tanzania. The adaptation strategies identifi ed in this section are built on and extend beyond the NAPA of the country as they have been prepared in a deliberate approach that covers key socio- economic growth sectors. It also responds to Cancun Agreement which require the countries to develop their National Adaptation Plans (NAPs) for the purpose of identifying medium and long term adaptation actions. Furthermore this Strategy provides basis for identifying short, medium and long term adaptation activities designed to address existing and em erging climate change threats.
This Strategy focuses on critical natural resource based sectors and outlines potential measures for adaptation to the adverse effects of climate change impacts. Various adaptation strategies in each sector are identifi ed as shown in Table 4.
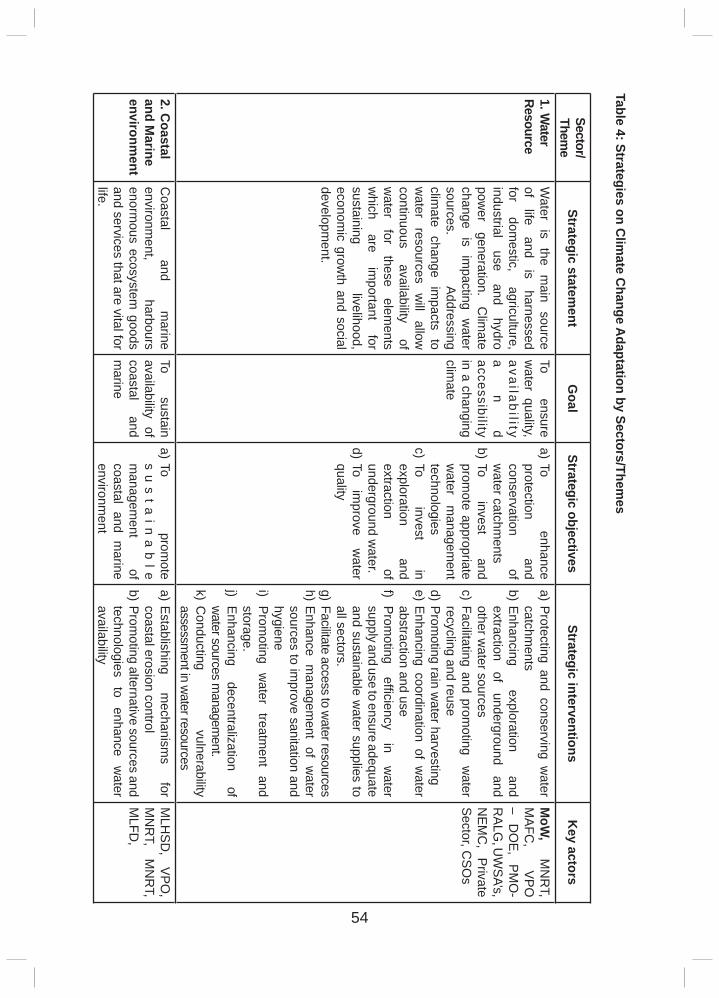
54
Table 4: Strategies on Clim
ate Change A
daptation by Sectors/Themes
Sector/ Them
eStrategic statem
entG
oalStrategic objectives
Strategic interventionsK
ey actors
1. Water
ResourceW
ater is
the m
ain source
of life
and is
harnessed for
domestic,
agriculture, industrial
use and
hydro pow
er generation.
Clim
ate change
is im
pacting w
ater sources.
Addressing clim
ate change
impacts
to w
ater resources
will
allow
continuous availability
of w
ater for
these elem
ents w
hich are
important
for sustaining
livelihood, econom
ic growth and social
development.
To ensure
water quality,
ava
ilab
ility a
nd
accessibility in a changing clim
ate
a) To enhance
protection and
conservation of
water catchm
ents b) To
invest and
promote appropriate
water
managem
ent technologies
c) To invest
in exploration
and extraction
of underground w
ater.d) To
improve
water
quality
a) Protecting and conserving water
catchments
b) Enhancing exploration
and extraction
of underground
and other w
ater sources c) Facilitating and prom
oting water
recycling and reused) Prom
oting rain water harvesting
e) Enhancing coordination of water
abstraction and usef) Prom
oting effi ciency
in w
ater supply and use to ensure adequate and sustainable w
ater supplies to all sectors.
g) Facilitate access to water resources
h) Enhance managem
ent of water
sources to improve sanitation and
hygienei)
Promoting
water
treatment
and storage.
j) Enhancing
decentralization of
water sources m
anagement.
k) Conducting
vulnerability assessm
ent in water resources
MoW
, M
NR
T, M
AFC,
VPO
–
DO
E, PM
O-
RALG
, UW
SA’s, N
EMC
, Private
Sector, CSO
s
2. Coastal
and Marine
environment
Coastal
and m
arine environm
ent, harbours
enormous ecosystem
goods and services that are vital for life.
To sustain
availability of coastal
and m
arine
a) To prom
ote s
us
ta
ina
ble
managem
ent of
coastal and marine
environment
a) Establishing m
echanisms
for coastal erosion control
b) Promoting alternative sources and
technologies to
enhance w
ater availability
MLH
SD,
VPO,
MN
RT,
MN
RT,
MLFD
,
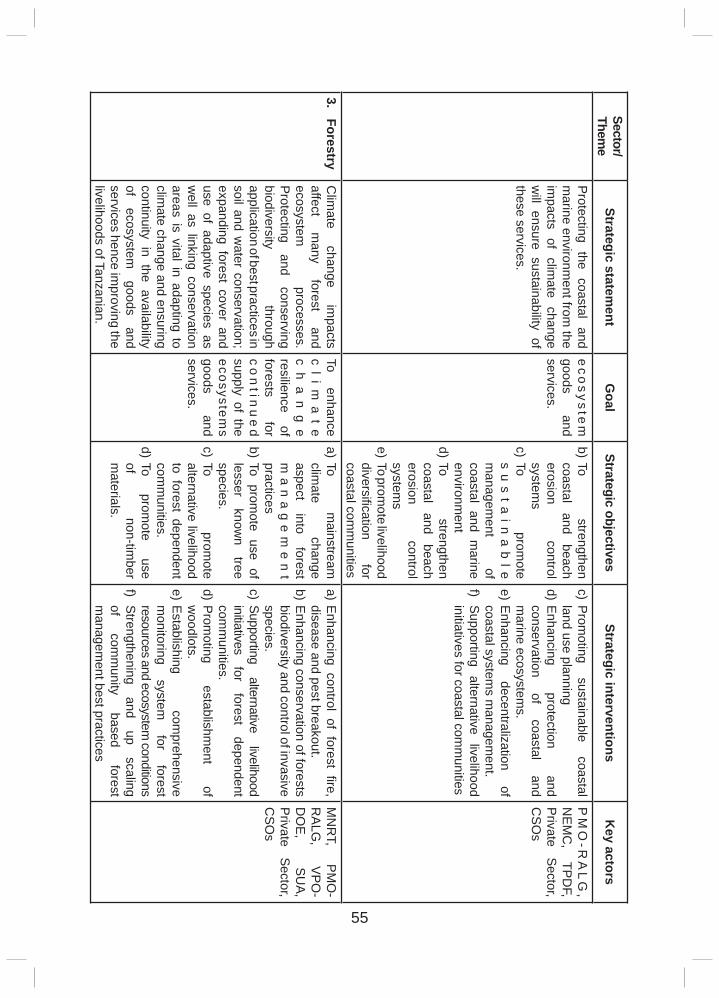
55
Sector/ Them
eStrategic statem
entG
oalStrategic objectives
Strategic interventionsK
ey actors
Protecting the
coastal and
marine environm
ent from the
impacts
of clim
ate change
will ensure sustainability of
these services.
eco
system
goods
and services.
b) To strengthen
coastal and
beach erosion
control system
sc) To
promote
su
st
ain
ab
le m
anagement
of coastal and m
arine environm
entd) To
strengthen coastal
and beach
erosion control
systems
e) To promote livelihood
diversifi cation for
coastal comm
unities
c) Promoting
sustainable coastal
land use planningd) Enhancing
protection and
conservation of
coastal and
marine ecosystem
s. e) Enhancing
decentralization of
coastal systems m
anagement.
f) Supporting alternative
livelihood initiatives for coastal com
munities
PM
O-R
AL
G,
NEM
C,
TPDF,
Private Sector,
CSO
s
3. ForestryC
limate
change im
pacts affect
many
forest and
ecosystem
processes. Protecting
and conserving
biodiversity through
application of best practices in soil and w
ater conservation; expanding forest cover and use of adaptive species as w
ell as linking conservation areas is vital in adapting to clim
ate change and ensuring continuity in the availability of
ecosystem
goods and
services hence improving the
livelihoods of Tanzanian.
To enhance
cl
im
at
e c
ha
ng
e resilience
of forests
for c
on
tinu
ed
supply of the ecosystem
s goods
and services.
a) To m
ainstream
climate
change aspect
into forest
ma
na
ge
me
nt
practicesb) To prom
ote use of lesser
known
tree species.
c) To prom
ote alternative livelihood to forest dependent com
munities.
d) To prom
ote use
of non-tim
ber m
aterials.
a) Enhancing control of forest fi re, disease and pest breakout.
b) Enhancing conservation of forests biodiversity and control of invasive species.
c) Supporting alternative
livelihood initiatives
for forest
dependent com
munities.
d) Promoting
establishment
of w
oodlots.e) Establishing
comprehensive
monitoring
system
for forest
resources and ecosystem conditions
f) Strengthening and
up scaling
of com
munity
based forest
managem
ent best practices
MN
RT,
PMO
-R
ALG,
VPO-
DO
E,
SUA,
Private Sector,
CSO
s

56
Sector/ Them
eStrategic statem
entG
oalStrategic objectives
Strategic interventionsK
ey actors
e) To P
romote
deliberate greening
activities
g) Prom
oting use
of non
wood
construction materials.
h) Prom
oting energy
effi cient technologies.
i) E
nhancing decentralization
of forest m
anagemen
4. Wildlife
Reducing vulnerability of the
wildlife and habitats to clim
ate change
will
signifi cantly contribute
to ecosystem
integrity
and ensure
sustainable managem
ent of w
ildlife resources.
To enhance
res
ilien
ce
of w
ildlife ecosystem
s to
impacts
of clim
ate change.
a) To prom
ote w
ildlife m
an
ag
em
en
t practices
that increase
resilience to clim
ate change.b) To establish w
ildlife clim
ate change
related m
onitoring and
information
ma
na
ge
me
nt
systems
a) Enhancing
protection and
conservation of wildlife habitats
b) Strengthening w
ildlife information
database and
managem
ent system
sc) E
nhancing m
anagement
of em
erging human-w
ildlife confl ictsd) P
romoting
appropriate m
ethods for conservation of clim
ate change threatened species.
e) Enhancing
involvement
of local
comm
unities in
wildlife
conservation through
Wildlife
Managem
ent Areas (W
MA
)f) C
onducting vulnerability
assessment of w
ildlifeg) Enhance controlled fi re m
anagement
system in w
ildlife habitats
MN
RT,
LGA
s, T
AN
AP
A,
Private
Sector,
CS
Os
5.Agriculture
and food security
More than 80%
of population in
Tanzania depends
on clim
ate sensitive
rain fed
agriculture as
source of
livelihood. R
educing vulnerability
of the
sector to
climate
change w
ill signifi cantly contribute to
To enhance
resilience of
ag
ricultu
re sector
to c
li
ma
te
change for
sustainable livelihood.
a) To identify
suitable crops for new
agro-ecological zones.
b) To prom
ote a
pp
ro
pr
iat
e agricultural practices that increase resilience to clim
ate change.
a) Assessing crop vulnerability and
suitability (cropping
pattern) for
different Agro-ecological zones
b) Assess
trade com
parative advantage
on traditional
export crops w
ith changing climate
c) Prom
oting appropriate
irrigation system
s
MA
FC,
PM
O,
MoT,
Ministry
of W
orks, M
LH
HS
D,
MS
CT N
ational Food
Reserve
Agency, TFD
A,
TBS
, TMA
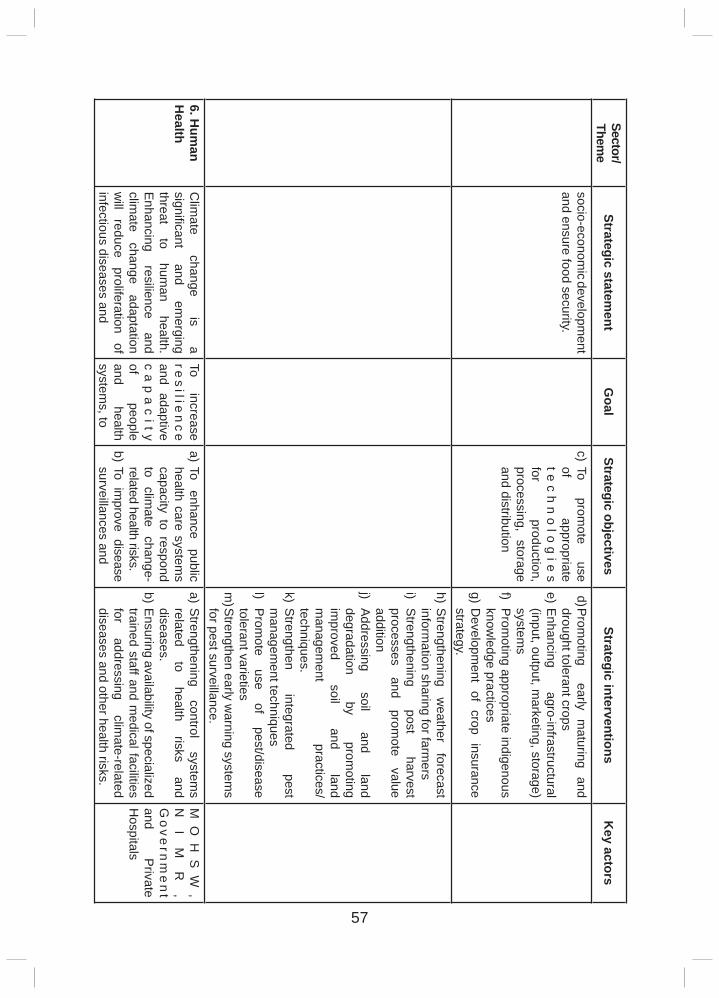
57
Sector/ Them
eStrategic statem
entG
oalStrategic objectives
Strategic interventionsK
ey actors
socio-economic developm
ent and ensure food security.
c) To prom
ote use
of appropriate
tec
hn
olo
gie
s for
production, processing,
storage and distribution
d) Prom
oting
early m
aturing and
drought tolerant crops e) E
nhancing agro-infrastructural
(input, output, marketing, storage)
systems
f) Prom
oting appropriate indigenous know
ledge practices g) D
evelopment
of crop
insurance strategy.
h) Strengthening
weather
forecast inform
ation sharing for farmers
i) S
trengthening post
harvest processes
and prom
ote value
additionj)
Addressing
soil and
land degradation
by prom
oting im
proved soil
and land
managem
ent practices/
techniques.k) S
trengthen integrated
pest m
anagement techniques
l) P
romote
use of
pest/disease tolerant varieties
m) S
trengthen early warning system
s for pest surveillance.
6. Hum
an H
ealthC
limate
change is
a signifi cant
and em
erging threat
to hum
an health.
Enhancing
resilience and
climate
change adaptation
will
reduce proliferation
of infectious diseases and
To increase
res
ilien
ce
and adaptive c
ap
ac
ity of
people and
health system
s, to
a) To enhance
public health care system
s capacity to respond to
climate
change-related health risks.
b) To improve disease
surveillances and
a) Strengthening
control system
s related
to health
risks and
diseases.b) E
nsuring availability of specialized trained staff and m
edical facilities for
addressing clim
ate-related diseases and other health risks.
MO
HS
W,
NI
MR
, G
ov
ern
me
nt
and P
rivate H
ospitals
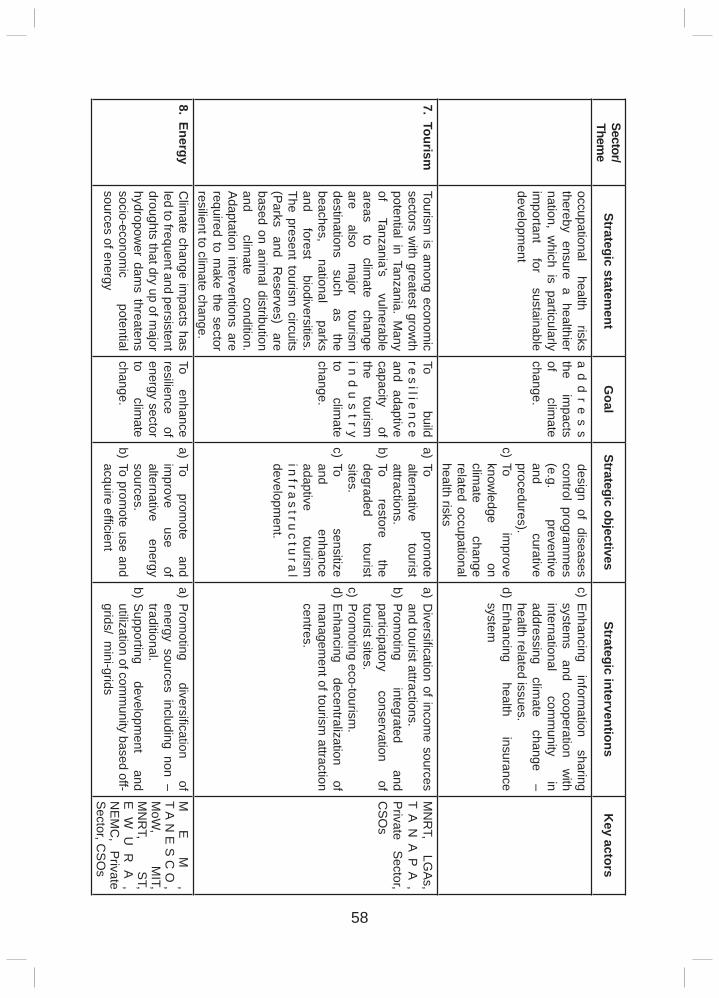
58
Sector/ Them
eStrategic statem
entG
oalStrategic objectives
Strategic interventionsK
ey actors
occupational health
risks thereby
ensure a
healthier nation, w
hich is particularly im
portant for
sustainable developm
ent
ad
dr
es
s the
impacts
of clim
ate change.
design of diseases control program
mes
(e.g. preventive
and curative
procedures).c) To
improve
knowledge
on clim
ate change
related occupational health risks
c) Enhancing
information
sharing system
s and
cooperation w
ith international
comm
unity in
addressing clim
ate change
– health related issues.
d) Enhancing
health insurance
system
7. TourismTourism
is among econom
ic sectors w
ith greatest growth
potential in Tanzania. Many
of Tanzania’s
vulnerable areas
to clim
ate change
are also
major
tourism
destinations such
as the
beaches, national
parks and
forest biodiversities.
The present tourism circuits
(Parks
and R
eserves) are
based on animal distribution
and clim
ate condition.
Adaptation interventions are
required to make the sector
resilient to climate change.
To build
res
ilien
ce
and adaptive capacity
of the
tourism
ind
us
try
to clim
ate change.
a) To prom
ote alternative
tourist attractions.
b) To restore
the degraded
tourist sites.
c) To sensitize
and enhance
adaptive tourism
in
fras
truc
tura
l developm
ent.
a) Diversifi cation of incom
e sources and tourist attractions.
b) Prom
oting integrated
and participatory
conservation of
tourist sites.c) P
romoting eco-tourism
.d) E
nhancing decentralization
of m
anagement of tourism
attraction centres.
MN
RT,
LGA
s, T
AN
AP
A,
Private
Sector,
CS
Os
8. EnergyC
limate change im
pacts has led to frequent and persistent droughts that dry up of m
ajor hydropow
er dams threatens
socio-economic
potential sources of energy
To enhance
resilience of
energy sector to
climate
change.
a) To prom
ote and
improve
use of
alternative energy
sources.b) To prom
ote use and acquire effi cient
a) Prom
oting diversifi cation
of energy sources including non – traditional.
b) Supporting
development
and utilization of com
munity based off-
grids/ mini-grids
ME
M,
TA
NE
SC
O,
MoW
, M
IT, M
NR
T, S
T, E
WU
RA
, N
EM
C, P
rivate S
ector, CS
Os
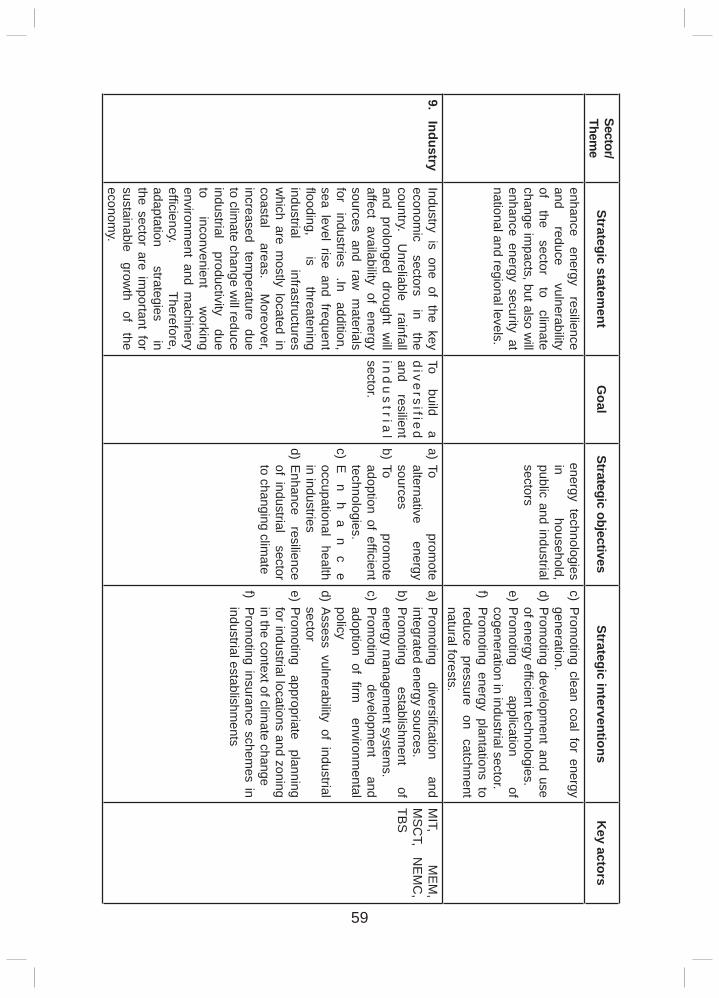
59
Sector/ Them
eStrategic statem
entG
oalStrategic objectives
Strategic interventionsK
ey actors
enhance energy
resilience and
reduce vulnerability
of the
sector to
climate
change impacts, but also w
ill enhance energy security at national and regional levels.
energy technologies in
household, public and industrial sectors
c) Prom
oting clean coal for energy generation.
d) Prom
oting development and use
of energy effi cient technologies.e) P
romoting
application of
cogeneration in industrial sector.f)
Prom
oting energy plantations to reduce
pressure on
catchment
natural forests.9. Industry
Industry is one of the key econom
ic sectors
in the
country. U
nreliable rainfall
and prolonged drought will
affect availability of energy sources and raw
materials
for industries
.In addition,
sea level rise and frequent fl ooding,
is threatening
industrial infrastructures
which are m
ostly located in coastal
areas. M
oreover, increased
temperature
due to clim
ate change will reduce
industrial productivity
due to
inconvenient w
orking environm
ent and machinery
effi ciency. Therefore,
adaptation strategies
in the sector are im
portant for sustainable
growth
of the
economy.
To build
a d
iversifie
d and
resilient in
du
stria
l sector.
a) To prom
ote alternative
energy sources
b) To prom
ote adoption of effi cient technologies.
c) En
ha
nc
e occupational
health in industries
d) Enhance
resilience of industrial sector to changing clim
ate
a) Prom
oting diversifi cation
and integrated energy sources.
b) Prom
oting establishm
ent of
energy managem
ent systems.
c) Prom
oting developm
ent and
adoption of fi rm environm
ental policy
d) Assess vulnerability of industrial
sectore) P
romoting
appropriate planning
for industrial locations and zoning in the context of clim
ate changef)
Prom
oting insurance schemes in
industrial establishments
MIT,
ME
M,
MS
CT,
NE
MC
, TB
S
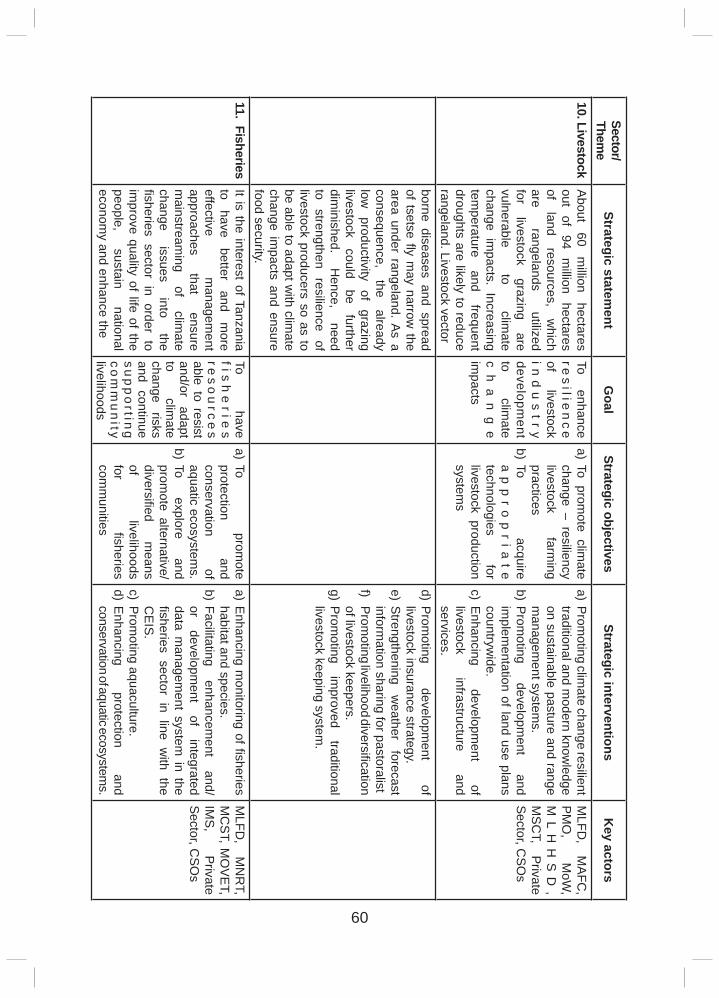
60
Sector/ Them
eStrategic statem
entG
oalStrategic objectives
Strategic interventionsK
ey actors
10. LivestockA
bout 60
million
hectares out
of 94
million
hectares of
land resources,
which
are rangelands
utilized for
livestock grazing
are vulnerable
to clim
ate change im
pacts. Increasing tem
perature and
frequent droughts are likely to reduce rangeland. Livestock vector
To enhance
res
ilien
ce
of livestock
ind
us
try
development
to clim
ate c
ha
ng
e im
pacts
a) To promote clim
ate change – resiliency livestock
farming
practicesb) To
acquire a
pp
ro
pr
iat
e technologies
for livestock production system
s
a) Prom
oting climate change resilient
traditional and modern know
ledge on sustainable pasture and range m
anagement system
s.b) P
romoting
development
and im
plementation of land use plans
countrywide.
c) Enhancing
development
of livestock
infrastructure and
services.
MLFD
, M
AFC
, P
MO
, M
oW,
ML
HH
SD
, M
SC
T, P
rivate S
ector, CS
Os
borne diseases and spread of tsetse fl y m
ay narrow the
area under rangeland. As a
consequence, the
already low
productivity
of grazing
livestock could
be further
diminished.
Hence,
need to
strengthen resilience
of livestock producers so as to be able to adapt w
ith climate
change impacts and ensure
food security.
d) Prom
oting developm
ent of
livestock insurance strategy.e) S
trengthening w
eather forecast
information sharing for pastoralist
f) P
romoting livelihood diversifi cation
of livestock keepers.g) P
romoting
improved
traditional livestock keeping system
.
11. FisheriesIt is the interest of Tanzania to
have better
and m
ore effective
managem
ent approaches
that ensure
mainstream
ing of
climate
change issues
into the
fi sheries sector in order to im
prove quality of life of the people,
sustain national
economy and enhance the
To have
fish
erie
s re
so
urc
es
able to resist and/or
adapt to
climate
change risks
and continue su
pp
ortin
g co
mm
un
ity livelihoods
a) To prom
ote protection
and conservation
of aquatic ecosystem
s.b) To
explore and
promote alternative/
diversifi ed m
eans of
livelihoods for
fi sheries com
munities
a) Enhancing m
onitoring of fi sheries habitat and species.
b) Facilitating enhancem
ent and/
or developm
ent of
integrated data m
anagement system
in the fi sheries sector in line w
ith the C
EIS
.c) P
romoting aquaculture.
d) Enhancing
protection and
conservation of aquatic ecosystems.
MLFD
, M
NR
T, M
CS
T, MO
VE
T, IM
S,
Private
Sector, C
SO
s
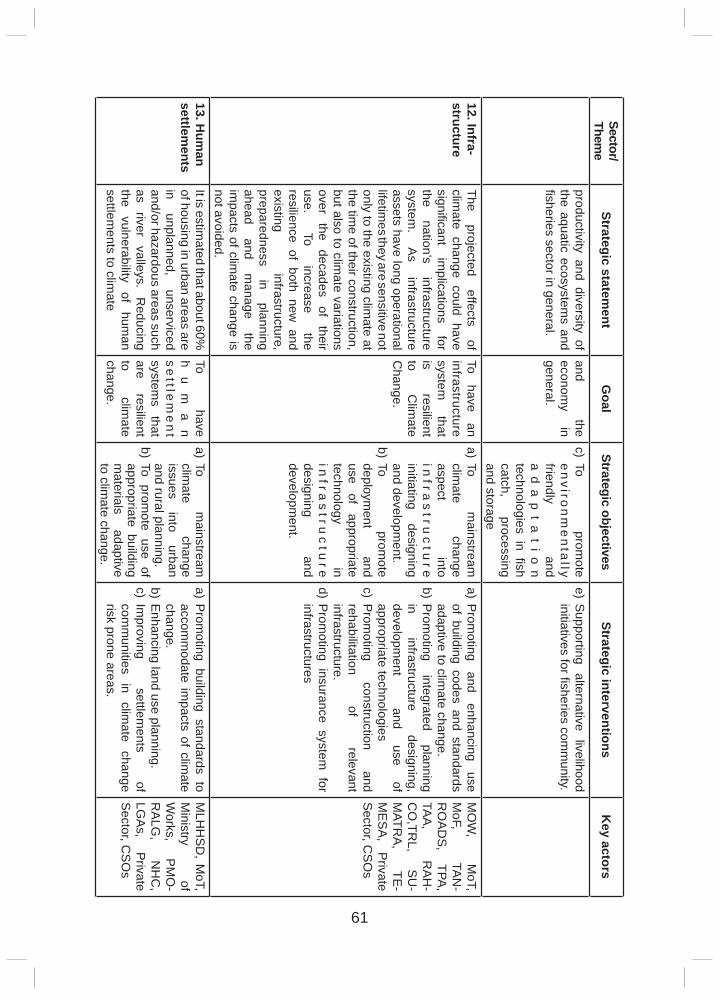
61
Sector/ Them
eStrategic statem
entG
oalStrategic objectives
Strategic interventionsK
ey actors
productivity and diversity of the aquatic ecosystem
s and fi sheries sector in general.
and the
economy
in general.
c) To prom
ote e
nviro
nm
en
tally
friendly and
ad
ap
ta
ti
on
technologies in fi sh catch,
processing and storage
e) Supporting
alternative livelihood
initiatives for fi sheries comm
unity.
12. Infra-structure
The projected
effects of
climate change could have
signifi cant im
plications for
the nation’s
infrastructure system
. A
s infrastructure
assets have long operational lifetim
es they are sensitive not only to the existing clim
ate at the tim
e of their construction, but also to clim
ate variations over
the decades
of their
use. To
increase the
resilience of both new and
existing infrastructure,
preparedness in
planning ahead
and m
anage the
impacts of clim
ate change is not avoided.
To have
an infrastructure system
that
is resilient
to C
limate
Change.
a) To m
ainstream
climate
change aspect
into in
fras
truc
ture
initiating designing
and development.
b) To prom
ote deploym
ent and
use of
appropriate technology
in in
fras
truc
ture
designing and
development.
a) Prom
oting and
enhancing use
of building codes and standards adaptive to clim
ate change.b) P
romoting
integrated planning
in infrastructure
designing, developm
ent
and use
of appropriate technologies
c) Prom
oting construction
and rehabilitation
of relevant
infrastructure.d) P
romoting insurance system
for infrastructures
MO
W,
MoT,
MoF,
TAN
-R
OA
DS
, TPA
, TA
A,
RA
H-
CO
,TRL,
SU
-M
ATRA
, TE
-M
ES
A,
Private
Sector, C
SO
s
13. Hum
an settlem
entsIt is estim
ated that about 60%
of housing in urban areas are in
unplanned, unserviced
and/or hazardous areas such as
river valleys.
Reducing
the vulnerability
of hum
an settlem
ents to climate
To have
hu
ma
n s
ettle
me
nt
systems
that are
resilient to
climate
change.
a) To m
ainstream
climate
change issues
into urban
and rural planning.b) To prom
ote use of appropriate building m
aterials adaptive
to climate change.
a) Prom
oting building standards to accom
modate im
pacts of climate
change.b) E
nhancing land use planning.c) Im
proving settlem
ents of
comm
unities in
climate
change risk prone areas.
MLH
HS
D, M
oT, M
inistry of
Works,
PM
O-
RA
LG,
NH
C,
LGA
s, P
rivate S
ector, CS
Os
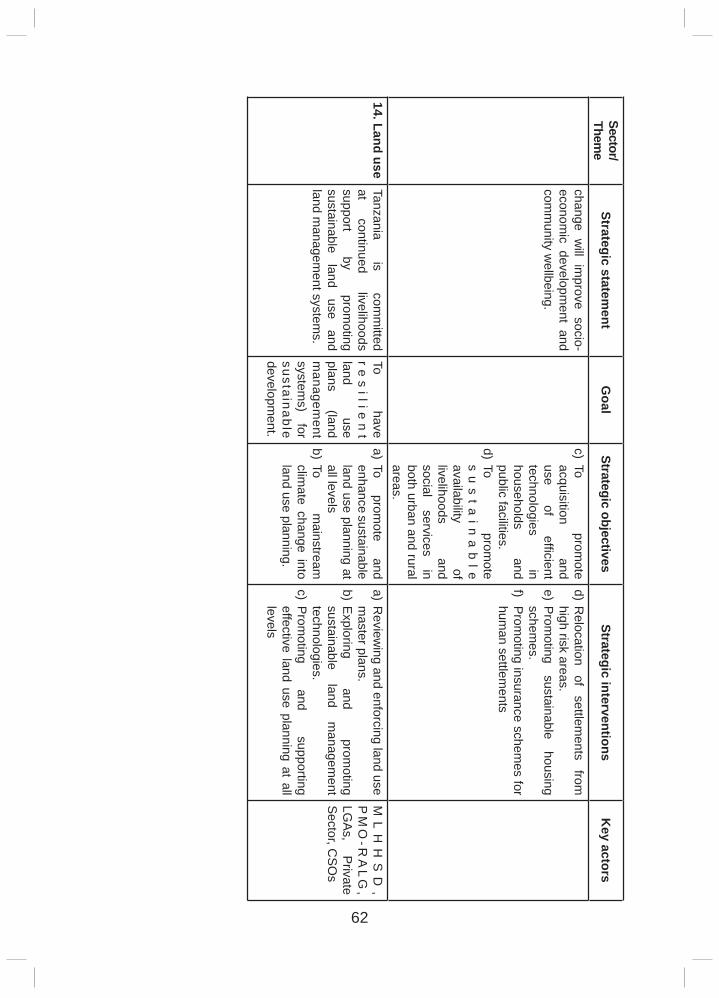
62
Sector/ Them
eStrategic statem
entG
oalStrategic objectives
Strategic interventionsK
ey actors
change will im
prove socio-econom
ic development and
comm
unity wellbeing.
c) To prom
ote acquisition
and use
of effi cient
technologies in
households and
public facilities.d) To
promote
su
st
ain
ab
le availability
of livelihoods
and social
services in
both urban and rural areas.
d) Relocation
of settlem
ents from
high risk areas.
e) Prom
oting sustainable
housing schem
es.f)
Prom
oting insurance schemes for
human settlem
ents
14. Land useTanzania
is com
mitted
at continued
livelihoods support
by prom
oting sustainable
land use
and land m
anagement system
s.
To have
res
ilien
t land
use plans
(land m
anagement
systems)
for sustainable developm
ent.
a) To prom
ote and
enhance sustainable land use planning at all levels
b) To m
ainstream
climate change into
land use planning.
a) Review
ing and enforcing land use m
aster plans.b) E
xploring and
promoting
sustainable land
managem
ent technologies.
c) Prom
oting and
supporting effective land use planning at all levels
ML
HH
SD
, P
MO
-RA
LG
, LG
As,
Private
Sector, C
SO
s
63
3.4.2 Mitigation strategies
Despite its negligible GHG emissions, Tanzania can participate in mitigation activities to contribute to its sustainable national development. Notably, potential sources of emissions include: traditional energy sources, transportation systems, and waste disposal management activities. In light of the opportunities presented by mitigation initiatives, Tanzania stands to gain fi nancially from the mechanisms, such as CDM, NAMAs, REDD+ and other carbon markets/trading. The mitigation strategies earmarked for this Strategy are presented in Table 4.
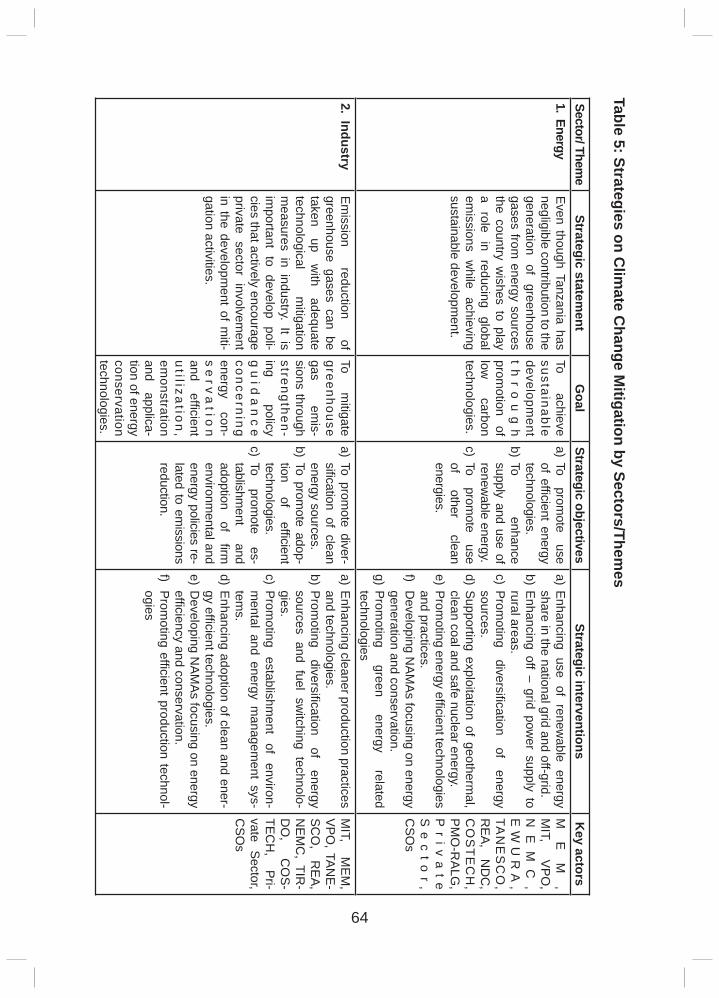
64
Table 5: Strategies on Clim
ate Change M
itigation by Sectors/Themes
Sector/ Theme
Strategic statement
Goal
Strategic objectivesStrategic interventions
Key actors
1. EnergyEven though Tanzania has negligible contribution to the generation
of greenhouse
gases from energy sources
the country wishes to play
a role
in reducing
global em
issions w
hile achieving
sustainable development.
To achieve
sustainable developm
ent t
hr
ou
gh
promotion
of low
carbon
technologies.
a) To prom
ote use
of effi cient energy technologies.
b) To enhance
supply and use of renew
able energy.c) To
promote
use of
other clean
energies.
a) Enhancing use of renewable energy
share in the national grid and off-grid.b) Enhancing off – grid pow
er supply to rural areas.
c) Promoting
diversifi cation of
energy sources.
d) Supporting exploitation of geothermal,
clean coal and safe nuclear energy.e) Prom
oting energy effi cient technologies and practices.
f) D
eveloping NAM
As focusing on energy generation and conservation.
g) Promoting
green energy
related technologies
ME
M,
MIT,
VPO,
NE
MC
, E
WU
RA
, TA
NE
SC
O,
REA,
ND
C,
CO
ST
EC
H,
PM
O-R
ALG
, P
riv
at
e S
ec
to
r,
CSO
s
2. IndustryEm
ission reduction
of greenhouse gases can be taken
up w
ith adequate
technological m
itigation m
easures in industry. It is im
portant to develop poli-cies that actively encourage private sector involvem
ent in the developm
ent of miti-
gation activities.
To m
itigate greenhouse gas
emis-
sions through strengthen-ing
policy g
uid
an
ce
con
cern
ing
energy con-
se
rva
tion
and effi cient
utiliza
tion
, em
onstration and
applica-tion of energy conservation technologies.
a) To promote diver-
sifi cation of clean energy sources.
b) To promote adop-
tion of
effi cient technologies.
c) To prom
ote es-
tablishment
and adoption
of fi rm
environm
ental and energy policies re-lated to em
issions reduction.
a) Enhancing cleaner production practices and technologies.
b) Promoting
diversifi cation of
energy sources and fuel sw
itching technolo-gies.
c) Promoting
establishment
of environ-
mental and energy m
anagement sys-
tems.
d) Enhancing adoption of clean and ener-gy effi cient technologies.
e) Developing N
AMAs focusing on energy
effi ciency and conservation.f)
Promoting effi cient production technol-
ogies
MIT,
MEM
, VPO
, TANE-
SCO
, R
EA, N
EMC
, TIR-
DO
, C
OS-
TECH
, Pri-
vate Sector,
CSO
s
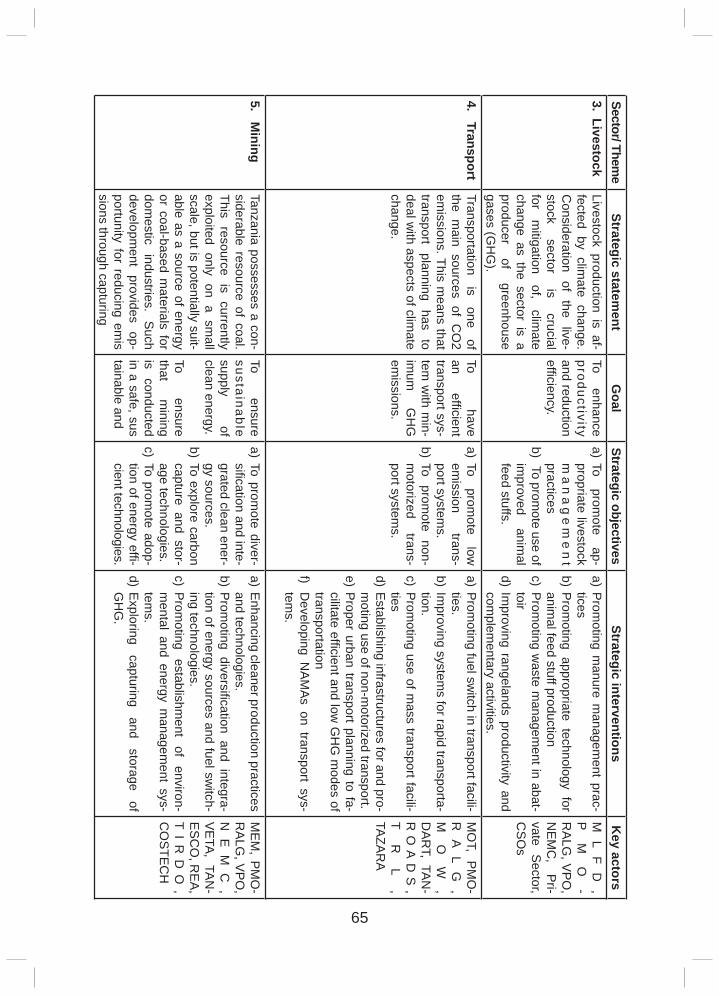
65
Sector/ Theme
Strategic statement
Goal
Strategic objectivesStrategic interventions
Key actors
3. LivestockLivestock production is af-fected by clim
ate change. C
onsideration of
the live-
stock sector
is crucial
for m
itigation of,
climate
change as the sector is a producer
of greenhouse
gases (GH
G).
To enhance
productivity and reduction effi ciency.
a) To prom
ote ap-
propriate livestock m
an
ag
em
en
t practices
b) To promote use of
improved
animal
feed stuffs.
a) Prom
oting manure m
anagement prac-
ticesb) P
romoting appropriate technology for
animal feed stuff production
c) Prom
oting waste m
anagement in abat-
toird) Im
proving rangelands productivity and com
plementary activities.
ML
FD
, P
MO
-R
ALG
, VP
O,
NE
MC
, P
ri-vate
Sector,
CS
Os
4. TransportTransportation
is one
of the m
ain sources of CO
2 em
issions. This means that
transport planning
has to
deal with aspects of clim
ate change.
To have
an effi cient
transport sys-tem
with m
in-im
um
GH
G
emissions.
a) To prom
ote low
em
ission trans-
port systems.
b) To prom
ote non-
motorized
trans-port system
s.
a) Prom
oting fuel switch in transport facili-
ties.b) Im
proving systems for rapid transporta-
tion.c) P
romoting use of m
ass transport facili-ties
d) Establishing infrastructures for and pro-
moting use of non-m
otorized transport.e) P
roper urban transport planning to fa-cilitate effi cient and low
GH
G m
odes of transportation
f) D
eveloping NA
MA
s on transport sys-tem
s.
MO
T, P
MO
-R
AL
G,
MO
W,
DA
RT, TA
N-
RO
AD
S,
TR
L,
TAZA
RA
5. Mining
Tanzania possesses a con-siderable resource of coal. This resource is currently exploited only on a sm
all scale, but is potentially suit-able as a source of energy or coal-based m
aterials for dom
estic industries.
Such
development
provides op-
portunity for reducing emis
sions through capturing
To ensure
sustainable supply
of clean energy.
To ensure
that m
ining is
conducted in a safe, sus tainable and
a) To promote diver-
sifi cation and inte-grated clean ener-gy sources.
b) To explore carbon capture and stor-age technologies.
c) To promote adop-
tion of energy effi -cient technologies.
a) Enhancing cleaner production practices
and technologies.b) P
romoting diversifi cation and integra-
tion of energy sources and fuel switch-
ing technologies.c) P
romoting
establishment
of environ-
mental and energy m
anagement sys-
tems.
d) Exploring
capturing and
storage of
GH
G.
ME
M, P
MO
-R
ALG
, VP
O,
NE
MC
, V
ETA
, TAN
-E
SC
O, R
EA
, T
IR
DO
, C
OS
TEC
H
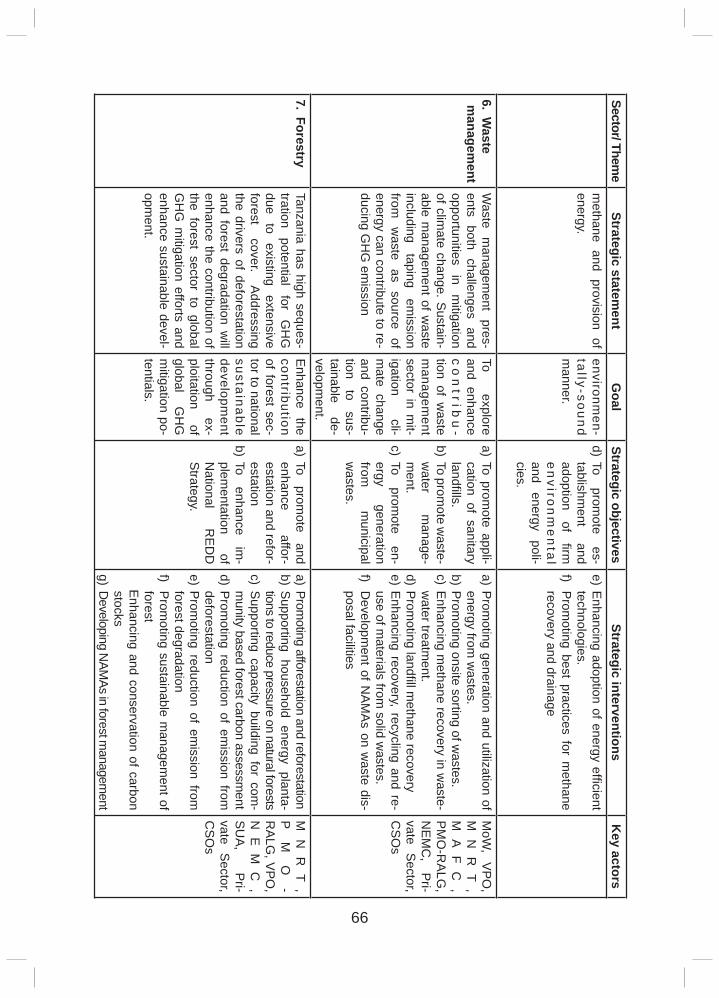
66
Sector/ Theme
Strategic statement
Goal
Strategic objectivesStrategic interventions
Key actors
methane and provision of
energy.environm
en-ta
lly-sou
nd
manner.
d) To prom
ote es-
tablishment
and adoption
of fi rm
e
nviro
nm
en
tal
and energy
poli-cies.
e) Enhancing adoption of energy effi cient
technologies.f)
Prom
oting best practices for methane
recovery and drainage
6. Waste
managem
entW
aste m
anagement
pres-ents
both challenges
and opportunities
in m
itigation of clim
ate change. Sustain-
able managem
ent of waste
including taping
emission
from
waste
as source
of energy can contribute to re-ducing G
HG
emission
To explore
and enhance c
on
tribu
-tion of w
aste m
anagement
sector in mit-
igation cli-
mate change
and contribu-tion
to sus-
tainable de-
velopment.
a) To promote appli-
cation of sanitary landfi lls.
b) To promote w
aste-w
ater m
anage-m
ent.c) To
promote
en-ergy
generation from
m
unicipal w
astes.
a) Prom
oting generation and utilization of energy from
wastes.
b) Prom
oting onsite sorting of wastes.
c) Enhancing m
ethane recovery in waste-
water treatm
ent. d) P
romoting landfi ll m
ethane recoverye) E
nhancing recovery, recycling and re-use of m
aterials from solid w
astes.f)
Developm
ent of NA
MA
s on waste dis-
posal facilities
MoW
, V
PO
, M
NR
T,
MA
FC
, P
MO
-RA
LG,
NE
MC
, P
ri-vate
Sector,
CS
Os
7. ForestryTanzania has high seques-tration
potential for
GH
G
due to
existing extensive
forest cover.
Addressing
the drivers of deforestation and forest degradation w
ill enhance the contribution of the forest sector to global G
HG
mitigation efforts and
enhance sustainable devel-opm
ent.
Enhance
the contribution of forest sec-tor to national sustainable developm
ent through
ex-ploitation
of global
GH
G
mitigation po-
tentials.
a) To prom
ote and
enhance affor-
estation and refor-estation
b) To enhance
im-
plementation
of N
ational R
ED
D
Strategy.
a) Promoting afforestation and reforestation
b) Supporting household energy planta-
tions to reduce pressure on natural forestsc) S
upporting capacity building for com-
munity based forest carbon assessm
entd) P
romoting reduction of em
ission from
deforestatione) P
romoting reduction of em
ission from
forest degradation f)
Prom
oting sustainable managem
ent of forestE
nhancing and conservation of carbon stocks
g) Developing N
AMAs in forest m
anagement
MN
RT
, P
MO
-R
ALG
, VP
O,
NE
MC
, S
UA
, P
ri-vate
Sector,
CS
Os
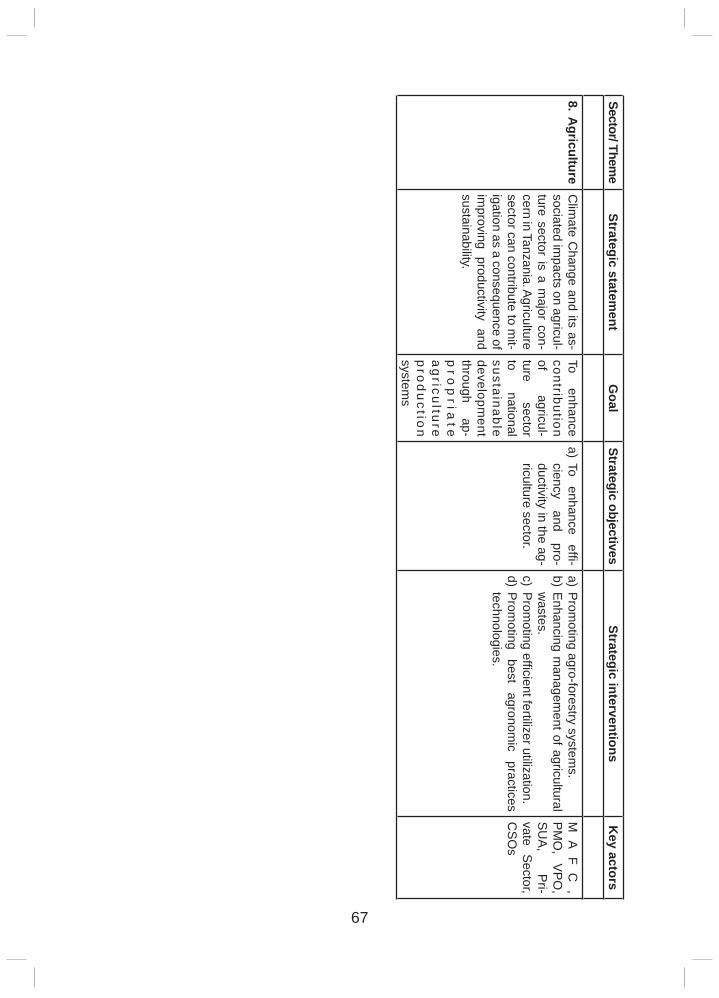
67
Sector/ Theme
Strategic statement
Goal
Strategic objectivesStrategic interventions
Key actors
8. Agriculture
Clim
ate Change and its as-
sociated impacts on agricul-
ture sector is a major con-
cern in Tanzania. Agriculture
sector can contribute to mit-
igation as a consequence of im
proving productivity and sustainability.
To enhance
contribution of
agricul-ture
sector to
national sustainable developm
ent through
ap-p
rop
riate
ag
ricultu
re p
rod
uctio
n system
s
a) To enhance
effi -ciency
and pro-
ductivity in the ag-riculture sector.
a) Prom
oting agro-forestry systems.
b) Enhancing m
anagement of agricultural
wastes.
c) Prom
oting effi cient fertilizer utilization. d) P
romoting
best agronom
ic practices
technologies.
MA
FC
, P
MO
, V
PO
, S
UA
, P
ri-vate
Sector,
CS
Os
68
3.4.3 Strategies on Cross-Cutting Issues
The socio-economic development of the country depends on sectoral and cross-sectoral activities. In the national efforts towards climate change adaptation and mitigation issues of cross-cutting nature have to be addressed in all sectors. Among the activities or programmes that need to be supported and implemented would include establishment and implementation of awareness programmes to sensitize the public on climate change impacts, adaptation and mitigation options; establishment of adequate research capacity for various R&D and training institutions to address issues related to climate change; building suffi cient capacities of marginalised groups, including women, to address climate change related disaster risks; supporting acquisition of appropriate technologies, for example, for enhancing early warning systems and weather forecasting; and documentation and promotion of indigenous knowledge on climate change adaptation in various socio-economic sectors. These initiatives should be complemented by rigorous support to integration of climate change adaptation in all sectors; development and implementation of a national climate change communication strategy. To achieve all the above, the strategy identify a need to build the capacity of all sectors and relevant institutions to address climate change adaptation.
Reducing emissions that are causing global warming will need international cooperation in almost all interventions. It is also factual that developing countries in particular LDCs that are particularly dependent on climate sensitive sectors will not be able to address the impacts of climate change or participate in mitigation opportunities without international support. Therefore, international cooperation in adaptation, mitigation and cross cutting issues such as fi nancing and technology will be critical in implementing this strategy.
The key concern is that international cooperation and commitments will be based on equity within the objectives and principles of the UNFCCC. Participating in international discourse on climate change shall remain important to ensure that Tanzania benefi ts from such international cooperation frameworks. The strategies to achieve the above are presented in Table 5.
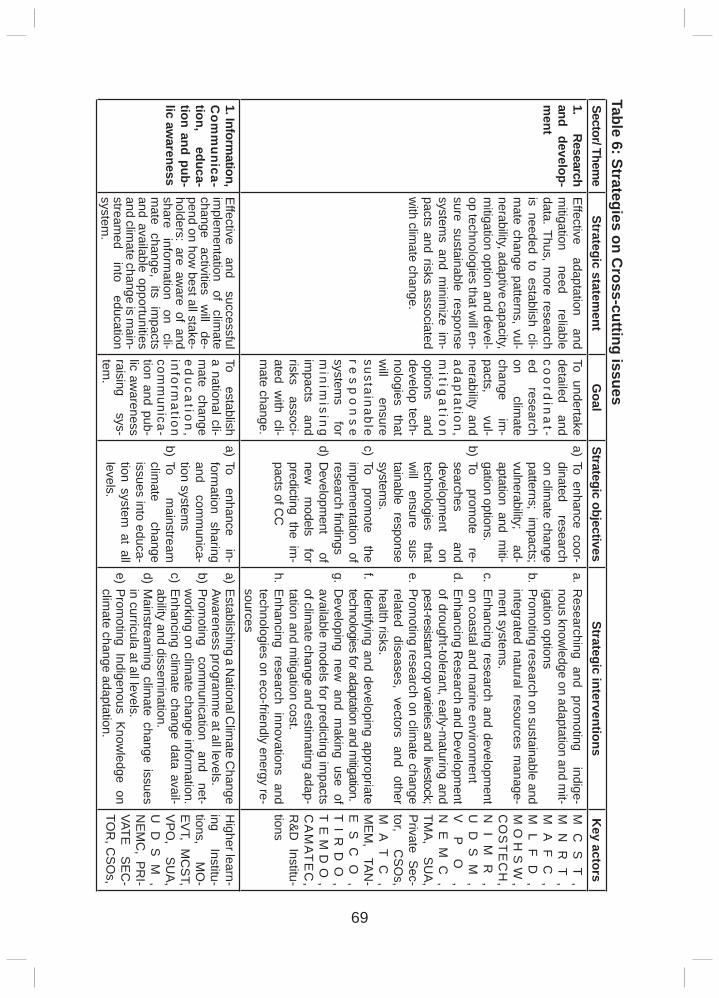
69
Table 6: Strategies on Cross-cutting issues
Sector/ Theme
Strategic statement
Goal
Strategic objectivesStrategic interventions
Key actors
1. Research
and develop-
ment
Effective
adaptation and
mitigation
need reliable
data. Thus, more research
is needed to establish cli-m
ate change patterns, vul-nerability, adaptive capacity, m
itigation option and devel-op technologies that w
ill en-sure sustainable response system
s and minim
ize im-
pacts and risks associated w
ith climate change.
To undertake detailed
and c
oo
rdin
at-
ed research
on clim
ate change
im-
pacts, vul-
nerability and a
da
pta
tion
, m
itiga
tion
options and
develop tech-nologies
that w
ill ensure
sustainable re
sp
on
se
systems
for m
inim
ising
impacts
and risks
associ-ated w
ith cli-m
ate change.
a) To enhance coor-dinated
research on clim
ate change patterns; im
pacts; vulnerability;
ad-aptation and m
iti-gation options.
b) To prom
ote re-
searches and
development
on technologies
that w
ill ensure
sus-tainable response system
s.c) To
promote
the im
plementation of
researchfi ndings
d) Developm
ent of
new
models
for predicting the im
-pacts of C
C
a. Researching and prom
oting indige-nous know
ledge on adaptation and mit-
igation optionsb. P
romoting research on sustainable and
integrated natural resources manage-
ment system
s.c. E
nhancing research and development
on coastal and marine environm
ent d. E
nhancing Research and D
evelopment
of drought-tolerant, early-maturing and
pest-resistant crop varieties and livestock; e. P
romoting research on clim
ate change related
diseases, vectors
and other
health risks.f.
Identifying and developing appropriate technologies for adaptation and m
itigation.g. D
eveloping new and m
aking use of available m
odels for predicting impacts
of climate change and estim
ating adap-tation and m
itigation cost. h. E
nhancing research innovations and technologies on eco-friendly energy re-sources
MC
ST
, M
NR
T,
MA
FC
, M
LF
D,
MO
HS
W,
CO
ST
EC
H,
NI
MR
, U
DS
M,
VP
O,
NE
MC
, TM
A,
SU
A,
Private S
ec-tor,
CS
Os,
MA
TC
, M
EM
, TA
N-
ES
CO
, T
IR
DO
, T
EM
DO
, C
AM
AT
EC
, R
&D
Institu-tions
1. Information,
Com
munica-
tion, educa-
tion and pub-lic aw
areness
Effective
and successful
implem
entation of
climate
change activities
will
de-pend on how
best all stake-holders: are aw
are of and share
information
on cli-
mate
change, its
impacts
and available opportunities and clim
ate change is main-
streamed
into education
system.
To establish
a national cli-m
ate change e
du
ca
tion
, in
form
atio
n com
munica-
tion and pub-lic aw
areness raising
sys-tem
.
a) To enhance
in-form
ation sharing and
comm
unica-tion system
s b) To
mainstream
clim
ate change
issues into educa-tion system
at all levels.
a) Establishing a N
ational Clim
ate Change
Awareness program
me at all levels.
b) Prom
oting com
munication
and net-
working on clim
ate change information.
c) Enhancing clim
ate change data avail-ability and dissem
ination.d) M
ainstreaming clim
ate change issues in curricula at all levels.
e) Prom
oting Indigenous Know
ledge on clim
ate change adaptation.
Higher learn-
ing Institu-
tions, M
O-
EV
T, MC
ST,
VP
O,
SU
A,
UD
SM
, N
EM
C, P
RI-
VATE
SE
C-
TOR
, CS
Os,
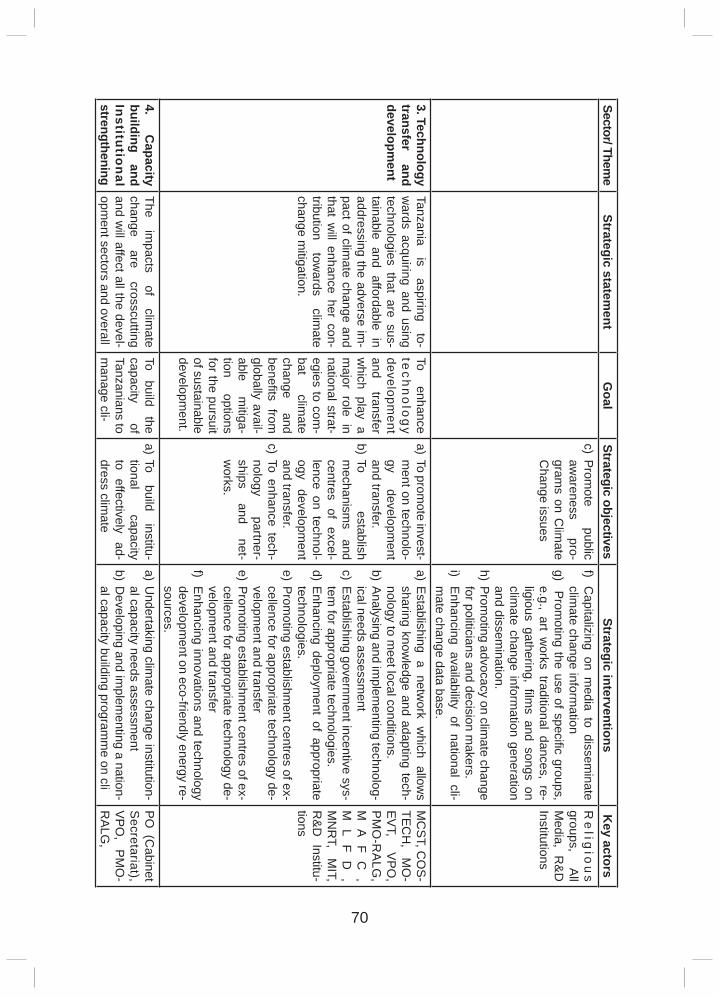
70
Sector/ Theme
Strategic statement
Goal
Strategic objectivesStrategic interventions
Key actors
c) Prom
ote public
awareness
pro-gram
s on Clim
ate C
hange issues
f) C
apitalizing on media to dissem
inate clim
ate change information
g) Prom
oting the use of specifi c groups, e.g., art w
orks traditional dances, re-ligious gathering, fi lm
s and songs on clim
ate change information generation
and dissemination.
h) Prom
oting advocacy on climate change
for politicians and decision makers.
i) E
nhancing availability of national cli-m
ate change data base.
Re
ligio
us
groups, A
ll M
edia, R&
D
Institutions
3. Technology transfer
and developm
ent
Tanzania is
aspiring to-
wards acquiring and using
technologies that are sus-tainable and affordable in addressing the adverse im
-pact of clim
ate change and that w
ill enhance her con-tribution
towards
climate
change mitigation.
To enhance
tech
no
log
y developm
ent and
transfer w
hich play a m
ajor role in national strat-egies to com
-bat
climate
change and
benefi ts from
globally avail-able
mitiga-
tion options
for the pursuit of sustainable developm
ent.
a) To promote invest-
ment on technolo-
gy developm
ent and transfer.
b) To establish
mechanism
s and
centres of excel-lence on technol-ogy
development
and transfer.c) To enhance tech-
nology partner-
ships and
net-w
orks.
a) Establishing a netw
ork which allow
s sharing know
ledge and adapting tech-nology to m
eet local conditions.b) A
nalysing and implem
enting technolog-ical needs assessm
ent c) E
stablishing government incentive sys-
tem for appropriate technologies.
d) Enhancing deploym
ent of appropriate technologies.
e) Prom
oting establishment centres of ex-
cellence for appropriate technology de-velopm
ent and transfere) P
romoting establishm
ent centres of ex-cellence for appropriate technology de-velopm
ent and transferf)
Enhancing innovations and technology
development on eco-friendly energy re-
sources.
MC
ST, C
OS
-TE
CH
, M
O-
EV
T, V
PO
, P
MO
-RA
LG,
MA
FC
, M
LF
D,
MN
RT,
MIT,
R&
D Institu-
tions
4. C
apacity building
and Institutional strengthening
The im
pacts of
climate
change are
crosscutting and w
ill affect all the devel-opm
ent sectors and overall
To build
the capacity
of Tanzanians to m
anage cli-
a) To build
institu-tional
capacity to
effectively ad-
dress climate
a) Undertaking clim
ate change institution-al capacity needs assessm
ent b) D
eveloping and implem
enting a nation-al capacity building program
me on cli
PO
(Cabinet
Secretariat),
VP
O,
PM
O-
RA
LG,
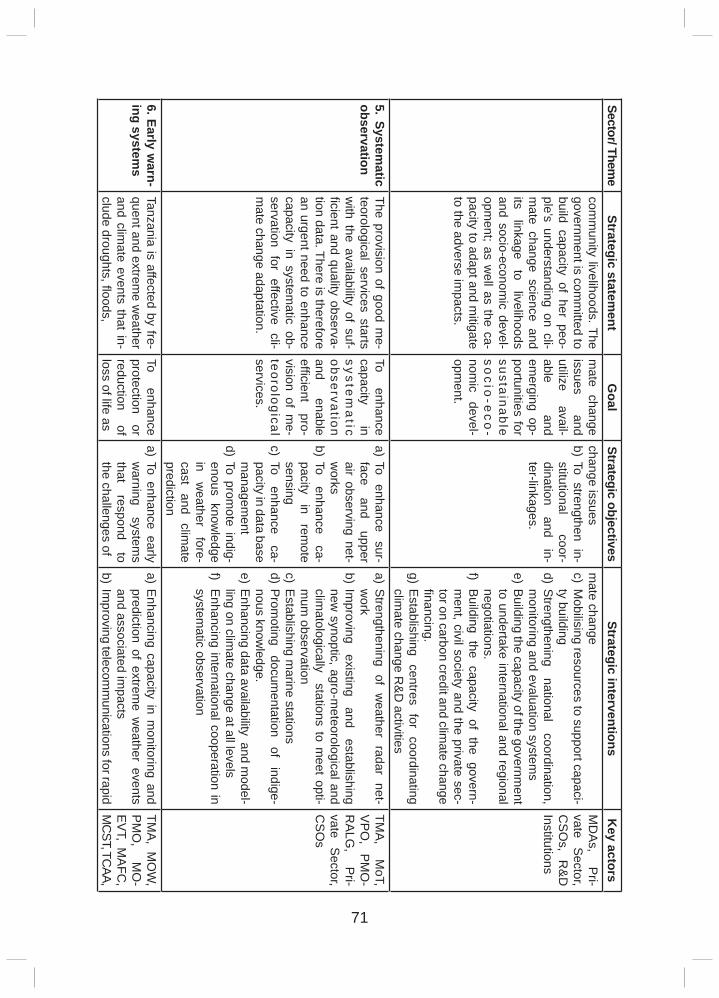
71
Sector/ Theme
Strategic statement
Goal
Strategic objectivesStrategic interventions
Key actors
comm
unity livelihoods. The governm
ent is comm
itted to build capacity of her peo-ple’s understanding on cli-m
ate change science and its
linkage to
livelihoods and socio-econom
ic devel-opm
ent; as well as the ca-
pacity to adapt and mitigate
to the adverse impacts.
mate change
issues and
utilize avail-
able and
emerging op-
portunities for sustainable s
oc
io-e
co
-nom
ic devel-
opment.
change issuesb) To strengthen in-
stitutional coor-
dination and
in-ter-linkages.
mate change
c) Mobilising resources to support capaci-
ty buildingd) S
trengthening national
coordination, m
onitoring and evaluation systems
e) Building the capacity of the governm
ent to undertake international and regional negotiations.
f) B
uilding the capacity of the govern-m
ent, civil society and the private sec-tor on carbon credit and clim
ate change fi nancing.
g) Establishing
centres for
coordinating clim
ate change R&
D activities
MD
As,
Pri-
vate S
ector, C
SO
s, R
&D
Institutions
5. Systematic
observationThe provision of good m
e-teorological services starts w
ith the availability of suf-fi cient and quality observa-tion data. There is therefore an urgent need to enhance capacity in system
atic ob-servation
for effective
cli-m
ate change adaptation.
To enhance
capacity in
system
atic
observation and
enable effi cient
pro-vision of m
e-teorological services.
a) To enhance
sur-face
and upper
air observing net-w
orksb) To
enhance ca-
pacity in
remote
sensingc) To
enhance ca-
pacity in data base m
anagement
d) To promote indig-
enous knowledge
in w
eather fore-
cast and
climate
prediction
a) Strengthening of w
eather radar net-w
orkb) Im
proving existing
and establishing
new synoptic, agro-m
eteorological and clim
atologically stations to meet opti-
mum
observationc) E
stablishing marine stations
d) Prom
oting docum
entation of
indige-nous know
ledge.e) E
nhancing data availability and model-
ling on climate change at all levels
f) E
nhancing international cooperation in system
atic observation
TMA
, M
oT, V
PO
, P
MO
-R
ALG
, P
ri-vate
Sector,
CS
Os
6. Early warn-
ing systems
Tanzania is affected by fre-quent and extrem
e weather
and climate events that in-
clude droughts, fl oods,
To enhance
protection or
reduction of
loss of life as
a) To enhance early w
arning system
s that
respond to
the challenges of
a) Enhancing capacity in m
onitoring and prediction of extrem
e weather events
and associated impacts
b) Improving telecom
munications for rapid
TMA
, MO
W,
PM
O,
MO
-E
VT, M
AFC
, M
CST, TC
AA,
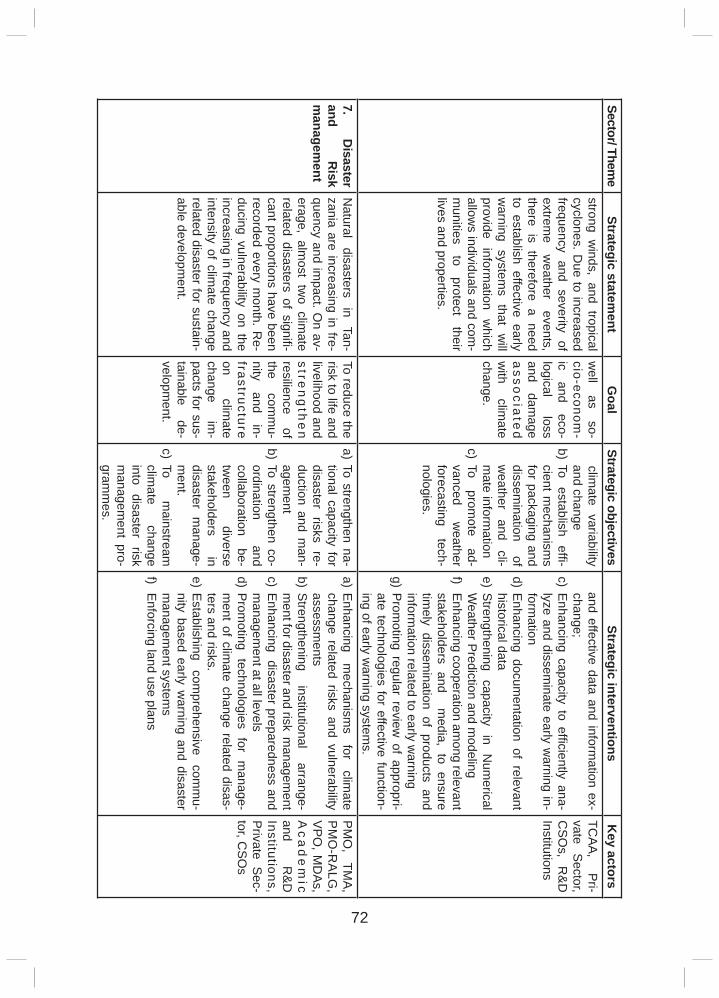
72
Sector/ Theme
Strategic statement
Goal
Strategic objectivesStrategic interventions
Key actors
strong winds, and tropical
cyclones. Due to increased
frequency and severity of extrem
e w
eather events,
there is therefore a need to establish effective early w
arning system
s that
will
provide inform
ation w
hich allow
s individuals and com-
munities
to protect
their lives and properties.
well
as so-
cio-econom-
ic and
eco-logical
loss and
damage
asso
ciate
d w
ith clim
ate change.
climate
variability and change
b) To establish
effi -cient m
echanisms
for packaging and dissem
ination of
weather
and cli-
mate inform
ation c) To
promote
ad-vanced
weather
forecasting tech-
nologies.
and effective data and information ex-
change;c) E
nhancing capacity to effi ciently ana-lyze and dissem
inate early warning in-
formation
d) Enhancing docum
entation of relevant historical data
e) Strengthening
capacity in
Num
erical W
eather Prediction and m
odelingf)
Enhancing cooperation am
ong relevant stakeholders and m
edia, to ensure tim
ely dissemination of products and
information related to early w
arningg) P
romoting regular review
of appropri-ate technologies for effective function-ing of early w
arning systems.
TCA
A,
Pri-
vate S
ector, C
SO
s, R
&D
Institutions
7. D
isaster and
Risk
managem
ent
Natural
disasters in
Tan-zania are increasing in fre-quency and im
pact. On av-
erage, almost tw
o climate
related disasters of signifi -cant proportions have been recorded every m
onth. Re-
ducing vulnerability on the increasing in frequency and intensity of clim
ate change related disaster for sustain-able developm
ent.
To reduce the risk to life and livelihood and stre
ng
the
n resilience
of the
comm
u-nity
and in-
frastructure on
climate
change im
-pacts for sus-tainable
de-velopm
ent.
a) To strengthen na-tional capacity for disaster risks re-duction and m
an-agem
entb) To strengthen co-
ordination and
collaboration be-
tween
diverse stakeholders
in disaster m
anage-m
ent.c) To
mainstream
clim
ate change
into disaster
risk m
anagement pro-
gramm
es.
a) Enhancing
mechanism
s for
climate
change related risks and vulnerability assessm
entsb) S
trengthening institutional
arrange-m
ent for disaster and risk managem
ent c) E
nhancing disaster preparedness and m
anagement at all levels
d) Prom
oting technologies
for m
anage-m
ent of climate change related disas-
ters and risks.e) E
stablishing com
prehensive com
mu-
nity based early warning and disaster
managem
ent systems
f) E
nforcing land use plans
PM
O,
TMA
, P
MO
-RA
LG,
VP
O, M
DA
s, A
ca
de
mic
and R
&D
Institutions, P
rivate Sec-
tor, CS
Os
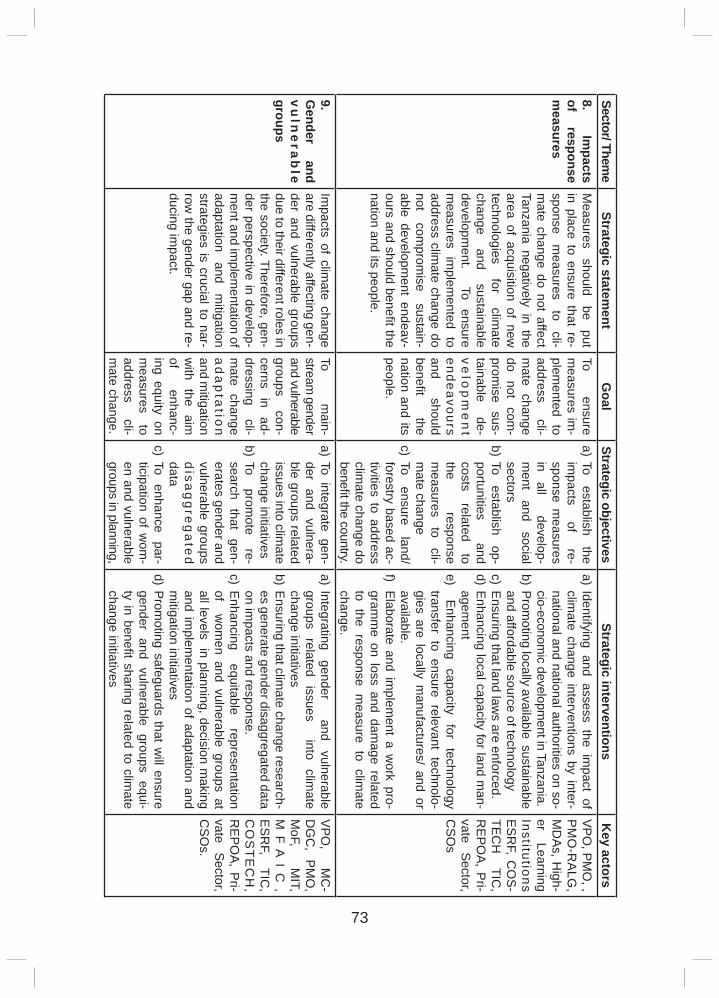
73
Sector/ Theme
Strategic statement
Goal
Strategic objectivesStrategic interventions
Key actors
8. Im
pacts of
response m
easures
Measures
should be
put in place to ensure that re-sponse
measures
to cli-
mate change do not affect
Tanzania negatively in the area of acquisition of new
technologies
for clim
ate change
and sustainable
development.
To
ensure m
easures implem
ented to address clim
ate change do not
comprom
ise sustain-
able development endeav-
ours and should benefi t the nation and its people.
To ensure
measures im
-plem
ented to address
cli-m
ate change do
not com
-prom
ise sus-
tainable de-
ve
lop
me
nt
endeavours and
should benefi t
the nation and its people.
a) To establish
the im
pacts of
re-sponse m
easures in
all
develop-m
ent and
social sectors
b) To establish
op-portunities
and costs
related to
the response
measures
to cli-
mate change
c) To ensure
land/forestry based ac-tivities to address clim
ate change do benefi t the country.
a) Identifying and assess the impact of
climate change interventions by inter-
national and national authorities on so-cio-econom
ic development in Tanzania.
b) Prom
oting locally available sustainable and affordable source of technology
c) Ensuring that land law
s are enforced.d) E
nhancing local capacity for land man-
agement
e) E
nhancing capacity
for technology
transfer to ensure relevant technolo-gies are locally m
anufactures/ and or available.
f) E
laborate and implem
ent a work pro-
gramm
e on loss and damage related
to the response measure to clim
ate change.
VP
O, P
MO
, , P
MO
-RA
LG,
MD
As, H
igh-er
Learning Institutions E
SR
F, CO
S-
TEC
H
TIC,
RE
PO
A, P
ri-vate
Sector,
CS
Os
9.Gender
and v
uln
era
ble
groups
Impacts of clim
ate change are differently affecting gen-der and vulnerable groups due to their different roles in the society. Therefore, gen-der perspective in develop-m
ent and implem
entation of adaptation
and m
itigation strategies is crucial to nar-row
the gender gap and re-ducing im
pact.
To m
ain-stream
gender and vulnerable groups
con-cerns
in ad-
dressing cli-
mate change
ad
ap
tatio
n and m
itigation w
ith the
aim
of enhanc-
ing equity on m
easures to
address cli-
mate change.
a) To integrate gen-der
and vulnera-
ble groups related issues into clim
ate change initiatives
b) To prom
ote re-
search that
gen-erates gender and vulnerable groups d
isag
gre
ga
ted
datac) To
enhance par-
ticipation of wom
-en and vulnerable groups in planning,
a) Integrating gender
and
vulnerable groups
related issues
into
climate
change initiativesb) E
nsuring that climate change research-
es generate gender disaggregated data on im
pacts and response.c) E
nhancing equitable
representation of w
omen and vulnerable groups at
all levels in planning, decision making
and implem
entation of adaptation and m
itigation initiativesd) P
romoting safeguards that w
ill ensure gender and vulnerable groups equi-ty in benefi t sharing related to clim
ate change initiatives
VP
O,
MC
-D
GC
, P
MO
, M
oF, M
IT, M
FA
IC
, E
SR
F, TIC
, C
OS
TE
CH
, R
EP
OA
, Pri-
vate S
ector, C
SO
s.
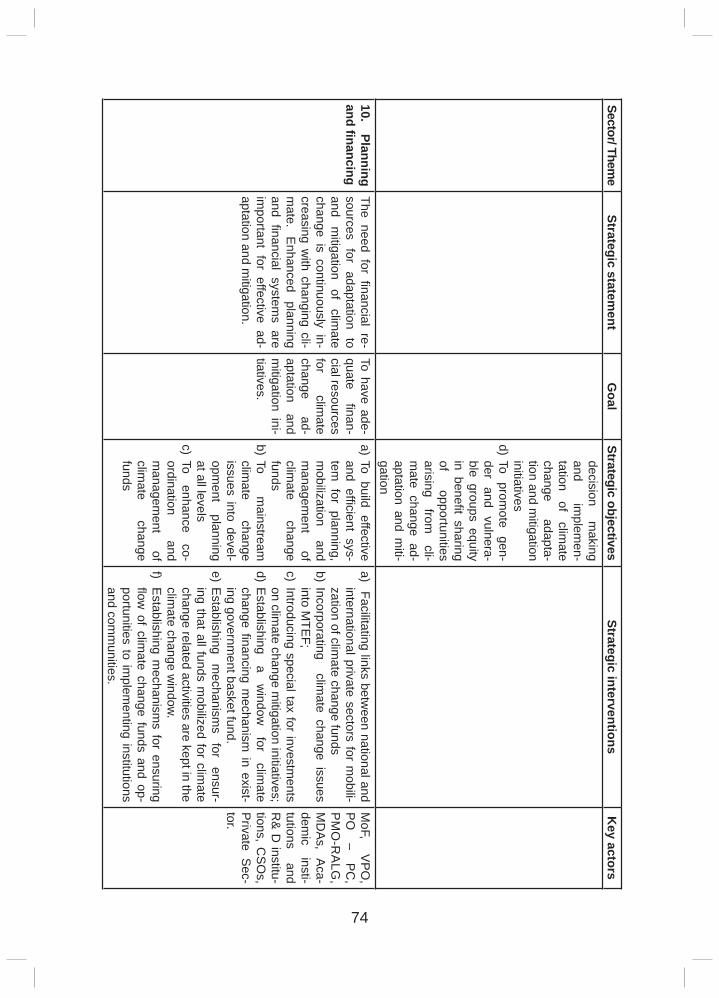
74
Sector/ Theme
Strategic statement
Goal
Strategic objectivesStrategic interventions
Key actors
decision m
aking and
implem
en-tation
of clim
ate change
adapta-tion and m
itigation initiatives
d) To prom
ote gen-
der and
vulnera-ble groups equity in benefi t sharing of
opportunities arising
from
cli-m
ate change ad-aptation and m
iti-gation
10. Planning
andfi nancing
The need for fi nancial re-sources
for adaptation
to and
mitigation
of clim
ate change is continuously in-creasing w
ith changing cli-m
ate. E
nhanced planning
andfi nancial system
s are im
portant for effective ad-aptation and m
itigation.
To have ade-quate
fi nan-cial resources for
climate
change ad-
aptation and
mitigation ini-
tiatives.
a) To build effective and effi cient sys-tem
for planning, m
obilization and
managem
ent of
climate
change funds
b) To m
ainstream
climate
change issues into devel-opm
ent planning
at all levelsc) To
enhance co-
ordination and
managem
ent of
climate
change funds
a) Facilitating links between national and
international private sectors for mobili-
zation of climate change funds
b) Incorporating climate change issues
into MTE
F;c) Introducing special tax for investm
ents on clim
ate change mitigation initiatives;
d) Establishing
a w
indow
for clim
ate change
fi nancing mechanism
in exist-ing governm
ent basket fund.e) E
stablishing m
echanisms
for ensur-
ing that all funds mobilized for clim
ate change related activities are kept in the clim
ate change window
.f)
Establishing m
echanisms for ensuring
fl ow of clim
ate change funds and op-portunities to im
plementing institutions
and comm
unities.
MoF,
VP
O,
PO
–
PC
, P
MO
-RA
LG,
MD
As,
Aca-
demic
insti-tutions
and R
& D
institu-tions, C
SO
s, P
rivate Sec-
tor.
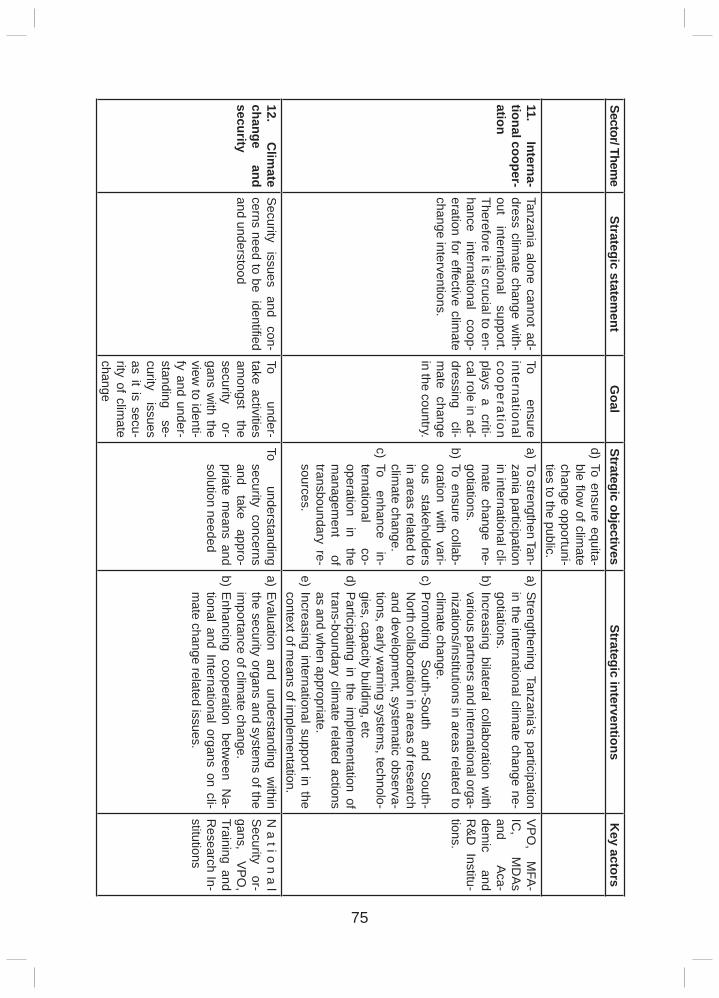
75
Sector/ Theme
Strategic statement
Goal
Strategic objectivesStrategic interventions
Key actors
d) To ensure equita-ble
fl ow of clim
ate change opportuni-ties to the public.
11. Interna-
tional cooper-ation
Tanzania alone cannot ad-dress clim
ate change with-
out international
support. Therefore it is crucial to en-hance
international coop-
eration for effective climate
change interventions.
To ensure
international cooperation plays
a criti-
cal role in ad-dressing
cli-m
ate change in the country.
a) To strengthen Tan-zania participation in international cli-m
ate change ne-gotiations.
b) To ensure collab-oration w
ith vari-ous
stakeholders in areas related to clim
ate change.c) To
enhance in-
ternational co-
operation in
the m
anagement
of transboundary re-sources.
a) Strengthening Tanzania’s participation
in the international climate change ne-
gotiations.b) Increasing bilateral collaboration w
ith various partners and international orga-nizations/institutions in areas related to clim
ate change.c) P
romoting
South-S
outh and
South-
North collaboration in areas of research
and development, system
atic observa-tions, early w
arning systems, technolo-
gies, capacity building, etc d) P
articipating in the implem
entation of trans-boundary clim
ate related actions as and w
hen appropriate.e) Increasing international support in the
context of means of im
plementation.
VP
O,
MFA
-IC
, M
DA
s and
Aca-
demic
and R
&D
Institu-tions.
12. C
limate
change and
security
Security
issues and
con-cerns need to be identifi ed and understood
To under-
take activities am
ongst the
security or-
gans with the
view to identi-
fy and under-standing
se-curity
issues as it is secu-rity of clim
ate change
To understanding
security concerns and
take appro-
priate means and
solution needed
a) Evaluation
and understanding
within
the security organs and systems of the
importance of clim
ate change.b) E
nhancing cooperation between N
a-tional and International organs on cli-m
ate change related issues.
Na
tion
al
Security
or-gans,
VP
O,
Training and R
esearch In-stitutions
76
4. IMPLEMENTATION ARRANGEMENTS
4.1 Implementation Plan
The institutional arrangement provided by the Environmental Management Act and also described in Chapter Three underpins the implementation of this Strategy. The overall coordination of the implementation of the strategy will be under the responsibility of the NCCFP. The NCCFP will also be responsible for preparing national climate change frameworks such as NAPs, NAMAs, guidelines and other relevant national documents. NCCFP will be responsible for Monitoring and Evaluation (M&E) of the overall implementation of the strategy where an M&E framework will be developed.
The general implementation of the strategies at sectoral level will be the responsibility of the relevant Government Departments and Agencies. The Prime-Minister’s Offi ce-Regional Administration and Local Government (PMO-RALG) will work closely with Local Government Authorities (LGAs) through their various departments in collaboration with lined sectoral ministries to implement the strategic interventions at local level. The established cross-sectoral committees, which are the NCCSC and the NCCTC will be important fora to facilitate implementation of cross-sectoral climate change interventions. To keep and update track records on climate change, National Bureau of Statistics will be the custodian.
The MDAs will prepare projects, programmes, action plans and cost the strategic interventions relevant to their respective sectors based on the strategic interventions identifi ed in the strategy. Each MDA will prepare sector specifi c action plans indicating targets to be achieved; time frame for implementing the interventions in short, medium and long term; and outcome indicators. The plans will subsequently be integrated in the Government budgets through the Medium Term Expenditure Frameworks for implementation. Broad and complex interventions may be addressed by preparing and implementing stand alone projects or programmes. Sectoral ministries and LGAs will be reporting the implementation status to NCCFP on annual basis whereby the NCCFP will ensure the availability of such information to the public.
Civil Society Organisations are encouraged to cooperate with the Government in implementing the strategy through various projects and/or programmes. The private sectors either individually or in collaboration with the Government under public-private partnership (PPP) arrangement are encouraged to implement innovative projects to address climate change. These may include CDM project activities; REDD+ initiatives, NAMAs and other carbon markets.
77
Development partners either bilaterally or through their multilateral arrangements are encouraged to support the government in implementing this Strategy by providing technical and fi nancial support, as well as facilitate resource mobilization. They are also encouraged to provide capacity building and facilitate technology development and transfer to various stakeholders in implementing this Strategy.
4.1.1 Coordination
Implementation of this Strategy will follow the institutional arrangement as provided by the EMA. In that context, the Strategy will be coordinated by the Vice President’s Offi ce which is responsible for coordination of environment management.
To coordinate climate change issues in the country the NCCTC and NCCSC will guide the implementation of this Strategy. The NCCTC shall provide technical advice to the NCCFP, while the NCCSC shall provide policy guidance, as well as ensure coordinated action and participation within various sectors. The implementation of specifi c strategic interventions and activities will be done in the respective MDAs; and LGAs according to their roles and responsibilities under EMA and mandates. NGOs, civil society organisations, religious organisations, educational institutions etc are encouraged to participate by facilitating the implementation of specifi c adaptation and mitigation projects at a community level. Resource mobilization, fi nancial management and reporting shall be undertaken pursuant to the government’s fi nancial management guidelines and systems established under the Ministry of Finance. However, special arrangements will be made in cooperation with the Ministry of Finance to enhance existing resource mobilization and fi nancial management systems to cope with increasing demand in fi nancial support for addressing climate change (if necessary).
4.1.2 Information and Communication Arrangement
The information management and communication in the implementation of this Strategy will follow institutional arrangements established in the EMA. The VPO is the centre for environmental information management and communication in the country. Climate change information will be collected from various sources, managed and communicated to the public by VPO. Communications of that information will periodically be done through publication of relevant reports. However other information communications mechanisms may be used in order to easily reach the public and cater for increasing demand of climate change information. Such mechanisms include: VPO offi cial website, National Climate
78
Change Website, newsletters, television and radio programmes, newspapers and cultural performances. To facilitate information communication, where necessary, the VPO will collaborate with key stakeholders dealing with climate change in the country to communicate climate change information. Such stakeholders include MDAs; LGAs, research and academic institutions, civil society organisations, private sector, politicians, religious organisations, media, and educational institutions among others.
4.1.3 Reporting Arrangements
The reporting arrangement in the implementation of this Strategy will follow the established government reporting system, as well as reporting system provided in EMA. Under the government reporting system, MDAs and LGAs are supposed to report implementation of the strategy annually. In addition, EMA requires Sector Environmental Coordinators and District/Council/Town Environmental Management Offi cers to report on implementation of their Environmental Action Plans that include climate change issues. Since the MDAs and LGAs are expected to integrate relevant strategic interventions in their respective plans, their quarterly and annual reports will capture information on the implementation of the Strategy. This will include fi nancial reporting that will be subjected to audit as per government regulation. In this case, MDAs and LGAs will report on any fi nancial resources that were allocated for the implementation of specifi c climate change issues in relation to this Strategy
4.2 Financing Climate Change
4.2.1 Financing Plan
Addressing climate change in Tanzania will largely depend on fi nancial support from international community. Domestic funding from government budget, private sector, as well as individual contributions will complement this effort. However, an integrated approach and coordinated working system is highly required to ensure that funds to address climate change are used to achieve the objectives presented in this strategy. To ensure resources availability, the strategy proposes establishment of a National Climate Change Fund (NCF) and a special climate change window under Basket Fund to fi nance its implementation. However, a balance of fi nancing is required in both adaptation and mitigation to climate change. Such balance is also important in fi nancing other areas such as capacity building, technology development and transfer as well as awareness rising. Funding sources for implementation of this strategy are categorised into National Funds, International Funds and Commitments related to UNFCCC and Kyoto Protocol.,
79
4.2.2 Estimating the Cost of Climate Interventions
Although the actual cost of implementing this Strategy has not been established, the key determinant in estimating the cost of climate change impacts can be indirectly derived from the climate change interventions outlined, that is, adaptation, mitigation, capacity building and cross-cutting interventions. This is because without an accurate and static future scenario it is diffi cult to cost the necessary actions needed to contend with the changes. This challenge is demonstrated by a UNFCCC report that provides a range as opposed to specifi c numbers that estimate the additional funding needed for adaptation by 2030. The report projects a need equivalent to between USD ($) 49 to 171 billion per annum globally (UNFCCC, 2007)41.
Moreover a recent study undertaken by the Stockholm Environment Institute42 estimates that the cost of building adaptive capacity and enhancing resilience against future climate change in Tanzania is USD ($)100 to 150 million per year. But, an additional USD ($) 500 million per year (but probably more) is needed to address current climate risks, in reducing future impacts and building resilience to future climate change.” The SEI report further states that while uncertain, aggregate models indicate that net economic costs could be equivalent to a further 1 to 2 % of GDP per year by 2030. With such uncertainty, it is diffi cult to arrive at a defi nitive cost of executing the Strategy.
A less inaccurate formula for arriving at the cost of implementing this Strategy is for the sectors, while developing the action plan, to estimate the cost of climate change interventions outlined herein, together with on-going programmes. This will involve (i) rating line activities based on sensitivity to climate change impacts on a four point scale (that is, no impact; low impact; medium impact and high impact); (ii) estimating a climate mark-up factor for each rating; (iii) applying the climate mark-up factor to each line budget item and; (iv) escalating annual cost to account for infl ation.
The climate mark-up indices are comparable to those used in the UNFCCCreport on investment and fi nancial fl ows to address climate change. No impact, low-impact, medium-impact and high-impact correspond to a 0%, 5%, 10% and 15% mark-up respectively. Additionally, the United States average infl ation rate of 2%43 can be used to escalate the subsequent annual estimates after the
41 UNFCCC (2007), Investment and Financial Flows to Address Climate Change, Climate Change Secretariat, Bonn42 SEI 2010: The Economics of Climate Change in the United Republic of Tanzania43 US Federal Reserve System (2012), Historical data, US Annual Infl ation available at http://www.federalreserve.gov/econresdata/statisticsdata.htm
80
base year since the indicative budget estimates are in US dollars terms or if the cost are in Tanzania shillings the prevailing infl ation rate in the country will be used.
4.2.3 International Funds
International Funds that are fi nancing climate change include the Global Environment Facility (GEF), banks and bilateral funds.
a) The World Bank FundsThe World Bank is an important source of fund for environmental and natural resources management. The support has been either in form of grants where the bank acts as an implementing agency of GEF or in form of lending of its own funds. The funding is both directly to environmental projects and capacity building. Lending for environment in the World Bank falls under the theme of Environment and Natural Resources (ENRM) accounting for about 9% of all the bank’s lending (ibid 2009). The ENRM theme consists of seven sub-themes: (i) biodiversity, : (ii) climate change, : (iii) environmental policies and institutions, : (iv) land administration and Management, : (v) pollution management and environmental health, : (vi) water resources management, and : (vii) other environment and natural resources management. For International Bank for Reconstruction and Development (IBRD) funds alone there has been a notable increase in Climate Change related commitments for IBRD countries, which surged from an average of 8% to 40% in Financial Year 2008 (ibid 2009). In terms of share by region, for IDA countries on average about half of the commitments go to Sub-Saharan Africa (SSA) and a fi fth to South Asia (SAR) and EAP. Middle East and North Africa (MNA) has a small share.
b) Africa Development Bank (AfDB) FundsThe Africa Development Bank (AfDB) is also becoming an important source of fi nance for environmental management and protection in particular climate change. The Bank is a GEF Executing Agency enabling it to appraise and implement projects on behalf of GEF and obtain direct access to GEF resources. Moreover, as part of AfDB commitment to supporting Africa’s move toward climate resilience and low carbon development, the bank is expanding access to international climate change fi nancing. To that end, the bank is implementing the Climate Investments Funds (CIF), a pair of fi nancing instrument worth USD ($) 6.4 billion designed to channel scaled up fi nancing in form of grants, concessional loans and risk mitigation instruments to developing countries through multilateral development banks (MDB) including the AfDB. The aim is to blend funding for climate solutions with other MDB, national and private sector development resources, thereby leveraging substantial additional funds.
81
By expanding CIF implementation in Africa, the AfDB hopes to inspire investor confi dence in the continent and generate even more fi nancing for clean energy and climate compatible development. The AfDB has also established the Climate for Development in Africa (Climate Development Africa); Special Fund (CDSF); the Africa Water Facility and the Congo Basin Forest Fund. It is also in the process of setting up an African Green Fund (AGF).
c) Global Environment Facility (GEF)GEF is an independent fi nancial organisation that provides grants to Developing Countries and Countries with Economies in Transition for projects related to biodiversity, climate change, international waters, land degradation, the ozone layer and persistent organic pollutants. These projects benefi t the global environment, linking local, national and global environmental challenges and promoting sustainable livelihoods. The GEF also works on several cross-cutting issues and programs such as Result and Learning; Earth Fund and Public private Partnerships; Capacity Development; Small Grants Programme; and Country Support Programme. In addition the GEF serves as fi nancial mechanism for the following conventions: Convention on Biological Diversity (CBD); UNFCCC; Stockholm Convention on Persistent Organic Pollutants (POPs); United Nations Convention to Combat Desertifi cation (UNCCD); and the GEF although not linked formally to the Montreal Protocol on substances that Deplete the Ozone Layer (MP), supports implementation of the protocol in Countries with Economies in Transition.
In undertaking its activities, GEF operates with its agencies that include: the United Nations Development Programme (UNDP); United Nations Environment Programme (UNEP); Food and Agricultural Organisation of United Nations (FAO), United Nations Industrial Development Organisations (UNIDO), International Fund for Agricultural Development (IFAD), the AfDB; the European Bank for Reconstruction and Development and the Inter-American Development Bank.
d) Bilateral FundsBilateral Funds are funds which are provided in the arrangement between one donor country and a developing country, institution, or NGO. Bilateral funds are mainly channelled through special assistance agencies in donor countries. Additional offi cial assistance is channelled from donor to recipient countries through multilateral organisations and through international NGOs. Some bilateral donors have a regional focus whilst others prefer regional networks for example SADC, EAC, AU etc. Interest of some donors is also confi ned to specifi c aspects of climate change.
82
Over the past years, a whole range of traditional donor countries have created new funds to support climate change programmes in developing countries. These include Governments of Australia, Germany, Japan, Spain, Norway, the UK together with the European Union and USA. These include:
i). The Environmental Transformation Fund (International Window) of the UK.
ii). The International Climate Protection Initiative of Germany.
iii). Norwegian International Climate and Forest Initiative.
iv). The Global Initiative on Forests and Climate of Australia.
v). The Global Climate Change Alliance of the European Union.
vi). The UNDP-Spain MDG Achievement Fund-Environment and Climate Change Thematic Window.
vii). The Cool Earth Partnership of Japan.
e) General Budget SupportA key tool in this collaboration is Performance Assessment Framework, agreed between the government and development partners. The initiative is fi nanced by 11 bilateral development partners: Norway, UK, Japan, Sweden, Denmark, Ireland, Canada, Germany, Finland, Netherlands, and Switzerland; together with the European Commission, the World Bank, and the AfDB. In this case, GBS also is encouraged to support implementation of the Strategy through establishment of a special climate change window.
f) East Africa Climate Change FundsThe East African Community has developed a Climate Change Policy, Climate Change Master Plan and Climate Change Strategy. The community has also established a Climate Change Fund which is in the process of being capitalised. The objective of the fund is to help the Party States to adapt and mitigate climate change. The fund if well capitalised will be one of the important sources of fi nance for adaptation and mitigation to climate change in the region.
g) Individuals and Foundation Funds Wealthy individuals and foundations have emerged to fi nance climate change adaptation and mitigation initiatives. Examples of individuals and foundations
83
funding climate change in Tanzania include: Clinton Foundation; The Bill and Mellinda Gates Foundation; Open Society Institute; START International; Rockefeller Foundation; WWF; WaterAid and Ford Foundation. These foundations and individuals can provide important source of funds for small communities/individual climate change adaptation and mitigation projects.
4.2.4 Multilateral Agreement FundsThese include funds which were established under UNFCCC and Kyoto Protocol to facilitate implementation of climate change activities. These include Least Developed Countries Fund (LDCF), Special Climate Change Fund (SCCF), Green Climate Fund (GCF) and Adaptation Fund.
Least Developed Countries Fund (LDCF)The LDCF addresses special needs of the LDCs under the climate change convention. Specifi cally, the LDCF was tasked with fi nancing the preparation and implementation of NAPAs. The LDCF is the major existing fund mandated to fi nance the implementation of NAPAs. Consistent with the fi ndings of the NAPAs, the LDCF focuses on reducing the vulnerability of those sectors and resources that are central to development and livelihoods, such as water; agriculture and food security; health; disaster risk management and prevention; infrastructure and fragile ecosystem.
Special Climate Change Fund (SCCF)The SCCF supports adaptation and technology transfer in all developing country parties to the UNFCCC. The SCCF supports both long-term and short-term adaptation activities in water resources management; land management; agriculture; health; infrastructure development; fragile ecosystems including mountainous ecosystems; and integrated coastal zone management.
Green Climate Fund (GCF)This fund was established with an objective of supporting projects, programmes, policies and other activities in developing countries using thematic funding windows. The fund is the window through which a balanced share of multilateral funding for adaptation and mitigation will be channelled.
Adaptation Fund (AF) The Adaptation Fund was established by the Parties to the Kyoto Protocol of the UN Framework Convention on Climate Change to fi nance concrete adaptation projects and programmes in developing countries that are parties to the Kyoto Protocol. The Fund is fi nanced with 2% of the Certifi ed Emission Reduction (CER) issued for projects of the CDM and other sources of funding.
84
4.2.5 National FundsThe main national funds are revenue collected by the Government through taxes and charges from various investments associated to climate change mitigation. These funds are allocated to various MDAs and Local Government Authorities through their Medium Term Expenditure Framework that will be refl ected in their both recurrent and development budgets. Climate change interventions in such MDAs and LGAs can be supported under this arrangement. Other sources of domestic funds include established funds such as National Environmental Trust Fund, National Climate Change Fund and REDD Funds; Payments for Environmental Services (for example, Payment for Ecosystem Services-PES); funds obtained through Public Private Partnership and funds from local NGOs44. These funds can be drawn for implementation of various planned activities by following arrangements established under such funds.
4.3 Monitoring and Evaluation FrameworkThe Strategy will follow Government standard monitoring and evaluation processes and procedures. Monitoring and evaluation is important for measuring performance in various areas of the strategy in order to meet targets and indicators. This will be done following the institutional arrangement provided by EMA. In that context, the VPO will monitor the implementation of the strategy through Sector Environmental Sections, the Regional Environmental Experts, and the Town/City/Municipal/District Environmental Management Offi cers. Furthermore, Environmental Management Offi cers from the LGAs will send their implementation reports to VPO-DoE. In this case, VPO will develop indicators and general monitoring and evaluation framework. These indicators along with the key deliverables and benchmarks will be the main tools for assessing implementation progress of the Strategy. The obtained information will be compiled in various periodical monitoring reports and made available to various stakeholders through quarterly and annual reports, budget speeches and relevant reports.
4.3.1 Monitoring planThis monitoring plan has been designed to ensure that the VPO in conjunction with responsible sectors are empowered to make informed decisions regarding the effectiveness of the existing, planned and future programmes and projects in the country, as well as ensure the effective use and mobilisation of resources. This monitoring plan has been designed to ensure collection of information for use by coordinating agencies and key stakeholders. In principle it will focus on the coordination process and review of reports to measure progress toward achieving the strategic interventions in this Strategy. Monitoring will be done at three levels:
(i) 44 The National Environmental Trust Fund and National REDD Trust Fund are still not yet operational.
85
(i) input; (ii) process; and (iii) output.
At the input level the VPO will focus on determination of the cost-effectiveness of the activities, projects and programmes to be undertaken. This is will be undertaken through a review reports submitted to the VPO periodically by the coordinators and managers responsible for climate change projects and programmes at the sector level. To augment the information acquired, VPO could utilise relevant information derived from monitoring tools, including stakeholder analysis; documentation review; biophysical measurements; direct observation; cost-benefi t analysis; structured interviews; questionnaires; and surveys, among others. At the process level the Division of Environment shall review and analyse the success of climate change mainstreaming in existing and planned sectoral activities which have been or are about to be implemented within the given time frame in the country.
4.3.2 Evaluation planEvaluation activities will be organised on an ad hoc and on-going basis. This includes all the evaluation activities to be carried out during the whole intervention period, comprising at strategy level ex-ante, mid-term, and ex-post evaluation as well as any other evaluation activity VPO may fi nd useful for improving intervention programmes management. The evaluation of this Strategy by the VPO will also measure the extent in which the strategic interventions and actions undertaken such evaluation activities will be organised on an on-going basis. The evaluation of this Strategy by VPO will also measure the extent in which the strategic interventions and actions undertaken have realised their desired changes in the sectors. It is recommended that the VPO undertake outcome and impact evaluations at three key stages in the implementation plan. Ex-ante evaluation will set the basis for setting up a system of evaluation by identifying objectives, target levels, and baselines for each response strategy. On this basis a system of on-going evaluation has to be developed which ensures continuous activities for strategy evaluation during the whole response strategy period. A mid-term evaluation will be conducted to provide an overview of the achievements of the objectives, technical approach and implementation framework towards the desired results. The information obtained will provide an avenue to make adjustments or amendments to the implementation plan (if necessary). The fi nal evaluation will be conducted at the end of the fi ve year period of the Climate Change Strategy to measure the achieved results against planned ones. The fi nal results and fi ndings shall guide VPO in revising this Strategy.
86
REFERENCES
Berger, J. (2004). The last mile: How to sustain long-distance migration in mammals. Conservation Biology, 18: 320-331.Daily News (12th May 2011). Floods displace 9,000 in Kilombero. Available at: http://dailynews.co.tz/home/?n=19764; see also http://reliefweb.int/node/404112
Desanker, P.V. (2004). The NAPA Primer. United Nations Framework Convention on Climate Change (UNFCCC) - Least Developed Countries Expert Group (LEG), Bonn, Germany, 192p. Available at: http://www.unfccc.int/ldc; http://www.NapaPrimer.org
East African Community – EAC (2010). Declaration of the 12th summit of EAC heads of state on food security and climate change. East African Community, Arusha
Elisa, M., Gara, J.I., and Wolanski, E. (2011). A Review of Water Crisis in Tanzania’s protected areas with emphasis on Katuma River-Lake Rukwa Ecosystem. Journal of Ecohydrology & Hydrobiology [DOI: 10.2478/v10104-011-0001-z]
Fischlin, A., Midgley, G.F., Price, J. T., Leemans, R., Gopal, B., Turley, C., Rounsevell, M. D.A., Dube, O. P., Tarazona, J., and Velichko, A.A. (2007). Ecosystems, their properties, goods, and services. In Parry, M.L., Canziani, O.F,. Palutikof, J. P., van der Linden P. J., and Hanson, C.E. (Eds.), Climate Change 2007: Impacts, Adaptation and Vulnerability. Contribution of Working Group II to the Fourth Assessment Report of the Intergovernmental Panel on Climate Change, Cambridge University Press, Cambridge, 211-272.
Global Climate Adaptation Partnership and Partners, 2011). The Economics of Climate Change in the United Republic of Tanzania.
Hannah, L., Lovejoy, T.E., and Schneider, S.H. (2005). Biodiversity and Climate Change in Context. In, Lovejoy, T. E., Hannah, L. (Eds.). Climate Change and Biodiversity, Yale University Press, New Haven, CT, USA and London, UK.International Federation of Red Cross and Red Crescent Societies – IFRC (2010). Tanzania: Floods. Available at: http://www.ifrc.org/docs/appeals/10/MDRTZ0101.pdf.
87
IPCC (2007a). Summary for Policymakers. In Parry, M.L., Canziani, O.F., Palutikof, J.P., van der Linden P.J., and Hanson, C.E. (Eds.). Climate Change 2007: Impacts, Adaptation and Vulnerability. Contribution of Working Group II to the Fourth Assessment Report of the Intergovernmental Panel on Climate Change, Cambridge University Press, Cambridge, UK and New York, NY, USA.
Kangalawe, R.Y.M. (2010). Mainstreaming climate change adaptation in the management of freshwater resources in the Rufi ji Basin. A consultancy report submitted to the Ruaha Water Programme. WWF-Tanzania Country Offi ce, Dar es Salaam.
Kangalawe, R.Y.M., Mung’ong’o, C.G., Yanda, P.Z., Mwakaje, A.G., Kalumanga, E. (2009). Climate change and variability impacts, vulnerability and adaptive capacity in Kasulu District, Tanzania. Chapter 2. In: Kangalawe, R.Y.M., Mung’ong’o, C.G. and Yanda, P.Z. (Eds.). People’s Perceptions and Community Response to Climate Change and Variability: Selected Cases from Tanzania. Institute of Resource Assessment, University of Dar es Salaam.Matari et al. (2008)
Meyer, B., Balozi, J.J., Shanyang, M.W., Mwangulango, N.A, and Qolli, A. (2006). Katavi Rukwa Ecosystem. Report KRCD project, GTZ/ECO-AGEG
NFP (2001). National Forest Programme.
Stern, N. (2006). What is the economics of climate change? World Economics 7(2): April-June 2006.
Tonnang, H.E.Z., Kangalawe, R.Y.M. and Yanda, P.Z. (2010). Predicting and mapping malaria under climate change scenarios: The potential redistribution of malaria vectors in Africa. Malaria Journal 2010, 9:111 [DOI: 10.1186/1475-2875-9-111].
UNDP (2007). Human Development Report 2007/2008: Fighting climate change: human solidarity in a divided world. Palgrave Macmillan, New York.
United Nations Human Settlements Programme - UN-HABITAT (2009). Tanzania: Dar es Salaam City Profi le. United Nations Human Settlements Programme, Regional and Technical Cooperation Division, Nairobi.
United Republic of Tanzania - URT (2002). National Water Policy. Ministry of Water and Livestock Development, Dar es Salaam.
88
United Republic of Tanzania - URT (2002). Population and Housing Census 2002. United Republic of Tanzania. National Bureau of Statistics, Dar es Salaam
United Republic of Tanzania - URT (2003). Initial National Communication under the United Nations Framework Convention on Climate Change (UNFCCC). Vice president’s Offi ce, Dar es Salaam.
United Republic of Tanzania - URT (2006). Annual Health Statistical Abstract. Ministry of Health, Dar es Salaam
United Republic Of Tanzania - URT (2007). Tanzania National Adaptation Programme of Action, 2007. Vice President’s Offi ce, Dar es Salaam
United Republic of Tanzania - URT (2008). State of the environment report 2008. Vice President’s Offi ce, Division of Environment, Dar es salaam.
United Republic of Tanzania - URT (2008a). Economic Survey, 2007. The Ministry of Finance and Economic Affairs, Dar es SalaamUnited Republic of Tanzania - URT (2008b). Study on strategies for addressing negative effects of climate change in food insecure areas of Tanzania. Ministry of Agriculture, Food and Cooperatives. Ministry of Agriculture, Food and Cooperatives, Dar es Salaam.
United Republic of Tanzania – URT (2009). Climate Change Impacts Assessment Report - 2009. Vice President’s Offi ce - Division of Environment, Dar es Salaam
United Republic of Tanzania – URT (2009). Climate Change Impacts Assessment Report - 2009. Vice President’s Offi ce - Division of Environment, Dar es Salaam
United Republic of Tanzania - URT (2009a). Climate change and agriculture policy brief. Vice President’s Offi ce, Division of Environment, Dar es Salaam
United Republic of Tanzania – URT (2010). National Strategy for Reduced Emissions from Deforestation and Forest Degradation (REDD+). Draft. Vice President’s Offi ce, Dar es Salaam.
United Republic Of Tanzania - URT (2010a). The Economic Survey 2009. The Ministry of Finance and Economic Affairs, Dar es Salaam
United Republic of Tanzania - URT (2010b). Energy consumption by sources in Tanzania. Ministry of Energy and Minerals – MEM, Dar es Salaam.
89
United Republic of Tanzania – URT (2011). The Dar es Salaam City Environment Outlook 2011. Vice President’s Offi ce, Division of Environment, Dar es Salaam. Draft.
United Republic of Tanzania – URT (2007). National Adaptation Programme of Action (NAPA)
United Republic of Tanzania – URT (2008). State of the Environment Report 2008. Vice President’s Offi ce, Division of Environment, Dar es salaam.
United Republic of Tanzania – URT (2009b). Climate change and livestock policy brief. Vice President’s Offi ce, Division of Environment, Dar es Salaam; and URT (2010a). The Economic Survey 2009. The Ministry of Finance and Economic Affairs, Dar es Salaam
United Republic of Tanzania – URT (2010). The Economic Survey 2009. Ministry of Finance and Economic Affairs, Kiuta, Dar es Salaam
United Republic of Tanzania – URT, 2009a
Wandiga, S.O., Opondo, M, Olago, D., Githeko, A., Downs, T., Yanda, P.Z, Kangalawe, R.Y.M., Kabumbuli,R., Opere,A., Githui, F., Kathuri, J., Olaka, L., Apindi, E., Marshall, M., Ogallo, L., Mugambi,P., Kirumira, E., Nanyunja, R., Baguma, T. Sigalla, R., and Achola, P. (2010). Vulnerability to epidemic malaria in the highlands of Lake Victoria basin: the role of climate change/variability, hydrology, health and socio-economic factors. Climate Change 99: 473–497 [DOI: 10.1007/s10584-009-9670-7]
World Health Organization – WHO (2008). Cholera Country Profi le: United Republic Of Tanzania. World Health Organization - Global Task Force on Cholera Control. 7 April 2008
Yanda, P.Z., Kangalawe, R.Y.M. and Sigalla, R.J. (2006). Climatic and socio-economic infl uences on malaria and cholera risks in the Lake Victoria Region of Tanzania. ICIFAI Journal of Environmental Economics (IJEE) 4 (3): 44-70
http://www.tanzania.go.tz/naturalresources.htmlhttp://www.bongofree.net/news_articles/english_news/ctl/readdefault/mid/700/articleid/41355.aspx
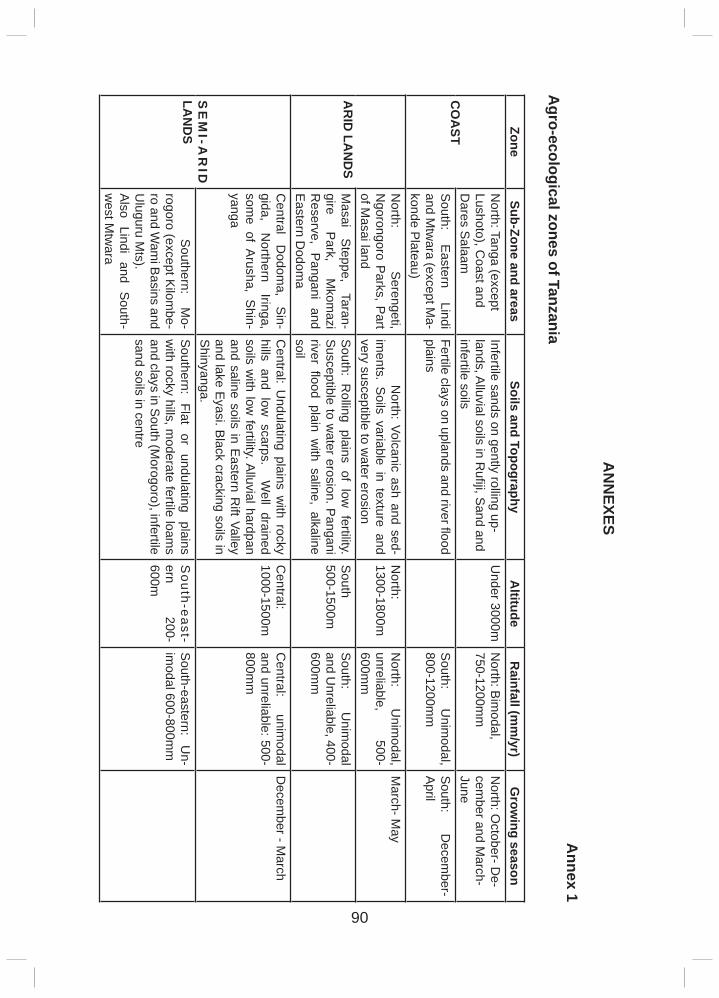
90
AN
NEXES
Annex 1
Agro-ecological zones of Tanzania
ZoneSub-Zone and areas
Soils and TopographyA
ltitudeR
ainfall (mm
/yr)G
rowing season
CO
AST
North: Tanga (except
Lushoto), Coast and
Dares S
alaam
Infertile sands on gently rolling up-lands, A
lluvial soils in Rufi ji, S
and and infertile soils
Under 3000m
North: B
imodal,
750-1200mm
North: O
ctober- De-
cember and M
arch-June
South:
Eastern
Lindi and M
twara (except M
a-konde P
lateau)
Fertile clays on uplands and river fl ood plains
South:
Unim
odal, 800-1200m
mS
outh: D
ecember-
April
AR
ID LA
ND
S
North:
Serengeti,
Ngorongoro P
arks, Part
of Masai land
N
orth: Volcanic ash and sed-im
ents. Soils variable in texture and
very susceptible to water erosion
North:
1300-1800mN
orth: U
nimodal,
unreliable, 500-
600mm
March- M
ay
Masai
Steppe,
Taran-gire
Park,
Mkom
azi R
eserve, P
angani and
Eastern D
odoma
South: R
olling plains of low fertility.
Susceptible to w
ater erosion. Pangani
riverfl ood plain w
ith saline, alkaline soil
South
500-1500mS
outh: U
nimodal
and Unreliable, 400-
600mm
SE
MI-A
RID
LA
ND
S
Central
Dodom
a, S
in-gida,
Northern
Iringa, som
e of Arusha, S
hin-yanga
Central: U
ndulating plains with rocky
hills and low scarps. W
ell drained soils w
ith low fertility. A
lluvial hardpan and saline soils in E
astern Rift Valley
and lake Eyasi. B
lack cracking soils in S
hinyanga.
Central:
1000-1500mC
entral: unim
odal and unreliable: 500-800m
m
Decem
ber - March
S
outhern: M
o-rogoro (except K
ilombe-
ro and Wam
i Basins and
Uluguru M
ts).A
lso Lindi
and S
outh-w
est Mtw
ara
Southern:
Flat or
undulating plains
with rocky hills, m
oderate fertile loams
and clays in South (M
orogoro), infertile sand soils in centre
South-east-
ern 200-
600m
South-eastern:
Un-
imodal 600-800m
m
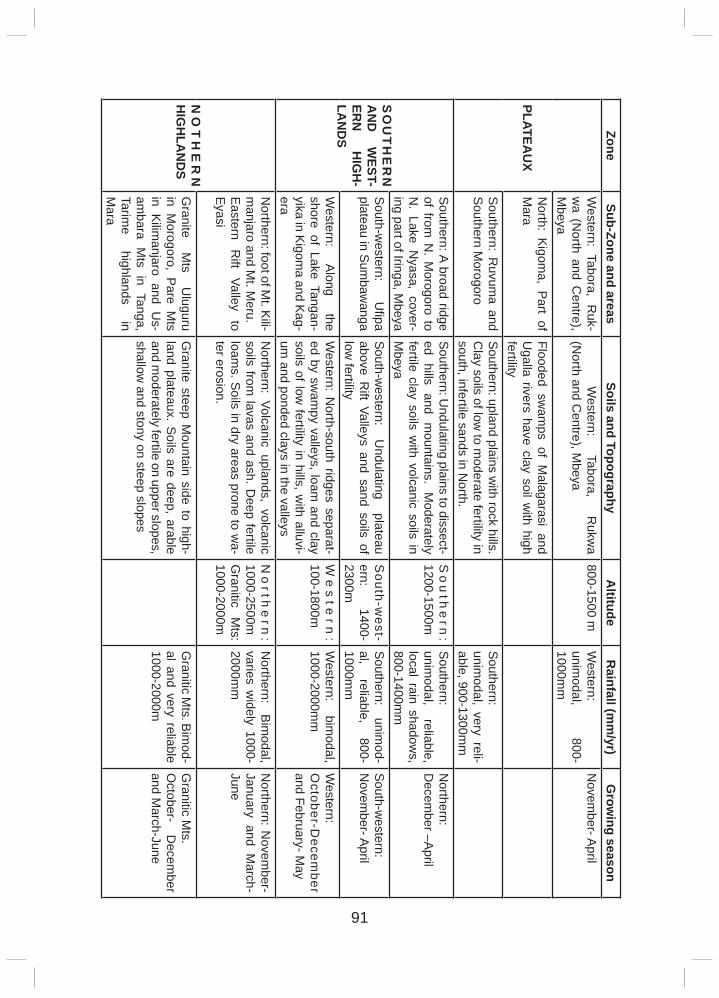
91
ZoneSub-Zone and areas
Soils and TopographyA
ltitudeR
ainfall (mm
/yr)G
rowing season
PLATEAU
X
Western: Tabora, R
uk-w
a (North and C
entre), M
beya
W
estern: Tabora,
Rukw
a (N
orth and Centre), M
beya800-1500 m
Western:
unimodal,
800-1000m
m
Novem
ber- April
North: K
igoma, P
art of M
araFlooded sw
amps of M
alagarasi and U
galla rivers have clay soil with high
fertilityS
outhern: Ruvum
a and S
outhern Morogoro
Southern: upland plains w
ith rock hills. C
lay soils of low to m
oderate fertility in south, infertile sands in N
orth.
Southern:
unimodal, very reli-
able, 900-1300mm
SO
UT
HE
RN
A
ND
W
EST-ER
N
HIG
H-
LAN
DS
Southern: A broad ridge
of from N
. Morogoro to
N. Lake N
yasa, cover-ing part of Iringa, M
beya
Southern: U
ndulating plains to dissect-ed hills and m
ountains. Moderately
fertile clay soils with volcanic soils in
Mbeya
So
uth
ern
: 1200-1500m
Southern:
unimodal,
reliable, local rain shadow
s, 800-1400m
m
Northern:
Decem
ber –April
South-w
estern: U
fi pa plateau in S
umbaw
angaS
outh-western:
Undulating
plateau above R
ift Valleys and sand soils of low
fertility
South-w
est-ern:
1400-2300m
Southern:
unimod-
al, reliable,
800-1000m
m
South-w
estern:N
ovember- A
pril
Western:
Along
the shore of Lake Tangan-yika in K
igoma and K
ag-era
Western: N
orth-south ridges separat-ed by sw
ampy valleys, loam
and clay soils of low
fertility in hills, with alluvi-
um and ponded clays in the valleys
We
ste
rn:
100-1800mW
estern: bim
odal, 1000-2000m
mW
estern: O
ctober-Decem
ber and February- M
ay
NO
TH
ER
N
HIG
HLA
ND
S
Northern: foot of M
t. Kili-
manjaro and M
t. Meru.
Eastern
Rift
Valley to
Eyasi
Northern: Volcanic uplands, volcanic
soils from lavas and ash. D
eep fertile loam
s. Soils in dry areas prone to w
a-ter erosion.
No
rthe
rn:
1000-2500mG
ranitic M
ts: 1000-2000m
Northern:
Bim
odal, varies w
idely 1000-2000m
m
Northern: N
ovember-
January and March-
June
Granite
Mts
Uluguru
in Morogoro, P
are Mts
in Kilim
anjaro and Us-
ambara M
ts in Tanga, Tarim
e highlands
in M
ara
Granite steep M
ountain side to high-land plateaux. S
oils are deep, arable and m
oderately fertile on upper slopes, shallow
and stony on steep slopes
Granitic M
ts. Bim
od-al and very reliable 1000-2000m
Granitic M
ts. O
ctober- D
ecember
and March-June
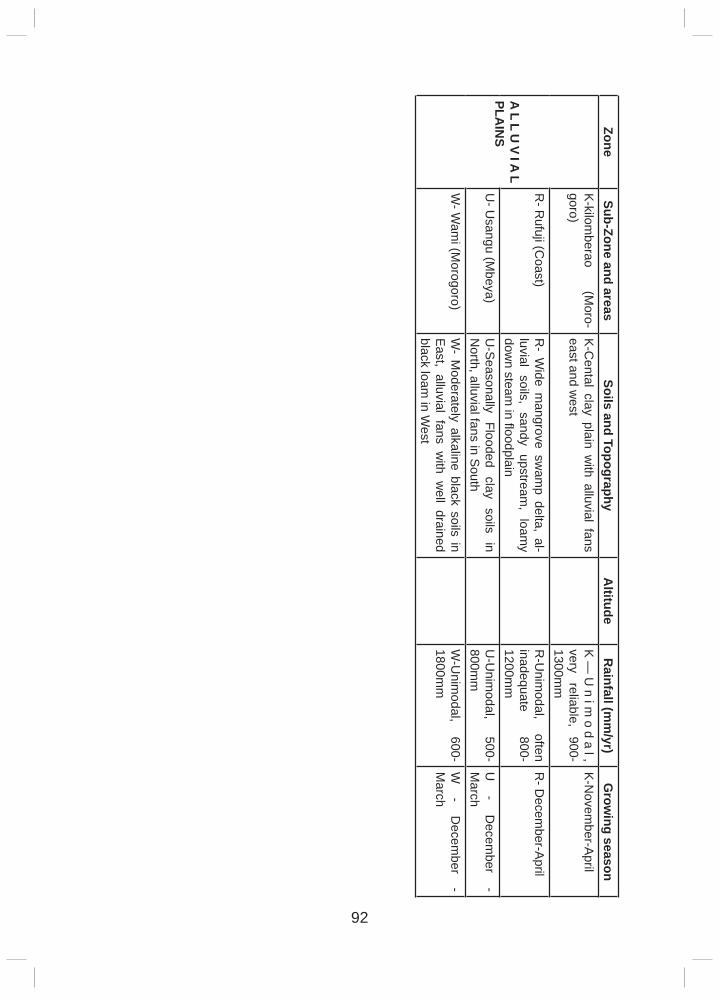
92
ZoneSub-Zone and areas
Soils and TopographyA
ltitudeR
ainfall (mm
/yr)G
rowing season
AL
LU
VIA
L PLA
INS
K-kilom
berao (M
oro-goro)
K-C
ental clay plain with alluvial fans
east and west
K—
Un
imo
da
l, very
reliable, 900-
1300mm
K-N
ovember-A
pril
R- R
ufuji (Coast)
R- W
ide mangrove sw
amp delta, al-
luvial soils, sandy upstream, loam
y dow
n steam in fl oodplain
R-U
nimodal,
often inadequate
800-1200m
m
R- D
ecember-A
pril
U- U
sangu (Mbeya)
U-S
easonally Flooded
clay soils
in N
orth, alluvial fans in South
U-U
nimodal,
500-800m
mU
-
Decem
ber -
March
W- W
ami (M
orogoro)W
- Moderately alkaline black soils in
East, alluvial fans w
ith well drained
black loam in W
est
W-U
nimodal,
600-1800m
mW
-
Decem
ber -
March