tanzania livestock master plan (2017/2018 – 2021/2022) · tanzania livestock master plan...
TRANSCRIPT

TANZANIA LIVESTOCKMASTER PLAN
(2017/2018 – 2021/2022)
UNITED REPUBLIC OF TANZANIAMINISTRY OF LIVESTOCK AND FISHERIES
December, 2017


i
Table of contents TABLES ....................................................................................................................................................... III
FIGURES ...................................................................................................................................................... V
ACRONYMS ................................................................................................................................................ VI
ACKNOWLEDGEMENT ............................................................................................................................. VIII
EXECUTIVE SUMMARY ................................................................................................................................ X
INTRODUCTION .......................................................................................................................................... 1
DAIRY DEVELOPMENT ROADMAP 2017/2018–2021/2022 ...................................................................... 11
VISION .................................................................................................................................................... 12 OVERALL TARGET ...................................................................................................................................... 12 TARGET PRODUCTION SUBSYSTEMS FOR COW DAIRY IMPROVEMENT INTERVENTIONS ............................................ 14
IMPROVED FAMILY DAIRY PRODUCTION IN COASTAL AND LAKE AND HIGHLANDS ZONES .......................................... 15 COMMERCIAL SPECIALIZED DAIRY PRODUCTION .............................................................................................. 28 KEY CHALLENGES AND STRATEGIES IN COMMERCIAL SPECIALIZED DAIRY PRODUCTION ............................................ 28
CONCLUSIONS .......................................................................................................................................... 33
RED MEAT SYSTEMS ROADMAP ............................................................................................................... 34
2017/2018-‐2021/2022 ............................................................................................................................. 34
VISION .................................................................................................................................................... 35 OVERALL TARGET ...................................................................................................................................... 35 IMPROVED TRADITIONAL RED MEAT PRODUCTION ........................................................................................... 35
SPECIALIZED CATTLE FEEDLOTS AND CULLED DAIRY CATTLE ................................................................................ 46 CONCLUSIONS .......................................................................................................................................... 53
CHICKEN DEVELOPMENT ROADMAP ........................................................................................................ 54
2017/2018–2021/2022 ............................................................................................................................. 54 VISION .................................................................................................................................................... 55
OVERALL TARGET ...................................................................................................................................... 55 SPECIALIZED COMMERCIAL CHICKEN PRODUCTION ........................................................................................... 62 CONCLUSIONS .......................................................................................................................................... 71
PIG/PORK VALUE CHAIN DEVELOPMENT ROADMAP ............................................................................... 72
2017/2018–2021/2022 ............................................................................................................................. 72 VISION .................................................................................................................................................... 73
OVERALL TARGET ...................................................................................................................................... 73 EXPANDING THE COMMERCIAL SPECIALIZED PIG PRODUCTION SUBSYSTEM TARGETS .............................................. 78 CONCLUSIONS .......................................................................................................................................... 89
LEATHER DEVELOPMENT .......................................................................................................................... 90
(HIDES & SKINS) ........................................................................................................................................ 90
LIVESTOCK SECTORAL ANALYSIS KEY FINDINGS ON CROSS-‐CUTTING ISSUES .......................................... 92
TANZANIA LIVESTOCK MASTER PLAN CONCLUSIONS ............................................................................. 109
ANNEX 1: FIVE-‐YEAR DAIRY PRODUCTION IMPROVEMENT INVESTMENT COSTS (2017/18-‐2021/22) .. 114

ii
ANNEX 2: FIVE-‐YEAR RED MEAT PRODUCTION IMPROVEMENT INVESTMENT COSTS (2017/18-‐2021/22) ................................................................................................................................................................ 117
ANNEX 3: FIVE-‐YEAR CHICKEN MEAT AND EGG PRODUCTION IMPROVEMENT INVESTMENT COSTS (2017/18-‐2021/22) ................................................................................................................................. 120
ANNEX 4: FIVE-‐YEAR PIG/PORK PRODUCTION IMPROVEMENT INVESTMENT COSTS (2017/18-‐2021/22)
................................................................................................................................................................ 122
REFERENCES ............................................................................................................................................ 126
iii
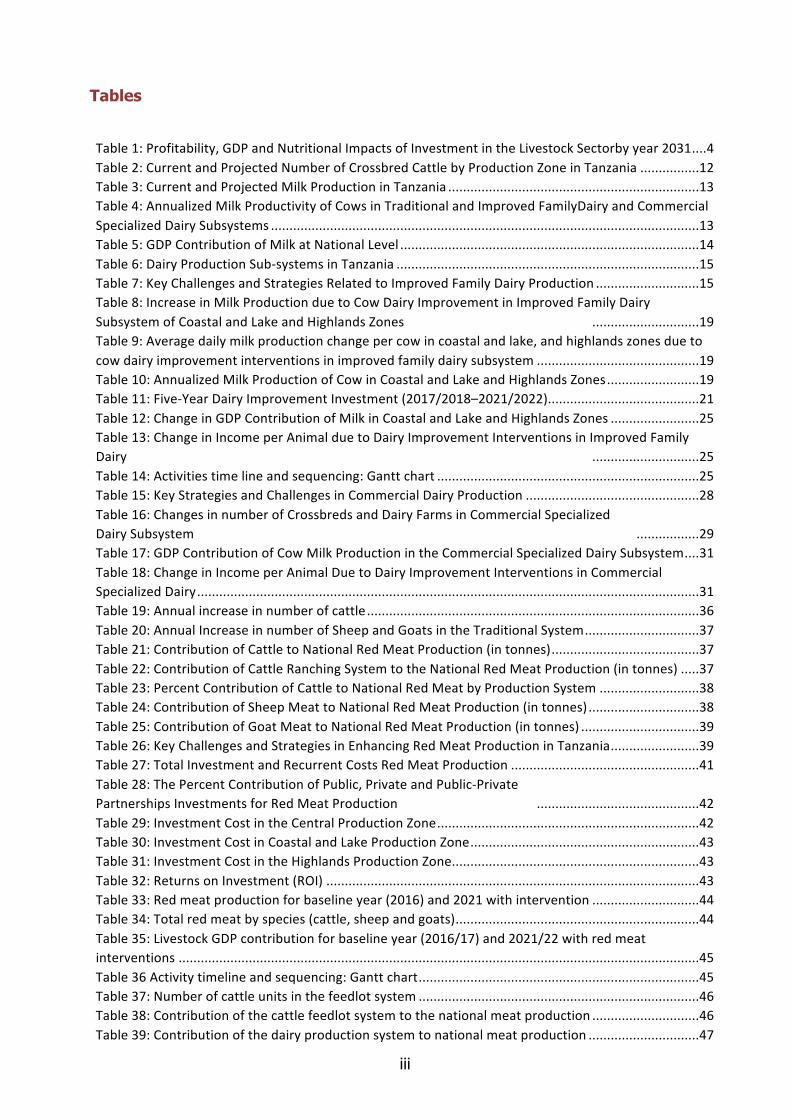
Tables
Table 1: Profitability, GDP and Nutritional Impacts of Investment in the Livestock Sectorby year 2031 .... 4 Table 2: Current and Projected Number of Crossbred Cattle by Production Zone in Tanzania ................ 12 Table 3: Current and Projected Milk Production in Tanzania .................................................................... 13 Table 4: Annualized Milk Productivity of Cows in Traditional and Improved FamilyDairy and Commercial Specialized Dairy Subsystems .................................................................................................................... 13 Table 5: GDP Contribution of Milk at National Level ................................................................................. 14 Table 6: Dairy Production Sub-‐systems in Tanzania .................................................................................. 15 Table 7: Key Challenges and Strategies Related to Improved Family Dairy Production ............................ 15 Table 8: Increase in Milk Production due to Cow Dairy Improvement in Improved Family Dairy Subsystem of Coastal and Lake and Highlands Zones ............................. 19 Table 9: Average daily milk production change per cow in coastal and lake, and highlands zones due to cow dairy improvement interventions in improved family dairy subsystem ............................................ 19 Table 10: Annualized Milk Production of Cow in Coastal and Lake and Highlands Zones ......................... 19 Table 11: Five-‐Year Dairy Improvement Investment (2017/2018–2021/2022) ......................................... 21 Table 12: Change in GDP Contribution of Milk in Coastal and Lake and Highlands Zones ........................ 25 Table 13: Change in Income per Animal due to Dairy Improvement Interventions in Improved Family Dairy ............................. 25 Table 14: Activities time line and sequencing: Gantt chart ....................................................................... 25 Table 15: Key Strategies and Challenges in Commercial Dairy Production ............................................... 28 Table 16: Changes in number of Crossbreds and Dairy Farms in Commercial Specialized Dairy Subsystem ................. 29 Table 17: GDP Contribution of Cow Milk Production in the Commercial Specialized Dairy Subsystem .... 31 Table 18: Change in Income per Animal Due to Dairy Improvement Interventions in Commercial Specialized Dairy ........................................................................................................................................ 31 Table 19: Annual increase in number of cattle .......................................................................................... 36 Table 20: Annual Increase in number of Sheep and Goats in the Traditional System ............................... 37 Table 21: Contribution of Cattle to National Red Meat Production (in tonnes) ........................................ 37 Table 22: Contribution of Cattle Ranching System to the National Red Meat Production (in tonnes) ..... 37 Table 23: Percent Contribution of Cattle to National Red Meat by Production System ........................... 38 Table 24: Contribution of Sheep Meat to National Red Meat Production (in tonnes) .............................. 38 Table 25: Contribution of Goat Meat to National Red Meat Production (in tonnes) ................................ 39 Table 26: Key Challenges and Strategies in Enhancing Red Meat Production in Tanzania ........................ 39 Table 27: Total Investment and Recurrent Costs Red Meat Production ................................................... 41 Table 28: The Percent Contribution of Public, Private and Public-‐Private Partnerships Investments for Red Meat Production ............................................ 42 Table 29: Investment Cost in the Central Production Zone ....................................................................... 42 Table 30: Investment Cost in Coastal and Lake Production Zone .............................................................. 43 Table 31: Investment Cost in the Highlands Production Zone ................................................................... 43 Table 32: Returns on Investment (ROI) ..................................................................................................... 43 Table 33: Red meat production for baseline year (2016) and 2021 with intervention ............................. 44 Table 34: Total red meat by species (cattle, sheep and goats) .................................................................. 44 Table 35: Livestock GDP contribution for baseline year (2016/17) and 2021/22 with red meat interventions ............................................................................................................................................. 45 Table 36 Activity timeline and sequencing: Gantt chart ............................................................................ 45 Table 37: Number of cattle units in the feedlot system ............................................................................ 46 Table 38: Contribution of the cattle feedlot system to the national meat production ............................. 46 Table 39: Contribution of the dairy production system to national meat production .............................. 47

iv
Table 40: Challenges and Strategies for Developing Specialized Cattle Feedlots and Dairy Cattle Systems ................................................................................................................................................................... 47 Table 41: Projected number of cattle fattened ......................................................................................... 48 Table 42: Estimated amount of additional concentrate feed needed for additional cattle going to beef feedlot by the year 2020 ........................................................................................................................... 49 Table 43: Investment in abattoir establishment ........................................................................................ 49 Table 44: Change in meat production from cattle feedlots (2016/17–2021/22) with interventions ........ 49 Table 45: Changes in livestock GDP with interventions in specialized cattle feedlots .............................. 50 Table 46: Activity timeline and sequencing: Gantt chart ........................................................................... 50 Table 47: Number of hens and chicken meat and eggs production in improved traditional family chicken and tropical improved chicken subsystems (2016/17–2021/22) .............................................................. 55 Table 48: Key challenges and strategies related to traditional family chicken system ............................. 57 Table 49: GDP contribution 2031 with current and with additional investment scenarios ...................... 60 Table 50: Intervention activity timeline and sequencing: Gantt chart ...................................................... 60 Table 51: Number of chicken and chicken meat production in specialized chicken subsystems .............. 62 Table 52: Egg production from specialized layers ..................................................................................... 63 Table 53: Five-‐year chicken meat and egg production improvement investment costs (2017/18–2021/22) .................................................................................................................................................... 64 Table 54: GDP contribution from commercial specialized chicken system (baseline GDP compared with 2021/22 from additional investment) ....................................................................................................... 66 Table 55: Total chicken meat and eggs production with additional investment ....................................... 66 Table 56: Family and commercial specialized chicken production systems GDP contribution with additional investment ................................................................................................................................ 67 Table 57: Annual incremental income as a result of the intervention ...................................................... 67 Table 58: Activity timeline and sequencing: Gantt chart ........................................................................... 68 Table 59: Targeted number of sow and tonnes of meat in traditional (extensive) family and improved family pig (TFP and IFP) subsystems .......................................................................................................... 73 Table 60: Key challenges and strategies related to the traditional and improved family pig subsystem . 74 Table 61: Traditional and Improved Family pig GDP contribution with additional investment ................ 78 Table 62: Targeted number of sows and pig meat production in the commercial/specialized pig production (CSP) subsystem ...................................................................................................................... 78 Table 63: Key challenges and strategies related to the commercial specialized pig system ..................... 79 Table 64: Five-‐year investment cost to transform the family pig system and expand the commercial specialized system (2016/17 to 2021/22) ................................................................................................. 82 Table 65: Total pig meat production with additional investment ............................................................. 85 Table 66: Traditional and Improved Family and commercial specialized pig System GDP contribution with additional investment ........................................................................................................................ 85 Table 67: Incremental income per sow ..................................................................................................... 85 Table 68: Major activities timing and sequence: Gantt chart .................................................................... 86 Table 69: Milk processing Industries in Tanzania (2016/2017) ................................................................. 96 Table 70: Leather Industries in Tanzania (2017/2018) ............................................................................ 100 Table 71: Meat Industries in Tanzania in 2016/2017 .............................................................................. 100 Table 72: Total investment cost required to carry out the livestock master plan roadmap ................... 113

v
Figures
Figure 1: Production-consumption balance for red meat with and without additionalinvestments for Tanzania, 2016/17–2031/32 ...................................................................... 6
Figure 2: Production-consumption balance for white meat with and without additionalinvestments for Tanzania, 2016–2031................................................................................ 7
Figure 3: Production-consumption balance for all meat with and without additionalinvestments for Tanzania, 2016–2031................................................................................ 8
Figure 4: Production-consumption balance for cow milk with and without additionalinvestments for Tanzania, 2016–2031................................................................................ 9
Figure 5: Projected cow milk consumption and production with and without investment,2017-2022 (in thousand tonnes)...................................................................................... 32
Figure 6: TLMP targets for production, consumption, and production-consumptionbalance for beef............................................................................................................. 51
Figure 7: TLMP targets for production, consumption, and production-consumptionbalance for sheep meat................................................................................................... 51
Figure 8: TLMP targets for production, consumption, and production-consumptionbalance for goat meat .................................................................................................. 52
Figure 9: TLMP targets for production, consumption, and production-consumptionbalance for red meat .................................................................................................... 52
Figure 10: Projected chicken meat consumption and production with and withoutadditional investment 2017–2022 (in thousand tonnes) ................................................... 68
Figure 11: Projected pig meat consumption and production with and withoutadditional investment (in thousand tonnes), 2017-2022 ................................................... 86

vi
Acronyms
ALive African Partnership for Livestock Development
AI Artificial Insemination
AnGR Animal Genetic Resources
ASF African Swine Fever
ASDP Agricultural Sector Development Programme
ATA Agricultural Transformation Agency
AU-IBAR African Union–Interafrican Bureau for Animal Resources
BAU Business as usual
BMGF Bill & Melinda Gates Foundation
CBPP Contagious Bovine Pleuropneumonia
CCPP Contagious Caprine Pleuropneumonia
CIRAD French Agricultural Research Centre for International Development
CSO Civil Society Organization
DOC Day-Old Chick
FAO Food and Agriculture Organization of the United Nations
FMD Foot and Mouth Disease
GDP Gross Domestic Product
HACCP Hazard Analysis and Critical Control Points
IFD Improved family dairy
IFP Improved Family Poultry
ILRI International Livestock Research Institute
IRR internal Rate of Return
IFPS Improved Family Pig System
ITFC Improved Traditional Family Chicken
LGA Local Government Authority
LMU Livestock Multiplication Units
LSA Livestock Sector Analysis
LSIPT Livestock Sector Investment and Policy Toolkit
MALF Ministry of Agriculture Livestock and Fisheries
MLF Ministry of Livestock and Fisheries
NAFORMA Tanzania Forest Service Agency
NARCO National Ranching Company

vii
PPE Personal Protective Equipment
PPP Public-Private Partnership
PPR Peste des Petits Ruminants (goat plague)
RVF Rift Valley Fever
SCC Specialized Commercial Chicken
SUA Sokoine University of Agriculture
SPA Swine Producers’ Association
TAC Technical Advisory Committee
TALIRI Tanzania Livestock Research Institute
TB Tuberculosis
TDV Tanzania Development Vision
TFPS Traditional Family Pig System
TIC Traditional Improved Chicken
TLMP Tanzania Livestock Master Plan
TLMI Tanzania Livestock Modernization Initiative
TVLA Tanzania Veterinary Laboratory Agency
TZS Tanzania Shilling
YASM Young and Adult Stock Mortality

Acknowledgement
Tanzania accounts for about 1.4% of the global cattle population and 11% of African cattle population (FAO 2014). Tanzania has about 30.5 million cattle, 18.8 million goats and 5.3 million sheep. Other livestock include; 1.9 million pigs, 38.2 million local chickens and 36.6 million improved chickens. The livestock sector employs about 50% of her population, which is equivalent to 4.6 million households who their income depends on livestock.
The Livestock Sector plays an important role in building a strong national economy by increasing household food security, income, animal draught power, manure, foreign currency and employment opportunities while nurturing the livestock resources. This contributes to increased economic growth and Government revenue.
The Livestock Sector by its nature has high multiplying effects and net worth per capital invested. Livestock is used as security as it can be converted easily into monetary values (non- fixed assets/ liquidity) when need arises. This contributes to increased purchasing power to consumable and capital goods.
Despite the potential of livestock resources available in the country, the sector contribute only 6.9%, which is very little to economic growth. The sector is facing so many challenges including low genetic potential, feed and water resources, diseases, land conflicts, lack of value addition of livestock priority commodities, increased post-harvest losses, lack of quality processed products for local and international markets and illegal trade of livestock and livestock products.
The emerging micro and macroeconomic policy changes, new challenges and opportunities have necessitated I and my Ministry with the technical support from the International Livestock Research Institute (ILRI) and the financial support from Bill and Melinda Gates Foundation (BMGF) to develop a livestock roadmap, the Tanzania Livestock Master Plan (TLMP) to address all challenges facing the sectors and hence achieve the Tanzania Development Vision (TDV) 2025. One of the TDV’s goals is that “by year 2025 there should be a livestock sector, which to a large extent shall be commercially run, modern and sustainable, using improved and highly productive livestock to ensure food security, improved income for households and the nation while conserving the environment”.
The TLMP sets out livestock-sector investment interventions on improved genetics, feed and water resources, health services, huge investment on industry and factory, promotes private sector investment and business environment and hence complementary policy support which could help meet the sector wide approach programme, the Agricultural Sector Development Programme (ASDP II) targets by improving productivity and total production in the key livestock value chains.
viii

May I thank, the capable individuals, supportive institutions and agencies, which greatly contributed to the realization of the TLMP. May, I also acknowledge the commitment of the Permanent Secretary – Livestock Prof. Elisante Ole Gabriel, Director of Policy and Planning Mr. Amosy K. Zephania and TLMP Government team1 for their excellent and recommendable work.
Furthermore, this program found receptive ears and supportive partners from Dr. Jimmy Smith, Director General of ILRI, Rico Natali of the BMGF, Prof. Marcelina Chijoriga the BMGF focal person in Tanzania, and Dr. Amos Omore, ILRI’s representative in Tanzania. Special thanks to the team of international experts from the International Livestock Research Institute (ILRI) who contributed to the making of the Livestock Master Plan; Dr. Barry I. Shapiro, the TLMP team leader from ILRI; Dr. Getachew Gebru, Solomon Desta, Asfaw Negassa, and Kidus Nigussie Brook.
I and my Ministry and other stakeholders we owe a huge debt to implement this Master Plan, which will be a resource weapon for conquer poverty and increase employment, economic growth, sustainable development and Government revenue.
In order to implement this, it may require formulation of new policy and strategies, amendments of laws and regulations, proper coordination of public and private sectors, education and awareness creation of which spirit of courage, commitment, determination and dedication is needed.
For effective and efficiently implementation of TLMP, I call upon every one of us to be focused, transparent, accountable and innovative in implementing the activities outlined in this document. I wish, therefore, to urge all Government staff from Central and Local Government, private sector and other stakeholders to fully commit themselves to the implementation of the Tanzania Livestock Master Plan for the benefit of the people of the United Republic of Tanzania, Africa and global.
Hon. Luhaga Joelson Mpina (MP) Minister for Livestock and Fisheries March, 2019
1Stephen Michael (Senior Economist), TLMP coordinator; Nathaniel Mbwambo (Animal Scientist), co-coordinator, Hassan Mruttu (Principal Livesto
ix
ck Researcher); Mathew MazikuDotto (Veterinarian); Conrad Ndomba, (Animal Scientist); Da Silva Mlau (Principal Statistician); Francis Makusaro (Economist); Salim Nandonde (Animal Scientist);Karim Msemo (Principal Economist) and Julius Crispin, an Economist.

x
Executive Summary In recent years, the Government of Tanzania has prioritized the transformation of the agricultural sector. This approach has been adopted in the 2007, the Agricultural Sector Development Program (ASDP) and its successor, the 2017 ASDP II. The country’s agriculture development plan is designed to meet the objectives set out in a number of existing strategies and policies in the country. Despite is ranked second in Africa in terms of cattle population, livestock-related activities contribute only 7.4% to Tanzania’s GDP and growth of the livestock sector at 2.6% is low (NBS 2016). This growth largely reflects increases in livestock numbers, rather than productivity gains. The absence of a roadmap to develop the livestock sector has persistently hindered successful implementation of previous investment plans for the sector. Though severely constrained by low livestock reproductive rates, high mortality and high disease prevalence, detailed interdisciplinary by the International Livestock Research Institute (ILRI) and the Ministry of Livestock and Fisheries (MLF) revealed the potential benefits of a comprehensive livestock master plan (LMP) for Tanzania. The TLMP sets out livestock-sector investment interventions, including better genetics, feed and health services, and complementary policy support, which could help meet the ASDP II targets by improving productivity and total production in the key livestock value chains of poultry, pork, red meat and dairy. If the proposed investments of USD 621 million, 36% and 64% from the public and private sectors, respectively will be successfully implemented, the anticipated transformation of the sector has the potential to impact positively on rural livestock keepers in increasing their incomes and on urban consumers through lower animal product prices. The success of the TLMP is also critical to the achievement of food and nutrition security at household and national levels. Development of the Tanzania Livestock Master Plan Using the most recently available data, from 2013 to 2015, the MLF supported by ILRI and by the Bill & Melinda Gates Foundation (BMGF), employed the Livestock Sector Investment and Policy Toolkit (LSIPT) to develop herd and sector models and a baseline assessment of the current state of livestock development in Tanzania. This assessment was used to assess the potential long-term, 15–20 years, impact of proposed combined technology and policy interventions, referred to as the Livestock Sector Analysis (LSA), whose results formed the basis for the development of the TLMP for 2017–2022. The TLMP is a series of five-year development implementation plans or “roadmaps”, to be used to implement the ASDP II. The LSA and TLMP interventions, based on investment scenarios related to productivity-enhancing technologies and improved policies developed by the MLF, were tested in accordance national development objectives based on the following criteria:
(i) reducing poverty, (ii) achieving food security and nutrition, (iii) contributing to economic growth, (iv) contributing to exports, and (v) contributing to industrialization.

xi
Using measurable economic indicators for these objectives, four key livestock value chains that is; live animals and red meat and milk (from cattle, sheep, and goats), dairy with crossbred cows, poultry, pigs, and dairy were identified in the LSA as producing the greatest productivity increases contributing to national economic development objectives and the long-term development of the sector. The TLMP comprises two sub-value chains for each value chain: smallholder family and commercial specialized production systems. These sub-value chains are found in one or more of the three major production typology zones of Tanzania: central; coastal and lake; and highlands, plus commercial specialized systems found throughout the country. The rigorous ex-ante technical and financial review of alternative intervention options (investment scenarios) carried out by the MLF is thus a guide to the choice and prioritization of public and private investments that have the highest payoffs for livestock sector transformation. Tanzania Livestock Master Plan Commodity Value Chains Based on results of the LSA, to reach the objectives and goals of the government, the key value chains targeted in the Livestock Master Plan roadmaps are:
(i) Red meat (and milk) from cattle, sheep, and goats: • Improved traditional red meat and milk, • Ranches, • Specialized feedlots.
(ii) Poultry
• Improved family chicken; • Commercial specialized chicken (layers and broilers).
(iii) Pigs/pork
• Traditional system (scavenging and semi-scavenging system); • Commercial specialized pig production systems.
(iv) Cow dairy • Improved family dairy; • Commercial specialized dairy.
(v) Leather
Key results
Red meat value chain development The proposed combined interventions for red meat production on traditional family farms and commercial ranches, as well as feedlot development, would result in a 52% increase in total red meat production. Production would grow to 742,524 tonnes between 2017 and 2022. This would, however, not meet expected consumption growth of 71% by 2022 (to 867,302 tonnes), leaving a 17% deficit (124,778 tonnes) in the 2017–2022 red meat production and consumption balance. Given the rapidly growing population, and increasing incomes and demand for animal-source foods in Tanzania, such projected deficits would put upward pressure on red meat prices.
xii
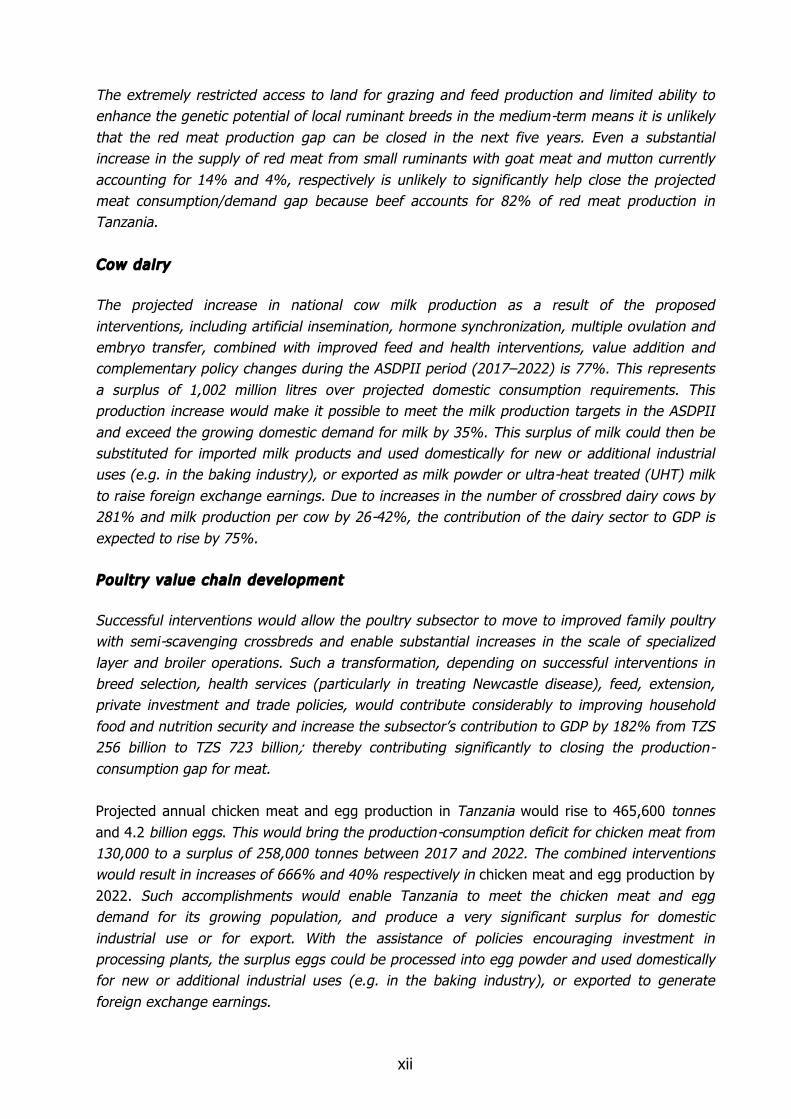
The extremely restricted access to land for grazing and feed production and limited ability to enhance the genetic potential of local ruminant breeds in the medium-term means it is unlikely that the red meat production gap can be closed in the next five years. Even a substantial increase in the supply of red meat from small ruminants with goat meat and mutton currently accounting for 14% and 4%, respectively is unlikely to significantly help close the projected meat consumption/demand gap because beef accounts for 82% of red meat production in Tanzania. Cow dairy The projected increase in national cow milk production as a result of the proposed interventions, including artificial insemination, hormone synchronization, multiple ovulation and embryo transfer, combined with improved feed and health interventions, value addition and complementary policy changes during the ASDPII period (2017–2022) is 77%. This represents a surplus of 1,002 million litres over projected domestic consumption requirements. This production increase would make it possible to meet the milk production targets in the ASDPII and exceed the growing domestic demand for milk by 35%. This surplus of milk could then be substituted for imported milk products and used domestically for new or additional industrial uses (e.g. in the baking industry), or exported as milk powder or ultra-heat treated (UHT) milk to raise foreign exchange earnings. Due to increases in the number of crossbred dairy cows by 281% and milk production per cow by 26-42%, the contribution of the dairy sector to GDP is expected to rise by 75%. Poultry value chain development Successful interventions would allow the poultry subsector to move to improved family poultry with semi-scavenging crossbreds and enable substantial increases in the scale of specialized layer and broiler operations. Such a transformation, depending on successful interventions in breed selection, health services (particularly in treating Newcastle disease), feed, extension, private investment and trade policies, would contribute considerably to improving household food and nutrition security and increase the subsector’s contribution to GDP by 182% from TZS 256 billion to TZS 723 billion; thereby contributing significantly to closing the production-consumption gap for meat. Projected annual chicken meat and egg production in Tanzania would rise to 465,600 tonnes and 4.2 billion eggs. This would bring the production-consumption deficit for chicken meat from 130,000 to a surplus of 258,000 tonnes between 2017 and 2022. The combined interventions would result in increases of 666% and 40% respectively in chicken meat and egg production by 2022. Such accomplishments would enable Tanzania to meet the chicken meat and egg demand for its growing population, and produce a very significant surplus for domestic industrial use or for export. With the assistance of policies encouraging investment in processing plants, the surplus eggs could be processed into egg powder and used domestically for new or additional industrial uses (e.g. in the baking industry), or exported to generate foreign exchange earnings.

xiii
Pig/pork value chain development The proposed combined interventions for improved family and expanded commercial pig production systems would result in a 69% increase in pork production. Production would grow from 22,025 to 37,191 tonnes between 2017 and 2022. The development of a competently market-oriented farming, processing and a dynamic pig/pork marketing sector, operating in more sustainable and climate-smart ways, supplying consumers with high-quality and safe pork would significantly contribute to increased household income, food and nutrition security, poverty alleviation and would increase sector’s contribution to GDP by 83%, from TZS 44 billion to 80 billion between 2017 and 2022. This would bring the production-consumption deficit for pork from 8,000 tonnes to a 1,350-tonne surplus between 2017 and 2022. Improving pig production requires a focus on controlling African swine fever in pigs. In the ‘without additional investment’ scenario, by year 2032, a deficit of 16,000 tonnes of pig meat is estimated, thus resulting in a total ‘all meat’ deficit of 2.0 million tonnes. However, industrializing pork production (in large commercial-scale operations and processing for product transformation) will lower domestic meat prices, and lead to an increase in pig/pork exports and foreign exchange earnings. Meat production-consumption balance Perhaps most importantly, the growth of the poultry and pig subsectors would enable Tanzania to close the projected total national meat production-consumption gap. This growth would also make it possible to increase the share of white meat in the total meat consumed from the current 9% to 41% by 2032, but only if chicken is substituted for red meat. Taking advantage of the benefits of the potential poultry revolution will require substantial investments in promotional activities to change tastes and preferences from beef, as well as from local to exotic chicken meat and eggs. The substitution of the surplus chicken meat for domestic red meat consumption would also lower pressure on domestic meat prices and enable an increase in the export of live animals (cattle, sheep, and goats), potentially raising foreign exchange earnings.
The huge deficit in projected demand (without investments) for red meat is being driven by an increasing human population and income growth. Limited access to land for improving feed production, including grazing lands, and the low genetic potential of local cattle and small ruminant breeds are the main constraints to increased red meat production. Nevertheless, red meat from small ruminants will be of little help in closing the meat gap due to their low numbers, limited feed resources and low genetic potential of indigenous breeds, nor will pork help because of outbreaks of African swine fever and a lack of demand in the country. Leather Industry Development Hides and skins are by-products from ruminants and there is potential to produce 3.6 hides and 12.8 skins. The tanning industry in the country has the total installed capacity equivalent to 104 million square feet per year, which can utilise 86 % hides and 61 % skins. The leather sector, however, remains weak and most of the exports are in the form of traditional products, such as raw and wet-blue hides. Owing to the inadequate quantities and quality of raw hides

xiv
and skins, tanneries are operating well below installed capacity. However, the expanding domestic and international markets point to immense investment potential for this sector. Efforts need to be made to increase the domestic supply of raw materials by among others, increasing the capability and scale up of the small-scale industry to provide secondary markets for large firms and by supporting local entrepreneurs.
Conclusions
Key messages
(i) Investment in poultry has the most potential to close the projected meat consumption gap and could enable export of ruminant animals and red meat. However, domestic consumer preferences for white meat and particularly chicken meat would need significant investment and effort in changing consumer preferences for red meat, especially beef and goat meat;
(ii) The projected gap in milk demanded could be closed and a surplus produced through artificial insemination, hormone synchronization, multiple ovulation and embryo transfer for breed improvement, combined with feed and health interventions addressing young and adult stock mortality (YASM);
(iii) Feed is the biggest constraint to animal productivity improvement. Access to land appropriate for grazing, and land for feed production needs to be addressed to overcome the serious existing feed deficit;
(iv) Red meat production is not expected to increase much over time and help significantly to close the projected all-meat production-consumption gap due to the present limited access to land for feed production and grazing, the need to expand animal health services, and the low genetic potential of local cattle breeds and small ruminants;
(v) Small ruminants are also not expected to contribute much in closing the meat gap due to their low numbers, inadequate feed resources and low genetic potential of indigenous breeds; and
(vi) Pork has potential to help close the projected all-meat production-consumption gap but it is prone to African swine fever requiring improved prevention and control, and its demand is limited; hence it cannot be a priority solution for closing the meat gap.
(vii) Efforts should be made to increase quantity and promote quality of hides and skins,
increase the capability and scale up of the small-scale industry to provide secondary markets for large tannery and by supporting local entrepreneurs.

xv
Priority investment interventions Various combinations of the three standard types of livestock technology interventions– improved genetics, health and feed–are needed to generate higher incomes and animal productivity, and contribute to achievement of national development objectives. The appropriate combinations, depending upon the biophysical, agro-ecological and market conditions facing livestock in the four production zones in Tanzania, include:
(i) Ensuring artificial insemination, hormone synchronization ,multiple ovulation and embryo transfer and improving feed and health interventions addressing YASM to help facilitate a surplus in milk production;
(ii) Targeting animal health interventions to address young and adult stock mortality
(vaccinations, parasite control), and ensuring improved productivity, thereby increasing animal and product off-take for meat and dairy products;
(iii) Prioritizing beef production from on-farm fattening and commercial feedlots as a way of
reducing the red meat deficit;
(iv) Improving access to land appropriate for grazing, and land for feed production to overcome the existing feed deficit, which is the biggest constraint to animal productivity improvement; and
(v) Improving the quality and quantity of livestock feed resources by introducing improved
forage crops and better animal feed management practices, feed production on irrigated land.
Complementary policy interventions: Appropriate policies will be needed to support livestock sector development efforts including in the following areas:
(i) Expanding animal health services provision especially in remote areas where pastoralists predominate. Public-private partnerships could be explored for offering these services where private investments are risky, and returns are low;
(ii) Veterinary services to be provided in a modified way through a policy of selective privatisation and support by public sector;
(iii) Undertaking investments in promotional activities to change tastes and preferences from beef to white meat, especially chicken;
(iv) Prioritizing poultry investments in genetic improvement by focusing on crossbred and
fully exotic chicken and pure breeds for both family and commercial enterprises;

xvi
(v) Promoting an extensive (or massive) artificial insemination, synchronisation, multiple ovulation and embryo transfer to increase the number of improved breeds and increase milk production
(vi) Prioritizing policies creating a conducive environment for investment in commercial
meat and milk production and processing; (vii) Promoting production and utilization of other livestock by-products for the
provision of industrial inputs and income generation to livestock producers and traders.
(viii) Promoting land allocation and ownership policies which facilitate the investments
required to increase feed availability for meat and milk production;
(ix) Promoting land leasing, including land under irrigation, for animal and feed production and providing tax incentives and subsidized leasing rates to entrepreneurs;
(x) Promoting exports to more remunerative markets in the region through the introduction of a practical and affordable system of animal identification and traceability, as well as food safety and animal health programs that include disease surveillance and monitoring animal slaughter processes;
(xi) Promoting livestock, livestock product and by product for domestic and export trade
by keeping fare business environment through control of cross border trade, strategic issuing and availability of livestock permits, license and supervision of primary, secondary and boarder markets in order to increase revenue accrued from trade
(xii) Promoting substantial private investment in livestock product transformation through high value-added processing; and
(xiii) Improving the enabling environment for agribusiness investment by streamlining regulations and procedures to attract and maintain private investment.

1
Introduction According to the Livestock Sector Analysis (LSA), Tanzania accounts for about 1.4% of the global cattle population and 11% of African cattle population (FAO 2014). The main livestock types are cattle, goats, sheep, pigs, chickens, and donkeys. Based on the 2016/2017, LSA baseline Tanzania has about 28.4 million cattle, 16.7 million goats and 5 million sheep. Other livestock include; 2 million pigs, 37.4 million local chickens and 34.5 million improved chickens (as also reported in the MALF budget speech, 2016/17). Goat meat and mutton currently account for 14% and 4% of all red meat respectively thus, their improved productivity is unlikely to significantly close the projected meat consumption/demand gap as beef accounts for 82% of the red meat production in Tanzania. Thus, the development focus has to include cattle. The national herd is dominated by indigenous cattle which are currently displaying low productivity, but they have much potential if feed, health and breed improvements can be made. The main breeds of beef cattle in the country include: Tanzania Shorthorn Zebu (TSHZ) characterized by small size mature body weight (200–350 kg); Longhorn Cattle (LHC) such as the Ankole which is characterized by large matured body weight (500–730 kg); and the Boran which has a large body weight (500–800 kg). The country has many other outstanding natural resources to support livestock development including extensive rangelands; diverse natural vegetation and its diversely resilient low production livestock breeds. Despite these resources, the livestock sector is performing below its potential. The LSA baseline analysis showed that only with additional investments in technological change and changes in policy can the productivity and production potential of these animal resources be sufficiently improved to provide sufficient animal-source foods (ASFs) to feed a rapidly growing population, with its rapidly increasing income and demand for ASFs. Presently, livestock activities contribute only 7.4% to the country’s GDP and the annual growth rate of the sector is low at 2.6%. This growth for the large part reflects an increase in livestock numbers rather than productivity gains. The sector is severely constrained by low livestock reproductive rates, high mortality and high disease prevalence, and lack of feed (TLMI 2015). The widely accepted baseline results for the sector and the LSA investment scenario results shared below point to high returns on investment in livestock. They also show there is a need to strategically increase investments in livestock production systems and value chains in order to improve productivity and incomes, thus enhancing the sector’s economic contributions at all levels, and to the development objectives mentioned above. In the investment scenarios carried out by MLF under the LSA on productivity enhancing technology interventions, combined with better policies, the following current national

2
development objectives of Tanzania were used as decision criteria for comparing the alternative investment interventions (combined technology and policy):
• reducing poverty; • achieving food security and nutrition; • contributing to economic growth; • contributing to exports; and • contributing to industrialization.
Using measurable economic indicators for the above objectives, four key livestock value chains–live animals and red meat and milk (from cattle, sheep, and goats), dairy with crossbred cows, and poultry and pigs (both white meat)–were identified in the LSA as having the most potential for productivity increase with new investments to achieve these national economic development objectives and contribute most to the long-run development of the sector. The rigorous ex-ante technical and financial analysis of alternative intervention options (investment scenarios) carried out by MLF is thus a guide to the choice and prioritization of public and private investments with the highest payoffs for livestock sector transformation. Priority interventions to modernize the sector The identified priority technology interventions for modernizing the livestock sector include:
(i) Improving the quality and quantity of livestock feed resources by introducing
improved forage crops and improved animal feed management practices, as well as increased access to existing lands appropriate for grazing;
(ii) Improving the productivity of indigenous livestock by changing the genetic composition through breed selection by crossbreeding, introducing pure exotic breeds where feasible and through improved animal husbandry interventions;
(iii) Increasing the quality and quantity of animal health services and livestock producers’ access to these services through private and/or private-public partnerships in order to decrease YASM;
(iv) Designing and implementing policies and institutional interventions which enable private and private-public investment interventions in animal feed, genetics, animal feed and animal husbandry.
Key results and conclusions: Profitability, GDP and nutritional impacts The return on investment (ROI) in the livestock sector is very attractive and has significant impact on household incomes (Table 1) and food and nutrition security, as well as the national economy. For all species and commodity value chains, the internal rate of return

3
(IRR) obtained was greater than 10% (the assumed project financial discount rate), except for the investment in cattle ranches in the coastal and lake zone (IRR = 6.6%). The other IRRs ranging from 15–86% indicate the substantial financial viability of all other investments. The incremental change in GDP in 2031 due to livestock investment interventions as compared to the base year of 2016 was also found to be very large. The incremental change was more than 80% in all cases and the highest incremental change of 4,696% was observed for cattle fattening. In comparison with the ‘without additional investment’ scenario in 2031, the ‘with additional investment’ intervention resulted in an increase of GDP which varied from 8% for cattle ranching in central zone to 1,187% for cattle fattening.

4
Table 1: Profitability, GDP and Nutritional Impacts of Investment in the Livestock Sector by year 2031 Increase in GDP contribution from
additional investments in livestock by 2031 by production system and
zone
% change in nutrition contribution
No.
Value chain and production zone
Internal rate of
return –IRR
In comparison with the base year 2015/16
In comparison with the without additional investment in 2031
Calories
Protein
1 Improved traditional cattle small-scale (central)
34%
87%
8%
8 22
2 Improved traditional cattle medium-to large-scale (central)
18% 10 49
3 Ranch cattle (central) 39% NA NA
4 Improved traditional cattle—small-scale (coastal and lake)
77%
131%
57%
5 15
5 Improved traditional cattle medium-to large-scale (Coastal and lake)
58% 35 105
6 Ranch cattle (coastal and lake)
6.6%
7 Improved traditional cattle—small-scale (highlands)
18%
196%
48%
2 5
8 Improved traditional cattle—large-scale (highlands)
15% 25
9 Ranch cattle (highlands) 73% NA NA
10 Urban and peri-urban dairy cattle small-scale (all zones)
35%
1,748%
958%
2 42
11 Urban and peri-urban dairy cattle medium- to large-scale (all zones)
73% 14 114
12 Cattle fattening (all zones) 72% 4,696% 1,187% NA NA
13 Improved traditional pigs small-scale (all zones)
86%
651%
165%
3 1
14 Improved traditional pigs—medium- to large-scale (all zones)
17% 8 5
15 Specialized pig operation (all zones)
22% 1 2
Source: LSIPT Livestock Sector Analysis (2017), MLF and calculation from LSIPT

5
The nutritional impact was also assessed in terms of the percentage change in livestock contribution to calories and protein. The increase in calories varied from only 1% for specialized pig operations to 35% for medium- to large-scale improved traditional cattle. The percentage change in contribution to protein varied from 1% for small-scale improved pigs to 105% for medium- to large-scale improved traditional cattle. It is important to note that the investment in improved traditional pigs is most profitable, but it contributes potentially least to household nutrition while the investment in medium- to large-scale cattle (coastal and lake zone) is modest in return on investment, but it also has the highest potential nutritional impact of the meat operations (assuming the meat is consumed in the household and not sold). Meanwhile, urban and peri-urban dairy cattle, medium- to large-scale (in all zones) also has significant potential to contribute to household nutritional security (again assuming the meat is consumed in the household and not sold). Production-consumption balance Without additional investments in the sector the projected red meat production-consumption gap in 15 years (by 2031/32) is estimated to be 1.7 million tonnes, driven by existing poor animal genetics, health, and feed constraints. Moreover, the scenario analysis with the current level of dairy investments shows that there will be a production-consumption gap/deficit of 5.8 million litres in 15 years. These projected deficits will also be driven by a high human population, increased incomes, urbanization, and income elasticity of demand, leading to very high projected growth in consumption of animal-source foods. The key results and conclusions of the ‘with additional investment’ scenario analysis in the LSA for each priority livestock value chain are as follows: Red meat The extremely limited access to land for grazing and feed production and limited ability to raise the genetic potential of local ruminant breeds in the medium- to long-term (15 years) mean that the red meat production shortage is unlikely to be closed in this period (Figure 1). Moreover, additional supply of red meat from ruminants will not contribute much to closing the projected ‘all-meat’ production-consumption gap. Beef is the dominant component of the red meat consumed in Tanzania, along with goat meat and mutton (sheep meat). In the base year of the sector analysis (2016–17), beef accounted for about 82% of the total red meat while goat meat and sheep meat accounted for 14% and 4%, respectively. The projected production-consumption balance indicates that there will be little change in the composition of red meat produced over the coming 15 years, with beef remaining dominant and accounting for 79% of total red meat without additional investment and 82% with additional investment.

6
Figure 1: Production-consumption balance for red meat with and without additional investments for Tanzania, 2016/17–2031/32.
500
1000
1500
2000
2500
Thou
sand
tons
/year
2016 2021 2026 2031
Consumption Production without investmentProduction with additional investment
Panel: Red meat
White meat Improving white meat requires a focus on controlling Newcastle disease and African swine fever (ASF) disease in chicken and pigs, respectively, to increase their productivity and their off-take and meat production. Raising productivity would help close the projected all-meat consumption-production gap projected in 15 years, thus helping to achieve better food security and enable red meat exports. In the ‘without additional investment’ scenario, by year 2031/32, a deficit of about 234,000 tonnes of white meat is projected resulting in total all meat deficit of 2 million tonnes. Moreover, industrializing white meat (chicken and pork) production in large commercial-scale operations and investing in industrial-scale processing for product transformation and value addition would likely lead to lower domestic meat prices, while enabling an increase in exports and foreign exchange earnings by enabling red meat to be exported. However, taking advantage of the benefits of the potential ‘white meat revolution’ would require substantial investments in promotional activities to change tastes and preferences from beef, as well as from local to exotic chicken meat and eggs.

7
Figure 2: Production-consumption balance for white meat with and without additional investments for Tanzania, 2016–2031.
0
500
1000
1500
2000
Thou
sand
tons
/year
2016 2021 2026 2031
Consumption Production without investmentProduction with additional investment
Panel: White meat
All meat The projected all meat production ‘with additional combined investment’ in the livestock sector is estimated at 3.2 million metric tonnes in 2031/32, a 199% increase from the without additional investment scenario. The self-sufficiency rate also increases from 35% to 105%, resulting in a surplus of 158 thousand metric tonnes which represents a potentially exportable quantity of not only primarily beef, but also perhaps other ruminant meats (goat meat and mutton) to surrounding countries, and even surplus chicken and eggs.

8
Figure 3: Production-consumption balance for all meat with and without additional investments for Tanzania, 2016–2031.
500
1000
1500
2000
2500
3000
Thou
sand
tons
/year
2016 2021 2026 2031
Consumption Production without investmentProduction with additional investment
Panel: All meat
Cow dairy The scenario analysis with the current dairy investment level shows that there would be a production-consumption gap of 5.4 million litres of milk in 15 years (Figure 4). The ‘with investment’ scenario analysis for additional dairy investments shows the gap in projected milk consumption can be closed and a surplus produced through artificial insemination, hormone synchronization, multiple ovulation and embryo transfer combined with improved feed and health interventions, value addition processing to help ensure a market for fresh milk, and complementary policy changes. Thus, with additional investments there could be a surplus of about 0.5 million litres of milk in 2031/32 which would provide raw material for domestic industries and export, after meeting domestic consumption requirements.

9
Figure 4: Production-consumption balance for cow milk with and without additional investments for Tanzania, 2016–2031
2000
4000
6000
8000
10000
Thou
sand
tons
/year
2016 2021 2026 2031
Consumption Production without investmentProduction with additional investment
Panel: Milk
Main results and conclusions of the livestock sector analysis
(i) Significantly increasing poultry production and consumption is key for increasing the contribution of animal-source foods in achieving greater household and national food security;
(ii) The projected gap in milk demand could be closed and a surplus produced through the use of artificial insemination, hormone synchronization, multiple ovulation and embryo transfer for breed improvement, combined with feed and health interventions addressing YASM;
(iii) Livestock genetic improvement priorities should focus on dairy crossbreeds and exotic chicken pure breeds for both family and large-scale investment;
(iv) Animal health interventions for YASM (vaccinations, parasite control) are critical to ensure improved productivity, thereby increasing animal and product off-take of meat and dairy;
(v) Feed is the biggest constraint to animal productivity improvement. Challenges of access to land appropriate for grazing, and land for feed production need to be addressed to overcome the existing animal feed deficit;

10
(vi) Land allocation and ownership policies need to change to favour the investments required to increase feed for meat and milk production;
(vii) The policy priority should focus on creating a more conducive environment for investment in commercial meat and milk production and processing;
(viii) The huge projected deficit in consumption of red meat is driven by an increasing human population and urbanization as well as rapid income growth;
(ix) Emphasis to improve cattle off-take needs to focus on increasing beef production from on-farm fattening and commercial feedlots;
(x) Red meat production cannot be expected to increase much over time and or to help significantly in closing the projected ‘all meat’ production-consumption gap due to the present limited access to land for feed production and grazing, the need to expand animal health services, and the low genetic potential of local cattle breeds and small ruminants;
(xi) Animal health services need to expand dramatically, especially in remote areas where pastoralists predominate, and public-private partnerships could be used where private investments are risky and the returns are low;
(xii) Pork is prone to African swine fever and its demand is limited, hence it cannot be a priority solution for closing the meat supply gap; and
(xiii) Investing in chicken production has the most potential to close the meat production-consumption gap and could enable export of ruminant animals and red meat. However, domestic consumer preferences for white meat and particularly chicken meat would need significant investment and effort in changing consumer preferences for red meat, especially beef and goat meat.

11
DAIRY DEVELOPMENT ROADMAP 2017/2018–2021/2022

12
Vision The overall vision of the dairy development roadmap is increased milk production that meets the domestic demand and the surplus is exported. This goal will be achieved by increasing dairy cow productivity through improvements in dairy cow genetics, health and nutrition and by expanding the national dairy cow herd and improving the processing and marketing of dairy products.
Overall target The number of crossbred dairy cattle at the national level will increase by about 3.8 times from the current 783,000 to 2,985,000 by 2021/22.
Table 2: Current and Projected Number of Crossbred Cattle by Production Zone in Tanzania
Livestock production zone
Number of crossbred cattle in improved family dairy and commercial specialized dairy
% change
Base year (2016/17) 2017/18 2018/19 2019/20 2020/21 2021/22
Improved family dairy
Coastal and lake
156,857 339,596 568,881 842,297 1,162,868 1,394,338 789
Highlands 375,337 460,801 556,671 665,979 790,043 930,286 148
Total in improved family dairy
532,194 800,397 1,125,552 1,508,276 1,952,911 2,324,624 337
Commercial specialized dairy
Commercial specialized
250,800 304,348 369,330 448,185 543,877 660,000 163
National number of crossbreeds
782,995 1,104,745 1,494,882 1,956,462 2,496,788 2,984,624 281
Source: LSIPT livestock sector analysis (2016), MLF
The production of milk at the national level will increase from 2,159 million litres in the base year to 3,816 million litres in 2021/22, an increase of about 77% over 5 years. Though most of this change is expected to come from improvement and increased production by dairy cows, improvement of cattle for red meat production will also contribute to milk production (the next section).

13
Table 3: Current and Projected Milk Production in Tanzania
Livestock production zone
National and production system milk production (thousand litre) % change
Base year (2016/17) 2017/18 2018/19 2019/20 2020/21 2021/22
Central 848,140 884,466 922,348 961,853 1,003,049 1,046,010 23
Coastal and lake
751,923 841,687 942,166 1,054,641 1,180,542 1,321,474 76
Highlands 344,186 401,149 467,541 544,920 635,106 740,219 115
Commercial specialized dairy
214,885 272,832 346,405 439,819 558,423 709,011 230
Total milk production 2,159,134 2,400,134 2,678,461 3,001,233 3,377,121 3,816,714 77
Source: LSIPT Livestock Sector Analysis (2017), MLF
Productivity improvement interventions in the dairy cow production system will result in 31% increase in the average annualized milk productivity of a cow in traditional and improved family dairy subsystem and a 26% increase in commercial specialized dairy. The national average annualized milk production of a cow will increase from 179 litres to 254 litres over 5 years (2016/17–2021/22). Table 4: Annualized Milk Productivity of Cows in Traditional and Improved Family Dairy and Commercial Specialized Dairy Subsystems
Livestock production Zone
Milk production per reproductive female per year (litre) % change
Base year (2016/17) 2017/18 2018/19 2019/20 2020/21 2021/22
Traditional and improved family dairy
165 174 184 194 205 216 31
Commercial specialized dairy
1,757 1,839 1,925 2,015 2,108 2,207 26
National 179 192 206 221 237 254 42
Source: LSIPT Livestock Sector Analysis (2017), MLF
Mainly due to dairy but also red meat improvement interventions, the GDP contribution of milk at the nation level is expected to increase from TZS 808,342 million in 2016/17 to TZS 1,415,671 in 2021/22, a 75% increase (Table 5).

14
Table 5: GDP Contribution of Milk at National Level
GDP contribution by commodity (TZS million) % change
Livestock product
Base year (2016/17) 2017/18 2018/19 2019/20 2020/21 2021/22
Milk 808,342 904,209 1,011,445 1,131,399 1,265,578 1,415,671 75 Source: LSIPT Livestock Sector Analysis (2017), MLF
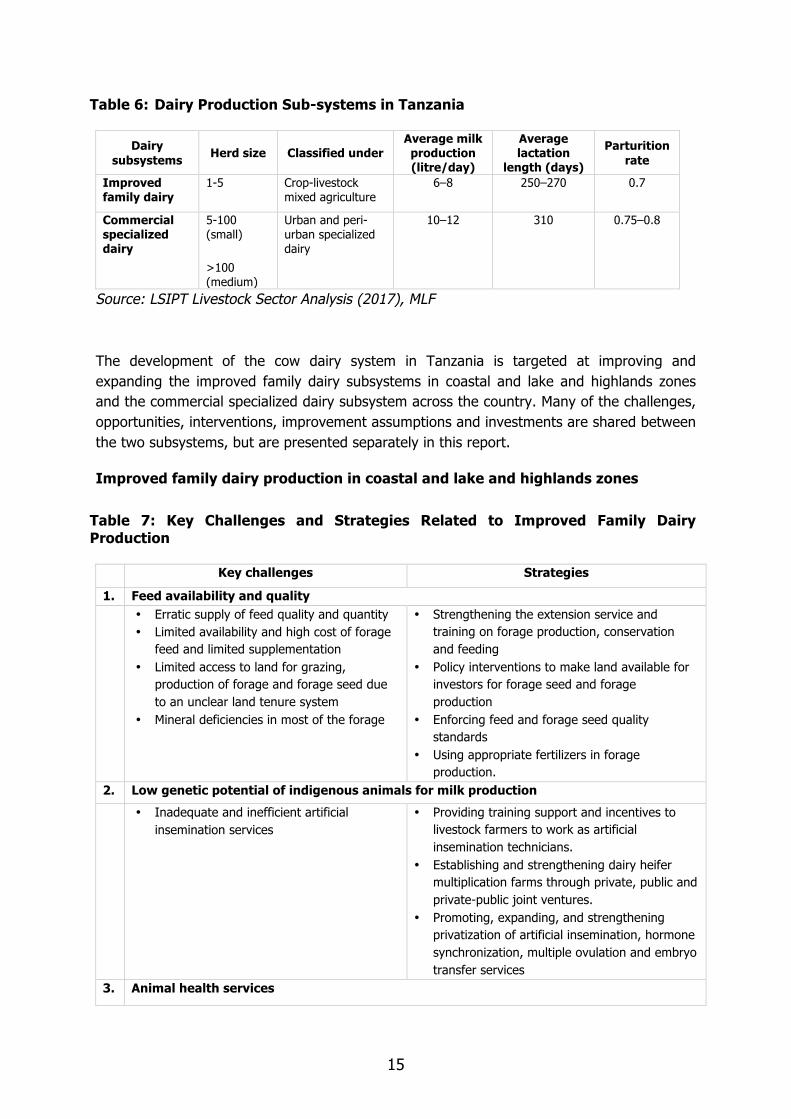
Target production subsystems for cow dairy improvement interventions The dairy production system in Tanzania can be divided into three major categories: traditional cow meat-milk, improved family dairy, and commercial specialized dairy subsystems (Nell et al. 2014). The traditional cow meat-milk production subsystem is not specialized on a single commodity and both milk and meat are important products. However, milk is a priority commodity in improved family dairy and commercial specialized dairy subsystems. Both of these subsystems use crossbred/pure temperate dairy breeds like Holstein, Jersey and Ayrshire and they differ mainly on the level of intensification and specialization (Nell et al. 2014). In the improved family dairy subsystem, the level of input by farmers is lower compared to the commercial specialized dairy subsystem. The input level in improved family dairy subsystem depends on marketing opportunities and income from sale of milk. Cattle are kept under semi and zero-grazing settings with cultivated fodder, crop residue and grass cut from communal land providing most of the feed. Channels for selling milk rely on direct marketing of milk to the consumer and milk collection centres. The commercial specialized dairy subsystem is more commercialized and specialized and has higher input of feeds and animal health services compared to the improved family dairy subsystem. This subsystem is divided into small and medium-sized farms, based on herd size. In small farms, farmers keep between 2-3 mostly crossbred cows that are not mixed with indigenous cattle. Farmers in the medium commercial and specialized dairy subsystem own larger herds of cattle, often more than 100 cows, with a national average of 450 animals. These farms are government or privately-owned farms with their own input delivery systems. The milk produced in these farms is sold directly to milk processing plants or processed within the farms.
15
Table 6: Dairy Production Sub-systems in Tanzania
Dairy subsystems Herd size Classified under
Average milk production (litre/day)
Average lactation
length (days) Parturition rate
Improved family dairy
1-5 Crop-livestock mixed agriculture
6–8 250–270 0.7
Commercial specialized dairy
5-100 (small)
>100 (medium)
Urban and peri-urban specialized dairy
10–12 310 0.75–0.8
Source: LSIPT Livestock Sector Analysis (2017), MLF
The development of the cow dairy system in Tanzania is targeted at improving and expanding the improved family dairy subsystems in coastal and lake and highlands zones and the commercial specialized dairy subsystem across the country. Many of the challenges, opportunities, interventions, improvement assumptions and investments are shared between the two subsystems, but are presented separately in this report.
Improved family dairy production in coastal and lake and highlands zones Table 7: Key Challenges and Strategies Related to Improved Family Dairy Production Key challenges Strategies
1. Feed availability and quality • Erratic supply of feed quality and quantity
• Limited availability and high cost of forage feed and limited supplementation
• Limited access to land for grazing, production of forage and forage seed due to an unclear land tenure system
• Mineral deficiencies in most of the forage
• Strengthening the extension service and training on forage production, conservation and feeding
• Policy interventions to make land available for investors for forage seed and forage production
• Enforcing feed and forage seed quality standards
• Using appropriate fertilizers in forage production.
2. Low genetic potential of indigenous animals for milk production
• Inadequate and inefficient artificial insemination services
• Providing training support and incentives to livestock farmers to work as artificial insemination technicians.
• Establishing and strengthening dairy heifer multiplication farms through private, public and private-public joint ventures.
• Promoting, expanding, and strengthening privatization of artificial insemination, hormone synchronization, multiple ovulation and embryo transfer services
3. Animal health services

16
Key challenges Strategies
• High calf mortality • Inefficient animal health services • Inadequate supply of drugs • Poor quality control of drugs and supplies • High prevalence of transboundary diseases
and trypanosomosis
• Rationalizing and strengthening the animal health regulatory capacity at the national and local government authorities (LGAs) levels under the coordination of the MLF
• Improving availability and quality control of vaccines and drugs
4. Marketing and processing
• Unreliable transport system • Narrow product range which is concentrated
on short shelf-life products i.e. liquid and fermented milk
• Poor milk marketing and low price of milk • Fluctuations in milk supply due to
seasonality (dry and wet seasons) • An absence of quality-based pricing
incentives • Poor milk quality control and enforcement
mechanisms • Existing informal trade of raw milk which
poses threat to spreading zoonoses • Limited promotion of dairy-product
consumption
• Promote investment in long shelf-life milk products such as UHT and powdered milk
• Introduction of quality-based standards and pricing to encourage quality milk supply
• Strengthen enforcement of milk and milk products quality standards
• Formalize milk trade by training and licensing milk traders
• Scale up school-milk feeding program to promote milk consumption
5. Policy
• Pricing policies have disincentive effects on milk processing
• Overregulation of the dairy industry resulting to multiple taxes which is a burden to investors
• Introduction of a protective trade policy that includes increasing import tariffs or bans and/or subsidies for domestically-produced milk products to enable competition with imports
• Put in place indicative prices for milk products • Reduce bureaucracy and facilitate investment in
the dairy industry.
Interventions to achieve targets All production zones are expected to benefit from the cow dairy improvement interventions. Expanding and improving the commercial specialized dairy subsystem will be implemented in all over the country while expanding and improving the improved family dairy subsystem will target coastal and lake, and highlands zones. The major criteria used to select the production zones for improved family dairy subsystems include feed availability, climatic condition (temperature), and prevalence of endemic diseases like trypanosomiasis, existing experience in dairying, product marketing infrastructure, and comparative advantage of each zone for dairy.

17
Main activities Feed improvement interventions The feed balance estimate in the costal and lake and highlands zones shows significant deficit. Maintaining moderately high productive crossbred dairy cattle therefore should be accompanied with a significant increase in amount of feed produced/purchased. In the coastal and lake zone, up to 60% and in highlands zone up to 40% of the feed requirement should be either produced/purchased to keep the crossbred dairy cattle productive. The type of feeds produced/purchased could be:
• Improved forage (grass/legumes/fodder trees and shrubs); • Concentrate feeds (locally made and industrial by-products); and • Strengthen the existing forage/forage seed/ quality control laboratories.
Genetic improvement interventions
(i) Use artificial insemination with and without hormone synchronization and/or proven bulls for crossbreeding/breeding;
(ii) Increase the number of crossbred cattle in the improved family dairy system through crossbreeding/breeding of indigenous and crossbred cattle using exotic dairy cattle breeds like Friesian, Ayrshire, Jersey, Brown Swiss and Mpwapwa;
(iii) Strengthen existing national and zonal artificial insemination centres and establish a new semen production centre;
(iv) Acquire five new liquid nitrogen plants; (v) Training and capacity building for 6,650 artificial insemination technicians (vi) Encourage establishment of bull centres; (vii) Encourage establishment of crossbred heifer multiplication farms; (viii) Purchase and distribute crossbred heifers for under-resourced dairying beginners
(2,000 every year); and (ix) Sensitize farmers on the formation of breed societies.
Animal health improvement interventions
(i) Set up an East Coastal fever vaccination program to vaccinate of 300,000 dairy cattle annually;
(ii) Implement vaccination campaign for Foot and Mouth Disease, Rift Valley Fever, Contagious Bovine Pleuropneumonia, Brucellosis, East Coastal Fever, transboundary diseases and perform routine internal and external parasite control programs;
(iii) Improve the capacity for livestock disease surveillance and diagnosis; (iv) Rehabilitate veterinary centres.
Milk and dairy products improvement interventions
(i) Provide incentives and ease the bureaucracy for investors seeking to establish milk processing plants;
(ii) In addition to small- and medium-scale pasteurized milk processing plants; promote establishment of high capacity milk processing plants (at least 1 UHT milk and 1 milk powder processing plants);
(iii) Promote the establishment of and strengthen the dairy cooperative/societies in high potential areas through training, sensitization, equipping and facilities;

18
(iv) Encourage/establish at least 150 milk collection centres/chilling plants (cold chain); (v) Strengthen the Dairy Board (office and laboratory) to improve quality regulation and
marketing of milk in milk shed areas; (vi) Strengthen the capacity of the milk quality assessment and safety control laboratory; (vii) Strength school-milk feeding programs to benefit 500,000 children in five years–
starting from 100,000 children on the base year and adding new 100,000 children every year.
Extension services improvement interventions Training livestock farmers and improved family dairy farmers on better husbandry, breed improvement and feeding practices. Assumptions and targets of interventions and outputs Farmers adopting the cow dairy improvement interventions will have higher cost of feed and veterinary services due to following up of the recommended frequency of vaccination, internal and external parasite treatments. The veterinary cost of adopting farmers is expected to be doubled from TZS 7,500 to TZS 15,000. Moreover, due to the current shortage of feed, the percent of feed purchased will increase to between 7–15% of the feed requirement of cattle in improved family dairy subsystems, from the current 0% purchase. Feed produced in the farm is also expected to grow likewise. Cattle receiving the dairy improvement interventions are expected to show the following improvements in productivity:
(i) Parturition rate increased from 0.58 to 0.70 in coastal and Lake Zone and from 0.60 to 0.70-0.75 in the highlands zone;
(ii) Mortality rate decreased by 50; (iii) Live weight of cattle increased by 7-20% in both Coastal and Lake and Highlands
Zones; (iv) Lactation length of local breed cattle in coastal and lake and highlands zones
increased from 180 to 250 days and 270 days for small and medium improved family dairy crossbred cattle subsystems, respectively; and
(v) Daily milk production of local breed cattle in coastal and lake and highlands zones increased from the current 1.5 and 2 litres/day, respectively, to eight (8) litres/day in improved family dairy crossbred dairy cattle.
At the national level, the dairy improvement intervention is expected to result in increases of crossbred dairy cattle numbers and milk production in the improved family dairy subsystem. The number of crossbred dairy cattle in improved family dairy (coastal and lake, and highlands) subsystem increases from 532,194 to 2,324,624 in 2021/22 (Table 2). The cow dairy improvement intervention in improved family dairy subsystems of coastal and lake and highlands zones will result in increase of milk production from 1,096 million litres in 2016/17 to 2,062 million litres in 2021/22.

19
Table 8: Increase in Milk Production due to Cow Dairy Improvement in Improved Family Dairy Subsystem of Coastal and Lake and Highlands Zones
Livestock production zone
Milk production in improved family dairy subsystem (thousand litre) % change
Base year (2016/17) 2017/18 2018/19 2019/20 2020/21 2021/22
Coastal and lake
751,923 841,687 942,166 1,054,641 1,180,542 1,321,474 76 Highlands
344,186 401,149 467,541 544,920 635,106 740,219 115 Total milk production
1,096,109 1,242,836 1,409,707 1,599,561 1,815,648 2,061,693 88 Source: LSIPT Livestock Sector Analysis (2017), MLF
Table 9: Average daily milk production change per cow in coastal and lake, and highlands zones due to cow dairy improvement interventions in improved family dairy subsystem
Livestock production zone
Average daily milk production per reproductive female (litre) % change
Base year (2016/17) 2017/18 2018/19 2019/20 2020/21 2021/22
Coastal and lake
1.50 1.62 1.74 1.88 2.02 2.18 45 Highlands
2.00 2.14 2.30 2.47 2.65 2.84 42 Source: LSIPT Livestock Sector Analysis (2017), MLF
The average annualized milk production of a cow in the improved family dairy subsystem of coastal and Lake Zone increases from the 157 litres in 2015/16 to 240 litres in 2020/21. The average annualized milk production of a cow in improved family dairy subsystem of highlands zone increases from the current 215 litres to 343 litres in 2020/21.
Table 10: Annualized Milk Production of Cow in Coastal and Lake and Highlands Zones
Livestock production zone
Milk production per reproductive female per year %
change Base year (2016/17) 2017/18 2018/19 2019/20 2020/21 2021/22
Coastal and lake 157 171 186 202 220 240 53
Highlands 215 236 259 285 313 343 59
Source: LSIPT Livestock Sector Analysis (2017), MLF

20
Investments The investments in cow dairy cattle development in the Coastal, Lake and Highlands Zones can be categorized into six major groups—feed, breed, health, extension, research, and marketing improvement investments. Investments related to feed improvement include improving pasture and forage and concentrate feed production and marketing through construction of commercial animal feed plants, improving existing feed and forage seed quality control laboratories (equipment and human resource capacity building). This is estimated to cost a total of TZS 44 billion. The investment to improve animal health is shared with cattle, sheep and goats as many of the interventions will serve all the three species. Animal health improvement investments will support the vaccination campaign to control and prevent East Coastal Fever, Contagious Bovine Pleuropneumonia, Foot-and-Mouth Disease, Rift Valley Fever, and Brucellosis and improve the capacity of veterinary centres, diagnostic laboratories for surveillance and diagnosis and construction and rehabilitation of dip tanks. Similar to the health improvement investments, investments to improve livestock extension services will serve all ruminant species. Cattle breed improvement investment is estimated to cost around TZS 52.6 billion for over five years. This investment will be aimed at strengthening existing national and zonal artificial insemination centres, establishing a new semen production centre, acquiring new liquid nitrogen plants, training and building the capacity of 6,650 artificial insemination technicians, establishing bull centres, purchasing and distributing crossbred heifers for under-resourced farmers, and establishing crossbred heifer multiplication farms. Investments to improve the capacity of research centres to carry out research on breed improvement, feed, health, marketing and value chain and dairy extension services are estimated to cost up to TZS 22 billion. Investment to improve milk marketing and processing is estimated to cost over TZS 106 billion. The construction of UHT and milk powder processing plants, formation and strengthening of dairy cooperative societies in high potential areas (training, sensitization, equipping and facilities), establishing milk collection/ chilling centres (cold chain), strengthening dairy board to regulate milk quality in lake and coastal, and highlands zones, strengthening the capacity of milk quality and safety control laboratory and school-milk feeding programs is expected to improve the marketing and processing of milk.

21
Table 11: Five-Year Dairy Improvement Investment (2017/2018–2021/2022)
No. Investment intervention
Investment cost (TZS million) Budget source % 2017/18 2018/19 2019/20 2020/21 2021/22 Total
1 Animal feeding i Pasture
establishment and paddocking Land preparation, pasture establishment and paddocking in newly-established 150 medium farms (50 Ha)
7,920 7,920 7,920 7,920 7,920 39,600 Private 100
ii Commercial animal feeds plants. Construction of 2 plants (TZS 1,100 million per plant).
- 1,100 - 1,100 - 2,200 Private 100
iii Feeding technologies and land acquisition (production, processing and storage) for newly established 150 medium farms.
176 176 176 176 176 880 Public- 80
Private–20
iv Feed quality control (laboratories and capacity building) and improving the existing (first five years)
- 440 - - - 440 Public–100
v Strengthen the existing pasture/forage seed quality control laboratories
880 - - - - 880 Public–100
Subtotal 8,976 9,636 8,096 9,196 8,096 44,000
2 Animal health i East Coastal fever
vaccination program for 300,000 dairy cattle per year
- - - - - - Income mentioned in red meat improve-
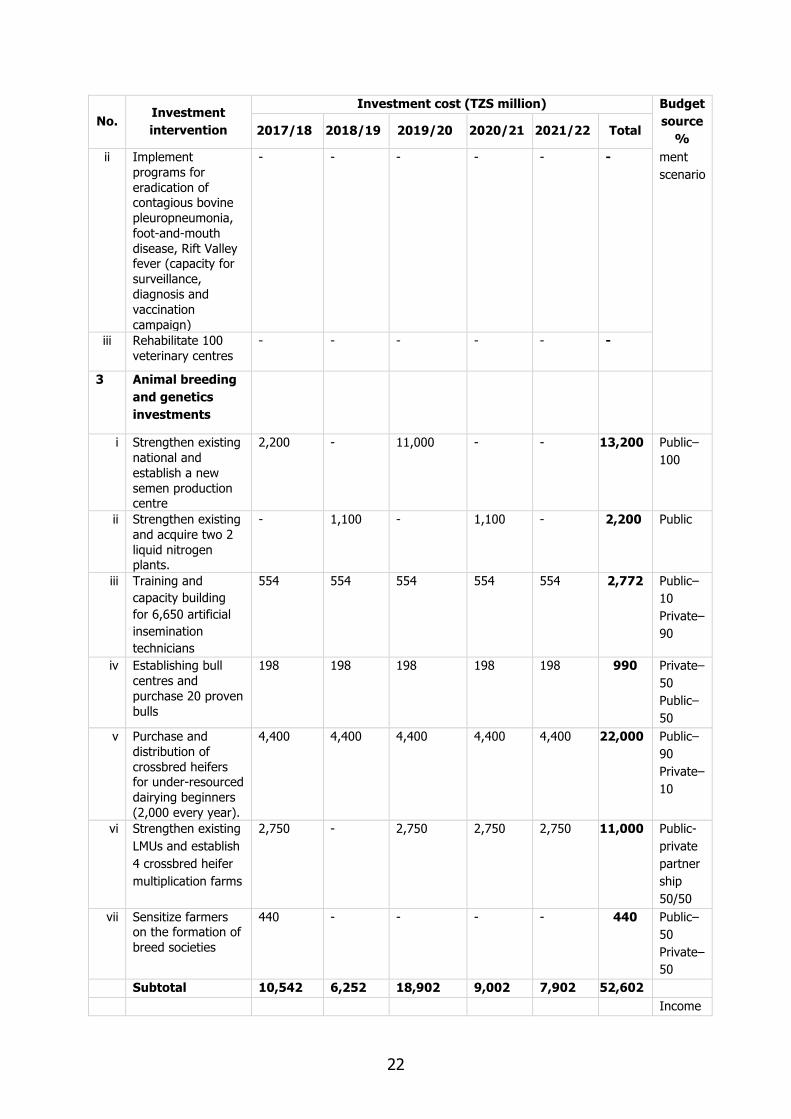
22
No. Investment intervention
Investment cost (TZS million) Budget source % 2017/18 2018/19 2019/20 2020/21 2021/22 Total
ii Implement programs for eradication of contagious bovine pleuropneumonia, foot-and-mouth disease, Rift Valley fever (capacity for surveillance, diagnosis and vaccination campaign)
- - - - - - ment scenario
iii Rehabilitate 100 veterinary centres
- - - - - -
3 Animal breeding and genetics investments
i Strengthen existing national and establish a new semen production centre
2,200 - 11,000 - - 13,200 Public–100
ii Strengthen existing and acquire two 2 liquid nitrogen plants.
- 1,100 - 1,100 - 2,200 Public
iii Training and capacity building for 6,650 artificial insemination technicians
554 554 554 554 554 2,772 Public–10 Private–90
iv Establishing bull centres and purchase 20 proven bulls
198 198 198 198 198 990 Private–50 Public–50
v Purchase and distribution of crossbred heifers for under-resourced dairying beginners (2,000 every year).
4,400 4,400 4,400 4,400 4,400 22,000 Public–90 Private–10
vi Strengthen existing LMUs and establish 4 crossbred heifer multiplication farms
2,750 - 2,750 2,750 2,750 11,000 Public-private partnership 50/50
vii Sensitize farmers on the formation of breed societies
440 - - - - 440 Public–50 Private–50
Subtotal 10,542 6,252 18,902 9,002 7,902 52,602 Income

23
No. Investment intervention
Investment cost (TZS million) Budget source % 2017/18 2018/19 2019/20 2020/21 2021/22 Total
4 Extension mentioned in red meat improve-ment scenario
Strengthening extension services for dissemination of appropriate livestock technologies
- - - - - -
5 Research Research on breed
improvement, feeds and forage, animal health and value addition of livestock products and by-products
- 10,000 - 12,000 - 22,000 Public–100
Subtotal - - 22,000 - - 22,000 6 Marketing and
value addition
i Construction of 1 UHT in coastal and lake, and 1 milk powder processing plant in highlands zone
- 11,000 17,600 - - 28,600 Public-private partnership– 50/50
ii Formation and strengthening of dairy cooperative and primary societies in high potential areas (training, sensitization, equipping and facilities)
220 220 220 220 220 1,100 Public–50 Private–50
iii Establish 150 milk collection/chilling centres (cold chain)
1,980 1,980 1,980 1,980 1,980 9,900 Public–50 Private–50
iv Strengthen Dairy Board to regulate milk quality in highlands, lake and coastal zones in four milk sheds (office and laboratory)
550 - - - - 550 Public–100
v Strengthen the capacity of milk quality and safety
330 - - - - 330 Public–100

24
No. Investment intervention
Investment cost (TZS million) Budget source % 2017/18 2018/19 2019/20 2020/21 2021/22 Total
control laboratory at the Tanzania Veterinary Laboratory Agency (TVLA)
vi School-milk feeding programs to benefit 500,000 children
4,400 8,800 13,200 17,600 22,000 66,000 Public-private partnership50/50
Subtotal 7,480 22,000 33,000 19,800 24,200 106,480 Grand total
investment
26,998 47,888 59,998 49,998 40,198 225,082
Public 47 Private 53
Impacts foster Return on Investment (RoI) The herd level internal rate of return (IRR) for the 15-year investment in improved family dairy systems of small cattle herds in coastal and lake, and highlands zones is 13.7% and 23.1% with a net present value (NPV) of TZS 605,735 and TZS 8,514,420, respectively. The herd level IRR for 15-year investment in improved family dairy systems of medium cattle herds in coastal and lake, and highlands zones is 7.5% and 20.4% with NPV of 350,593 and 26,615,979 TZS, respectively. Milk production Due to the dairy and red meat improvement interventions in coastal and lake, and highlands zones, the production of milk in the zones is expected to increase from 751,923 and 214,885 thousand litres to 1,321,444 and 740,539 thousand litres over five years (2016-2020), respectively. An increase of 76% in coastal and lake zone and 115% in highlands zone (Table 8). GDP impacts Mainly due to dairy but also with a small contribution of red meat improvement intervention, the GDP contribution of milk for coastal and lake, and highlands zones is expected to increase from TZS 273,437 and TZS 149,567 in 2015/16 to TZS 449,468 and TZS 319,269 million in 2019/20, respectively. This will result in a 64% growth in contribution of milk to the national GDP from the coastal and lake zone and by 113% growth in the highlands zone.

25
Table 12: Change in GDP Contribution of Milk in Coastal and Lake and Highlands Zones GDP contribution of milk (million TZS)
% change
Livestock production zone
Base year (2016/17) 2017/18 2018/19 2019/20 2020/21 2021/22
Coastal and lake 273,437 302,053 333,664 368,584 407,157 449,768 64 Highlands
149,567 174,061 202,565 235,737 274,342 319,269 113 Source: LSIPT Livestock Sector Analysis (2017), MLF
Additional increase in income from dairy investments
• Dairy improvement interventions in the coastal and lake, and highlands zones will result in a 5-22% increase in income per animal when ‘without’ and ‘with additional investments’ scenarios are compared (Table 12).
Table 13: Change in Income per Animal due to Dairy Improvement Interventions in Improved Family Dairy
Production zone/system Herd size
Income per animal (without additional investment)
Income per animal (with additional investment)
% change
coastal and lake zone
Small herd 85,021 89,397 5 Medium herd 79,121 83,865 6
Highlands zone
Small herd 114,646 132,463 16 Medium herd 93,684 114,122 22
Source: LSIPT Livestock Sector Analysis (2017), MLF
Table 14: Activities time line and sequencing: Gantt chart No Activities Investment activities timing
2017/18 2018/19 2019/20 2020/21 2021/22 Jul– Dec
Jan-June
Jul– Dec
Jan– June
Jul– Dec
Jan– June
Jul– Dec
Jan– June
Jul– Dec
Jan– June
1. Encourage establishment of new commercial dairy farms
2. Encourage establishment of new commercial dairy feed processing plants
3. Strengthen existing feed and seed quality control laboratories (equipment and capacity building)
4. Strengthen existing national and establish a new semen production

26
No Activities Investment activities timing 2017/18 2018/19 2019/20 2020/21 2021/22 Jul– Dec
Jan-June
Jul– Dec
Jan– June
Jul– Dec
Jan– June
Jul– Dec
Jan– June
Jul– Dec
Jan– June
centre.
5. Acquire 2 new liquid nitrogen plants
6. Training and capacity building of 6,650 artificial insemination technicians
7. Establishment of bull centres
8. Purchase and distribution of crossbred heifers for under resources dairying beginners (2,000 every year)
9. Establish crossbred heifers’ multiplication farms
10. Sensitize farmers on formation of breed societies.
11. Construction and rehabilitation of dip tanks
12. Support the vaccination campaign of contagious bovine pleuropneumonia, foot-and-mouth disease, Rift Valley fever, peste des petits ruminants, contagious caprine pleuropneumonia, and brucellosis and improve the capacity of veterinary centres, diagnostic laboratories for surveillance and diagnosis
13. Strengthening the capacity of existing livestock training institutes
14. Establish and/or strengthen ward livestock resource centres and provide extension officers with the necessary equipment (toolkit)

27
No Activities Investment activities timing 2017/18 2018/19 2019/20 2020/21 2021/22 Jul– Dec
Jan-June
Jul– Dec
Jan– June
Jul– Dec
Jan– June
Jul– Dec
Jan– June
Jul– Dec
Jan– June
15. Training to livestock keepers and improved family dairy farmers on better husbandry, breed improvement and feeding practices
16. Research on breed improvement, feeds and forage, animal health and value addition of livestock products and by-products.
17. Encourage construction of UHT and milk powder processing plants
18. Formation and strengthening of dairy cooperative (training, sensitization, equipping and facilities)
19. Establish milk collection/ chilling centres (cold chain)
20. Strengthen Dairy Board to regulate milk quality in highlands, lake and coastal areas in four milk sheds (office and laboratory)
21. Strengthen the capacity of milk quality and safety control laboratory (TVLA)
22. Implement school milk feeding programs to benefit 1,500,000 children
Complementary intervention and success requirements
The following are crucial aspects of the dairy improvement interventions and success requirements:
(i) Plan and carry out extensive crossbreeding/breeding schemes in selected areas using artificial insemination, artificial insemination with hormone synchronizing and/or bull of dairy cattle breeds, multiple ovulation and embryo transfer;

28
(ii) Improve the efficiency of existing artificial insemination, artificial insemination with hormone synchronizing and/ or bull crossbreeding/breeding, multiple ovulation and embryo transfer services;
(iii) Reduce cumbersome procedures to ease land availability for local and foreign investors in feed and dairy production and processing;
(iv) Encourage establishment of heifers’ multiplication centres; (v) Provide continuous training and refresher courses to artificial insemination
technicians; (vi) Strengthen the extension service and training to dairy cattle owners in dairy cattle
husbandry and milk and milk products handling; (vii) Improve the animal health service; (viii) Enforce forages, concentrate feeds and forage seed quality standards and create
conducive environment for production and marketing of feeds and feed seeds; and (ix) Enforce milk quality standards and support establishment/functioning of milk
processing plants. Commercial specialized dairy production
Key challenges and strategies in commercial specialized dairy production Many of the challenges and strategies listed in the improved family dairy section are also pertinent for commercial specialized dairy production. Thus, only specific challenges and strategies which are important to commercial specialized dairy are listed here. Table 15: Key Strategies and Challenges in Commercial Dairy Production Key challenges Strategies to address challenges 1. Feed availability and quality • Cumbersome procedures of
owning land for commercial forage production
• Underutilized public farms • Shortage of concentrate feed
and roughage (both in quality and quantity)
• Lack of effective feed quality control and standards enforcement mechanisms
• Making land available for commercial forage production by investors
• Employ PPP arrangement to increase public farms production efficiency
• Promoting and enforcing outsourcing contracts to produce forage for specialized dairy
• Enforcing feed quality standards, quality monitoring and control • Promoting the establishment of flour mills and oil processing
plants which will make more concentrate feed ingredients available i.e. wheat bran, wheat short and seed cakes
2. Marketing and processing • Lack of diversity of dairy
products and packaging that meets consumption needs of different consumers
• Shortage of dairy technologists
• Promoting investment in UHT milk, powdered milk production, and other value-added products like yogurt, ice cream and cheese, etc.
• Building the capacity of the dairy technology training institute(s)
3. Policy and investment support • Poor milk quality control and
enforcement mechanisms • Few commercial specialized
dairy farms and milk processing plants
• A need for milk-quality standards control and enforcement, as well as grading and pricing policies
• A need for an effective land acquisition policy for dairy investments (preferential treatment for accessing land for specialized dairy production, milk processing and feed production).
• A need for incentives for investors to establish dairy processing plants and specialized dairy farms

29
Interventions to achieve targets The major interventions proposed to improve the commercial specialized dairy are feed improvement (production, marketing and processing of feed), increasing the number of crossbred dairy cattle and commercial specialized dairy farms, encouraging private artificial insemination and health service providers and improving marketing of milk and milk products. Main activities Feed improvement interventions • Make land accessible for forage production for the commercial specialized dairy farms
and forage producers. • Strengthen the existing forage/forage seed/ quality control laboratories.
Increasing the number of commercial specialized dairy farms • Provide incentives to investors and ease the bureaucracy in establishing commercial
specialized dairy farms. • The number of crossbreed dairy cattle and commercial specialized dairy farms in
commercial specialized dairy subsystem is expected to increase by 120-163% and 164%, respectively.
• The number of commercial specialized dairy farms is targeted to increase from 159,000 to 420,000 in small and from 204–400 farms in medium commercial specialized dairy subsystems (Table 16).
• The number of crossbred dairy cattle will increase from 159,000 in 2015/56 to 420,000 in 2020/21 in small commercial specialized dairy farms and from 250,800 in 2015/16 to 660,000 in 2020/21 in the medium ones.
Table 16: Changes in number of Crossbreds and Dairy Farms in Commercial Specialized Dairy Subsystem
Livestock production subsystem
Items
Number of farms and crossbreed cattle in commercial specialized dairy
% change
Base year (2016/17) 2017/18 2018/19 2019/20 2020/21
2021/22
Small commercial specialized dairy
Herd size 5 5 5 5 5 5 0 No of farms 31,800 37,236 43,601 51,054 59,781 70,000 120
Number of crossbreeds
159,000 193,093 23,4497 284,779 345,843 420,000 164
Medium commercial specialized dairy
Herd size 450 477 505 535 566 600 33 No of farms
204 233 267 306 350 400 96
Number of crossbreeds
91,800 111,254 134,831 163,404 198,033 240,000 161
Total crossbreds in commercial specialized dairy
250,800 304,348 369,330 448,185 543877 660,000 163

30
Animal health interventions
• Improve availability of drugs, vaccines and medical equipment and support to enhance the effectiveness of private health service providers.
• Improve the availability of vaccines for Foot and Mouth Disease, Rift Valley Fever, Contagious Bovine Pleuropneumonia, East Coastal Fever and Brucellosis.
Genetic improvement interventions • Encourage private artificial insemination service providers
Improving marketing and processing of milk and milk products
• Interventions proposed to improve marketing and processing of milk and milk products in improved family dairy subsystems equally work for commercial specialized dairy subsystems.
Assumptions and targets
• Commercial specialized dairy farmers adopting the cow dairy improvement interventions will increase their cost of acquiring quality feed and veterinary services.
• The per cent of feed purchased will increase from 10% to 17% and 20% in small and medium commercial specialized dairy subsystems
• The veterinary cost will increase from TZS 15,000–20,000 per year/cow
Cattle receiving the cow dairy improvement interventions are expected to show the following productivity improvements:
• An increase in parturition rate from 0.70–0.75 in small and up to 0.80 in medium commercial specialized dairy subsystem.
• A decline in mortality rate of juveniles from 10–6% in both small and medium commercial specialized dairy.
• A daily milk production increase from 8–10 litres in small and 9–12 litres in medium commercial specialized dairy.
At the national level, the dairy improvement intervention is expected to result in an increase in the number of crossbred dairy cattle and milk production in the commercial specialized dairy subsystem.
• The number of crossbreed dairy cattle will increase from 250,800 to 660,000, a 163% increase in 5 years (Table 14).
• Milk production in the subsystem will increase from 214,885 thousand litres in 2016/17 to 709,011 thousand litres in 2021/22 (Table 3).
• The average annualized milk production of a cow in the commercial specialized dairy subsystem is targeted to increase from the current 1,757 litres to 2,207 litres in 2021/22 (Table 4).
Investments The investment listed for improved family dairy subsystem, above, equally work for the commercial specialized dairy subsystem and the investment will be shared among both subsystems.

31
Impacts Return on investment The herd level IRR for 15-year investment in commercial specialized dairy of small and medium cattle herd sizes appears to be very high with net present value (NPV) of TZS 7.4 million and TZS 1,384 million, respectively.
Milk production Due to the dairy improvement interventions in the commercial specialized dairy, the production of milk in the subsystem is expected to increase from 214,885 thousand litres to 709,011 thousand litres over five years (2016-2020), an increase of 230% (Table 3).
GDP impacts Dairy improvement interventions in the commercial specialized dairy will increase milk’s contribution to GDP from commercial specialized dairy subsystem from the current TZS 76,678 million to TZS 276,130 million, a 247% increase in five years (Table 17).
Table 17: GDP Contribution of Cow Milk Production in the Commercial Specialized Dairy Subsystem
Livestock production
Contribution of cow milk (TZS millions) % change
Base year (2016/17) 2017/18 2018/19 2019/20 2020/21 2021/22
Commercial specialized dairy subsystem
79,678 102,163 130,993 167,959 215,357 276,130 247
Source: LSIPT Livestock Sector Analysis (2017), MLF
Additional increase in income from dairy investments Dairy improvement interventions in commercial specialized dairy system resulted in 30-31% increase in income per animal when ‘without’ and ‘with additional investments’ scenarios are compared (Table 18). Table 18: Change in Income per Animal Due to Dairy Improvement Interventions in Commercial Specialized Dairy
Production zone/system Herd size
Income per animal (without additional investment)
Income per animal (with additional investment)
% change
Commercial specialized dairy
Small herd 311,068 408,949 31 Medium herd 643,394 834,544 30
Source: LSIPT Livestock Sector Analysis (2017), MLF

32
Activities time line and sequencing: Gantt chart The Gantt chart presented in the improved family dairy improvement section, above, works equally well for both commercial specialized dairy and improved family dairy subsystems. Complementary intervention and success requirements The following are crucial aspects of the dairy improvement interventions and success requirements for the commercial specialized dairy subsystem.
(i) Provide incentives to investors and ease the bureaucracy in establishing commercial specialized dairy farms;
(ii) Make land accessible for forage production for commercial specialized dairy farms and forage producers;
(iii) Encourage establishment of heifer multiplication centers and use PPP arrangement in public underutilized farms to increase production efficiency;
(iv) Enforce milk quality standards and support the establishment and functioning of milk processing plants;
(v) Enforce forages, concentrate feed and forage seed quality standards and create conducive environment for production and marketing of feeds and feed seeds; and
(vi) Improve availability of drugs, vaccines and medical equipment and support to enhance the role of private health and artificial insemination service providers.
Dairy production and consumption balance The projected quantities of cow milk consumption and production ‘with additional investment’ and ‘without investment’ over the five-year LMP period are shown in Figure 5. Without investment, it is projected the production gap will start developing toward the end of the plan period and investment is, therefore, required to avoid production gaps during and beyond the LMP period. Figure 5: Projected cow milk consumption and production with and without investment, 2017-2022 (in thousand tonnes)
Production with additional investment
Production without investment
Consumption
1,500
2,000
2,500
3,000
3,500
4,000
2017 2018 2019 2020 2021 2022

33
Conclusions The interventions proposed to improve cattle milk production and productivity will transform traditional farms engaged in family dairy into improved and more market-oriented family dairy systems by:
• raising and realizing the genetic potential of local breeds for significantly higher milk production through crossbreeding with exotic dairy breeds using artificial insemination with or without hormone synchronization and bull semen, multiple ovulation and embryo transfer combined with better feed and health services.
Milk production and productivity of the commercial dairy system will also increase significantly by:
• bringing more crossbred cattle into the commercial cattle dairy system, and • increasing the availability of forage feeds by improving forage feed production and
marketing.
Local cattle, or the vast majority of individual animals, also offer a huge potential for bridging the gap between the national milk consumption and production. The interventions–mainly targeted at improving animal reproductive and weight gain performance–also affect milk production and productivity significantly in all typology zones. These interventions will be achieved by:
• Improving the natural grazing (pasture and range) land, coupled with health interventions to reduce mortality.
These combined interventions will result in:
• 77% increase in national cattle milk production from 2,087 million litres in 2017 to 3,687 million litres in 2022 (over the five-year development plan period). The production of a surplus of 1,002 million litres of cow milk over projected domestic consumption requirements by year 2022.
This surplus could substitute for imported milk products and be used domestically for new or additional industrial purposes or exported as milk powder or UHT (Figure 5) to raise foreign exchange earnings. In addition to the above activities, the critical conditions, which need emphasis for success of the plan, are:
• Encouraging the private sector to invest in milk processing plants and dairy farms. • Ensuring availability of more and better feed seed, forage production and marketing.
and health services in all areas, whether breed improvement is implemented or not. • Ensuring more effective extension services to support production, processing and
marketing of quality milk.

34
RED MEAT SYSTEMS ROADMAP 2017/2018-2021/2022

35
Tanzania produces about 493,000 metric tonnes of red meat (by year 2016/2017) whereby 83% is beef and the remainder comes from sheep and goats. Most of this produce (97%) comes from pastoral and agro-pastoral communities. The red meat produced is predominately for domestic consumption, with little exports. The country still has not been able to meet its domestic demand for red meat, and meeting this demand, as well as exploiting the exports potential for red meat, is possible only if the limitations of unavailable resources, such as animal feeds, are overcome.
Vision The projected year 2021 domestic demand gap for red meat arising due to rapidly growing population, increasing urbanization, and rising incomes is reduced; and live animal and meat exports are increased to generate foreign exchange earnings.
Overall target To reach production of 742,000 tonnes of red meat by year 2021, through improvement of grazing land resources, animal health, and genetics; and use of appropriate feeding technology. By 2021, a total of 2 million heads of animals passing through the ranch, feedlot and non-traditional (culled dairy cattle) operations is achieved; and the contribution of the traditional sector to the overall red meat produced is reduced from the current level of 97% to 10%. Improved traditional red meat production
Targets Interventions aimed at increasing traditional red meat output are expected to bring the following changes:
• An increase in the area of the grazing/pasture from 10–13%. • Promoting allocation and establishment of pasture/fodder production areas from
almost 0%, at present, to 5%. • Increasing the parturition rate from 4–5%. • Reducing mortality rate to 25–50% for all age and sex categories. • An increase in dressing percentage by 2%. • An increase in live weight by 10% for all age and sex categories. • Off-take rate increases from 10–16% for small-scale farms; 10–14% for medium-
scale farms; and from 18–26% in ranches. • Increasing the herd size of ranches by a range of 10–37% through purchasing of
additional heifers in the first three to four years; and maintain constant herd size, once the carrying capacity is achieved.
• The number of ranches increased by 18%. • The number of cattle in a fattening cycle, in feedlots, increased by 33%. • The number of fattening cycles per year, in a feedlot, increased by 17%. • To increase the number of feedlot units by over 100%.

36
Table 19: Annual increase in number of cattle Production zone 2016/17 2017/18 2018/19 2019/20 2020/21 2021/22 %
change Traditional cattle system Central 13,102,022 14,098,320 14,632,283 15,186,470 15,761,646 16,358,606 20 Coastal and lake
11,560,207
12,301,694 12,626,411 12,959,700 13,301,786 3,652,901 14
Highlands 3,773,606 4,095,903 4,288,036 4,489,182 4,699,763 4,920,222 26 Total
28,435,835 30,495,917 31,546,730 32,635,351 33,763,194 34,931,72
9 18
Ranching system Central 12,330 12,988 13,682 14,413 15,182 15,993 30 Coastal and lake 19,297 19,525 19,755 19,988 20,224 20,463 6 Highlands 41,400 46,037 51,193 56,927 63,303 70,393 70 Total 73,027 78,550 84,630 91,328 98,709 106,848 46
Cattle2 in feedlot Feedlot 78,111 115,878 171,905 255,020 378,323 561,242 619 Dairy subsector 260,293 315,888 383,356 465,235 564,601 685,191 163 Total 338,404 431,765 555,261 720,255 942,924 1,246,432 268
Source: LSIPT Livestock Sector Analysis (2017), MLF
• The total number of cattle in the three production zones shows an 18% increase (29
–34 million by 2021/22). • The total number of cattle in the ranching system shows a growth of 46% (from
73,000 heads in 2016/17 to 106,000 in 2021/22). • The number of cattle (local cattle and those culled cattle from dairy operations)
reaching the feedlots show a 268% increase (from 338,404 heads to 1.2 million heads by 2021).
2 The number includes culled cattle from the dairy subsector that are sent for fattening at feedlots
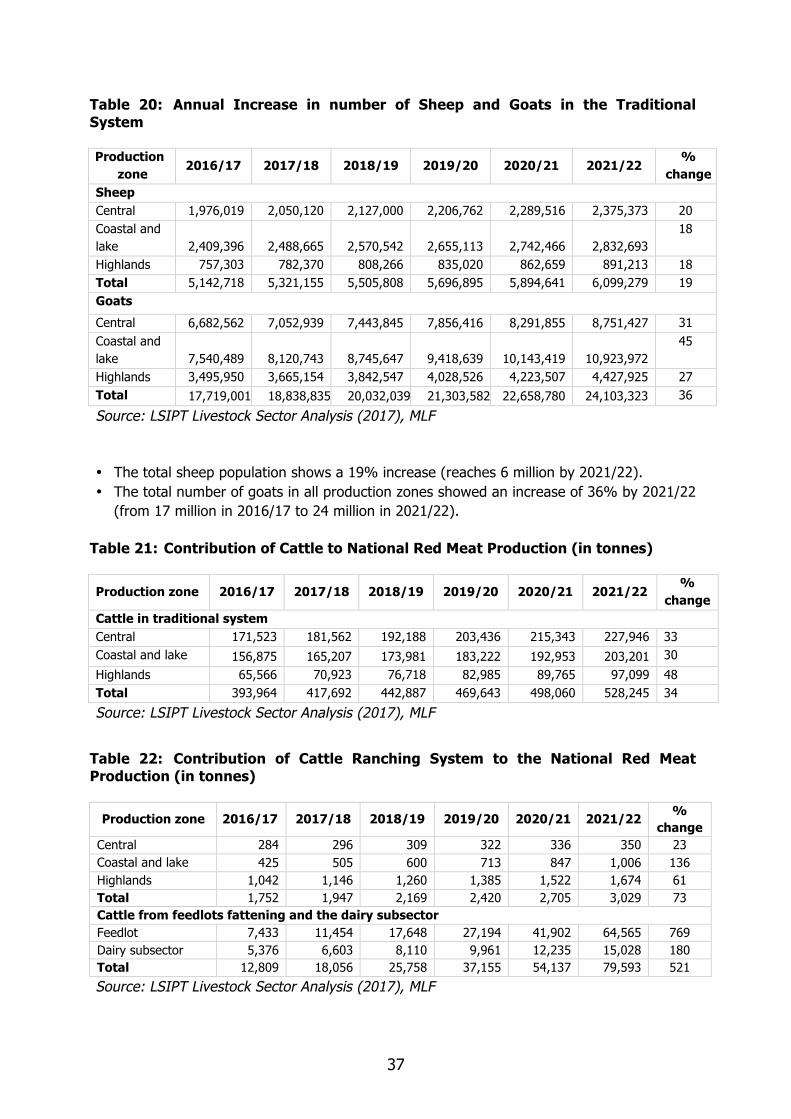
37
Table 20: Annual Increase in number of Sheep and Goats in the Traditional System Production zone 2016/17 2017/18 2018/19 2019/20 2020/21 2021/22 %
change Sheep Central 1,976,019 2,050,120 2,127,000 2,206,762 2,289,516 2,375,373 20 Coastal and lake 2,409,396 2,488,665 2,570,542 2,655,113 2,742,466 2,832,693
18
Highlands 757,303 782,370 808,266 835,020 862,659 891,213 18 Total 5,142,718 5,321,155 5,505,808 5,696,895 5,894,641 6,099,279 19 Goats Central 6,682,562 7,052,939 7,443,845 7,856,416 8,291,855 8,751,427 31 Coastal and lake 7,540,489 8,120,743 8,745,647 9,418,639 10,143,419 10,923,972
45
Highlands 3,495,950 3,665,154 3,842,547 4,028,526 4,223,507 4,427,925 27 Total 17,719,001 18,838,835 20,032,039 21,303,582 22,658,780 24,103,323 36
Source: LSIPT Livestock Sector Analysis (2017), MLF
• The total sheep population shows a 19% increase (reaches 6 million by 2021/22). • The total number of goats in all production zones showed an increase of 36% by 2021/22
(from 17 million in 2016/17 to 24 million in 2021/22).
Table 21: Contribution of Cattle to National Red Meat Production (in tonnes)
Production zone 2016/17 2017/18 2018/19 2019/20 2020/21 2021/22 % change
Cattle in traditional system Central 171,523 181,562 192,188 203,436 215,343 227,946 33 Coastal and lake 156,875 165,207 173,981 183,222 192,953 203,201 30
Highlands 65,566 70,923 76,718 82,985 89,765 97,099 48 Total 393,964 417,692 442,887 469,643 498,060 528,245 34
Source: LSIPT Livestock Sector Analysis (2017), MLF
Table 22: Contribution of Cattle Ranching System to the National Red Meat Production (in tonnes)
Production zone 2016/17 2017/18 2018/19 2019/20 2020/21 2021/22 % change
Central 284 296 309 322 336 350 23 Coastal and lake 425 505 600 713 847 1,006 136 Highlands 1,042 1,146 1,260 1,385 1,522 1,674 61 Total 1,752 1,947 2,169 2,420 2,705 3,029 73 Cattle from feedlots fattening and the dairy subsector Feedlot 7,433 11,454 17,648 27,194 41,902 64,565 769 Dairy subsector 5,376 6,603 8,110 9,961 12,235 15,028 180 Total 12,809 18,056 25,758 37,155 54,137 79,593 521
Source: LSIPT Livestock Sector Analysis (2017), MLF

38
• The potential contribution of cattle to red meat overall production zones grows from 393,964 tonnes in 2016/17 to 528,245 tonnes by 2021/22 (a 34% increase).
• The contribution of cattle ranching system to red meat production grows from 1,752 tonnes in 2016/17 to 3,029 tonnes by 2021/22 (a 73% increase). The contribution of feedlot and dairy subsector system to the national red meat production grows from 12,809 tonnes in 2016/17 to 79,593 tonnes by 2021/22 (a 521% increase).
Table 23: Percent Contribution of Cattle to National Red Meat by Production System Production system 2016/17 2017/18 2018/19 2019/20 2020/21 2021/22 %
change Cattle Traditional 97.05% 96.23% 95.12% 93.61% 91.58% 88.87% -8.43 Ranches 0.35% 0.37% 0.38% 0.39% 0.40% 0.41% 15.02 Feedlots 1.51% 2.16% 3.09% 4.39% 6.20% 8.70% 477.73 Culled commercial dairy cattle
1.09% 1.24% 1.42% 1.61% 1.81% 2.02% 85.94
Total 100 % 100% 100% 100% 100% 100%
Source: LSIPT Livestock Sector Analysis (2017), MLF
Table 24: Contribution of Sheep Meat to National Red Meat Production (in tonnes)
Meat production 2016/17 2017/18 2018/19 2019/20 2020/21 2021/22 %
change Sheep Central 6,242 6,738 7,273 7,850 8,473 9,146 47 Coastal and lake 11,059 11,670 12,314 12,993 13,710 14,467
31
Highlands 3,149 3,361 3,587 3,829 4,087 4,362 39 Total 20,450 21,768 23,174 24,672 26,270 27,975 37
Source: LSIPT Livestock Sector Analysis (2017), MLF
• The amount of sheep meat produced grows from 20,450 tonnes in 2016/17 to 27,975 tonnes by 2021/22 (a 37% increase).
• The amount of goat meat produced grows from 64,894 tonnes in 2016/17 to 103,681 tonnes by 2021/22 (a 60% increase).

39
Table 25: Contribution of Goat Meat to National Red Meat Production (in tonnes) Production system
2016/17 2017/18 2018/19 2019/20 2020/21 2021/22 % change
Central 25,096 27,246 29,579 32,113 34,863 37,849 51 Coastal and lake 26,373 29,516 33,033 36,970 41,375 46,305
76
Highlands 13,424 14,469 15,595 16,809 18,117 19,527 45 Total 64,894 71,231 78,208 85,891 94,355 103,681 60
Source: LSIPT Livestock Sector Analysis (2017), MLF
Challenges and strategies
Table 26: Key Challenges and Strategies in Enhancing Red Meat Production in Tanzania
Challenges Strategies Feed • Lack of sufficient grazing areas to meet
the feed needs of the animals • Underperformed/idle public ranches,
farms and other livestock infrastructure • Poor-quality grazing land resources • Inadequate knowledge on the use of crop
residues and by-products • Limited availability of concentrates and
feed supplements, when needed.
• Rehabilitation of rangeland/grazing land • Acquiring substantial additional area for grazing
land and for pasture/fodder production • Sublease underperformed/idle public ranches,
farms and other livestock infrastructure to private sector or employ PPP arrangement
• Training and capacity building and skill development to increase the use of crop residues and by-products
• Increased and better use of agro-industrial by-products from the processing of cereal/grains/oil seeds/sugarcane as concentrates for animal feeding.
• Promote appropriate storage and marketing of concentrates and feed supplements
Genetics
• Low genetic improvement extension coverage
• Poor animal data recording system
• Selection within the local breeds • Establishing community-based breeding
programs, which include developing an animal recording scheme
• Promoting animal identification and traceability scheme.
Animal health • Poor animal health extension services • Inefficient animal health services • Inadequate supplies and qualities of
vaccines and drugs • Poor control of drugs and supplies
• strengthening animal health regulatory capacity under the coordination of the livestock ministry
Marketing and processing • Poor market infrastructure • Strategic capacity building spearheaded by the

40
Challenges Strategies • Poor technical knowledge of value chain
actors, especially processors and technicians
• Inadequate market information • Poor linkages between producers,
processors and export abattoirs.
second phase of the agricultural sector development program (ASDPII)
• Building additional infrastructure.
Policy ! Absence of a breeding policy ! Loss of land to alternative investments
outside livestock ! A lack of protective trade policies
! Developing clearly defined guidelines on land use and access rights
! Implementing appropriate land policies. ! Gazetting grazing land
Interventions to achieve targets3 Most of interventions for red meat production are expected to be done in the central, and coastal and lake production zones. The interventions in these zones do not involve artificial insemination and genetic progress through improved selection of indigenous breeds is anticipated to be slow.
The main proposed technological interventions in the central zone are:
(i) Feed improvement through better range management, oversowing with grass and
legumes, and the control of invasive species. The intervention to improve rangeland productivity includes water development and rangeland improvement by shrub clearing, and the application of thinning technique where major shrub encroachment takes place.
(ii) Introduction of Public Private Partnership and sub lease arrangement to increase production efficiency especially to idle or underperformed public ranches, farms and other livestock infrastructure.
(iii) Reduction in young and adult stock mortality: The relevant health interventions include improving access to quality of veterinary services through rationalized use of public/private veterinary services; parasite control and treatment and vaccinations.
(iv) Breed improvement through better selection and management of male breeding animals.
(v) Introduction of a herd/flock recording scheme for breed improvement.
However, other interventions will target the research, extension, market and value additions for the red meat products. In the highlands zone, the following interventions will be carried out:
(i) Breed improvement, involving artificial insemination with semen of exotic breed primarily for dairy development. However, the culled dairy cattle will be channelled to beef production.
3 The detailed red meat interventions for all production are presented in the LSA report.

41
(ii) Breed management and improvement through the implementation of a herd/flock recording scheme.
(iii) Training/extension to improve the capacity of farmers to select and manage male breeding animals.
(iv) The reduction of young and adult stock mortality with vaccines and anti-parasites. (v) The introduction of integrated fodder crops with food crops. (vi) The timely harvesting of grass, and storage and conservation of hay from communal
grazing lands. (vii) Increased efficiency of crop residue use (proper storage, supplementation, treatment
including physical treatment-chopping, and urea). (viii) Over-sowing and rotational grazing. Investments
• The time span of the project is five years. • Total investment budget is estimated at TZS 342,240 million where by 56% of the
budget source is public. Private and public-private partnerships will provide 43% and 1% of the total budget, respectively (Table 27) to be spent over the five years.
• For all the scenarios, the annual discount rate assumed is 10%, which is the assumed current social opportunity cost of capital in Tanzania.
Table 27: Total Investment and Recurrent Costs Red Meat Production Investment category Responsible actor (TZS million) Total investment
cost (TZS million) Public Private Public-private partnerships
Animal feeding 57,607 21,625 79,231 Animal health 58,087 6,888 64,975 Animal breeding and genetics 12,230 109,574 121,804 Research 5,940 1,760 7,700 Extension services 9,900 1,100 11,000 Marketing and value addition 47,414 5,817 4,300 57,530 Total investment 191,177 146,763 4,300 342,240
Source: LSIPT Livestock Sector Analysis (2017), MLF
Thirty-six per cent (36%) of the investment budget will cater for animal breeding and genetics. However, 75% of this budget will be sourced from the private sector (Table 28). Most of the public fund (60%) will be used in animal feeding and health interventions. The public-private partnerships will only suffice some budget for marketing and value addition which generally has the big proportion of public funds.

42
Table 28: The Percent Contribution of Public, Private and Public-Private Partnerships Investments for Red Meat Production No. Key investment area Proportion by responsible actor Proportions by
key investment area
Public Private Public-private partnerships
1 Animal feeding 30% 15% 23% 2 Animal health 30% 5% 19% 3 Animal breeding and
genetics 6% 75% 36%
4 Research 3% 1% 2% 5 Extension services 5% 1% 3% 6 Marketing and value
addition 25% 4% 100% 17%
100% 100% 100% 100% Source: LSIPT Livestock Sector Analysis (2017), MLF
About 46% of the investment budget will be allocated to the central zone. The coastal and lake zone will use 42% of the t budget the remaining portion will be used in the highlands zone. Central zone
• The time span for the project is five years. • The investment cost is estimated at TZS 156 billion (see Table 29, 30 and 31) to be
spent over the five years span of the project, covering animal feeding, animal health, breeding, research, extension services, marketing and value addition.
• For all the scenarios, the annual discount rate assumed is 10%, which is the assumed current social opportunity cost of capital in Tanzania.
Table 29: Investment Cost in the Central Production Zone No. Key intervention for investment Cost (TZS million) Proportion 1 Animal feeding 35,974 23%
2 Animal health 29,718 19%
3 Animal breeding and genetics 54,743 35%
4 Research 3,128 2%
5 Extension services 4,692 3%
6 Marketing and value addition 26,590 17%
Total 156,409 100% Source: LSIPT Livestock Sector Analysis (2017), MLF
Coastal and lake zone Similar to the central zone, Table 30 shows the investment in coastal and lake zone with a total of over TZS 142 billion.

43
Table 30: Investment Cost in Coastal and Lake Production Zone No. Key intervention for investment Cost (TZS million) Proportion
1 Animal feeding 31,932 22% 2 Animal health 26,127 18% 3 Animal breeding and genetics 49,350 34% 4 Research 2,903 2% 5 Extension services 4,354 3% 6 Marketing and value addition 29,029 20%
Total 145,147 100% Source: LSIPT Livestock Sector Analysis (2017), MLF Highlands zone There is very minimal investment for red meat in the highlands production zone. Major intervention for the highlands is on dairy development, which indirectly benefits the red meat production. However, the investment on animal feed that focuses on rangelands development is included in the red meat intervention as shown in Table 31. Table 31: Investment Cost in the Highlands Production Zone No. Key intervention for investment Cost (TZS million) Proportion 1 Animal feeding 10,985 27%
2 Animal health 8,950 22%
3 Animal breeding and genetics 17,087 42%
4 Research 1,221 3%
5 Extension services 1,627 4%
6 Marketing and value addition 814 2% Total 40,683 100% Impacts Return on investment (ROI) The internal rate of return on investment in red meat is negative in the first five years, but positive or higher returns above the 10% discount are attainable within 15 years. Table 32: Returns on Investment (ROI) Production zone Central Highlands Coastal and lake Small-scale 16.9% 89.5% -26.6% Medium-scale -6.8% 540.8% -31.1% Ranch - 102.5% 36.9% Source: LSIPT Livestock Sector Analysis (2017), MLF

44
Production impacts Table 33: Red meat production for baseline year (2016) and 2021 with intervention Products Total red meat in 2016/17
(tonnes) —baseline Total red meat in 2020/22 (tonnes) — with intervention
% change in production
Meat in central zone Cattle 171,807 228,296 33 Sheep 6,242 9,146 47 Goats 25,096 37,849 51 Total 203,145 275,291 36 Meat in coastal and lake zone Cattle 157,301 204,206 30 Sheep 11,059 14,467 31 Goats 26,373 46,305 76 Total 194,733 264,979 36 Meat in highlands zone Cattle 66,609 98,773 48 Sheep 3,149 4,362 39 Goats 13,424 19,527 45 Total 83,182 122,662 47 Grand total 481,061 662,931 38 Source: LSIPT Livestock Sector Analysis (2017), MLF
Table 34: Total red meat by species (cattle, sheep and goats) Products Total red meat in
2016(tonnes)—baseline
Total red meat in 2020 (tonnes)—with intervention
% change in production
Total red meat Cattle 395,716 531,275 34 Sheep 20,450 27,975 37 Goats 64,894 103,681 60 Total 481,061 662,931 38 Source: LSIPT Livestock Sector Analysis (2017), MLF
• The total red meat will grow from 481,061 tonnes in 2016/17 to 662,931 tonnes in 2020/21, showing an increase of 38%.

45
Livestock’s contribution to GDP Table 35: Livestock GDP contribution for baseline year (2016/17) and 2021/22 with red meat interventions
Products Total livestock GDP 2016/17—baseline (TZS million)
Total livestock GDP 2021/22 with intervention (TZS
million)
% change in national
livestock GDP contribution
Meat in central zone Cattle 600,130 779,505 30 Sheep 17,702 25,069 42 Goats 81,851 114,929 40 Meat in coastal and lake zone Cattle 558,562 624,701 12 Sheep 40,602 52,523 29 Goats 83,479 134,674 61 Meat in highlands zone Cattle 232,949 305,601 31 Sheep 12,183 15,463 27 Goats 59,473 79,025 33 Total 1,686,930 2,131,490 26 Source: LSIPT Livestock Sector Analysis (2017), MLF • The GDP contribution of red meat coming from the production zones shows an overall
increase of 26% comparing the base year with the 2021/22 projection. This amounts to TZS 1.6 trillion in 2016/17, and 2.1 trillion in 2021/22.
Table 36 Activity timeline and sequencing: Gantt chart No.
Activities 2016/17 2017/18 2018/19 2019/20 2020/2011
Jul–Dec
Jan–
June
Jul–Dec
Jan–June
Jul–Dec
Jan–June
Jul–Dec
Jan–June
Jul–Dec
Jan–June
1 Parasite control and treatment
2 Adult stock immunization
3 Young stock immunization
4 Animal disease surveillance
5 Strategic feed supplementation to the dams
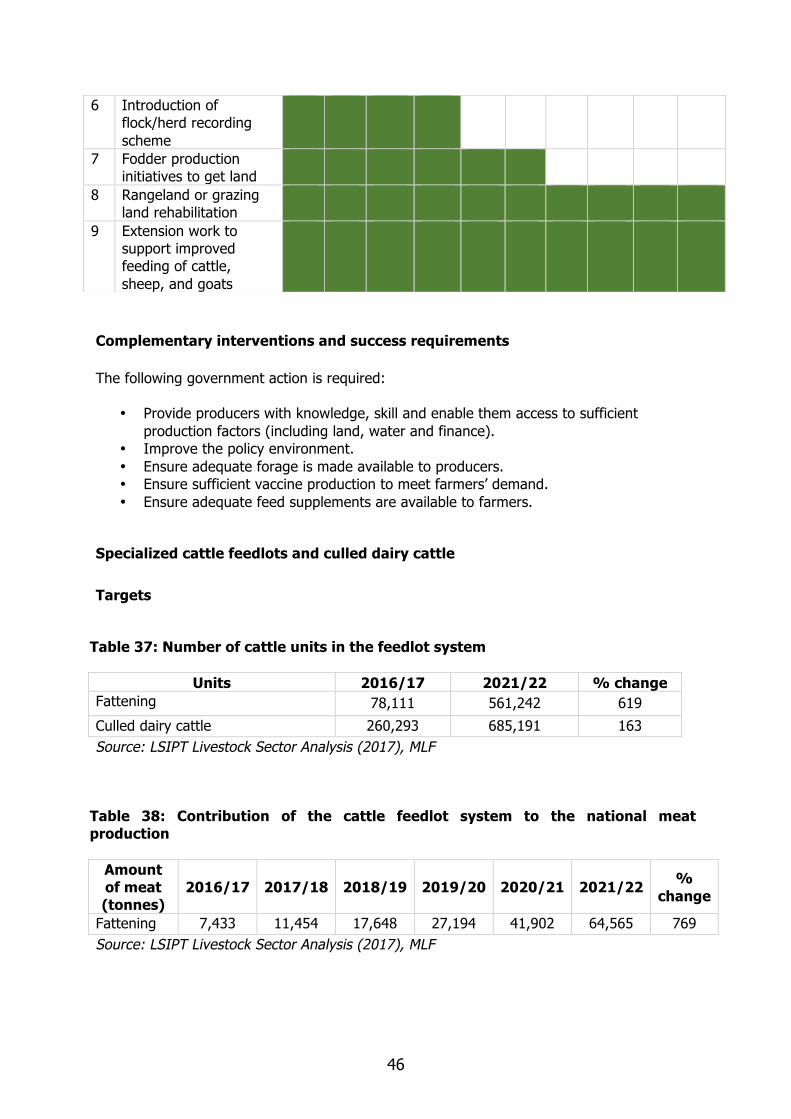
46
Complementary interventions and success requirements The following government action is required:
• Provide producers with knowledge, skill and enable them access to sufficient production factors (including land, water and finance).
• Improve the policy environment. • Ensure adequate forage is made available to producers. • Ensure sufficient vaccine production to meet farmers’ demand. • Ensure adequate feed supplements are available to farmers.
Specialized cattle feedlots and culled dairy cattle Targets
Table 37: Number of cattle units in the feedlot system
Units 2016/17 2021/22 % change Fattening 78,111 561,242 619
Culled dairy cattle 260,293 685,191 163 Source: LSIPT Livestock Sector Analysis (2017), MLF
Table 38: Contribution of the cattle feedlot system to the national meat production Amount of meat (tonnes)
2016/17 2017/18 2018/19 2019/20 2020/21 2021/22 % change
Fattening 7,433 11,454 17,648 27,194 41,902 64,565 769 Source: LSIPT Livestock Sector Analysis (2017), MLF
6 Introduction of flock/herd recording scheme
7 Fodder production initiatives to get land
8 Rangeland or grazing land rehabilitation
9 Extension work to support improved feeding of cattle, sheep, and goats
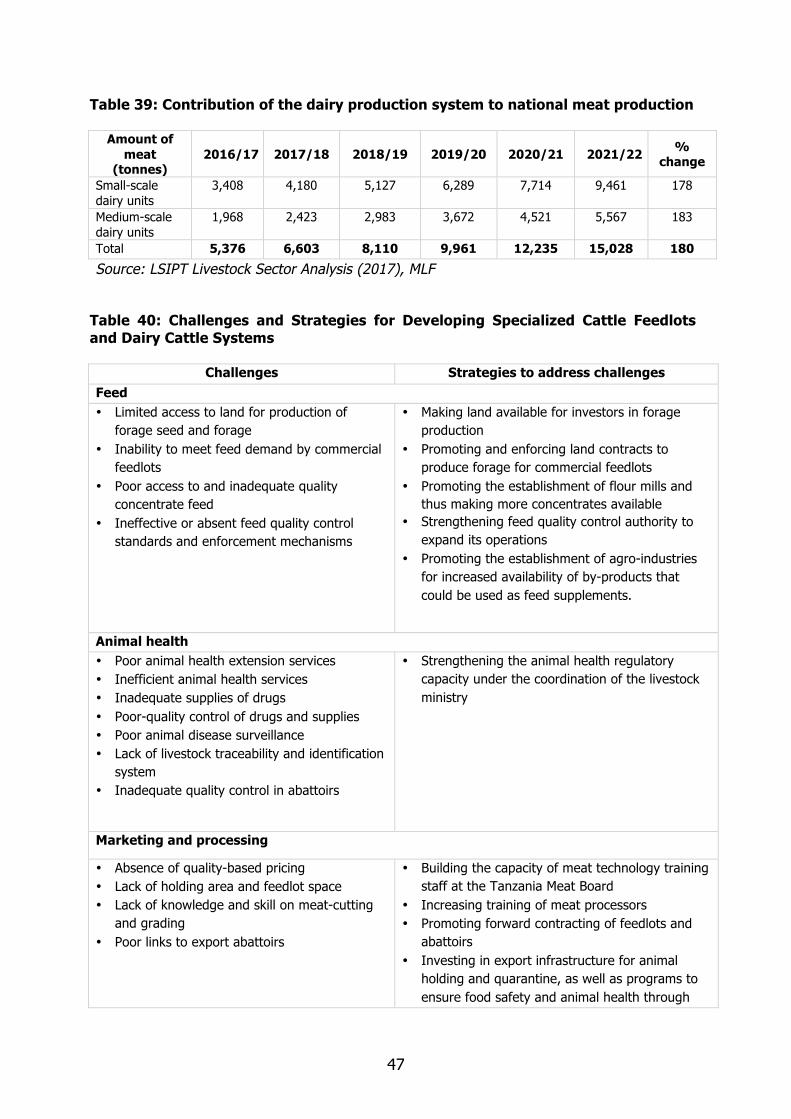
47
Table 39: Contribution of the dairy production system to national meat production Amount of meat (tonnes)
2016/17 2017/18 2018/19 2019/20 2020/21 2021/22 % change
Small-scale dairy units
3,408 4,180 5,127 6,289 7,714 9,461 178
Medium-scale dairy units
1,968 2,423 2,983 3,672 4,521 5,567 183
Total 5,376 6,603 8,110 9,961 12,235 15,028 180 Source: LSIPT Livestock Sector Analysis (2017), MLF
Table 40: Challenges and Strategies for Developing Specialized Cattle Feedlots and Dairy Cattle Systems
Challenges Strategies to address challenges Feed • Limited access to land for production of
forage seed and forage • Inability to meet feed demand by commercial
feedlots • Poor access to and inadequate quality
concentrate feed • Ineffective or absent feed quality control
standards and enforcement mechanisms
• Making land available for investors in forage production
• Promoting and enforcing land contracts to produce forage for commercial feedlots
• Promoting the establishment of flour mills and thus making more concentrates available
• Strengthening feed quality control authority to expand its operations
• Promoting the establishment of agro-industries for increased availability of by-products that could be used as feed supplements.
Animal health • Poor animal health extension services • Inefficient animal health services • Inadequate supplies of drugs • Poor-quality control of drugs and supplies • Poor animal disease surveillance • Lack of livestock traceability and identification
system • Inadequate quality control in abattoirs
• Strengthening the animal health regulatory capacity under the coordination of the livestock ministry
Marketing and processing
• Absence of quality-based pricing • Lack of holding area and feedlot space • Lack of knowledge and skill on meat-cutting
and grading • Poor links to export abattoirs
• Building the capacity of meat technology training staff at the Tanzania Meat Board
• Increasing training of meat processors • Promoting forward contracting of feedlots and
abattoirs • Investing in export infrastructure for animal
holding and quarantine, as well as programs to ensure food safety and animal health through

48
Challenges Strategies to address challenges disease surveillance, monitoring of abattoirs, and an animal identification and traceability system etc.
Policy • Inadequate meat quality standards and
enforcement of controls, grading, and pricing policies;
• Poor implementation of policy on breeding • A need to develop land policies, or strengthen
the existing ones that are related to feed production and land acquisition for feedlot investment
• Inadequate feed quality monitoring and control
• Need for further incentives to establish feedlots (including land access in appropriate locations conducive to feed production, linkages with export market, and infrastructure such as road access, power and water supply
• Inadequate policy incentives to promote domestic production of oil seed to increase availability of oil cakes and limit importation of cooking oil
• Introducing a trade policy to reduce the importation of cooking oil and grain flour
• Developing and implementing animal welfare policies
Interventions to achieve targets Increasing the number of cattle fattened The specialized production feedlot system will be improved through better feed and health services, increasing the number of cattle feedlot units, and the number of cattle being fattened. Producers (fatteners) will be given training on cattle fattening procedures, including cattle selection and feeding and on improving the efficiency of the beef value chain, which targets quality beef marketing. Table 41: Projected number of cattle fattened 2016 2021 % change Number of animals fattened/unit/year 90 112 24 Number of fattening units 2,367 5,000 53 Total cattle fattened 213,030 512,000 58
• Increasing the availability of feed ingredients required by cattle feedlot

49
Table 42: Estimated amount of additional concentrate feed needed for additional cattle going to beef feedlot by the year 2020 Number of animals Additional No. of
animals in year 2021 relative to 2016
Additional concentrate/year (thousand tonnes) 2016 2021
Fattening units 234,333 1,795,974 1,561,641
• The additional concentrate needed per animal will be 0.01 tonnes per year. Investments
Table 43: Investment in abattoir establishment
Type of processing
Cost per unit (TZS million)
Number of new abattoirs
Capacity per day
Investment cost/plant (TZS million)
Area/population covered
Big abattoir (with rendering system)
2,200 2 • 2,000 sheep and goats
• 200 cattle
4,400 Towns and cities with over 200,000 people
Modern abattoir (with all required facilities)
2,600 1 • 3,000 sheep and goats
• 700 cattle
2,600 Towns and cities with over 200,000 people
Impacts Return on investment The return on investment (ROI) under cattle feedlots is big and attractive. The benefit/cost ratio is 19%. Production impacts Table 44: Change in meat production from cattle feedlots (2016/17–2021/22) with interventions
Products (beef in tonnes)
Total production 2016/17 baseline
Total production 2021/22-with commercial feedlots
intervention % change in production
Cattle 7,433 64,565 769
Source: LSIPT Livestock Sector Analysis (2017), MLF
• Total red meat production increases by 769% in 2021/22, amounting to 7,433
tonnes (in the base year) and 64,565 tonnes (in 2021/22).

50
Table 45: Changes in livestock GDP with interventions in specialized cattle feedlots Product (meat)
Total livestock GDP 2016/17 (TZS million)–baseline
Total livestock GDP 2021/22 (TZS million)–with specialized feedlots interventions
% change in national livestock GDP
Cattle 3,535 48,394 1,269 Source: LSIPT Livestock Sector Analysis (2017), MLF
Table 46: Activity timeline and sequencing: Gantt chart No. Activities 2015/16 2016/17 2017/18 2018/19 2019/2020
Jul–Dec
Jan–June
Jul–Dec
Jan–June
Jul–Dec
Jan–June
Jul–Dec
Jan–June
Jul–Dec
Jan–June
1 Implementing the roadmap for the rationalization of public/private veterinary services
2 Parasite treatment 3 Adult stock
vaccinations
4 Disease surveillance 5 Establishing
quarantine facilities
6 Establishing identification and traceability tools
7 Quality control in abattoirs
8 Identifying potential locations for feedlot establishment
9 Creating new feedlots
10 Ensuring MLF support for establishment of feedlots in strategic locations
11 Establishing abattoirs Complementary interventions and success requirements • Industry strategy developed by the government in collaboration with the Tanzanian
industry association. • Access enabled to sufficient production factors (including land, water and finance). • Conducive policy and investment environment required to attract and facilitate private
sector investment in feedlots and abattoir operations. • Strategic use of the feed sources coming from new and existing sugar plantations and
other types of large-scale crop production investments in Tanzania.
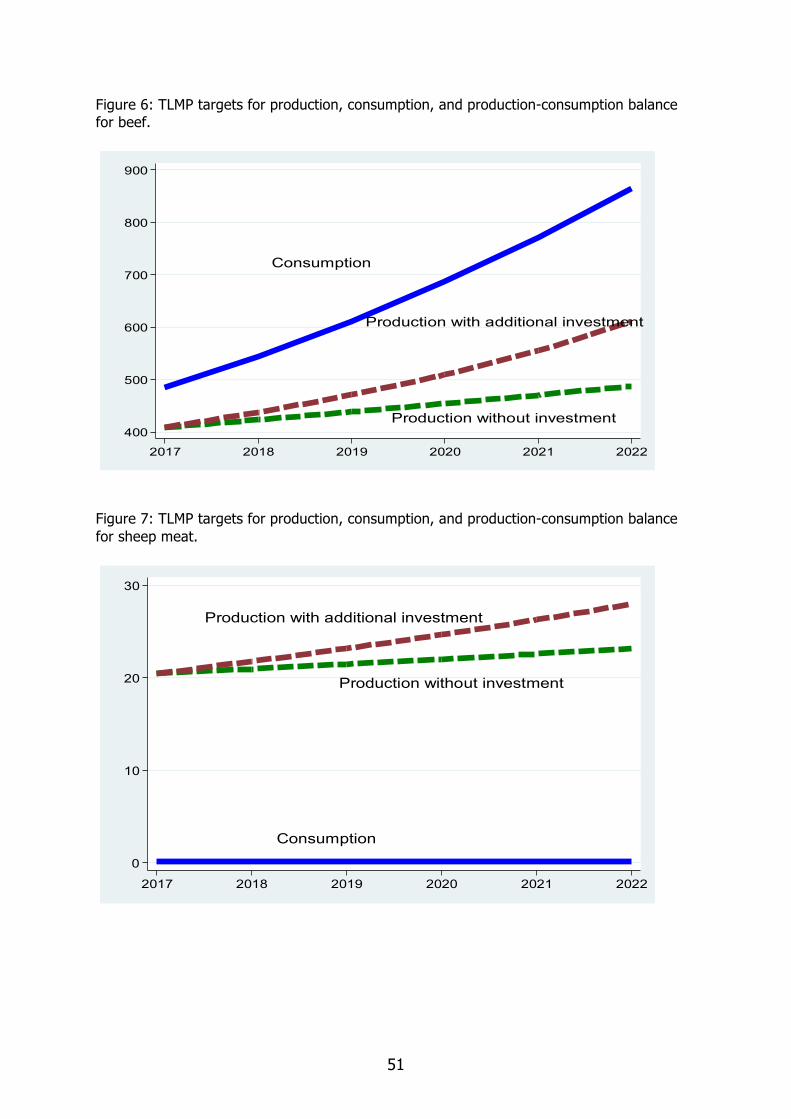
51
Figure 6: TLMP targets for production, consumption, and production-consumption balance for beef.
Consumption
Production with additional investment
Production without investment400
500
600
700
800
900
2017 2018 2019 2020 2021 2022
Figure 7: TLMP targets for production, consumption, and production-consumption balance for sheep meat.
Consumption
Production without investment
Production with additional investment
0
10
20
30
2017 2018 2019 2020 2021 2022

52
Figure 8: TLMP targets for production, consumption, and production-consumption balance for goat meat.
Consumption
Production with additional investment
Production without investment
60
70
80
90
100
110
2017 2018 2019 2020 2021 2022
Figure 9: TLMP targets for production, consumption, and production-consumption balance for red meat.
Consumption
Production with additional investment
Production without investment500
600
700
800
900
1000
2017 2018 2019 2020 2021 2022

53
Conclusions Given the indicated production increases, there is significant contribution by the traditional, ranches, and feedlot production systems towards improving food security, meeting the red meat consumption and nutrition, and contributing towards economic growth. However, this can only be realized if:
(i) The Government and private sector make investments in time and fund the activities adequately;
(ii) Meeting the livestock feed needs becomes a priority, and is followed by efforts towards increasing pasture and fodder production and increasing the availability of roughages such as crop residues and agro-industrial by-products. The bulk of additional concentrate feed needed, particularly in feedlots, is expected to come from investment by the private sector in agro-processing industries;
(iii) An industry strategy is put in place to enable access to sufficient production factors including land, water and finance;
(iv) The policy environment is improved to attract and enable sustainable growth of feedlots;
(v) Linkages are established for a viable stocker and feeder program where the improved young male stocks from the traditional sector are channeled to feedlot operations, thus reducing the grazing pressure on the grazing land in the traditional system; and
(vi) The establishment of new feedlot operations takes into account the spatial distribution of sugarcane factories, agro-industrial processing plants, and milling industries.
Production of red meat grows from 493,869 tonnes in 2016/17 to 742,524 tonnes in 2021/22, an increase of 50%. Consumption of red meat grows faster, from 508,094 tonnes of red meat in 2016/17 to 867,302 tonnes by 2021/22, an increase of 71% Even if all the above conditions are met, the red meat production and consumption balance for the period 2016/17–2021/22 remains at a deficit amounting to 124,778 tonnes by 2021/22.

54
CHICKEN DEVELOPMENT ROADMAP
2017/2018–2021/2022

55
Vision
By 2022, the chicken industry is to a large extent efficient and commercially run, both in commercial and household operations, using improved and highly productive breeds to ensure household food security and higher incomes, and significantly contributes to achieving national all-meat food security, and higher national income while being resilient to climate change and conserving the environment.
Overall target The overall target is to raise annual chicken meat production almost eightfold from about 60,800 to 465,600 tonnes and egg production from about 3.0 to 4.2 billion by year 2021/22 through improved traditional family chicken (ITFC), tropical improved chicken (TIC) and expanded specialized/commercial chicken (SCC) with layers and broilers subsystems. Improving traditional family chicken and promoting and expanding tropical improved chicken sub-systems.
Targets
Table 47: Number of hens and chicken meat and eggs production in improved traditional family chicken and tropical improved chicken subsystems (2016/17–2021/22) Chicken subsystem
Unit (tonnes)
2016/17 2017/18 2018/19 2019/20 2020/21 2021/22 % change
Improved traditional family chicken (ITFC)
In million In million In million In million In million In million
4.2 4.4 4.7 5.0 5.4 5.7 37
Traditional improved chicken (TIC)*
0.02 0.04 0.11 0.28 0.76 2.01 NA*
Total 4.22 4.44 4.81 5.28 6.16 7.71 NA* ITFC eggs 101.2 119.2 140.3 165.3 194.6 229.2 127 TIC eggs 0.79 2.2 6.1 16.8 46.5 129.1 NA* Total eggs 101.99 121.4 146.4 182.1 241.1 358.3 350 ITFC meat In thousand 31.8 34.5 37.5 40.8 44.3 48.2 52 TIC meat In thousand 0.01 0.03 0.1 0.2 0.6 1.7 NA* Total meat In thousand 31.81 34.5 37.6 41 44.9 49.9 57 Source: LSIPT livestock sector analysis (2017), MLF
(i) The number of hens in the ITFC grows from 4.2 million in the base year to 5.7 million in 2021/22, a 37% increase.
(ii) The number of chicken in the TIC grows from 0.02 million to 2.01 million. (iii) Chicken meat production from ITFC increases from 31.8 thousand tonnes in the year
2016/17 to 48.2 thousand tonnes in the year 2021/22, a 52% increase. (iv) Chicken meat production from the TIC increases from 0.01 thousand tonnes in the
year 2016/17 to 1.7 thousand tonnes.

56
(v) Total meat from the family system increases from 31.81 thousand tonnes to 49.9 thousand tonnes, a 57% increase.
(vi) Egg production from ITFC increases from 101.2 million in the year 2016/17 to 229.2 million in the year 2021/22, a 127% increase.
(vii) Egg production from TIC increases from 0.79 million in the year 2016/17 to 129.1 million in the year 2021/22.
(viii) Total egg production from the family system increases from 109.99 million in the year 2016/17 to 358.3 million in the year 2021/22, a 350% increase.
* Tropical improved chicken (TIC) is a newly introduced chicken system with a small number of birds in the base year hence comparing the near non-existent number of TICs in the base year with those in the fifth-year number does not make sense. Key assumptions for the family chicken system
(i) The average number of hens/flock in improved traditional family chicken grows from 2 to 4.
(ii) The average number of chicken/flock in tropical improved chicken remains 25. (iii) The number of eggs laid per hen/year increases from 50 to 90. (iv) The mortality in chicken before marketing will be reduced from 50–10% (v) The average live weight of chickens (growers) sold will increase from 1.1–1.4kg. (vi) The number of eggs and chicken consumed on-farm/year increases from 10–20, a
100% increase. (vii) The costs of veterinary drugs increase from TZS 50/chicken to TZS 100/chicken, a
100% increase.
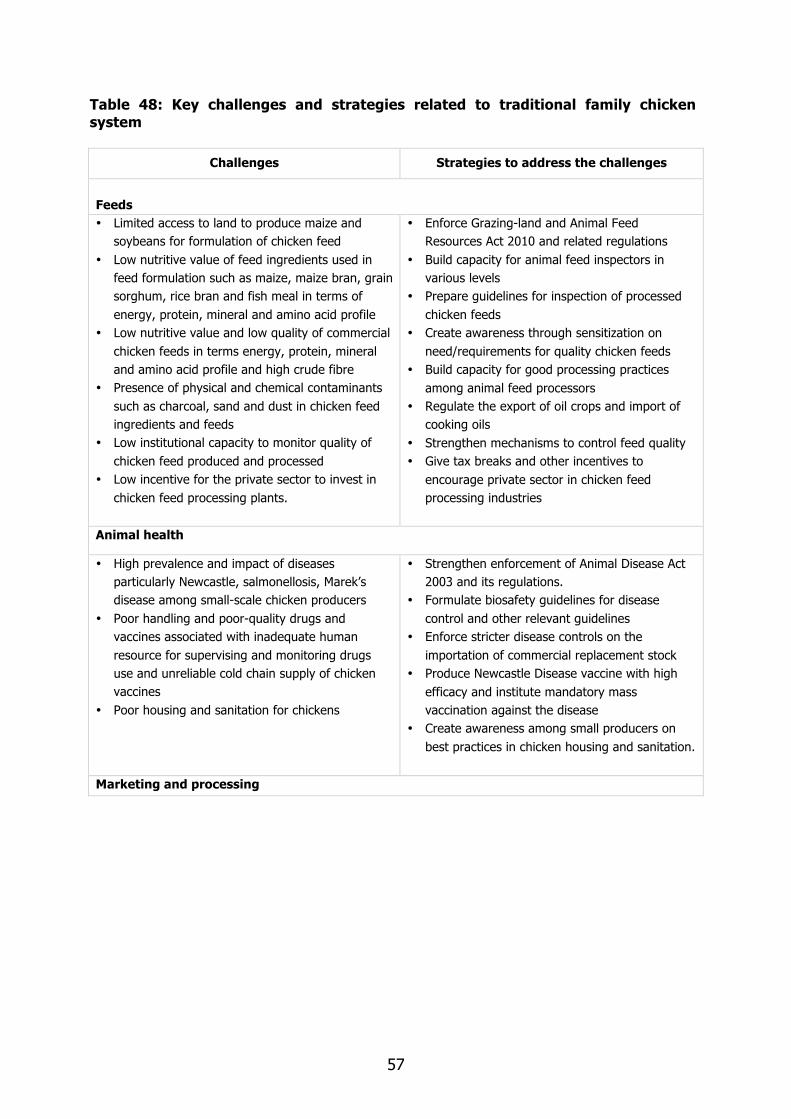
57
Table 48: Key challenges and strategies related to traditional family chicken system
Challenges Strategies to address the challenges
Feeds • Limited access to land to produce maize and
soybeans for formulation of chicken feed • Low nutritive value of feed ingredients used in
feed formulation such as maize, maize bran, grain sorghum, rice bran and fish meal in terms of energy, protein, mineral and amino acid profile
• Low nutritive value and low quality of commercial chicken feeds in terms energy, protein, mineral and amino acid profile and high crude fibre
• Presence of physical and chemical contaminants such as charcoal, sand and dust in chicken feed ingredients and feeds
• Low institutional capacity to monitor quality of chicken feed produced and processed
• Low incentive for the private sector to invest in chicken feed processing plants.
• Enforce Grazing-land and Animal Feed Resources Act 2010 and related regulations
• Build capacity for animal feed inspectors in various levels
• Prepare guidelines for inspection of processed chicken feeds
• Create awareness through sensitization on need/requirements for quality chicken feeds
• Build capacity for good processing practices among animal feed processors
• Regulate the export of oil crops and import of cooking oils
• Strengthen mechanisms to control feed quality • Give tax breaks and other incentives to
encourage private sector in chicken feed processing industries
Animal health
• High prevalence and impact of diseases particularly Newcastle, salmonellosis, Marek’s disease among small-scale chicken producers
• Poor handling and poor-quality drugs and vaccines associated with inadequate human resource for supervising and monitoring drugs use and unreliable cold chain supply of chicken vaccines
• Poor housing and sanitation for chickens
• Strengthen enforcement of Animal Disease Act 2003 and its regulations.
• Formulate biosafety guidelines for disease control and other relevant guidelines
• Enforce stricter disease controls on the importation of commercial replacement stock
• Produce Newcastle Disease vaccine with high efficacy and institute mandatory mass vaccination against the disease
• Create awareness among small producers on best practices in chicken housing and sanitation.
Marketing and processing

58
Challenges Strategies to address the challenges
• Chicken farmers’ marketing organizations are limited in geographical scope with most operating in Dar-es-salaam and other urban areas
• Weak chicken farmer’s groups and platforms existing farmers marketing organizations are poorly structured and there is lack of a related apex national association.
• Lack of slaughter facilities for chicken • Lack of chicken meat processing facilities • Weak biosafety facilities and hazard analysis and
critical control points (HACCP) (viii) Weak consumers preference for exotic
chicken meat and eggs
• Promote establishment of Tanzania chicken traders’ associations
• Construct chicken slaughtering and processing facilities and promote chicken meat and eggs marketing.
• Institutionalize mandatory biosafety and HACCP procedures
• Intensify the promotion and extension work to change the attitudes of consumers towards consuming eggs and meat from hybrid and exotic breeds
Policy • Most of the hatcheries and breeder chicken farms
are not registered, do not have registered veterinarians and operate within residential areas without standard operating procedures
• There are many complaints from farmers on high mortality of chicks from some hatcheries due to salmonellosis and emergence of Marek’s disease in pullets (layers).
• Weak policies related to land acquisition for chicken feed production.
• Promote registration of hatcheries and breeder farms
• Establish standard operating procedures and guidelines for operation of hatcheries and breeder farms
• Institutionalize biosafety measures and HACCP facilities for chicken meat, eggs and feeds
• Create favourable policies for land acquisition for chicken feed production
Interventions to achieve targets The interventions to transform the family chicken system involve improving indigenous chicken productivity through improved breed selection, importation of high-yielding pure tropical scavenging brooding breeds and importation of semi-scavenging tropical breeds. These measures should go along with a reduction of reproductive wastage by introducing brooding and artificial incubation facilities such as hay box brooders and small-scale incubators; and health, feed and management interventions. Adoption and coverage of the intervention at 40% and 30%, respectively, will impact 12% of the total indigenous ITFC chicken over the 5-year project period. Tropical improved chicken will grow from 15,000-2,000,000 chickens in 5 years, a huge development. The interventions in the improved traditional family chicken (indigenous and imported pure breeds) aim at upgrading the flock size from –8 hens. Eggs laid per year will increase from 50-90 and average weight of sold chicken will increase from 1.1–1.4 kg. Through the semi-scavenging tropical crossbreeds such as Kuroiler, holding per family will remain 25 chickens and it is expected to grow to at least 150 eggs per hen/year with 2.8 kg live weight for mature chicken. With the additional animal health services, chicken mortality before marketing will drop down from 50–10%. The average number of eggs consumed on-farm/year will increase from 10–20 and chicken consumed from 5–10; both 100% increases.

59
Investments The investment details are indicated in Table 53. Impacts Investment impacts The internal rate of return of the investment for improved traditional family chicken is 75% and for tropical improved chicken is 58% which justifies the value of the investment. This is at a discount rate of 10%. Production impacts
• Total meat from the family system (ITFC and TIC) increases from 31.81 thousand tonnes to 49.9 thousand tonnes, a 57% increase.
• Total egg production from the family system (ITFC and TIC) increases from 109.99 million eggs in the year 2016/17 to 358.3 million eggs in the year 2021/22, a 350% increase.
GDP impacts The GDP contribution from the family chicken (ITFC and TIC) will increase from 21,310.6 to 54,355.1 million for eggs and 153,326.93 to 275,188.72 million for chicken meat respectively in the year 2021.

60
Table 49: GDP contribution 2031 with current and with additional investment scenarios
Products Chicken GDP 2016/17 (TZS millions)
Chicken GDP 2021/22 (TZS millions)
% change
Improved traditional family chicken (ITFC) meat
153,843.49 276,115.6 79
Crossbreed family chicken meat 52.5 8,266.3 NA Total family chicken meat 153,895.9 284,381.9 85 ITFC eggs 22,678.3 57,843.5 155 Tropical improved chicken (TIC) eggs 122.5 20,570.0 NA Total family chicken eggs 22,800.8 78,413.5 244 Total family chicken meat and eggs 176,696.7 362,795.4 105 Source: LSIPT Livestock Sector Analysis (2017), MLF GDP contribution from the family chicken system increases from TZS 176,696.7 million in 2016/17 to TZS 362,795.4 million in 2021/22, a 105% increase as a result of additional interventions. Table 50: Intervention activity timeline and sequencing: Gantt chart
No. Investment interventions Investment activity timing 2017/18 2018/19 2019/20 2020/21 2021/22
1 Establishing three chicken feed processing plants
2 Improving the capacities of chicken feed quality control laboratories
3 Land investment for feed (yellow-maize and soybean) production (sorghum to complement maize)
4 Upgrading and expand Newcastle Disease, fowl pox and Gumboro vaccines production plant
5 Establishing and monitor the chicken industry bio-safety program
6 Identifying suitable tropical pure reproducing/brooding chicken breeds
7 Identifying suitable tropical semi-scavenging crossbred chicken breeds
8 Testing breeds at the Tanzania Livestock Research Institute (TALIRI) and at farm-level and

61
No. Investment interventions Investment activity timing 2017/18 2018/19 2019/20 2020/21 2021/22
developing appropriate business models
9 Strengthening/upgrading seven public chick multiplication centres
10 Establishing eight new public and private crossbred semi-scavenging and commercial day-old chick multiplication centres and 30 mothering units and distribution centres for four-weeks vaccinated chicks
11 Establishing 10 public and private hatchery facilities and 100 private distribution centres for selected four-weeks vaccinated reproducing/brooding chicken
12 Reducing reproductive wastage of brooding hens using artificial incubation (10,000 incubators/year)
13 Reducing reproductive wastage of brooding hens using chicken brooder box (10,000 hay brooding box/year)
14 Supporting the Livestock Training Agency (LITA) and private institutions to implement farmers’ skills and training programs on commercial livestock production
15 Promotion of exotic chicken meat and eggs consumption
16 Establishment of chicken slaughterhouses and cold storage for eggs and chicken meat
17 Building capacity of MLF, local government authorities, and livestock keepers on record keeping, data management and dissemination

62
Specialized commercial chicken production
Targets
Table 51: Number of chicken and chicken meat production in specialized chicken subsystems Chicken subsystem Unit 2016/17 2017/18 2018/19 2019/20 2020/21 2021/22 %
change Specialized layers
million
13.32 13.99 14.68 15.42 16.19 17.00 28 Specialized broilers
million
3.29 5.64 9.64 16.49 28.20 48.23 1,362 Total specialized chicken
million 15.61 19.63 24.32 31.91 44.39 65.23 318
Specialized layer
Tonnes 9,988.3 10,591 11,231 11,909 12,629 13,391 34
Specialized broiler
Tonnes 19,058.7 35,075 64,550 118,796 218,628 402,354 2,011
Total Tonnes 29,047 45,666 75,782 130,705 231,256 415,745 1,331 Source: LSIPT Livestock Sector Analysis (2017), MLF
• The number of chickens in the specialized chicken layers subsystem grows from 13.3 million in 2016/17 to 17 million in 2021/22, a 28% increase.
• The number of chickens in the specialized chicken broilers subsystem grows from 3.3 million in 2016/17 to 48.2 million in the year 2021/22, a 1,362% increase.
• Chicken meat production from specialized chicken increases from 29,047 tonnes in 2016/17 to 415,745 tonnes in the year 2021/22, a 1,331% increase.

63
Table 52: Egg production from specialized layers Chicken subsystem 2016/17 2017/18 2018/19 2019/20 2020/21 2021/22 Change
in % Specialized chicken egg (thousands)
2,864,947 3,035,292 3,215,766 3,406,971 3,609,544 3,824,162 33
Source: LSIPT Livestock Sector Analysis (2017), MLF
• Egg production from specialized layers increases from 2.86 billion in 2016/17 to 3.82 billion in the year 2021/22, an increase of 33%.
Key challenges and strategies related to the specialized layers and broilers system
The specialized layers and broilers systems are facing the challenges as those of the traditional family chicken system and need similar strategies transforming the system. Refer to Table 48 above for the details. Interventions to achieve targets The interventions for specialized chicken improvement involve increasing the scale of operations and volume of production from the specialized chicken farms that is specialized chicken layers and specialized chicken broilers. The major intervention proposed for the specialized chicken layers and specialized chicken broilers are increasing their number in the country and the number of specialized farm units. The average number of broilers per specialized farm/year increases to 1,020 per cycle and the average number of layers stays the same at 1,300. Impacts Return on investments The internal rates of return of the investment in specialized broilers and specialized layers is 57% and 36%, respectively, which is way above the 10% discount rate. These returns justify the investment and imply the profitability of both specialized layers and broilers. As shown in Table 53, the total investment required during the first five years to develop the sector amounts to TZS 753 billion which is shared by the public and private sector.

64
Table 53: Five-year chicken meat and egg production improvement investment costs (2017/18–2021/22)
Investment interventions
Investment cost (TZS million) Budget source 2017/18 2018/19 2019/20 2020/21 2021/22 Total
Animal feeding
• Establishing 3 chicken feed processing plants 2,970 5,940 8,910 Private
(100%) • Improving the capacities
of chicken feed quality control laboratories
1,320 1,320 2,640 Public4 (100%)
• Land investment for feed (yellow maize and soybean) production (sorghum to complement maize)
36,300 36,300 46,200 60,500 62,700 242,000 Private (100%)
Animal health • Upgrading and
expanding Newcastle Disease, fowl pox and Gumboro vaccines production plant
13,200 19,360 13,200 45,760 Public (100%)
• Establishing and monitoring the chicken industry biosafety program
2,200 3,300 1,320 1,320 1,210 9,240 Public (100%)
Animal breeding and genetics
• Identifying suitable tropical pure reproducing/brooding chicken breeds
3,960 2,200 6,160 Public (100%)
• Identifying suitable tropical semi scavenging crossbred chicken breeds
2,200 1,760 3,960 Public (100%)
• Testing breeds at the Tanzania Livestock Research Institute (TALIRI) and at farm-level and developing appropriate business models
2,200 3,520 5,720 Public (100%)
• Strengthening/upgrading 7 public chick multiplication centres
1,100 2,200 2,420 5,720 Public (100%)
• Establishing 8 new public and private crossbred semi-scavenging and commercial day-old chick multiplication centres and 30 mothering units and distribution centres for 4 weeks vaccinated chicks
3,163 3,163 6,325 6,325 6,325 25,300 Public (20%), Private(80%)
4 Represents Government and NGO funds. NGO funds assumed to feed into the achievement of the national government/public goals

65
Investment interventions
Investment cost (TZS million) Budget source 2017/18 2018/19 2019/20 2020/21 2021/22 Total
• Establishing 10 public and private hatchery facilities and 100 private distribution centres for selected 4 weeks vaccinated reproducing/brooding chicken
7,508 7,508 15,015 15,015 15,015 60,060 Public (20%), Private (80%)
Extension • Reduce reproductive
wastage of brooding hens using artificial incubation (10,000 Incubators/year)
22,000 26,400 33,000 35,200 37,400 154,000 Public (30%), Private (70%)
• Reducing reproductive wastage of brooding hens using chicken brooder box (10,000 hay brooding box/year)
8,800 9,900 11,000 12,100 13,200 55,000 Public (20%), Private (80%)
• Supporting the Livestock Training Agency (LITA) and private institutions to implement a farmers’ skills and training programs on commercial livestock production
3,696 3,696 3,696 3,696 3,696 18,480 Public (50%), Private (50%)
• Promoting exotic chicken meat and eggs consumption
220 440 1,100 1,320 1,760 4,840 Public (60%)
Marketing and value chain • Establishment of chicken
slaughtering house, cold storage for eggs and chicken meat
6,325 6,600 12,925 Public (10%), Private (90%)
Policy, planning and M&E • Building capacity of the
MLF, local government authorities, and livestock keepers on record keeping, data management and dissemination5
1,210 1,320 1,430 1,540 1,786 7,286 Public (80%), Private (20%)
Total investment 121,644 134,404 162,206 163,031 172,187 753,361 Public 26% Private 74% Production impacts
• Chicken meat production from specialized chicken increases from 29,047 tonnes in 2016/17 to 415,745 tonnes in the year 2021/22, a 1,331% increase.
• Egg production from specialized layers increases from 2.86 billion in 2016/17 to 3.82 billion in the year 2021/22, an increase of 33%.
5 This investment serves across all commodities

66
GDP impacts The GDP contribution of the specialized commercial chicken system increases from the current TZS 55 billion to TZS 303 billion in 5 years. Eggs from the specialized system contributed TZS 61 billion during the same 5-year investment period. Table 54: GDP contribution from commercial specialized chicken system (baseline GDP compared with 2021/22 from additional investment)
GDP contributions 2016/17 (TZS millions) 2021/22 (TZS millions) % change
Chicken meat GDP 55,148 303,567 450 Eggs GDP 24,123 61,110 153 Total 79,121 364,67 361 Source: LSIPT Livestock Sector Analysis (2017), MLF The total GDP contribution of the specialized chicken system increases from TZS 79 billion to TZS 365 billion by the fifth investment year, which is a 360% increase. Total production Chicken meat The total chicken meat production from the family and commercial specialized systems increases by 665% over five years. Table 55: Total chicken meat and eggs production with additional investment
Products Unit Chicken meat 2016/17 (tonnes)
Chicken meat 2021/22 (tonnes)
Total chicken meat from the Family system Tonnes 31,773 49,855
Total chicken meat from Commercial specialized system Tonnes 29,047 415,745
Total chicken meat production Tonnes 60,820 465,600
Total eggs family system Thousands 101,956 358,305
Total eggs from specialized system Thousands 2,864,947 3,824,162
Total eggs production Thousands 2,966,903 4,182,457
Source: LSIPT Livestock Sector Analysis (2017), MLF
Eggs The total eggs production from the family and commercial specialized systems increased by 41% over five years.

67
Total GDP Table 56: Family and commercial specialized chicken production systems GDP contribution with additional investment
Products GDP 2016/17 (TZS millions)
GDP 2021/22 (TZS millions)
% change
Family chicken meat contribution 153,896 284,382 85% Specialized chicken meat contribution 55,148 303,567 450% Total meat contribution 209,044 587,949 181 Family chicken eggs contribution 22,800 78,415 244% Specialized chicken eggs contribution 24,123 61,110 153% Total eggs contribution 46,923 139,525 197 Total meat and eggs GDP contribution 255,967 727,474 184
Source: LSIPT Livestock Sector Analysis (2017), MLF Overall the GDP contribution of the total chicken meat and eggs production increased from the current TZS 256 billion to TZS 723 billion in five years, an increase of 184%. Change in annual incremental income Table 57: Annual incremental income as a result of the intervention
Chicken subsystem 2016/17 2021/22 Annual incremental income per place % change
Family chicken 41,345 54,557 13,212 32 Improved family chicken 19,496 20,746 1,250 6 Specialized layer 3,720 5,342 1,622 44 Specialized broilers 2,954 4,541 1,587 54 Source: LSIPT Livestock Sector Analysis (2017), MLF
Production and consumption The figure below shows that under a ‘business as usual’ or ‘without additional investment’ scenario, there is and there will be a substantial shortage of chicken meat production to meet the current as well as the future domestic consumption demand. However, with the proposed additional investment, the shortage will be removed and there will be surplus beginning from year 2020.
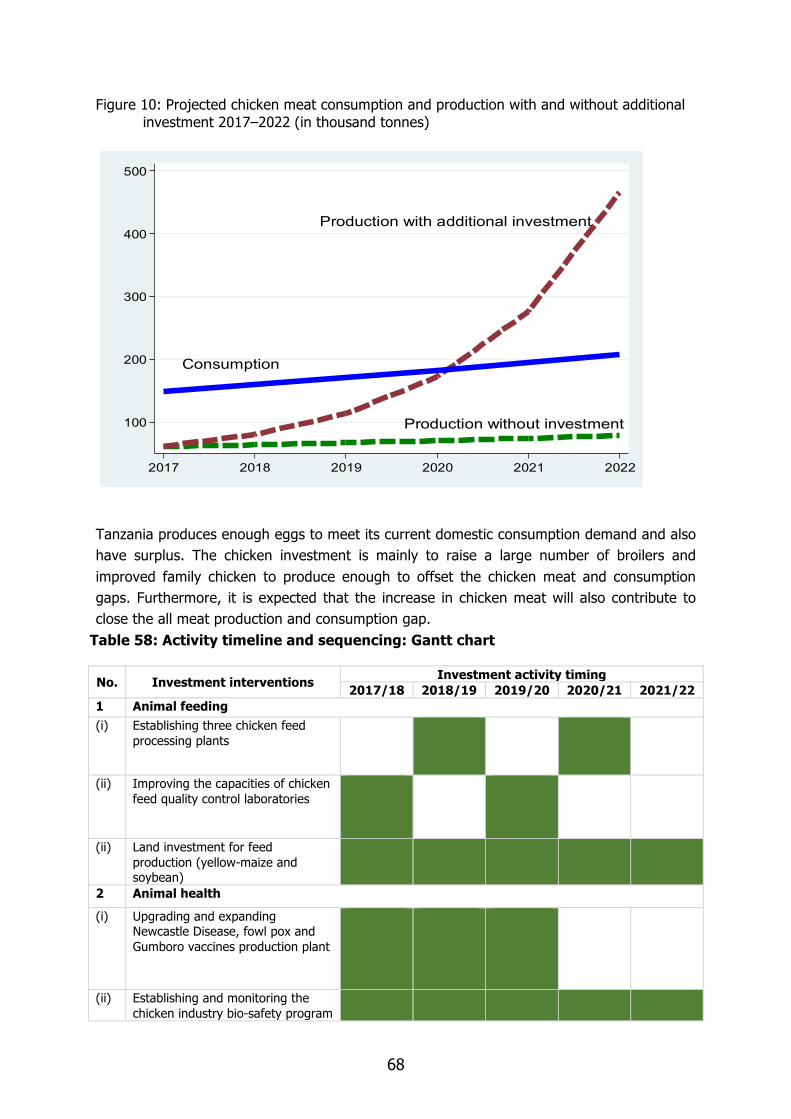
68
Figure 10: Projected chicken meat consumption and production with and without additional investment 2017–2022 (in thousand tonnes)
Production without investment
Consumption
Production with additional investment
100
200
300
400
500
2017 2018 2019 2020 2021 2022
Tanzania produces enough eggs to meet its current domestic consumption demand and also have surplus. The chicken investment is mainly to raise a large number of broilers and improved family chicken to produce enough to offset the chicken meat and consumption gaps. Furthermore, it is expected that the increase in chicken meat will also contribute to close the all meat production and consumption gap. Table 58: Activity timeline and sequencing: Gantt chart
No. Investment interventions Investment activity timing 2017/18 2018/19 2019/20 2020/21 2021/22
1 Animal feeding (i) Establishing three chicken feed
processing plants
(ii) Improving the capacities of chicken feed quality control laboratories
(ii) Land investment for feed production (yellow-maize and soybean)
2 Animal health
(i) Upgrading and expanding Newcastle Disease, fowl pox and Gumboro vaccines production plant
(ii) Establishing and monitoring the chicken industry bio-safety program

69
No. Investment interventions Investment activity timing 2017/18 2018/19 2019/20 2020/21 2021/22
3 Animal breeding and genetics (i) Identifying suitable tropical pure
reproducing/brooding chicken breeds
(ii) Identifying suitable tropical semi scavenging crossbred chicken breeds
(iii) Testing breeds at TALIRI and at farm level and developing appropriate business models
(iv) Strengthening/upgrading 7 public chick multiplication centres
(v) Establishing eight new public and private crossbred semi-scavenging and commercial DOC multiplication centres and 30 mothering units and distribution centres for 4 weeks vaccinated chicks
(vi) Establishing 10 public and private hatchery facilities and 100 private distribution centres for selected 4 weeks vaccinated reproducing/brooding chicken
4
Extension
(i) Reducing reproductive wastage of brooding hens using artificial incubation (10,000 Incubators/year)
(ii) Reducing reproductive wastage of brooding hens using chicken brooder box (10,000 hay brooding box/year)
(iii) Supporting the Livestock Training Agency (LITA) and private institutions to implement a farmers’ skills and training programs on commercial livestock production
(iv) Promoting of exotic chicken meat and eggs consumption
5 Marketing and value chain
(i) Establishment of chicken slaughtering house, cold storage for eggs and chicken meat
6 Policy, planning and monitoring and evaluation
(i) Building capacity of MLF, LGAs, and livestock keepers on record keeping, data management and dissemination6
6 This investment serves across all commodities

70
Complementary intervention and success requirements for specialized chicken
(i) The sustainability of the specialized chicken system depends on the effectiveness of the day-old chicks’ production and distribution system. A well-functioning private day-old chicks’ industry will be required for their efficient production and distribution to the specialized chicken farms.
(ii) Government encouragement of chicken agribusiness investors and a reduction of
bureaucratic obstacles will be required.
(iii) Government should give priority in land allocation to specialized chicken farms and chicken feeds production enterprises.
(iv) The increase in production of eggs and chicken meat that exceeds domestic
demand opens up opportunities for export and processing. Large investments in processing plants will be needed to produce value-added products for industrial uses (e.g. egg powder) or to meet foreign consumer demand for eggs and egg powder. The government should encourage private investors in chicken meat and eggs processing through tax breaks and low-interest loans.
(v) Availability of chicken feed is a critical factor in the success of specialized chicken
operations. There is a need to set up mechanisms for low-cost feed production and formulation at all production levels.
(vi) Specialized chicken enterprises should make efforts to link-up with chicken meat
and egg processing enterprises to ensure regular access to market outlets, and with maize producers and cooking oil plants for regular supply of feed.
(vii) Public-private partnerships should be used to manufacture and distribute quality
vaccines to keep the exotic chickens healthy.
(viii) Other essential components that need to be carried out by farmer groups and cooperatives include:
(ix) Setting up out-growers (mother units) schemes for pullet production and
distribution
(x) Establishment of mini-hatcheries
(xi) Establishment of feed processing plants and slaughter facilities.

71
Conclusions
The chicken industry can contribute significantly to improving food and nutrition security, household incomes, and national economic growth in Tanzania. This roadmap presented the challenges that need to be addressed in the sector, the proposed policy and investment interventions required and the indicative required investment funds to develop the sector. The financial viabilities of various interventions and the impacts of interventions on chicken productivity, production and on national economy mainly in terms of GDP are also presented. It is observed that the policy and investment interventions in the improved family chicken and specialized chicken systems will substantially increase chicken meat production which will contributes toward closing the gap in production-consumption for all meats. However, this goal will be realized only if:
• the feed problem is resolved; • an effective extension system is put in place; • private investors in the sector (specialized chicken, processing plants, feed
producers) are given adequate incentives in terms of tax breaks, subsidized land-leasing rates and priority access to acquire land; and
• protective trade policies to encourage domestic private investors in the chicken business are implemented.

72
PIG/PORK VALUE CHAIN DEVELOPMENT ROADMAP 2017/2018–2021/2022

73
Vision
By 2025 the Tanzania pig industry becomes an efficiently functioning sector with market-oriented farming, processing and dynamic marketing, operating in more sustainable and climate-smart ways, supplying consumers with high-quality and safe pig meat/pork, and contributing to household food and nutritional security, income growth, poverty alleviation and to national economic growth.
Overall target The overall target is to raise pig meat production from the current 22,000 tonnes (2016/17) to 37,000 tonnes by 2021/22 through improved family and expanded commercial specialized pig production systems. Modernizing and transforming the traditional free-ranging family pig production system. Table 59: Targeted number of sow and tonnes of meat in traditional (extensive) family and improved family pig (TFP and IFP) subsystems
Pig subsystem Unit 2016/17 2017/18 2018/19 2019/20 2020/21 2021/22 % change
Targeted Numbers of Pigs in Traditional an Improved Family Pig subsystems Traditional family pig system (TFPS)
Number 207,083 223,028 240,202 258,697 278,617 300,070 45
Improved family pig system (IFPS)
Number 77,778 83,767 90,217 97,163 104,645 112,703 45
Total number of TFPS & IFPS Number 284,861 306,795 330,419 355,860 383,262 412,773 45
Targeted Tonnes of Meat in Traditional an Improved Family Pig subsystems TFPS meat Thousand
Tonnes 12.77 13.71 14.72 15.81 16.98 18.23 43
IFPS meat Thousand Tonnes
5.96 6.38 6.84 7.33 7.85 8.42 41
Total Tonnes TFPS and IFPS
Thousand Tonnes 18.73 20.10 21.57 23.14 24.83 26.65 42
Source: LSIPT Livestock Sector Analysis (2016), MLF Tanzania
As indicated in Table 59 the number of sows in traditional (extensive) family (TFPS) systems increases from 207,083 to 300,070 and the number of pigs in the improved semi-intensive family system increases from 77,778 to 112,703. In both cases the change in number over five years is 45%. Pig meat production from the TFPS subsystem increases from 12.8 thousand tonnes to 18. 2 thousand tonnes, a 43% increase. Pig meat from improved (semi-intensive) family pig subsystem (IFPS) increases from 6 tonnes to 8.4 tonnes, a 41% change over 5 years.

74
Targeted productivity changes
(i) The number of sows in the TFPS household sub-system increases from 2 to 4. (ii) Mortality of young pigs will decrease from an average of 20% to 18% and 12% to
10% in TFPS and IFPS, respectively. (iii) The age at first calving decreases from an average of 300 days to 270 days in TFPS. (iv) The proportion of industrial feed included in the pig ration increases from average of
0% to 4% and from 20% to 40% among TFPS and IFPS, respectively. (v) Age at weaning decreases from an average of 60 to 55 and 45 to 35 days among
TFPS and IFPS, respectively. (vi) Age of piglets for marketing decreases from 120 to 112 days and from 60 to 40 days
among TFPS and IFPS, respectively. Table 60: Key challenges and strategies related to the traditional and improved family pig subsystem
Challenges Strategies to address the challenges Genetics
• Limited number of improved pig breeds • Lack of specialized commercial pig
breeding farms
• Establishing public and private sector specialized commercial pig breeding and multiplication farms
• Designing a pig industry development strategy/program in Tanzania
• Low productivity of family-kept pigs partly due to low genetic potential and inbreeding leading to poor quality stock supplied to farmers
• Inadequate supply of well-bred pig stocks from pig multiplication and breeding farms
• Importing new lines of improved high-yielding pig breeds to avoid inbreeding and increase productivity
• Extension and proper management and husbandry practices to lower the probability of inbreeding
• Supporting the Tanzania Livestock Research Institute pig breeding and research activities
• Promote establishment of pig multiplication and breeding farms
Animal health
• A weak animal health delivery system • Inadequate health extension staffs
• Strengthening surveillance, early detection/diagnosis • Strengthening national and local government authorities’
capacity to recruit additional staff to respond to outbreaks and provide specialized pig extension services.
• Widespread pig health and reproductive problems and major devastating diseases such as African swine fever, foot-and-mouth disease, erysipelas, transmissible gastroenteritis and brucellosis that cause heavy mortality
• Supporting immunization measures (for foot-and-mouth disease, brucellosis)
• Improving pig farm management practices to benefit producers.
• Enforcing the Animal Pounds Act, and Animal Welfare Act, 2008
• Extensive pig farmers education and developing regulations to stop free roaming
• To prepare the national pig biosecurity policy guidelines for farmers (small and commercial), feed and meat processors
Feeds challenges
• Unreliable supply of commercial feeds • Establishment of private small-scale feed mills and public-private partnerships multilevel feed processing
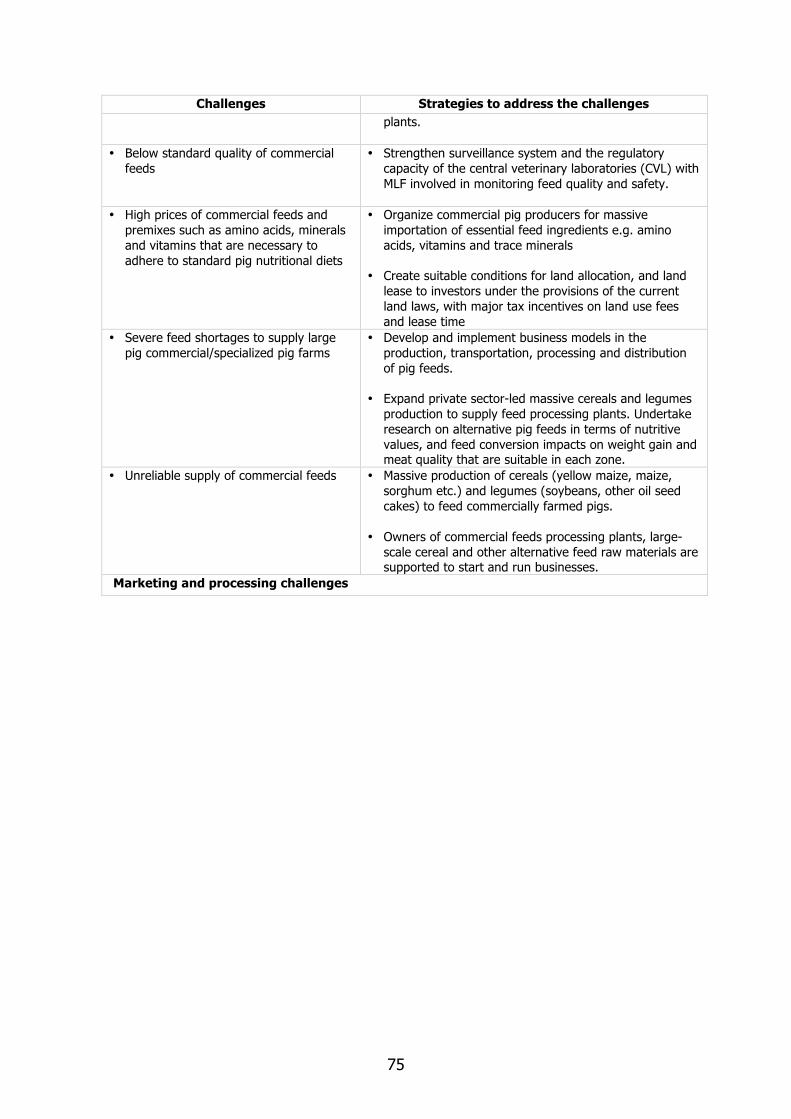
75
Challenges Strategies to address the challenges plants.
• Below standard quality of commercial feeds
• Strengthen surveillance system and the regulatory capacity of the central veterinary laboratories (CVL) with MLF involved in monitoring feed quality and safety.
• High prices of commercial feeds and
premixes such as amino acids, minerals and vitamins that are necessary to adhere to standard pig nutritional diets
• Organize commercial pig producers for massive importation of essential feed ingredients e.g. amino acids, vitamins and trace minerals
• Create suitable conditions for land allocation, and land lease to investors under the provisions of the current land laws, with major tax incentives on land use fees and lease time
• Severe feed shortages to supply large pig commercial/specialized pig farms
• Develop and implement business models in the production, transportation, processing and distribution of pig feeds.
• Expand private sector-led massive cereals and legumes production to supply feed processing plants. Undertake research on alternative pig feeds in terms of nutritive values, and feed conversion impacts on weight gain and meat quality that are suitable in each zone.
• Unreliable supply of commercial feeds • Massive production of cereals (yellow maize, maize, sorghum etc.) and legumes (soybeans, other oil seed cakes) to feed commercially farmed pigs.
• Owners of commercial feeds processing plants, large-scale cereal and other alternative feed raw materials are supported to start and run businesses.
Marketing and processing challenges

76
Challenges Strategies to address the challenges • Weak pig marketing arrangements • Higher pork price due to marketing
inefficiency, high cost of transportation from producers to urban markets
• Lack of pig slaughter facilities/abattoirs, absence of cooling systems (e.g. refrigerators), absence of standard weights and measures
• Lack of access to formal credit sources for investment in pig production
• Developing the pig value chain to improve pig marketing, trading capacity and smallholder pig production by constructing pig markets, slaughter facilities/abattoirs and fresh pork marketing outlets.
• Ensure linkages to slaughter facilities/abattoirs, preservation facilities and processing plants
• Applying good-manufacturing practices (GMP) in production process, implement HACCP in animal feed manufacturing, pig slaughtering facilities and processing.
• Strengthening swine producer associations (SPAs) to provide credit facilities, offer learning opportunities to farmers’ and actors’ in the value chain through skills training and joint implementation of biosecurity measures to control devastating diseases such as African Swine Fever.
• Promote SPAs to innovate and actively participate in the value chain mainstreaming to maximize installed feed and meat processing capacities, own and manage cooperative-owned small-scale feed mills, enforce formal use of weights in meat sales, and infrastructural developments in order to increase the overall volume and values in the market
• Lack of quality grading system for pig meat
• Establish pig meat quality grading standards and regulatory systems to enforce it
• Build capacity of animal and livestock production staff on pig ante- and post-mortem inspection skills/techniques
Policy challenges • Lack of official pig marketing and pig
meat transportation policies • Ensure policy guidelines/regulations to reorganize pig
marketing/trading system is developed
• The development, support and implementation of animal welfare strategic plan undertaken.
• Lack of policy for pig holding and slaughtering facilities
• Create enabling policy environments for the establishment of rural small-scale and urban large-scale slaughter facilities.
• Develop policy guidelines, standard operating procedures (SOPs) and awareness campaigns on slaughter facilities’ hygiene and food safety.

77
Challenges Strategies to address the challenges • Lack of policy for land allocation for pig
production • Lack of policy that gives incentives to
private sector to invest in pig production
• Ensure policy related to land acquisition or long-term land leasing
• Develop and seek government approvals on appropriate policy incentives to encourage foreign direct investments, organizations and individuals to invest in commercial pig production, processing and marketing, building domestic pig auction markets, and pig products and kiosks consumption outlets
• Ensure sufficient infrastructure and access to feed sources for the production of feed raw materials (cereals, legumes, roots/tubers etc.) to supply large pig farms
• Introduce protective trade policies to encourage domestic private investment in pig production
Interventions to achieve targets in traditional and improved family pig subsystems The proposed transformation of the traditional family pig production system involves genetic, health and feeding interventions alongside marketing and policy interventions. The genetic interventions involve importation of tropically adapted and more productive pig sows and boars for breeding and crossbreeding and the establishment of pig breeding and multiplication farms. The animal health interventions involve strengthening disease control for priority pig diseases such as African swine fever, transmissible gastro enteritis, erysipelas, worms, and mange; strengthening bio-security and allied facilities; surveillance through local government authorities and zonal veterinary labs; and the building of staff capacity on national mandatory pig or commodity-based identification and traceability to achieve animal health and safe trade objectives. The feed interventions involve strengthening the capacity of private small-scale pig feed mills/processors to compound and distribute pig feeds to rural smallholder farmers and strengthening capacity of family pig keeping households to compound and supplement quality pig feed/home rations with locally available and industrial feed materials.

78
Impacts Return on investment The return on the pig investment from the family pig system is 86% and 17% for small- and medium-sized traditional pig systems, respectively. Both have demonstrated an internal rate of return greater than the 10% discount rate used in the analysis of the investment. Production impacts Pig meat production from the traditional family pig subsystem (TFPS) increases from 12.8 thousand tonnes to 18.2 thousand tonnes and pig meat from the improved semi-intensive IFPS subsystem increases from 6 tonnes to 8.4 tonnes. Total pig meat production from the family system increases from 18.7 tonnes to 26.7 tonnes, a 42% increase in 5 years. GDP impacts Because of the additional intervention, the GDP contribution of the traditional family pig system increases from TZS 27.5 billion in 2016/17 to TZS 39 billion. Similarly, the GDP that comes from the improved family pig system increases from TZS 11 billion to TZS 15 billion during the same period. Due to the additional investment, the total GDP contribution of the family pig production subsystem increases from TZS 38.6 billion to TZS 54.4 billion, a 41% growth. Table 61: Traditional and Improved Family pig GDP contribution with additional investment
Products Pig meat GDP 2016/17 (TZS millions)
Pig meat GDP 2021/22 (TZS millions)
% change
TFSP meat contribution 27,457.50 39,151.30 43 IFPS meat contribution 11,118.70 15,282.60 37 Total family pig meat system contribution 38,576.20 54,433.90 41
Source: LSIPT Livestock Sector Analysis (2017), MLF
Expanding the commercial specialized pig production subsystem Targets Table 62: Targeted number of sows and pig meat production in the commercial/specialized pig production (CSP) subsystem
Pig subsystem 2016/17 2017/18 2018/19 2019/20 2020/21 2021/22 %
change CSP (numbers) 57,580 70,746 86,922 106,796 131,215 161,218 180 CSP meat (tonnes)
3,295 4,156 5,241 6,610 8,336 10,514 219
Source: LSIPT Livestock Sector Analysis (2017), MLF
As indicated in Table No. 62 the number of sows in the commercial specialized pig subsystem increases by 180% from 57,580 to 161,218 sows. With each sow having 6 followers, the total number of pigs in this subsystem increases from 403,360 to 1,128,526.

79
Pig meat production from the specialized pig system increases from 3.3 thousand tonnes to 10.5 thousand tonnes over 5 years which constitutes a 219% growth. This growth is as a result of the following changes:
" Delay in weaning: successful service from 15–11 days " Proportion of industrial feed included in the ration rising from 70–79% " Age of piglets marketed reducing from 40–36 months " Daily weight gain of piglets rising from 0.7–0.8 kg
Table 63: Key challenges and strategies related to the commercial specialized pig system
Challenges Strategies to address the challenges
Genetics
• Limited number of improved pig breeds • Lack of specialized commercial pig
breeding farms
• Establishing public and private sector specialized commercial pig breeding and multiplication farms
• Designing a pig industry development strategy/program in Tanzania
• Low productivity of family-kept pigs partly due to low genetic potential and inbreeding leading to poor quality stock supplied to farmers
• Inadequate supply of well-bred pig stocks from pig multiplication and breeding farms
• Importing new lines of improved high-yielding pig breeds to avoid inbreeding and increase productivity
• Extension and proper management and husbandry practices to lower the probability of inbreeding
• Supporting the Tanzania Livestock Research Institute pig breeding and research activities
• Promote establishment of pig multiplication and breeding farms
Animal health
• A weak animal health delivery system • Inadequate health extension staffs
• Strengthening surveillance, early detection/diagnosis • Strengthening national and local government
authorities’ capacity to recruit additional staff to respond to outbreaks and provide specialized pig extension services
• Widespread pig health and reproductive problems and major devastating diseases such as African swine fever, foot-and-mouth disease, erysipelas, transmissible gastroenteritis and brucellosis that cause heavy mortality
• Supporting immunization measures (for foot-and-mouth disease, brucellosis)
• Improving pig farm management practices to benefit producers.
• Enforcing the Animal Welfare Act, 2008 • Extensive pig farmers education and developing
regulations to stop free roaming. • To prepare the national pig bio-security policy
guidelines for farmers (small and commercial), feed and meat processors
Feeds challenges • Unreliable supply of commercial feeds • Establishment of private small-scale feed mills and
public-private partnerships multilevel feed processing plants
• Below standard quality of commercial feeds
• Strengthen surveillance system and the regulatory capacity of the central veterinary laboratories (CVL) with MLF involved in monitoring feed quality and safety
• High prices of commercial feeds and premixes such as amino acids, minerals and vitamins that are necessary to adhere
• Organize commercial pig producers for massive importation of essential feed ingredients e.g. amino acids, vitamins and trace minerals

80
Challenges Strategies to address the challenges
to standard pig nutritional diets • Create suitable conditions for land allocation, and land lease to investors under the provisions of the current land laws, with major tax incentives on land use fees and lease time
• Severe feed shortages to supply large pig commercial/specialized pig farms
• Develop and implement business models in the production, transportation, processing and distribution of pig feeds
• Expand private sector-led massive cereals and legumes production to supply feed processing plants. Undertake research on alternative pig feeds in terms of nutritive values, and feed conversion impacts on weight gain and meat quality that are suitable in each zone
• Unreliable supply of commercial feeds • Massive production of cereals (yellow maize, maize, sorghum etc.) and legumes (soybeans, other oil seed cakes) to feed commercially farmed pigs
• Owners of commercial feeds processing plants, large-scale cereal and other alternative feed raw materials are supported to start and run businesses
Marketing and processing challenges • Weak pig marketing arrangements • Higher pork price due to marketing
inefficiency, high cost of transportation from producers to urban markets
• Lack of pig slaughter facilities/abattoirs, absence of cooling systems (e.g. refrigerators), absence of standard weights and measures
• Lack of access to formal credit sources for investment in pig production
• Developing the pig value chain to improve pig marketing, trading capacity and smallholder pig production by constructing pig markets, slaughter facilities/abattoirs and fresh pork marketing outlets
• Ensure linkages to slaughter facilities/abattoirs, preservation facilities and processing plants
• Applying good-manufacturing practices (GMP) in production process, implement HACCP in animal feed manufacturing, pig slaughtering facilities and processing
• Strengthening swine producer associations (SPAs) to provide credit facilities, offer learning opportunities to farmers’ and actors’ in the value chain through skills training and joint implementation of biosecurity measures to control devastating diseases such as African Swine Fever
• Promote SPAs to innovate and actively participate in the value chain mainstreaming to maximize installed feed and meat processing capacities, own and manage cooperative-owned small-scale feed mills, enforce formal use of weights in meat sales, and infrastructural developments in order to increase the overall volume and values in the market
• Lack of quality grading system for pig meat
• Establish pig meat quality grading standards and regulatory systems to enforce it
• Build capacity of animal and livestock production staff on pig ante- and post-mortem inspection skills/techniques
Policy challenges • Lack of official pig marketing and pig meat
transportation policies • Ensure policy guidelines/regulations to reorganize pig
marketing/trading system is developed • The development, support and implementation of
animal welfare strategic plan undertaken

81
Challenges Strategies to address the challenges
• Lack of policy for pig holding and slaughtering facilities
• Create enabling policy environments for the establishment of rural small-scale and urban large-scale slaughter facilities
• Develop policy guidelines, standard operating procedures (SOPs) and awareness campaigns on slaughter facilities’ hygiene and food safety
• Lack of policy for land allocation for pig production
• Lack of policy that gives incentives to private sector to invest in pig production
• Ensure policy related to land acquisition or long-term land leasing
• Develop and seek government approvals on appropriate policy incentives to encourage foreign direct investments, organizations and individuals to invest in commercial pig production, processing and marketing, building domestic pig auction markets, and pig products and kiosks consumption outlets
• Ensure sufficient infrastructure and access to feed sources for the production of feed raw materials (cereals, legumes, roots/tubers etc.) to supply large pig farms
• Introduce protective trade policies to encourage domestic private investment in pig production
Genetics challenges and strategies to address the challenges The genetic challenges and strategies for addressing them are similar to those in the family pig subsystem in Table 60.
Animal health challenges and strategies Apart from the low level of bio-safety measures in the commercial specialized pig subsystem, which can be addressed through implementation of a strict biosafety measures at farm level and HACCP at feed plants, the animal health problems and strategies to them challenge are similar to those in the family pig subsystem (refer to Table 60).
Feeds challenges and strategies These are the same as those in the family pig subsystem in Table 60. However, to deal with the serious feed shortage in the specialized system, suitable conditions for land allocation, and leasing of land to investors under the provisions of the current land laws, with major tax incentives on land use fees and lease time should be created.
Marketing and processing challenges and strategies These are the same as those of the family pig subsystem in Table 60.
Policy challenges and strategies These are the same as those of the family pig subsystem.
Intervention to achieve targets in commercial specialized pig systems The proposed expansion and up-scaling of the commercial specialized pig production system involves genetic, health and feed interventions alongside marketing and policy interventions. The genetic improvement measures involve importation of 4,000 tropically adapted pig sows and 200 boars for breeding and crossbreeding and establishment of 10 private and 10 public pig breeding and multiplication farms.

82
The animal health interventions involve strengthening disease control for priority pig diseases such as African swine fever, transmissible gastro enteritis, erysipelas, worms, and mange, strengthening biosafety facilities, and building staff capacity on national mandatory identification and traceability to achieve animal health and safe trade objectives. The feed interventions involve strengthening capacity of private small-, medium- and large-scale pig feed mills/processors and making land available for pig feed (maize and other cereal) production. See Table 64 for the detailed investment interventions. Investment requirements for transforming the pig sector The total 15-year investment requirement to transform the pig industry amounts to TZS 195.375 billion or USD 88.8 million over a 15-year period. Thirty-seven per cent (37%) of the investment which is TZS 73.202 billion or USD 33.145 million will be required in the first 5 years, followed by 35% in the second and the remaining 28% in the final 5 years. Most of the investment is in the first year due to capital items and requirements for setting a leap in production and value addition activities. In the first 5 years, overall the major portion of the investment is in animal health and product safety (33%) and marketing (29%). Out of the total investment, 22% is covered by the public and 78% by the private sector. The pig sector is basically of private interest and the public sector will play a major role in setting up regulations for the sector, the overall development and facilitation of activities in the sector and providing incentives to attract and encourage the private investors.
Table 64: Five-year investment cost to transform the family pig system and expand the commercial specialized system (2016/17 to 2021/22)
Type of investment Total (TZS million)
Budget Source %
1 Animal feeding (i) Strengthen capacity of 150 private small-scale pig feed
mills/processors to compound and distribute feeds to farmers 1,450 Public–35
Private–65
(ii) Strengthen capacity of public sector to regulate, and 30 private feed and meat processors to prepare own hazard analysis and critical control points (HACCP)
154 Public–100
2 Animal health (i) Strengthen disease surveillance at central and zonal veterinary
laboratories (procure capital lab equipment) 1,200 Public–45
Private–55
(ii) Train staff on novel lab technologies and methods to test blood/organ samples for early diagnosis of key pig diseases especially African Swine fever
180 Public–30
Private–70 (iii) Strengthen veterinary laboratories capacity: procure in-line and
offline feed quality analyzer equipment to check hazards, nutrient level, and residues
140 Public–100
(iv) Procure equipment to check/validate feed intoxication and biological contamination
72 Public–100
(v) Build laboratory staff capacity on residues validation testing procedures/methodology
460 Public–100

83
Type of investment Total (TZS million)
Budget Source %
(vi) Build capacity of meat inspectors in 100 local government areas (LGAs) for safe meat marketing
1,100 Public–40 Private–60
(vii) Equip pig abattoir and personal protective equipment (PPEs) for pig meat inspectors
1,056 Public–35 Private–65
(viii) Strengthen biosafety facilities and plans of 300 pig farms to control pig diseases.
5,280 Public–35 Public-private partnership 65
(ix) Build capacity of 100 LGA for cost-effective pig disease surveillance and control strategies
8,250 Public–15 Public-private partnership 85
(x) Strengthen biosafety infrastructures in 300 pig farms in 100 LGAs and national biosafety services
660 Public–45 Private–55
(xi) Facilitate pig identification, registration and traceability 2,200 Public–5 Public-private partnership 95
(xii) Build staff capacity on national mandatory identification and traceability to achieve animal health and safe trade objectives
550 Public–35 Private–65
3 Animal breeding
(i) Import 4,000 tropically adapted and productive pig sow breeds for breeding
4,400 Public–50 Private–50
(ii) Import 230 tropically adapted and more productive pig boar breeds for breeding
660 Public–45 Private–55
(iii) Facilitate to establish 10 private pig breeding and multiplication farms
232 Public–15 Public-private partnership 85
(iv) Facilitate to establish 10 public pig breeding and multiplication farms
408 Public–100
4 Research activities
(i) Identify risk factors for spread of African swine fever, including the role of wild pigs-argasidae-tick interactions in high risk areas
60 Public–100
(ii) Field test the efficacy of novel African swine fever virus diagnostic tests (lateral flow device (LFD) for early detection of virus antigen and ELISA to detect IgM) for the virus
30 Public–100
(iii) Modeling cost-effective measures for prevention and control of African swine fever
22 Public–100
(iv) Improve control and preparedness of pig farmers, Vets and public agencies for African swine fever
7,920 Public–100
(v) Diagnostic study on swine producer associations managerial, financial and organizational needs and planning to achieve operational efficiency
33 Public–100
5 Extension services (i) Establish 300 swine producers’ associations (SPAs) in potential
areas 2,280 Public–20
Private–80 (ii) Build capacity for 300 SPAs to revitalize and innovate to address
production, trade and development limitations 50 Public–10
Private–90 (iii) Build SPAs capacity to manage pig meat value chain (processing,
marketing) 100 Public–25
Private–75 (iv) Enhance leadership capacity to manage pig producer SACCOS,
production and marketing 230 Public–30
Private–70
(v) Build hands-on capacity to manage pig farm enterprise costs, manure processing and pig industry sustainability
275 Public–30 Private–70

84
Type of investment Total (TZS million)
Budget Source %
6 Commercial production, marketing and value addition
(i) Expand and upgrade the capacity of 50 large-scale specialized investors' pig farms
2,200 Public–5 Private–95
(ii) Establish 50 new commercial specialized pig farms for commercial pig production
4,400 Public–5 Private–95
(iii) Improve capacity of government staff to backstop 30 meat processors and 30 feed processors to implement their own HACCP
1,100 Public–40 Private–60
(iv) Construct pig marketing centres with slaughter facilities in 100 pilot LGAs
8,800 Public–10 Private–90
(v) Construct mechanized pig slaughter facilities, and processing plant with cold-storage for marketing of chilled pig meat to domestic and exports markets
5,280 Public–5 Private–95
7 Monitoring and evaluation (i) Institutionalize pig database and capacity for program and
monitoring 9,600 Public
(ii) Bi-annual evaluation of the transformational development in the pig industry
720 Public
(iii) Support to program coordination and asset management 1,375 Public
Total 73,202 Public–22 Private–78
Impacts Return on investment The return on the pig investment from the commercial specialized system is 22% and it is big enough to justify the proposed investment. The internal rate of return which is 22% ensures profitability.
Production impacts Pig meat production from the commercial specialized system increases from 3.3 thousand tonnes to 10.5 thousand tonnes over a 5-year period that constitutes a 219% growth.
GDP impacts The GDP contribution of the commercial specialized system increases from the current TZS 5.3 billion to TZS 26 billion in 5 years. With the additional investments, there is a fourfold increase in the GDP contribution of the specialized system.
Total pig meat production The total pig meat production from the family and commercial specialized systems increases by 69% over the 5-year period (2017–2022) likely attributed to good animal productivity and increasing number of intensive smallholders, and medium- to large-scale farmers.

85
Table 65: Total pig meat production with additional investment
Products Pig meat 2016/17 (in tonnes)
Pig meat 2021/22 (tonnes)
% change
Total pig meat from the traditional and improved family system
18,730 26,650 42
Total pig meat from commercial specialized system
3,295 10,541 219
Total Pig meat production 22,025.00 37,191.00 69
Source: LSIPT Livestock Sector Analysis (2017), MLF Tanzania Total GDP contribution Overall the GDP contribution of pig meat production increases from the current TZS 44 billion to 80 billion in 5 years, an increase of 83% from the base year. Table 66: Traditional and Improved Family and commercial specialized pig System GDP contribution with additional investment
Products Pig meat GDP 2016/17 (TZS millions)
Pig meat GDP 2021/22 (TZS millions)
% change
Traditional and Improved family pig meat subsystem contribution 38,576.20 54,433.90 41
Commercial subsystem pig meat contribution
5,397.6 26,042.1 382
Total meat contribution 43,973.80 80,476.00 83
Source: LSIPT Livestock Sector Analysis (2017), MLF Income With the additional investment and increase in productivity, the net income per sow increases by 3.1%, 10.2% and 57.1% in the traditional family pig, improved family pig and commercial specialized pig subsystems, respectively. The commercial specialized system sees the most significant incremental income benefit per animal followed by the improved pig family system. Table 67: Incremental income per sow
Pig subsystem Net income per sow 2016/17
Net income per sow 2021/22
Incremental income per sow
% change
Traditional family pig subsystem 803,714 829,113 25,399 3.1
Improved family pig subsystem 1,029,362 1,134,622 105,260 10.2
Commercial specialized subsystem 1,654,757 2,599,367 944,610 57.1
Source: LSIPT Livestock Sector Analysis (2017), MLF

86
Production-consumption balance The figure below shows that under the ‘business as usual’ or ‘without additional investment’ scenario, there is and there will be a substantial shortage of pig meat production to meet the current as well as the future domestic consumption demand. Even with the proposed additional investment the deficit will not be removed during the first five-year investment period, but it will become much narrower compared with the ‘without additional investment’ scenario. Figure 11: Projected pig meat consumption and production with and without additional investment (in thousand tonnes), 2017-2022
Source: LSIPT livestock sector analysis (2016), MLF Tanzania Table 68: Major activities timing and sequence: Gantt chart No. Type of investment 2017 2018 2019 2020 2021 1 Animal feeding
(i) Strengthen capacity of 150 private small-scale pig feed mills/processors to compound and distribute feeds to farmers
(ii) Strengthen capacity of public sector to regulate, and 30 private feed and meat processors to prepare own HACCP
- -
2 Animal health - - - - -
(i) Strengthen disease surveillance at central and zonal veterinary laboratories (procure capital lab equipment)
Production without additional investment
Production with additional investment
Consumption
20
25
30
35
40
2017 2018 2019 2020 2021 2022

87
No. Type of investment 2017 2018 2019 2020 2021 (ii) Train staff on novel laboratory technologies and
methods to test blood/organ samples for early diagnosis of key pig diseases especially African swine fever
(iii) Strengthen veterinary laboratories capacity: procure in-line and offline feed quality analyser equipment to check hazards, nutrient level, and residues.
(iv) Procure equipment to check/validate feed intoxication and biological contamination
- - -
(v) Build laboratory staff capacity on residues validation testing procedures/methodology
-
(vi) Build capacity of meat inspectors in 100 LGAs for safe meat marketing
- -
(vii) Equip pig abattoirs and avail personal protective equipment (PPE) for pig meat inspectors
- -
(viii) Strengthen biosafety facilities and plans of 300 pig farms to control pig diseases
(ix) Build capacity of 100 LGAs for cost-effective pig disease surveillance and control strategies
(x) Strengthen biosafety infrastructures in 300 pig farms in 100 LGAs and national biosafety services
(xi) Facilitate pig identification, registration and traceability
(xii) Build staff capacity on national mandatory identification and traceability to achieve animal health and safe trade objectives
- -
3 Animal breeding and genetics (i) Import 4,000 tropically adapted and productive pig
sow breeds for breeding - - -
(ii) Import 230 tropically adapted and productive pig boar breeds for breeding
- - -
(iii) Facilitate to establish 10 private pig breeding and multiplication farms
-
(iv) Facilitate to establish 10 public pig breeding and multiplication farms
-
4 Research activities 4.1 Develop capacity to control African swine fever and transform the pig industry in the
country (i) Identify risk factors for spread of African swine
fever, including the role of wild pigs-argasidae tick interactions in high risk areas
- - -
(ii) Field test the efficacy of novel African swine fever virus diagnostic tests (lateral flow device (LFD) for early detection of virus antigen and ELISA to detect IgM) for the virus
- - - -
(iii) Modelling cost-effective measures for prevention and control of African swine fever
- - - -
(iv) Improve control and preparedness of pig farmers, Vets and public agencies for African swine fever

88
No. Type of investment 2017 2018 2019 2020 2021 (v) Diagnostic study on swine producer associations
managerial, financial and organizational needs and planning to achieve operational efficiency
- - - -
5 Extension services 5.1 Build capacity of 300 swine producer associations (SPAs)
(i) Establish 300 SPAs in potential areas
(ii) Build capacity for 300 SPAs to revitalize and innovate to address production, trade and development limitations
(iii) Build SPAs capacity to manage pig meat value chain (processing, marketing)
(iv) Leadership capacity to manage pig producer SACCOS, production and marketing
(v) Build hands-on capacity to manage pig farm enterprise costs, manure processing and pig industry sustainability
6 Marketing and value additions
(i) Expand and upgrade the capacity of 50 large-scale specialized investors' pig farms
- - -
(ii) Establish 50 new commercial specialized pig farms for commercial pig production
- - -
(iii) Improve capacity of government staff to backstop 30 meat processors and 30 feed processors to implement their own HACCP
- -
(iv) Construct pig marketing centres with slaughter facilities in 100 pilot LGAs
- -
(v) Construct mechanized pig slaughter facilities, and processing plant with cold-storage for marketing of chilled pig meat to domestic and exports markets
- -
7 Monitoring and evaluation
(i) Institutionalize pig database and capacity for program coordination and monitoring
(ii) Bi-annual evaluation of transformational development of the pig industry
- - -

89
Conclusions Amid increasing demand for pig meat, pig producers require proper knowledge, skills and business investment plans to run their pig enterprises profitably. It is observed that under a ‘business as usual’ scenario, often without additional investment, there is and there will be a substantial shortage of pig meat production to supply the current as well as the future domestic consumption demands. Even with the proposed additional investment, the deficit will not be removed during the initial years of the first five-year investment phase, demand and supply gap for pig meat will get much more narrowed with the ‘additional investment’ scenario. The transformation of the commercial intensive pig industry will be driven by:
(i) Adoption of supplementary feeding in the traditional family pig subsystem and adequate production and supply of quality commercial feeds;
(ii) Assured herd health and a drive towards higher fertility and greater pig productivity through intensive smallholder, medium- and large-scale investments; and continuing improvements in herd fertility for the breeding herds;
(iii) A greater focus on indoor pig farming through progressive reduction of the numbers of free-roaming pigs and improvement of traditional units/holdings.
(iv) Strategic development of industrial pig farming/concentrations through invitation and support for foreign direct investments in pig farming as a special target for those in large commercial pig production farms (e.g. commercial specialized farming system);
(v) Supporting private sector investment in animal health and other pig farming technical and business development services;
(vi) Continued mainstreaming of smallholder pig production activities with commercial pig farms and meat processing plants, massive cereal production, feed processing, breeding activities, marketing and pig meat value addition (slaughter and processing);
(vii) Strengthening swine associations for producers, traders, processors by training and equipping them with knowledge and skills, and giving them access to credit through and collective marketing.

90
LEATHER DEVELOPMENT (HIDES & SKINS)

91
Tanzania tanneries industry has a total annual capacity to process 3.6 million hides and 12.8 million skins. The total installed capacity in the country is equivalent to 104 million square feet per year, with actual capacity utilization at around 86 % for hides and 61 % for skins of total annual processing capacity. The Tanzanian tanning industry produces mainly wet-blue leather. Crust and finished leather account for a smaller share of production. There are no tanneries producing high-fashion finished leather. The sector is estimated to employ about 1,000 people directly. It is estimated that, only five small firms produce leather footwear in the country and less than 200 workers are employed in the leather footwear sector (excluding micro / small enterprises employing less than 10 people).
There are around 40 micro, small and medium-size enterprises; and two large enterprises, which are involved in the manufacture of leather products and footwear. These account for the entire Tanzanian exports of finished leather. Some of these firms are also vertically integrated in the tanning sub-sector. Domestic and international markets for leather and leather products are growing. A stable demand for leather from large importing markets (United States, China, etc.) has been a key driver for expansion of the sector in the country. The expanding middle class in emerging countries (Brazil, the Russian Federation, India, China and South Africa - BRICS) add to this demand on Tanzanian leather products which in turn will prompt further expansion of the leather industry.
The leather sector, however, remains weak and most of the exports are in the form of traditional products, such as raw and wet-blue hides. A low degree of product diversification over the last decade reflects weak technology adoption, limited access to finance and a number of supply-side constraints. Challenges facing tanneries are also associated with unproductive investments where investments are made in equipment without a concomitant increased level of production, owing to the inadequate quantities and quality of raw hides and skins (H&S). Tanneries are therefore operating well below installed capacity.
Other challenges include growing requirements in terms of environmental compliance and standards, chemical controls (including the Registration, Evaluation, Authorization and Restriction of Chemicals Regulation) and weak customer service when dealing with the delivery requirements of buyers (e.g. grades, timing, etc.). However, the expanding domestic and international markets point to immense investment potential for this sector. Efforts need to be made to increase the domestic supply of raw materials by among others, increasing the capability and scale of the small-scale industry to provide secondary markets for large firms and by supporting local entrepreneurs.

92
Livestock sectoral analysis key findings on cross-cutting issues Introduction The productivity enhancing technologies and policy interventions with the greatest potential for contributing to achieving Tanzania’s national agricultural objectives include feed, animal health, and animal genetics development, cross border trade, private sector involvement, animal health services, artificial insemination, other livestock by products and employment. The constraints and opportunities related to these interventions were analysed using the livestock sector investment and policy toolkit (LSIPT).
Feed and Water Crop and livestock production are the dominant economic subsectors providing livelihoods, incomes and employment to more than 75% of Tanzania’s population. The livestock sector analysis showed feed and water are the most critical resource constraint to growth and modernization in the livestock sector. Though endowed with natural resources, a large resource base for the country’s millions of livestock, the utilization of grazing lands for sustainable livestock production is hampered by seasonal variations in the quality and quantity of forage etc. While the country also produces substantial amounts of cereals and root crops, whose residues are valuable feeds for livestock, these crops are produced primarily for human consumption and some are in short supply. The livestock feed deficit is aggravated by the effects of climate change on feed quantity and quality. Extended dry seasons, frequent droughts, erratic rainfall manifested by shifts in the onset and cessation of rainfall, and increased temperatures have drastically reduced the availability of both roughages and concentrate feeds. Pasture and water shortages have also led to overgrazing and resource conflicts between livestock keepers and other land users. The LSIPT was employed to measure the potential supply of forage, fodder and other feed resources and future requirements for cattle, sheep, goats, poultry and pigs in the three production zones and the specialized systems. Results indicated a clear shortage in feed and forage supply in the country, with available resources making up only 26% of required feed on average (with deficits in all types of rainfall years). Unless significant action is taken, projected shortages are set to worsen substantially over the next 15 years with available resources making up only 15% of the feed required. The central zone is expected to be the most severely affected since the systems there rely most on grazing, leading to increased mortality rates and poorer animal nutritional health. Interventions in this zone should focus on improving pasture productivity in the grazing lands and fodder conservation, and reducing the ruminant livestock population. In other systems and zones, the focus needs to be on intensified on-farm forage production, as well as commercial-scale feed production through irrigation where possible. The intensification of feeding programs, where feasible, should also be pursued in tandem with breeding programs to enhance the genetic potential of livestock.

93
Animal health More than 75% of Tanzanians live in rural areas, out of which about 37% keep livestock. The livestock population is estimated at 107 million animals, of which an estimated 88% are kept in smallholder traditional systems. Animal health services—through disease control and prevention—remain one of the main drivers of livestock production and productivity, along with feed and genetics. In 2015 alone, the Tanzanian government recorded 329 animal disease outbreaks involving 32 animal disease conditions and 24,231 clinical cases, causing 5,864 deaths. The control and prevention of animal diseases is a recurring and costly burden to individual livestock keepers, commercial herd owners and the local and national governments. Transboundary animal diseases and zoonosis are particularly important constraints to livestock production in pastoral and agro-pastoral areas and are by and large the most important constraint to herd health and trade in animals and their products. The main diseases constraining livestock production in Tanzania are Rift Valley fever, foot-and-mouth disease, peste des petits ruminants (PPR), African swine fever, Marek’s disease, Newcastle disease, contagious bovine pleuropneumonia (CBPP), brucellosis and East Coast fever. Based on expert opinion and data on animal diseases, the toolkit was used to assess qualitative and quantitative socio-economic impacts of diseases on household assets, markets/value chains and intensification of production, develop a priority list of animal diseases, and characterize the status of veterinary infrastructure in the country. This work sought to determine the optimal allocation of financial and human resources for surveillance, prevention, control and elimination of selected infectious diseases. The species targeted were food-producing animals: mainly cattle (beef, dairy), small ruminants (sheep and goats), chicken and pigs. The identified priority diseases7 hampering: • household assets were CBPP for cattle; Rift valley fever for small ruminants, African
swine fever for pigs; and Newcastle disease for poultry; • markets and value chains were foot-and-mouth disease for cattle; brucellosis for small
ruminants; African swine fever for pigs; and salmonellosis for poultry; and • livestock intensification were foot-and-mouth disease for cattle; PPR for small
ruminants; African swine fever for pigs; and salmonellosis for poultry. Inadequate resources including funds, skilled personnel and logistics have also weakened the ability of national veterinary services to contribute to reducing the impact of reported transboundary and zoonotic diseases and pests. Detecting, controlling and preventing these diseases requires a highly-coordinated public surveillance and response system at all levels in all areas of the country. The department of veterinary services needs to strengthen the country’s animal disease surveillance and reporting system including through empowering livestock communities to detect and report disease incidents to facilitate prompt responses to outbreaks.
7 The priority disease affecting each species are listed here. The other diseases can be found in the Tanzania livestock master plan.

94
Animal genetics The absence of effective livestock breeding and selection programs in Tanzania has hindered the supply of improved breeds to farming communities. Better coordination of the development and protection of animal genetic resources (AnGR) in Tanzania should involve the establishment of reliable and sustainable germplasm delivery systems and the involvement of the private sector in animal genetic improvement. Employing the LSIPT, an inventory and characterization of AnGR in Tanzania was undertaken. Management, conservation and maintenance policies and practices were evaluated for the three production zones in the country and the findings were discussed with key experts and main stakeholders from the private and public sectors. Crossbreeding local cattle should focus on the interbreeding of breed-types, taking advantage of additive gene action. It is recommended that for dairy, suitable exotic breeds include Friesian, and for dual-purpose (milk and meat), the best breed is Simmentals. For small ruminants, selection should focus on improving growth rates, crossbreeding indigenous stock with the Boer, Saanen, Dorper and Malya.
For poultry breeding, there is a need to develop a national recording program to help identify local breeds and strains for commercial production. Indigenous chickens need to be characterized and selected, and desirable traits for improvement and conservation established. Breeds developed elsewhere also need to be tested.
Inbreeding of pigs needs to be controlled and new or improved breeds introduced. The importation and multiplication of breeds with proven herd performance and track records should be undertaken by the private sector in line with MLF policy and oversight. This oversight will require the establishment and enforcement of a legal framework, including the development of an animal breeding policy and the implementation of the animal breeding bill currently being prepared. Livestock selection for genetic improvement needs to focus on:
(i) Ensuring effective breeding, selection and conservation programs are in place, including open nucleus breeding schemes and the renovation of public livestock farms and artificial insemination centres;
(ii) The establishment of data recording systems for on-station and on-farm breed evaluation programs for both locally-adapted and exotic breeds and their crosses; and
(iii) The provision of training and support to strengthen animal breeding infrastructure, such as artificial insemination and minus-one-element-technique laboratories.
Cross border trade
Livestock, livestock product and by product export and import is a key element in the livelihood systems of traders, pastoral and agro�pastoral populations in Tanzania. Export and import trade is supported by a network of regional cross�border trade. Responsible

95
ministry for livestock development have the mandate to enforce stipulated laws, rules and regulation related to livestock trade facilitation.
Challenges
Fail to adhere to laws, rules and regulations for livestock, livestock product and by product trade including illegal cross border trade particularly live animals and animal feeds and importation of livestock products from neighbouring countries without following the proper channels and required permits. Waiving of various taxes and levies for imported livestock products, inputs and importation of expired livestock inputs.
Strategies
1. Continuous control of livestock trade and its products 2. Strategic issuing and availability of livestock permits 3. Strategic issuing and availability of license. 4. Registration of production, storage, transportation, and selling premises for
livestock inputs 5. Strategic centers on stock routes, livestock products and livestock feed ingredients
for export in neighbouring counties. 6. Application of electronic system 7. Strategic supervision of primary, secondary and boarder markets
Private Sector involvement in value addition of livestock products and by- products
The Government has a role of creating a conducive environment to attract investments in the livestock sector. Some of the challenges to be addressed include presence of many Government regulatory bodies which causes unnecessary disturbances to the investors; un fare competition caused by importation of products from abroad especially inferior goods which leads to lack of markets of local products; many taxes in some products; and lack of reliable electricity for the industries.
There is a need of cooperation between the government and private sector especially to invest in livestock processing plants (milk, meat and leather) and rehabilitation of abandoned industries.
Milk Processing Industries in Tanzania in 2016/2017 There are 81 milk processing industries in Tanzania which has a capacity of processing 276.55 million litres per year. Currently there are 65 working industries which has a capacity of processing only 40.13 million litres per year which is 14.5%.
Challenges:- i) Availability of long term capitals which has low interest rate ii) Some businessman fails to pay back the loan iii) Uncontrolled sales of milk which leads to loss of government revenue iv) More than 20 % of milk are imported through black markets v) Access and availability of raw milk as raw materials for working industries vi) Availability of cold chain

96
Table 69: Milk processing Industries in Tanzania (2016/2017) No. Region No of
Industries Name of Industry Processing
Capacity (Litres/day)
Status Current Processing capacity (Litres/day)
% capacity
1. Arusha 14 Northern Creameries
30,000 Not working
- -
International Dairy Products
10,000 Working 3,500 35.00
Mountain Green Dairy
1,500 Working 1,000 66.67
Agape Dairy Group
500 Working 200 40.00
Jitume Dairy Group
300 Working 150 50.00
Idafaso Dairy Group
300 Working 100 33.33
Inuka Dairy Group 500 Working 300 60.00
Kijimo Dairy Cooperative
1,000 Working 500 50.00
Ayalabe Dairy Cooperative Society
1,500 Working 400 26.67
Uvingo Dairy 1,000 Working 500 50.00
Grand Demam 15,000 Working 2,000 13.33
Prince Food Technologies
2,000 Working 400 20.00
Hillside Dairies 1,500 Working 400 26.67
Nasinya Dairy Ltd 300 Working 150 50.00
13/14
2. Dar es Salaam
8 Bakresa Food Products
10,000 Working 8,000 80.00
Profate Dairy Investment
2,000 Working 800 40.00
Manow Dairy 1,000 Working 300 30.00
SADO Farm Dairy 1,000 Working 500 50.00
Fabian and Family Co. Dairy
1,500 Working 500 33.33
TAMU Milk 500 Working 150 30.00
Dairy Daily 500 Working 300 60.00
Milk Com 100,000 Working 26,000 26.00
8/8
3. Iringa 2 Mafinga Milk Group 600 Working 100 16.67
ASAS Dairy 50,000 Working 14,000 28.00
2/2

97
No. Region No of Industries
Name of Industry Processing Capacity (Litres/day)
Status Current Processing capacity (Litres/day)
% capacity
4. Kagera 6 Kagera Milk 3,000 Working 400 13.33
Kyaka Milk Plant (Mgando)
1,000 Working 450 45.00
Kihanga Milk 500 Not working
- -
Kagera Mgando 1,000 Working 300 30.00
Kagoma Ranch 800 Working 200 25.00
Delco Food Ltd 1,000 Working 300 30.00
5/6
5. Kilimanjaro 11 Nronga Women 2,000 Working 800 40.00
West Kilimanjaro 2,000 Working 800 40.00
Mboreni Women 1,000 Working 300 30.00
Marukeni 1,000 Working 450 45.00
Foo Dairy 1,000 Working 200 20.00
Ng'uni Women 1,000 Working 350 35.00
Kalali Women 1,000 Working 300 30.00
Fukeni Mini Dairies 3,000 Working 500 16.67
Kilimanjaro Creameries
10,000 Working 4,000 40.00
Neema Dairies 500 Working 300 60.00
Kondiki Small Scale Dairy
4,000 Working 1,000 25.00
11/11
6. Lindi 2 Lindi Dairy 500 Working 200 40.00
Narunyu Sisters Dairy
500 Working 300 60.00
2/2
7. Manyara 1 Nasinya Dairy Ltd 400 Working 200 50.00
1/1
8. Mara 9 Musoma Dairy 120,000 Not working
- -
Baraki Sisters 250 Working 100 40.00
Nyuki Dairy 3,500 Working 1,200 34.29
Mara Milk 16,000 Not working
- -
Kwetu milk 200 Working 100 50.00

98
No. Region No of Industries
Name of Industry Processing Capacity (Litres/day)
Status Current Processing capacity (Litres/day)
% capacity
Bwai Milk 300 Working 100 33.33
Mema Milk 500 Working 150 30.00
Musoma Milk Group
1,200 Working 700 58.33
AFRI Milk 400 Working 100 25.00
7/9
9. Mbeya 3 Lwis Milk 300 Working 150
Mbeya Maziwa 1,000 Working 800 80.00
Malt Uyole 1,000 Working 200 20.00
3/3
10. Morogoro 5 SUA 200 Working 100 50.00
Bakilana Dairy 500 Working 300 60.00
Shamo Dairy 300 Working 100 33.33
Twawose 500 Working 200 40.00
Shambani Graduates
3,000 Working 1,500 50.00
5/5
11. Mwanza 2 Mother Dairy-Sengerema
1,600 Working 300 18.75
Tukwamuane Dairy 500 Working 200 40.00
2/2
12. Njombe 1 Njombe Milk Factory
6,000 Working 4,200 70.00
1/1
13. Pwani 2 Chawakimu Cooperative
1,000 Working 500 50.00
Mother Dairy Ltd 3,000 Working 2,000 66.67
2/2
14. Rukwa 1 Motherland Dairy 5,000 Working 800 16.00
1/1
15. Ruvuma 2 Mother Dairy Ltd 300 Working 200 66.67
Ruvuma Dairies 500 Working 300 60.00
2/2
16. Shinyanga 2 Saweka Cooperative
200 Working 150 75.00
Propavet Dairies 500 Working 200 40.00

99
No. Region No of Industries
Name of Industry Processing Capacity (Litres/day)
Status Current Processing capacity (Litres/day)
% capacity
2/2
17. Simiyu 2 Lamadi Milk (Busega)
400 Working 100 25.00
Meatu Milk 1,000 Working 200 20.00
2/2 18. Singida 1 Singidani Dairy 500 Working 300 60.00
1/1
19. Songwe 1 Ushirika wa Maziwa wa Vwawa
5,000 Working 200 4.00
1/1
20. Tabora 2 Uhai Mazingira (Sikonge)
200 Not working
- -
New /Tabora Dairies
2,000 Working 500 25.00
1/2
21. Tanga 4 Tanga Fresh Ltd 160,000 Working 41,000 25.63
Ammy Brothers Ltd 1,000 Working 250 25.00
Irente Farm 1,000 Working 300 30.00
Montensory Sister’s
1,000 Not working
- -
3/4
22. Unguja 1 Azam Dairy 150,000 Working 25,000 16.67
1/1
Total 82 757,550 154,100

100
Leather Processing Industries The Government has continued to encourage private sector to invest in leather processing industries in Tanzania. Through the involvement of private sector the leather industries there is 9.
Table 70: Leather Industries in Tanzania (2017/2018) NO NAME OF INDUSTRIES PLACE PROCESING CAPACITY
(Feet2) STATUS
Cattle Sheep/ Goats
1 Lake Trading Co. Ltd Kibaha 90,000 420,000 Working
2. Himo Tanneries and Planters Moshi 90,000 900,000 Working
3 Sak International Ltd Arusha 450,000 900,000 Working
4 Ace Leather Ltd Morogoro 1,200,000 3,600,000 Working
5 Salex tanneries Ltd Arusha 624,000 1,500,000 Working
6 Moshi Leather Industries Ltd Moshi 180,000 1,200,000 Working
7 Afro Leather Industries DSM 300,000 700,000 Not Working
8 Hua Cheng Dodoma 900,000 1,500,000 Not Working
9 Xing Hua Investment Shinyanga 900,000 2,100,000 Not Working
TOTAL 4,734,000 12,820,000
Meat Industries in Tanzania Tanzania has 32 meat processing industries which has the capacity of processing 626,992 tons of meat per year. Currently the processing capacity is 81,220 per year.
Table 71: Meat Industries in Tanzania in 2016/2017
NO SLAUGHTER SLAB/ INDUSTRY LOCATION CAPACITY/DAY STATUS
1 Alpha Choice LTD-Magu Magu Cattle 80 Working
2 SAAFI Ltd Sumbawanga
Cattle 150, Sheep & goats 150 Working
3 Orpul Ltd Simanjiro Cattle 40, Sheep & goats 40 Not working
4 Arusha Meat Company Arusha Cattle 300, Sheep & goats 400
Working
5 Mtanga Farms Iringa Iringa Cattle 80 Working
6 Peramiho Songea Cattle 40 Working
7 Triple S Company Shinyanga Cattle 500, Sheep & goats 700
Not working

101
8 Tandan Farms Iringa Mkuranga Nguruwe 100
Not working
9 Happy Sausage Arusha Nguruwe 100 Working
10 Kuku Poa Mwanza Kuku 5,000 Working
11 Interchick Dar es salaam Kuku 3,000 Working
12 Kijenge Farms Arusha Kuku 4,000 Working
13 Kiliagro Moshi Kuku 4,000 Working
14 Mkuza Chicks Kibaha Kuku 5,000 Working
16 Aman (Endanahai) Babati Kuku 4,000 Working
17 Al Kafir Co.Ltd Dodoma Cattle 300, Sheep & goats 3,000
Working
18 Fudar Enterprise Co Dodoma Cattle 200, Sheep & goats 1,000 Not working
19 S and Y Group Meat Co. Ltd Dodoma Cattle 200, Sheep & goats 1,000 Working
20 Ali Allaba Company Ltd Bagamoyo Cattle 400, Sheep & goats 3,000 Not working
21 Fan Hua Investment Co. Ltd Shinyanga Punda 100
Working
22 Chobo Investment Ltd Mwanza Cattle 360, Sheep & goats 400
Working
23 Manispaa ya Iringa Iringa Cattle 200, Sheep & goats 200
Not working
24 Nguru Hills Ranch Mvomero Cattle 150, Sheep & goats 200, chicken 16,000
Not working
25 Kampuni ya Ranchi za Taifa (NARCO) Ruvu Cattle 800
Not working
26 Mitoboto farms Ltd Kibaha Cattle 3000 Working
27 Brich Company Ltd Ubungo DSM Pigs 20 Working
28 Huacheng International Ltd Dodoma Donkeys 40 Working
29 Buibui Investment Ltd Kibaha Ostriches 5 Working
30 Meat King Ltd Moshono Arusha Pigs 3 and cattle 7 Working
31 Zheng He International (T) Ltd Temeke Ofoals 4 tons
Working
32 GES Company Ltd Kinondoni Meat 8 tons Working
102
The Tanzania Livestock Sector Reforms
i) Animal Health Services
Before 1986, the Government provided most of the veterinary services, both public and private. Following the introduction of a pluralistic political system and free market economic policies in late 1980s, the Government started to embark on several reforms that resulted in hiving-off a number of commercial related services to the private sector and concentrating on regulatory, policy formulation and law enforcement functions. Government Reforms and Veterinary Services Privatization Preceded by the Sector Reforms, the Privatization of Animal Health Services was equally affected by the removal of Government support to Livestock Extension and Input-supply (drugs, pesticide chemicals, and vaccines). The Public Sector Reforms (PSR), which included the Civil Service Reform (CSR), Agricultural Sector Reform and the Local Government Reform. The PSR prescribed the main areas to remove government’s funding especially those which are contestably attractive to the private sector in 1992. The basic vision is that the roles of central government and sectoral ministries be confined to policy making, regulation, periodical performance monitoring or assessments and intervention to ensure the legality of public services provision. These reforms, culminated in developing a new Agricultural and Livestock Policy of 1997 (NALP 1997). The agricultural sector reform, restructured the livestock services delivery system starting with the separation of functions that should be performed by the private sector, public sector, and those that should be shared. However, the Livestock Policy (2006) which is a part of the NALP 1997, prefered a cautious approach in implementation of new mandates. For example, as far as privatization of livestock services is concerned, the policy provides under section 3(iii) that: “the privatization of veterinary services and drug supply will be gradual, starting in urban and peri-urban areas where services can easily be provided by the private sector”. The NALP 1997 envisaged that veterinary services and drug supply in rural areas would remain under government control in the near future. The Local governments reform program of 1999, introduced the new local government system based on political devolution and decentralization of functions and finances within the framework of a unitary state. It came with the re-deployment of sector ministries’ staffs to the districts or local government authorities (LGAs). Under this system LGAs are a holistic institutions, i.e. they are multi-sectoral in operations, representing government units with legal status, operating on the basis of discretionary, but general powers. However, despite the implementation of these reforms, still they had observable effects to the division of responsibilities between state veterinary officers and private veterinary officers, especially as far as provision of private good veterinary services in rural areas is concerned. The Animal Health Strategy of 1998 and Privatization The animal health strategy was to devise means for efficient utilization of both public and private veterinary sectors in accelerating efforts towards reduction of animal diseases, morbidity and mortality and protect livestock and livestock consumers against infections, pests and diseases. The overall principle embedded in the strategy is that farm level disease control is the responsibility of the livestock keeper and services such as the procurement and distribution of veterinary especially drugs, vaccines and other livestock inputs supplied by the private veterinary sector. The role of the government be limited to the control of

103
epidemic and infectious diseases outbreaks, sanitary control, inspection and controlling pests and related diseases, which are in such a magnitude that individual farmers cannot control. The Strategy provides a summary on how the private and public sectors will share or divide among themselves the veterinary services. Livestock Sector Reforms and Animal Health Services Delivery
The national government stopped providing animal health services among several agricultural and social services in the country in 1992. The efforts to implement these reforms resulted into limited success, it has resulted into the division of roles (still in papers), the privatization of clinical veterinary services, management of livestock infrastructures, and drug distribution (through veterinary clinics and Agrovet shops) accompanied by attempts to induce government veterinarians to leave government services and enter private practices. However, as the Livestock Policy portrays, successes of such a move will highly depend on ability to cultivate a clientele able to pay for the services. This means privatization though is a step in the right direction, but it will not be able to succeed in the near future and help the majority of agro-pastoralist and pastoral livestock producers who are also subsistence herders. As such, the hiatus left by the government withdrawal from the provision of private veterinary services, will be much more felt in rural areas than in urban and peri-urban areas, where private veterinary services is prominent. The inability of some livestock keepers to pay veterinary service fees, normally leads to breakdowns pf services. There is also a potential lack of cooperation or participation of local government authorities, which further undermine the effectiveness of veterinary services delivery. Reasons for Privatization of Veterinary Services in Tanzania.
In Tanzania, the growing fiscal deficits to support public livestock services, and the huge economic costs of an inefficient pubic livestock services have renewed the interest to transfer (selectively) the delivery of important livestock services from public to private sector. These services includes veterinary surveillance and diagnostics, animal diseases and vector controls, vaccinations, clinical treatment of sick animals, inspection of livestock products, and veterinary research and extension.
However, from the point of view of the Tanzania Livestock Master Plan (TLMP), the supply of private veterinary services will be determined by profitability and several other factors arising from economies of scale, such as the size of the livestock enterprises in the locality, the nature of potential and actual animal diseases, and the types of animals raised in the production systems. It follows that, where private veterinary work is unprofitable or where other types of market failure occurs, both economic and or social concerns may make some type of public intervention necessary.
The Current Strategies in the Delivery of Veterinary Services Within the confines of TLMP framework, it’s emphasized that, veterinary or animal health services will be done in modified ways through a policy of selective privatization and support. The latter means, while the public sector (in collaboration with development partners staff and through public veterinarians and para-veterinary staffs) will assume all
104
roles of delivering quality animal health services where the private sector cannot viably deliver. The private veterinary sector will provide animal health services in moderate to high potential livestock areas and for those services that are commercially contestable.
On the contrary, the public sector may transfer the delivery of all animal health services which have limited business attractions and those which are of a public good to the private sector by co-opting the latter on short-term contract basis or by other collaborative arrangements). In this arrangements, the private sector will do specialized short-term animal health service tasks in remote underserved areas to safeguard public good and serving livelihoods. The government will retain and fully support livestock extension (for a short transient period), training and research to complement private services and ensure the success of such transfers. Being a catalytic development agent of the livestock sector, the government may grant in-kind seed capital to livestock communities to initiate or revamp a dying or slumbering livestock service. For example, the government may fund the procurement and distribution of starter supplies of seed acaricides to revamp a previously dead farmer-managed dipping scheme or routine vaccination campaigns for diseases like New Castle Disease, brucellosis, anthrax etc.
Delivery of Preventive Animal Health Services
The Tanzania Livestock Master Plan (TLMP) clearly emphasize that “the threats posed by endemic and epidemic animal diseases in Tanzania need to be urgently addressed. Effective disease control and prevention through efficient animal health services delivery is a perquisite to transform the livestock industry”. The TLMP states that “improved preventive animal health services needs to be able to control all priority transboundary animal diseases (TADs) and neglected zoonotic diseases (NZDs) hindering production and catalyze livestock intensification, investment and innovation”.
"In many arid and semi-arid parts of the country, it would be the roles of the government and its partners to provide required services like mass livestock vaccination campaigns. The public sector and partners must strive to reach as many animals as possible. In these areas, vaccinations will be a strategic option focusing to help affected remote communities out of the risk of epidemic disease and their socio-economic effects in the societies. These campaign must be done early in dry season (for predicted diseases); otherwise in the rainy periods, rains may completely cut off or make them extremely difficult to access, and a huge number of animals risk being trapped in an impossible disease situation,"
The TLMP’s noble approach to ensuring the remotely placed subsistence livestock keepers (keeping the majority of beef animals) and urban smallholder livestock farmers (keeping high value dairy herds) albeit has access to and able to buy and utilize the expensive but very efficient East Coast fever (ECF) vaccines. Such access to essential vaccines will be supported through local (LGAs) and central government or its development partner’s catalytic subsidization support.
Under the supervision of a government veterinary personnel, the public sector will execute monitored arrangement where the private supplier(s) will be obliged to sell ECF vaccine and

105
vaccination services at an agreed/prescribed price charging the deference of the actual price from the subsidized amounts instead of a full cost recovery and contract delivery which is comparatively expensive. The same arrangement can be implemented to supply acaricides to maintain a steady dipping scheme in different LGAs and regions in the country.
ii) Establishment of the Organ/Agency
Many livestock services and infrastructures are operating in efficiently (under capacity) due to lack of resources and proper coordination. There is need for Government to conduct a study and see to it if there is a need of establishing an agency which will supervise and operates livestock infrastructure such as, animal breeding, pastures, water points, animal health and marketing.
Artificial Insemination Service in Tanzania
Historical Background AI services in Tanzania started way back in 1958 by white settler farmers in the northern part of the country. As the demand for grade dairy cows kept rising, the Ministry of Agriculture, by then opened up a semen production centre at Mpwapwa in 1966. This centre first produced liquid semen, but later in 1968/69 changed to deep frozen semen that was issued free of charge to AI schemes with the intention being to get smallholder dairy to participate in AI services.
New sub-centres were opened up later in Kilimanjaro, Arusha, Tanga, Mbeya, Mara and Kagera regions. Most of these AI sub-centres were being supplied by semen from Mpwapwa. The newly started AI scheme soon collapsed due to problems emanating from irregular semen supply, liquid nitrogen (LN2), inadequate funds and lack of follow up of the services.
During the early 1960’s to 1980’s A.I field services were directly under NAIC and with support from Regional Development Directors, and Regional Livestock Development Officers. Between 1980’s and 2000’s support of these services shifted from state support to stakeholders mainly by development partners under dairy development programmes which were mainly operating in Southern Highlands (SHDDP) supported by the Swiss government; Kagera region by KALIDEP and Tanga region by TDPP supported by the Dutch and the Austrian Government under Austro project which was supporting Mara and Coastal regions. Under dairy development programmes most of the semen use was being imported from abroad mainly from the Netherlands and the USA from progeny tested sires and was basically used in inseminating cows (Zebu and Boran) for the purpose of crossbreeding to get F1 heifers for distribution to aspiring dairy farmers in the project areas.
Outside the dairy development programmes areas, farmers continued to use NAIC semen for inseminating their animals despite its associated problems. Even in some project areas NAIC semen was being used, mainly because of being relatively cheaper and easily available

106
compared to imported semen (sold at 600/- TZS against 1950/- TZS per straw). Most inseminators and farmers preferred imported semen, because NAIC semen exhibited low motility ranging between 40% and 55%, while imported semen ranged between 65% to 85% motility (KALIDEP report –Dairy conference). The low motility semen was reflected in higher number of inseminations per pregnancy for NAIC semen when compared to imported semen. For this reason Dairy programmes preferred imported over NAIC semen. Moreover, there were other attempts within AI services and dairy development programmes, to privatize A.I field services and traces of privately based A.I services are evident today in the country.
When these programmes phased out during the mid-2000’s and in line with decentralization of livestock services and sensitization on the involvement of the private sector, A.I field services became the responsibility of Local Government Authorities (LGA) and the private sector. To date over 1000 public and private A.I technicians are said to be operating in the country under LGAs or privately employed. These inseminators have been trained at NAIC under the sponsorship of LGAs, Non-Government Organizations (NGOs), Dairy Development Programmes and the private sector.
A.I field technicians are operating either as LGA’s employees, self-employed or as privately employed by private organizations like farms or registered veterinary facilities in urban areas. These technicians have equipment for storing and transporting semen and LN2, and insemination gear.
Current Status of Artificial Insemination in Tanzania
AI services in the country include the following;
• Semen and Liquid Nitrogen production • Artificial insemination field services • Training of Inseminators
Production of Semen, liquid nitrogen and training of Inseminators is done by the Government with some cost sharing. The main reason is to ensure production of quality semen from good quality bulls. Presently semen is produced at NAIC and distributed to the zonal AI centers located in Mwanza, Dodoma, Mbeya, Lindi, Kibaha and Mpanda or through private inseminators; who practice field services which were privatized since 1997. The prices of semen have set to be 3,000/= in regional level and 5,000/= at District level.
Other livestock by-products
Other livestock by-products of economic importance include wool, blood, bones, horns, hooves, bristles, feathers, hair and fur. These livestock by-products are used for different purposes such as manufacture of animal feeds, medicines and garments.
Issues
Promotion of sustainable production and use of these by-products is limited by inadequate knowledge, lack of code of practice and procedures on production, handling, processing and inappropriate technology.

107
Objective
To promote production and utilization of other livestock by-products for the provision of industrial inputs and income generation to livestock producers and traders.
Interventions
i. Efforts will be undertaken to promote production and utilization of other livestock by-products.
ii. The Government will encourage and promote establishment of processing and handling facilities for other livestock by-products.
iii. The Government will promote and support research on better use of other livestock by-products.
iv. The Government in collaboration with other stakeholders will strengthen marketing information and support services.
v. The Government will institute and strengthen quality control of other livestock by-products.
Contribution of Livestock Sector to the Employment
There are 4.493 million households owning livestock and majority being poultry and cattle. Each household has about five members which makes about 22.5 million people who engage in livestock which is estimated to be 50% of population of Tanzania. The livestock industry has an important role to play in building a strong national economy and in the process, increasing their incomes and employment opportunities’. It is a source of employment for millions of family labourers and hired external labour in Tanzania. During implementation of the first phase of TLMP it is estimated to have additional of approximately 2 million people who will be employed in livestock sector.
Priority and complementary institutional and policy recommendations
The review of existing policies, institutions, laws and regulations highlights a lack of enforcement capacity and the need to modify out-of-date policies are priorities. Land allocation and tenure regulations particularly need to be revised to encourage private sector investment in feed production to alleviate severe shortages. Key policy priorities in related areas include:
(i) Offering incentives for the private sector involvement in veterinary service provision in rural areas, including cost sharing for the prevention and control of diseases of economic importance;

108
(ii) Establishing a reporting system for the collection of veterinary drugs/vaccines performance at all levels;
(iii) Strengthening enforcement of the Animal Disease Act 2003 for poultry and the Grazing Land and Animal Feed Resources Act 2010, building the capacity of animal feed and meat inspectors, and formulating and enforcing poultry feed inspection guidelines and bio-security and other relevant disease control guidelines;
(iv) Taking measures to promote investment in processing facilities for hides and skins, and ensuring enforcement of relevant trade regulations;
(v) Strengthening market price and related information for live animals and products (i.e. hides and skins);
(vi) Introducing policies and enforcing laws on rangeland improvement: designating grazing areas in rangelands owned by livestock farmers; encouraging environmentally friendly tsetse control; mandating dipping and vaccinations; and incentivizing the adoption of climate change adaptation and mitigation practices;
(vii) Ensuring the implementation of the draft animal breeding act is accompanied by the provision of sufficient human resources and infrastructure and the establishment of livestock breeders’ associations;
(viii) Enforcing the Grazing Land and Animal Feed Resources Act 2010, and promoting the commercialization of maize and soybean production for livestock feeds, and contract farming for feed raw materials, such as soybean;
(ix) Reducing the high costs associated with livestock research by increasing investment in facilities, infrastructure and human resources, mandating more inclusive associations and platforms of experts to promote collaboration among researchers and with other stakeholders, including the private sector;
(x) Increasing the quantity and quality of extension staff and associated infrastructure
and facilities, and clearly delineating roles and responsibilities between ministry and local government authorities;
(xi) Strengthening the national livestock identification, registration and traceability system through the addition and enactment of a legislative amendment enabling the private sector supply of identification devices;
(xii) Reducing social conflict between livestock farmers and other land users, and land
degradation from overuse, by strengthening livestock extension support services, legislating the demarcation of land for grazing, and the formation of pastoral and agro-pastoral associations;
(xiii) Building the capacity of livestock ministry staff to conduct detailed economic and
statistical analysis, develop implementation roadmaps, formulate policies and evaluate the outcomes.

109
Tanzania Livestock Master Plan Conclusions
The ex-ante impacts of the livestock master plan roadmaps demonstrate that investing in the development of the livestock sector during the ASDP II phase could reduce poverty and improve the food security of rural people, as well as make livestock an increasing contributor to national income growth (GDP), and also to exports and foreign exchange earnings. For the specific value chains and interventions, the main conclusions and implications of implementing the livestock master plan roadmaps through ASDP II, as well as conditions critical to achieving success, are as follows: Dairy cow development The projected increase in national cow milk production as a result of the proposed interventions including artificial insemination, hormone synchronization, multiple ovulation and embryo transfer combined with improved feed and health services, value addition and complementary policy changes during the ASDP II period (2017–2022) is 77% or a surplus of 1,002 million litres over projected domestic consumption requirements. This production increase would make it possible to meet the milk production targets in the ASDP II phase, exceeding the growing domestic demand for milk by 35%. Due to increases in the number of crossbred dairy cows of 281% and milk production per cows by 26% (42%), the contribution of the dairy sector to GDP is expected to rise by 75%. The critical conditions needed for the success of the cow dairy roadmap are:
(i) Promotion of investment in long shelf life milk products, such as UHT, milk powder and other value-added products like yogurt, ice cream and cheese etc;
(ii) Introduction of quality-based standards and pricing to encourage quality milk supply; (iii) Strengthening of enforcement of milk and milk products quality standards and
comprehensive grading and pricing policies; (iv) Formalization of milk trade through the training and licensing of milk traders. (v) Up scaling of the ongoing school milk feeding programs to promote consumption; (vi) Building of the capacity of the dairy technology training institute(s); (vii) Introduction of protective trade policies including higher import tariffs or bans on
imported milk products and/or subsidies for domestically-produced milk products; (viii) Reduction in bureaucracy and promotion of investment in the dairy industry; (ix) Development and implementation of an effective land acquisition policy for dairy
investments (preferential treatment for accessing land for specialized dairy production, milk processing and feed production); and
(x) Provision of incentives for investors to establish dairy processing plants and commercial specialized dairy farms.

110
Red meat development The proposed combined interventions for red meat production on traditional family farms and commercial ranches, as well as feedlot development, would result in a 52% increase in total red meat production. Production would grow to 742,500 tonnes between 2017 and 2022. This would not, however, meet expected consumption growth of 71% by year 2022 (to 867,302 tonnes), leaving a 17% deficit (124, 800 tonnes) in the 2017–2022 red meat production and consumption balance. Due to extremely limited access to land for grazing and feed production, and limited ability to enhance the genetic potential of local ruminant breeds in the medium-term mean, it is unlikely that the red meat production gap can be closed in the next five years. Even with a substantive increase in the supply of red meat from small ruminants—with goat meat and mutton currently accounting for 14% and 4% respectively—this is unlikely to significantly help close the projected meat consumption/demand gap as beef accounts for 82% of the red meat production in Tanzania. Given the rapidly growing population, and increasing incomes and demand for animal-source foods in Tanzania, such projected deficits would be expected to put upward pressure on red meat prices. Moreover, meeting the growing red meat export goals in the ASDP II period would also be extremely difficult. To be successful, the red meat/milk interventions need to be supported by:
(i) Development of the meat technology training staff, and the provision of training to meat processing staff;
(ii) Promotion of forward contracting by feedlots and abattoirs; (iii) Investment in export infrastructure for animal holding and quarantine centres, as
well as in programs for disease surveillance, monitoring of abattoirs, animal identification and traceability etc;
(iv) Strengthening of the animal health regulatory capacity at national and local levels under the coordination of the MLF;
(v) Development of strategic capacities spearheaded by staff working in the Agricultural Sector Development Program II;
(vi) Building of a key infrastructure to support the marketing and processing of livestock and livestock products;
(vii) Development and implementation of standards on meat and feed quality control and enforcement and grading, and pricing policies;
(viii) Introduction of trade policy to reduce the importation of cooking oil and grain flour whose raw materials can be used to increase and improve livestock feeds;
(ix) Development and implementation of policies protecting and enhancing animal welfare;
(x) Development of clearly defined guidelines on the right to access and use land and the implementation of appropriate land policies;

111
(xi) Refraining from uncritically gazetting grazing land, to make land currently held for conservation purposes accessible for pastoral production.
Poultry development Successful poultry interventions would allow the subsector to move to improved family poultry with semi-scavenging crossbreeds and for substantial increases in the scale of specialized layer and broiler operations. Such a transformation—depending on successful interventions in the areas of breed selection, health services (particularly in treating Newcastle disease), feed, extension, private investment and trade policies—would contribute considerably to improving food and nutrition security and household incomes, as well as the contribution of poultry to GDP by 182%, from TZS 256 billion to 723 billion, and to substantial contributing closing the production–consumption gap for meat. Projected annual chicken meat and egg production in Tanzania would rise to 465,600 tonnes and 4.2 billion eggs, respectively. This would bring the production-consumption deficit for chicken meat from 130,000 to a surplus of 258,000 tonnes between 2017 and 2022. The combined interventions would result in increases of 666% and 40% respectively in chicken meat and egg production by 2022. Such accomplishments would enable Tanzania to meet the chicken meat and egg demand for its growing population, and produce a very significant surplus for domestic industrial use or export. Perhaps most importantly, the growth of the poultry subsector would enable Tanzania to close the total national meat production-consumption gap (see Figure 3). It would also contribute to the reduction of greenhouse gas emissions from total meat consumption. Taking advantage of the benefits of the potential poultry revolution would thus require substantial investments in promotional activities to shift tastes and preferences away from beef and mutton, as well as from local chicken meat and eggs, towards exotic chicken meat and eggs. Moreover, if the surplus chicken meat could substitute for domestic red meat consumption, this would also enable meat exports (of beef, mutton and goat meat) to be increased to raise foreign exchange earnings, in line with the government’s meat export policy. Furthermore, the surplus eggs created could be also processed into egg powder and used domestically for new or additional industrial uses (e.g. in the baking industry), or exported as egg powder to raise foreign exchange earnings. The above benefits can only be realized with the:
(i) Establishment of an efficiently functioning private day-old-chick’s industry and effective distribution system of the birds for the specialized poultry farms.
(ii) Facilitation by government of the establishment of investment in the poultry agribusiness sector through the reduction of bureaucratic obstacles.

112
(iii) The allocation of land for the establishment of poultry farms and production of feed. (iv) Promotion of large-scale private investment in poultry processing plants to produce
value added products for industrial uses or to meet consumer demand for processed egg and meat products—through the provision of favourable taxation levels and provision of local interest loans to investors.
(v) Establishment of a mechanism to encourage low-cost production and formulation of poultry feed critical to the success of specialized poultry farms.
(vi) Facilitation of links between specialized chicken and egg producers with processors, ensuring regular access to market outlets, and both with maize producers and cooking oil plants, ensuring a regular supply of feed.
(vii) Use of public-private partnerships in the manufacture and distribution of quality vaccines needed to keep exotic chickens healthy, where the private sector will not invest.
(viii) Encouragement of farmer groups and cooperatives to establish out grower schemes for pullet production and distribution, mini-hatcheries, and feed processing plants and slaughtering facilities.
Pig development The proposed combined interventions for improved family and expanded commercial specialized pig production systems would result in a 69% increase in pig meat production. Production would grow from about 22,000 to 37,200 tonnes between 2017 and 2022. The development of a competently market-oriented farming, processing and a dynamic marketing sector, operating in more sustainable and climate-smart ways, supplying consumers with high-quality and safe pig meat/pork would significantly contribute to increased household income, food and nutrition security, poverty alleviation, as well as increasing the contribution of pork to GDP by 83%, from TZS 44 billion to 80 billion between 2017 and 2022. This would bring the production-consumption deficit for pig meat from 8,000 tonnes to a 1,350-tonne surplus in the five-year period. Improving pig meat requires a focus on controlling African swine fever to increase pig productivity and meat production to help close the projected all-meat consumption gap projected in 15 years. In the ‘without additional investment’ scenario, by year 2032, a deficit of 16,000 tonnes of pig meat is estimated, thus resulting in a total all meat deficit of 2 million tonnes. However, industrializing pork production (in large commercial-scale operations) and processing for product transformation will lower domestic meat prices, while enabling an increase in exports and foreign exchange earnings. The above benefits can only be realized with:
(i) An increase in the supplementary feeding of family pig herds and in the production and supply of quality commercial feeds.
(ii) An intensification of pig production through a combination of small-, medium- and large-scale investments in genetics, biosafety, health and feed designed to increase fertility and productivity rates.

113
(iii) A greater focus to indoor pig farming through progressive reduction of the numbers of free-roaming pigs and improvement of traditional units/holdings.
(iv) Strategic development of industrial pig farming concentrations through the attraction of, and support for, domestic and foreign direct investments in pig farming, targeting large commercial pig producers.
(v) Promotion of private sector investment in animal health, and other pig farming technical and business development services.
(vi) Integration of smallholder pig production activities with specialized pig farms and meat processing plants, massive cereal production, feed processing, breeding activities, marketing and pig meat value addition services (e.g. slaughter and processing).
(vii) Strengthening of swine associations to make them vehicles for commercialization of the pig industry, ensuring they have the right knowledge and skills, and access to credit and collective marketing opportunities.
Total investment in the livestock master plan The total investment costs required to carry out the LMP roadmap are TZS 1,393.9 billion. The proportion of investment from the public and private sectors is 36% (TZS 502.6 billion) and 64% (TZS 891.3 billion), respectively.
Table 72: Total investment cost required to carry out the livestock master plan roadmap
Investment interventions Total investment cost in billion TZS Total cost (USD millions) Public Private Total
Cow dairy8 105.8 119.3 225.1 101 Red meat/milk and feedlot 184.8 157.4 342.2 153 Poultry 195.9 557.5 753.4 337 Pig/pork 16.1 57.1 73.2 33 Total 502.6 891.3 1,393.9 624
Finally, the results for all the targeted value chains show that investing in the livestock master plan could help transform family farms from traditional to improved market-oriented systems. This includes all the traditional family systems. The specialized commercial production systems for dairy, cattle feedlots, and poultry (broilers and layers) could also be improved through better genetics, feed and health services and by increasing the number of specialized commercial units and animals in them to increase their contributions to rural household income, national livestock production and GDP. Moreover, livestock development does not just have an impact on rural people. The anticipated transformation of the livestock sector also has the potential to impact positively on urban consumers through lower animal product prices. It is, therefore critical to the attainment of food and nutrition security at household, sectorial and national levels.
8 Investments to improve pasture productivity and reduce young and adult stock mortality are included in the investment of red meat/milk and feedlot system.

114
Annex 1: Five-year Dairy Production Improvement Investment Costs (2017/18-2021/22)
S/No Investment intervention Investment cost (TZS million) Budget source
% 2017/18 2018/19 2019/20 2020/21 2021/22 Total 1 Animal feeding 1.1 Pasture establishment and paddocking
Land preparation, pasture establishment and paddocking in newly-established 150 medium farms (50 Ha).
7,920 7,920 7,920 7,920 7,920 39,600 Private–100
1.2 Commercial animal feeds plants Construction of 2 plants (TZS 1,100 million per plant).
- 1,100 - 1,100 - 2,200 Private–100
1.3 Feeding technologies and land acquisition (production, processing and storage) for newly established 150 medium farms.
176 176 176 176 176 880 Public–80
Private–20 1.4 Feed quality control (laboratories and capacity
building) and improving the existing (first five years).
- 440 - - - 440 Public–100
1.5 Strengthen the existing pasture/forage seed quality control laboratories.
880 - - - - 880 Public–100
Subtotal 8,976 9,636 8,096 9,196 8,096 44,000 2 Animal health - - - - - - 2.1 East Coastal fever vaccination program for
300,000 dairy cattle per year. - - - - - - Income mentioned in
red meat improvement scenario
2.2 Implement programs for eradication of contagious bovine pleuropneumonia, foot-and-mouth disease, Rift Valley fever (capacity for surveillance, diagnosis and vaccination campaign).
- - - - - -
2.3 Rehabilitate 100 veterinary centres. - - - - - - 3 Animal breeding and genetics investments 3.1 Strengthen existing national and establish a new
semen production centre. 2,200 - 11,000 - - 13,200 Public–100
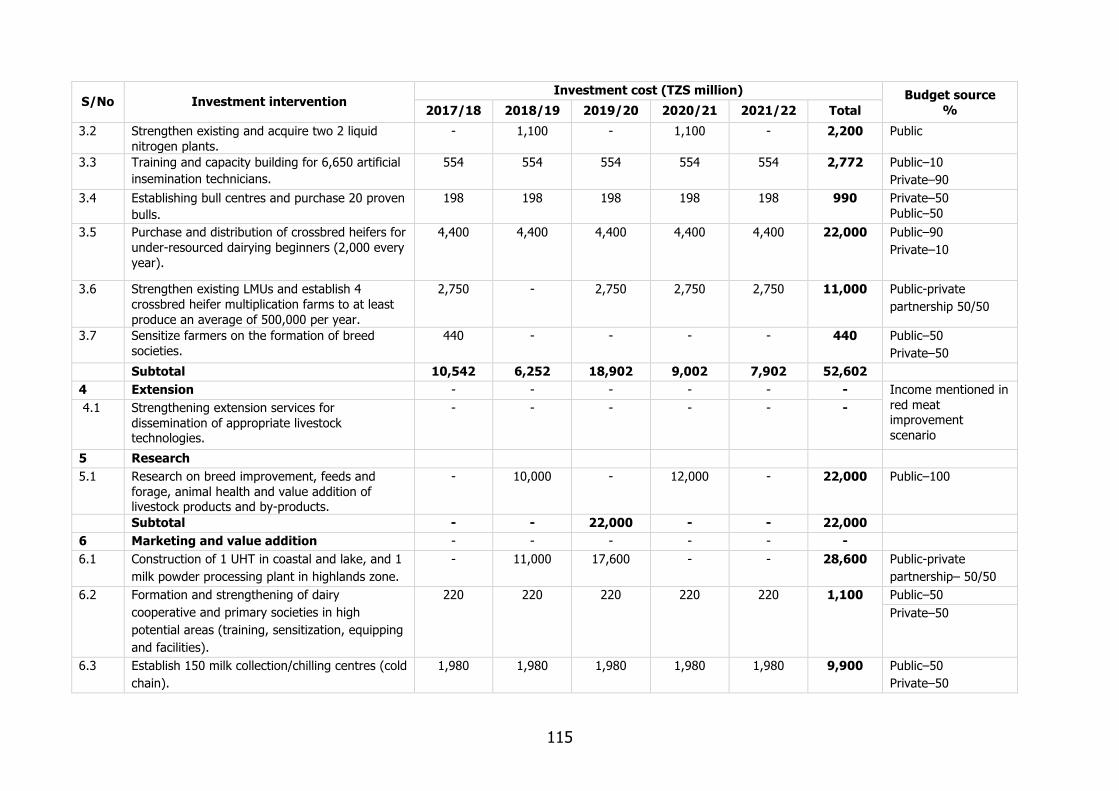
115
S/No Investment intervention Investment cost (TZS million) Budget source
% 2017/18 2018/19 2019/20 2020/21 2021/22 Total 3.2 Strengthen existing and acquire two 2 liquid
nitrogen plants. - 1,100 - 1,100 - 2,200 Public
3.3 Training and capacity building for 6,650 artificial insemination technicians.
554 554 554 554 554 2,772 Public–10 Private–90
3.4 Establishing bull centres and purchase 20 proven bulls.
198 198 198 198 198 990 Private–50 Public–50
3.5 Purchase and distribution of crossbred heifers for under-resourced dairying beginners (2,000 every year).
4,400 4,400 4,400 4,400 4,400 22,000 Public–90 Private–10
3.6 Strengthen existing LMUs and establish 4 crossbred heifer multiplication farms to at least produce an average of 500,000 per year.
2,750 - 2,750 2,750 2,750 11,000 Public-private partnership 50/50
3.7 Sensitize farmers on the formation of breed societies.
440 - - - - 440 Public–50 Private–50
Subtotal 10,542 6,252 18,902 9,002 7,902 52,602 4 Extension - - - - - - Income mentioned in
red meat improvement scenario
4.1 Strengthening extension services for dissemination of appropriate livestock technologies.
- - - - - -
5 Research 5.1 Research on breed improvement, feeds and
forage, animal health and value addition of livestock products and by-products.
- 10,000 - 12,000 - 22,000 Public–100
Subtotal - - 22,000 - - 22,000 6 Marketing and value addition - - - - - - 6.1 Construction of 1 UHT in coastal and lake, and 1
milk powder processing plant in highlands zone. - 11,000 17,600 - - 28,600 Public-private
partnership– 50/50 6.2 Formation and strengthening of dairy
cooperative and primary societies in high potential areas (training, sensitization, equipping and facilities).
220 220 220 220 220 1,100 Public–50 Private–50
6.3 Establish 150 milk collection/chilling centres (cold chain).
1,980 1,980 1,980 1,980 1,980 9,900 Public–50 Private–50

116
S/No Investment intervention Investment cost (TZS million) Budget source
% 2017/18 2018/19 2019/20 2020/21 2021/22 Total 6.4 Strengthen Dairy Board to regulate milk quality
in highlands, lake and coastal zones in four milk sheds (office and laboratory).
550 - - - - 550 Public–100
6.5 Strengthen the capacity of milk quality and safety control laboratory at the Tanzania Veterinary Laboratory Agency (TVLA).
330 - - - - 330 Public–100
6.6 School-milk feeding programs to benefit 500,000 children.
4,400 8,800 13,200 17,600 22,000 66,000 Public-private partnership– 50/50
Subtotal 7,480 22,000 33,000 19,800 24,200 106,480 Grand total investment 26,998 47,888 59,998 49,998 40,198 225,082 Public–47 Private–53

117
Annex 2: Five-year Red Meat Production Improvement Investment Costs (2017/18-2021/22) S/No Investment intervention Investment cost (TZS million) Budget source
% 2017/18 2018/19 2019/20 2020/21 2021/22 Total 1. Animal feeding 1.1 Gazette grazing land, demarcation and
enforcement of the Grazing Land and Animal Feeds Resources Act 2010.
5,000 3,000 2,000 1,000 11,000 Public–100
1.2 Rangeland (communal grazing land) improvement–Bush clearing and/or oversowing.
20,000 10,338 10,000 5,000 4,000 49,338 Public–60 Private–40
1.3 Livestock-water development programs (charcoal dams/boreholes for village grazing land).
10,000 5,000 3,893 18,893 Public–90 Private–10
2.
Animal health
2.1 Public good vaccination for East Coast fever, CBPP, foot-and-mouth disease, Rift Valley fever, PPR, CCPP and brucellosis diseases.
2,552 2,552 2,552 2,552 2,552 12,760 Public–80 Private–20
2.2 Construction and rehabilitation of dip tanks. 1,043 1,043 1,043 1,043 1,043 5,215
Public–60 Private–40
2.3 Improve the capacity of vaccine production centres, veterinary centres and diagnostic laboratories for vaccination, surveillance and diagnosis.
22,000 11,000 11,000 44,000 Public–100
2.4 Promote private sector engagement in vaccine production.
1,000 1,000 1,000 3,000 Public–25 Private–75
3. Animal breeding and genetics 3.1 Purchase of proven breeding bulls (Boran, Ankole
and Fipa). 40,518 40,518 40,518 121,554
Public–10 Private–90
3.2 Purchase of proven breeding bucks of Malya (blended) goat.
70 100 80 250 Public–30 Private–70
4.
Research
4.1 Grazing land resource (feed/fodder/water) 2,750 2,750 5,500 Public–80

118
S/No Investment intervention Investment cost (TZS million) Budget source % 2017/18 2018/19 2019/20 2020/21 2021/22 Total
assessment research. Private–20 4.2 Research on breed improvement, feeds and forage,
animal health and value addition of livestock products and by-products.
1,000 1,000 200 2,200 Public–70 Private–30
5.
Extension services
5.1 Strengthening the capacity of existing livestock training institutes:
• Provide extension officers with the necessary equipment (toolkit).
• Establish and/or strengthen ward livestock resource centres.
5,500 5,500 11,000 Public–90 Private–10
6.
Marketing and value addition
6.1 Establishment and rehabilitation of secondary livestock markets.
1,500 1,000 2,500 Public–100
6.2 To renovate and equip Kwala and Tarime and Murusagamba livestock quarantine station (for export processing).
10,000 10,000 20,000 40,000 Public–100
6.3 Renovation and/or constructions of modern abattoirs:
• 2 big abattoirs with a capacity to slaughter 2,000 sheep and goats and 200 cattle per day.
• 1 modern abattoir with a capacity to slaughter 3,000 sheep and goats and 700 cattle per day.
3,500 3,500 7,000 Public–50 Private–20 Public-private partnerships–30
6.4 Renovation of existing and/or constructions of 2 new semi-processing and finished leather products processing plants.
2,400 2,000 4,400 Private–100
6.5 Strengthening the meat board to regulate, promote, monitor and coordinate stakeholder
200 130 330 Public–95 Private–5

119
S/No Investment intervention Investment cost (TZS million) Budget source % 2017/18 2018/19 2019/20 2020/21 2021/22 Total
activities for improving the meat value chain (traders and producers’ associations).
6.6 Strengthen the capacity of meat quality and safety control laboratory in the Tanzania Veterinary Livestock Agency.
550 550 1,100 Public–100
6.7 Enhancing livestock identification and traceability system–purchase of equipment (computer, networking and identification kits).
1,200 1,000 2,200 Public-private partnerships–100
Total 72,083 115,251 99,623 26,688 28,595 342,240 Public 54 Private 46

120
Annex 3: Five-year Chicken Meat and Egg Production Improvement Investment Costs (2017/18-2021/22)
S/No. Investment interventions Investment cost (TZS million) Budget source
% 2017/18 2018/19 2019/20 2020/21 2021/22 Total 1 Animal feeding 1.1 Establish 3 chicken feed processing plants. 2,970 5,940 8,910 Private–100
1.2 Improve the capacities of chicken feed quality control laboratories.
1,320 1,320 2,640 Public9 –100
1.3 Land investment for feed (yellow-maize and soybean) production (sorghum to complement maize).
36,300 36,300 46,200 60,500 62,700 242,000 Private–100
2 Animal health 2.1 Upgrade and expand Newcastle disease, fowl pox,
Gumboro vaccines production plant. 13,200 19,360 13,200 45,760 Public–100
2.2 Establish and monitor the chicken industry bio-safety program.
2,200 3,300 1,320 1,320 1,210 9,240 Public–100
3 Animal breeding and genetics 3.1 Identify suitable tropical pure
reproducing/brooding chicken breeds 3,960 2,200 6,160 Public–100
3.2 Identify suitable tropical semi scavenging crossbred chicken breeds.
2,200 1,760 3,960 Public–100
3.3 Testing breeds at the Tanzania Livestock Research Institute and at farm level and developing appropriate business models.
2,200 3,520 5,720 Public–100
3.4 Strengthen/upgrade 7 public chick multiplication centres.
1,100 2,200 2,420 5,720 Public–100
3.5 Establish 8 new public and private crossbred semi-scavenging and commercial day-old-chick multiplication centres and 30. mothering units and distribution centres for month-old vaccinated chicks.
3,163 3,163 6,325 6,325 6,325 25,300 Public–20 Private–80
3.5 Establish 10 public and private hatchery facilities and 100 private distribution centres for selected vaccinated month-old chicks reproducing/brooding
7,508 7,508 15,015 15,015 15,015 60,060 Public–20
Private–80
9 Represents government and NGO funds. NGO funds assumed to feed to the achievement of the national government/public goals

121
S/No. Investment interventions Investment cost (TZS million) Budget source
% 2017/18 2018/19 2019/20 2020/21 2021/22 Total chicken.
4 Extension
4.1 Reduce reproductive wastage of brooding hens using artificial incubation (10,000 incubators/year).
22,000 26,400 33,000 35,200 37,400 154,000 Public–30 Private–70
4.2 Reduce reproductive wastage of brooding hens using chicken brooder box (10,000 hay brooding box/year).
8,800 9,900 11,000 12,100 13,200 55,000 Public–20 Private–80
4.3 Support the Livestock Training Agency and private institutions to implement farmers’ skills and training programs on commercial livestock production.
3,696 3,696 3,696 3,696 3,696 18,480 Public–50 Private–50
4.4 Promotion of exotic chicken meat and eggs consumption.
220 440 1,100 1,320 1,760 4,840 Public–60 Private–40
5 Marketing and value chain
5.1 Establishment of chicken abattoirs and cold storage for eggs and chicken meat.
6,325 6,600 12,925 Public–10 Private–90
6 Policy, planning and monitoring and evaluation 6.1 Building capacity of MLF, local government
authorities (LGAs), and livestock keepers on record keeping, data management and dissemination10.
1,210 1,320 1,430 1,540 1,786 7,286 Public–80 Private–20
Total investment 121,644 134,404 162,206 163,031 172,187 753,361 Public 26 Private 74
10 This investment serves across all commodities

122
Annex 4: Five-year Pig/Pork Production Improvement Investment Costs (2017/18-2021/22)
S/No. Type of investment Investment cost (TZS million) Total (TZS
million) Budget source
% 2017 2018 2019 2020 2021 1 Animal feeding
1.1 Strengthen capacity of 150 private small-scale pig feed mills/processors to compound and distribute feeds to farmers.
290 290 290 290 290 1,450 Public–35 Private–65
1.2 Strengthen capacity of public sector to regulate, and assist 30 private feed and meat processors to prepare own hazard analysis and critical control points (HACCP).
- 54 52 - 48 154 Public–100
2 Animal health 2.1 Strengthen disease surveillance at the central veterinary
laboratory and the zonal veterinary centres (procure capital laboratory equipment).
280 270 250 220 180 1,200 Public–45
Private–55 2.2 Train staff on novel lab technologies and methods to test
blood/organ samples for early diagnosis of key pig diseases especially African swine fever.
36 36 36 36 36 180 Public–30 Private–70
2.3 Strengthen veterinary laboratories capacity: procure in-line and offline feed quality analyser equipment to check hazards, nutrient level, and residues.
28 28 28 28 28 140 Public–100
2.4 Procure equipment to check/validate feed intoxication and biological contamination.
42 30 - - - 72 Public–100
2.5 Build lab staff capacity on residues validation testing procedures/methodology.
- 115 115 115 115 460 Public–100
2.6 Build capacity of meat inspectors in 100 local government authorities (LGAs) for safe meat marketing.
380 - 370 - 350 1,100 Public–40 Private–60

123
S/No. Type of investment Investment cost (TZS million) Total (TZS
million) Budget source
% 2017 2018 2019 2020 2021 2.7 Equip pig abattoirs and PPEs for pig meat inspectors. 352 - 352 - 352 1,056 Public–35
Private–65
2.8 Strengthen biosafety facilities and plans of 300 pig farms to control pig diseases.
960 1,200 1,200 1,080 840 5,280 Public–35 Public-private partnerships -65
2.9 Build capacity of 100 LGAs for cost-effective pig disease surveillance and control strategies.
1,650 1,650 1,650 1,650 1,650 8,250 Public–15 Public-private partnerships–85
2.10 Strengthen biosafety infrastructures in 300 pig farms in 100 LGAs and national biosafety services
132 132 132 132 132 660 Public–45 Private–55
2.11 Facilitate pig identification, registration and traceability. 560 480 440 400 320 2,200 Public–5 Public-private partnerships–95
2.12 Build staff capacity on national mandatory identification and traceability to achieve animal health and safe trade objectives.
220 180 150 - - 550 Public–35 Private–65
3 Animal breeding and genetics
3.1 Import 4,000 tropically adapted productive pig sow breeds for breeding.
- 2,420 1,980 - - 4,400 Public–50 Private–50
3.2 Import adaptable tropical productive 230 pig boar breeds for breeding.
- 330 330 - - 660 Public–45 Private–55
3.3 Facilitate establishment of 10 private pig breeding and multiplication farms.
58 58 58 58 - 232 Public–15 Public-private partnerships–85
3.4 Facilitate establishment of 10 public pig breeding and multiplication farms.
102 102 102 102 - 408 Public–100
4 Research activities

124
S/No. Type of investment Investment cost (TZS million) Total (TZS
million) Budget source
% 2017 2018 2019 2020 2021 4.1 Develop capacity to control African swine fever virus and
transform the pig industry. Public–100
4.2 Identify risk factors for spread of African swine fever, including the role of wild pigs-argasidae-tick interactions in high risk areas.
30 30 - - - 60 Public–100
4.3 Field test the efficacy of novel African swine fever virus diagnostic tests (lateral flow device (LFD) for early detection of virus antigen and ELISA to detect IgM for the virus.
30 - - - - 30 Public–100
4.4 Modelling cost-effective measures for prevention and control of African swine fever.
- 22 - - - 22 Public–100
4.5 Improve control and preparedness of pig farmers, vets and public agencies for African swine fever.
1,800 1,760 1,540 1,500 1,320 7,920 Public–100
4.6 Diagnostic study on Swine Producers’ Associations (SPAs) managerial, financial and organizational needs and planning to achieve operational efficiency.
- - 33 - - 33 Public–100
5 Extension services 5.1 Build capacity of 300 swine producer associations (SPAs).
5.2 Establish 300 SPAs in potential areas. 456 456 456 456 456 2,280 Public–20 Private–80
5.3 Build capacity for 300 SPAs to revitalize and innovate to address production, trade and development limitations.
10 10 10 10 10 50 Public–10
Private–90 5.4 Build SPAs capacity to manage pig meat value chain
(processing, marketing). 20 20 20 20 20 100 Public–25
Private–75
5.5 Leadership capacity to manage pig farmers’ savings and cooperative societies production and marketing.
54 37 48 37 54 230 Public–30 Private–70
5.6 Build hands-on-capacity to manage pig farm enterprise costs, manure processing and pig industry sustainability.
55 55 55 55 55 275 Public–30 Private–70

125
S/No. Type of investment Investment cost (TZS million) Total (TZS
million) Budget source
% 2017 2018 2019 2020 2021 6 Commercial production, marketing and value addition
6.1 Expand and upgrade the capacity of 50 large-scale specialized investors' pig farms.
1,200 - 1,000 - - 2,200 Public–5 Private–95
6.2 Establish 50 new commercial specialized pig farms for commercial pig production.
- 2,100 2,300 - - 4,400 Public–5 Private–95
6.3 Improve capacity of government staff to backstop 30 meat processors and 30 feed processors implement their own HACCP.
380 - 370 - 350 1,100 Public–40 Private–60
6.4 Construct pig marketing centres with slaughter facilities in 100 pilot LGAs.
- - 3,200 2,880 2,720 8,800 Public–10 Private–90
6.5 Construct mechanized pig slaughters, processing plant, with cold-storage for marketing of chilled pig meat to domestic and exports markets.
- - 2,112 2,112 1,056 5280 Public–5
Private–95
7 Monitoring and evaluation
7.1 Institutionalize pig database and capacity for program and monitoring.
2,000 3,000 4,000 600 9,600
7.2 Bi-annual evaluation of the transformational development in the pig industry.
150 150 160 130 130 720
7.3 Support to program coordination and asset management. 400 400 450 400 1,650
Total investment 9,275 14,415 22,239 15,761 11,512 73,202 Public–22 Private–78

126
References
FAO, 2014. FAO: World Agriculture: Towards 2015/2030
Nell, A. J., Schiere, H. and Bol, S. 2014. Quick scan dairy sector Tanzania. (Available from http://edepot.wur.nl/334382).

The International Livestock Research Institute (ILRI) works to improve food security and reduce poverty in developing countries through research for better and more sustainable use of livestock. ILRI is a CGIAR research centre. It works through a network of regional and country offices and projects in East, South and Southeast Asia, Central, East, Southern and West Africa, and in Central America. ilri.org
CGIAR is a global agricultural research partnership for a food-secure future. Its research is carried out by research centres in collaboration with hundreds of partner organizations
TANZANIA LIVESTOCK MASTER PLAN