taphonomy of sediments: bioturbation in the triassic
TRANSCRIPT
Loma Linda UniversityTheScholarsRepository@LLU: Digital Archive of Research,Scholarship & Creative Works
Loma Linda University Electronic Theses, Dissertations & Projects
3-2016
Taphonomy of Sediments: Bioturbation in theTriassic Moenkopi Formation in SouthwesternUtahJames Vernon Bird Jr.
Follow this and additional works at: http://scholarsrepository.llu.edu/etd
Part of the Geology Commons, and the Sedimentology Commons
This Thesis is brought to you for free and open access by TheScholarsRepository@LLU: Digital Archive of Research, Scholarship & Creative Works. Ithas been accepted for inclusion in Loma Linda University Electronic Theses, Dissertations & Projects by an authorized administrator ofTheScholarsRepository@LLU: Digital Archive of Research, Scholarship & Creative Works. For more information, please [email protected].
Recommended CitationBird, James Vernon Jr., "Taphonomy of Sediments: Bioturbation in the Triassic Moenkopi Formation in Southwestern Utah" (2016).Loma Linda University Electronic Theses, Dissertations & Projects. 336.http://scholarsrepository.llu.edu/etd/336

LOMA LINDA UNIVERSITY
School of Medicine
in conjunction with the
Faculty of Graduate Studies
____________________
Taphonomy of Sediments: Bioturbation in the Triassic Moenkopi Formation in
Southwestern Utah
by
James Vernon Bird Jr.
____________________
A Thesis submitted in partial satisfaction of
the requirements for the degree
Master of Science in Geology
____________________
March 2016

© 2016
James Bird
All Rights Reserved

iii
Each person whose signature appears below certifies that this thesis in his/her opinion is
adequate, in scope and quality, as a thesis for the degree Master of Science.
, Chairperson
Leonard Brand, Professor of Biology and Paleontology
Paul Buchheim, Professor of Geology
Raul Esperante, Adjunct Assistant Professor of Geology

iv
ACKNOWLEDGEMENTS
This work forms part of the master’s research of the principal author (J.V.B.).
This project was sponsored by the Loma Linda University School of Medicine, Earth and
Biological Sciences Department. The author wants to thank Ranjan Fernando, Dominic
Ombati and Rob Johnson.
To my wife, Norris, I am thankful that I am finished with this research project so
that I may be able to spend lots of time with you and show you some of the wonderful
things that I have learned about and discussed in this thesis.
To my committee members Drs. Buchheim and Esperante thank you for the
expertise you brought to field of study. I appreciate the insight you had on combining
aspects of sedimentology, stratigraphy, bioturbation and their interplay in understanding
the paleoenvironment of the Moenkopi Formation. Your review of this document was
much appreciated.
To my colleagues, Jankel Coronado and Monte Fleming, thank you for making
this journey with me. To my constant comrade and brother, Jimmy Wilhelm, you
provided the comic relief and friendship that made every one of our classes and fieldtrips
an adventure.
To Ana Martinez, thank you for all of your time, encouragement and feedback.
Your advice was much appreciated. I am continually inspired by your love of geology
and inquisitive mind. You will make fantastic geology professor soon!!
To my primary advisor Leonard Brand, I would not have been able to do this
project with you. I am thankful for the opportunity of learning from you and having been
able to do my fieldwork under such an inspiring and God fearing individual. Thank you

v
for keeping me focused, for meeting with me for constantly reviewing and revising this
thesis. Your support, encouragement and kind words have kept me going. I have learned
much from you about what it means to be a Christian educator.

vi
DEDICATION
To California Preparatory College for giving me the flexibility at work to allow
me to investigate, learn and spend time in the outdoors I enjoy.

vii
CONTENTS
Approval Page .................................................................................................................... iii
Acknowledgements ............................................................................................................ iv
Dedication .......................................................................................................................... vi
Table of Contents .............................................................................................................. vii
List of Tables ..................................................................................................................... ix
List of Figures ......................................................................................................................x
Abstract ............................................................................................................................. xii
Chapter
1. Introduction ..............................................................................................................1
Objectives ..........................................................................................................3
References ..........................................................................................................4
2. Geology of the Moenkopi Formation ......................................................................5
Introduction ........................................................................................................5
Geologic Setting.................................................................................................6
3. Methods..................................................................................................................13
Mapping and Choice of Study Sites.................................................................15
Sampling and Analysis ....................................................................................17
Intensity of Bioturbation ..................................................................................18
Sample Treatments for Enhancing Bioturbation..............................................22
X-Ray Diffraction Analysis .............................................................................24
Petrographic Analysis ......................................................................................24
4. Results ....................................................................................................................25
Stratigraphy ......................................................................................................25
Bioturbation and Virgin Limestone Outcrops..................................................30
Middle Red Member ........................................................................................33
Shnabkaib Member ..........................................................................................35
Upper Red Member..........................................................................................37
X-Ray Diffraction Analysis .............................................................................40

viii
Petrographic Analysis ......................................................................................43
5. Discussion ..............................................................................................................50
Conclusions ......................................................................................................55
References ..........................................................................................................................56
Appendices
A. Stratigraphy ........................................................................................................59
B. Petrographic Pictures ..........................................................................................68
C. Bioturbation and Sedimentary Structures ..........................................................72

ix
TABLES
Tables Page
1. Comparison of Different Treatments to Reveal Bioturbation................................31
2. Bioturbation Averages for Select Samples ............................................................31
3. Samples for Comparison of Mineralogy and Bioturbation …………………….. 42

x
FIGURES
Figures Page
1. Formal and Informal Members of the Moenkopi Formation .................................12
2. Members of the Moenkopi Formation and Hurricane Mesa ..................................12
3. Map of Research Area ...........................................................................................14
4. Explanation of Prefixes Used in Study for Sample Sites .......................................16
5. Ichnofabric Index ...................................................................................................19
6. Field Observation of Bioturbation Intensity ..........................................................21
7. Comparison of Different Treatments Used to Reveal Bioturbation ......................23
8. Stratigraphic Sections of the Virgin Limestone Member ......................................26
9. Select Beds & Sedimentary Features from the Virgin Limestone
Members .......................................................................................................... 28-29
10. Ternary Diagram ....................................................................................................32
11. Outcrop View of R-1 .............................................................................................34
12. Comparison of Middle Red and Shnabkaib Member Sediments ...........................36
13. Upper Red Member.......................................................................................... 38-39
14. Diffractograms .......................................................................................................41
15. Textural and Compositional Analysis ....................................................................44
16. Ternary Diagram ....................................................................................................45
17. Photomicrographs ............................................................................................ 47-48
18. Photomicrographs (Roadcut) .................................................................................49

xi
19. Measured Sections .................................................................................................64
20. B1 Outcrop .............................................................................................................65
21. Measured Sections ........................................................................................... 66-67
22. Petrographic Pictures ....................................................................................... 69-71
23. Bioturbation and Sedimentary Structures ........................................................ 73-74
24. Bioturbation and Sedimentary Structures (Roadcut) ....................................... 75-76

xii
ABSTRACT OF THE THESIS
Taphonomy of Sediments: Bioturbation in the Triassic Moenkopi Formation in
Southwestern Utah
by
James Vernon Bird Jr.
Master of Science, Graduate Program in Geology
Loma Linda University, March 2016
Leonard Brand, PhD, Chairperson
Measurement of bioturbation reflects physical and biological processes operating
over time and can be used to reveal information about paleo-environments. The purpose
of this study was to determine the intensity of bioturbation in Triassic Moenkopi
Formation at Hurricane Mesa in Southwestern Utah. This formation is interpreted as
having been deposited mostly in large ancient river channels, tidal flats, delta and shallow
marine environments. Five stratigraphic sections measured in the Virgin Limestone
Member provided the basis for this study. Detailed descriptions and quantification of
bioturbation were recorded in each of the sections. Similar treatment was given to
additional study sites in the rest of the formation, above the Virgin Limestone.
Treatments on selected samples were implemented to better reveal evidence of
bioturbation. In these treatments samples were coated with water or oil, etched with HCL
and viewed under blacklight. Integrating the results of the treatments with x-ray
diffraction and petrographic analysis suggest that there was minimal bioturbation. These
findings are consistent with more rapid deposition than previously reported by other
researchers.

1
CHAPTER ONE
INTRODUCTION
A “subject that I have perhaps treated in foolish detail.”
- Charles Darwin, 1881 – on what is now referred to as bioturbation
Bioturbation studies ought to play a significant role in the study of sedimentary
rocks, deposition rates and preservation of sedimentary structures. Bioturbation is a type
of ecosystem engineering that involves the modification of geochemical gradients,
sedimentary features and the redistribution of food and resources. Darwin, in his last
scientific book On the Formation of Vegetable Mounds through the Action of Worms with
Observations on their Habits (Darwin, 1881) covered the activity of rooting plants and
burrowing animals such as worms. Today we know that bioturbation is not a topic of
“small importance” as Darwin at first believed but one that plays a role in the fields of
ecology, geomorphology, hydrology and even archeology (Feller et al., 2003). The study
of burrowing organisms is now understood to affect nearly the entire surface of the earth
(Meysman et al., 2006). In terrestrial as well as aquatic environments bioturbation by
animals results from similar activities. A study of bioturbation along with other indicators
such as stratigraphy, sedimentary structures and fossils can yield information useful in
interpreting paleoenvironmental conditions and rates of deposition. It should be noted
that it is recognized that sedimentation is the result of unsteady geomorphic processes
(Sadler, 1981) and it is assumed that the stratigraphic record is incomplete. These
assumptions lead researchers to conclude that some beds were completely removed by
erosion while others remained. Although continuous deposition and erosion are assumed,

2
the rock record often does not show evidence of erosion (Peters, 2007). Peters suggests
that lack of bioturbation is not solely the result of erosion, or “no one being home”, rather
lack of bioturbation is often the result of a combination of these geomorphic and
sedimentary processes.
Bioturbation is defined as the disturbance of sedimentary deposits by living
organisms. It is the process of particle translocation vertically and/or laterally within
near-surface unconsolidated sedimentary deposits by animals or plants (Balek, 2002;
Bateman et al., 2007; Whitford & Kay, 1999). In both terrestrial and aquatic
environments there are many potential sources of disturbance such as worms, gophers,
moles, bivalves, gastropods and crustaceans. These organisms bioturbate sediments in the
process of creating burrows, mounds and tunnels. This nearly ceaseless movement of
sediment modifies substrate as tunnels collapse and burrows are back filled. Though the
activity of bioturbators is continuous it is mostly limited to the uppermost layers. Hence,
bioturbation is most intensive within a meter or so of the surface. It appears that the
primary control on bioturbation depends on how long sediments remain in the upper 1-2
m and the depth of sediment deposited in any single event (Bateman et al., 2007).
Bioturbation in modern sediments, particularly by animals including infaunal
organisms has been documented to be very effective at reworking sediments while
building new pedogenic structures and destroying others. Garkaklis et al. (2004) found
that the small, less than 1 kg, marsupial Bettongia penicillata of Australia can dig up to
100, 15 cm deep holes per night and can displace over 4 tons of sediment annually.
Intensely burrowed modern sediments are usually interpreted to indicate low
sedimentation rates (Howard, 1975; Nara, 2002).

3
Mermillod-Blondin (2011) discusses five functional groups of bioturbators in
soft-bottom sediments; 1) biodiffusors, organisms whose activities result in random
sediment mixing on the surface; 2) upward conveyors and 3) downward conveyors,
characterized by organisms whose feeding activities (ingestions and egestion) move
sediment vertically; 4) regenerators, digging organisms that leave open burrows that fill
with newer sediments when abandoned; and 5) gallery-diffusors which are organisms that
build extensive galleries of burrows that are irrigated by biotic activities. However in
barren units with unaltered sediments it may be assumed that colonizers either were not
present or could not adjust to the changes in sea floor as might be expected from modern
environments where new burrows are made during quiet periods (Nara, 2002). It is not
clear whether the five functional groups identified by Blondin were present, or were
absent or rare during the entire lower to middle Triassic at Hurricane Mesa. If the record
of those five functional groups was not preserved, perhaps sedimentation rates or
environmental conditions played a more important role than is currently recognized.
Objectives
The overall goal of this research is to quantify bioturbation in the Triassic
Moenkopi formation at Hurricane Mesa, Utah. Quantification of the bioturbation found in
the sedimentary record provides insight to understand the paleoenvironmental impact on
burrowing organisms. This is accomplished through the identification of bioturbation
through study of exposed sedimentary surfaces of sediment samples. The application of
different surface treatments such as water, oil, blacklight and acid etch on samples may
help reveal obscured bioturbation features.

4
References
Balek, C. L. (2002). Buried Artifacts in Stable Upland Sites and the Role of Bioturbation:
A Review. Geoarcheology, 17, 41-51.
Bateman, M. D., Boulter, C. H., Carr, A. S., Frederick, C. D., Peter, D., & Wilder, M.
(2007). Preserving the palaeoenvironmental record in Drylands: Bioturbation and
its significance for luminescence-derived chronologies. Sedimentary Geology,
195(1–2), 5-19.
Darwin, C. (1881). The Formation of Vegetable Mould Through the Action of Worms
With Observation of Their Habits: Cambridge University Press.
Feller, C., Brown, G.G., Blanchart, E., Deleporte, P., Chernyanskii, S.S. (2003). Charles
Darwin, Earthworms and the Natural Sciences: Various Lessons from Past to
Future. Agriculture, Ecosystem & Environment, 99, 29-49.
Garkaklis, M. J., Bradley, J. S., & Wooller, R. D. (2004). Digging and soil turnover by a
mycophagous marsupial. Journal of Arid Environments, 56(3), 569-578.
Howard, J. D. (1975). The Sedimentological Significance of Trace Fossils. In R. W. Frey
(Ed.), The Study of Trace Fossils: A Synthesis of Principles, Problems, and
Procedures in Ichnology (pp. 131-146). New York: Springer-Verlag.
Mermillod-Blondin, F. (2011). The Functional Significance of Bioturbation and
Biodeposition on Biogeochemical Processes and the Water-Sediment interface in
Freshwater and Marine Ecosystems. Journal of the North American Benthological
Society , 770-778.
Meysman, F. J. R., Middelburg, J. J., & Heip, C. H. R. (2006). Bioturbation: a fresh look
at Darwin's last idea. Trends in Ecology & Evolution, 21(12), 688-695.
Nara, M. (2002). Crowded Rosselia socialis in Pleistocene Inner Shelf Deposits: Benthic
Paleoecology During Rapid Sea-level Rise. PALAIOS, 17(3), 268-276.
Peters, S. E. (2007). The problem with the Paleozoic. Paleobiology, 33(2), 165-181.
Sadler, P. M. (1981). Sediment Accumulation Rates and the Completeness of
Stratigraphic Sections. Journal of Geology, 89, 569-584.
Whitford, W. G., Kay, F.R. (1999). Biopedturbation by Mammals in Deserts: A Review.
Journal of Arid Environments, 41, 203-230.

5
CHAPTER TWO
GEOLOGY AND BIOTURBATION OF THE MOENKOPI
FORMATION
Introduction
Sedimentary taphonomy is the study of factors that influence how sedimentary
features are or are not preserved. Preserved sedimentary structures such as cross bedding,
graded beds, ripple marks, or burrowing by organisms are commonly found throughout
the geologic column. These features were part of the sediments when they were first
deposited prior to lithification. Bioturbation produces biogenic sedimentary structures
that involve the mixing, reworking and displacement of sediments by organisms (Stow,
2012). Sediment layers are bioturbated when plant roots penetrate into the ground and
when organisms such as worms, bivalves and gastropods burrow to carry on their normal
daily functions. Prominent examples of bioturbation are invertebrate organisms such as
Callianassa shrimp or bivalves that live in the sediments (Bromley, 1990). In this process
the original bedding and sedimentary structures may be destroyed.
This paper reports a study of bioturbation in the Moenkopi Formation in
Southwestern Utah. The Moenkopi Formation is a widespread formation found on the
Colorado Plateau of the western United States. The formation is found in six western
states of the United States including Arizona, Colorado, California, Nevada, New Mexico
and Utah (McKee, 1954). It is underlain by Permian age rocks making the Moenkopi
Formation the basal Triassic formation. It is overlain unconformably by the Late Triassic
Chinle Formation (Cadigan, 1971).

6
Geologic Setting
L.F. Ward in his study of the Geology of the Little Colorado Valley (1901) seems
to have been the first to name and describe the Moenkopi Formation. It was originally
called “Moenkopie” for a section of reddish-brown siltstone and sandstone he identified
near the junction of the Moenkopi Wash and Little Colorado River in north-central
Arizona (Blakey, 1974).
Later the term was incorrectly applied to sediments in Utah and it wasn’t until
1918 that W.B. Emery used the term to describe the sediment now known as the
Moenkopi Formation. McKee’s (1954) study focusing on the northern Arizona portion of
the Moenkopi Formation was the first comprehensive study of the formation. Work on
the area was continued by Richard Blakey (1974) who presented detailed facies analysis
and proposed depositional environments of the Moenkopi Formation in southeastern
Utah. Reeside and Bassler (1922) investigated the Moenkopi Formation in southwestern
Utah and identified six units. In ascending order they are: Timpoweap Member (formerly
Rock Canyon Conglomeratic Member), Lower Red Beds, Virgin Limestone Member,
Middle Red Beds, Shnabkaib Shale Member and the Upper Red Beds (Stewart et al.,
1972).
While there now are many recognized members of the Moenkopi Formation, none
extend throughout the entire depositional area (Fig. 1). In the area around Virgin, UT at
Hurricane Mesa, five members of the formation are observed. In ascending order these
are: the Lower Red Member, Virgin Limestone Member, Middle Red Member,
Shnabkaib Member and Upper Red Member. In the west near St. George, Utah,
Moenkopi deposits are thicker and gradually thin out towards the east as indicated in
Figure 1 (Stewart et al., 1972).

7
Near Virgin, Utah at Hurricane Mesa a roadcut exposes almost all of the
Moenkopi Formation (Figs. 2 & 3) which may be the best exposure of Moenkopi
available. It has been suggested that during much of the Triassic the area was covered by
a shallow epeiric sea which submersed what is now western Utah and parts of Nevada
(McKee, 1954). The western portion of the Moenkopi Formation found near Hurricane
Mesa contains ripple-laminated siltstone that is interpreted as having been deposited in
part on tidal flats or in a shallow sea (Stewart et al., 1972). The Moenkopi preserves
deposits that seem to include ancient tidal and shallow marine shelf deposits, evidence of
the Early Triassic seaway. As such, some portions of the formation may be comparable to
the shallow marine shelf off the coast of Florida or the bank margins of the Bahama
Banks. Other depositional environments associated with the Moenkopi include large
ancient river channels and deltas. The multitude of depositional environments transition
from continental deposits in the east to more marine deposits in the west (Wilson &
Stewart, 1967; Stewart et al, 1972). A shallow aqueous environment is suggested by the
occurrence of mud cracks, ripple marks and other sedimentary structures. There are also
salt crystal casts in Moenkopi mudstones which are interpreted as the result of
evaporation of sea water on tidal flats, further indicating a shallow marine environment in
some parts of the Moenkopi (Bannister, 1998).
This study included the Virgin Limestone Member and those members above it.
The Lower Red Member was not studied because of a lack of good exposure in this area.
The Virgin Limestone Member of the Moenkopi Formation is a carbonate-siliciclastic
deposit that varies in thickness from 50 to 300 m (Pruss & Bottjer, 2004). The Virgin
Limestone Member at Hurricane Mesa near St. George, Utah, is made up of layers of

8
light to dark claystone, shale, siltstone and bioturbated sandstone which is believed to
have been deposited during a marine incursion. It is overlain by the Middle Red Member,
which is made up of layers of reddish brown claystone with abundant secondary gypsum
veins and siltstone. The Middle Red Member transitions into the Shnabkaib Member and
is capped by the Upper Red Member which marks the surface contact with the Shinarump
Conglomerate of the Chinle Formation (Fig. 2). The member that came to be known as
the Virgin Limestone Member was first described in detail by David White who proposed
the name while serving as Chief Geologist of the U.S. Geological Survey in 1921 (White,
1921).
The Moenkopi is bound both above and below by unconformities. It is separated
from the Permian Kaibab Limestone by a basal unconformity. The Kaibab limestone is
believed to have been deposited by warm advancing shallow sea waters. The marine
deposition of the Kaibab is evidenced by its limestone composition in addition to shark
teeth, mollusks, brachiopods, corals and ichnofossils (McKee, 1938; McKinney, 1983;
Fillmore, 2000).
The upper contact is marked by an unconformity followed by the upper Triassic
Shinarump Conglomerate. The Shinarump Conglomerate is a bed that typically ranges
from 14 to 29 meters thick with a maximum thickness in some areas of 100 meters. It
stretches over nearly 260,000 square kilometers (Dubiel, 1994; Stokes, 1950). The
Shinarump is believed to have been deposited by numerous braided stream systems
whose constant movement across a relatively flat surface resulted in a thick veneer-like
conglomeritic sandstone.
9
The work of organisms on sediment produces changes that accumulate over time.
The continuous reworking and processing of sediments leads to a modified substrate
since the process of bioturbation is destructive to sedimentary features. Burrows may be
categorized by function or structure. Burrows are produced by organisms for the
functions of protection, concealment, respiration, suspension feeding, deposit feeding,
detritus feeding, gardening, predation, reproduction and to escape trauma (Bromley,
1990). Whatever the type of burrowing, the reworking of the sediment leads to an
increased likelihood that the sediment is processed and altered after deposition resulting
in more or less destruction of original sedimentary structures.
Recent research on bioturbation indicates that the mixture of marine sediments by
organisms such as marine worms, bivalves, arthropods and echinoderms can occur within
a short period of time (Froede, 2009). Over time the total reworking of the sediment in
which burrowing organisms live is the norm along shallow marine shelves. In the case of
the Grand Bahama Banks, the Callianassa Shrimp has been found to vertically mix sand
to a depth of more than a meter (Bathhurst, 1975). In 1957, Ginsburg found that
laminated sediment in an aquarium was completely obliterated by bioturbation within one
month (Bathurst, 1975). A total reworking of modern sediment, such that bedding is
obliterated has been observed by Imbrie and Buchanan (1965).
Bromley (1990, p. 201) states that “a totally bioturbated rock clearly provides
evidence that the rate of biogenic reworking exceeded that of sedimentation.” Thus,
sediments that are not totally bioturbated provide evidence that the rate of sedimentation
exceeded that of biogenic reworking. Yet, many paleo-sediments are persistently bedded

10
(Sarkar & Chaudhuri, 1992) indicating that sedimentation rate may have exceeded rate of
bioturbation, and/or the burrowing environment was stressful.
Sarkar and Chaudhuri (1992) suggest that slowly accreting, low stress
environments with periodic breaks in deposition were most conducive to development of
dwelling burrows. They found that burrowing organisms could not withstand high-stress
environments that may be characterized by storms or when the rate of sedimentation
exceeded the ability of the burrower to keep pace with vertical aggradation of sediments.
Bathhurst (1975) cautions that any interpretation of ancient environments must be
tempered since paleo-sediments are often not bioturbated to the same degree as modern
sediments. However this must be evaluated carefully in an attempt to understand the
degree of bioturbation and the reason for it.
Measurement of bioturbation intensity is an important key to reconstructing
paleoenvironments. The intensity of bioturbation in one particular area reflects both
physical and biological processes and can be used to meaningfully discuss accumulation
rate, availability of oxygen and composition of the benthic community (Marenco &
Bottjer, 2008). Bioturbated as well as unbioturbated sediments reveal important
information about their paleoenvironment (Peters, 2007).
The time for deposition of the Moenkopi is believed to have been 10-15 million
years. Such long periods of time generally are expected to result in bioturbation.
Exceptions can occur when rapid sedimentation threatens the life of or kills the
bioturbators. Also bioturbation can be incomplete as a result of lack of oxygenated water
or high salinity or temperature (James & Dalrymple, 2010; Peters, 2007). Incomplete
bioturbation implies that some stress factor prevented organisms or plants from

11
reworking sediments and destroying original bedding, or the sediments were deposited
too rapidly for much bioturbation to occur (Bathurst, 1975; Sarkar & Chaudhuri, 1992).

12
Fig. 1. Formal and informal members of the Moenkopi Formation and related strata in the
Colorado Plateau region (modified from Stewart et al., 1972).
Fig. 2. Members of the Moenkopi Formation and the Shinarump Conglomerate member of
the Chinle Formation – From top to bottom; TRcs: Shinarump Conglomerate Member of
the Chinle Formation TRmu: Upper Red Member (shoreline grading into fluvial
[river]);TRms: Shnabkaib Member [shoreline/sabkha]; TRmm: Middle Red Member:
(shoreline); TRmv: Virgin Limestone [marine]; TRml: Lower Red Member (shoreline).
Lower Red Member - TRml
Virgin Limestone Member - TRmv
Middle Red Member - TRmm
Shnabkaib Member - TRms
Upper Red Member - TRmu
Shinarump Conglomerate Member - TRcs

13
CHAPTER THREE
METHODS
All of the field work for this project was completed during the months of June,
2012 and September, 2013. Five sections were investigated and measured in the Virgin
Limestone Member along with nine additional sample sites next to the roadcut on Mesa
Road at Hurricane Mesa, above the Virgin River Limestone Member and throughout the
rest of the formation (Fig. 3).

14
Fig. 3. Map of the research area depicting sample sites at Hurricane Mesa roadcut. B, 1-5
designate the measured sections. R, 1-9 indicate sampling locations along the road cut
above the Virgin Limestone Member
Moenkopi – Shinarump Contact
Hurricane Mesa Road
Top of Mesa
TRcs
TRmv
TRmm
TRms
TRmu

15
Mapping and Choice of Study Sites
A preliminary study found that the Virgin Limestone Member had obvious
bioturbation, but no evidence of bioturbation was found in the upper members. Because
of this five sections were measured in the Virgin Limestone Member (Fig. 3). Each bed
of the Virgin Limestone Member was measured in five sections. These five sections were
correlated and compared and samples were collected for further study.
Above the Virgin Limestone Member nine additional exposures were studied
along the road cut throughout the Middle Red, Shnabkaib and Upper Red Member. The
sample sites were chosen at topographic elevation increases of approximately 50 meters,
where possible (Fig. 3). At each 50m vertical interval the exact study site was chosen on
the basis of quality of outcrop exposure and lack of cover, including slumping. All
sections are georeferenced using the WGS84 datum used for GPS locations (See Fig. 3).
Two site number prefixes were used during this field study:
1) B – prefix indicates samples taken from the Virgin Limestone Member (Fig. 4).
2) R – prefix for measurements and samples taken along the roadcut above the
Virgin Limestone Member.

16
Fig. 4. Sites were labeled with a sequence of letters and numbers. The letter (B) indicates
that the section was in the Virgin Limestone Member and the number corresponds to the
measured section. Beds were labeled using letters A-I which indicate beds from the base
through the top of a section. For example in section B5B corresponds to the second bed
from the base in the fifth section measured in the Virgin Limestone member.
B5
B
B5
D
B5
E
B5
E

17
Sampling and Analysis
At each outcrop site field descriptions of lithologies, including grain size and
sedimentary structures were taken along with intensity of bioturbation, GPS locations and
collection of samples. At the five measured sections, the lower, middle and upper
portions of each portion of each bed of the Virgin Limestone Member was examined over
a lateral area of approximately five meters. In total, one hundred samples were collected
from representative lithologies; seventy-one samples were collected from the five
measured sections in the Virgin Limestone Member and twenty-nine throughout the
roadcut which included samples from the Middle-Red, Shnabkaib and Upper Red
Members. Each of the one hundred collected samples were treated by several process to
determine if burrows were present that could not be detected in untreated samples. These
treatments included slabbing, wetting treatment, viewing under blacklight, etching with
10% hydrochloric acid and wetting with mineral oil.
Sediment samples were also examined by x-ray diffraction to determine mineral
composition. Petrographic and textural analyses of thin sections were done on fifteen
selected samples. Features including grain size, grain maturity and minerals present were
recorded. Thin sections were also examined under the dissection microscope for
bioturbation not visible at the outcrop. Two thin sections were selected and analyzed with
150 point count using the Petrog Analysis program to texturally and compositionally
classify the samples (Fig. 12). They were chosen because they were silicilastic rocks
representative of the siltstones and sandstones with grain size coarser than clay or mud.

18
Intensity of Bioturbation
Since the qualitative nature of bioturbation descriptions allows for marked
variability, it is important that an investigator choose a bioturbation intensity scale that
allows for objective evaluation. In this study vertical ichnofabric index/bioturbation
intensity was evaluated using the scale developed by Droser and Bottjer (1986) modified
by Brand where vertical exposures are on a scale of 1-4 based on the intensity of
bioturbation and the degree of disruption in the primary bedding (Fig. 5).

19
Fig. 5. Key to ichnofabric index (bioturbation intensity) used for study (modified from
Droser and Bottjer, 1986) to determine intensity of bioturbation observed in Moenkopi
Formation sediments at Hurricane Mesa. An intensity of 1 indicates that there was little to
no bioturbation with laminations and sedimentary structures easily identifiable; 2,
bioturbation is easily visible however laminations and sedimentary structures are largely
intact; 3, bioturbation intensity has mostly obliterated traces of laminations and original
sedimentary structures; 4, all traces of original laminations and sedimentary structures have
been obliterated. A bed with a bioturbation intensity of 4 could have a boundary within it
that is not detectable.

20
The score of 1 includes no bioturbation to little bioturbation because in field
observations it does not seem realistic to claim that there was actually no bioturbation. If
more bedding plane surface was visible there could be more bioturbation, but we can
observe that there has been little or no disturbance of sediment laminations. If the
bedding was completely bioturbated it was scored as 4 (Figure 6A-D). This bioturbation
index was based on the Droser and Bottjer bioturbation intensity index as opposed to
Taylor and Goldring’s (1993) ichnofabric index method because the Droser and Bottjer
index utilizes illustrations which allow for more efficient field analysis.

21
Fig. 6. Field observation of the intensity of bioturbation on the different layers of the
Moenkopi Formation at Hurricane Mesa. A. Bioturbation intensity of 1. B and C (water
used to reveal bioturbation). Bioturbation intensity of 2. D. Bioturbation intensity of 3.
A
B
C
D

22
Sample Treatments for Enhancing Bioturbation
The following techniques were used to determine if they would expose burrows
not visible in untreated and un-polished samples. Slabs were treated with water, black
light, HCL and oil. Thin section analysis was also used to look for bioturbation at the
microscopic level.
If the condition of the sample permitted, it was cut. Friable samples considered
valuable for analysis were first embedded in plaster so that they could be slabbed.
Treatment with water included cleaning the surfaces of each cut sample so that
identification of intensity of bioturbation using other treatments would be more readily
identifiable. After treatment with water, prepared surfaces were observed under black
light. Then samples were immersed in 10% HCL for twenty seconds in a glass pan to
etch their surfaces. For the final treatment, mineral oil was applied to cut surfaces before
bioturbation was scored. Pictures were taken for each treatment (Fig. 7).
Bioturbation intensity averages found in tables 1 & 2 were derived by adding the
bioturbation intensity of individual samples from each outcrop and dividing the total
bioturbation intensity by the number of samples that were treated from the entire outcrop.
For example the average of bioturbation intensity observed in samples from outcrop B1
was 1.2 while the average observed after treatment with water was 1.35 (Table 1). Table
1 gives the average bioturbation intensity for each of the 5 measured sections. Table 2
gives a comparison of the intensity of bioturbation identified by each of the treatments of
five selected samples.

23
Fig. 7.A. B1D-1. Treated with water. B. B1D-1. Viewed under black light. C. B1D-1.
Etched with 10% HCL for 20 seconds. D. B1D-1. Treated with oil.
A
B
C
D

24
X-Ray Diffraction Analysis
Samples were prepared for x-ray diffraction analysis by powdering in a marble
mortar and pestle. After the samples were powdered (~10µm), identification of
mineralogy of clay constituents was undertaken using a Siemens D-500 x-ray
diffractometer (XRD). A total of thirty-one representative samples were analyzed from
the five measured sections of the Virgin Limestone Member and nine roadcut sites from
the roadcut at Hurricane Mesa.
Petrographic Analysis
A total of fifteen representative samples were selected and made into thin
sections. All thin sections were made according to the same protocol, but thickness
varied, depending on how well objects could be seen. The thin sections were analyzed
using the petrographic microscope in the Earth and Biological Sciences Department of
Loma Linda University. Petrographic analysis was completed using the 2013 Petrog
Software to conduct point-count analysis, derive classifications along with producing
textural and compositional classification plots (Figs. 14 & 15). The classification
diagrams used to classify the thin sections was from Folk (1954).

25
CHAPTER FOUR
RESULTS
STRATIGRAPHY
The five measured sections of the Moenkopi Formation Virgin Limestone
member at Hurricane Mesa are portrayed in Figure 8. All information is based on field,
laboratory and petrographic examination of observed rocks. The five sections (Fig. 14) of
the Virgin Limestone Member measured at Hurricane Mesa averaged ~20 m in thickness.
This member is thought to have been deposited in a mixed carbonate siliciclastic
paleoenvironment. The characteristic color of sediment found in the member at Hurricane
Mesa was tannish/yellow for the sandstone marker beds (A,G & I) and brownish-purple
for the claystone with some rarer grey and green claystone layers. In some sections, the
outcrop was covered or poorly exposed possibly hiding some beds that were identified in
other sections.

26
Fig. 8 Stratigraphic Sections in the Virgin Limestone Member, Moenkopi Formation, at Hurricane Mesa.

27
Working from left to right, the stratigraphic columns will be described from
bottom to top and will include lithological description, sedimentary structures and
evidence of bioturbation. The beds show a general pattern of alternation of sandstone and
claystone/siltstone. The A bed ranges in thickness from 3.3 to 5.8 meters across the five
sections and is mainly represented by siltstone as well as fine to very fine sandstone and
calcareous sandstone with local clay lenses. The primary sedimentary structures observed
were herringbone cross stratification, hummocky cross stratification and planar parallel
laminations (Fig. 9a & b). Bioturbation was observed in various places throughout this
bed. Above this bed there are sandstone lenses that pinch out, followed by the D bed that
consists of a brownish-purple friable claystone layer that ranged in thickness from 1.8 to
7.5 meters with no observed sedimentary structures and no observed bioturbation. The
next major bed was a very fine sandstone (G bed) and calcareous sandstone that
displayed normal grading into siltstone and ranged in thickness from 1 to 2.2 m (Fig.9b).
Evidence of bioturbation in observed mostly in the top 5 to 10 centimeters of this bed.
The H bed overlies the G bed and is composed of brownish-purple claystone ranging in
thickness from 3.85 to 5.24 meters with no observable evidence of bioturbation. The final
I bed across the five sections is 1.3 to 1.7 meters of fine to very fine sandstone that
transitions into calcareous siltstone with a bioturbation intensity varying between 1 and 2.

28
Fig. 9. A.B5A – fine to very fine herringbone cross-stratified sandstone; this feature
indicates shallow water current ripples possibly from tidal effects. B.B4D-B4G. From the
bottom to the top, B4D (brownish purple claystone); B1E (very fine sandstone); B1F
(medium gray claystone with lenses of silt) corresponding to deeper water; B1G
(bioturbated sandstone to fossiliferous sandstone). C.B3A – Close-up of B3A (siltstone
with hummocky cross-stratification) with evidence of possible mega ripples typically
indicative of large storms.
B4
G
B4F
B4
E B4
D
B3A
A
B
C
B5A
A
B
C

29
Fig. 9. D.B2D and B2G - 6.16-7.2 meter thick layers of brownish-purple claystone. These
are overlain by B2F (siltstone), not shown here.
B2G
B2D
D
30
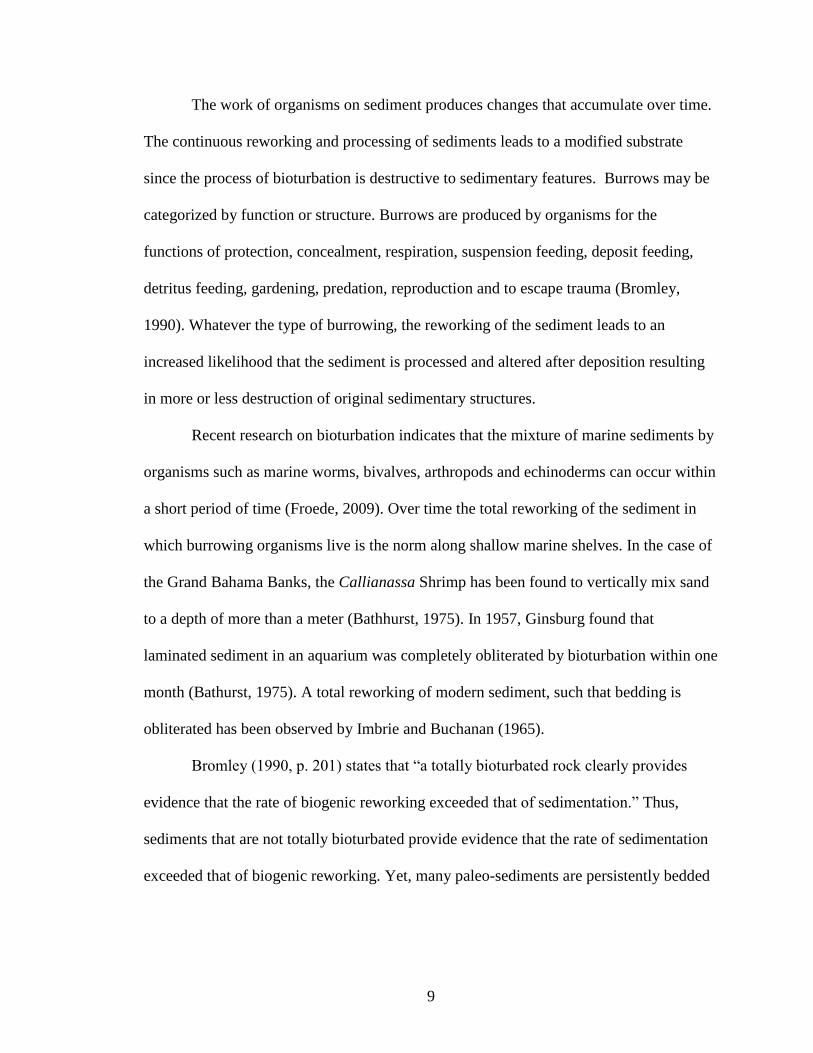
Bioturbation from Virgin Limestone Outcrops
Bioturbation in layers of the Virgin Limestone Member occurred in three beds
which were composed of fine to very fine sandstone or siltstone (Figure 8). Each of these
three beds were identified in all measured sections. These three beds (A, G & I) were
used as marker beds with the A unit in each section marking the basal bed of the Virgin
Limestone Member and I bed marking the uppermost portion of each measured section.
Besides the A, G, and I, other beds were also identified in each of the measured sections
that showed bioturbation. For example, the C bed was identified in all sections except for
B4 while the E layer was found in B5, B4 and B1 but not B3 or B2. No bioturbation was
observed in beds with a primarily clay lithology.
The treatment that best displayed the intensity of bioturbation was HCl acid etch.
Table 1 shows that while the observed intensity of bioturbation was low for all
treatments, treatment with mineral oil and HCl best displayed bioturbation. It is likely
that etching treatment was most revealing because the HCl was able to remove
carbonates that precipitated as a secondary process exposing bioturbation. Oil was also
found to be helpful in identifying bioturbation, black light and water had similar results
and as expected an untreated sample was least effective in revealing bioturbation.

31
Table 1. Comparison of the different treatments to reveal bioturbation in Moenkopi
samples from Hurricane Mesa. Numbers were derived by taking the average bioturbation
intensity of each sample and dividing by the total number of samples that were treated from
that layer.
Outcrop Textural Classification
Untreated Water Oil Etch Black Light
B1 Claystone -Very Fine
Sandstone
1.20 1.35 1.66 2.00 1.37
B2 Claystone-Fine
Sandstone
1.20 1.14 1.00 2.00 1.36
B3 Claystone – Very Fine
Sandstone
1.22 1.22 1.67 1.80 1.11
B4 Claystone Very Fine
Sandstone
1.29 1.46 1.43 1.83 1.31
B5 Claystone – Fine
Sandstone
1.13 1.25 1.67 1.67 1.18
Avg. 1.21 1.28 1.49 1.86 1.27
Table 2. B1 - Twenty-two samples from section B1 were treated to evaluate if the
treatments enhanced the visibility of bioturbation. The observed intensity of bioturbation
for all B1 samples was 1.41. This matches the observed bioturbation in other sections as
well. Overall bioturbation was relatively consistent, regardless of the treatment method
used.
Sample Textural Classification
Untreated Samples
Water Oil Etch Black Light
Average
B1D-1 Fine Siltstone 2 2 3 3 2 2.4
B1I-2 Fine Siltstone 1 1 2 1 1 1.2
B2G-1 Medium Siltstone
1 1 1 2 1 1.2
B3G-1 Coarse Siltstone
1 1 1 2 1 1.2
B4G-1 Very Fine Sandstone
2 2 2 3 2 2.2
B5G-2 Fine Siltstone 1 2 2 2 1 1.6
Avg. 1.33 1.50 1.83 2.40 1.33

32
There is a strong correlation between grain size and intensity of bioturbation found
using the different treatment methods. For example claystone showed the lowest values
when compared with siltstones and sandstones.
Figure 10. The ternary diagram shows the majority of samples had a larger grain size,
ranging from silt to sand, and a mix thereof. Clay was found to be in a minority of samples.
Furthermore, bioturbation intensity only reached the maximum of 3 in 8% of samples, an
intensity of 2 was observed in 13% of samples, while the remaining 79% of samples showed
relatively little bioturbation.

33
Middle Red Member
The Middle Red member of the Moenkopi at Hurricane Mesa fills the interval
between the lower Virgin Limestone Member and the upper Shnabkaib Member. It is
characterized by its red color and generally thin, fine-grained, stratified, mudstones and
continuous undisturbed, laminated beds (BI-1) with veins of secondary gypsum in the
lower portion of the Upper Red Member which corresponds with R1 and R2 of this study.
Crosscutting veins of gypsum were present throughout the lower and middle portions of
the Middle Red Member through the R5 site (Fig. 10).

34
Fig. 10. Outcrop view of the R1 section made up of mudstone with gypsum veins. Acid
treatment showed no evidence of carbonates or limestone.

35
The crosscutting veins of gypsum are generally about 0.5 cm thick and a white to
off-white color. While some gypsum occurred as nodules along bedding planes the
gypsum veins observed generally were not perpendicular to the bedding plane but instead
were crosscutting at a forty-five degree angle indicating that they are diagenetic. Gypsum
veins found in the Middle Red Member show cross-cutting relationships. The researchers
found no primary gypsum.
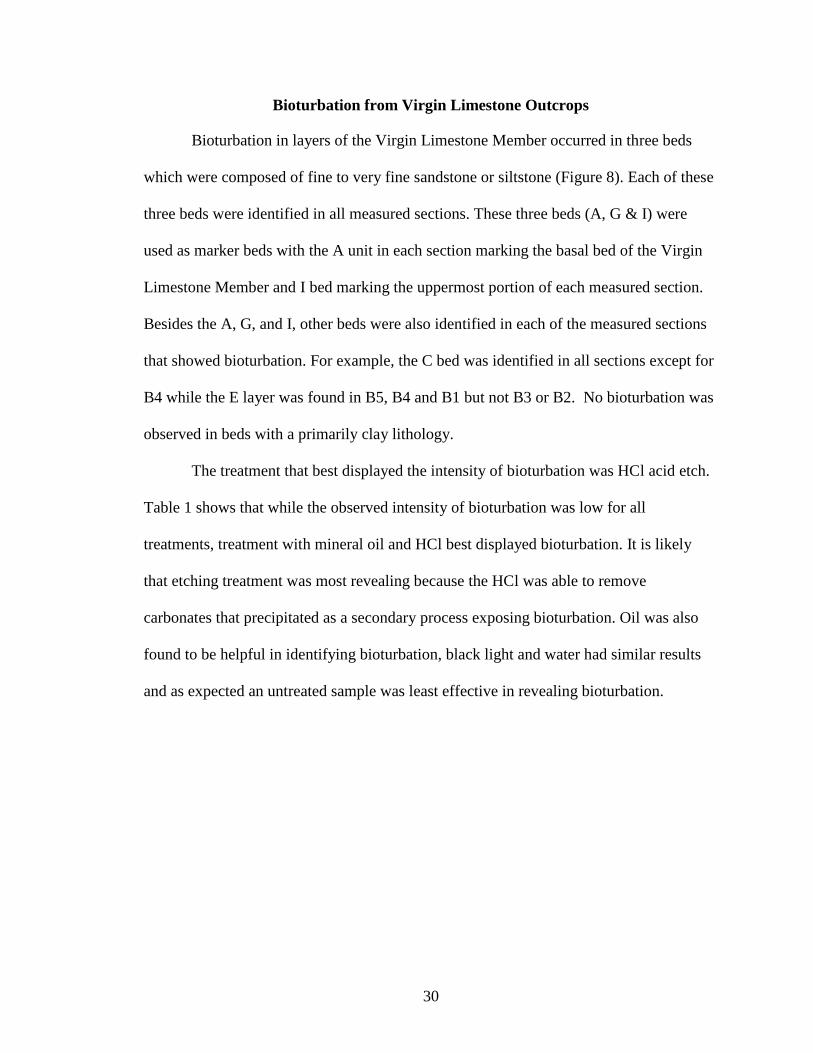
Shnabkaib Member
The Shnabkaib Member of the Moenkopi located above the Middle Red Member
was a lighter white to greenish grey color (Fig.11a) made up of thinly laminated siltstone
beds with pockets of clay and mudstones crosscut with gypsiferous sediments throughout
and reddish-brown sediments higher in the member (Appendix A, Fig. 20b). This
member corresponds to the R3, R4 and R5 sites of this study. Some possible teepee
structures were identified (Fig. 11b). In this member it was difficult to determine the
bioturbation though bedding seemed to be largely intact. The beds, when observable,
were finely laminated with abundant secondary gypsum that was similar to gypsum found
at R1. At R4 a one meter section seven meters across was investigated and no evidence of
burrowing was found (BI-1). The gypsum found at R3 and R4 appears to have been
emplaced after deposition. Located above the lighter colored sediments, reddish-brown
mudstone interlayered with siltstone and fine grained sandstone was found (Fig. 11c).
The siltstone and sandstone beds were crossbedded and no bioturbation was observed at
R5 (BI-1).
36
Fig. 11. A. Lighter colored sediments of the Shnabkaib compared to the Middle Red
Member. B. Possible teepee structures. Scale is 10cm. C. Interlayered beds of mudstone,
siltstone and sandstone.
A
B
C
Shnabkaib

37
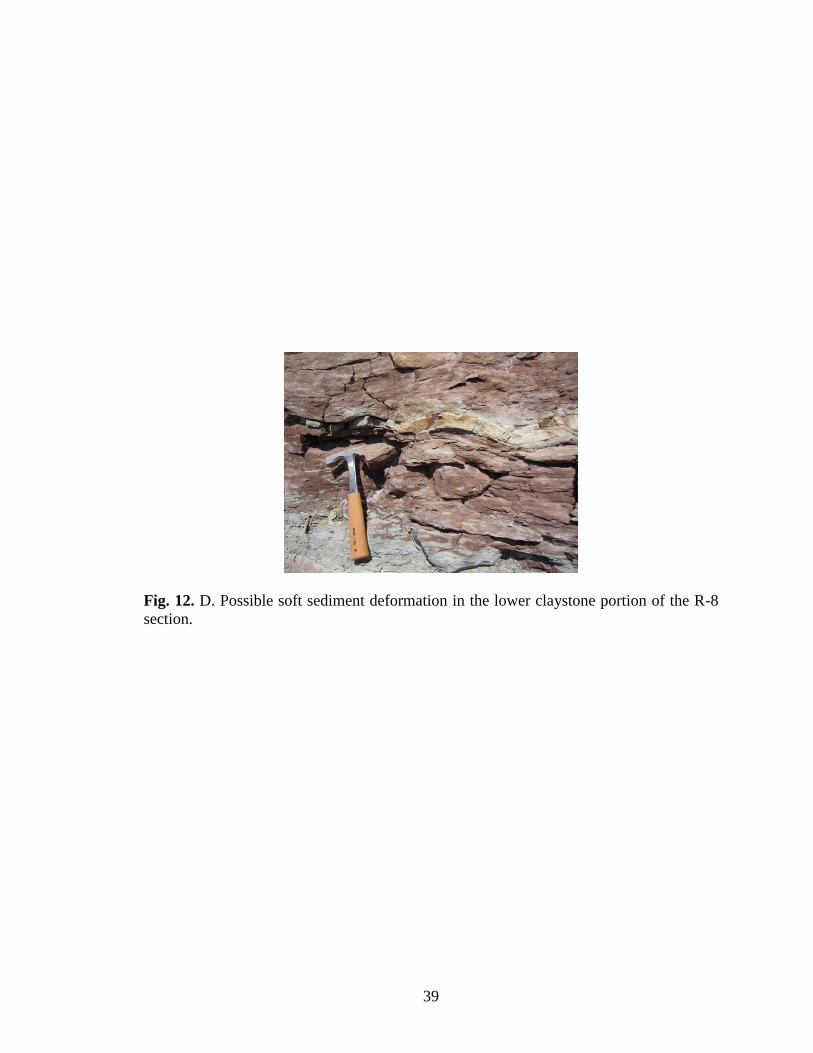
Upper Red Member
This member corresponded to the R6-R8 beds of this study and mostly consisted
of interlayered mudstone, very fine to fine grained sandstone and siltstone (Fig. 12a).
Upon closer examination, some places initially believed to be bioturbated were found to
be mudcrack related structures. Very clear examples of crossbedding were found at the
R6 stop (BI-1) (Fig. 12b). Greenish colored sediments collected at R7 were claystones
with silty clay located below an erosion resistant laminated siltstone (Fig. 12c). Some of
the finely grained orangish sediments found at R8 may be due to sulphur staining. In
general there was an increase in silt with elevation at R8, with evidence of what appears
to be soft sediment deformation (Fig. 12d).

38
Fig. 12. A. R-6. Characteristic reddish-brown sandstone and mudstone of the lower beds
of the Upper Red Member. B. R-6. Interlayered mudstone, siltstone and sandstone. Scale
= 10cm. C. R-7. Laminated claystone bed interlayered with lenses of silty clay. Scale = 10
cm.
A
B
C
39
Fig. 12. D. Possible soft sediment deformation in the lower claystone portion of the R-8
section.

40
X-Ray Diffraction Analysis
Once thin sections were made, each sample was X-rayed. Minerals were
identified using one x-ray diffractometer trace presented as natural with water and air
dried as opposed to solvation with ethylene glycol or heating (Brewster, 1980). The
associated diffraction peaks have been interpreted according to Carroll (1970). The
samples analyzed using the XRD were samples BIC-1, B5E-1, R2-3 and R3-2. The
dominant minerals identified in B1C (sandstone) were quartz, anorthite and dolomite, in
B5E-1 quartz, illite and clinochlore (Fig. 13). For the roadcut samples above the Virgin
Limestone member in the Middle Red Member the major minerals identified were quartz,
dolomite, phengitse and secondary gypsum found in fractures. R3-2 was primarily
composed of dolomite (89.3%).

41
Fig. 13 – Selected diffractograms from samples collected from bed and roadcut sites. B1C-
1 the main minerals present in this sample are quartz, anorthite and dolomite. B5E-1 mostly
made up of quartz, illite, clinochlore. R2-3 represented by gypsum, quartz and dolomite.
R3-2 mainly dolomite with a low percentage of quartz.

42
Table 3. Samples from various sections were collected analyzed for bioturbation, in order
to determine if mineralogy may have had some control in presence and degree of
bioturbation. Samples B1C-1 and B5E-2 showed signs of bioturbation, however R2-3 and
R3-2 did not show any signs of bioturbation. The only difference between the two transects
are presence of clay minerals. All samples were categorized as an intensity of 1 because
they either exhibited no bioturbation or minor amounts of bioturbation.
Sample Textural Classification
Dominant Minerals
B1C-1 Claystone -Very Fine
Sandstone
Quartz 46%
Anorthite 25.2%
Dolomite 19.5%
B5E-2 Claystone-Fine
Sandstone
Quartz 29.8%
Illite 29.5%
Halite
R2-3 Claystone – Very Fine
Sandstone
Gypsum 28.8%
Quartz 17.8%
Dolomite 16.8%
R3-2 Wackestone Dolomite 89.3%
Quartz 10.7%

43
Petrographic Analysis
The samples collected at Hurricane Mesa were analyzed using thin section
petrography in the labs at the Loma Linda University Department of Earth and Biological
Sciences. A total of fifteen thin sections were analyzed from the five measured
stratigraphic sections and nine roadcut transects. The results were plotted in ternary
diagrams and summarized (Figs. 14 & 15). B5A-1 and B5I-1 were selected for analysis
because they are siliciclastic rocks that are representative of Moenkopi siltstones and
sandstones.
Petrographic analysis of B5A-1 indicates that it is nearly a quartzite made up of
authigenic quartz grains, organics and porosity. Unlike the other A layers identified,
B5A did not have dolomite in the matrix. Dolomite is often found in supersaturated saline
environments. In contrast B5I-1 was composed of almost thirty-five percent detrital
grains, forty percent matrix and twenty-four percent organics. This suggests these grains
are remnants of living organisms.

44
Textural & Compositional Classification
Fig. 14. A. B5A-1. Thin Section – Point Count and compositional classification. B. B5I-1
Thin Section – Point Count and compositional classification.

45
Figure 15. B5A-1. classification according to Folk (1974). Folk classification shows that
the majority of feldspathic minerals have been dissolved away, showing that the preserved
sediment was re-worked over a long period of time.

46
The low intensity of bioturbation observed at Hurricane Mesa outcrops was
confirmed by petrographic analysis. In some cases, bioturbation, biogenic and
sedimentary structures that could not be identified in hand samples were identified in thin
section (Figs. 17f, 18b). Thin section analysis confirmed field observations of no
confirmed bioturbation, however evidence of soft sediment deformation, laminations,
microfossils and possible bioturbation were observed. Laminations, microfossils and
potential bioturbation were observed almost exclusively in very fine siltstone to fine
sand. No evidence of bioturbation was observed in claystone.
In general petrographic analysis confirmed that there was more bioturbation in the
beds of the Virgin Limestone Member as compared with the Middle Red, Shnabkaib and
Upper Red Members (Figs. 16 & 17).

47
Fig. 16. A.B1A-1AP1. Folding due to soft sediment deformation. B.B1A-1AP2.
Laminations with no identifiable bioturbation. C.B1D-1P2. Glauconite and fossil
fragments.
A
B
C

48
Fig. 16. D. D.B1D-1P3. Organics surrounding calcite carbonate crystals where shell
originally was. E. B4A-1P2. Representative photo of mostly continuous sandstone
laminations observed. F. B4A-1P4. Illustration of possible bioturbation.
D
E
F

49
Fig. 17. A. R3-2P1. Laminations of silt (lighter) and clay (darker) with no identifiable
bioturbation. B. R6-1P1. Representative picture of well laminated claystone, oxidized
sediment with no bioturbation. C. R8-4P1. Micritic claystone with a fossil (possible
gastropod
A
B

50
CHAPTER FIVE
DISCUSSION
The Moenkopi Formation is thought to represent depositional environments that
include tidal and shallow marine environments that persisted for some period of time.
Environments such as those found in even brackish or in estuarine modern environments
can be expected to have a high level of bioturbation. The Virgin Limestone Member
which crops out in Utah, Nevada and California was deposited during the Early Triassic
and is believed to have been part of a transgressive marine tongue from the Panthalassa
seaway to the west (Pruss & Bottjer, 2004; Blakey, 1974). The Virgin Limestone
Member commonly has bioturbation, but at a very low intensity. In this study no
evidence of bioturbation was found in the Moenkopi Formation above the Virgin
Limestone Member. The obvious question is why is there so little bioturbation? Several
factors have been suggested as possible explanations for little or no bioturbation in
paleoenvironments in which more bioturbation can be expected.
This study does not deal with the particular ichnotaxa, or seek to classify and
describe the type of burrowing observed. Rather, we are examining the occurrence and
intensity of bioturbation in order to understand better the conditions that precluded
bioturbation throughout the Virgin Limestone member.
There often is a significant difference observed between modern sedimentation
and the results of ancient sedimentation. Several reasons have been posited for lack of
bioturbation including rapid sedimentation that precludes organisms from establishing
themselves in an environment, low levels of dissolved oxygen, hypersalinity in some
cases, and low density of organisms.
D

51
One possible explanation for the low intensity of bioturbation observed is that the
Moenkopi was deposited more rapidly than currently suggested by other researchers.
Bateman et al. (2007) found that bioturbation is most intensive within the upper meter of
the surface. They believe that the primary control on bioturbation is the length of time
sediment remains within the upper 1-2 m. Time control on sediment remaining in the
upper 1-2 meters of sediment can occur from relatively rapid sedimentation, or from
relatively rapid environmental changes that lead to increased rates of deposition, or storm
events. The evidence in this case may infer both. Observed clay lithologies have well-
preserved fine laminations, suggesting little to no disturbance across the basin where we
studied, which suggests relatively rapid rates of sedimentation that precluded
bioturbation, which were interrupted by short-term storm events that transported
fossiliferous silts and sands into the basin.
Another, supplemental, explanation for the lack of bioturbation observed in
Moenkopi sediments is that there may have been a low dissolved oxygen concentration.
Low oxygen levels, resulting in a hypoxic environment would have likely resulted in the
exclusion of metazoans. In modern environments rapid deposition typically results in an
oxygen-depleted environment that leads to the premature demise of the transported
infaunal dwellers. However in our study evidence for storm processes are in the coarser
sediments, where at least some bioturbation was present. Sediment with evidence of
storm currents are not likely to be oxygen depleted.
Evidence for episodic sedimentation in the Moenkopi is supported by
sedimentation patterns throughout the measured sections. Sedimentation patterns in the
Virgin Limestone show repeated episodes of clay deposition being interrupted by coarser

52
beds of silt and fine sand. Often, these contain both sedimentary structures and fossils,
which are characteristic of storm deposits. Storm events are inferred from the herring-
bone cross stratification, coarse sediment, and unoriented conglomerations of fossils that
are characteristic of the fossiliferous silts and sands.
One frequently observed sedimentary feature in the coarser sediments of the
Moenkopi was hummocky cross-stratification. This feature usually forms during large
storms below fair-weather wave base and above storm-weather wave base. Hummocky
cross-stratification, present in the coarser units is used as an indicator of shallow marine
environments on the shore face or at times on land when large storms deposit water onto
tidal flats (Bannister 1998). Even if there was such a large storm and a bed was deposited,
modern studies suggest that all evidence of the storm should be erased in a short time by
bioturbation. In 1961 after Hurricane Carla hit the Texas coast depositing a bed of
sediment it was bioturbated to the point that it was indistinguishable from lower sediment
within twenty years (Dott, 1983). Such intense bioturbation was not found in the
Moenkopi sediments.
While the Virgin Limestone member has fossils and burrows, they are limited to
the non-clay lithologies. Clay lithologies show no observable bioturbation, even in thin
section, are not calcareous, and the laminations in all thin sections observed are well-
preserved. These criteria often are associated with deeper water below wave base.
Interruptions in the clay lithology are thought to be storm events that have the energy to
transport coarser grains into the basin. The coarser units also suggest that the clay
depositional environments differed significantly from the origin of the coarser sediment,
as abundant fossils are found in some units, while no fossils are found in the clay units.
53
It has been suggested that another possible reason for the low level of bioturbation
in some Triassic sediments may be that the abundance of organisms was greatly reduced
at the Permian mass extinction (Ausich & Bottjer, 1982, 2002). Pruss and Bottjer (2004),
speculate that the low levels of deep bioturbation found in some Early Triassic
environments is evidence that there was a return to Cambrian style substrates that may
have been triggered by environmental stress of some sort. This explanation is made based
on a comparison between end-Permian substrates with a pronounced mixed ground as
compared with Early Triassic marine substrates which evidence a return to the low levels
of vertical bioturbation that are typical of Cambrian substrates (Ausich & Bottjer, 2002).
The density of organisms following the Permian extinction may have been low enough
that evidence of bioturbation was not recorded or no bioturbation occurred.
The gypsum found in the Middle Red Member has been interpreted as
representing a restricted sabkha like environment. The marine water along with a
restricted environment and the increasing temperatures that are thought to have
characterized the Triassic are believed to have resulted in ideal conditions for the
precipitation of gypsum. Numerous researchers working in different parts of the
Moenkopi have interpreted the presence of gypsum as evidence of an arid environment
(Lambert, 1980; Bannister, 1998). However, this research was unable to corroborate
those findings at our research area. At Hurricane Mesa, no evidence of primary gypsum
was found; gypsum was only found in fractures. Furthermore, the alternation between
sand, silt and clay indicate that it is unlikely that the paleo-environment at Hurricane
Mesa was always a tidal flat.

54
Both the bedding and roadcut exposures of the Moenkopi Formation investigated
along Mesa Road at Hurricane Mesa display little evidence of bioturbation. However
research on depositional environments such as the Bahama Banks that are thought to
correspond in some ways to the depositional environment found in southwestern Utah
during the Triassic when the Moenkopi was deposited should be more bioturbated and
display more biogenic features. At the time the Virgin Limestone Member of the
Moenkopi Formation was deposited during the early to middle Spathian a major
transgression deposited carbonate facies in what appears to be coastal and marine
conditions. Much of Utah was located near the equator, which seems likely to have
resulted in an environment more suitable to burrowing organisms (Mickelson et al.,
2006). However, the transgressive sequence observed by other researchers, may suggest
that basinward deposition was significantly different from landward deposition, which
included significant biological contributions.
The low levels of bioturbation in the Moenkopi Formation in Southwestern Utah
remain somewhat puzzling. Portions of the formation may have had low oxygen levels,
inhibiting bioturbators, but this does not seem likely in the higher energy conditions
during parts of the Virgin Limestone deposition. Second, both episodic and secular
sedimentation rates suggest relatively rapid sedimentation in the basin that helped
preclude colonization in the study area. There may have been other factors reducing the
presence of bioturbators, but the nature of these factors remains uncertain.

55
Conclusions
The Moenkopi Formation at Hurricane Mesa in Utah exhibits remarkably little
bioturbation. The minimal amount of bioturbation observed is unusual when compared
with modern shallow marine environments such as the Bahama Banks. While many
factors may have played a role in the lack of bioturbation observed, it is unlikely that all
of those factors remained constant and continued to impact bioturbation during nearly the
entire deposition of the Moenkopi. Rather, it seems likely that sedimentation rate
exceeded bioturbation rate, or bioturbators were rare during this interval.

56
REFERENCES
Ausich, W. I., Bottjer, D.J. (1982). Tiering in Suspension-Feeding Communities on Soft
Substrata throughout the Phanerozoic. Science, 216, 173-174.
Ausich, W. I., Bottjer, D.J. (2002). Sessile Invertebrates. Oxford: Blackwell Science.
Bannister, K. (1998). Sedimentation, Stratigraphy, and Paleoenvironments of the Lower
Members of the Carmel Formation (Middle Jurassic, Southwestern Utah). Walla
Walla: Whitman College.
Bateman, M. D., Boulter, C. H., Carr, A. S., Frederick, C. D., Peter, D., & Wilder, M.
(2007). Preserving the palaeoenvironmental record in Drylands: Bioturbation and
its significance for luminescence-derived chronologies. Sedimentary Geology,
195(1–2), 5-19.
Bathhurst, R. (1975). Carbonate Sediments and Their Diagenesis. New York: Elsevier
Scientific Publishing Company, Inc.
Blakey, R. C. (1974). Stratigraphic and Depositional Analysis of the Moenkopi
Formation, Southeastern Utah: Utah Geological and Mineral Survey.
Brewster, G. R. (1980). Effect of Chemical Pretreatment on X-Ray Powder Diffraction
Characteristics of Clay Minerals Derived from Volcanic Ash. Clays and Clay
Mineral, 28.
Bromley, R. G. (1990). Trace Fossils: Biology and Taphonomy. Boston: Unwin Hyman.
Cadigan, R. A. (1971). Petrology of the Triassic Moenkopi Formation and Related Strata
in the Colorado Plateau Region. Washington: U.S. Atomic Energy Commission.
Carroll, D. (1970). Clay minerals, a guide to their X-ray identification: Geol. Soc. Am.,
Special Paper 126, 80 pp.
Dott, R. H., Jr. (1983). Episodic sedimentation; how normal is average? How rare is rare?
Does it matter? Journal of Sedimentary Petrology, 53(1), 5-23.
Dubiel, R. F. (1994). Triassic Deposystems, Paleogeography and Paleoclimate of the
Western Interior, Mesozoic Systems of the Rocky Mountain Region, USA. In M.
V. Caputo, Peterson, J.A., Franczyk, K.J. (Ed.), (pp. 133-168). Denver: Society
for Sedimentary Geology.
Droser, M. L., & Bottjer, D. J. (1986). A semiquantitative field classification of
ichnofabric. Journal of Sedimentary Research, 56(4), 558-559.
57
Emery, W.B. (1918). The Green River Desert section, Utah: American Journal of
Science, 4(46), 551-577.
Fillmore, R. (2000). The Geology of the Parks, Monuments, and Wildands of Southern
Utah. Salt Lake City: University of Utah Press.
Folk, R. L. (1954). The distinction between grain size and mineral composition in
sedimentary rock nomenclature. Journal of Geology, 62(4), 344-359.
Froede Jr., C. R. (2009). Sediment Bioturbation Experiments and the Actual Rock
Record. Journal of Creation, 23(3), 3-5.
Ginsburg, R.N. (1957). Early Diagenesis and Lithification of Shallow-Water Crarbonate
Sediments in South Florida. In: R.J. Le Blanc and J.G. Breeding (Editors)
Regional Aspects of Carbonate Deposition – Soc. Econ. Paleontologists
Mineralogists, Spec. Publ., 5: 80-98.
Howard, J. D. (1975). The Sedimentological Significance of Trace Fossils. In R. W. Frey
(Ed.), The Study of Trace Fossils: A Synthesis of Principles, Problems, and
Procedures in Ichnology (pp. 131-146). New York: Springer-Verlag.
Imbrie, J., Buchanan, J. (1965). Sedimentary Structures in Modern Carbonate Sands of
the Bahamas. In G. V. Middleton (Ed.), Sedimentary Structures and their
Hydrodynamic Interpretation (pp. 149-172): Society for Sedimentary Geology.
James, N. P., Dalrymple, R.W. (Ed.). (2010). Facies Models 4. Canada: Geological
Association of Canada.
Lambert, R. E. (1980). Shnabkaib Member of the Moenkopi Formation: Depositional
Environment and Stratigraphy near Virgin, Washington County, Utah. (M.S.),
Bringham Young University, Salt Lake City.
Marenco, K. N., & Bottjer, D. J. (2008). The importance of Planolites in the Cambrian
substrate revolution. Palaeogeography, Palaeoclimatology, Palaeoecology,
258(3), 189-199.
McKee, E. D. (1938). Environment and History of the Toroweap and Kaibab Formations
of Northern Arizona and Southern Utah (pp. 268). Washington D.C.: Carnegie
Institute.
McKee, E. D. (1954). Stratigraphy and History of the Moenkopi Formation of Triassic
Age. Baltimore, MD: United States Geological Survey.
McKinney, F. K. (1983). Ectoprocta, (Bryozoa) From the Permian Formation, Grand
Canyon National Park, Arizona: Appalachian State University.

58
Meysman, F. J. R., Middelburg, J. J., & Heip, C. H. R. (2006). Bioturbation: a fresh look
at Darwin's last idea. Trends in Ecology & Evolution, 21(12), 688-695.
Mickelson, D. L., Milner, A. R. C., Deblieux, D. D., & McGuire, J. L. (2006). The Oldest
Known Early Triassic Fossil Vertebrate Footprints in North America, From Zion
National Park, Utah Fossils from Federal Lands: New Mexico Museum of
Natural History and Science.
Peters, S. E. (2007). The problem with the Paleozoic. Paleobiology, 33(2), 165-181.
Pruss, S. B., & Bottjer, D. J. (2004). Early Triassic Trace Fossils of the Western United
States and their Implications for Prolonged Environmental Stress from the End-
Permian Mass Extinction. PALAIOS, 19(6), 551-564.
Reeside, J. B., Bassler, H. (1922). Stratigraphic Section in Southwestern Utah and
Northwestern Arizona: U.S. Geological Survey.
Sarkar, S., & Chaudhuri, A. K. (1992). Trace fossils in Middle to Late Triassic fluvial
redbeds, Pranhita-Godavari Valley, South India. Ichnos [Chur, Switzerland], 2(1),
7-19.
Stewart J.H., P. F. G. H., Wilson, R.F. (1972). Stratigraphy and Origin of the Triassic
Moenkopi Formation and Related Strata in the Colorado Plateau Region.
Washington: U.S. Atomic Energy Commission.
Stokes, W. L. (1950). Pediment Concept Applied to Shinarump and Similar
Conglomerates (Vol. 61, pp. 91-98): Geological Society of America Bulletin.
Stow, D. A. V. (2012). Sedimentary Rocks in the Field: A Color Guide (6 ed.). Waltham:
Academic Press.
Taylor, A. M., & Goldring, R. (1993). Description and analysis of bioturbation and
ichnofabric. Journal of the Geological Society, 150(1), 141-148.
Ward, L. F. (1901). Geology of the Little Colorado Valley. American Journal of Science,
Series 4 Vol. 12(72), 401-413.
White, D. (1921). Shorter Contributions to General Geology. Washington: United States
Geological Survey.
Wilson, F. W., Stewart, J.H. (1967). Correlation of Upper Triassic and Triassic (?)
Formations Between Southwestern Utah and Southern Nevada. Washington: U.S.
Atomic Energy Commission.

59
APPENDIX A
STRATIGRAPHIC
Detailed Description of Stratigraphic Sections
Section B5
The base of this section is 4.5m of fine to very fine calcareous sandstone (B5A)
with parallel laminations (2mm) and herringbone cross-stratification (Figure 9) with a
bioturbated layer 2.3m above the base. The entire 4.5m bed had a bioturbation intensity
of 1. It is overlain by a 1.5m bed of grey claystone with a bioturbation intensity of 1
(B5B) and a 48cm bed of fine to very fine calcareous sandstone (B5C) displaying ripples
scaled at a bioturbation intensity of 1 followed by a bed of 4.9m of brownish-purple
claystone (B5D) (intensity 1). The next bed corresponds to very fine sandstone (B5E)
and a bioturbation intensity of 1 with a thickness of 18cm which is overlain by a 1.43m
grey claystone (B5F) with no observable bioturbation (intensity 1). Continuing upwards
is 2.2m of alternating siltstone and very fine calcareous sandstone (B5G) with no
observable bioturbation (Fig. 18). B5G exhibits both parallel and hummocky cross-
stratification and is overlain by 5.3m of brownish-purple claystone (B5H) displaying a
bioturbation intensity of 1. The top of this section is capped by 1.3m of bioturbated
(average intensity 1.5) very fine sandstone (B5I).
Section B4
The base of this section is 5.8m of very fine light grey sandstone alternating with
siltstone and lenses of clay before grading back into sandstone with lots of silt (B4A).
B4A had parallel laminations lower and a bioturbated layer that was approximately two

60
meters above the base. Above the bioturbated layer, evidence of a change in water
velocity is evidenced by an immediate transition from the bioturbated layer to a
hummocky cross stratified layer before a sharp contact with planar laminations truncating
the hummocky cross stratified lower portion. The upper portion is marked by a 4-5cm
layer that is burrowed at an intensity of 3 before transitioning into planar laminations (2-
4mm). The average intensity of bioturbation for all four samples collected at B4A is 1.5.
The B4A sandstone and siltstone is overlain by a 7.5m bed of brownish-purple claystone
(B4D) with no observable bioturbation (Fig. 10). The next bed corresponds to very fine
sandstone (B4E) with a thickness of 14cm with evidence of bioturbation (intensity 1)
lower in the layer and displaying ripples. Above the layer exhibiting ripples is a 1.75m
bed of grey claystone (B4F) with no observable bioturbation. Continuing upwards there
is a 2.20m bed of very fine sandstone (B4G) which displays reverse grading from very
fine to fine sand at the top of this layer (Fig. 19). Throughout this 2.2m bed very few
vertical burrows were identified except for the uppermost 3-4cm. The top 3-4cm of B4G
is marked by what appears to be the casts of numerous bivalves with evidence of tool
marks and heavy bioturbation in some places (intensity 3) when moving laterally to the
right towards the B3 Section. The average intensity of bioturbation of the samples
collected from B4G was 2. B4G is overlain by 3.85m of grayish claystone (B4H) with no
observable bioturbation. The top of this section is capped by 1.4m of bioturbated
(intensity 2) very fine sandstone (B4I).
Section B3
The base of this section is 3.5m of siltstone with lenses of clay and mud between

61
siltstone layers (B3A). Possible storm deposit is evidenced by planar laminations
abruptly transitioning into hummocky cross bedding on left of outcrop with rare (only 2
burrows) evidence of bioturbation (intensity 1) within a 50m lateral section (Fig. 11). It
is overlain by 1.8m of brownish-purple claystone (B3B) with no observable bioturbation
followed by 12cm of sandstone (B3C) displaying ripples but no bioturbation (intensity 1).
The next bed is 6.1m of brownish-purple claystone (B3D) with no observable
bioturbation followed by 1.5m of siltstone (B3G) with scattered horizontal burrows
(intensity 1) that cover between 1-5% of the surface. B3G is overlain by 5m of
brownish-purple claystone (B3H) with no observable bioturbation. The section is capped
by a 1.2m layer of fine to very fine fossiliferous bioturbated sandstone which transitions
into calcareous siltstone (B3I) with a bioturbation intensity of 1.5.
Section B1
The base of this section is 3.5m of finely laminated (1/2-1mm) very fine
sandstone transitioning into very fine calcareous sandstone (B1A) with less than 1%
clasts with very rare burrows along a 10-15m lateral section which transitioned from no
laminations to laminated. B1A exhibits both planar laminations and hummocky cross
stratification above the planar laminations. The average intensity of bioturbation for B1A
was 1. It is overlain by a 1.4m bed of brownish-purple claystone (B1B) where a bivalve
but no bioturbation (intensity 1) was found followed by a 30cm bed of fossiliferous
(intensity 1) siltstone displaying ripples and a 5.83m bed of brownish-purple claystone
(B1D) exhibiting no bioturbation (intensity 1). The next bed corresponds to a siltstone
(B1E) with a thickness of 25cm (intensity 2) which is overlain by a 1.65m bed of grayish

62
claystone (B1F) with no observable bioturbation. Above BIF is observed a 1m bed of
very fine bioturbated (intensity 2) sandstone (B1G). Continuing upwards, the next bed is
4.5m of brownish-purple claystone (B1H) with no observable bioturbation. The section
is capped by 1.65m bed of very fine sandstone in which the last 25-35cm layer of very
fine bioturbated sandstone (B1I) displays extensive horizontal but not vertical
bioturbation at the top (intensity of 1.5).
Section B2
The base of this section is 3.3 meters of calcareous sandstone (B2A) with minimal
bioturbation (intensity 1) that displays reverse grading from very fine to fine sand (Fig.
20). While more bioturbation was found in this bed than others, there was not enough to
obscure sedimentary structures or destroy evidence of laminations, bioturbation in this
bed included both horizontal as well as vertical burrowing. Lower in the bed a 2-3cm
layer of planar laminations are observed with some vertical burrowing which is abruptly
truncated by hummocky cross-stratification. It is overlain by a 1.5m bed of
unbioturbated (intensity 1) of brownish-purple claystone (B2B) followed by a 10cm bed
of very fine sandstone that displays ripples but no bioturbation. In section B2, the D bed
observed in B1, B3, B4 and B5 was broken into three lithologies. Those beds were
labeled B2D-1, B2D-2 and the brownish purple claystone that corresponds to the
brownish purple claystone found in each of the other sections (Fig. 12). This claystone
bed had no observable bioturbation (intensity 1). B2G corresponds to the B4G bivalve
bed and is made up of 1.3m of very fine calcareous sandstone with mudclasts with
possible but unconfirmed bioturbation. B2G is overlain by 5.24m of brownish-purple

63
claystone (B2H) with no observable bioturbation. The top of this section is capped by
1.7m of comparatively bioturbated (intensity 1) very fine sandstone (B2I) that displays
both horizontal as well as vertical bioturbation.

64
Fig. 18. A. B1B-1 Brownish-purple claystone that is characteristic of the measured
sections of the Virgin Limestone member at Hurricane Mesa (bioturbation intensity 1). B.
B5D (brownish purple claystone transitioning into brownish grey shale); B5E (siltstone);
B5F (brownish grey shale); B5G (sandstone with mudclasts grading into very fine
sandstone and siltstone). C. B4A Generalized features of this 5.8m bed represented by
mostly very sandstone grading into siltstone with lenses of clay before grading back into
sandstone with lots of silt.
A
B
C
B4A
B5D
B5E
BFE
B5G

65
Fig. 19. In this picture B1A-B1G layers are observed. From the bottom to the top, B1A
(very fine sandstone); B1B (siltstone); B1C (brownish purple claystone); B1D (siltstone
with clay interclasts transitioning to fossiliferous siltstone with clay interclasts); B1E
(brownish purple claystone); B1G (very fine calcareous sandstone transitioning into
bioturbated sandstone).
B1A
A
B1B
B1D
DD
B1E B1F
B1G

66
Figure 20 – A. B2A, 3.3m calcareous laminated bioturbated siltstone displaying reverse
grading into sandstone B. Gypsum veins crosscutting mudstone. C. Gypsum veins in
mudstone. Round greenish colored balls in middle third of outcrop was due to staining.
A
B
B2A
C

67
Figure 20 – D. A,G & I marker beds with the C bed that was identified in all measured
sections except for B4.
D I - Bed
G - Bed
A - Bed

68
APPENDIX B
PETROGRAPHIC PICTURES
Thin Section Preparation
Standard glass slides were ground until the surface was parallel to the grinding
wheel. The slides were then polished until the grooves and chips were gone, using 400
grit powder on a glass block. 600 and 800 grit were used successively to polish the slide
until there were no visible marks on the surface when viewed with a 10x hand lens. Rock
chips were cut by first impregnating the sample with a heat-cured 2 part, epoxy and resin.
After curing at least one day, the samples were cut into 3/4" slabs, and then cutting chips
with dimensions at least 1 mm from the edge of the glass slide. The rock chips went
through the same polishing process as the glass. After the chips were dried in an oven
overnight, they were then glued to the slides using UV-cured adhesive. After at least one
hour, the chips were cut to approximately 150 microns thick. The chips were then ground
on a wheel until they were 30-50 microns thick. The chips were then polished using 600
and 800 grit on a glass block until the blemishes were no longer visible.
Resulting thin sections are shown in Figure 21.

69
Fig. 21. A. B3A-1P2. Picture of bioturbation found in dolomitic clay. B. B3A-1P4.
Possibly dissolved fossil (organic) or cast filled with organic matter. C. B4F-1P3. Picture
of a more bioturbated area found.
A
B
C

70
Fig. 21. D. B4F-1P4. Possible shell remnant, fossil surrounded by carbonates and clay. F.
B5A-1P1. Picture of calcitic shell remnant of microfossil. G. B5H-1P1. Representative
picture.
D
F
G

71
Fig. 21. H. R9-1QP2. High in organic matter, no evidence of bioturbation.
H

72
APPENDIX C
BIOTURBATION AND SEDIMENTARY STRUCTURES
PHOTOS OF CUT AND POLISHED SECTIONS, AND OF SOME
OTHER SAMPLES SHOW DETAILS OF SEDIMENTARY
STRUCTURES AND SOME BIOTURBATION (FIG. 22 AND 23).

73
Fig. 22. A.R5 – Cross-section showing ripple cross-bedded sandstone with no evidence of
bioturbation (BI-1). All foresets are well-preserved B. B1-I Planar view of a bioturbated
silty-sandstone. The sample shows horizontal burrows while cross-section showed no
vertical bioturbation. C. BI-2 Cross-section of a mottled planar bioturbated sandstone (BI-
3).
A
B
C

74
Fig. 22. D. Cross-section of a bioturbated sandstone. Burrows are mostly horizontal with
a few vertical burrows. Some original bedding is preserved in the lower portion of the
sample (BI-3). E. B2C. Rippled sandstone (BI-1) F. B2C. Rippled sandstone (BI-1).
D
E
F

75
Fig. 23. A.R2-1 – Gypsum veins. B. Sandstone with evidence of planar burrowing. C.R-
9 – Planar-laminated siltstone (BI-1).
C
B
A

76
Fig. 23. D. Cross-section of an bioturbated sandstone. Burrows are mostly horizontal with
a few vertical burrows. Some original bedding is preserved in the lower portion of the
sample (BI-3). E.B4G – An allochthonous fossiliferous sandstone unit of bivalves believed
to have been transported because none were found life-like positions. F. Clear evidence of
planar bioturbation was observed on this mottled sandstone.
D
E
F