tardir/mig/a302521 - defense technical information center mr. stephen a. adamec, director, dod high...
TRANSCRIPT

Technical Report ITL-95-11 October 1995
US Army Corps of Engineers Waterways Experiment Station
Application of Data Sonification for Enhanced Interpretation of Numerical Model Results
by Julia A. Baca
PEL % DEC 2 9 1995 1 H
i li f:51%
Approved For Public Release; Distribution Is Unlimited
19951227 034
Technical Report ITL-95-11 October 1995
Application of Data Sonification for Enhanced Interpretation of Numerical Model Results by Julia A. Baca
U.S. Army Corps of Engineers Waterways Experiment Station 3909 Halls Ferry Road Vicksburg.MS 39180-6199
Accesion For
NTIS CRA&I S DTIC TAB □ Unannounced □ Justification
By Distribution/
Avaüabiüty Codes
Dist Avail £
Spe ind/or cial
Final report Approved for public release; distribution is unlimited
US Army Corps of Engineers Waterways Experiment Station
HEUMUMTBS •ULMNO
ram MIJWIHHI,I,H»CT;
PUBLIC AFFAIRS OFRCE
ILS-AMfYENOINEEK WATERWAYS EXPEMENT STATION
WO» HALLS FERRY ROAD wcKsaum, mjm'i'i »MMIM PHONE: (H1)«M-2gB
OFflHBVMTiaN -1» *IM
Waterways Experiment Station Cataloging-in-Publication Data
Baca, Julia A. Application of data sonification for enhanced interpretation of numerical model results / by
Julia A. Baca. 12 p.: ill.; 28 cm. — (Technical report; ITL-95-11) 1. Electronic data processing. 2. Science — Data processing. 3. Visualization. 4.
Human-computer interaction. I. United States. Army. Corps of Engineers. II. U.S. Army Engineer Waterways Experiment Station. III. Information Technology Laboratory (U.S. Army Engineer Waterways Experiment Station) IV. Title. V. Series: Technical report (U.S. Army Engineer Waterways Experiment Station); ITL-95-11. TA7W34no.lTL-95-11

PREFACE
This report documents a project to investigate the development of auditory
mappings to augment interpretation of numerical model results via a scientific
visualization. The work described in this report was performed by Ms. Julia A. Baca of
the Information Technology Laboratory (ITL) of the US Army Engineer Waterways
Experiment Station (WES) under the direction of Dr. N. Radhakrishnan, Director, ITL;
Mr. Stephen A. Adamec, Director, DoD High Performance Computing Center (HPCC);
and Mr. Bradley M. Comes, Program Manager of the Scientific Visualization Center.
Other personnel making major contributions to this work were Dr. Reed L. Mosher and
Mr. Michael E. Pace, ITL.
The Director of WES is Dr. Robert W. Whalin. The Commander is COL Bruce K.
Howard, EN.
1. Introduction
Techniques for visualizing scientific data have advanced remarkably in recent years. Nonetheless, current techniques remain inadequate for certain classes of problems. Examples include studies with multivariate data as well as complex time-dependent problems. Research indicates that technologies engaging a fuller realm of human perception, incorporating such senses as hearing and touch as well as sight, can be effective for interpreting these classes of problems [1]. In addition to the requirements of existing problems, the scope and size of problems in the near future, extending into the teraflop range, will demand innovative solutions for interpreting results. The U.S. Army Corps of Engineers Waterways Experiment Station (WES) Scientific Visualization Center is currently investigating an experimental technology for data interpretation, data sonification. This paper examines this new technology and discusses the results of our investigations to date.
2. Background
Researchers have been interested in the applications of sound in computer technology for over a decade. Interest in the area has increased as sound synthesis techniques have improved, making it possible to produce digital audio signals in real time. Much of the initial research in the area was motivated by the need to use sound in the development of computer- human interfaces for the blind and visually impaired [2]. Included in this larger goal was the attempt to use sound to interpret data, eventually termed data sonification. However one categorizes the research, the literature indicates common issues to be addressed and shared findings upon which to draw to effectively use audio in computer-human interaction.
Initial research indicated that the human auditory system possessed unique attributes which could be used more fully in developing the computer-human interface [3]. Analogous to its visual counterpart, the human auditory system can perceive certain physical dimensions of sound, such as pitch, volume, and duration. These lower level physical dimensions can be isolated and manipulated to present information similar to the way in which the visual attributes of an object such as shape, size or color may be used [3],[4]. At a higher level, human hearing represents a continually open channel and can thus function in the background, detecting information without requiring full conscious attention. Gaver employed audio cues in the Sonic Finder, which adds auditory icons to the Macintosh File Finder [5]. The auditory icons serve an alerting function and do not require the full attention of the user.
Early research also revealed that certain kinds of information are possibly better understood aurally than visually, such as time-varying, logarithmic, and multivariate data [6], [3], [7]. Finally, initial research demonstrated that any efforts to employ sound in computer-
1

human interaction must address certain fundamental questions: What are the most appropriate mappings of information to sound and how can these mappings be determined? Also, how do human auditory and visual perception interact and how can this be maximally used to convey information? [8], [2].
Current research has attempted to address issues raised in the initial investigations. Evaluations of two recent studies conducted at the National Center for Supercomputing Applications (NCSA) and the University of Lowell, were helpful in determining a strategy for applying sonification in the WES research environment.
Researchers at NCSA have employed a sound specification system to test the effectiveness of sonification in assisting scientists to analyze complex data [9]. The research team explored the problem of generating optimum data-to-sound mappings by testing both "abstract" and "data-related" mappings. The mappings were based on Gentner's concept of object analogies in which a sound is made suggestive of the process being represented, and alternatively, relation analogies in which a process or relationship between objects is mapped to a sonic parameter or relation between parameters [10]. The mappings were applied to data from selected NCSA-produced scientific visualizations. The project culminated in the production of sonifications which augment the selected visualizations.
Researchers at the University of Lowell have examined the effectiveness of sound in multivariate data interpretation, particularly the interaction between aural and visual perception in the interpretive process [2], [11]. The project entailed construction of an exploratory visualization tool, Exvis, which seeks to exploit the human ability to perceive texture, both visually and aurally. Each data sample is represented by a visual icon which has an auditory component. The user can sweep through a field of multi-dimensional visual icons, using a mouse, and hear corresponding auditory icons [11].
3. Applying Sonification in the WES Research Environment
The previous two studies were relevant to the goals of the visualization center for several reasons. Both studies involved the use of audio in interpreting complex data. More importantly, each study emphasized the visual as well as auditory elements of the interpretive process. This was significant since a primary component of the center's mission is to provide visualization services to the WES and other DoD research communities. A combination of the two approaches appeared optimum for detenriining the viability of applying sonification as an interpretive technique.
Consequently, a multi-phased strategy was formed. The first phase would entail working with a research team to construct auditory mappings for a data set. Contingent upon the interest of the researchers involved, a second phase would involve synchronizing the

auditory mappings with a visualization. The third phase, integration of auditory components into a visual display, would be undertaken dependent on the success of the second phase.
3.1. Selection of Data for Investigation
Certain criteria were considered when selecting the initial project to which sonification would be applied. First, the project would be selected from existing visualizations. This would minimize the start-up time on the investigation, building on an existing familiarity with the project and relationship with the researchers. Also, the project would need to involve data with sufficient complexity to require alternative interpretive techniques.
A time-dependent numerical model of the Snell Lock on the Saint Lawrence Seaway was chosen for the initial project [12]. The simulation models layers of backfill soil being placed on the lock to determine the point at which the stress produced by the soil layers would cause a crack in the structure to occur. This project fit the criteria set forth. A non- linear, two-dimensional soil-structure interaction finite element model, the simulation spanned a sequence of forty construction stages. In addition, a visualization of the project had recently been completed.
For the initial mappings, one parameter, stress, was chosen to be mapped to sound. Further, a single point on the corner of the culvert of the lock was selected to be sonified over time for the length of the animation. This point was selected because it was located in a position of maximum tensile stresses where a crack had actually formed in the model. Figure 1 shows the model at the construction stage in which the crack began to form. Shaded areas on the model represent stress contours; the area in red indicates the initiation of the crack.
3.2. Mapping the Data to Sound
To construct the data mappings, an evaluation of what audio might add to the interpretation of the problem was required. First, it could increase the viewer's sense of engagement in the problem, particularly conveying an overall sense of the shift in data values from compression to tension. Secondly, it could provide warning signals, indicating specifically when the data crossed zero or when the data exceeded the predetermined threshold at which a crack could occur. Once these determinations were made, it was possible to begin constructing the mappings of data to sound.
The mappings were constructed using a microcomputer-based sound specification system, offering high-level auditory tools [13]. Initial effort focused on representing the shift in values from compression to tension. To increase the user's sense of engagement, a lower- pitched, fuller sound was selected to represent compression, and a higher-pitched, thinner

sound to represent tension. A mapping was constructed which transmitted values representing compression through a low-pass filter and those representing tension through a high-pass filter.
3.3 Observations of the Researcher
The researchers were asked to listen to the initial mapping of the data without the visualization and give their observations. They indicated that although it was possible to perceive a general impression of the shift in values, it was difficult to discern any specific information about the data, particularly without the visual information present. A second data mapping was then constructed which produced a short, cuffed sound at the specific point at which the data values crossed zero. When evaluating this mapping, the researchers acknowledged that this provided more specific information, but again reported feeling "lost" without the visuals. Also, no attempts had been made to represent the threshold values in the data. Although the relief in stress occurring after the crack could be heard, the change in sound was too gradual to discern at what point this occurred.
3.4. Second Iteration for Data-to-Sound Mappings
Gaver's use of realistic sounds in the Sonic Finder [5] and Gentner's object analogies used by Craig and Scaletti [10], provided a basis for the second set of data mappings. To emulate the sound of concrete under stress, the data was mapped to generate random pulses which decreased in width while increasing in both speed and resonant frequency as the data values increased. This mapping produced as sound more suggestive of cracking concrete than the initial mapping. It also conveyed more distinctly the change in values, particularly the decrease in tensile forces once the crack had occurred.
The researchers were asked again to listen to only the auditory mappings of the data. They felt the more realistic sound better enhanced a sense of immersion in the data model. They also indicated that it more distinctly conveyed the change in data values, particularly the decrease in tension coinciding with the crack. Since this mapping had achieved the largest number of original objectives for the project, it was selected to be synchronized with the visualization.
3.5. Synchronizing Audio with Visualization
To synchronize the audio with the visualization, the frame rate for the data samples in the animation was first ascertained. The audio was then recorded at that frame rate to an Audio Interchange File Format (AIFF) file on computer disk and transmitted to videotape where it was synchronized with a videotape of the visualization. Playing the video with the

sonification showed that the threshold was actually exceeded prior to its indication on the visual display.
4. Results
The engineers presented the video to their sponsors who indicated a high level of interest in further examination of what the technology might provide for data interpretation. Although some new information was gained from the video, much of the information was redundant. This redundancy served to increase a sense of immersion in the model world of the data and hence, added value to the visual display. However, an interactive display allowing the researchers to move through the data visually, using audio as a probe, could potentially provide new information, such as locating areas of high stress.
We are currently implementing an auditory interface to accompany the visualization tool used for the data. The principal problem encountered thus far has involved integration of the microcomputer-based audio subsystem into the display architecture, a high- performance graphics workstation. This problem has been temporarily solved through a serial connection between the two systems.
5. Conclusions
Several objectives were accomplished in this investigation. Auditory mappings of complex, time-dependent data were constructed. These mappings were used to augment a visualization which was favorably received by both the engineers and their sponsors. As
-originally planned, based on the success of the previous phases, construction of an auditory interface has been undertaken. Nevertheless, several issues remain open for exploration. For example, although the construction of the mappings was based on earlier research, more rigorous tests should be administered to ascertain the effectiveness of these mappings. Also, the interaction between sound and graphics should be examined more closely. Finally, although a temporary solution was obtained for integrating the audio subsystem with the display architecture, the lack of easily integrated high-end sound synthesis systems presents a primary challenge for data sonification. Through ongoing studies to determine the viability of this technology, we expect to address many of these issues.
6. References
[I] G. Grinstein, R. Pickett, and M. Williams, "EXVIS: An exploratory visualization environment," Graphics Interface '89. 254-261, 1989.
[2] D. Lunney and R.C. Morrison, "High technology laboratory aids for visually handicapped chemistry students," Journal of Chemical Education. 58(3): 228-231, 1981.
[3] S. Bly, "Presenting information in sound," Proceedings of the CHI '82 Conference on Human Factors in Computer Systems, 371-375, 1982.
[4] W. Buxton, "The use of non-speech audio at the interface," Tutorial #10, Proceedings of the CHI '89 Conference on Human Factors in Computer Systems. 2.1- 2.15, 1989.
[5] W. Gaver, "Auditory icons: Using sound in comptuer interfaces," Human-Computer Interaction 2(2), 167-177, 1986.
[6] E.S. Yeung, "attern recognition by audio representation of multivariate analytical data." Analytical Chemistry. 52(7): 1120-1123. 1980.
[7] J.J. Mezrich, S. Frysinger, and R. Slivjanovski, "Dynamic representation of multivariate time series data," Journal of the American Statistical Association. 79(385):34-40, 1984.
[8] D.L. Mansur, "Graphs in sound: a numerical data analysis method for the blind," MS thesis, UCRL-53548, Lawrence Livermore National Laboratory and University of California, Davis, 1984.
[9] A. Craig and C. Scaletti, "Using sound to extract meaning from complex data," Proceedings of the SPIE Conference. E. Farrell, chair, SPIE: San Jose, 1991.
[10] D. Gentner, "Mechanisms of analogical learning," Similarity and analogical reasoning. S. Vosniadou and A. Ortony (Eds), 200, Cambridge University Press, London, 1989.
[II] S. Smith, D. Bergeron, and G. Grinstein, "Stereophonic and surface sound generation for exploratory data analysis," Proceedings of the CHI '90 Conference on Human Factors in Computer Systems. 125-132, 1990.
[12] R.L. Mosher, T.L. Bevins, B.D. Neely, "A structural evaluation of Eisenhower and Snell Locks, Saint Lawrence Seaway, Massena, New York," Technical Report ITL- 91-4.
[13] C.A. Scaletti, Kyma Language for Sound Specification. User's Manual. Version 1.0.
[14] C.A. Scaletti, "Kyma: an interactive graphic environment for object-oriented music composition and sound synthesis," Proceedings of the 1988 Conference on Object- Oriented Programming Languages and Systems. 18-26, ACM 1988.
[15] S. Bly (Ed.), "Communicating with sound," Proceedings of CHI '85 Conference on Human Factors in Computer Systems. 115-119, 1985.
[16] E. Evans and J. Wilson (Eds.) Psvchophvsics and Physiology of Hearing. New York: Academic Press, 1977.
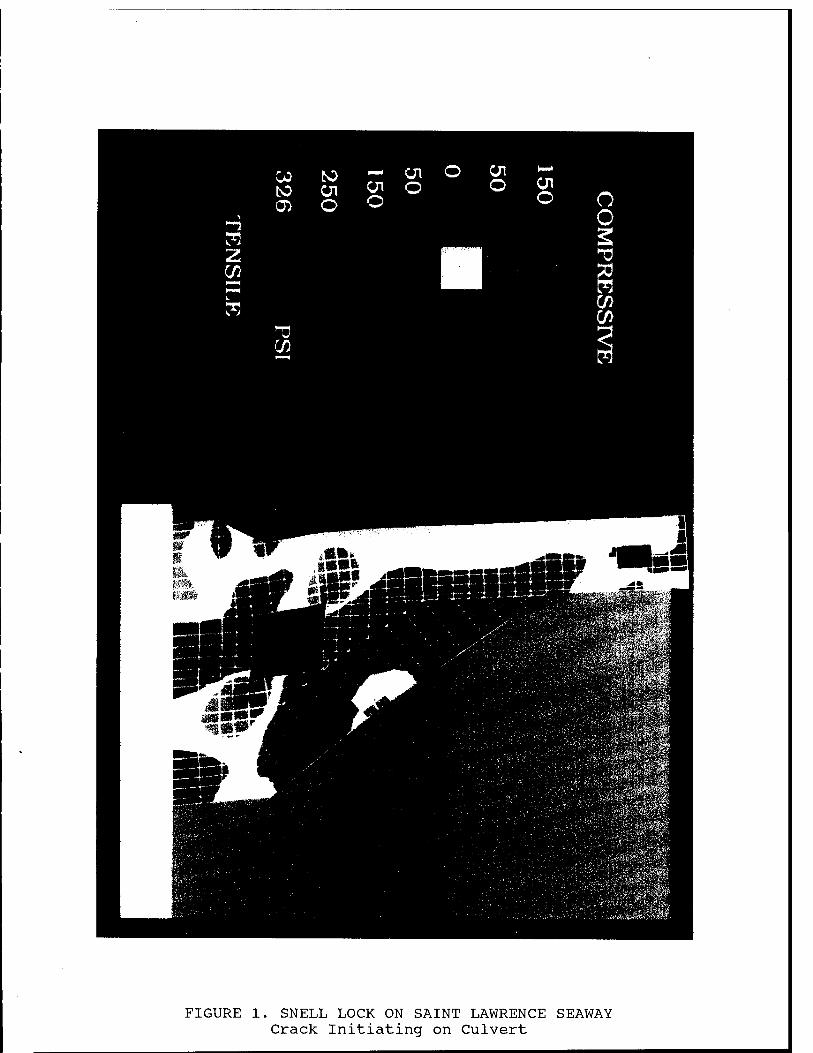
FIGURE 1. SNELL LOCK ON SAINT LAWRENCE SEAWAY Crack Initiating on Culvert

REPORT DOCUMENTATION PAGE Form Approved OMB No. 0704-0188
Public reporting burden for this collection of information is estimated to average 1 hour per response, including the time for reviewing instructions, searching existing data sources, gathering and maintaining the data needed, and completing and reviewing the collection of information. Send comments regarding this burden estimate or any other aspect of this collection of information, including suggestions for reducing this burden, to Washington Headquarters Services, Directorate for Information Operations and Reports, 1215 Jefferson Davis Highway, Suite 1204, Arlington, VA 22202-4302, and to the Office of Management and Budget, Paperwork Reduction Project (0704-0188), Washington, DC 20503.
1. AGENCY USE ONLY (Leave blank) 2. REPORT DATE
October 1995 3. REPORT TYPE AND DATES COVERED
Final report
4. TITLE AND SUBTITLE
Application of Data Sonification for Enhanced Interpretation of Numerical Model Results
5. FUNDING NUMBERS
6. AUTHOR(S)
Julia A. Baca
Vl. PERFORMING ORGANIZATION NAME(S) AND ADDRESSES)
U.S. Army Engineer Waterways Experiment Station 3909 Halls Ferry Road, Vicksburg, MS 39180-6199
8. PERFORMING ORGANIZATION REPORT NUMBER
Technical Report ITL-95-11
9. SPONSORING/MONITORING AGENCY NAME(S) AND ADDRESSES) 10. SPONSORING/MONITORING AGENCY REPORT NUMBER
11. SUPPLEMENTARY NOTES
Available from National Technical Information Service, 5285 Port Royal Road, Springfield, VA 22161.
12a. DISTRIBUTION/AVAILABILITY STATEMENT
Approved for public release; distribution is unlimited. 12b. DISTRIBUTION CODE
13. ABSTRACT (Maximum 200 words)
This report describes the application of a technique known as data sonification. The technique entails creating audi- tory mappings for interpreting scientific data. The paper first provides background on research in the use of computer- generated audio for data interpretation. The remainder of the paper discusses a preliminary investigation in which the technique was employed to augment a scientific data visualization. The results of this investigation are reported and directions for further study are indicated.
14. SUBJECT TERMS
Data processing Human-computer interaction Electronic data processing Visualization
15. NUMBER OF PAGES
12
16. PRICE CODE
17. SECURITY CLASSIFICATION OF REPORT
UNCLASSIFIED
18. SECURITY CLASSIFICATION OF THIS PAGE
UNCLASSIFIED
19. SECURITY CLASSIFICATION OF ABSTRACT
20. LIMITATION OF ABSTRACT
NSN 7540-01-280-5500 Standard Form 298 (Rev. 2-89) Prescribed by ANSI Std. Z39-18 298-102