targa resources - nasdaqfiles.shareholder.com/...5419.../targa_q4_investor_presentation.pdf ·...
TRANSCRIPT

Targa Resources
Investor Presentation
Fourth Quarter 2016
February 15, 2017
2
Forward Looking Statements
Certain statements in this presentation are "forward-looking statements" within the
meaning of Section 27A of the Securities Act of 1933, as amended, and Section 21E of the
Securities Exchange Act of 1934, as amended. All statements, other than statements of
historical facts, included in this presentation that address activities, events or
developments that Targa Resources Corp. (NYSE: TRGP; “Targa”, “TRC” or the
“Company”) expects, believes or anticipates will or may occur in the future are forward-
looking statements. These forward-looking statements rely on a number of assumptions
concerning future events and are subject to a number of uncertainties, factors and risks,
many of which are outside the Company’s control, which could cause results to differ
materially from those expected by management of Targa Resources Corp. Such risks and
uncertainties include, but are not limited to, weather, political, economic and market
conditions, including declines in the production of natural gas or in the price and market
demand for natural gas and natural gas liquids, the timing and success of business
development efforts, the credit risk of customers and other uncertainties. These and other
applicable uncertainties, factors and risks are described more fully in the Company’s
Annual Report on Form 10-K for the year ended December 31, 2015 and other reports filed
with the Securities and Exchange Commission. The Company undertakes no obligation to
update or revise any forward-looking statement, whether as a result of new information,
future events or otherwise.

3
Targa’s Corporate Structure
Targa Resources Corp.
(NYSE: TRGP)
(S&P: BB-
Moody’s: Ba2)
Targa Resources Partners LP
(S&P: BB-/BB-
Moody’s: Ba2/Ba3)
TRC
Public
Shareholders
100% Interest
(193,949,450 Shares)(1)
TRP
Preferred
Unitholders
Senior Notes
Revolving Credit Facility
A/R Securitization Facility
Term Loan B
Revolving Credit Facility
TRC
Preferred
Shareholders
Closed in March 2016
~$1 billion Series A Preferred Stock
9.5% dividend paid quarterly
Issued in October 2015
$125 million Series A Preferred Units
9% distribution paid monthly
Gathering and Processing Segment Logistics and Marketing Segment
(“Downstream”)
53% of 2016 Operating Margin(2)
47% of 2016 Operating Margin
(1) Represents outstanding shares of our common stock beneficially owned and outstanding as of February 13, 2017
(2) Includes the effects of commodity derivative hedging activities

4
A Strong Footprint in
Active Basins
And a Leading Position at
Mont Belvieu
Drive Targa’s
Long-Term Growth
Premier Permian Basin footprint
across Midland Basin, Central
Basin Platform and Delaware
Basin, augmented by the
acquisition announced on
January 23, 2017
Midcontinent position well
exposed to SCOOP play and
STACK play
Dedicated acreage across the
most attractive counties
exposed to Bakken activity
Enhanced Eagle Ford presence
through attractive JV
Premier fractionation ownership
position in NGL market hub at
Mont Belvieu
Most flexible LPG export facility
on the US Gulf Coast, with
approximately 2/3 of our
capacity contracted at attractive
rates each year through 2022
with fee-based, take-or-pay
contracts
Positions not easily replicated
Additional NGL volumes will
flow to Mont Belvieu from
increased E&P activity
Disciplined balance sheet
management means Targa is well
positioned across any
environment
Continued G&P expansions as
E&P activity increases
Adding fractionation over time to
support NGL supply increases,
“when” not “if”
Hedge percentages decreasing
beyond 2017, will help capture
tailwinds in a rising commodity
price environment
Strong Asset Base Poised for Growth
(1) Acquisition expected to close in Q1 2017 subject to customary regulatory approvals and other closing conditions

0
200
400
600
800
1,000
1,200
1,400
1,600
1,800
2,000
Q1 -2014
Q2 -2014
Q3 -2014
Q4 -2014
Q1 -2015
Q2 -2015
Q3 -2015
Q4 -2015
Q1 -2016
Q2 -2016
Q3 -2016
Q4 -2016
Jan2017
Permian
Eagle Ford
Williston
Marcellus
Mississippian
Granite Wash
DJ-Niobrara
Haynesville
Utica
Barnett
Others
U.S. Land Rig Count by Basin(1)
Asset Highlights
~8.7 Bcf/d gross processing capacity(2)
44 natural gas processing plants(3)
~ 28,600 miles of natural gas, NGL and crude oil pipelines
Gross NGL production of ~329 MBbls/d in 2016
3 crude and refined products terminals (2.5 MMBbls of storage)
Over 670 MBbl/d gross fractionation capacity
7.0 MMBbl/month or more capacity LPG export terminal
5
Attractive Asset Footprint
Targa’s assets are positioned in
some of the best basins in the
US, with exposure to the
Permian, STACK, SCOOP,
Bakken and Eagle Ford
Diversified customer base
across all businesses
Rig productivity has
continued to increased over
time
(1) Source: Baker Hughes; data through January 27, 2017
(2) Includes addition of SouthTX Raptor Plant (260MMcf/d), Joyce WestTX Plant (200MMcf/d), 20MMcf/d Midkiff expansion in WestTX, Permian acquisition announced
January 23, 2017 (80MMcf/d), and a new (60MMcf/d) plant in the Delaware, subject to the announced acquisition on January 23, 2017 closing
(3) Assumes acquisition announced January 23 , 2017 closes, and includes SouthTX Raptor Plant under construction, new Joyce WestTX Plant, new Delaware plant and
newly acquired processing plants in the Permian

6
Producer Activity Drives NGL Flows to Mont Belvieu
Growing field NGL production
increases NGL flows to Mont Belvieu
Increased NGL production will
support Targa’s expanding Mont
Belvieu and Galena Park presence
Petrochemical investments,
fractionation and export services will
continue to clear additional
domestic supply
Targa’s Mont Belvieu and Galena
Park businesses very well
positioned
Rockies
Galena
Park
6
Mont
Belvieu
Rest of the
World
(1) Pro forma Targa/TPL for all years
169 178 206
251 282
306 329
0
50
100
150
200
250
300
350
2010 2011 2012 2013 2014 2015 2016
NG
L P
rod
ucti
on
(M
Bb
l/d
)
NGL Production(1)
~30%
~70%
Fee Commodity Sensitive
53% 47%
Downstream G&P
9%
25%
5%
7% 8%
11%
17%
16%
2%
SAOU WestTX Sand Hills
Versado SouthTX North Texas
SouthOK WestOK Badlands
7
Business Mix, Diversity and Fee Based Margin
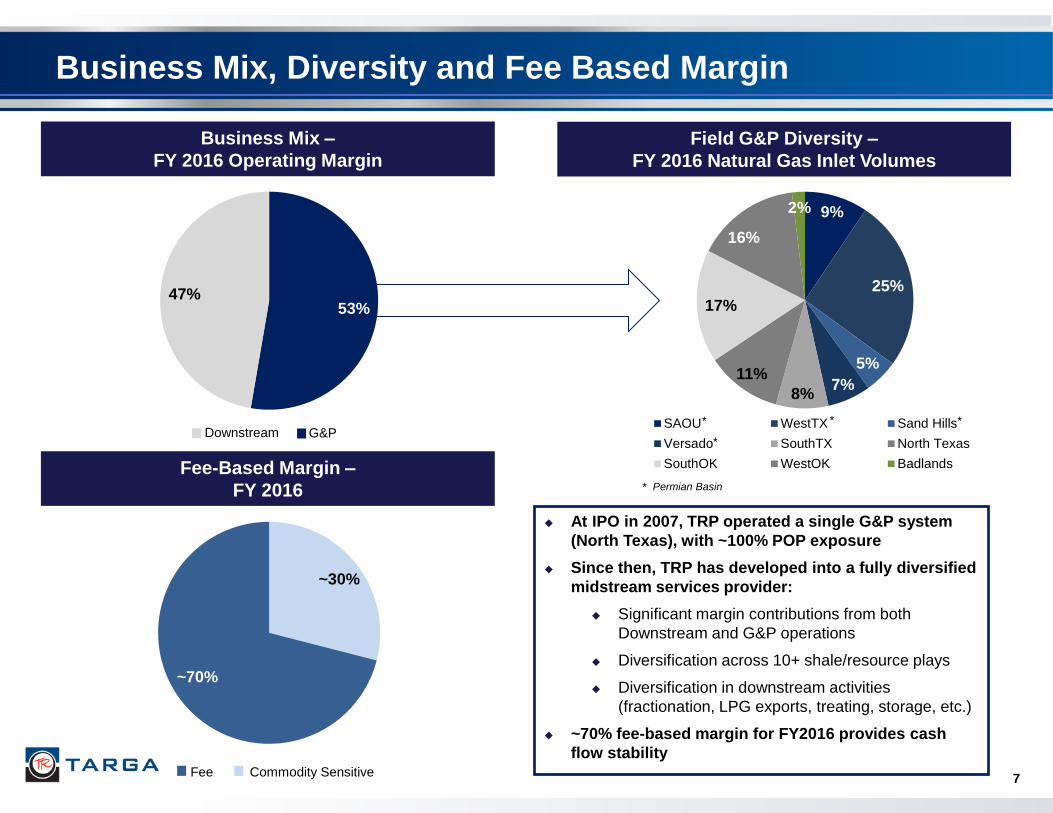
Fee-Based Margin –
FY 2016
Business Mix –
FY 2016 Operating Margin
Field G&P Diversity –
FY 2016 Natural Gas Inlet Volumes
At IPO in 2007, TRP operated a single G&P system
(North Texas), with ~100% POP exposure
Since then, TRP has developed into a fully diversified
midstream services provider:
Significant margin contributions from both
Downstream and G&P operations
Diversification across 10+ shale/resource plays
Diversification in downstream activities
(fractionation, LPG exports, treating, storage, etc.)
~70% fee-based margin for FY2016 provides cash
flow stability
*
* Permian Basin
*
* *

8
Positioning and Strategy Looking Forward
Asset
Footprint
Well
Positioned
G&P growth driven by producers with assets in some of the most economic basins in the world
Focus on continuing to grow in Permian (Midland Basin, Delaware Basin), STACK, SCOOP and Bakken
Systems already located in active areas will continue to benefit as producer activity increases
Current excess capacity in many Targa systems provides margin expansion with minimal capital outlay
Downstream Mont Belvieu/Galena Park footprint cannot be replicated
G&P activity will drive additional NGL volumes downstream to Targa’s frac and export facilities
Increased frac volumes expected from greater ethane extraction (new petchems online in 2017+) and
additional G&P activity
LPG export facility well positioned with demonstrated track record to help clear excess domestic propane
and butanes supply from expected increase in NGL production
Strong
Balance
Sheet
and
Liquidity
Targa’s operations are supported by a strong balance sheet and liquidity position
As of December 31, estimated TRP compliance leverage ratio was 3.8x (5.5x covenant)
Available liquidity of approximately $1.9 billion
No significant near-term debt or revolver maturities
Raised approximately $575 million of total net equity proceeds under ATM program from Q2 through Q4,
and expect to continue to utilize the ATM program for more than 50% of growth capex funding
Expect higher average Permian, SouthTX and Bakken volumes in 2017 vs. average 2016
Recently announced Permian acquisition and processing capacity expansions in the Permian
are supported by continuing producer activity
Acquisition of Delaware and Midland assets will bolt on to existing footprint and is supported by long-term
fee-based contracts with active producers(1)
New Joyce WestTX Plant to be completed in Q1 2018, idled Benedum Plant being brought back online in
Q1 2017, capacity expansion to Midkiff Plant slated for Q2 2017 completion, due to strong WestTX activity
Other identified attractive G&P growth capex projects in the Bakken, Mid-Con and Eagle Ford
Continuing development of significant downstream projects supported by G&P activity/volumes
Activity
will
Drive
Continued
Growth
(1) Assumes close of acquisition expected in Q1 2017 subject to customary regulatory approvals and other closing conditions

$251
$749
$7
$439
$1,192
$580
$500 $500
$0
$400
$800
$1,200
$1,600
$2,000
2017 2018 2019 2020 2021 2022 2023 2024 2025 2026 2027
Sen
ior
No
te M
atu
riti
es (
$ in
MM
)
3.9x 3.8x
2.0x
3.0x
4.0x
5.0x
6.0x
Year End2015
Year End 2016
9
Leverage and Financial Position
Senior Note Maturities(1)
No
Near-
term
Matu
riti
es
TRP Compliance Leverage Targa Liquidity
Pro Forma Leverage and Liquidity
(1) As of December 31, 2016; includes TRC term loan
TRP Compliance Covenant
~ 76% of our senior notes are set to mature in
2022 and beyond
$1,677
$1,905
$0
$500
$1,000
$1,500
$2,000
$2,500
Year End2015
Year End 2016
($ in
millio
ns)
Protecting and improving the balance sheet has
remained a focus
In October 2016, Targa issued $500 million of
5.125% senior notes due 2025, $500 million of
5.375% senior notes due 2027 with proceeds
used to refinance other series of senior notes
In October 2016, TRP amended its $1.6 billion
revolver to extend maturity to October 2020
From late May 2016 through December 31, 2016,
Targa raised ~$575 million of proceeds via equity
issuances through an ATM program
As of December 31, 2016, TRP compliance
leverage ratio was 3.8x (5.5x covenant), and
liquidity, including availability under both TRP
and TRC revolvers, was ~$1.9 billion
Concurrent with announcement that Targa was
acquiring assets in the Delaware and Midland
Basins, on January 23, 2017, Targa raised net
proceeds of ~$525 million through an
underwritten public offering of 9.2 million shares
of its common stock at $57.65 per share

Growth has been driven primarily by investing in
the business, not by changes in commodity prices
Targa benefits from multiple factors that help
mitigate commodity price volatility, including:
Scale
Business and geographic diversity
Increasing fee-based margin
Hedging
Targa is only partially hedged for the balance of
2016 and beyond, and in an environment of rising
commodity prices, will benefit
For 2017, approximately 75% of natural gas, 65% of
condensate and 50% of NGLs are hedged
For 2018, approximately 45% of natural gas, 45% of
condensate and 20% of NGLs are hedged
Below are commodity price only sensitivities to 2017
Adjusted EBITDA:
+/- $0.05/gal NGLs = +/- $27 million Adjusted EBITDA
+/- $0.25/MMBtu nat gas = +/- $10 million Adjusted
EBITDA
+/- $5.00/Bbl crude oil = +/- $3 million Adjusted
EBITDA
Diversity and Scale Help Mitigate Commodity Price Changes
10
Adjusted EBITDA - Actual WTI Crude Oil Prices - Quarter Realized
(1)
Cru
de
Oil
Adjusted EBITDA vs. Commodity Prices
Na
tura
l G
as
N
GL
s
• Note: Targa’s composite NGL barrel comprises 38% ethane, 34% propane, 5% iso-butane, 12% normal butane, and 11% natural gasoline
Adjusted EBITDA - Actual Henry Hub Nat. Gas Prices - Quarter Realized
Adjusted EBITDA - Actual Weighted Avg. NGL Prices - Quarter Realized
$30
$50
$70
$90
$110
$130
$0
$200
$400
$600
$800
$1,000
$1,200
$1,400
$/b
arr
el
EB
ITD
A (
mil
lio
ns
)
2007 2008 2009 2010 2012 2011 2013 2014 2015 2016
$0.00
$2.00
$4.00
$6.00
$8.00
$10.00
$12.00
$0
$200
$400
$600
$800
$1,000
$1,200
$1,400
$/M
mb
tu
EB
ITD
A (
mil
lio
ns
) 2007 2008 2009 2012 2010 2011 2013 2014 2015 2016
$0.00
$0.20
$0.40
$0.60
$0.80
$1.00
$1.20
$1.40
$1.60
$1.80
$0
$200
$400
$600
$800
$1,000
$1,200
$1,400
$/g
al
EB
ITD
A (
mil
lio
ns
)
2007 2008 2009 2012 2010 2011 2013 2014 2015 2016
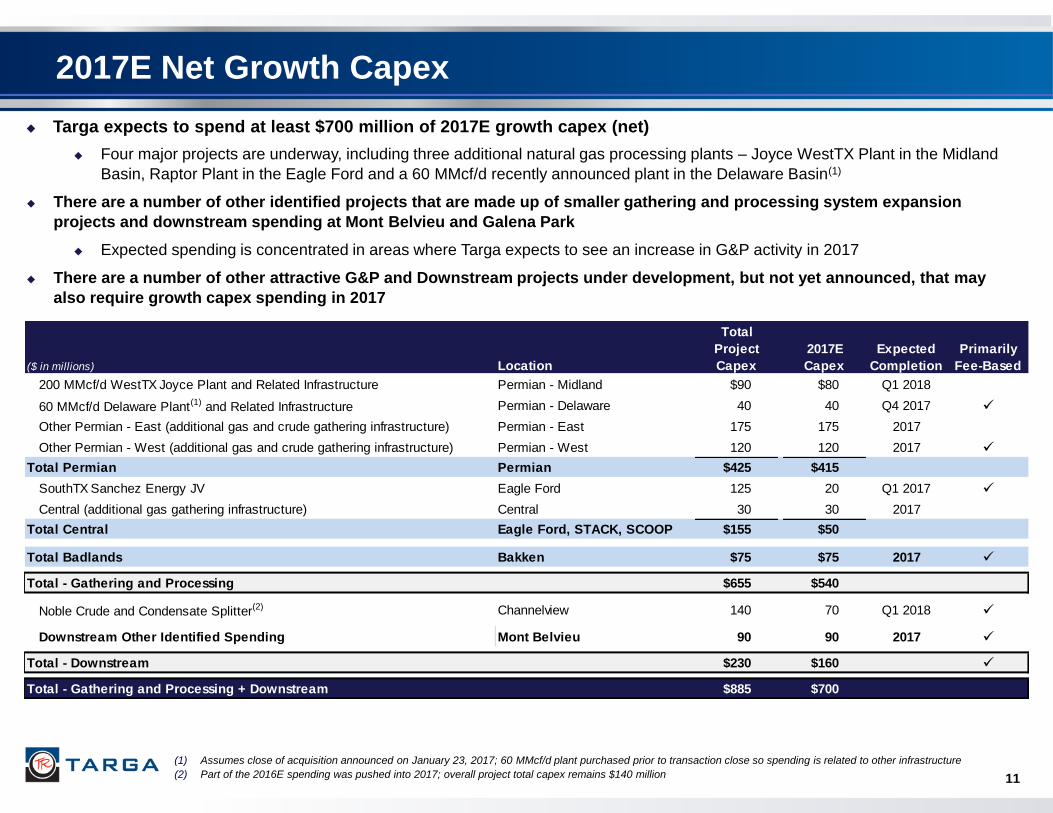
($ in millions) Location
Total
Project
Capex
2017E
Capex
Expected
Completion
Primarily
Fee-Based
200 MMcf/d WestTX Joyce Plant and Related Infrastructure Permian - Midland $90 $80 Q1 2018
60 MMcf/d Delaware Plant(1) and Related Infrastructure Permian - Delaware 40 40 Q4 2017
Other Permian - East (additional gas and crude gathering infrastructure) Permian - East 175 175 2017
Other Permian - West (additional gas and crude gathering infrastructure) Permian - West 120 120 2017
Total Permian Permian $425 $415
SouthTX Sanchez Energy JV Eagle Ford 125 20 Q1 2017
Central (additional gas gathering infrastructure) Central 30 30 2017
Total Central Eagle Ford, STACK, SCOOP $155 $50
Total Badlands Bakken $75 $75 2017
Total - Gathering and Processing $655 $540
Noble Crude and Condensate Splitter(2) Channelview 140 70 Q1 2018
Downstream Other Identified Spending Mont Belvieu 90 90 2017
Total - Downstream $230 $160
Total - Gathering and Processing + Downstream $885 $700
11
2017E Net Growth Capex
Targa expects to spend at least $700 million of 2017E growth capex (net)
Four major projects are underway, including three additional natural gas processing plants – Joyce WestTX Plant in the Midland
Basin, Raptor Plant in the Eagle Ford and a 60 MMcf/d recently announced plant in the Delaware Basin(1)
There are a number of other identified projects that are made up of smaller gathering and processing system expansion
projects and downstream spending at Mont Belvieu and Galena Park
Expected spending is concentrated in areas where Targa expects to see an increase in G&P activity in 2017
There are a number of other attractive G&P and Downstream projects under development, but not yet announced, that may
also require growth capex spending in 2017
(1) Assumes close of acquisition announced on January 23, 2017; 60 MMcf/d plant purchased prior to transaction close so spending is related to other infrastructure
(2) Part of the 2016E spending was pushed into 2017; overall project total capex remains $140 million

12
Operational and Financial Guidance
2017E
Field G&P
Volumes
2017E Field G&P natural gas inlet volumes will average at least 10% higher than 2016 Field G&P
average natural gas inlet volumes
In the Permian Basin, we expect average G&P natural gas inlet volumes to increase by approximately
20% in 2017 compared to 2016
Includes volumes from acquisition of assets in the Delaware and Midland Basins(1)
Expect higher natural gas inlet volumes in SouthTX average 2017 versus average 2016
Expect higher natural gas inlet volumes and crude volumes in the Badlands average 2017 versus average
2016
These volume increases will be partially offset by lower volumes in WestOK, SouthOK and North Texas
(1) Permian acquisition announced on January 23, 2017 is expected to close in Q1 2017 subject to customary closing regulatory approvals and other closing conditions
2017E
Net Growth
and
Maintenance
Capex
2017E net growth capex of at least $700 million for currently announced projects and other
identified spending
There are a number of other attractive G&P and Downstream projects under development, but not yet
announced, that may require additional growth capex spending in 2017
2017E net maintenance capex of approximately $110 million
LPG
Contracts
at
Galena Park
Approximately two-thirds of our current estimated export capacity of 7 million barrels per month
is contracted each year at attractive rates through 2022
Some years are slightly higher and some years are slightly lower than two-thirds, but two-thirds is
representative of the significant percentage of current LPG export capacity is contracted in each year
2017E
Dividend
Coverage
For full year 2017, expect dividend coverage to exceed 1.0 times
Assumes $3.64 per common share 2017 dividend
Cash Taxes Including Permian acquisition, estimate that Targa will not pay cash taxes for the next 5 years(1)

Targa’s Attractive Asset Footprint

14
Extensive Field Gathering and Processing Position
Summary Footprint
1,044 1,161
1,605
2,095
2,453
2,774 2,761
119 128
159
207
235
264 288
0
50
100
150
200
250
300
350
0
500
1,000
1,500
2,000
2,500
3,000
2010 2011 2012 2013 2014 2015 2016
Gro
ss
NG
L P
rod
uc
tio
n (
MB
bl/
d)
Inle
t V
olu
me
(M
Mc
f/d
)
Inlet Gross NGL Production
Volumes(4)
Over 26,000 miles of pipeline across attractive positions
~4.3 Bcf/d of gross processing capacity(1)(2)
Announced the acquisition of Delaware and Midland
Basin assets on January 23, 2017
Examples of recent/current G&P expansions:
200 MMcf/d Buffalo Plant placed in service in WestTX in April
2016; new 200 MMcf/d Joyce WestTX Plant recently
approved; re-starting 45 MMcf/d Benedum Plant and adding
20 MMcf/d of capacity at Midkiff Plant; new 60 MMcf/d
Delaware plant(3)
260 MMcf/d Raptor Plant expected in service by April 2017
POP and fee-based contracts
(1) Includes the Joyce WestTX Plant and the expansion to Midkiff Plant
(2) Assumes acquisition close expected during Q1 2017
(3) Assuming acquisition close, new Delaware Plant expected online Q4 2017
(4) Pro forma Targa/TPL for all years
(5) Total gas, NGL and crude oil pipeline mileage
(6) Includes 200MMcf/d Raptor Plant (expected online April 2017), which will be expanded to 260 MMcf/d in Q3 2017
Est. Gross
Processing Capacity
(MMcf/d) Miles of Pipeline (5)
SAOU 369 1,760
WestTX(1) 1,075 4,440
Sand Hills 165 1,610
Versado 255 3,615
Acquired Midland(2) 10 100
Acquired Delaware(2) 70 140
New Delaware(3) 60 –
Permian Total 2,004 11,665
SouthTX(6) 660 940
North Texas 478 4,695
SouthOK 580 2,280
WestOK 458 6,450
Central Total 2,176 14,365
Badlands 90 610
Total 4,270 26,640

Recently Announced Permian Acquisition Adds to Targa’s Premier Permian Position(1)
15
~65% of active Permian
rigs are on or within 10
miles of pro forma
Targa assets
Pro forma Targa has
~2 million dedicated
acres in the
Permian Basin
Combined assets will
have ~2 Bcf/day(2) of
processing capacity by
Q1 2018
Expect to connect
acquired Delaware
assets to Sand Hills
system
Significant
opportunities for
operational and capital
synergies
Bolting on the acquired Permian assets to Targa’s existing footprint increases and strengthens
our exposure to active development in the Delaware Basin and the northern Midland Basin
Source: Drillinginfo; rigs as of February 10, 2017
(1) Assumes close of acquisition announced on January 23, 2017
(2) Includes previously announced processing capacity additions in WestTX, close of the Permian acquisition announced January 23, 2017, and the new announced Delaware plant
Expect to connect
acquired Midland
assets to WestTX
system

Over 5,000 miles of pipeline across Sand Hills, Versado and newly
acquired assets(1)
Expect to connect acquired Delaware assets to Sand Hills system
Acquired Delaware assets, Sand Hills, SAOU and WestTX will be
connected
Eventually may connect Versado, creating a fully-connected Permian
system
~475 MMcf/d of processing capacity
70 MMcf/d of additional processing capacity from Delaware acquisition
(Loving Plant)
Recently announced 60 MMcf/d plant(1)
Evaluating adding processing capacity to accommodate expected growth
High-quality pure-play producers added to system with very limited
crossover of existing upstream customers
Highlights
16
Newly Acquired Delaware Assets
Weighted average system contract length of 14 years
Loving Plant
70 MMcf/d cryogenic processing plant capacity
Gas Gathering System
~60 miles of low pressure gathering lines and ~30 miles of high pressure
rich gas lines
Crude Gathering System
~50 miles of pipeline with initial capacity of 40,000 Bbls/d
10,000 Bbl internal floating roof tank
Pro Forma Targa Delaware Basin Assets
Source: Drillinginfo; rigs as of February 10, 2017
(1) Assumes close of acquisition announced on January 23, 2017
17
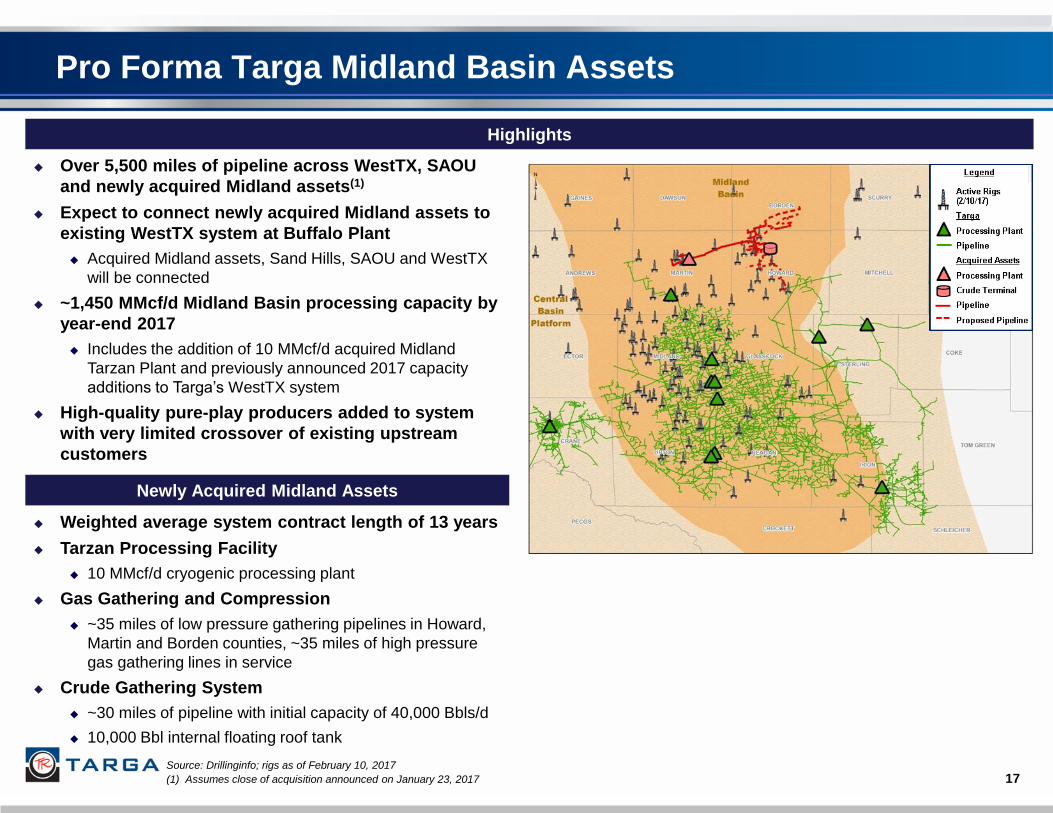
Highlights
Over 5,500 miles of pipeline across WestTX, SAOU
and newly acquired Midland assets(1)
Expect to connect newly acquired Midland assets to
existing WestTX system at Buffalo Plant
Acquired Midland assets, Sand Hills, SAOU and WestTX
will be connected
~1,450 MMcf/d Midland Basin processing capacity by
year-end 2017
Includes the addition of 10 MMcf/d acquired Midland
Tarzan Plant and previously announced 2017 capacity
additions to Targa’s WestTX system
High-quality pure-play producers added to system
with very limited crossover of existing upstream
customers
Newly Acquired Midland Assets
Weighted average system contract length of 13 years
Tarzan Processing Facility
10 MMcf/d cryogenic processing plant
Gas Gathering and Compression
~35 miles of low pressure gathering pipelines in Howard,
Martin and Borden counties, ~35 miles of high pressure
gas gathering lines in service
Crude Gathering System
~30 miles of pipeline with initial capacity of 40,000 Bbls/d
10,000 Bbl internal floating roof tank
Pro Forma Targa Midland Basin Assets
Source: Drillinginfo; rigs as of February 10, 2017
(1) Assumes close of acquisition announced on January 23, 2017

Est. Gross 2016 2016
Processing Gross Gross NGL
Location Capacity Plant Inlet Production Miles of
Facility % Owned (County) (MMcf/d) (MMcf/d) (MBbl/d) Pipeline
(1) Mertzon 100.0% Irion, TX 52
(2) Sterling 100.0% Sterling, TX 92
(3) Conger(a) 100.0% Sterling, TX 25
(4) High Plains 100.0% Midland, TX 200
SAOU Total 369 259 32 1,760
(a) Idled in September 2014
Summary Asset Map and Rig Activity(1)
Permian (SAOU) – Summary
Footprint includes approximately 370 MMcf/d of
processing capacity and 1,760 miles of pipeline in the
Midland Basin
Three active cryogenic processing plant locations and one
idled standby plant
200 MMcf/d High Plains Plant placed in service
Q2 2014
Connected to WestTX and Sand Hills systems
Traditionally POP contracts, with added fees and fee-
based services for compression, treating, etc.
18 (1) Source: Drillinginfo; rigs as of February 10, 2017
Map does not reflect acquisition announced January 23, 2017
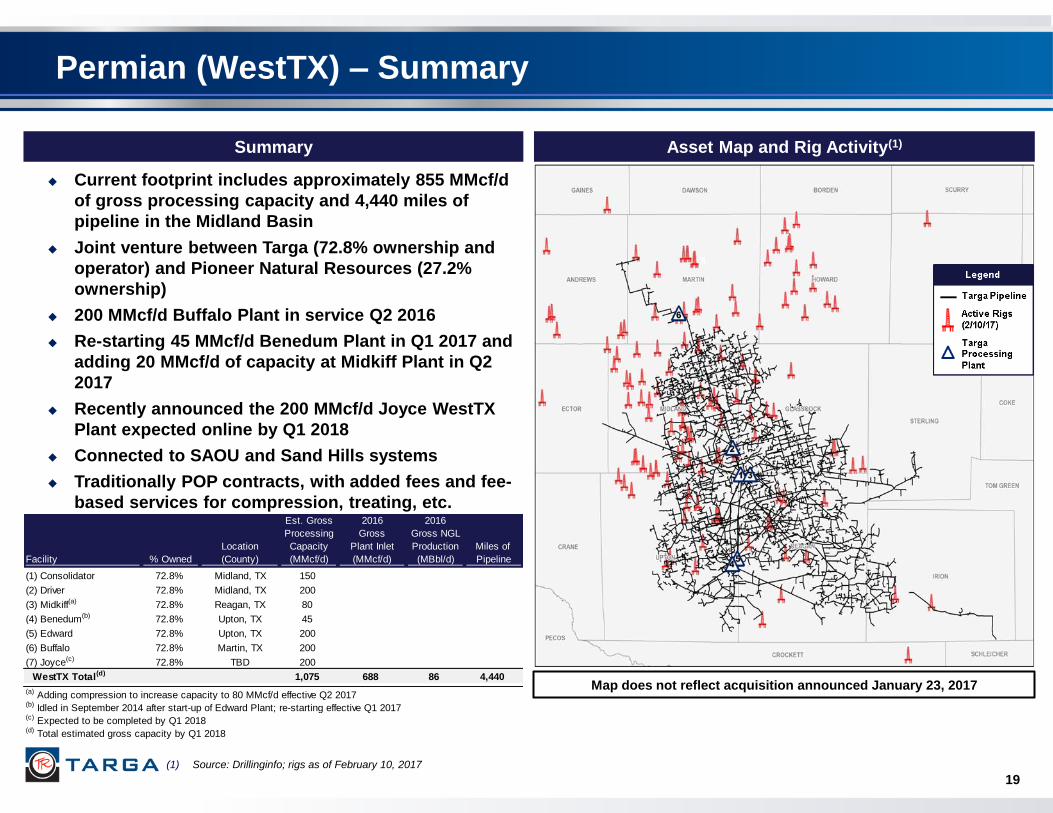
Summary Asset Map and Rig Activity(1)
Permian (WestTX) – Summary
Current footprint includes approximately 855 MMcf/d
of gross processing capacity and 4,440 miles of
pipeline in the Midland Basin
Joint venture between Targa (72.8% ownership and
operator) and Pioneer Natural Resources (27.2%
ownership)
200 MMcf/d Buffalo Plant in service Q2 2016
Re-starting 45 MMcf/d Benedum Plant in Q1 2017 and
adding 20 MMcf/d of capacity at Midkiff Plant in Q2
2017
Recently announced the 200 MMcf/d Joyce WestTX
Plant expected online by Q1 2018
Connected to SAOU and Sand Hills systems
Traditionally POP contracts, with added fees and fee-
based services for compression, treating, etc.
19
(1) Source: Drillinginfo; rigs as of February 10, 2017
Map does not reflect acquisition announced January 23, 2017
Est. Gross 2016 2016
Processing Gross Gross NGL
Location Capacity Plant Inlet Production Miles of
Facility % Owned (County) (MMcf/d) (MMcf/d) (MBbl/d) Pipeline
(1) Consolidator 72.8% Midland, TX 150
(2) Driver 72.8% Midland, TX 200
(3) Midkiff(a) 72.8% Reagan, TX 80
(4) Benedum(b) 72.8% Upton, TX 45
(5) Edward 72.8% Upton, TX 200
(6) Buffalo 72.8% Martin, TX 200
(7) Joyce(c) 72.8% TBD 200
WestTX Total(d) 1,075 688 86 4,440
(a) Adding compression to increase capacity to 80 MMcf/d effective Q2 2017(b) Idled in September 2014 after start-up of Edward Plant; re-starting effective Q1 2017(c) Expected to be completed by Q1 2018(d) Total estimated gross capacity by Q1 2018

Est. Gross 2016 2016
Processing Gross Gross NGL
Location Capacity Plant Inlet Production Miles of
Facility % Owned (County) (MMcf/d) (MMcf/d) (MBbl/d) Pipeline
(1) Sand Hills 100.0% Crane, TX 165
Sand Hills Total 165 140 15 1,610
Summary Asset Map and Rig Activity(1)
Permian (Sand Hills) – Summary
Footprint includes approximately 165 MMcf/d of
processing capacity and 1,610 miles of pipeline in the
Central Basin Platform/Delaware Basin
Connected to WestTX and SAOU systems; currently
moving volumes to SAOU
Expect to connect to acquired Delaware assets(2)
Traditionally POP contracts, with added fees and fee-
based services for compression, treating, etc.
20 (1) Source: Drillinginfo; rigs as of February 10, 2017
(2) Assumes close of acquisition announced on January 23, 2017
Map does not reflect acquisition announced January 23, 2017

Est. Gross 2016 2016
Processing Gross Gross NGL
Location Capacity Plant Inlet Production Miles of
Facility % Owned (County) (MMcf/d) (MMcf/d) (MBbl/d) Pipeline
(1) Saunders 100.0% Lea, NM 60
(2) Eunice 100.0% Lea, NM 110
(3) Monument 100.0% Lea, NM 85
Versado Total 255 182 22 3,615
Permian (Versado) – Summary
Summary Asset Map and Rig Activity(1)
Footprint includes approximately 250 MMcf/d of
processing capacity and 3,615 miles of pipeline in the
northern Delaware Basin
Three active cryogenic processing plant facilities
Traditionally POP contracts, with added fees and fee-
based services for compression, treating, etc.
Executed on October 31, 2016, Targa acquired
Chevron’s 37% interest in Versado, and now owns
100% of the system
Simplifies Targa focus on capturing increasing Delaware
Basin volumes
Traditionally POP contracts, with added fees and fee-
based services for compression, treating, etc.
21 (1) Source: Drillinginfo; rigs as of February 10, 2017
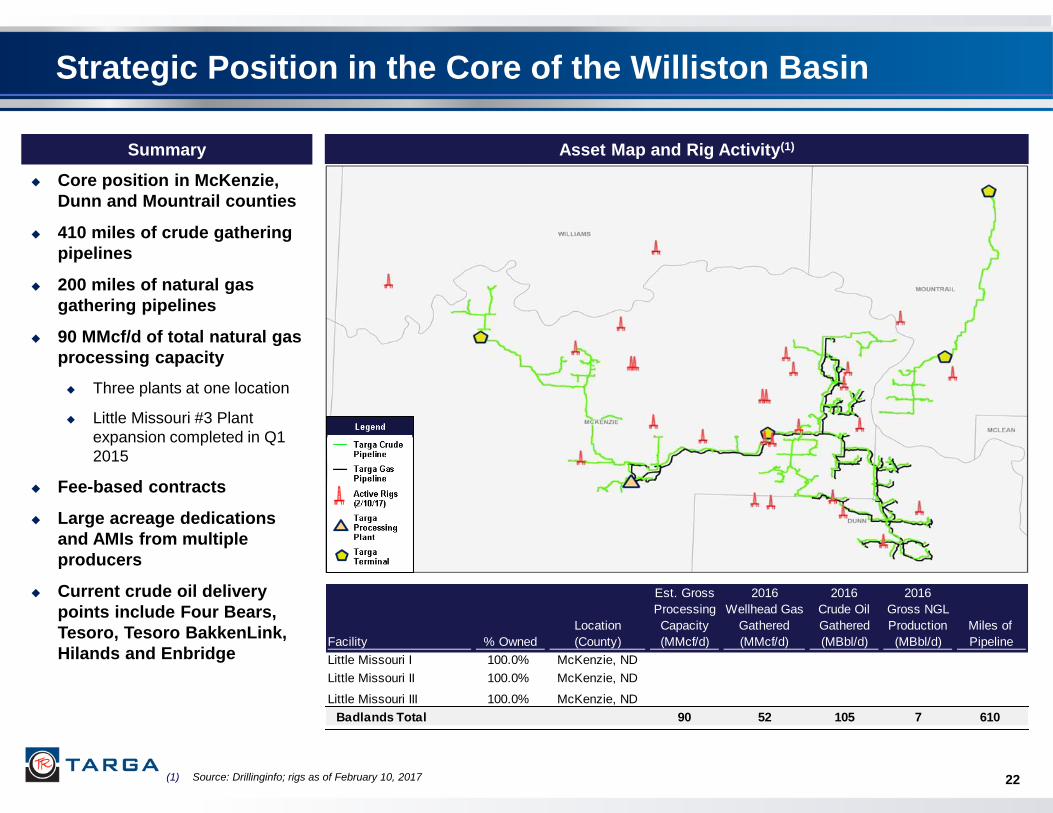
Strategic Position in the Core of the Williston Basin
Summary
Core position in McKenzie,
Dunn and Mountrail counties
410 miles of crude gathering
pipelines
200 miles of natural gas
gathering pipelines
90 MMcf/d of total natural gas
processing capacity
Three plants at one location
Little Missouri #3 Plant
expansion completed in Q1
2015
Fee-based contracts
Large acreage dedications
and AMIs from multiple
producers
Current crude oil delivery
points include Four Bears,
Tesoro, Tesoro BakkenLink,
Hilands and Enbridge
22
Asset Map and Rig Activity(1)
(1) Source: Drillinginfo; rigs as of February 10, 2017
Est. Gross 2016 2016 2016
Processing Wellhead Gas Crude Oil Gross NGL
Location Capacity Gathered Gathered Production Miles of
Facility % Owned (County) (MMcf/d) (MMcf/d) (MBbl/d) (MBbl/d) Pipeline
Little Missouri I 100.0% McKenzie, ND
Little Missouri II 100.0% McKenzie, ND
Little Missouri III 100.0% McKenzie, ND
Badlands Total 90 52 105 7 610
Gross
Processing Capacity
(MMcf/d) Miles of Pipeline
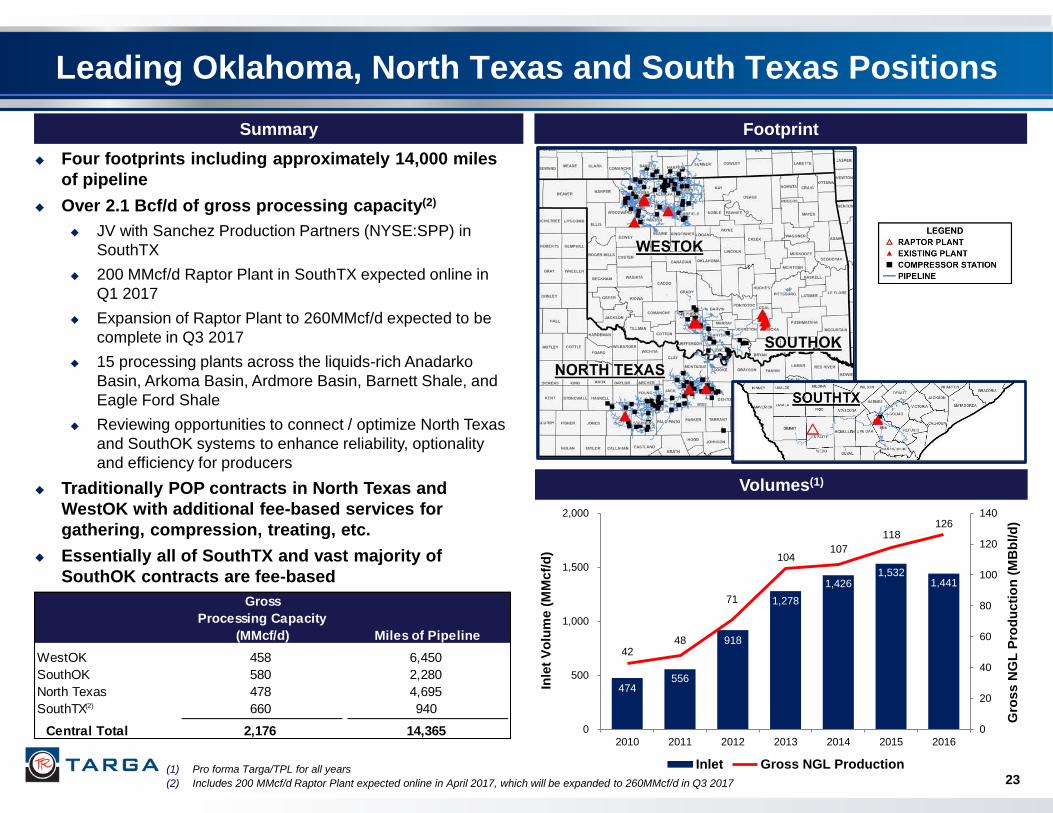
WestOK 458 6,450
SouthOK 580 2,280
North Texas 478 4,695
SouthTX(2) 660 940
Central Total 2,176 14,365
474 556
918
1,278
1,426 1,532
1,441
42 48
71
104 107
118 126
0
20
40
60
80
100
120
140
0
500
1,000
1,500
2,000
2010 2011 2012 2013 2014 2015 2016
Gro
ss N
GL
Pro
du
cti
on
(M
Bb
l/d
)
Inle
t V
olu
me (
MM
cf/
d)
Inlet Gross NGL Production
Leading Oklahoma, North Texas and South Texas Positions
Four footprints including approximately 14,000 miles
of pipeline
Over 2.1 Bcf/d of gross processing capacity(2)
JV with Sanchez Production Partners (NYSE:SPP) in
SouthTX
200 MMcf/d Raptor Plant in SouthTX expected online in
Q1 2017
Expansion of Raptor Plant to 260MMcf/d expected to be
complete in Q3 2017
15 processing plants across the liquids-rich Anadarko
Basin, Arkoma Basin, Ardmore Basin, Barnett Shale, and
Eagle Ford Shale
Reviewing opportunities to connect / optimize North Texas
and SouthOK systems to enhance reliability, optionality
and efficiency for producers
Traditionally POP contracts in North Texas and
WestOK with additional fee-based services for
gathering, compression, treating, etc.
Essentially all of SouthTX and vast majority of
SouthOK contracts are fee-based
Summary Footprint
Volumes(1)
(1) Pro forma Targa/TPL for all years
(2) Includes 200 MMcf/d Raptor Plant expected online in April 2017, which will be expanded to 260MMcf/d in Q3 2017 23

Est. Gross 2016 2016
Processing Gross Gross NGL
Location Capacity Plant Inlet Production Miles of
Facility % Owned (County) (MMcf/d) (MMcf/d) (MBbl/d) Pipeline
Silver Oak I 100.0% Bee, TX 200
Silver Oak II 90.0% Bee, TX 200
Raptor(a) 50.0% Bee, TX 260
SouthTX Total 660 216 24 940
(a) Expected to be completed April 2017
SouthTX – Sanchez Energy Corp. JV Driving Growth
Summary Asset Map and Rig Activity(1)
JV agreements with Sanchez Energy Corp. (NYSE:SN)
executed in October 2015
Gathering JV interest subsequently acquired by Sanchez
Production Partners LP (NYSE:SPP) in July 2016 and
plant JV interest sold to SPP in October 2016
Constructing 200 MMcf/d Raptor Plant, expected
online in April 2017
Western system gathering expansion completed in March
2016
Targa and SPP recently decided to increase Raptor Plant
capacity to 260 MMcf/d, expected to be complete in Q3
2017
Fee-based contract
125 MMcf/d MVC for 5 years begins Q1 2017
15 year acreage dedication in Dimmit, La Salle and
Webb counties
24 (1) Source: Drillinginfo; rigs as of February 10, 2017

North Texas – Exposed to Barnett Shale and Marble Falls
Summary
478 MMcf/d of gross processing capacity
Primarily Barnett Shale and Marble Falls
Customers are a combination of larger independent
producers with exposure to multiple plays and smaller
independents with a single footprint
Primarily POP contracts with fee-based components
Expect to connect North Texas and SouthOK systems
Asset Map and Rig Activity(1)
25 (1) Source: Drillinginfo; rigs as of February 10, 2017
Est. Gross 2016 2016
Processing Gross Gross NGL
Location Capacity Plant Inlet Production Miles of
Facility % Owned (County) (MMcf/d) (MMcf/d) (MBbl/d) Pipeline
(1) Chico(a) 100.0% Wise, TX 265
(2) Shackelford 100.0% Shackelford, TX 13
(3) Longhorn 100.0% Wise, TX 200
North Texas Total 478 317 36 4,695
(a) Chico Plant has fractionation capacity of ~15 Mbbls/d

SouthOK – Exposure to Increasing SCOOP Activity
Summary Asset Map and Rig Activity(1)
580 MMcf/d of gross processing capacity
Velma system well positioned to benefit from
increasing SCOOP activity
Primary growth driver will be SCOOP activity focused in
the oil/condensate window (Grady, Garvin and Stephens
Counties)
Arkoma Woodford (Coal, Atoka, Hughes and Pittsburg
Counties) growth will occur with improvement in gas pricing
Majority fee-based contracts
26 (1) Source: Drillinginfo; rigs as of February 10, 2017
Est. Gross 2016 2016
Processing Gross Gross NGL
Location Capacity Plant Inlet Production Miles of
Facility % Owned (County) (MMcf/d) (MMcf/d) (MBbl/d) Pipeline
(1) Atoka(a) 60.0% Atoka County, OK 20
(2) Coalgate 60.0% Coal, OK 80
(2) Stonewall 60.0% Coal, OK 200
(2) Tupelo 100.0% Coal, OK 120
(3) Velma 100.0% Stephens, OK 100
(3) Velma V-60 100.0% Stephens, OK 60
SouthOK Total 580 462 39 2,280
(a) The Atoka Plant was idled due to the start-up of the Stonewall Plant in May 2014

WestOK – Positioned for STACK Growth
Summary Asset Map and Rig Activity(1)
~460 MMcf/d of gross processing capacity
Declining Mississippi Lime activity has impacted
volumes
Majority of WestOK contracts are hybrid POP’s plus
fees
Continuing to develop opportunities to connect and
gather additional STACK volumes from the south into
WestOK system
27 (1) Source: Drillinginfo; rigs as of February 10, 2017
Est. Gross 2016 2016
Processing Gross Gross NGL
Location Capacity Plant Inlet Production Miles of
Facility % Owned (County) (MMcf/d) (MMcf/d) (MBbl/d) Pipeline
(1) Waynoka I 100.0% Woods, OK 200
(1) Waynoka II 100.0% Woods, OK 200
(2) Chaney Dell(a) 100.0% Major, OK 30
(3) Chester 100.0% Woodward, OK 28
WestOK Total 458 445 27 6,450
(a) The Chaney Dell Plant was idled in December 2015

Downstream Capabilities
28
Assets include:
Attractive fractionation footprint at Mont Belvieu and Lake
Charles
Second largest, and most flexible, LPG export terminal on
the Houston Ship Channel
Above and underground storage terminals across the
country
Domestic NGL marketing and distribution
Wholesale, refinery and transportation services
Natural gas marketing
Contributed 47% of Targa’s overall 2016 operating
margin
Fee-based businesses; many with “take-or-pay”
commitments
Major capex projects announced and completed, or
in progress, over last 3 years include: LPG export
terminal expansions, new fractionation trains, a
crude and condensate splitter and terminal
capability additions
NGL Fractionation / Storage
Leading Mont Belvieu (and Lake Charles) footprint with
underground storage and connectivity provides a locational
advantage
Fixed fees with “take-or-pay” commitments
LPG Exports
Fixed loading fees with “take-or-pay” commitments; market to
end users and international trading houses
Other
NGL and Natural Gas Marketing
Manage physical distribution of mixed NGLs and
specification products using owned and third party facilities
Manage inventories for Targa downstream business
Domestic NGL Marketing and Distribution
Contractual agreements with major refiners to market NGLs
by barge, rail and truck; margin-based fees
Sell propane to multi-state, independent retailers and
industrial accounts; inventory sold at index plus
Commercial Transportation
All fee-based; 650 railcars, 88 transport tractors, 20 NGL
barges
Petroleum Logistics
Gulf Coast, East Coast and West Coast terminals
Downstream Businesses Overview
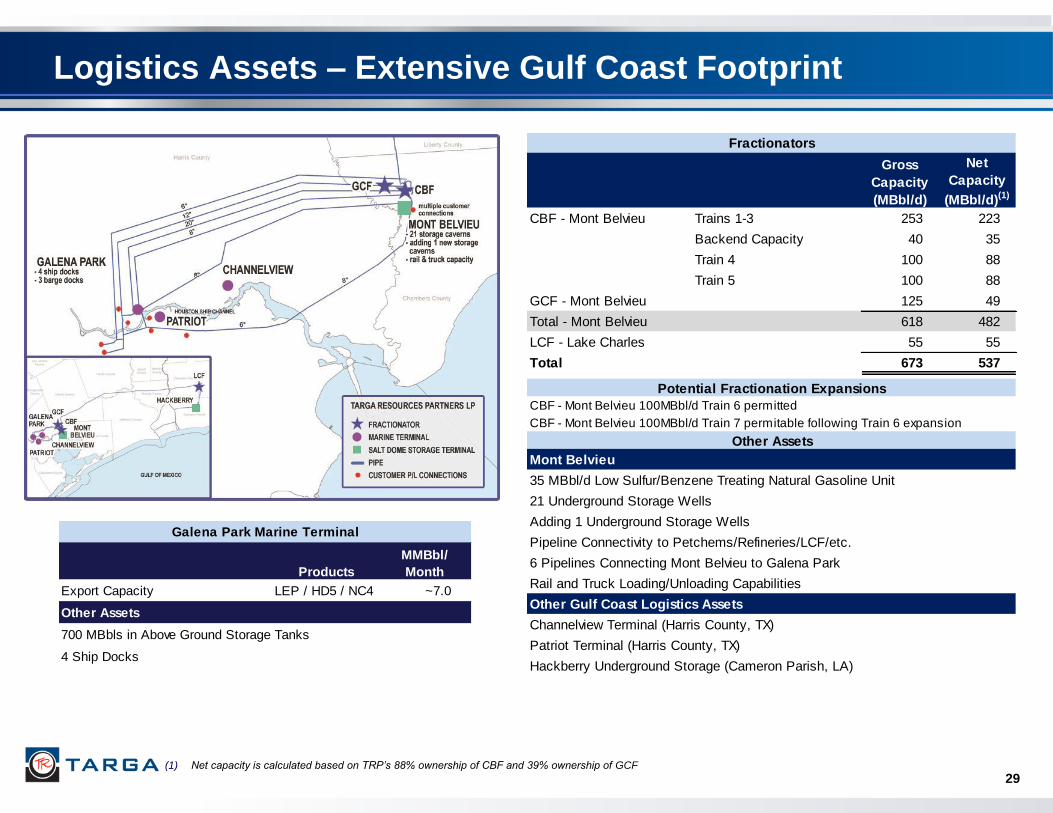
Fractionators
Gross
Capacity
(MBbl/d)
Net
Capacity
(MBbl/d)(1)
CBF - Mont Belvieu Trains 1-3 253 223
Backend Capacity 40 35
Train 4 100 88
Train 5 100 88
GCF - Mont Belvieu 125 49
Total - Mont Belvieu 618 482
LCF - Lake Charles 55 55
Total 673 537
Potential Fractionation Expansions
CBF - Mont Belvieu 100MBbl/d Train 6 permitted
CBF - Mont Belvieu 100MBbl/d Train 7 permitable following Train 6 expansion
Other Assets
Mont Belvieu
35 MBbl/d Low Sulfur/Benzene Treating Natural Gasoline Unit
21 Underground Storage Wells
Pipeline Connectivity to Petchems/Refineries/LCF/etc.
6 Pipelines Connecting Mont Belvieu to Galena Park
Rail and Truck Loading/Unloading Capabilities
Other Gulf Coast Logistics Assets
Channelview Terminal (Harris County, TX)
Patriot Terminal (Harris County, TX)
Hackberry Underground Storage (Cameron Parish, LA)
Adding 1 Underground Storage Wells
Logistics Assets – Extensive Gulf Coast Footprint
29 (1) Net capacity is calculated based on TRP’s 88% ownership of CBF and 39% ownership of GCF
Galena Park Marine Terminal
Products
MMBbl/
Month
Export Capacity LEP / HD5 / NC4 ~7.0
Other Assets
700 MBbls in Above Ground Storage Tanks
4 Ship Docks

1,724 1,796 1,842 1,856
1,403
907 866 753
562
422 479
589 683
-
500
1,000
1,500
2,000
2,500
3,000
3,500
4,000
4,500
5,000
0
200
400
600
800
1,000
1,200
1,400
1,600
1,800
2,000
Q1 -2014
Q2 -2014
Q3 -2014
Q4 -2014
Q1 -2015
Q2 -2015
Q3 -2015
Q4 -2015
Q1 -2016
Q2 -2016
Q3 -2016
Q4 -2016
Jan2017
Liq
uid
s P
rod
ucti
on
(M
Bb
l/d
)
Rig
Co
un
t
Rig Count Field NGL Production Total Production
30
Targa’s Fractionation Assets
Domestic Rig Count and NGL Supply
(1) Source: Baker Hughes as of January 27, 2017
(2) Source: EIA as of November 30, 2016
NGL field production has been resilient amidst a steady
decline in rig count since early 2015
With a more stable commodity price outlook, upstream
activity is expected to continue to increase, which should
drive further growth in NGL production
While there is currently some excess frac capacity in Mont
Belvieu, frac capacity likely to tighten in late 2017 and
beyond
EPD ethane export facility plus new petchems will increase
ethane demand and ethane recovery
Targa well positioned to benefit
Targa Fractionation Footprint
Targa’s Y-grade capacity at its Mont Belvieu
CBF fractionator is 453 MBbl/d with additional
back-end capacity of 40 MBbl/d and 55 MBbl/d
of additional capacity at the interconnected
Lake Charles fractionation facility
100 Mbbl/d CBF Train 5 operational in May 2016
Train 6 is permitted and Targa will proceed when
additional frac capacity is needed
(1) (2) (2)
231
268
299 288
350 343
309
0.0
50.0
100.0
150.0
200.0
250.0
300.0
350.0
400.0
2010 2011 2012 2013 2014 2015 2016
Th
rou
gh
pu
t (M
Bb
ls/d
)

6.3
6.9
5.8
5.0
5.6 5.9
5.5 5.5
4.8
6.3
-
1.0
2.0
3.0
4.0
5.0
6.0
7.0
8.0
Q3 Q4 Q1 Q2 Q3 Q4 Q1 Q2 Q3 Q4
2014 2015 2016
LP
G E
xp
ort
s (
MM
Bb
l/m
on
th)
31
Targa’s LPG Export Business
Galena Park LPG Export Volumes
LPG Exports by Destination(1)
Fee based business – charge fee for loading vessel at dock
Targa advantaged versus some potential competitors given
support infrastructure (fractionation, salt cavern storage,
supply/market interconnectivity, refrigeration, de-
ethanizers)
Differentiated facility versus other LPG export facilities due
to operational flexibility on vessel size and cargo
composition
Nameplate capacity of ~9 MMBbl/month; effective
operational capacity of ~7 MMBbl/month or more
Majority of Targa volumes staying in the Americas, but
some volumes traveling to Europe and the Far East
Currently have approximately 2/3 of capacity contracted
each year through 2022, with minor variability each year (1) Trailing twelve months – Q1 2016 through Q4 2016
Propane and Butane Exports(1)
Early days of Gulf
Coast exports;
historic MB-CP
spreads
~50%
~20%
~30%
Latin America/South America Caribbean Rest of the WorldPropane Butanes
~15%
~85%

Additional Information Concerning - Permian Acquisition
Announced January 23, 2017

Transaction Overview
33 33
Targa Resources Corp. (NYSE: TRGP) (“Targa” or the “Company”) has executed definitive agreements for its
subsidiary, Targa Resources Partners LP, to acquire 100% of the membership interests of Outrigger Delaware
Operating, LLC, Outrigger Southern Delaware Operating, LLC (together “Outrigger Delaware”) and Outrigger
Midland Operating, LLC (“Outrigger Midland” and together with “Outrigger Delaware”, “Outrigger Permian”)
$565 million initial cash consideration represents ~9x 2017E EBITDA multiple
Outrigger Permian sellers may receive additional consideration linked to existing contract performance via earn-out
payments(1)
Targa’s acquisition of the Outrigger Permian assets provides numerous strategic benefits to Targa, including:
Expands premier Permian footprint deeper into the Delaware and Midland basins
Additional 250,000+ acres dedicated under long-term contracts from a strong mix of active operators
Increases Targa’s gross processing capacity to ~2 Bcf/d across the Permian Basin by year-end 2017
Expect to connect Outrigger Permian assets to existing Targa systems, and acquisition may facilitate eventual connection of Targa
Sand Hills and Versado systems in the Delaware
Adds attractive fee-based natural gas gathering and processing and crude gathering assets in the Permian Basin backed by
long-term contracts
Accretive to distributable cash flow in 2017 and beyond
Closing expected in Q1 2017, subject to customary regulatory approvals and other closing conditions
(1) See page 35, “Summary – Earn-Out Structure”, for additional information

Strategic Rationale – Assets, Operations and Contracts
34 34
Contracts are with
High Quality,
Active Producers
Several quality pure-play producers moving to development in 2017+
Strong mix of public and private operators with impressive track records of growth
Expands Targa’s already strong and diverse customer relationships
Attractive Long-Term
Fee Based
Contracts
Almost entirely fixed-fee contracts
Long-term contracts
Weighted average life of more than 13 years
Addition of 250,000+
Dedicated Acres in
Prolific Delaware and
Midland Basins
Significant organic growth potential from continued producer development
Decades of inventory of highly economic drilling locations
Will benefit from continued improvements in drilling results
Highly Complementary to
Existing Targa
Footprint and Assets
Connected systems allow for operational and capital efficiencies
Expect to immediately connect Outrigger Delaware assets to Sand Hills and Outrigger Midland
assets to WestTX
Expected to provide additional volumes for Targa’s downstream assets over time
Introduces
Targa to Crude Gathering
in the Permian
Opportunity to expand crude gathering operations into the Permian
Expect new opportunities to leverage system to grow crude gathering footprints

Strategic Rationale – Structure and Financial Impact
35 35
Accretive
Transaction
to
Financial Metrics
Transaction expected to be accretive to Distributable Cash Flow in 2017 and beyond
Successful asset performance will increase realized gross margin, resulting in larger
potential earn-out payments, and importantly, additional accretion for Targa
Initial
Consideration
$565 million of initial consideration represents an ~9x 2017E EBITDA multiple
Expect to fund through capital markets activities and borrowings from the TRP credit
facility
The merits of the acquisition of the Outrigger Permian assets are strong on an operational and strategic basis,
further heightened by a transactional structure that aligns total consideration with existing contract performance
Attractive
Transaction
Structure
Earn-out payments based on realized gross margin on existing contracts
First earn-out payment based on attractive multiples of realized gross margin from existing
contracts from March 1, 2017 through February 28, 2018
Second earn-out payment based on attractive multiples of realized gross margin from existing
contracts from March 1, 2018 through February 28, 2019
Earn-out structure de-risks transaction
As compared to a single significant upfront payment, Targa is paying for performance on existing
contracts through earn-out payments over time, and performance drives total consideration
Upside from additional contracts accrues solely to Targa’s benefit

36
Summary – Earn-Out Structure
Beneficial
Transaction
Structure
Potential earn-out payments are based on realized gross margin(1) on existing contracts as of
the estimated close for the Outrigger Delaware and Outrigger Midland assets
$565 million of Initial Consideration(2) representing an ~9x 2017E EBITDA multiple
Calculation of Potential Earn-Out Payment #1:
Outrigger Delaware = 9.75 times Actual Outrigger Delaware 2017(1) Gross Margin less
Initial Delaware Consideration of $385 million
Outrigger Midland = 9.25 times Actual Outrigger Midland 2017(1) Gross Margin less
Initial Midland Consideration of $180 million
Calculation of Potential Earn-Out Payment #2:
Outrigger Delaware = 8.75 times Actual Outrigger Delaware 2018(1) Gross Margin less
(Initial Delaware Consideration of $385 million + Outrigger Delaware Earn-Out Payment #1)
Outrigger Midland = 8.75 times Actual Outrigger Midland 2018(1) Gross Margin less
(Initial Outrigger Midland Consideration of $180 million + Outrigger Midland Earn-Out Payment #1)
Earn-Out Diagram Outrigger Delaware Outrigger Midland Outrigger Consolidated
Initial Consideration(2) $385 million $180 million $565 million
Earn Out #1 Multiple(1) 9.75x 9.25x N/A
Earn Out #2 Multiple(1) 8.75x 8.75x N/A
Potential Earn-Out Payments $935 million
Potential Total Consideration $1.5 billion
(1) Based on Gross Margin generated from existing contracts between March 1, 2017 and February 28, 2018 for Earn Out #1 and (ii) March 1, 2018 and February 28, 2019
for Earn Out #2
(2) $90 million of initial consideration paid within 90 days of closing, balance at closing

Additional Information

38
Noble Crude and Condensate Splitter Project – Events and Non-GAAP Accounting Treatment
March 31, 2014
Announced an agreement with Noble Americas Corp., a subsidiary of Noble Group Ltd.
("Noble"), to construct a 35 Mbbl/d condensate splitter located at the Channelview Terminal
supported by a long-term, fee-based arrangement
October 2016
First ~$40 million pre-payment from Noble received under the terms of the crude and
condensate splitter agreements. An ~$40 million pre-payment will be received every October
until the year prior to the final year of the contract
Noble made a cash payment (recognized in Q1, Q2 and Q3 2015) to Targa to modify the existing
agreements to provide time for Noble to analyze the splitter and/or a new terminal at Patriot. The
original deal economics from March 2014 were not negatively impacted as a result of the revised
agreements
December 31,
2014
Summary
Non-GAAP Accounting Treatment
Date Description EBITDA DCF
Q4 2016 ~$40 million cash pre-payment from Noble + ~$10 million + ~$40 million
Q1 2017 + ~$10 million
Q2 2017 + ~$10 million
Q3 2017 + ~$10 million
Q4 2017 ~$40 million cash pre-payment from Noble + ~$10 million + ~$40 million
Q1 2018 Asset is expected to be operational + ~$10 million - associated opex
Q2 2018 + ~$10 million - associated opex
Q3 2018 + ~$10 million - associated opex
Q4 2018+ Similar treatment until final contract year (term of contract has not been disclosed) + ~$10 million - associated opex + ~$40 million - associated opex

$199
$246
$298
$0
$50
$100
$150
$200
$250
$300
$350
Dividends Paid Distributable Cash Flow Adjusted EBITDA
$ i
n m
ilio
ns
$442
$695
$1,137
$599 $682
$1,281
$640 $574
$1,214
$0
$200
$400
$600
$800
$1,000
$1,200
$1,400
G&P Logistics & Mktg Total
$ i
n m
ilio
ns
FY 2014 FY 2015 FY 2016
$98
$191
$289
$167 $163
$329
$179
$150
$329
$0
$50
$100
$150
$200
$250
$300
$350
G&P Logistics & Mktg Total
$ i
n m
ilio
ns
Q4 2014 Q4 2015 Q4 2016
39
TRC Update
Adjusted EBITDA declined in Q4 2016 versus Q4
2015 due to lower downstream segment operating
margin, partially offset by higher G&P segment
operating margin
DCF increased in Q4 2016 vs Q4 2015
TRP compliance leverage at 3.8x
$0.91 dividend declared on TRC common shares
$3.64 annual dividend per share
$22.9 million of dividends paid on TRC 9.5%
Series A preferred shares
(1) Includes impact of commodity hedge settlements
(2) Includes dividends on TRC common shares and on TRC 9.5% Series A preferred shares
Q4 2016
Operating Margin
Q4 2016 Summary
(2)
(1) (1)

40 40
Pro Forma Consolidated Capitalization
(1) Adjusts EBITDA to provide credit for material capital projects that are in process, but have not started commercial operation, and other items; compliance debt excludes
senior notes of Targa Pipeline Partners, L.P. (“TPL”) and $250 million of borrowings under the A/R Securitization Facility
(2) TRC compliance leverage deducts cash and cash equivalents from debt
($ in millions)
Actual Actual
Cash and Debt Maturity Coupon 9/30/2016 Adjustments 12/31/2016
Cash and Cash Equivalents $141.1 ($67.6) $73.5
TRP Accounts Receivable Securitization Dec-16 225.0 50.0 275.0
TRP Revolving Credit Facility Oct-20 – 150.0 150.0
TRC Revolving Credit Facility Feb-20 275.0 – 275.0
TRC Term Loan B Feb-22 160.0 – 160.0
Unamortized Discount (2.3) 0.1 (2.2)
Total Senior Secured Debt 657.7 857.8
Senior Notes Jan-18 5.000% 733.6 (483.1) 250.5
Senior Notes Nov-19 4.125% 749.4 - 749.4
Senior Notes Oct-20 6.625% 309.9 (309.9) -
Senior Notes Feb-21 6.875% 478.6 (478.6) -
Senior Notes Aug-22 6.375% 278.7 - 278.7
Senior Notes May-23 5.250% 559.6 - 559.6
Senior Notes Nov-23 4.250% 583.9 - 583.9
Senior Notes Mar-24 6.750% 580.1 - 580.1
Senior Notes Feb-25 5.125% – 500.0 500.0
Senior Notes Feb-27 5.375% – 500.0 500.0
Unamortized Discount/Premium on TRP Debt (15.4) 15.4 -
TPL Senior Notes Oct-20 6.625% 12.9 (12.9) -
TPL Senior Notes Nov-21 4.750% 6.5 - 6.5
TPL Senior Notes Aug-23 5.875% 48.1 - 48.1
Unamortized Premium on TPL Debt 0.6 (0.1) 0.5
Total Consolidated Debt $4,984.2 $4,915.1
TRP Compliance Leverage Ratio(1) 3.8x 3.8x
TRC Compliance Leverage Ratio(2) 0.9x 0.7x
Liquidity:
TRP Credit Facility Commitment $1,600.0 – $1,600.0
Funded Borrowings – (150.0) (150.0)
Letters of Credit (13.5) 0.3 (13.2)
Total TRP Revolver Availability $1,586.5 $1,436.8
Available A/R Securitization Capacity - -
Total TRP Liquidity with Available A/R Securitization Capacity $1,586.5 $1,436.8
Available TRC Credit Facility Availability 395.0 395.0
Cash 141.1 73.5
Total Consolidated Liquidity $2,122.6 $1,905.3

Current Gross
Processing Capacity
(MMcf/d)
2016 NGL
Production
(MBbl/d)
LOU 440
Vesco 750
Other Coastal Straddles 3,255
Total 4,445 41
1,680 1,551
1,416 1,330 1,188
897 838
50 50
46 45
47
42 41
0
10
20
30
40
50
60
70
80
0
400
800
1,200
1,600
2,000
2010 2011 2012 2013 2014 2015 2016
Gro
ss N
GL
Pro
du
cti
on
(M
Bb
l/d
)
Inle
t V
olu
me (
MM
cf/
d)
Inlet Gross NGL Production
41
Summary Footprint
Volumes
Asset position represents a competitively advantaged
straddle option on Gulf of Mexico activity over time
LOU (Louisiana Operating Unit)
440 MMcf/d of gas processing (180 MMcf/d Gillis Plant,
80 MMcf/d Acadia Plant and 180 MMcf/d Big Lake Plant)
Interconnected to Lake Charles Fractionator (LCF)
Coastal Straddles (including VESCO)
Positioned on mainline gas pipelines processing volumes
of gas collected from offshore
Coastal inlet volumes and NGL production have been
declining, but NGL production decreases have been
partially offset by moving volumes to more efficient
plants
Hybrid contracts (POL with fee floors)
Coastal – Gulf Coast Footprint

U.S. Butane(3)
($0.20)
($0.10)
$0.00
$0.10
$0.20
$0.30
$0.40
$0.50
$0.60
$0.70
$0.80
0
5
10
15
20
25
30
35
2005 2006 2007 2008 2009 2010 2011 2012 2013 2014 2015 2016
$/g
al
MM
Bb
ls
Imports Exports Butane Basis (CP less MB)
($0.20)
($0.10)
$0.00
$0.10
$0.20
$0.30
$0.40
$0.50
$0.60
$0.70
$0.80
0
50
100
150
200
250
300
350
2005 2006 2007 2008 2009 2010 2011 2012 2013 2014 2015 2016
$/g
al
MM
Bb
ls
Imports Exports Propane Basis (CP less MB)
42
Dynamics of the LPG Market
VLGC Freight Rates(1) Increasing VLGC Fleet(2)
(1) Source: Baltic Exchange; Bloomberg
(2) Clarksons Platou and Gibson
(3) Source: IHS
+32
+50
+22
U.S. Propane(3)
$0.00
$0.20
$0.40
$0.60
$0.80
$1.00
$1.20
$1.40
$1.60
$1.80
$0.00
$0.05
$0.10
$0.15
$0.20
$0.25
$0.30
$0.35
MB
Pro
pan
e P
rice (
$/g
al)
Balt
ic S
hip
pin
g R
ate
($/g
al)
Baltic Shipping Rate MB Propane Price
+5
+7
167
199
249
271 276 283
0
50
100
150
200
250
300
2014 2015 2016 2017E 2018E 2019E
Nu
mb
er
of
VL
GC
s

Reconciliations

44
This presentation includes the non-GAAP financial measure of Adjusted EBITDA. The presentation provides a
reconciliation of this non-GAAP financial measures to its most directly comparable financial measure calculated
and presented in accordance with generally accepted accounting principles in the United States of America
("GAAP"). Our non-GAAP financial measures should not be considered as alternatives to GAAP measures such
as net income, operating income, net cash flows provided by operating activities or any other GAAP measure of
liquidity or financial performance.
Non-GAAP Measures Reconciliation

45
Adjusted EBITDA - The Company defines Adjusted EBITDA as net income (loss) available to TRC before: interest;
income taxes; depreciation and amortization; impairment of goodwill; gains or losses on debt repurchases,
redemptions, amendments, exchanges and early debt extinguishments and asset disposals; risk management
activities related to derivative instruments including the cash impact of hedges acquired in the APL merger; non-
cash compensation on equity grants; transaction costs related to business acquisitions; the Splitter Agreement
adjustment; net income attributable to TRP preferred limited partners; earnings/losses from unconsolidated affiliates
net of distributions, distributions from preferred interests, change in contingent consideration and the noncontrolling
interest portion of depreciation and amortization expenses. Adjusted EBITDA is used as a supplemental financial
measure by the Company and by external users of the Company’s financial statements such as investors,
commercial banks and others. The economic substance behind the Company’s use of Adjusted EBITDA is to
measure the ability of the Company’s assets to generate cash sufficient to pay interest costs, support our
indebtedness and pay dividends to the Company’s investors.
Adjusted EBITDA is a non-GAAP financial measure. The GAAP measure most directly comparable to Adjusted
EBITDA is net income (loss) attributable to TRC. Adjusted EBITDA should not be considered as an alternative to
GAAP net income. Adjusted EBITDA has important limitations as an analytical tool. Investors should not consider
Adjusted EBITDA in isolation or as a substitute for analysis of our results as reported under GAAP. Because
Adjusted EBITDA excludes some, but not all, items that affect net income and is defined differently by different
companies in the Company’s industry, the Company’s definition of Adjusted EBITDA may not be comparable to
similarly titled measures of other companies, thereby diminishing its utility.
Management compensates for the limitations of Adjusted EBITDA as an analytical tool by reviewing the comparable
GAAP measures, understanding the differences between the measures and incorporating these insights into our
decision-making processes.
Non-GAAP Measures Reconciliation

46
Distributable Cash Flow - The Company defines distributable cash flow as Adjusted EBITDA less distributions to
TRP preferred limited partners, the Splitter Agreement adjustments, cash interest expense on debt obligations,
cash tax (expense) benefit and maintenance capital expenditures (net of any reimbursements of project costs). This
measure includes the impact of noncontrolling interests on the prior adjustment items.
Distributable cash flow is a significant performance metric used by the Company and by external users of the
Company’s financial statements, such as investors, commercial banks and research analysts, to compare basic
cash flows generated by the Company (prior to the establishment of any retained cash reserves by our board of
directors) to the cash dividends the Company expects to pay its shareholders. Using this metric, management and
external users of the Company’s financial statements can quickly compute the coverage ratio of estimated cash
flows to cash dividends. Distributable cash flow is also an important financial measure for the Company’s
shareholders since it serves as an indicator of the Company’s success in providing a cash return on investment.
Specifically, this financial measure indicates to investors whether or not the Company is generating cash flow at a
level that can sustain or support an increase in the Company’s quarterly dividend rates.
Distributable cash flow is a non-GAAP financial measure. The GAAP measure most directly comparable to
distributable cash flow is net income (loss) attributable to TRC. Distributable cash flow should not be considered as
an alternative to GAAP net income (loss) available to common and preferred shareholders. It has important
limitations as an analytical tool. Investors should not consider distributable cash flow in isolation or as a substitute
for analysis of the Company’s results as reported under GAAP. Because distributable cash flow excludes some, but
not all, items that affect net income and is defined differently by different companies in the Company’s industry, the
Company’s definition of distributable cash flow may not be comparable to similarly titled measures of other
companies, thereby diminishing its utility.
Management compensates for the limitations of distributable cash flow as an analytical tool by reviewing the
comparable GAAP measure, understanding the differences between the measures and incorporating these insights
into the Company’s decision-making processes.
Non-GAAP Measures Reconciliation

2016 2015 2016 2015
Reconciliation of net income (loss) attributable to TRC
to Adjusted EBITDA and Distributable Cash Flow:
Net income (loss) to Targa Resources Corp. (150.8)$ 27.0$ (187.3)$ 58.3$
Add:
Impact of TRC/TRP Merger on NCI - (212.0) (3.8) (180.1)
Income attributable to TRP preferred limited partners 2.9 2.4 11.3 2.4
Interest expense, net 67.2 42.5 254.2 231.9
Income tax expense (benefit) (96.8) (14.5) (100.6) 39.6
Depreciation and amortization expense 194.1 228.8 757.7 677.1
Goodwill impairment 183.0 290.0 207.0 290.0
(Gain) loss on sale or disposition of assets 0.4 (7.8) 6.1 (8.0)
(Gain) loss from financing activities 69.6 (3.5) 48.2 10.1
(Earnings) loss from unconsolidated affiliates 2.9 1.4 14.3 2.5
Distributions from unconsolidated affiliates and preferred partner interests, net 4.9 3.8 17.5 21.1
Change in contingent consideration (0.1) (1.2) (0.4) (1.2)
Compensation on TRP equity grants 7.5 6.0 29.7 25.0
Transaction costs related to business acquisitions - - - 27.3
Splitter agreement 10.8 - 10.8 -
Risk management activities 6.5 18.8 25.2 64.8
Other - 0.6 - 0.6
Noncontrolling interest adjustment (4.5) (56.3) (25.0) (69.7)
TRC Adjusted EBITDA 297.6$ 326.0$ 1,064.9$ 1,191.7$
Distributions to TRP preferred limited partners (2.9) (2.4) (11.3) (2.4)
Cash received from payments under Splitter Agreement 43.0 - 43.0 -
Splitter Agreement (10.8) - (10.8) -
Interest expenses on debt obligations, net (62.7) (68.9) (263.8) (253.3)
Cash tax (expense) benefit 9.8 (15.0) 20.9 (15.0)
Maintenance capital expenditures (29.4) (24.9) (85.7) (97.9)
Noncontrolling interests adjustments of maintenance capex 1.6 1.3 5.2 7.2
TRC Distributable Cash Flow 246.2$ 216.1$ 762.4$ 830.3$
Twelve Months Ended
December 31,
($ in millions)
Three Months Ended
December 31,
($ in millions)
47
Non-GAAP Reconciliations – Q4 and FY 2016 EBITDA and DCF
The following table presents a reconciliation of Adjusted EBITDA and Distributable Cash Flow for the periods shown for
TRC:

48
Non-GAAP Reconciliations – Q4 and FY 2016 Gross Margin
The following table presents a reconciliation of gross margin and operating margin to net income (loss) for the periods
shown for TRC:
2016 2015 2016 2015
Reconciliation of gross margin and operating
margin to net income (loss):
Gross margin 468.6$ 459.8$ 1,768.0$ 1,821.0$
Operating expenses (139.7) (130.4) (553.7) (540.0)
Operating margin 328.9 329.4 1,214.3 1,281.0
Depreciation and amortization expenses (194.1) (228.8) (757.7) (677.1)
General and administrative expenses (48.9) (25.2) (187.2) (161.7)
Goodwill impairment (183.0) (290.0) (207.0) (290.0)
Interest expense, net (67.2) (42.5) (254.2) (231.9)
Income tax expense 96.8 14.5 100.6 (39.6)
Gain (loss) on sale or disposition of assets (0.4) 7.8 (6.1) 8.0
Gain (loss) from financing activities (69.6) 3.5 (48.2) (10.1)
Other, net (3.1) (0.6) (13.6) (30.0)
Net income (140.6)$ (231.9)$ (159.1)$ (151.4)$
Net income (loss) attributable to noncontrolling interests 10.2 (258.9) 28.2 (209.7)
Net income (loss) attributable to Targa Resources Corp. (150.8)$ 27.0$ (187.3)$ 58.3$
($ in millions)
Twelve Months Ended
December 31,
($ in millions)
Three Months Ended
December 31,

49
1000 Louisiana
Suite 4300
Houston, TX 77002
Phone: (713) 584-1000
Email: [email protected]
Website: www.targaresources.com