target corporation annual report 2000 growth. target corporation
TRANSCRIPT

Target Corporation Annual Report 2000 Growth.Target Corporation Annual Report 2000 Growth.
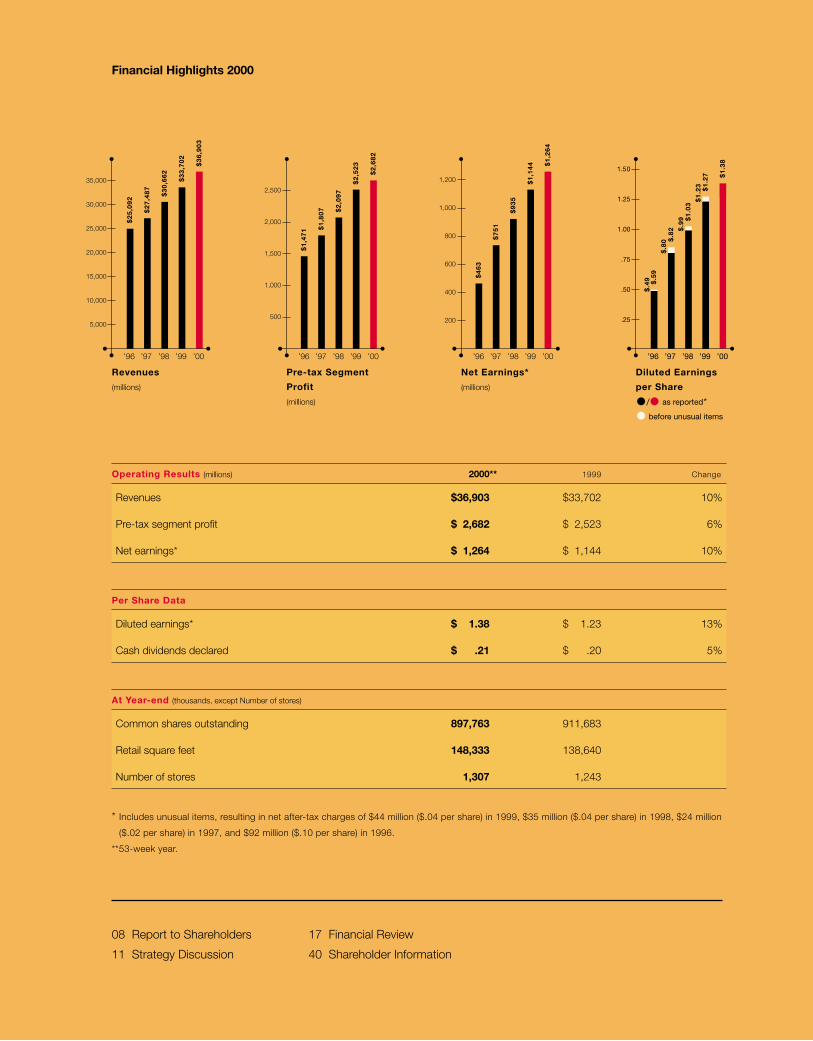
* Includes unusual items, resulting in net after-tax charges of $44 million ($.04 per share) in 1999, $35 million ($.04 per share) in 1998, $24 million
($.02 per share) in 1997, and $92 million ($.10 per share) in 1996.
**53-week year.
Operating Results (millions) 2000** 1999 Change
Revenues $36,903 $33,702 10%
Pre-tax segment profit $ 2,682 $ 2,523 6%
Net earnings* $ 1,264 $ 1,144 10%
Per Share Data
Diluted earnings* $ 1.38 $ 1.23 13%
Cash dividends declared $ .21 $ .20 5%
At Year-end (thousands, except Number of stores)
Common shares outstanding 897,763 911,683
Retail square feet 148,333 138,640
Number of stores 1,307 1,243
08 Report to Shareholders
11 Strategy Discussion
17 Financial Review
40 Shareholder Information
Financial Highlights 2000
$2
5,0
92
Revenues
(millions)
’96 ’97 ’98 ’99 ’00
$2
7,4
87
$3
0,6
62
$3
3,7
02
$3
6,9
03
35,000
30,000
25,000
20,000
15,000
10,000
5,000
$4
63
Net Earnings*
(millions)
’96 ’97 ’98 ’99 ’00
$7
51
$9
35
$1
,14
4 $1
,26
4
1,200
1,000
800
600
400
200
Pre-tax Segment
Profit
(millions)
’96 ’97 ’98 ’99 ’00
$1
,47
1 $1
,80
7 $2
,09
7
$2
,52
3
$2
,68
2
2,500
2,000
1,500
1,000
500
$.8
2$
.80
Diluted Earnings
per Share
/ as reported*
before unusual items
’96 ’97 ’98 ’99 ’00
$.5
9$
.49
$1
.03
$.9
9
$1
.27
$1
.23
$1
.38
1.50
1.25
1.00
.75
.50
.25
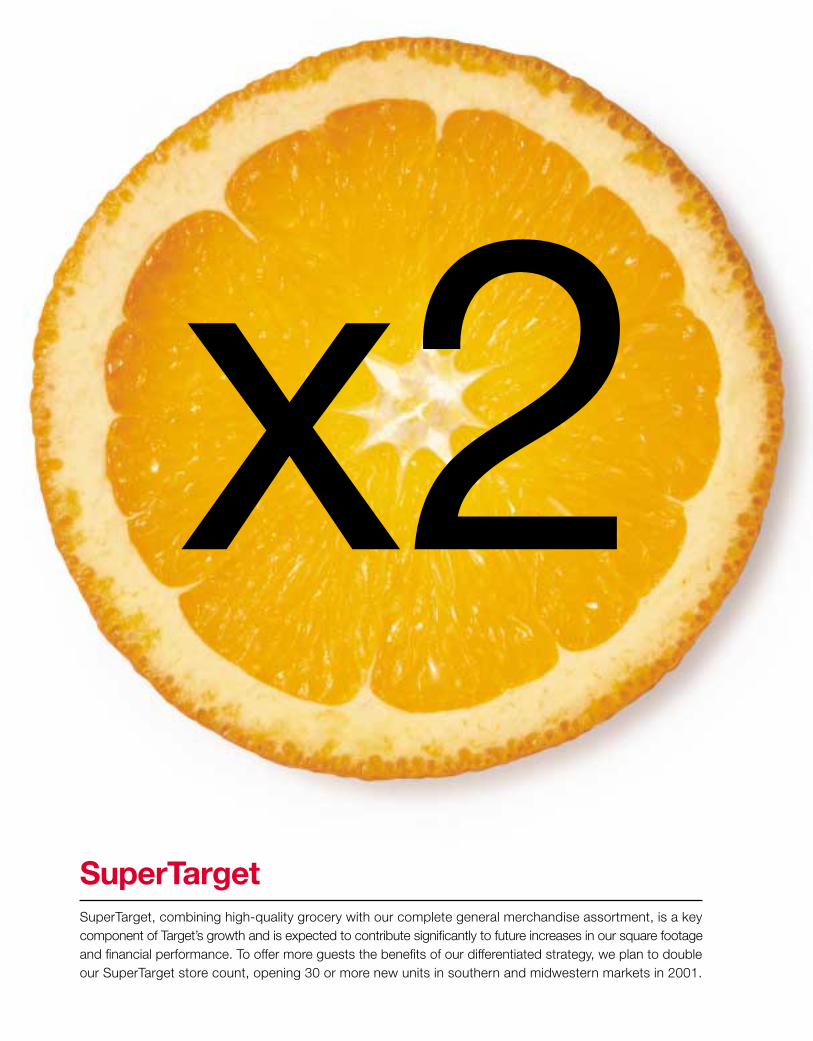
x2SuperTargetSuperTarget, combining high-quality grocery with our complete general merchandise assortment, is a keycomponent of Target’s growth and is expected to contribute significantly to future increases in our square footageand financial performance. To offer more guests the benefits of our differentiated strategy, we plan to doubleour SuperTarget store count, opening 30 or more new units in southern and midwestern markets in 2001.
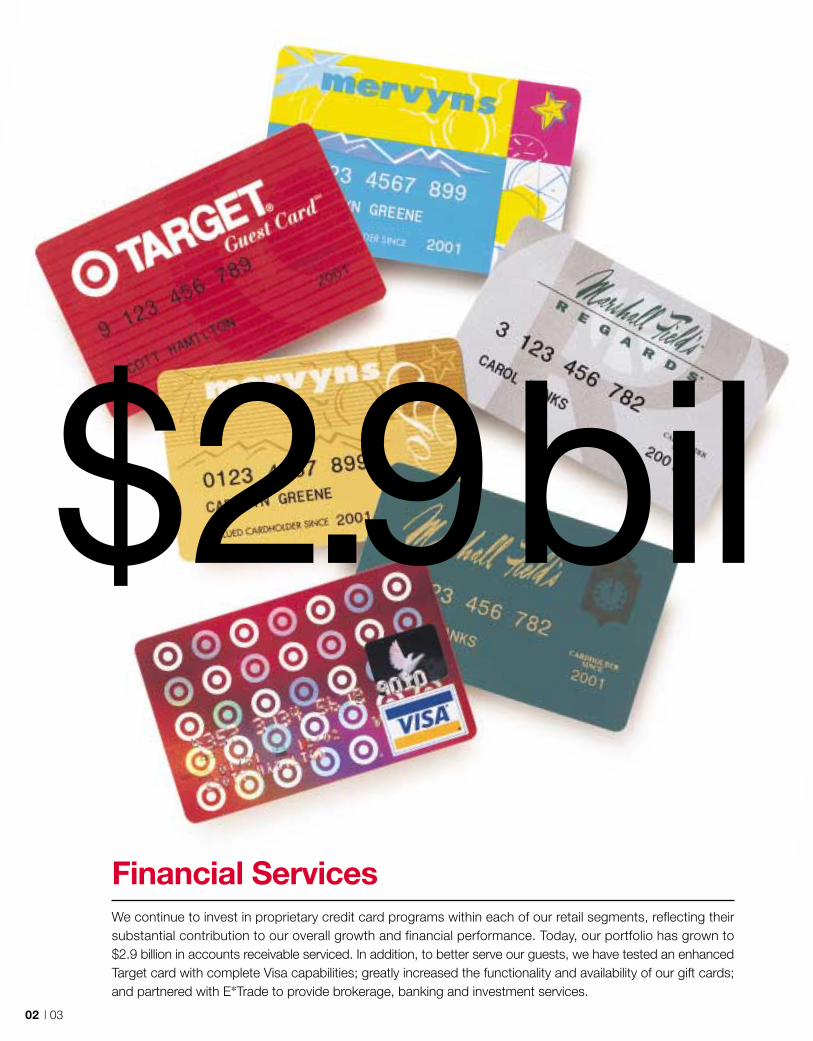
Financial ServicesWe continue to invest in proprietary credit card programs within each of our retail segments, reflecting theirsubstantial contribution to our overall growth and financial performance. Today, our portfolio has grown to$2.9 billion in accounts receivable serviced. In addition, to better serve our guests, we have tested an enhancedTarget card with complete Visa capabilities; greatly increased the functionality and availability of our gift cards;and partnered with E*Trade to provide brokerage, banking and investment services.
$2.9bil
02 | 03

+200%Internet StrategiesThe Internet extends the reach of our store brands and provides a tool for more efficient communication withour team members, our vendor partners and our guests. In 2001, we expect to triple the number of visitors totarget.com, our largest web site. Through target.direct and the WorldWide Retail Exchange, we are leveragingInternet technology to satisfy more of our guests’ needs, improve productivity and position ourselves for continuedstrong earnings growth.
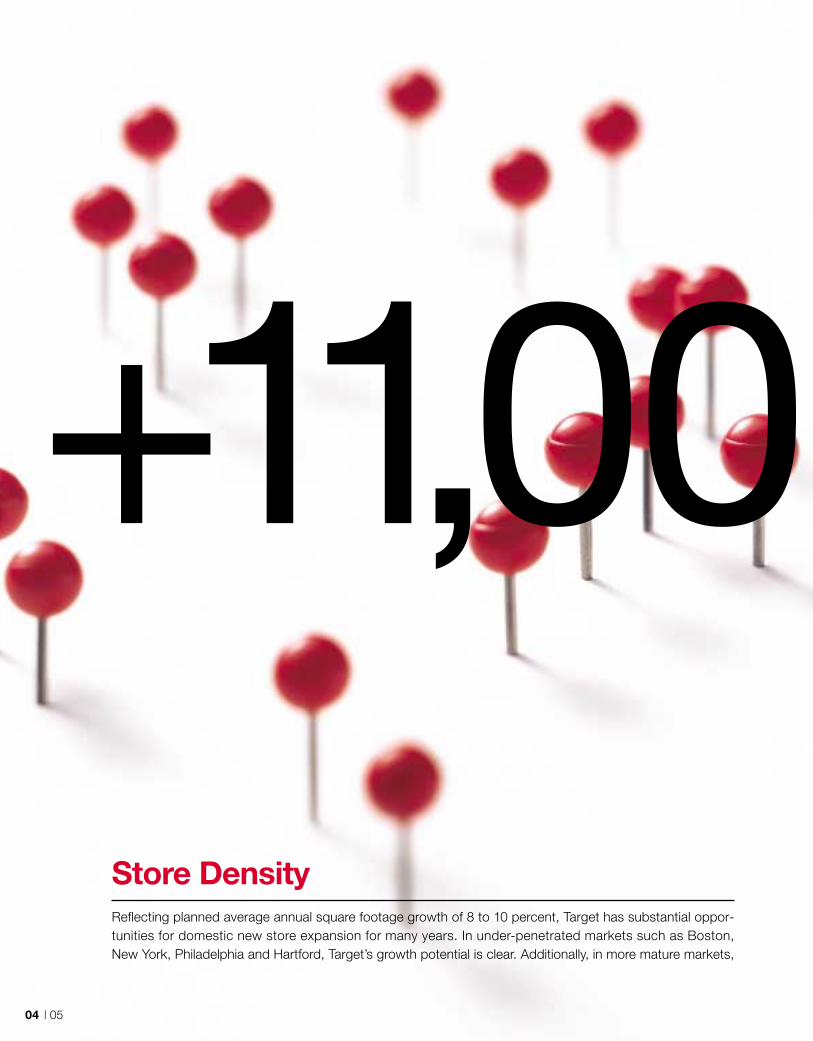
Store DensityReflecting planned average annual square footage growth of 8 to 10 percent, Target has substantial oppor-tunities for domestic new store expansion for many years. In under-penetrated markets such as Boston, New York, Philadelphia and Hartford, Target’s growth potential is clear. Additionally, in more mature markets,
+11,00
04 | 05

including Phoenix, Indianapolis, Denver and Atlanta, Target continues to increase store density and strengthenmarket share through buildback opportunities. In 2001, Target plans to add more than 11 million square feet to a base of over 112 million square feet, through a combination of supercenter and discount store growth.
0,000

Brand ConsolidationWithin our traditional department store segment, Marshall Field’s is our largest and most recognized brand. By combining our 64 stores under this single name, we increase the power of our physical presence and on-line initiatives, and strengthen our competitive position. Though the Dayton’s and Hudson’s names arechanging, we remain committed to being “The Best Store in Town.”
106 | 07

Community GivingFor more than 50 years, we’ve given 5 percent of our federally taxable income to nonprofit organizations across the country. Through current donations, averaging well over $1 million per week, we are continuing our traditionof supporting the many communities we serve. From St. Jude Children’s Research Hospital to Project Imagineto our Community Closet on wheels, our commitment is evident.
5%
Our performance in 2000
demonstrates the strength
of our brands, the soundness
of our overall strategy and the
value of our financial disciplines.
In a difficult environment, we achieved solid financial
results: a 9.5 percent increase in annual revenues
to $36.9 billion and a 13.1 percent gain in earnings
per share (9.2 percent compared with 1999 earnings
per share before unusual items) to $1.38. In addition:
• We continued to invest in new Target discount
stores and SuperTarget growth, further
expanding our market share.
• We aggressively repurchased shares of our
common stock, reflecting our ongoing
commitment to creating shareholder value.
• We engineered a strong profit recovery at
Mervyn’s through improved merchandising
and adept inventory management.
• And, we devoted significant resources to build
and further strengthen both our Internet and
financial services businesses.
Though we under-performed our long-term
growth objectives in 2000, and the economic
environment in 2001 remains uncertain, we are
confident in our underlying strategy and growth
potential. By leveraging the power of our Target
brand, we believe that we can continue to deliver
strong growth and financial success for many years
to come.
Store Growth As a corporation, our greatest
opportunity for future growth is the continued
expansion of our Target Stores division. In 2000,
through a combination of discount stores and
supercenter stores, Target opened 65 net new
locations and added net square footage of more
than 9 percent, or nearly 10 million square feet.
We continued to increase our presence in newer
markets along the East coast, and we built back stores
in our more mature markets throughout the rest
of the country. We believe that this effort to densify
major metropolitan areas—even extremely well-
established markets such as Minneapolis/St. Paul —
presents an important opportunity for us to serve
more guests, gain market share, improve profitability
and create shareholder wealth. In 2001, we plan
to increase our U.S. penetration, adding more than
10 percent, on a net basis, to Target’s year-end
2000 square footage. Included in this 2001 store-
opening program are 30 or more SuperTarget
locations, representing about one-half of our
incremental square feet and a doubling of our
supercenter store count. As evidenced by this rapid
expansion, SuperTarget is expected to be a key
contributor to our near-term and long-term growth.
In recent years, we have become increasingly
flexible in our site selection and store design—
without compromising our Target brand or our
financial disciplines. By successfully replicating
our guest experience in more unique locations, we
have significantly expanded our growth horizons.
Reflecting this confidence, we announced our intent
To Our Shareholders,
08 | 09
earlier this year to purchase 35 former Montgomery
Wards stores. This acquisition provides an excellent
opportunity for Target to secure prime real estate
in a large number of premier markets, including
California, where sufficient, desirable property is
particularly difficult to find. We intend to extensively
renovate these stores to ensure that they fully reflect
our Target brand, and expect the majority of these
locations to open as Target stores during 2002.
Other Growth In addition to store expansion, the
growth of our Target Stores division is propelled by
our ability to protect and enhance our distinct brand
character. We strive to provide our guests with a
shopping experience that is consistently better than,
and different from, their experiences at our competi-
tors’ stores. By offering innovative, well-designed
merchandise, compelling prices and clean, attract-
ive stores, we deliver the excitement and value
that our guests expect and demand. In 2000,
we introduced Philips Kitchen Appliances, Martex
domestics and Liz Claiborne fashions, among
other brands; and in 2001, our assortment of new,
exclusive products includes Mossimo apparel, Waverly
home furnishings and Eddie Bauer camping gear.
Our commitment to constantly renew and refresh
our offering, and satisfy the lifestyle needs of our guests,
enhances our brand and fuels our continued growth.
Combined with Target’s operational consistency,
this unique brand positioning also provides the
foundation for extending our brand through the
Internet and financial services initiatives. For example,
by capturing the synergies inherent in building com-
plementary web-based and store-based strategies,
our target.direct team continues to expand both the
merchandise offering and functionality of our on-line
business, providing the differentiated assortment,
great prices, unique marketing, and fast, fun and
friendly service that are at the heart of our Target
store strategy. As a result, we are driving substan-
tially increased guest visits and sales at target.com
and expect traffic to our site to triple in 2001.
We are also increasingly using the Internet as
the platform for improving communications and
facilitating commerce with our business partners.
As a founding member of the WorldWide Retail
Exchange, we believe that the technology and
infrastructure available through this channel will
enhance our efficiency and ultimately enable us to
deliver more value to our guests and our shareholders.
Similarly, our financial services, including our
credit card operations, are integral components of
our overall strategy and meaningful contributors to
our annual revenue and profit growth. Over the past
five years, pre-tax contribution from this business
has grown at a compound annual rate of 17 percent
and our return on investment has also risen sharply.
To sustain this growth, we continue to reinforce
the use of our own proprietary cards as the preferred
method of payment by investing in guest loyalty and
rewards programs at all three of our retail segments.
In addition, we are expanding our offering of gift
cards; providing access to integrated banking,
brokerage and investment planning services through
assortment and promotional pricing complement
the offerings at Target and Marshall Field’s. Together,
Mervyn’s and Marshall Field’s generate approximately
$500 million in net pre-tax cash flow annually.
In addition, the added scale of these two divisions
contributes to our overall performance by allowing us
to leverage important resources, such as our credit
expertise and systems investment, and increase the
efficiency and profitability of our total organization.
As we look to the future, we believe that our
corporation is well-positioned to meet near-term
economic challenges and continue to grow and
prosper. We are confident in the strategy of our core
businesses and excited about the new opportunities
that will fuel our growth in coming years. Over time,
we expect to achieve our objective of generating
15 percent or more in average annual earnings
per share growth and we remain committed to
delivering superior returns to our shareholders.
Sincerely,
our alliance with E*Trade; and leveraging guest
interactions throughout our organization to create
a comprehensive database that will help us
strengthen our long-term relationship with our guests.
We are also piloting an enhanced Target Card with
greater utility and universal acceptance throughout
the Visa network. While we are still evaluating this
test initiative, the early results are promising and
we believe that it may offer another avenue of
potential growth for Target.
Target Corporation reflects our core belief that our
three retail segments are far more similar than they are
different, and that scale matters. Though our two
smaller retail divisions represent 20 percent or less
of the corporation today, we believe that their combined
contribution to our overall strategy and financial
performance remains important. As a result, we are
taking steps to leverage the power of these brands
and strengthen their position in the marketplace.
To operate our traditional department stores with
a single identity, we are changing the names of our
Dayton’s and Hudson’s stores to Marshall Field’s.
This more widely-recognized name preserves our
commitment to fashion leadership and superior
guest service, and reinforces our long heritage as
an admired department store institution. It also gives
us the ability to launch an on-line gift registry with
a coherent, unified vision in 2001. At Mervyn’s, we
are focused on executing our “Big Brands. Small
Prices.” strategy and maintaining our 2000 profit
momentum. Mervyn’s highly-branded, middle-market
Bob Ulrich, Chairman and Chief Executive Officer
10 | 11

Target Corporation’s goal is to deliver average annual
earnings per share growth of 15 percent or more over
time and generate superior returns for our shareholders.
We expect to achieve this goal by increasing market share
from new and existing stores; improving productivity
through investment in technology and infrastructure;
and leveraging the power of our brands into new
strategies, including supercenters, financial services
and electronic commerce.
Store Density The company’s primary growth comes
from new store expansion within our Target Stores
division. Through a combination of net new discount
stores and new SuperTarget stores, Target plans to
continue adding an average of 8 to 10 percent to retail
square footage annually. We continue to build out less
penetrated markets, such as Boston, New York and
Philadelphia, that provide substantial growth oppor-
tunities because of their dense population and the
favorable demographics of potential guests. We also
continue to introduce Target into entirely new markets,
such as our planned entry into Portland, Maine, in the
fall of 2001. But increasingly, Target is expanding its
store density in more mature markets, such as Atlanta,
Phoenix and Dallas/Fort Worth, reflecting the growing
recognition and strength of the Target brand in major
metropolitan areas across the U.S. In fact, despite more
than doubling our presence in Minnesota in the past
ten years, and operating more square footage per capita
in Minnesota than in any other state, Target continues
to strengthen its Minnesota store base and plans to add
five new sites in 2001. This ability to build additional stores
even in well-established markets, and enhance our
financial performance, gives us confidence that Target
can continue to grow profitably for many years to come.
In 2001, Target’s growth plans reflect a net increase
in square footage of between 10 and 11 percent. New
discount store locations in existing markets account
for approximately one-half of this incremental square
footage and about two-thirds of our store openings
during the year. We will also continue to invest in store
remodels to ensure that all Target stores accurately
represent the Target brand.
SuperTarget Expansion SuperTarget supplements
the tremendous growth opportunities provided by our
traditional discount stores and raises the potential to
strengthen our brand in key markets. By combining a
high-quality, full-line grocery assortment with our general
merchandise offering, SuperTarget creates a convenient
one-stop shopping experience for our guests. Like Target,
SuperTarget strives to set itself apart from competitors
Avenues of Growth.
TARGET/CHIP GANASSI RACING TIGER WOODS’ START SOMETHING SUPERTARGETKASHUK
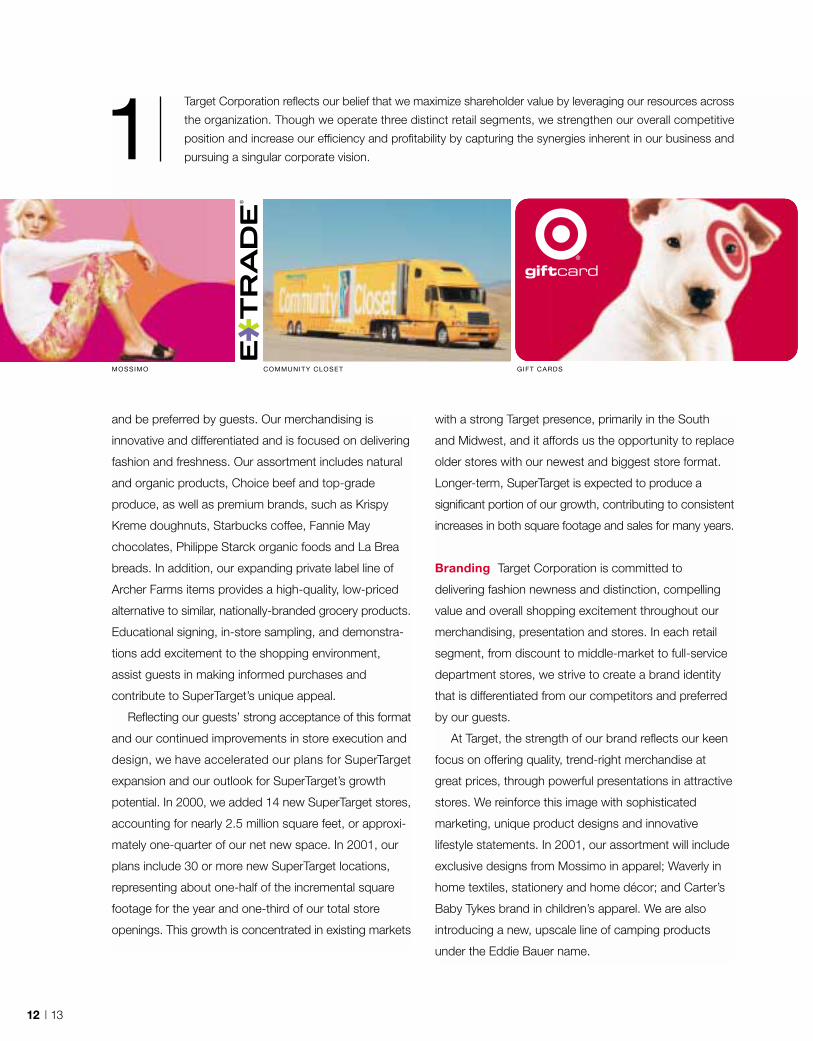
1Target Corporation reflects our belief that we maximize shareholder value by leveraging our resources across
the organization. Though we operate three distinct retail segments, we strengthen our overall competitive
position and increase our efficiency and profitability by capturing the synergies inherent in our business and
pursuing a singular corporate vision.
12 | 13
COMMUNITY CLOSET GIFT CARDS
with a strong Target presence, primarily in the South
and Midwest, and it affords us the opportunity to replace
older stores with our newest and biggest store format.
Longer-term, SuperTarget is expected to produce a
significant portion of our growth, contributing to consistent
increases in both square footage and sales for many years.
Branding Target Corporation is committed to
delivering fashion newness and distinction, compelling
value and overall shopping excitement throughout our
merchandising, presentation and stores. In each retail
segment, from discount to middle-market to full-service
department stores, we strive to create a brand identity
that is differentiated from our competitors and preferred
by our guests.
At Target, the strength of our brand reflects our keen
focus on offering quality, trend-right merchandise at
great prices, through powerful presentations in attractive
stores. We reinforce this image with sophisticated
marketing, unique product designs and innovative
lifestyle statements. In 2001, our assortment will include
exclusive designs from Mossimo in apparel; Waverly in
home textiles, stationery and home décor; and Carter’s
Baby Tykes brand in children’s apparel. We are also
introducing a new, upscale line of camping products
under the Eddie Bauer name.
MOSSIMO
and be preferred by guests. Our merchandising is
innovative and differentiated and is focused on delivering
fashion and freshness. Our assortment includes natural
and organic products, Choice beef and top-grade
produce, as well as premium brands, such as Krispy
Kreme doughnuts, Starbucks coffee, Fannie May
chocolates, Philippe Starck organic foods and La Brea
breads. In addition, our expanding private label line of
Archer Farms items provides a high-quality, low-priced
alternative to similar, nationally-branded grocery products.
Educational signing, in-store sampling, and demonstra-
tions add excitement to the shopping environment,
assist guests in making informed purchases and
contribute to SuperTarget’s unique appeal.
Reflecting our guests’ strong acceptance of this format
and our continued improvements in store execution and
design, we have accelerated our plans for SuperTarget
expansion and our outlook for SuperTarget’s growth
potential. In 2000, we added 14 new SuperTarget stores,
accounting for nearly 2.5 million square feet, or approxi-
mately one-quarter of our net new space. In 2001, our
plans include 30 or more new SuperTarget locations,
representing about one-half of the incremental square
footage for the year and one-third of our total store
openings. This growth is concentrated in existing markets
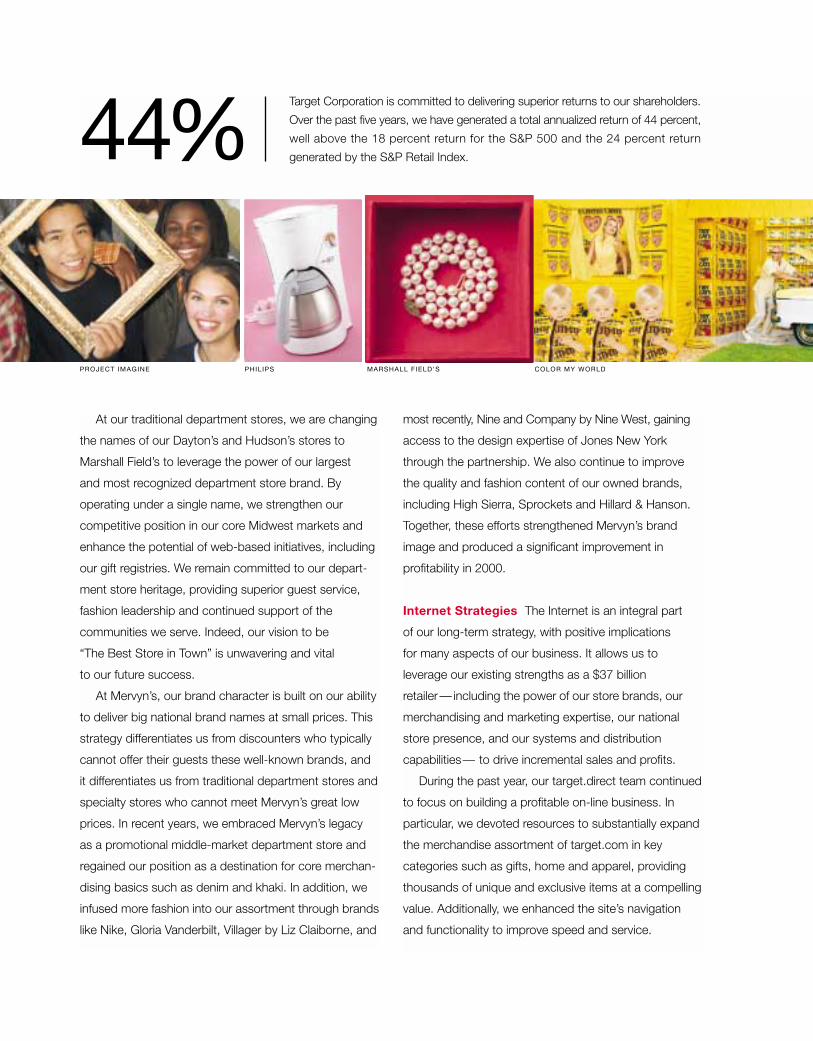
44%Target Corporation is committed to delivering superior returns to our shareholders.
Over the past five years, we have generated a total annualized return of 44 percent,
well above the 18 percent return for the S&P 500 and the 24 percent return
generated by the S&P Retail Index.
MARSHALL FIELD’S COLOR MY WORLDPROJECT IMAGINE PHILIPS
At our traditional department stores, we are changing
the names of our Dayton’s and Hudson’s stores to
Marshall Field’s to leverage the power of our largest
and most recognized department store brand. By
operating under a single name, we strengthen our
competitive position in our core Midwest markets and
enhance the potential of web-based initiatives, including
our gift registries. We remain committed to our depart-
ment store heritage, providing superior guest service,
fashion leadership and continued support of the
communities we serve. Indeed, our vision to be
“The Best Store in Town” is unwavering and vital
to our future success.
At Mervyn’s, our brand character is built on our ability
to deliver big national brand names at small prices. This
strategy differentiates us from discounters who typically
cannot offer their guests these well-known brands, and
it differentiates us from traditional department stores and
specialty stores who cannot meet Mervyn’s great low
prices. In recent years, we embraced Mervyn’s legacy
as a promotional middle-market department store and
regained our position as a destination for core merchan-
dising basics such as denim and khaki. In addition, we
infused more fashion into our assortment through brands
like Nike, Gloria Vanderbilt, Villager by Liz Claiborne, and
most recently, Nine and Company by Nine West, gaining
access to the design expertise of Jones New York
through the partnership. We also continue to improve
the quality and fashion content of our owned brands,
including High Sierra, Sprockets and Hillard & Hanson.
Together, these efforts strengthened Mervyn’s brand
image and produced a significant improvement in
profitability in 2000.
Internet Strategies The Internet is an integral part
of our long-term strategy, with positive implications
for many aspects of our business. It allows us to
leverage our existing strengths as a $37 billion
retailer— including the power of our store brands, our
merchandising and marketing expertise, our national
store presence, and our systems and distribution
capabilities— to drive incremental sales and profits.
During the past year, our target.direct team continued
to focus on building a profitable on-line business. In
particular, we devoted resources to substantially expand
the merchandise assortment of target.com in key
categories such as gifts, home and apparel, providing
thousands of unique and exclusive items at a compelling
value. Additionally, we enhanced the site’s navigation
and functionality to improve speed and service.
And, we expanded the range of services available to our
on-line guests with the introduction of our Club Wedd
and Lullaby Club gift registries, and the development
of alliances with E*Trade and America Online. We
recognize the advantages of operating as a multi-
channel retailer and strongly embrace the synergies
inherent in building complementary web-based and
store-based strategies. In our view, by investing in both
our physical and virtual space, we strengthen and
deepen the relationship with more guests and maximize
opportunities for long-term profit growth.
We also made tremendous progress during 2000
in using Internet technology to improve supply chain
efficiencies. In collaboration with 16 other retailers
from around the world, Target Corporation founded
the WorldWide Retail Exchange, a global business-to-
business electronic marketplace, designed to facilitate
trading between retailers and thousands of vendor
partners and suppliers. Today, the Exchange, which
operates as an independent organization, consists
of more than 50 leading retailers from North America,
Europe, Asia and Africa. Collectively, these members
generate over $700 billion in annualized sales volume.
In 2001, the Exchange will continue to invest in infra-
structure and provide its members with access to
software tools and technology solutions that are expected
to produce an improved procurement process and
ultimately better values for our guests and our shareholders.
Financial Services Financial services are key
elements of our business strategy and contribute
substantially to increases in our overall profit perform-
ance. In 2000, we continued to invest in the guest
loyalty and rewards programs that support proprietary
credit in each of our retail segments, reinforcing the
use of our own credit cards as the preferred method of
payment. Today, our combined portfolio includes more
than 36 million accounts, reflecting broad and growing
acceptance of the Target Guest Card and stable credit
penetration at both Mervyn’s and Marshall Field’s.
During the past year, we also introduced new
financial products and services to help drive future
growth. For example, we expanded our offering of gift
cards, adding greater functionality and cool designs that
support our store brands. We partnered with E*Trade
to provide access to integrated banking, brokerage
and investment planning services within SuperTarget.
And, we began testing an enhanced Target Card with
Visa capabilities in three markets: Phoenix, Denver
and Atlanta. Each of these initiatives will continue to
be priorities in 2001. Currently, we are exploring an
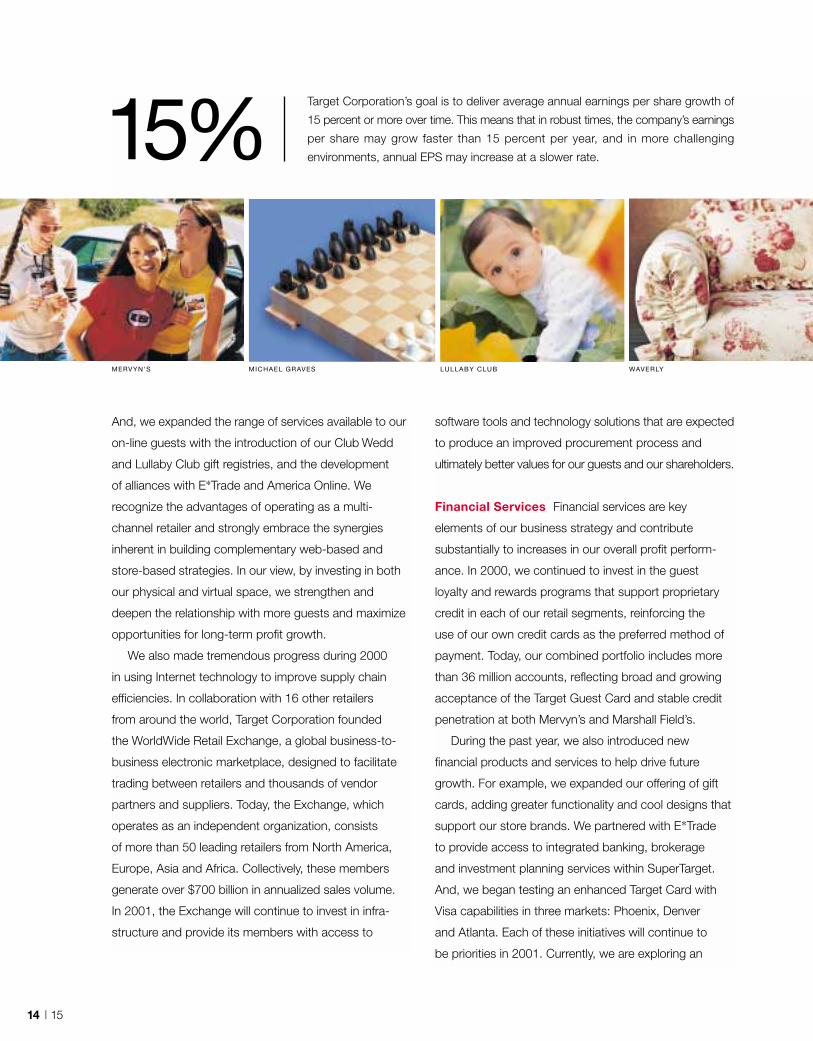
15%Target Corporation’s goal is to deliver average annual earnings per share growth of
15 percent or more over time. This means that in robust times, the company’s earnings
per share may grow faster than 15 percent per year, and in more challenging
environments, annual EPS may increase at a slower rate.
14 | 15
MICHAEL GRAVESMERVYN’S WAVERLYLULLABY CLUB
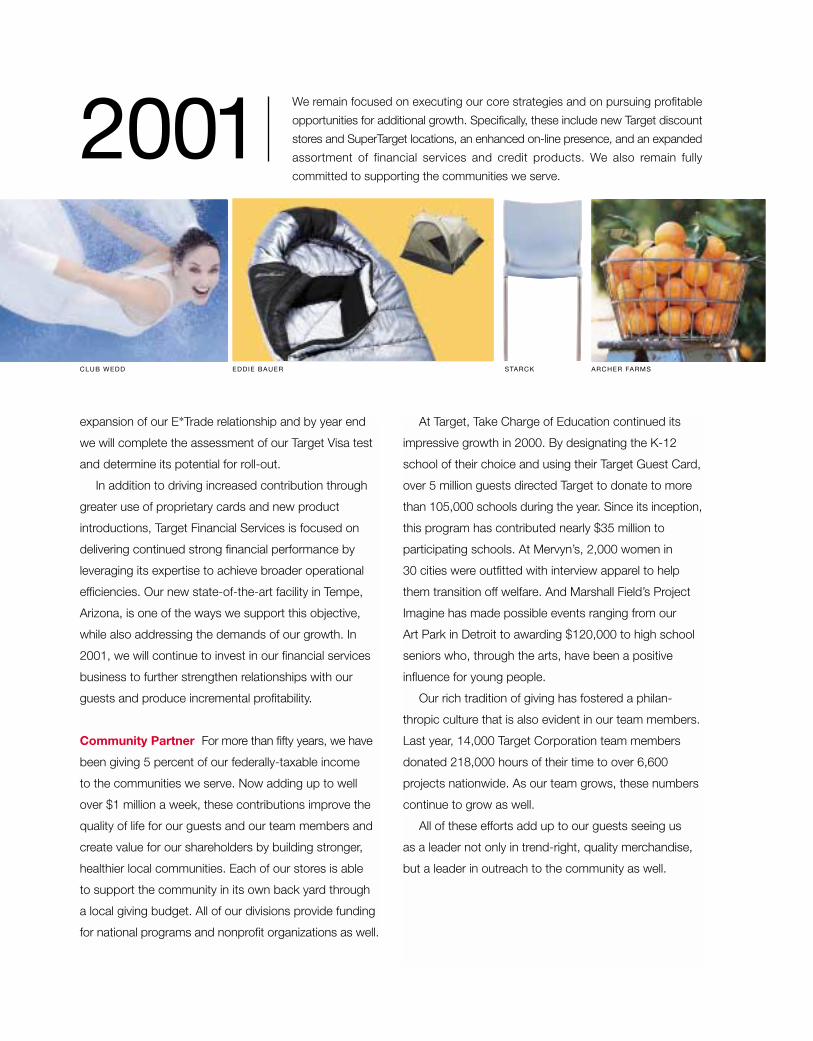
2001We remain focused on executing our core strategies and on pursuing profitable
opportunities for additional growth. Specifically, these include new Target discount
stores and SuperTarget locations, an enhanced on-line presence, and an expanded
assortment of financial services and credit products. We also remain fully
committed to supporting the communities we serve.
expansion of our E*Trade relationship and by year end
we will complete the assessment of our Target Visa test
and determine its potential for roll-out.
In addition to driving increased contribution through
greater use of proprietary cards and new product
introductions, Target Financial Services is focused on
delivering continued strong financial performance by
leveraging its expertise to achieve broader operational
efficiencies. Our new state-of-the-art facility in Tempe,
Arizona, is one of the ways we support this objective,
while also addressing the demands of our growth. In
2001, we will continue to invest in our financial services
business to further strengthen relationships with our
guests and produce incremental profitability.
Community Partner For more than fifty years, we have
been giving 5 percent of our federally-taxable income
to the communities we serve. Now adding up to well
over $1 million a week, these contributions improve the
quality of life for our guests and our team members and
create value for our shareholders by building stronger,
healthier local communities. Each of our stores is able
to support the community in its own back yard through
a local giving budget. All of our divisions provide funding
for national programs and nonprofit organizations as well.
At Target, Take Charge of Education continued its
impressive growth in 2000. By designating the K-12
school of their choice and using their Target Guest Card,
over 5 million guests directed Target to donate to more
than 105,000 schools during the year. Since its inception,
this program has contributed nearly $35 million to
participating schools. At Mervyn’s, 2,000 women in
30 cities were outfitted with interview apparel to help
them transition off welfare. And Marshall Field’s Project
Imagine has made possible events ranging from our
Art Park in Detroit to awarding $120,000 to high school
seniors who, through the arts, have been a positive
influence for young people.
Our rich tradition of giving has fostered a philan-
thropic culture that is also evident in our team members.
Last year, 14,000 Target Corporation team members
donated 218,000 hours of their time to over 6,600
projects nationwide. As our team grows, these numbers
continue to grow as well.
All of these efforts add up to our guests seeing us
as a leader not only in trend-right, quality merchandise,
but a leader in outreach to the community as well.
EDDIE BAUER ARCHER FARMSSTARCKCLUB WEDD
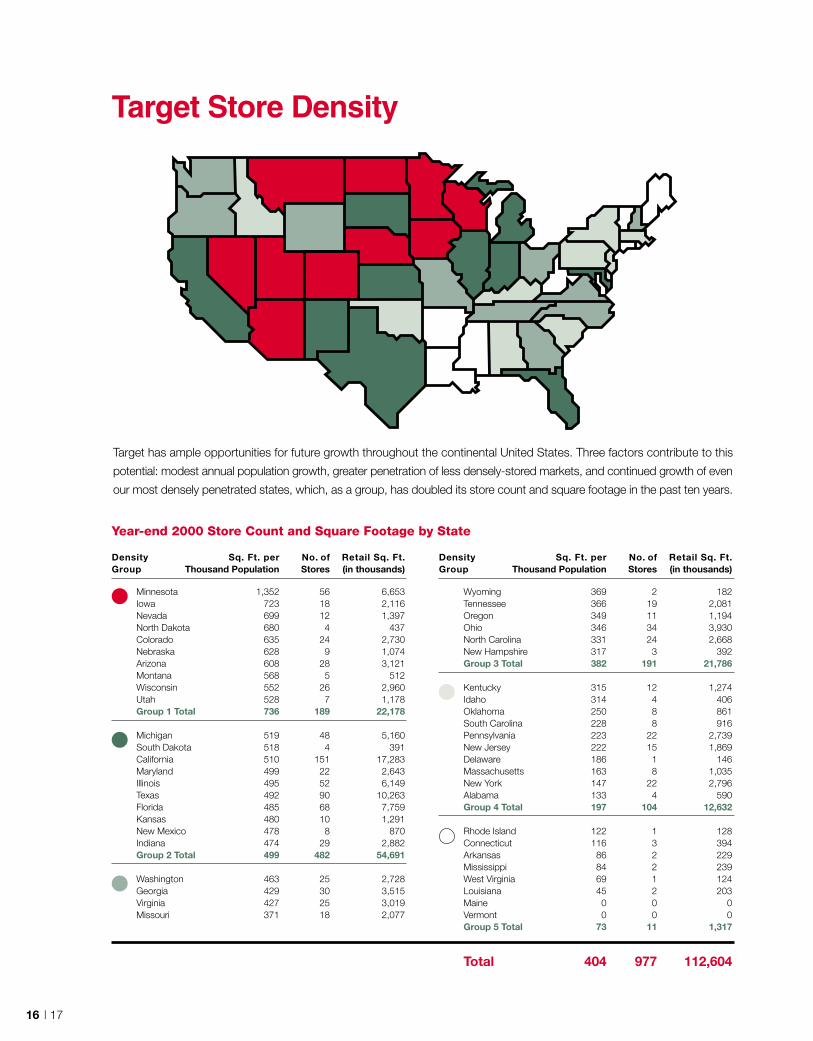
Minnesota 1,352 56 6,653Iowa 723 18 2,116Nevada 699 12 1,397North Dakota 680 4 437Colorado 635 24 2,730Nebraska 628 9 1,074Arizona 608 28 3,121Montana 568 5 512Wisconsin 552 26 2,960Utah 528 7 1,178Group 1 Total 736 189 22,178
Michigan 519 48 5,160South Dakota 518 4 391California 510 151 17,283Maryland 499 22 2,643Illinois 495 52 6,149Texas 492 90 10,263Florida 485 68 7,759Kansas 480 10 1,291New Mexico 478 8 870Indiana 474 29 2,882Group 2 Total 499 482 54,691
Washington 463 25 2,728Georgia 429 30 3,515Virginia 427 25 3,019Missouri 371 18 2,077
Wyoming 369 2 182Tennessee 366 19 2,081Oregon 349 11 1,194Ohio 346 34 3,930North Carolina 331 24 2,668New Hampshire 317 3 392Group 3 Total 382 191 21,786
Kentucky 315 12 1,274Idaho 314 4 406Oklahoma 250 8 861South Carolina 228 8 916Pennsylvania 223 22 2,739New Jersey 222 15 1,869Delaware 186 1 146Massachusetts 163 8 1,035New York 147 22 2,796Alabama 133 4 590Group 4 Total 197 104 12,632
Rhode Island 122 1 128Connecticut 116 3 394Arkansas 86 2 229Mississippi 84 2 239West Virginia 69 1 124Louisiana 45 2 203Maine 0 0 0Vermont 0 0 0Group 5 Total 73 11 1,317
Total 404 977 112,604
16 | 17
Target Store Density
Target has ample opportunities for future growth throughout the continental United States. Three factors contribute to this
potential: modest annual population growth, greater penetration of less densely-stored markets, and continued growth of even
our most densely penetrated states, which, as a group, has doubled its store count and square footage in the past ten years.
Year-end 2000 Store Count and Square Footage by State
Density Sq. Ft. per No. of Retail Sq. Ft.Group Thousand Population Stores (in thousands)
Density Sq. Ft. per No. of Retail Sq. Ft.Group Thousand Population Stores (in thousands)
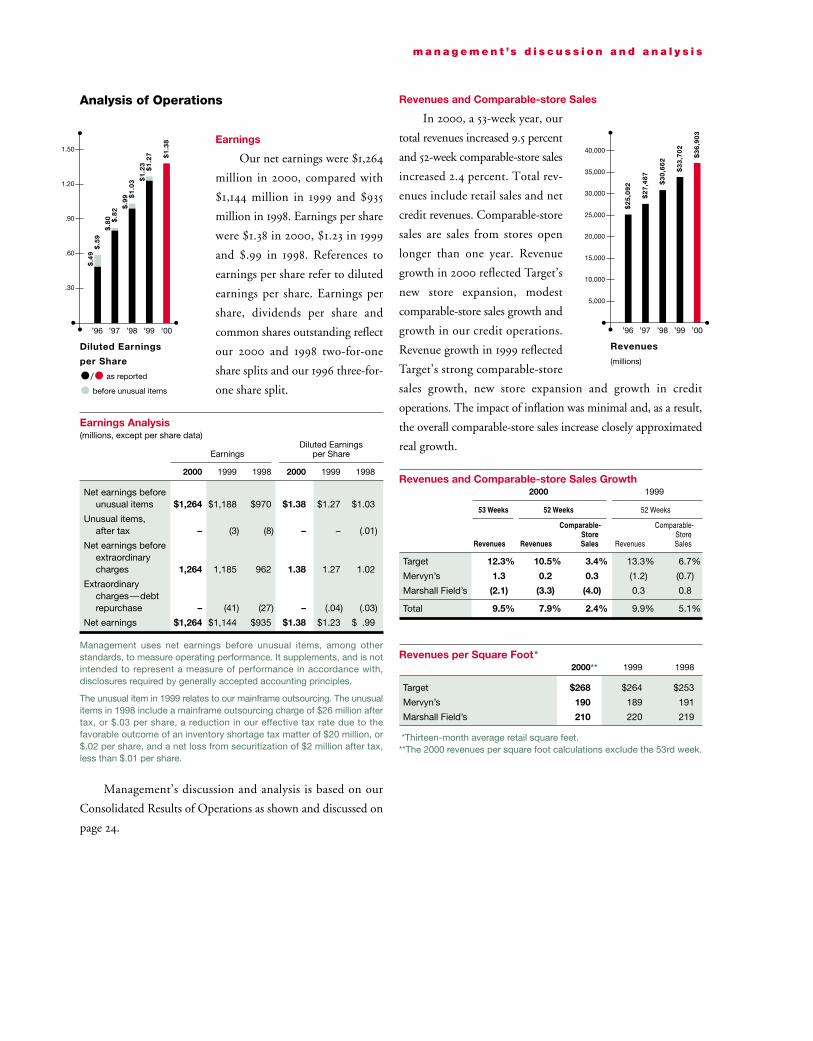
Analysis of Operations
Earnings
Our net earnings were $1,264
million in 2000, compared with
$1,144 million in 1999 and $935
million in 1998. Earnings per share
were $1.38 in 2000, $1.23 in 1999
and $.99 in 1998. References to
earnings per share refer to diluted
earnings per share. Earnings per
share, dividends per share and
common shares outstanding reflect
our 2000 and 1998 two-for-one
share splits and our 1996 three-for-
one share split.
Earnings Analysis(millions, except per share data)
Diluted EarningsEarnings per Share
2000 1999 1998 2000 1999 1998
Net earnings beforeunusual items $1,264 $1,188 $970 $1.38 $1.27 $1.03
Unusual items, after tax – (3) (8) – – (.01)
Net earnings beforeextraordinarycharges 1,264 1,185 962 1.38 1.27 1.02
Extraordinarycharges—debtrepurchase – (41) (27) – (.04) (.03)
Net earnings $1,264 $1,144 $935 $1.38 $1.23 $ .99
Management uses net earnings before unusual items, among otherstandards, to measure operating performance. It supplements, and is notintended to represent a measure of performance in accordance with,disclosures required by generally accepted accounting principles.
The unusual item in 1999 relates to our mainframe outsourcing. The unusualitems in 1998 include a mainframe outsourcing charge of $26 million aftertax, or $.03 per share, a reduction in our effective tax rate due to thefavorable outcome of an inventory shortage tax matter of $20 million, or$.02 per share, and a net loss from securitization of $2 million after tax,less than $.01 per share.
Management’s discussion and analysis is based on our
Consolidated Results of Operations as shown and discussed on
page 24.
Revenues and Comparable-store Sales
In 2000, a 53-week year, our
total revenues increased 9.5 percent
and 52-week comparable-store sales
increased 2.4 percent. Total rev-
enues include retail sales and net
credit revenues. Comparable-store
sales are sales from stores open
longer than one year. Revenue
growth in 2000 reflected Target’s
new store expansion, modest
comparable-store sales growth and
growth in our credit operations.
Revenue growth in 1999 reflected
Target’s strong comparable-store
sales growth, new store expansion and growth in credit
operations. The impact of inflation was minimal and, as a result,
the overall comparable-store sales increase closely approximated
real growth.
Revenues and Comparable-store Sales Growth2000 1999
53 Weeks 52 Weeks 52 Weeks
Comparable- Comparable-Store Store
Revenues Revenues Sales Revenues Sales
Target 12.3% 10.5% 3.4% 13.3% 6.7%
Mervyn’s 1.3 0.2 0.3 (1.2) (0.7)
Marshall Field’s (2.1) (3.3) (4.0) 0.3 0.8
Total 9.5% 7.9% 2.4% 9.9% 5.1%
Revenues per Square Foot*2000** 1999 1998
Target $268 $264 $253
Mervyn’s 190 189 191
Marshall Field’s 210 220 219
*Thirteen-month average retail square feet.**The 2000 revenues per square foot calculations exclude the 53rd week.
m a n a g e m e n t ’s d i s c u s s i o n a n d a n a l y s i s
$.5
9
$.8
2$
.80
Diluted Earnings
per Share
/ as reported
before unusual items
’96 ’97 ’98 ’99 ’00
$1
.03
$.9
9
$1
.27
$1
.23
$1
.38
1.50
1.20
.90
.60
.30
$2
5,0
92
$2
7,4
87
Revenues
(millions)
’96 ’97 ’98 ’99 ’00
$3
0,6
62
$3
3,7
02
$3
6,9
03
40,000
35,000
30,000
25,000
20,000
15,000
10,000
5,000
$.4
9
18 | 19
Gross Margin Rate
The gross margin rate represents gross margin as a percent
of sales. In 2000, our gross margin rate decreased primarily due
to the mix impact of growth at Target, our lowest gross margin
rate division. In 1999, our gross margin rate increased primarily
due to rate expansion at Target and Marshall Field’s, partially
offset by the mix impact of growth at Target.
The LIFO provision, included in cost of sales, is calculated
based on inventory levels, markup rates and internally generated
retail price indices. In 2000, the LIFO provision was a $4 million
charge (less than $.01 per share), compared with a $7 million
credit (less than $.01 per share) in 1999 and an $18 million credit
($.01 per share) in 1998. The 2000 LIFO charge resulted
primarily from lower inventory levels at Marshall Field’s. The
1999 LIFO credit resulted primarily from higher markup.
Operating Expense Rate
Operating expense rate represents selling, general and
administrative expense (including buying and occupancy,
advertising, start-up and other expense) as a percent of revenues.
Our 2000 operating expense rate was essentially even with the
prior year, benefiting from the overall growth of Target, our
lowest expense rate division, offset by lack of sales leverage at
both Mervyn’s and Marshall Field’s. The operating expense rate
in 1999 was essentially even with 1998.
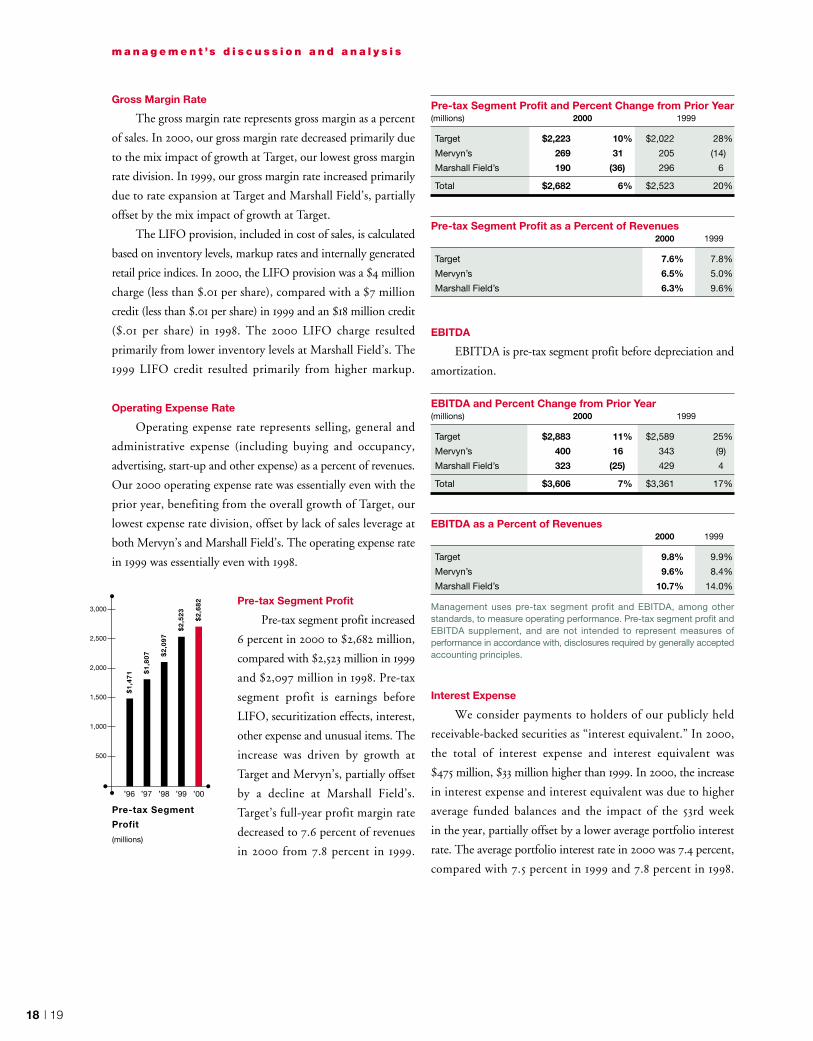
Pre-tax Segment Profit
Pre-tax segment profit increased
6 percent in 2000 to $2,682 million,
compared with $2,523 million in 1999
and $2,097 million in 1998. Pre-tax
segment profit is earnings before
LIFO, securitization effects, interest,
other expense and unusual items. The
increase was driven by growth at
Target and Mervyn’s, partially offset
by a decline at Marshall Field’s.
Target’s full-year profit margin rate
decreased to 7.6 percent of revenues
in 2000 from 7.8 percent in 1999.
Pre-tax Segment Profit and Percent Change from Prior Year(millions) 2000 1999
Target $2,223 10% $2,022 28%
Mervyn’s 269 31 205 (14)
Marshall Field’s 190 (36) 296 6
Total $2,682 6% $2,523 20%
Pre-tax Segment Profit as a Percent of Revenues2000 1999
Target 7.6% 7.8%
Mervyn’s 6.5% 5.0%
Marshall Field’s 6.3% 9.6%
EBITDA
EBITDA is pre-tax segment profit before depreciation and
amortization.
EBITDA and Percent Change from Prior Year(millions) 2000 1999
Target $2,883 11% $2,589 25%
Mervyn’s 400 16 343 (9)
Marshall Field’s 323 (25) 429 4
Total $3,606 7% $3,361 17%
EBITDA as a Percent of Revenues2000 1999
Target 9.8% 9.9%
Mervyn’s 9.6% 8.4%
Marshall Field’s 10.7% 14.0%
Management uses pre-tax segment profit and EBITDA, among otherstandards, to measure operating performance. Pre-tax segment profit andEBITDA supplement, and are not intended to represent measures ofperformance in accordance with, disclosures required by generally acceptedaccounting principles.
Interest Expense
We consider payments to holders of our publicly held
receivable-backed securities as “interest equivalent.” In 2000,
the total of interest expense and interest equivalent was
$475 million, $33 million higher than 1999. In 2000, the increase
in interest expense and interest equivalent was due to higher
average funded balances and the impact of the 53rd week
in the year, partially offset by a lower average portfolio interest
rate. The average portfolio interest rate in 2000 was 7.4 percent,
compared with 7.5 percent in 1999 and 7.8 percent in 1998.
m a n a g e m e n t ’s d i s c u s s i o n a n d a n a l y s i s
$1
,47
1 $1
,80
7
Pre-tax Segment
Profit
(millions)
’96 ’97 ’98 ’99 ’00
$2
,09
7
$2
,52
3
$2
,68
2
3,000
2,500
2,000
1,500
1,000
500
In 1999, the total of interest expense and interest equivalent was
$4 million lower than 1998 due to a lower average portfolio
interest rate, partially offset by higher average funded balances.
During 2000, we repurchased $35 million of debt for
$39 million, resulting in an after-tax extraordinary charge of $3
million (less than $.01 per share). The debt repurchased had a
weighted-average interest rate of 9.7 percent and an average
remaining life of 12 years. Also during 2000, $371 million of
puttable debt was put to us, resulting in an after-tax
extraordinary gain of $3 million (less than $.01 per share). The
debt put to us had a weighted-average interest rate of 5.9 percent
and an average remaining life of 21 years. In 1999 and 1998, we
repurchased $381 million and $127 million of long-term debt,
resulting in after-tax extraordinary charges of $41 million ($.04
per share) and $27 million ($.03 per share), respectively.
Income Tax Rate
The effective income tax rate was 38.4 percent, 38.8 percent
and 38.2 percent in 2000, 1999 and 1998, respectively. The 2000
tax rate reflected a favorable mix of state tax rates. The 1998
effective tax rate reflected the beneficial effect of $20 million
($.02 per share) resulting from the favorable outcome of our
inventory shortage tax matter.
Receivable-backed Securities
In 1998, Target Receivables Corporation (TRC), a special-
purpose subsidiary, sold $400 million of receivable-backed
securities to the public. This issue of receivable-backed securities
had an expected maturity of five years and a stated rate of 5.90
percent. Proceeds from the sale were used for general corporate
purposes, including funding the growth of receivables. The 1998
sale transaction and the maturity of our 1995 securitization
resulted in a net pre-tax loss of $3 million (less than $.01 per
share), which reduced 1998 finance charge revenues and pre-tax
earnings. In 1997, TRC sold $400 million of receivable-backed
securities to the public, with an expected maturity of 2002 and
a stated rate of 6.25 percent.
Our Consolidated Results of Operations do not include
finance charge revenues and loss provision related to the publicly
held receivable-backed securities. The amounts that represent
payments to holders of our publicly held receivable-backed
securities are included in our pre-tax earnings reconciliation on
page 36 as interest equivalent. Interest equivalent was $50 million
in 2000, $49 million in 1999 and $48 million in 1998.
Mainframe Outsourcing
In 1998, we announced our plan to outsource our
mainframe computer data center functions and expensed
$42 million ($.03 per share) of related charges. During 1999, we
completed the transition and expensed an additional $5 million
(less than $.01 per share) related to the outsourcing. These
expenses are included in selling, general and administrative
expense.
Fourth Quarter Results
Due to the seasonal nature of the retail industry, fourth
quarter operating results typically represent a substantially larger
share of total year revenues and earnings due to the inclusion of
the holiday shopping season.
Fourth quarter 2000 net earnings were $552 million,
compared with $494 million in 1999. Earnings per share were
$.61 for the quarter, compared with $.53 in 1999. Total revenues
increased 12.8 percent, partly due to the impact of the additional
week in 2000, and 13-week comparable-store sales increased 1.8
percent. Our pre-tax segment profit increased 8 percent to $1,079
million, driven by results at Target and Mervyn’s.
Fourth Quarter Pre-tax Segment Profit andPercent Change from Prior Year(millions) 2000 1999
Target $ 892 10% $ 811 26%
Mervyn’s 108 58 69 (34)
Marshall Field’s 79 (34) 120 5
Total $1,079 8% $1,000 16%
m a n a g e m e n t ’s d i s c u s s i o n a n d a n a l y s i s
20 | 21
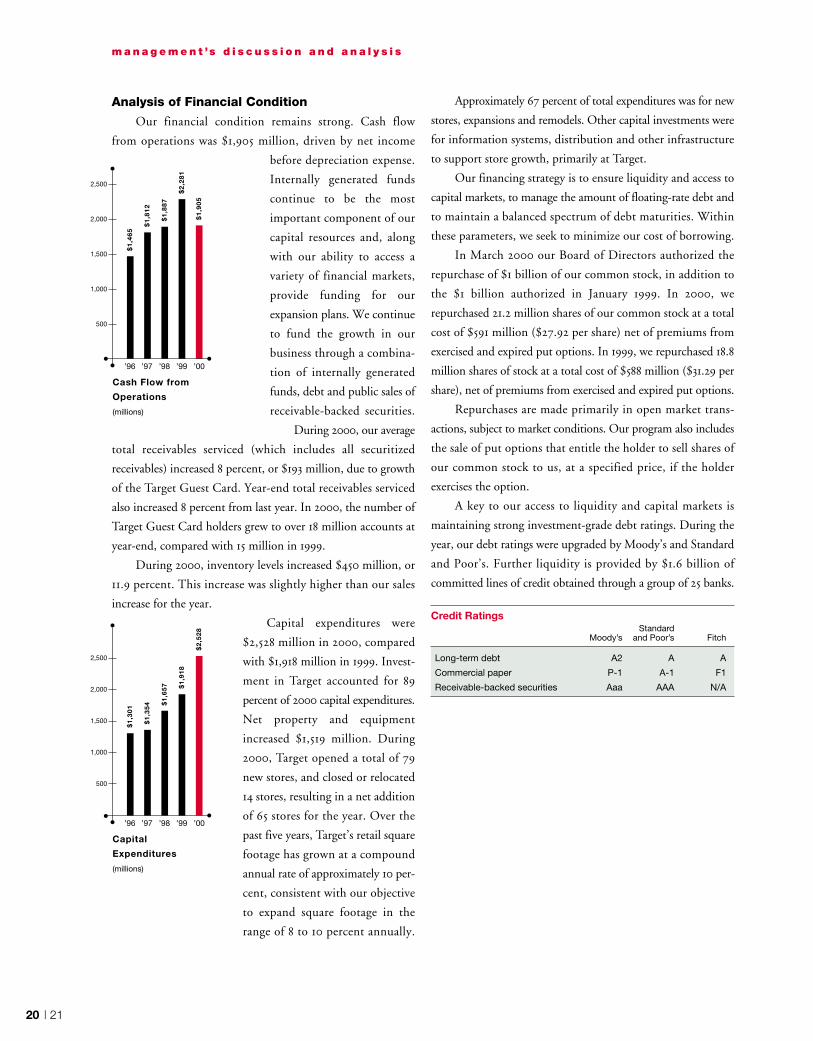
Analysis of Financial Condition
Our financial condition remains strong. Cash flow
from operations was $1,905 million, driven by net income
before depreciation expense.
Internally generated funds
continue to be the most
important component of our
capital resources and, along
with our ability to access a
variety of financial markets,
provide funding for our
expansion plans. We continue
to fund the growth in our
business through a combina-
tion of internally generated
funds, debt and public sales of
receivable-backed securities.
During 2000, our average
total receivables serviced (which includes all securitized
receivables) increased 8 percent, or $193 million, due to growth
of the Target Guest Card. Year-end total receivables serviced
also increased 8 percent from last year. In 2000, the number of
Target Guest Card holders grew to over 18 million accounts at
year-end, compared with 15 million in 1999.
During 2000, inventory levels increased $450 million, or
11.9 percent. This increase was slightly higher than our sales
increase for the year.
Capital expenditures were
$2,528 million in 2000, compared
with $1,918 million in 1999. Invest-
ment in Target accounted for 89
percent of 2000 capital expenditures.
Net property and equipment
increased $1,519 million. During
2000, Target opened a total of 79
new stores, and closed or relocated
14 stores, resulting in a net addition
of 65 stores for the year. Over the
past five years, Target’s retail square
footage has grown at a compound
annual rate of approximately 10 per-
cent, consistent with our objective
to expand square footage in the
range of 8 to 10 percent annually.
Approximately 67 percent of total expenditures was for new
stores, expansions and remodels. Other capital investments were
for information systems, distribution and other infrastructure
to support store growth, primarily at Target.
Our financing strategy is to ensure liquidity and access to
capital markets, to manage the amount of floating-rate debt and
to maintain a balanced spectrum of debt maturities. Within
these parameters, we seek to minimize our cost of borrowing.
In March 2000 our Board of Directors authorized the
repurchase of $1 billion of our common stock, in addition to
the $1 billion authorized in January 1999. In 2000, we
repurchased 21.2 million shares of our common stock at a total
cost of $591 million ($27.92 per share) net of premiums from
exercised and expired put options. In 1999, we repurchased 18.8
million shares of stock at a total cost of $588 million ($31.29 per
share), net of premiums from exercised and expired put options.
Repurchases are made primarily in open market trans-
actions, subject to market conditions. Our program also includes
the sale of put options that entitle the holder to sell shares of
our common stock to us, at a specified price, if the holder
exercises the option.
A key to our access to liquidity and capital markets is
maintaining strong investment-grade debt ratings. During the
year, our debt ratings were upgraded by Moody’s and Standard
and Poor’s. Further liquidity is provided by $1.6 billion of
committed lines of credit obtained through a group of 25 banks.
Credit RatingsStandard
Moody’s and Poor’s Fitch
Long-term debt A2 A A
Commercial paper P-1 A-1 F1
Receivable-backed securities Aaa AAA N/A
m a n a g e m e n t ’s d i s c u s s i o n a n d a n a l y s i s
$1
,46
5
$1
,81
2
Cash Flow from
Operations
(millions)
’96 ’97 ’98 ’99 ’00
$1
,88
7
$2
,28
1
$1
,90
5
2,500
2,000
1,500
1,000
500
$1
,30
1
$1
,35
4
Capital
Expenditures
(millions)
’96 ’97 ’98 ’99 ’00
$1
,65
7 $1
,91
8
$2
,52
8
2,500
2,000
1,500
1,000
500
Performance Objectives
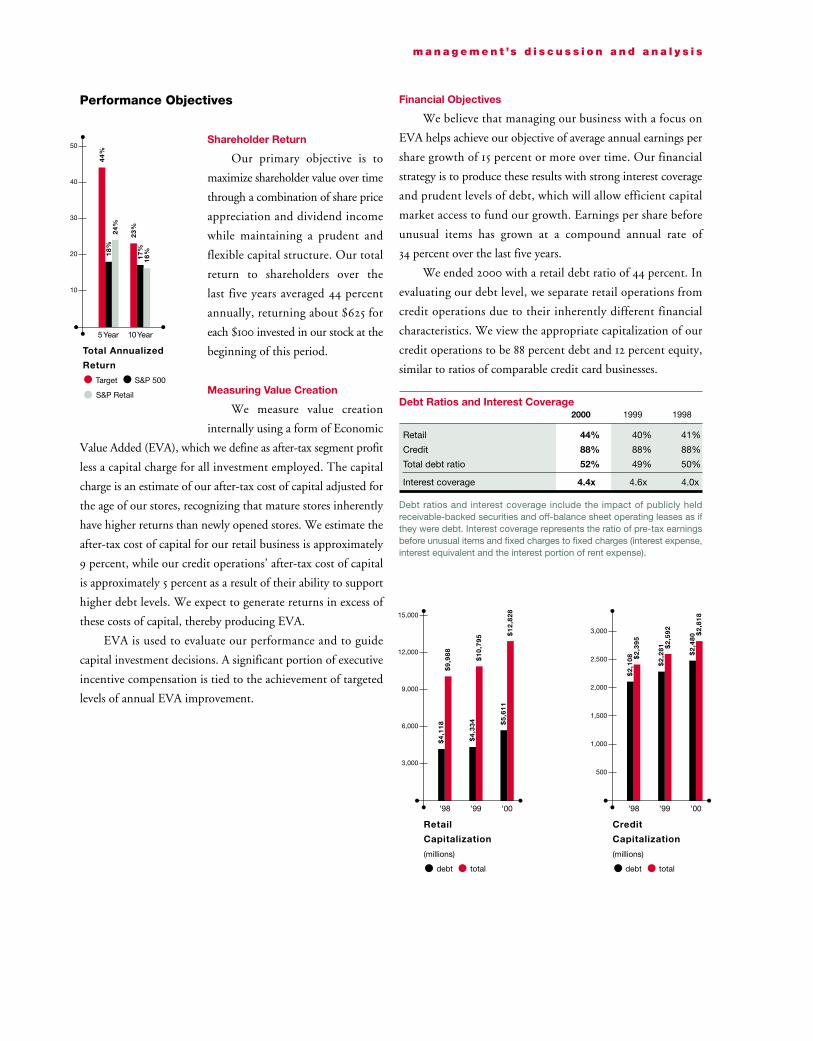
Shareholder Return
Our primary objective is to
maximize shareholder value over time
through a combination of share price
appreciation and dividend income
while maintaining a prudent and
flexible capital structure. Our total
return to shareholders over the
last five years averaged 44 percent
annually, returning about $625 for
each $100 invested in our stock at the
beginning of this period.
Measuring Value Creation
We measure value creation
internally using a form of Economic
Value Added (EVA), which we define as after-tax segment profit
less a capital charge for all investment employed. The capital
charge is an estimate of our after-tax cost of capital adjusted for
the age of our stores, recognizing that mature stores inherently
have higher returns than newly opened stores. We estimate the
after-tax cost of capital for our retail business is approximately
9 percent, while our credit operations’ after-tax cost of capital
is approximately 5 percent as a result of their ability to support
higher debt levels. We expect to generate returns in excess of
these costs of capital, thereby producing EVA.
EVA is used to evaluate our performance and to guide
capital investment decisions. A significant portion of executive
incentive compensation is tied to the achievement of targeted
levels of annual EVA improvement.
m a n a g e m e n t ’s d i s c u s s i o n a n d a n a l y s i s
Financial Objectives
We believe that managing our business with a focus on
EVA helps achieve our objective of average annual earnings per
share growth of 15 percent or more over time. Our financial
strategy is to produce these results with strong interest coverage
and prudent levels of debt, which will allow efficient capital
market access to fund our growth. Earnings per share before
unusual items has grown at a compound annual rate of
34 percent over the last five years.
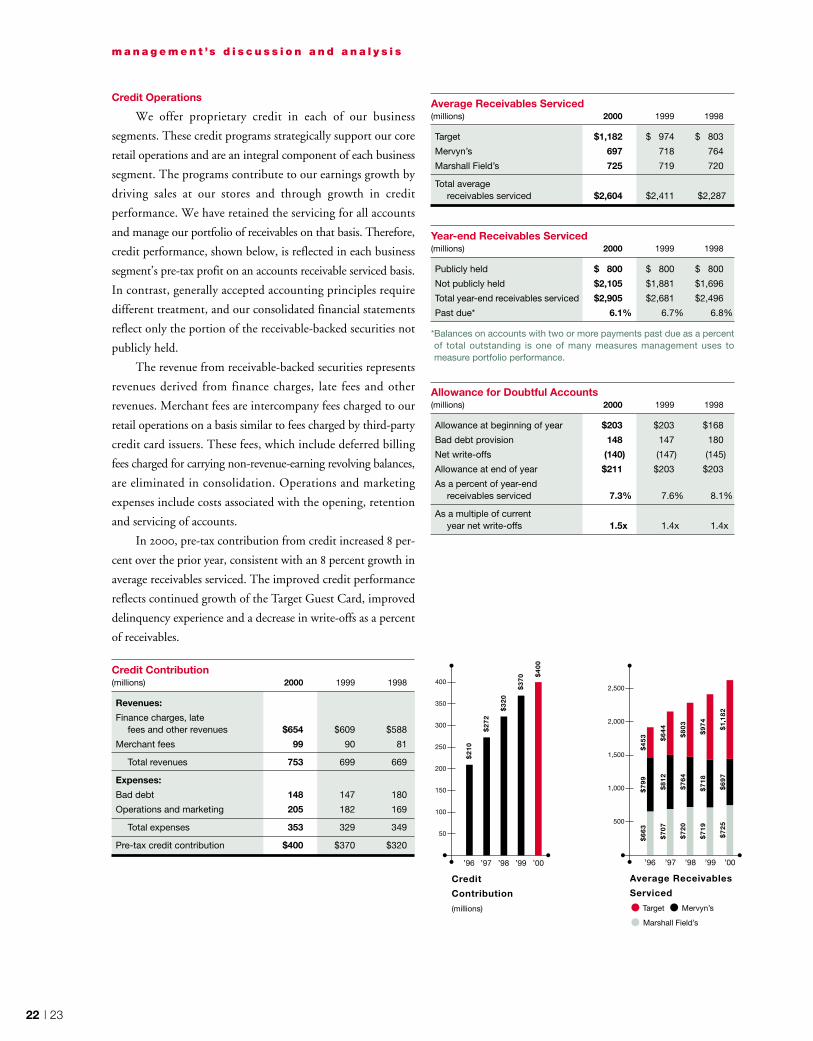
We ended 2000 with a retail debt ratio of 44 percent. In
evaluating our debt level, we separate retail operations from
credit operations due to their inherently different financial
characteristics. We view the appropriate capitalization of our
credit operations to be 88 percent debt and 12 percent equity,
similar to ratios of comparable credit card businesses.
Debt Ratios and Interest Coverage2000 1999 1998
Retail 44% 40% 41%
Credit 88% 88% 88%
Total debt ratio 52% 49% 50%
Interest coverage 4.4x 4.6x 4.0x
Debt ratios and interest coverage include the impact of publicly heldreceivable-backed securities and off-balance sheet operating leases as ifthey were debt. Interest coverage represents the ratio of pre-tax earningsbefore unusual items and fixed charges to fixed charges (interest expense,interest equivalent and the interest portion of rent expense).
44
%1
8%
24
%
Total Annualized
Return
Target S&P 500
S&P Retail
5Year 10Year
23
%1
7%
16
%50
40
30
20
10
$9
,98
8
Retail
Capitalization
(millions)
debt total
’98 ’99 ’00
$4
,11
8
$1
0,7
95
$4
,33
4
$1
2,8
28
$5
,61
1
15,000
12,000
9,000
6,000
3,000
$2
,39
5
Credit
Capitalization
(millions)
debt total
’98 ’99 ’00
$2
,10
8
$2
,59
2$
2,2
81
$2
,81
8$
2,4
803,000
2,500
2,000
1,500
1,000
500
22 | 23
Credit Operations
We offer proprietary credit in each of our business
segments. These credit programs strategically support our core
retail operations and are an integral component of each business
segment. The programs contribute to our earnings growth by
driving sales at our stores and through growth in credit
performance. We have retained the servicing for all accounts
and manage our portfolio of receivables on that basis. Therefore,
credit performance, shown below, is reflected in each business
segment’s pre-tax profit on an accounts receivable serviced basis.
In contrast, generally accepted accounting principles require
different treatment, and our consolidated financial statements
reflect only the portion of the receivable-backed securities not
publicly held.
The revenue from receivable-backed securities represents
revenues derived from finance charges, late fees and other
revenues. Merchant fees are intercompany fees charged to our
retail operations on a basis similar to fees charged by third-party
credit card issuers. These fees, which include deferred billing
fees charged for carrying non-revenue-earning revolving balances,
are eliminated in consolidation. Operations and marketing
expenses include costs associated with the opening, retention
and servicing of accounts.
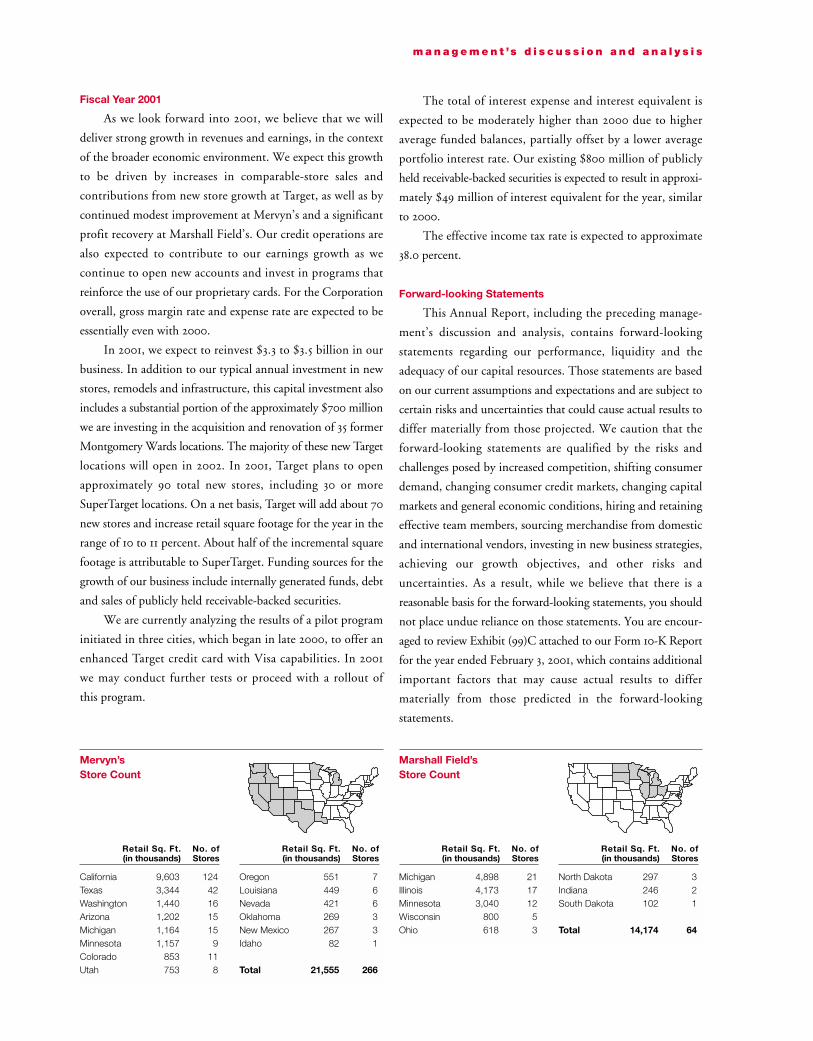
In 2000, pre-tax contribution from credit increased 8 per-
cent over the prior year, consistent with an 8 percent growth in
average receivables serviced. The improved credit performance
reflects continued growth of the Target Guest Card, improved
delinquency experience and a decrease in write-offs as a percent
of receivables.
Credit Contribution(millions) 2000 1999 1998
Revenues:
Finance charges, latefees and other revenues $654 $609 $588
Merchant fees 99 90 81
Total revenues 753 699 669
Expenses:
Bad debt 148 147 180
Operations and marketing 205 182 169
Total expenses 353 329 349
Pre-tax credit contribution $400 $370 $320
m a n a g e m e n t ’s d i s c u s s i o n a n d a n a l y s i s
$2
10
$2
72
Credit
Contribution
(millions)
’96 ’97 ’98 ’99 ’00
$3
20
$3
70 $
40
0
400
350
300
250
200
150
100
50
$7
99
$4
53
$6
63
$7
07
$8
12
$6
44
Average Receivables
Serviced
Target Mervyn’s
Marshall Field’s
’96 ’97 ’98 ’99 ’00
$7
20
$7
64
$8
03
$7
19
$7
18
$9
74
$7
25
$6
97
$1,
18
2
2,500
2,000
1,500
1,000
500
Average Receivables Serviced(millions) 2000 1999 1998
Target $1,182 $ 974 $ 803
Mervyn’s 697 718 764
Marshall Field’s 725 719 720
Total average receivables serviced $2,604 $2,411 $2,287
Year-end Receivables Serviced(millions) 2000 1999 1998
Publicly held $ 800 $ 800 $ 800
Not publicly held $2,105 $1,881 $1,696
Total year-end receivables serviced $2,905 $2,681 $2,496
Past due* 6.1% 6.7% 6.8%
*Balances on accounts with two or more payments past due as a percentof total outstanding is one of many measures management uses tomeasure portfolio performance.
Allowance for Doubtful Accounts (millions) 2000 1999 1998
Allowance at beginning of year $203 $203 $168
Bad debt provision 148 147 180
Net write-offs (140) (147) (145)
Allowance at end of year $211 $203 $203
As a percent of year-endreceivables serviced 7.3% 7.6% 8.1%
As a multiple of currentyear net write-offs 1.5x 1.4x 1.4x
Fiscal Year 2001
As we look forward into 2001, we believe that we will
deliver strong growth in revenues and earnings, in the context
of the broader economic environment. We expect this growth
to be driven by increases in comparable-store sales and
contributions from new store growth at Target, as well as by
continued modest improvement at Mervyn’s and a significant
profit recovery at Marshall Field’s. Our credit operations are
also expected to contribute to our earnings growth as we
continue to open new accounts and invest in programs that
reinforce the use of our proprietary cards. For the Corporation
overall, gross margin rate and expense rate are expected to be
essentially even with 2000.
In 2001, we expect to reinvest $3.3 to $3.5 billion in our
business. In addition to our typical annual investment in new
stores, remodels and infrastructure, this capital investment also
includes a substantial portion of the approximately $700 million
we are investing in the acquisition and renovation of 35 former
Montgomery Wards locations. The majority of these new Target
locations will open in 2002. In 2001, Target plans to open
approximately 90 total new stores, including 30 or more
SuperTarget locations. On a net basis, Target will add about 70
new stores and increase retail square footage for the year in the
range of 10 to 11 percent. About half of the incremental square
footage is attributable to SuperTarget. Funding sources for the
growth of our business include internally generated funds, debt
and sales of publicly held receivable-backed securities.
We are currently analyzing the results of a pilot program
initiated in three cities, which began in late 2000, to offer an
enhanced Target credit card with Visa capabilities. In 2001
we may conduct further tests or proceed with a rollout of
this program.
The total of interest expense and interest equivalent is
expected to be moderately higher than 2000 due to higher
average funded balances, partially offset by a lower average
portfolio interest rate. Our existing $800 million of publicly
held receivable-backed securities is expected to result in approxi-
mately $49 million of interest equivalent for the year, similar
to 2000.
The effective income tax rate is expected to approximate
38.0 percent.
Forward-looking Statements
This Annual Report, including the preceding manage-
ment’s discussion and analysis, contains forward-looking
statements regarding our performance, liquidity and the
adequacy of our capital resources. Those statements are based
on our current assumptions and expectations and are subject to
certain risks and uncertainties that could cause actual results to
differ materially from those projected. We caution that the
forward-looking statements are qualified by the risks and
challenges posed by increased competition, shifting consumer
demand, changing consumer credit markets, changing capital
markets and general economic conditions, hiring and retaining
effective team members, sourcing merchandise from domestic
and international vendors, investing in new business strategies,
achieving our growth objectives, and other risks and
uncertainties. As a result, while we believe that there is a
reasonable basis for the forward-looking statements, you should
not place undue reliance on those statements. You are encour-
aged to review Exhibit (99)C attached to our Form 10-K Report
for the year ended February 3, 2001, which contains additional
important factors that may cause actual results to differ
materially from those predicted in the forward-looking
statements.
m a n a g e m e n t ’s d i s c u s s i o n a n d a n a l y s i s
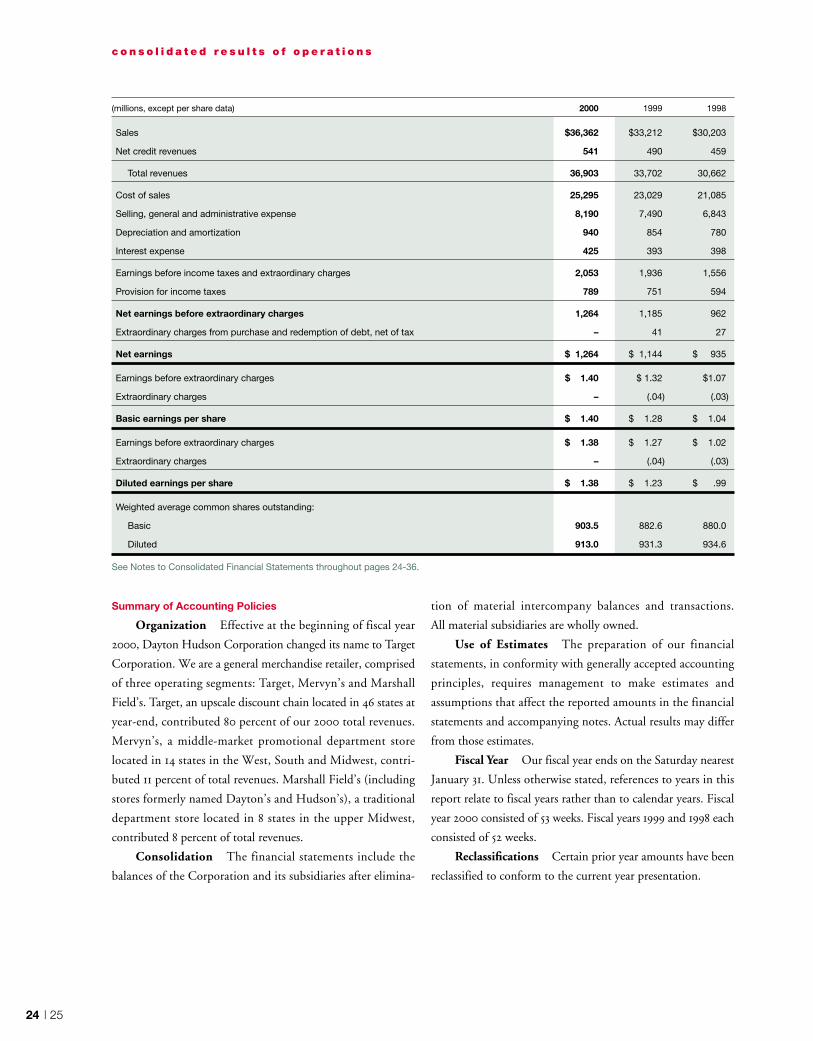
California 9,603 124Texas 3,344 42Washington 1,440 16Arizona 1,202 15Michigan 1,164 15Minnesota 1,157 9Colorado 853 11Utah 753 8
Oregon 551 7Louisiana 449 6Nevada 421 6Oklahoma 269 3New Mexico 267 3Idaho 82 1
Total 21,555 266
Retail Sq. Ft. No. of(in thousands) Stores
Retail Sq. Ft. No. of(in thousands) Stores
Michigan 4,898 21Illinois 4,173 17Minnesota 3,040 12Wisconsin 800 5Ohio 618 3
North Dakota 297 3Indiana 246 2South Dakota 102 1
Total 14,174 64
Retail Sq. Ft. No. of(in thousands) Stores
Retail Sq. Ft. No. of(in thousands) Stores
Mervyn’sStore Count
Marshall Field’sStore Count
24 | 25
Summary of Accounting Policies
Organization Effective at the beginning of fiscal year
2000, Dayton Hudson Corporation changed its name to Target
Corporation. We are a general merchandise retailer, comprised
of three operating segments: Target, Mervyn’s and Marshall
Field’s. Target, an upscale discount chain located in 46 states at
year-end, contributed 80 percent of our 2000 total revenues.
Mervyn’s, a middle-market promotional department store
located in 14 states in the West, South and Midwest, contri-
buted 11 percent of total revenues. Marshall Field’s (including
stores formerly named Dayton’s and Hudson’s), a traditional
department store located in 8 states in the upper Midwest,
contributed 8 percent of total revenues.
Consolidation The financial statements include the
balances of the Corporation and its subsidiaries after elimina-
tion of material intercompany balances and transactions.
All material subsidiaries are wholly owned.
Use of Estimates The preparation of our financial
statements, in conformity with generally accepted accounting
principles, requires management to make estimates and
assumptions that affect the reported amounts in the financial
statements and accompanying notes. Actual results may differ
from those estimates.
Fiscal Year Our fiscal year ends on the Saturday nearest
January 31. Unless otherwise stated, references to years in this
report relate to fiscal years rather than to calendar years. Fiscal
year 2000 consisted of 53 weeks. Fiscal years 1999 and 1998 each
consisted of 52 weeks.
Reclassifications Certain prior year amounts have been
reclassified to conform to the current year presentation.
c o n s o l i d a t e d r e s u l t s o f o p e r a t i o n s
(millions, except per share data) 2000 1999 1998
Sales $36,362 $33,212 $30,203
Net credit revenues 541 490 459
Total revenues 36,903 33,702 30,662
Cost of sales 25,295 23,029 21,085
Selling, general and administrative expense 8,190 7,490 6,843
Depreciation and amortization 940 854 780
Interest expense 425 393 398
Earnings before income taxes and extraordinary charges 2,053 1,936 1,556
Provision for income taxes 789 751 594
Net earnings before extraordinary charges 1,264 1,185 962
Extraordinary charges from purchase and redemption of debt, net of tax – 41 27
Net earnings $ 1,264 $ 1,144 $ 935
Earnings before extraordinary charges $ 1.40 $ 1.32 $1.07
Extraordinary charges – (.04) (.03)
Basic earnings per share $ 1.40 $ 1.28 $ 1.04
Earnings before extraordinary charges $ 1.38 $ 1.27 $ 1.02
Extraordinary charges – (.04) (.03)
Diluted earnings per share $ 1.38 $ 1.23 $ .99
Weighted average common shares outstanding:
Basic 903.5 882.6 880.0
Diluted 913.0 931.3 934.6
See Notes to Consolidated Financial Statements throughout pages 24-36.
n o t e s t o c o n s o l i d a t e d f i n a n c i a l s t a t e m e n t s
Revenues
Revenue from retail sales is recognized at the time of sale.
Leased department sales, net of related cost of sales, are included
within sales and were $33 million in 2000, $31 million in 1999,
and $29 million in 1998. Net credit revenues represent revenue
from receivable-backed securities, which is comprised of finance
charges and late fees on internal credit sales, net of the effect of
publicly held receivable-backed securities. Internal credit sales
were $5.5 billion, $5.0 billion and $4.5 billion in 2000, 1999 and
1998, respectively.
Advertising Costs
Advertising costs, included in selling, general and
administrative expense, are expensed as incurred and were
$824 million, $791 million and $745 million for 2000, 1999 and
1998, respectively.
Mainframe Outsourcing
In 1998, we announced our plan to outsource our
mainframe computer data center functions and expensed
$42 million ($.03 per share) of related charges. During 1999, we
completed the transition and expensed an additional $5 million
(less than $.01 per share) related to the outsourcing. These
expenses are included in selling, general and administrative
expense.
Start-up Expense
In first quarter 1999, we adopted SOP 98-5, “Reporting on
the Costs of Start-Up Activities.” The adoption did not impact
total year start-up expense, which is included in selling, general
and administrative expense.
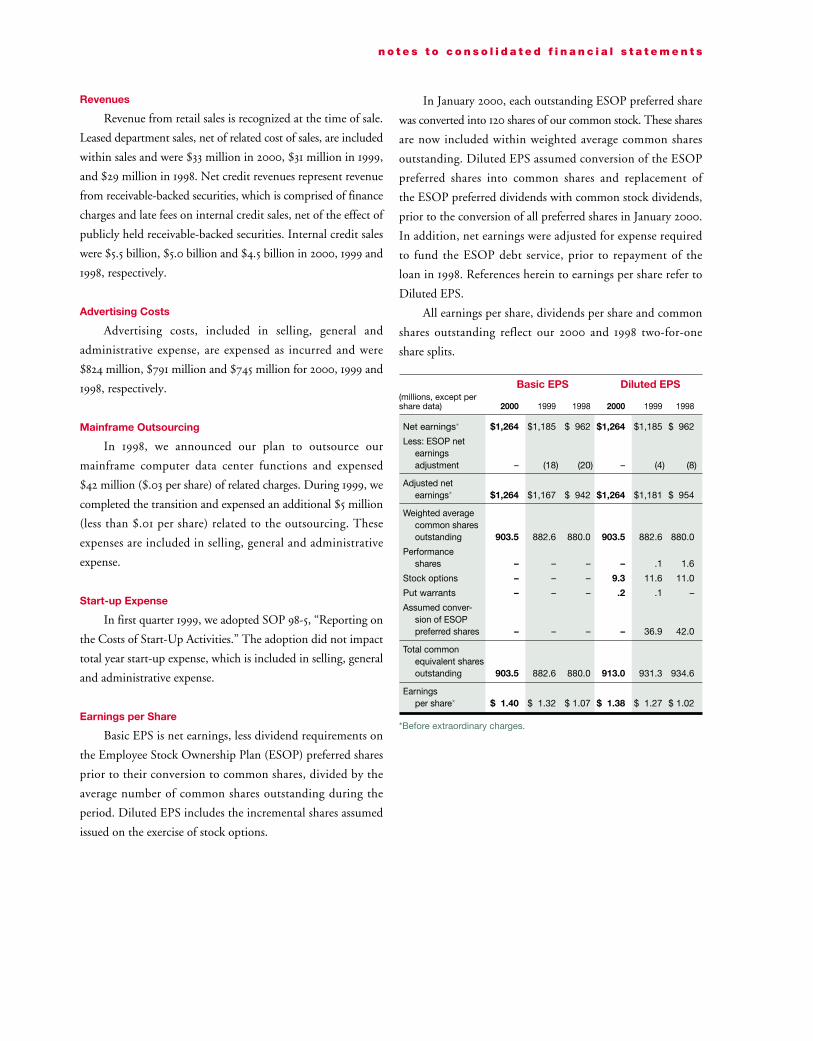
Earnings per Share
Basic EPS is net earnings, less dividend requirements on
the Employee Stock Ownership Plan (ESOP) preferred shares
prior to their conversion to common shares, divided by the
average number of common shares outstanding during the
period. Diluted EPS includes the incremental shares assumed
issued on the exercise of stock options.
In January 2000, each outstanding ESOP preferred share
was converted into 120 shares of our common stock. These shares
are now included within weighted average common shares
outstanding. Diluted EPS assumed conversion of the ESOP
preferred shares into common shares and replacement of
the ESOP preferred dividends with common stock dividends,
prior to the conversion of all preferred shares in January 2000.
In addition, net earnings were adjusted for expense required
to fund the ESOP debt service, prior to repayment of the
loan in 1998. References herein to earnings per share refer to
Diluted EPS.
All earnings per share, dividends per share and common
shares outstanding reflect our 2000 and 1998 two-for-one
share splits.
Basic EPS Diluted EPS(millions, except pershare data) 2000 1999 1998 2000 1999 1998
Net earnings* $1,264 $1,185 $ 962 $1,264 $1,185 $ 962
Less: ESOP netearningsadjustment – (18) (20) – (4) (8)
Adjusted netearnings* $1,264 $1,167 $ 942 $1,264 $1,181 $ 954
Weighted averagecommon sharesoutstanding 903.5 882.6 880.0 903.5 882.6 880.0
Performanceshares – – – – .1 1.6
Stock options – – – 9.3 11.6 11.0
Put warrants – – – .2 .1 –
Assumed conver-sion of ESOPpreferred shares – – – – 36.9 42.0
Total commonequivalent sharesoutstanding 903.5 882.6 880.0 913.0 931.3 934.6
Earningsper share* $ 1.40 $ 1.32 $ 1.07 $ 1.38 $ 1.27 $ 1.02
*Before extraordinary charges.
26 | 27
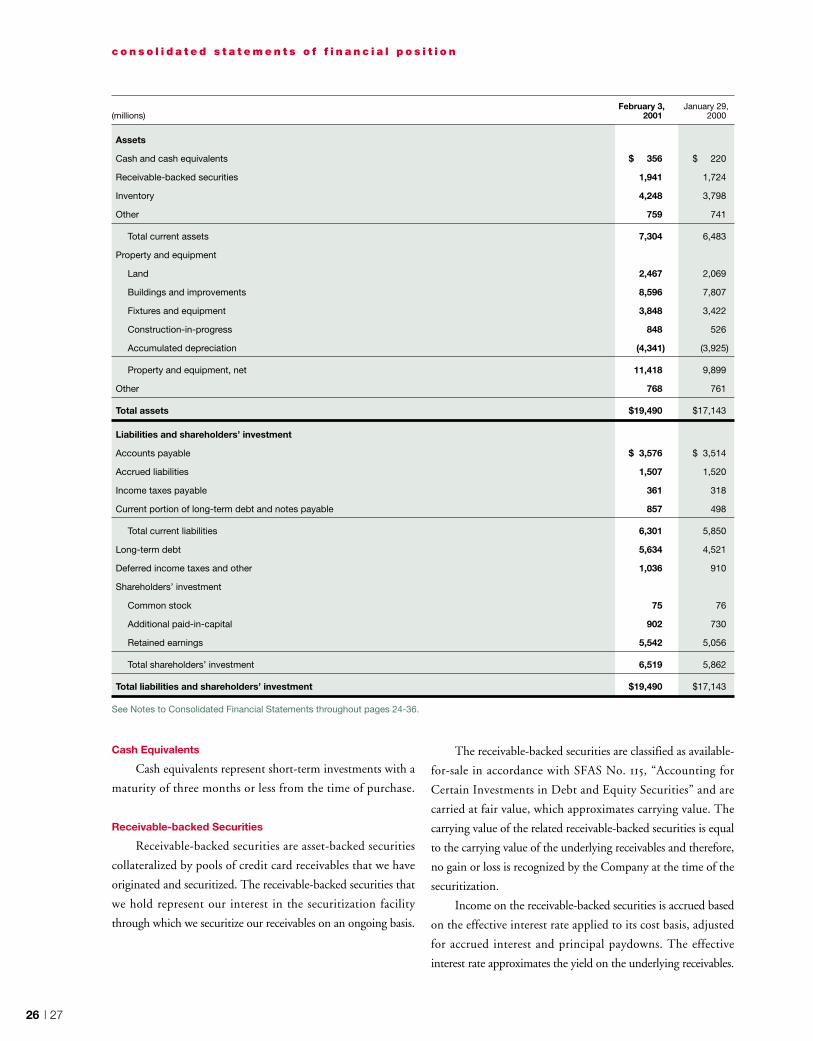
February 3, January 29,(millions) 2001 2000
Assets
Cash and cash equivalents $ 356 $ 220
Receivable-backed securities 1,941 1,724
Inventory 4,248 3,798
Other 759 741
Total current assets 7,304 6,483
Property and equipment
Land 2,467 2,069
Buildings and improvements 8,596 7,807
Fixtures and equipment 3,848 3,422
Construction-in-progress 848 526
Accumulated depreciation (4,341) (3,925)
Property and equipment, net 11,418 9,899
Other 768 761
Total assets $19,490 $17,143
Liabilities and shareholders’ investment
Accounts payable $ 3,576 $ 3,514
Accrued liabilities 1,507 1,520
Income taxes payable 361 318
Current portion of long-term debt and notes payable 857 498
Total current liabilities 6,301 5,850
Long-term debt 5,634 4,521
Deferred income taxes and other 1,036 910
Shareholders’ investment
Common stock 75 76
Additional paid-in-capital 902 730
Retained earnings 5,542 5,056
Total shareholders’ investment 6,519 5,862
Total liabilities and shareholders’ investment $19,490 $17,143
See Notes to Consolidated Financial Statements throughout pages 24-36.
c o n s o l i d a t e d s t a t e m e n t s o f f i n a n c i a l p o s i t i o n
Cash Equivalents
Cash equivalents represent short-term investments with a
maturity of three months or less from the time of purchase.
Receivable-backed Securities
Receivable-backed securities are asset-backed securities
collateralized by pools of credit card receivables that we have
originated and securitized. The receivable-backed securities that
we hold represent our interest in the securitization facility
through which we securitize our receivables on an ongoing basis.
The receivable-backed securities are classified as available-
for-sale in accordance with SFAS No. 115, “Accounting for
Certain Investments in Debt and Equity Securities” and are
carried at fair value, which approximates carrying value. The
carrying value of the related receivable-backed securities is equal
to the carrying value of the underlying receivables and therefore,
no gain or loss is recognized by the Company at the time of the
securitization.
Income on the receivable-backed securities is accrued based
on the effective interest rate applied to its cost basis, adjusted
for accrued interest and principal paydowns. The effective
interest rate approximates the yield on the underlying receivables.
Our retained interests relate to the publicly held
securitizations in the form of interest only strips, which represent
the difference between the yield on the receivable portfolio
and the stated interest rate on the publicly held receivable-
backed security. The retained interests are not material to the
financial statements.
We monitor impairment of receivable-backed securities
based on fair value. Provisions for losses are charged to earnings
when it is determined that the receivable-backed securities’
carrying value is greater than their fair value.
Through our special purpose subsidiary, Target Receiv-
ables Corporation (TRC), we transfer, on an ongoing basis,
substantially all of our receivables to a trust in return for
certificates representing undivided interests in the trust’s assets.
TRC owns the undivided interest in the trust’s assets, other than
the publicly held trust certificates described below and the 2
percent of trust assets held by Retailers National Bank (RNB),
a wholly owned subsidiary of the Corporation that also services
receivables. The undivided interests held by TRC and RNB and
the related income and expenses are reflected in each operating
segment’s assets and operating results based on the origin of the
credit sale giving rise to the receivable.
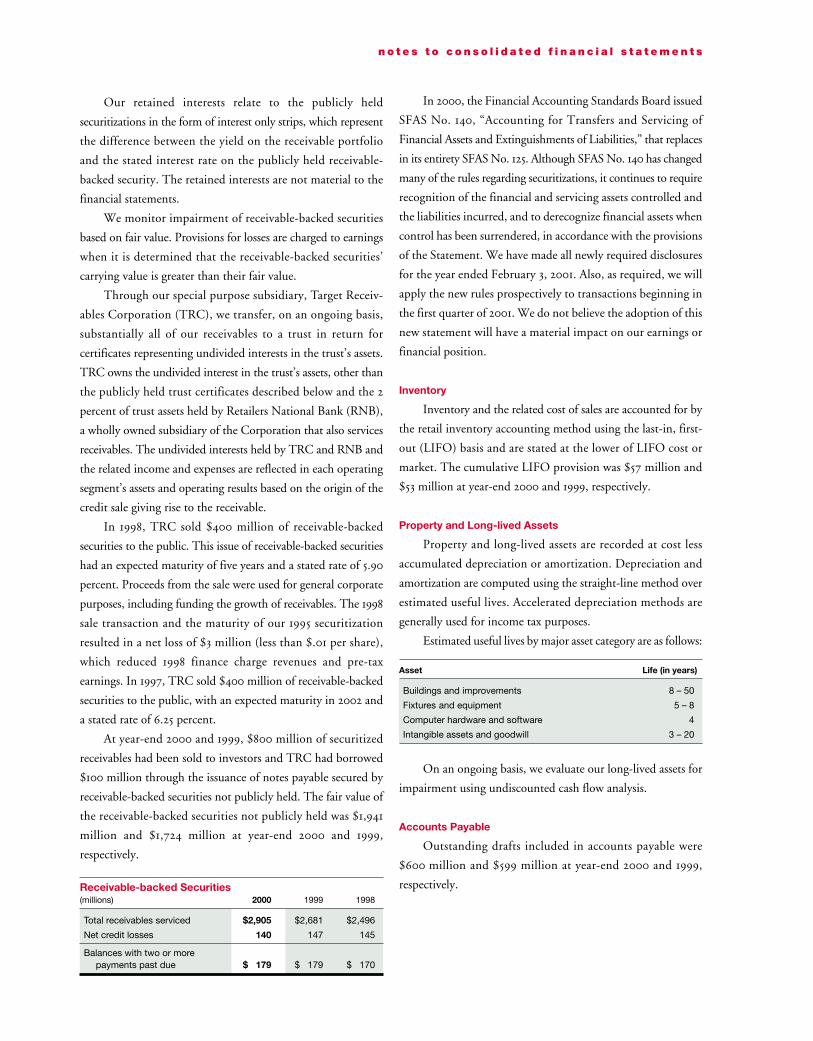
In 1998, TRC sold $400 million of receivable-backed
securities to the public. This issue of receivable-backed securities
had an expected maturity of five years and a stated rate of 5.90
percent. Proceeds from the sale were used for general corporate
purposes, including funding the growth of receivables. The 1998
sale transaction and the maturity of our 1995 securitization
resulted in a net loss of $3 million (less than $.01 per share),
which reduced 1998 finance charge revenues and pre-tax
earnings. In 1997, TRC sold $400 million of receivable-backed
securities to the public, with an expected maturity in 2002 and
a stated rate of 6.25 percent.
At year-end 2000 and 1999, $800 million of securitized
receivables had been sold to investors and TRC had borrowed
$100 million through the issuance of notes payable secured by
receivable-backed securities not publicly held. The fair value of
the receivable-backed securities not publicly held was $1,941
million and $1,724 million at year-end 2000 and 1999,
respectively.
Receivable-backed Securities(millions) 2000 1999 1998
Total receivables serviced $2,905 $2,681 $2,496
Net credit losses 140 147 145
Balances with two or more payments past due $ 179 $ 179 $ 170
In 2000, the Financial Accounting Standards Board issued
SFAS No. 140, “Accounting for Transfers and Servicing of
Financial Assets and Extinguishments of Liabilities,” that replaces
in its entirety SFAS No. 125. Although SFAS No. 140 has changed
many of the rules regarding securitizations, it continues to require
recognition of the financial and servicing assets controlled and
the liabilities incurred, and to derecognize financial assets when
control has been surrendered, in accordance with the provisions
of the Statement. We have made all newly required disclosures
for the year ended February 3, 2001. Also, as required, we will
apply the new rules prospectively to transactions beginning in
the first quarter of 2001. We do not believe the adoption of this
new statement will have a material impact on our earnings or
financial position.
Inventory
Inventory and the related cost of sales are accounted for by
the retail inventory accounting method using the last-in, first-
out (LIFO) basis and are stated at the lower of LIFO cost or
market. The cumulative LIFO provision was $57 million and
$53 million at year-end 2000 and 1999, respectively.
Property and Long-lived Assets
Property and long-lived assets are recorded at cost less
accumulated depreciation or amortization. Depreciation and
amortization are computed using the straight-line method over
estimated useful lives. Accelerated depreciation methods are
generally used for income tax purposes.
Estimated useful lives by major asset category are as follows:
Asset Life (in years)
Buildings and improvements 8 – 50
Fixtures and equipment 5 – 8
Computer hardware and software 4
Intangible assets and goodwill 3 – 20
On an ongoing basis, we evaluate our long-lived assets for
impairment using undiscounted cash flow analysis.
Accounts Payable
Outstanding drafts included in accounts payable were
$600 million and $599 million at year-end 2000 and 1999,
respectively.
n o t e s t o c o n s o l i d a t e d f i n a n c i a l s t a t e m e n t s
28 | 29
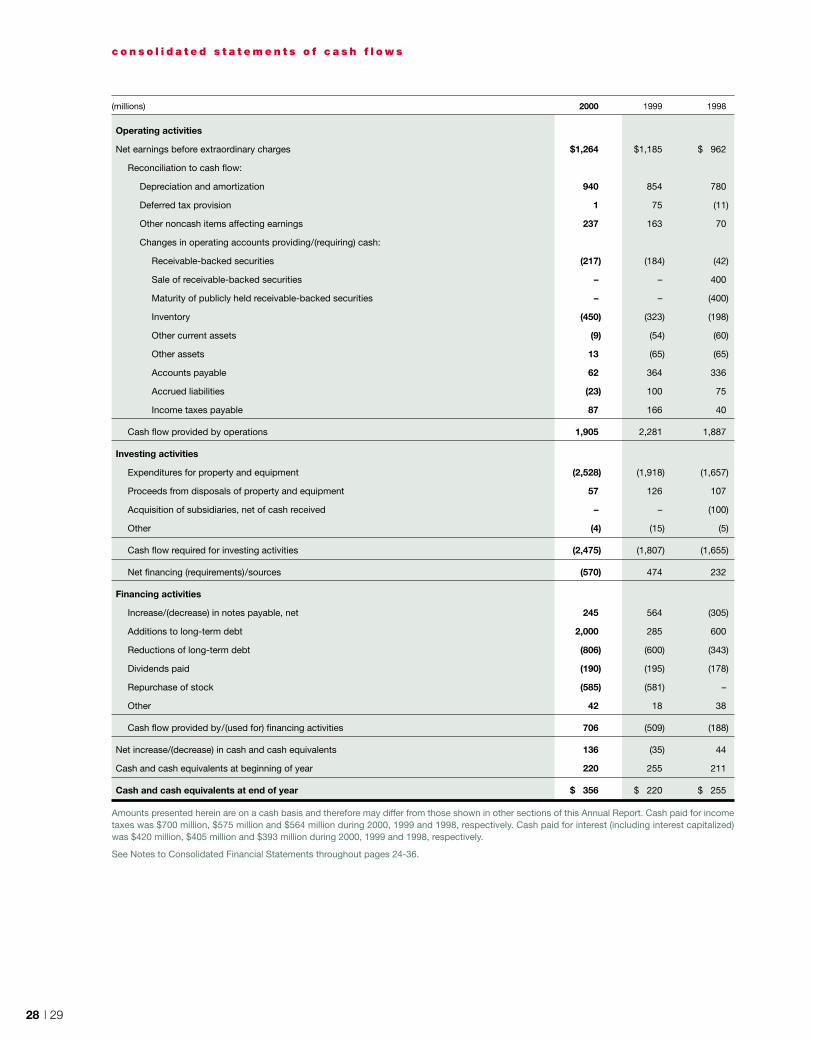
c o n s o l i d a t e d s t a t e m e n t s o f c a s h f l o w s
(millions) 2000 1999 1998
Operating activities
Net earnings before extraordinary charges $1,264 $1,185 $ 962
Reconciliation to cash flow:
Depreciation and amortization 940 854 780
Deferred tax provision 1 75 (11)
Other noncash items affecting earnings 237 163 70
Changes in operating accounts providing/(requiring) cash:
Receivable-backed securities (217) (184) (42)
Sale of receivable-backed securities – – 400
Maturity of publicly held receivable-backed securities – – (400)
Inventory (450) (323) (198)
Other current assets (9) (54) (60)
Other assets 13 (65) (65)
Accounts payable 62 364 336
Accrued liabilities (23) 100 75
Income taxes payable 87 166 40
Cash flow provided by operations 1,905 2,281 1,887
Investing activities
Expenditures for property and equipment (2,528) (1,918) (1,657)
Proceeds from disposals of property and equipment 57 126 107
Acquisition of subsidiaries, net of cash received – – (100)
Other (4) (15) (5)
Cash flow required for investing activities (2,475) (1,807) (1,655)
Net financing (requirements)/sources (570) 474 232
Financing activities
Increase/(decrease) in notes payable, net 245 564 (305)
Additions to long-term debt 2,000 285 600
Reductions of long-term debt (806) (600) (343)
Dividends paid (190) (195) (178)
Repurchase of stock (585) (581) –
Other 42 18 38
Cash flow provided by/(used for) financing activities 706 (509) (188)
Net increase/(decrease) in cash and cash equivalents 136 (35) 44
Cash and cash equivalents at beginning of year 220 255 211
Cash and cash equivalents at end of year $ 356 $ 220 $ 255
Amounts presented herein are on a cash basis and therefore may differ from those shown in other sections of this Annual Report. Cash paid for incometaxes was $700 million, $575 million and $564 million during 2000, 1999 and 1998, respectively. Cash paid for interest (including interest capitalized)was $420 million, $405 million and $393 million during 2000, 1999 and 1998, respectively.
See Notes to Consolidated Financial Statements throughout pages 24-36.
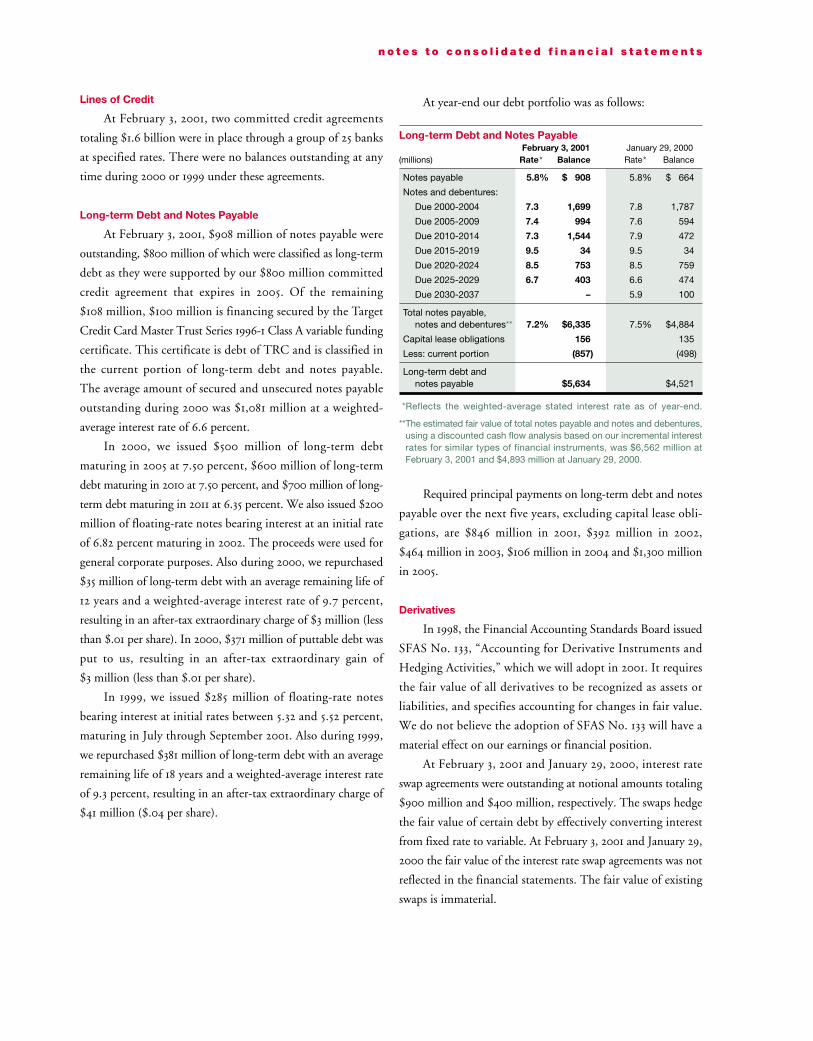
Lines of Credit
At February 3, 2001, two committed credit agreements
totaling $1.6 billion were in place through a group of 25 banks
at specified rates. There were no balances outstanding at any
time during 2000 or 1999 under these agreements.
Long-term Debt and Notes Payable
At February 3, 2001, $908 million of notes payable were
outstanding, $800 million of which were classified as long-term
debt as they were supported by our $800 million committed
credit agreement that expires in 2005. Of the remaining
$108 million, $100 million is financing secured by the Target
Credit Card Master Trust Series 1996-1 Class A variable funding
certificate. This certificate is debt of TRC and is classified in
the current portion of long-term debt and notes payable.
The average amount of secured and unsecured notes payable
outstanding during 2000 was $1,081 million at a weighted-
average interest rate of 6.6 percent.
In 2000, we issued $500 million of long-term debt
maturing in 2005 at 7.50 percent, $600 million of long-term
debt maturing in 2010 at 7.50 percent, and $700 million of long-
term debt maturing in 2011 at 6.35 percent. We also issued $200
million of floating-rate notes bearing interest at an initial rate
of 6.82 percent maturing in 2002. The proceeds were used for
general corporate purposes. Also during 2000, we repurchased
$35 million of long-term debt with an average remaining life of
12 years and a weighted-average interest rate of 9.7 percent,
resulting in an after-tax extraordinary charge of $3 million (less
than $.01 per share). In 2000, $371 million of puttable debt was
put to us, resulting in an after-tax extraordinary gain of
$3 million (less than $.01 per share).
In 1999, we issued $285 million of floating-rate notes
bearing interest at initial rates between 5.32 and 5.52 percent,
maturing in July through September 2001. Also during 1999,
we repurchased $381 million of long-term debt with an average
remaining life of 18 years and a weighted-average interest rate
of 9.3 percent, resulting in an after-tax extraordinary charge of
$41 million ($.04 per share).
At year-end our debt portfolio was as follows:
Long-term Debt and Notes PayableFebruary 3, 2001 January 29, 2000
(millions) Rate* Balance Rate* Balance
Notes payable 5.8% $ 908 5.8% $ 664
Notes and debentures:
Due 2000-2004 7.3 1,699 7.8 1,787
Due 2005-2009 7.4 994 7.6 594
Due 2010-2014 7.3 1,544 7.9 472
Due 2015-2019 9.5 34 9.5 34
Due 2020-2024 8.5 753 8.5 759
Due 2025-2029 6.7 403 6.6 474
Due 2030-2037 – 5.9 100
Total notes payable, notes and debentures** 7.2% $6,335 7.5% $4,884
Capital lease obligations 156 135
Less: current portion (857) (498)
Long-term debt andnotes payable $5,634 $4,521
*Reflects the weighted-average stated interest rate as of year-end.
**The estimated fair value of total notes payable and notes and debentures,using a discounted cash flow analysis based on our incremental interestrates for similar types of financial instruments, was $6,562 million atFebruary 3, 2001 and $4,893 million at January 29, 2000.
Required principal payments on long-term debt and notes
payable over the next five years, excluding capital lease obli-
gations, are $846 million in 2001, $392 million in 2002,
$464 million in 2003, $106 million in 2004 and $1,300 million
in 2005.
Derivatives
In 1998, the Financial Accounting Standards Board issued
SFAS No. 133, “Accounting for Derivative Instruments and
Hedging Activities,” which we will adopt in 2001. It requires
the fair value of all derivatives to be recognized as assets or
liabilities, and specifies accounting for changes in fair value.
We do not believe the adoption of SFAS No. 133 will have a
material effect on our earnings or financial position.
At February 3, 2001 and January 29, 2000, interest rate
swap agreements were outstanding at notional amounts totaling
$900 million and $400 million, respectively. The swaps hedge
the fair value of certain debt by effectively converting interest
from fixed rate to variable. At February 3, 2001 and January 29,
2000 the fair value of the interest rate swap agreements was not
reflected in the financial statements. The fair value of existing
swaps is immaterial.
n o t e s t o c o n s o l i d a t e d f i n a n c i a l s t a t e m e n t s
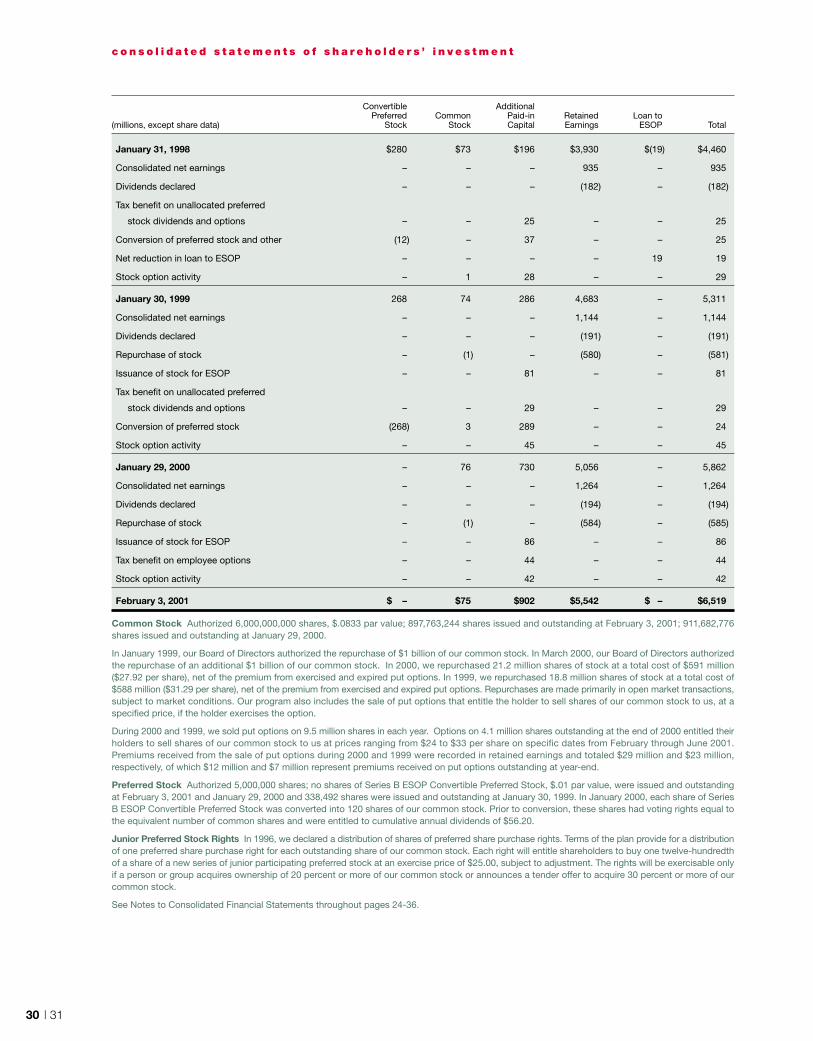
30 | 31
Convertible AdditionalPreferred Common Paid-in Retained Loan to
(millions, except share data) Stock Stock Capital Earnings ESOP Total
January 31, 1998 $280 $73 $196 $3,930 $(19) $4,460
Consolidated net earnings – – – 935 – 935
Dividends declared – – – (182) – (182)
Tax benefit on unallocated preferred
stock dividends and options – – 25 – – 25
Conversion of preferred stock and other (12) – 37 – – 25
Net reduction in loan to ESOP – – – – 19 19
Stock option activity – 1 28 – – 29
January 30, 1999 268 74 286 4,683 – 5,311
Consolidated net earnings – – – 1,144 – 1,144
Dividends declared – – – (191) – (191)
Repurchase of stock – (1) – (580) – (581)
Issuance of stock for ESOP – – 81 – – 81
Tax benefit on unallocated preferred
stock dividends and options – – 29 – – 29
Conversion of preferred stock (268) 3 289 – – 24
Stock option activity – – 45 – – 45
January 29, 2000 – 76 730 5,056 – 5,862
Consolidated net earnings – – – 1,264 – 1,264
Dividends declared – – – (194) – (194)
Repurchase of stock – (1) – (584) – (585)
Issuance of stock for ESOP – – 86 – – 86
Tax benefit on employee options – – 44 – – 44
Stock option activity – – 42 – – 42
February 3, 2001 $ – $75 $902 $5,542 $ – $6,519
Common Stock Authorized 6,000,000,000 shares, $.0833 par value; 897,763,244 shares issued and outstanding at February 3, 2001; 911,682,776shares issued and outstanding at January 29, 2000.
In January 1999, our Board of Directors authorized the repurchase of $1 billion of our common stock. In March 2000, our Board of Directors authorizedthe repurchase of an additional $1 billion of our common stock. In 2000, we repurchased 21.2 million shares of stock at a total cost of $591 million($27.92 per share), net of the premium from exercised and expired put options. In 1999, we repurchased 18.8 million shares of stock at a total cost of$588 million ($31.29 per share), net of the premium from exercised and expired put options. Repurchases are made primarily in open market transactions,subject to market conditions. Our program also includes the sale of put options that entitle the holder to sell shares of our common stock to us, at aspecified price, if the holder exercises the option.
During 2000 and 1999, we sold put options on 9.5 million shares in each year. Options on 4.1 million shares outstanding at the end of 2000 entitled theirholders to sell shares of our common stock to us at prices ranging from $24 to $33 per share on specific dates from February through June 2001.Premiums received from the sale of put options during 2000 and 1999 were recorded in retained earnings and totaled $29 million and $23 million,respectively, of which $12 million and $7 million represent premiums received on put options outstanding at year-end.
Preferred Stock Authorized 5,000,000 shares; no shares of Series B ESOP Convertible Preferred Stock, $.01 par value, were issued and outstandingat February 3, 2001 and January 29, 2000 and 338,492 shares were issued and outstanding at January 30, 1999. In January 2000, each share of SeriesB ESOP Convertible Preferred Stock was converted into 120 shares of our common stock. Prior to conversion, these shares had voting rights equal tothe equivalent number of common shares and were entitled to cumulative annual dividends of $56.20.
Junior Preferred Stock Rights In 1996, we declared a distribution of shares of preferred share purchase rights. Terms of the plan provide for a distributionof one preferred share purchase right for each outstanding share of our common stock. Each right will entitle shareholders to buy one twelve-hundredthof a share of a new series of junior participating preferred stock at an exercise price of $25.00, subject to adjustment. The rights will be exercisable onlyif a person or group acquires ownership of 20 percent or more of our common stock or announces a tender offer to acquire 30 percent or more of ourcommon stock.
See Notes to Consolidated Financial Statements throughout pages 24-36.
c o n s o l i d a t e d s t a t e m e n t s o f s h a r e h o l d e r s ’ i n v e s t m e n t
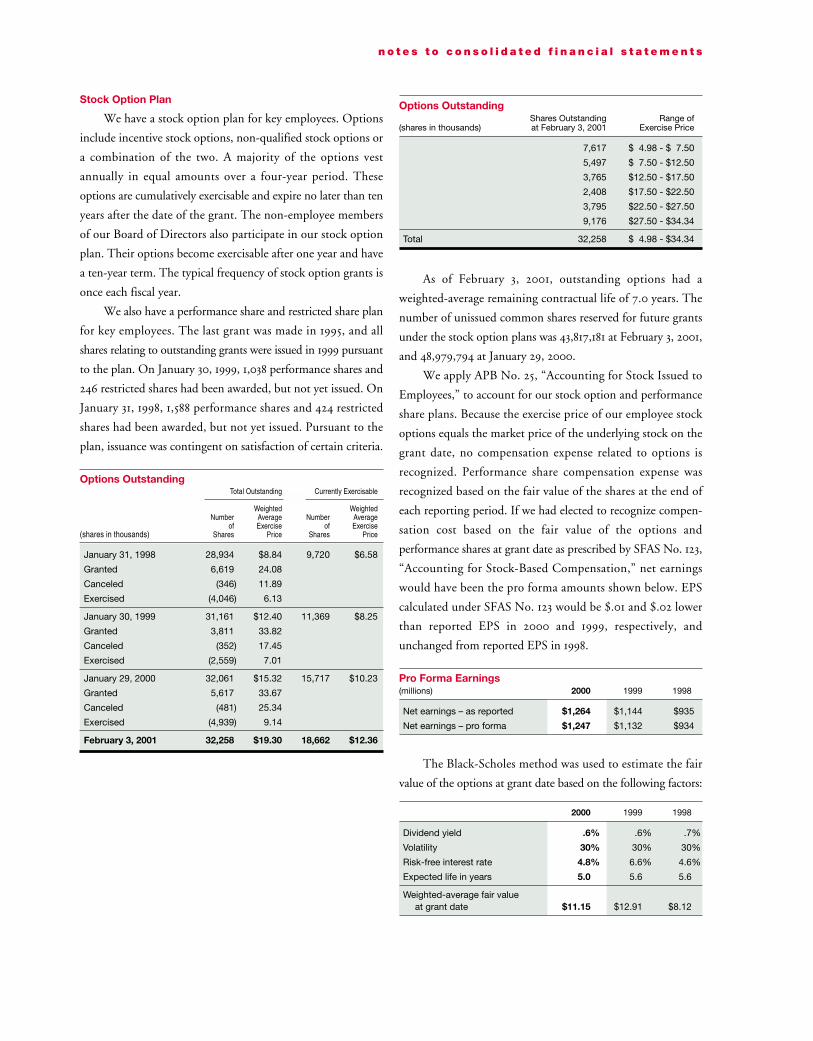
Stock Option Plan
We have a stock option plan for key employees. Options
include incentive stock options, non-qualified stock options or
a combination of the two. A majority of the options vest
annually in equal amounts over a four-year period. These
options are cumulatively exercisable and expire no later than ten
years after the date of the grant. The non-employee members
of our Board of Directors also participate in our stock option
plan. Their options become exercisable after one year and have
a ten-year term. The typical frequency of stock option grants is
once each fiscal year.
We also have a performance share and restricted share plan
for key employees. The last grant was made in 1995, and all
shares relating to outstanding grants were issued in 1999 pursuant
to the plan. On January 30, 1999, 1,038 performance shares and
246 restricted shares had been awarded, but not yet issued. On
January 31, 1998, 1,588 performance shares and 424 restricted
shares had been awarded, but not yet issued. Pursuant to the
plan, issuance was contingent on satisfaction of certain criteria.
Options OutstandingTotal Outstanding Currently Exercisable
Weighted WeightedNumber Average Number Average
of Exercise of Exercise(shares in thousands) Shares Price Shares Price
January 31, 1998 28,934 $8.84 9,720 $6.58
Granted 6,619 24.08
Canceled (346) 11.89
Exercised (4,046) 6.13
January 30, 1999 31,161 $12.40 11,369 $8.25
Granted 3,811 33.82
Canceled (352) 17.45
Exercised (2,559) 7.01
January 29, 2000 32,061 $15.32 15,717 $10.23
Granted 5,617 33.67
Canceled (481) 25.34
Exercised (4,939) 9.14
February 3, 2001 32,258 $19.30 18,662 $12.36
n o t e s t o c o n s o l i d a t e d f i n a n c i a l s t a t e m e n t s
Options OutstandingShares Outstanding Range of
(shares in thousands) at February 3, 2001 Exercise Price
7,617 $ 4.98 - $ 7.50
5,497 $ 7.50 - $12.50
3,765 $12.50 - $17.50
2,408 $17.50 - $22.50
3,795 $22.50 - $27.50
9,176 $27.50 - $34.34
Total 32,258 $ 4.98 - $34.34
As of February 3, 2001, outstanding options had a
weighted-average remaining contractual life of 7.0 years. The
number of unissued common shares reserved for future grants
under the stock option plans was 43,817,181 at February 3, 2001,
and 48,979,794 at January 29, 2000.
We apply APB No. 25, “Accounting for Stock Issued to
Employees,” to account for our stock option and performance
share plans. Because the exercise price of our employee stock
options equals the market price of the underlying stock on the
grant date, no compensation expense related to options is
recognized. Performance share compensation expense was
recognized based on the fair value of the shares at the end of
each reporting period. If we had elected to recognize compen-
sation cost based on the fair value of the options and
performance shares at grant date as prescribed by SFAS No. 123,
“Accounting for Stock-Based Compensation,” net earnings
would have been the pro forma amounts shown below. EPS
calculated under SFAS No. 123 would be $.01 and $.02 lower
than reported EPS in 2000 and 1999, respectively, and
unchanged from reported EPS in 1998.
Pro Forma Earnings(millions) 2000 1999 1998
Net earnings – as reported $1,264 $1,144 $935
Net earnings – pro forma $1,247 $1,132 $934
The Black-Scholes method was used to estimate the fair
value of the options at grant date based on the following factors:
2000 1999 1998
Dividend yield .6% .6% .7%
Volatility 30% 30% 30%
Risk-free interest rate 4.8% 6.6% 4.6%
Expected life in years 5.0 5.6 5.6
Weighted-average fair valueat grant date $11.15 $12.91 $8.12
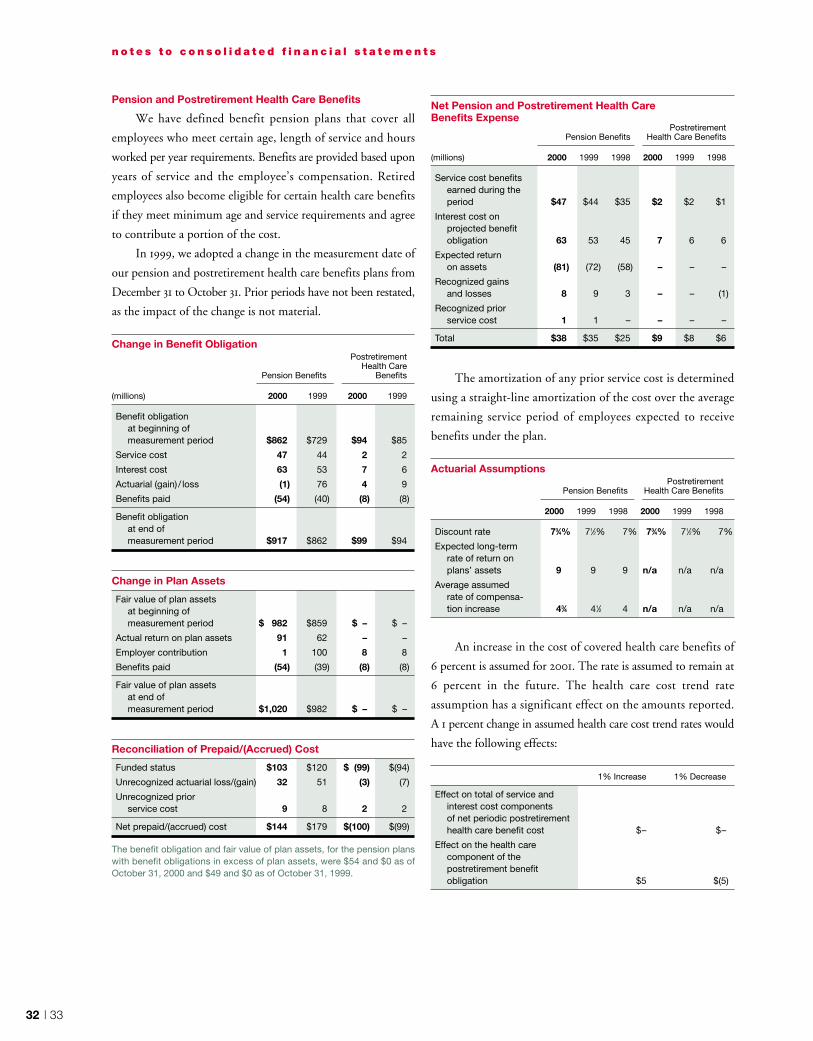
32 | 33
Pension and Postretirement Health Care Benefits
We have defined benefit pension plans that cover all
employees who meet certain age, length of service and hours
worked per year requirements. Benefits are provided based upon
years of service and the employee’s compensation. Retired
employees also become eligible for certain health care benefits
if they meet minimum age and service requirements and agree
to contribute a portion of the cost.
In 1999, we adopted a change in the measurement date of
our pension and postretirement health care benefits plans from
December 31 to October 31. Prior periods have not been restated,
as the impact of the change is not material.
Change in Benefit ObligationPostretirement
Health CarePension Benefits Benefits
(millions) 2000 1999 2000 1999
Benefit obligation at beginning of measurement period $862 $729 $94 $85
Service cost 47 44 2 2
Interest cost 63 53 7 6
Actuarial (gain) / loss (1) 76 4 9
Benefits paid (54) (40) (8) (8)
Benefit obligation at end of measurement period $917 $862 $99 $94
Change in Plan Assets
Fair value of plan assets at beginning of measurement period $ 982 $859 $ – $ –
Actual return on plan assets 91 62 – –
Employer contribution 1 100 8 8
Benefits paid (54) (39) (8) (8)
Fair value of plan assets at end of measurement period $1,020 $982 $ – $ –
Reconciliation of Prepaid/(Accrued) Cost
Funded status $103 $120 $ (99) $(94)
Unrecognized actuarial loss/(gain) 32 51 (3) (7)
Unrecognized priorservice cost 9 8 2 2
Net prepaid/(accrued) cost $144 $179 $(100) $(99)
The benefit obligation and fair value of plan assets, for the pension planswith benefit obligations in excess of plan assets, were $54 and $0 as ofOctober 31, 2000 and $49 and $0 as of October 31, 1999.
n o t e s t o c o n s o l i d a t e d f i n a n c i a l s t a t e m e n t s
Net Pension and Postretirement Health CareBenefits Expense
PostretirementPension Benefits Health Care Benefits
(millions) 2000 1999 1998 2000 1999 1998
Service cost benefitsearned during theperiod $47 $44 $35 $2 $2 $1
Interest cost onprojected benefitobligation 63 53 45 7 6 6
Expected returnon assets (81) (72) (58) – – –
Recognized gainsand losses 8 9 3 – – (1)
Recognized priorservice cost 1 1 – – – –
Total $38 $35 $25 $9 $8 $6
The amortization of any prior service cost is determined
using a straight-line amortization of the cost over the average
remaining service period of employees expected to receive
benefits under the plan.
Actuarial AssumptionsPostretirement
Pension Benefits Health Care Benefits
2000 1999 1998 2000 1999 1998
Discount rate 73⁄4% 71⁄2% 7% 73⁄4% 71⁄2% 7%
Expected long-termrate of return onplans’ assets 9 9 9 n/a n/a n/a
Average assumedrate of compensa-tion increase 43⁄4 41⁄2 4 n/a n/a n/a
An increase in the cost of covered health care benefits of
6 percent is assumed for 2001. The rate is assumed to remain at
6 percent in the future. The health care cost trend rate
assumption has a significant effect on the amounts reported.
A 1 percent change in assumed health care cost trend rates would
have the following effects:
1% Increase 1% Decrease
Effect on total of service and interest cost components of net periodic postretirementhealth care benefit cost $– $–
Effect on the health care component of the postretirement benefitobligation $5 $(5)
Employee Stock Ownership Plan
We sponsor a defined contribution employee benefit plan.
Employees who meet certain eligibility requirements can
participate by investing up to 20 percent of their compensation.
We match 100 percent of each employee’s contribution up to 5
percent of respective total compensation. Our contribution to
the plan is invested in the ESOP. Through December 1998,
ESOP preferred shares (401(k) preferred shares) were allocated
to participants. In January 1999, we began providing new
common shares to the ESOP to fund the employer match.
In 1989, we loaned $379 million to the ESOP at a 9 percent
interest rate. Proceeds from the loan were then used by the
ESOP to purchase 438,353 shares of 401(k) preferred shares. The
original issue value of the 401(k) preferred shares of $864.60 per
share was guaranteed by the Corporation. The loan was paid off
during 1998 using dividends paid on all 401(k) preferred shares
held by the ESOP. In January 2000, each 401(k) preferred share
was converted into 120 shares of common stock.
Prior to the conversion of all 401(k) preferred shares to
common stock, we were required to exchange at fair value each
401(k) preferred share for 120 shares of common stock and cash,
if any, upon a participant’s termination. The 401(k) preferred
shares were classified as shareholders’ investment to the extent
the preferred shares were permanent equity.
Dividends earned on 401(k) preferred shares held by the
ESOP were $19 million in both 1999 and 1998. The dividends
on allocated 401(k) preferred shares were paid to participants’
accounts in additional 401(k) preferred shares until June 1998.
Dividends are now paid to participants in cash. Benefits expense
was $92 million in 2000, $78 million in 1999 and $29 million
in 1998.
Leases
Assets held under capital leases are included in property
and equipment and are charged to depreciation and interest over
the life of the lease. Operating leases are not capitalized and lease
rentals are expensed. Rent expense on buildings, classified in
selling, general and administrative expense, includes percentage
rents that are based on a percentage of retail sales over stated
levels. Total rent expense was $168 million in 2000 and 1999
and $150 million in 1998. Most of the long-term leases include
options to renew, with terms varying from five to 30 years.
Certain leases also include options to purchase the property.
Future minimum lease payments required under non-
cancelable lease agreements existing at February 3, 2001, were:
Future Minimum Lease PaymentsOperating Capital
(millions) Leases Leases
2001 $ 111 $ 25
2002 102 24
2003 89 22
2004 79 21
2005 73 20
After 2005 680 146
Total future minimum lease payments $1,134 $258
Less: interest* (334) (102)
Present value of minimum lease payments $ 800 $156**
*Calculated using the interest rate at inception for each lease (the weighted-average interest rate was 8.7 percent).
**Includes current portion of $11 million.
Owned and Leased Store Locations
At year-end, owned, leased and “combined” (combination
owned/leased) store locations by operating segment were as
follows:
Owned Leased Combined Total
Target 759 95 123 977
Mervyn’s 160 67 39 266
Marshall Field’s 51 12 1 64
Total 970 174 163 1,307
n o t e s t o c o n s o l i d a t e d f i n a n c i a l s t a t e m e n t s
34 | 35
Income Taxes
Reconciliation of tax rates is as follows:
Percent of Earnings Before Income Taxes2000 1999 1998
Federal statutory rate 35.0% 35.0% 35.0%
State income taxes,net of federal tax benefit 3.6 3.9 4.5
Dividends on ESOP stock (.2) (.4) (.5)
Work opportunity tax credits (.2) (.2) (.2)
Inventory shortage tax matter – – (1.3)
Other .2 .5 .7
Effective tax rate 38.4% 38.8% 38.2%
The components of the provision for income taxes were:
Income Tax Provision: Expense/(Benefit)(millions) 2000 1999 1998
Current:
Federal $675 $570 $497
State 113 106 110
788 676 607
Deferred:
Federal (1) 63 (10)
State 2 12 (3)
1 75 (13)
Total $789 $751 $594
The components of the net deferred tax asset/(liability) were:
Net Deferred Tax Asset/(Liability)February 3, January 29,
(millions) 2001 2000
Gross deferred tax assets:
Self-insured benefits $167 $146
Deferred compensation 143 130
Inventory 100 84
Valuation allowance 64 63
Postretirement health care obligation 40 41
Other 99 106
613 570
Gross deferred tax liabilities:
Property and equipment (460) (408)
Other (96) (104)
(556) (512)
Total $ 57 $ 58
Inventory Shortage Tax Matter
In 1998, we received a favorable ruling from the United
States Court of Appeals on a 1983 case related to the deductibility
of accrued inventory shortage expense. The beneficial effect
resulting from the outcome of the case was $20 million ($.02
per share) and was reflected as a reduction in the 1998 effective
income tax rate. This issue has been settled for all years.
Acquisitions
In 1998, we acquired The Associated Merchandising
Corporation, an international sourcing company that provides
services to our operating divisions and other retailers, and we
also acquired Rivertown Trading Company, a direct marketing
firm. Both subsidiaries are included in the consolidated financial
statements. Their revenues and operating results are included
in “other” in revenues and in our pre-tax earnings reconciliation
on page 36 and were immaterial in 2000, 1999 and 1998.
Commitments and Contingencies
Commitments for the purchase, construction, lease or
remodeling of real estate, facilities and equipment were
approximately $633 million at year-end 2000. We are exposed
to claims and litigation arising out of the ordinary course of
business. Management, after consulting with legal counsel,
believes the currently identified claims and litigation will not
have a material adverse effect on our results of operations or our
financial condition taken as a whole.
n o t e s t o c o n s o l i d a t e d f i n a n c i a l s t a t e m e n t s
Quarterly Results (Unaudited)
The same accounting policies are followed in preparing quarterly financial data as are followed in preparing annual data. The
table below summarizes results by quarter for 2000 and 1999:
(millions, except per share data) First Quarter Second Quarter Third Quarter Fourth Quarter Total Year
2000 1999 2000 1999 2000 1999 2000 1999 2000 1999
Total revenues $7,746 7,158 $8,251 7,687 $8,582 7,927 $12,324 10,930 $36,903 33,702
Gross margin (a) $2,410 2,182 $2,530 2,376 $2,584 2,441 $ 3,543 3,184 $11,067 10,183
Net earnings before
extraordinary
charges (c) $ 239 194 $ 257 228 $ 216 241 $ 552 522 $ 1,264 1,185
Net earnings (b) (c) $ 239 194 $ 258 224 $ 215 232 $ 552 494 $ 1,264 1,144
Basic earnings
per share (b) (c) (d) $ .26 .21 $ .28 .25 $ .24 .26 $ .62 .55 $ 1.40 1.28
Diluted earnings
per share (b) (c) (d) $ .26 .21 $ .28 .24 $ .24 .25 $ .61 .53 $ 1.38 1.23
Dividends declared
per share (d) $ .050 .050 $ .050 .050 $ .055 .050 $ .055 .050 $ .210 .200
Common stock price (e)
High $38.59 37.88 $35.72 36.22 $31.88 34.75 $ 37.98 37.50 $ 38.59 37.88
Low $27.94 29.38 $26.22 28.97 $22.75 27.63 $ 25.50 30.38 $ 22.75 27.63
(a) Gross margin is sales less cost of sales. The LIFO provision, included in gross margin, is analyzed each quarter for estimated changes in year-
end inventory levels, markup rates and internally generated retail price indices. A final adjustment is recorded in the fourth quarter for the difference
between the prior quarters’ estimates and the actual total year LIFO provision.
(b) In 2000, second and third quarter net earnings include extraordinary gains (charges), net of tax, related to the purchase and redemption of debt
of $1 million and $(1) million (each less than .01 per basic and diluted share), respectively. In 1999, second, third and fourth quarter net earnings
include extraordinary charges, net of tax of $4 million, $9 million and $28 million (less than $.01, $.01 and $.03 per basic and diluted share),
respectively.
(c) Third quarter and total year 1999 net earnings before extraordinary charges, net earnings and earnings per share include a mainframe outsourcing
pre-tax charge of $5 million (less than $.01 per share).
(d) Per share amounts are computed independently for each of the quarters presented. The sum of the quarters may not equal the total year amount
due to the impact of changes in average quarterly shares outstanding and/or rounding caused by the 2000 two-for-one common share split.
(e) Our common stock is listed on the New York Stock Exchange and Pacific Exchange. At March 23, 2001, there were 14,660 registered shareholders
and the common stock price was $34.90 per share.
n o t e s t o c o n s o l i d a t e d f i n a n c i a l s t a t e m e n t s
36 | 37
Business Segment Comparisons(millions) 2000* 1999 1998 1997 1996 1995*
Revenues
Target $29,278 $26,080 $23,014 $20,298 $17,810 $15,752
Mervyn’s 4,152 4,099 4,150 4,219 4,350 4,491
Marshall Field’s 3,011 3,074 3,064 2,970 2,932 2,991
Other 462 449 434 – – –
Total revenues $36,903 $33,702 $30,662 $27,487 $25,092 $23,234
Pre-tax segment profit and earnings reconciliation
Target $ 2,223 $ 2,022 $ 1,578 $ 1,287 $ 1,048 $ 721
Mervyn’s 269 205 240 280 272 117
Marshall Field’s 190 296 279 240 151 192
Total pre-tax segment profit $ 2,682 $ 2,523 $ 2,097 $ 1,807 $ 1,471 $ 1,030
LIFO provision credit/(expense) (4) 7 18 (6) (9) (17)
Securitization adjustments:
Gain/(loss) – – (3) 45 – –
Interest equivalent (50) (49) (48) (33) (25) (10)
Interest expense (425) (393) (398) (416) (442) (442)
Mainframe outsourcing – (5) (42) – – –
Real estate repositioning – – – – (134) –
Other (150) (147) (68) (71) (78) (60)
Earnings before income taxes and extraordinary charges $ 2,053 $ 1,936 $ 1,556 $ 1,326 $ 783 $ 501
Assets
Target $14,348 $12,048 $10,475 $ 9,487 $ 8,257 $ 7,330
Mervyn’s 2,270 2,248 2,339 2,281 2,658 2,776
Marshall Field’s 2,114 2,149 2,123 2,188 2,296 2,309
Other 758 698 729 235 178 155
Total assets $19,490 $17,143 $15,666 $14,191 $13,389 $12,570
Depreciation and amortization
Target $ 660 $ 567 $ 496 $ 437 $ 377 $ 328
Mervyn’s 130 138 138 126 151 150
Marshall Field’s 134 133 135 128 119 113
Other 16 16 11 2 3 3
Total depreciation and amortization $ 940 $ 854 $ 780 $ 693 $ 650 $ 594
Capital expenditures
Target $ 2,244 $ 1,665 $ 1,352 $ 1,155 $ 1,048 $ 1,067
Mervyn’s 106 108 169 72 79 273
Marshall Field’s 143 124 127 124 173 161
Other 35 21 9 3 1 21
Total capital expenditures $ 2,528 $ 1,918 $ 1,657 $ 1,354 $ 1,301 $ 1,522
Segment EBITDA
Target $ 2,883 $ 2,589 $ 2,074 $ 1,724 $ 1,425 $ 1,049
Mervyn’s 400 343 378 406 423 267
Marshall Field’s 323 429 414 368 270 305
Total segment EBITDA $ 3,606 $ 3,361 $ 2,866 $ 2,498 $ 2,118 $ 1,621
Net assets**
Target $10,659 $ 8,413 $ 7,302 $ 6,602 $ 5,711 $ 5,109
Mervyn’s 1,928 1,908 2,017 2,019 2,268 2,484
Marshall Field’s 1,749 1,795 1,785 1,896 1,879 1,940
Other 463 428 514 169 53 96
Total net assets $14,799 $12,544 $11,618 $10,686 $ 9,911 $ 9,629
Each operating segment’s assets and operating results include the receivable-backed securities held by Target Receivables Corporation and
Retailers National Bank, as well as related income and expense.
*Consisted of 53 weeks.
**Net assets represent total assets (including publicly held receivable-backed securities) less non-interest bearing current liabilities.
n o t e s t o c o n s o l i d a t e d f i n a n c i a l s t a t e m e n t s
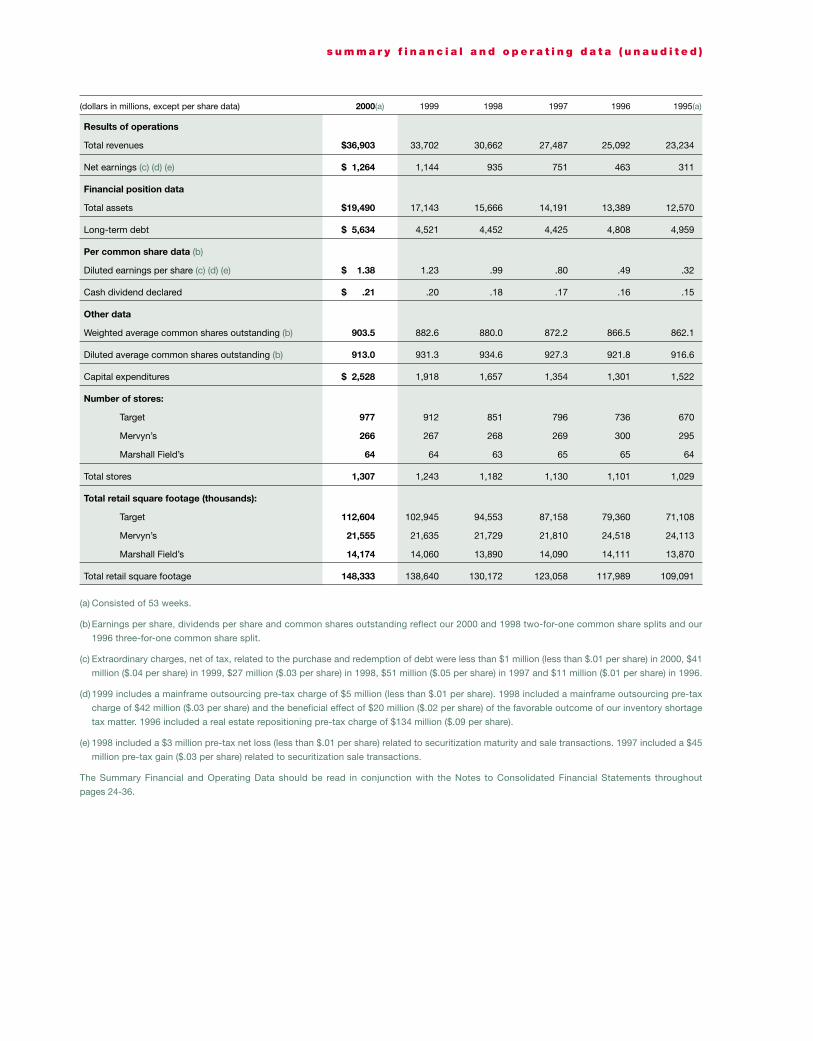
(dollars in millions, except per share data) 2000(a) 1999 1998 1997 1996 1995(a)
Results of operations
Total revenues $36,903 33,702 30,662 27,487 25,092 23,234
Net earnings (c) (d) (e) $ 1,264 1,144 935 751 463 311
Financial position data
Total assets $19,490 17,143 15,666 14,191 13,389 12,570
Long-term debt $ 5,634 4,521 4,452 4,425 4,808 4,959
Per common share data (b)
Diluted earnings per share (c) (d) (e) $ 1.38 1.23 .99 .80 .49 .32
Cash dividend declared $ .21 .20 .18 .17 .16 .15
Other data
Weighted average common shares outstanding (b) 903.5 882.6 880.0 872.2 866.5 862.1
Diluted average common shares outstanding (b) 913.0 931.3 934.6 927.3 921.8 916.6
Capital expenditures $ 2,528 1,918 1,657 1,354 1,301 1,522
Number of stores:
Target 977 912 851 796 736 670
Mervyn’s 266 267 268 269 300 295
Marshall Field’s 64 64 63 65 65 64
Total stores 1,307 1,243 1,182 1,130 1,101 1,029
Total retail square footage (thousands):
Target 112,604 102,945 94,553 87,158 79,360 71,108
Mervyn’s 21,555 21,635 21,729 21,810 24,518 24,113
Marshall Field’s 14,174 14,060 13,890 14,090 14,111 13,870
Total retail square footage 148,333 138,640 130,172 123,058 117,989 109,091
(a) Consisted of 53 weeks.
(b) Earnings per share, dividends per share and common shares outstanding reflect our 2000 and 1998 two-for-one common share splits and our
1996 three-for-one common share split.
(c) Extraordinary charges, net of tax, related to the purchase and redemption of debt were less than $1 million (less than $.01 per share) in 2000, $41
million ($.04 per share) in 1999, $27 million ($.03 per share) in 1998, $51 million ($.05 per share) in 1997 and $11 million ($.01 per share) in 1996.
(d) 1999 includes a mainframe outsourcing pre-tax charge of $5 million (less than $.01 per share). 1998 included a mainframe outsourcing pre-tax
charge of $42 million ($.03 per share) and the beneficial effect of $20 million ($.02 per share) of the favorable outcome of our inventory shortage
tax matter. 1996 included a real estate repositioning pre-tax charge of $134 million ($.09 per share).
(e) 1998 included a $3 million pre-tax net loss (less than $.01 per share) related to securitization maturity and sale transactions. 1997 included a $45
million pre-tax gain ($.03 per share) related to securitization sale transactions.
The Summary Financial and Operating Data should be read in conjunction with the Notes to Consolidated Financial Statements throughout
pages 24-36.
s u m m a r y f i n a n c i a l a n d o p e r a t i n g d a t a ( u n a u d i t e d )
38 | 39
Report of Independent Auditors
Board of Directors and Shareholders
Target Corporation
We have audited the accompanying consolidated statements
of financial position of Target Corporation and subsidiaries as of
February 3, 2001 and January 29, 2000 and the related consolidated
results of operations, cash flows and shareholders’ investment for
each of the three years in the period ended February 3, 2001. These
financial statements are the responsibility of the Corporation’s
management. Our responsibility is to express an opinion on these
financial statements based on our audits.
We conducted our audits in accordance with auditing
standards generally accepted in the United States. Those standards
require that we plan and perform the audit to obtain reasonable
assurance about whether the financial statements are free of material
misstatement. An audit includes examining, on a test basis, evidence
supporting the amounts and disclosures in the financial statements.
An audit also includes assessing the accounting principles used and
significant estimates made by management, as well as evaluating
the overall financial statement presentation. We believe that our
audits provide a reasonable basis for our opinion.
In our opinion, the financial statements referred to above
present fairly, in all material respects, the consolidated financial
position of Target Corporation and subsidiaries at February 3, 2001
and January 29, 2000 and the consolidated results of their operations
and their cash flows for each of the three years in the period ended
February 3, 2001 in conformity with accounting principles generally
accepted in the United States.
Minneapolis, Minnesota
March 5, 2001
Report of Management
Management is responsible for the consistency, integrity and
presentation of the information in the Annual Report. The
consolidated financial statements and other information presented
in this Annual Report have been prepared in accordance with
accounting principles generally accepted in the United States and
include necessary judgments and estimates by management.
To fulfill our responsibility, we maintain comprehensive
systems of internal control designed to provide reasonable assurance
that assets are safeguarded and transactions are executed in
accordance with established procedures. The concept of reasonable
assurance is based upon a recognition that the cost of the controls
should not exceed the benefit derived. We believe our systems of
internal control provide this reasonable assurance.
The Board of Directors exercises its oversight role with respect
to the Corporation’s systems of internal control primarily through
its Audit Committee, which is comprised of five independent
directors. The Committee oversees the Corporation’s systems of
internal control, accounting practices, financial reporting and audits
to assess whether their quality, integrity and objectivity are sufficient
to protect shareholders’ investments. The Committee’s report
appears on this page.
In addition, our consolidated financial statements have been
audited by Ernst & Young LLP, independent auditors, whose report
also appears on this page. As a part of its audit, Ernst & Young LLP
develops and maintains an understanding of the Corporation’s
internal accounting controls and conducts such tests and employs
such procedures as it considers necessary to render its opinion on
the consolidated financial statements. Their report expresses an
opinion as to the fair presentation, in all material respects, of the
consolidated financial statements and is based on independent audits
made in accordance with auditing standards generally accepted in
the United States.
Robert J. Ulrich Douglas A. Scovanner
Chairman of the Board and Executive Vice President and
Chief Executive Officer Chief Financial Officer
March 5, 2001
Report of Audit Committee
The Audit Committee met two times during fiscal 2000 to
review the overall audit scope, plans for internal and independent
audits, the Corporation’s systems of internal control, emerging
accounting issues, audit fees and benefit plans. The Committee also
met individually with the independent auditors, without manage-
ment present, to discuss the results of their audits. The Committee
encourages the internal and independent auditors to communicate
closely with the Committee.
Audit Committee results were reported to the full Board of
Directors and the Corporation’s annual financial statements were
reviewed and approved by the Board of Directors before issuance.
The Audit Committee also recommended to the Board of Directors
that the independent auditors be reappointed for fiscal 2001, subject
to the approval of the shareholders at the annual meeting.
March 5, 2001
d i r e c t o r s a n d m a n a g e m e n t
Livio D. DeSimoneRetired Chairman and Chief Executive Officer, 3M 1, 5, 6
Roger A. EnricoChairman and Chief Executive Officer,PepsiCo, Inc. 1, 2, 3
William W. GeorgeChairman and Chief Executive Officer,Medtronic, Inc. 1, 2, 4
Michele J. HooperFormer Chief ExecutiveOfficer and President, Voyager Expanded Learning1, 2, 6
James A. JohnsonChairman and Chief Executive Officer,Johnson Capital Partners1, 3, 4, 5
Richard M. KovacevichPresident and Chief Executive Officer,Wells Fargo & Co. 1, 2, 6
Anne M. MulcahyPresident and Chief Operating Officer,Xerox Corporation 1, 4, 5
Stephen W. SangerChairman and Chief Executive Officer,General Mills, Inc.1, 3, 5, 6
George W. TamkePartner,Clayton, Dubilier & Rice1, 3
Solomon D. TrujilloChairman, President and Chief Executive Officer,graviton, Inc. 1, 3, 4, 5
Robert J. UlrichChairman and Chief Executive Officer,Target Corporation andTarget Stores 1
1 Executive Committee
2 Audit Committee
3 Compensation Committee
4 Corporate ResponsibilityCommittee
5 Finance Committee
6 Nominating Committee
Linda L. AhlersPresident, Marshall Field’s
Todd V. BlackwellSenior Vice President,Human Resources
Bart ButzerPresident, Mervyn’s
Michael R. FrancisSenior Vice President,Marketing
John D. GriffithSenior Vice President,Property Development
James T. HaleExecutive Vice President,General Counsel and Corporate Secretary
Maureen W. KyerSenior Vice President,Merchandising, Mervyn’s
Douglas A. ScovannerExecutive Vice Presidentand Chief Financial Officer
Paul L. SingerSenior Vice Presidentand Chief Information Officer
Gregg W. SteinhafelPresident, Target Stores
Gerald L. StorchVice Chairman
Ertugrul TuzcuExecutive Vice President,Store Operations, Marshall Field’s
Robert J. UlrichChairman and Chief Executive Officer
Gail J. DornVice President, Community Relations
Nathan K. GarvisVice President, Government Affairs
Susan D. KahnVice President, Investor Relations
Tracy KofskiVice President,Compensation & Benefits
Stephen C. KowalkeVice President andTreasurer
Richard J. KuzmichPresident, AssociatedMerchandising Corp.
Dale NitschkePresident, target.direct
Ronald A. PrillPresident, Target FinancialServices
Jack N. ReifAssistant Treasurer
Sara J. RossAssistant Treasurer
Erica C. StreetPresident, Target Brands, Inc.
Jane P. WindmeierSenior Vice President,Finance
Directors Executive Officers Other Officers
40 | 41
s h a r e h o l d e r i n f o r m a t i o n
Annual Meeting
The Annual Meeting of Shareholders is scheduled for
May 23, 2001, at 9:30 a.m. CDT at The Children’s Theatre,
2400 Third Avenue South, Minneapolis, Minnesota.
Shareholder Information
Quarterly and annual shareholder information,
including the Form 10-Q and Form 10-K Annual Report,
which are filed with the Securities and Exchange
Commission, is available at no charge to shareholders. To
obtain copies of these materials, you may call 612-370-6736,
send an email to [email protected], or write
to: Vice President, Investor Relations, Target Corporation,
777 Nicollet Mall, Minneapolis, Minnesota 55402.
Information about Target Corporation is also available
on the Internet at www.target.com.
Sales Information
Comments regarding the company’s sales results are
provided periodically throughout the year on a recorded
telephone message. You may access this message by calling
612-370-6500.
Direct Stock Purchase/Dividend Reinvestment Plan
First Chicago Trust Company of New York, a division
of Equiserve, administers a direct service investment plan
that allows interested investors to purchase Target
Corporation stock directly, rather than through a broker,
and become a registered shareholder of the Company. The
program offers many features including dividend
reinvestment. For detailed information regarding this
program, call First Chicago Trust toll free at 1-888-268-0203
or write to:
The DirectSERVICE Investment Program
c/o First Chicago Trust Company
P.O. Box 2598
Jersey City, NJ 07303-2598
Transfer Agent, Registrar and Dividend Disbursing Agent
First Chicago Trust Company of New York, a division
of Equiserve
Trustee, Employee Savings 401(k) and Pension Plans
State Street Bank and Trust Company
Stock Exchange Listings
Trading symbol TGT
New York Stock Exchange and Pacific Stock Exchange
Shareholder Assistance
For assistance regarding individual stock records, lost
certificates, name or address changes, dividend or tax
questions, call First Chicago Trust at 1-800-317-4445, access
their website at www.equiserve.com, or write to: First
Chicago Trust Company of New York, a division of
EquiServe, P.O. Box 2500, Jersey City, NJ 07303.
Co
nc
ep
t a
nd
de
sig
n:
Lit
tle
& C
om
pa
ny,
Min
ne
ap
oli
s
Target, the Bullseye Design, SuperTarget, target.com, Target Guest Card, Marshall Field's, Dayton's, Hudson's, Project Imagine, Archer Farms, Lullaby Club, Club Wedd and Take Charge of Education are trademarks of Target Brands, Inc. Mervyn's, High Sierra, Sprockets and Hillard & Hanson are trademarks ofMervyn's Brands, Inc. Krispy Kreme is a trademark of HDN Development Corporation, Starbucks is a trademark of Starbucks U.S. Brands Corporation, Fannie Mayis a trademark of Archibald Candy Corporation, La Brea is a trademark of La Brea Bakery, Mossimo is a trademark of Mossimo, Inc., Waverly is a trademark ofF. Schumacher & Co., Baby Tykes is a trademark of William Carter Company, Eddie Bauer is a trademark of Eddie Bauer, Inc., Nike is a trademark of Nike, Inc.,Gloria Vanderbilt is a trademark of Gloria Vanderbilt Trademark, B.V., Villager is a trademark of L.C. Licensing, Inc., Jones New York is a trademark ofJones Investment Co., Inc., E*Trade is a trademark of E*Trade Securities, Inc., America Online is a trademark of America Online, Inc., Philips is a trademark of Philips Electronics N.V., VISA is a trademark of Visa International Service Association.

777 Nicollet Mall, Minneapolis, Minnesota 55402, 612.370.6948, www.target.comTarget • Marshall Field’s • Mervyn’s • AMC • target.direct • DCI •Target Financial Services
©2001 Target C
orporation. The Bullseye D
esign is a registeredtradem
ark of Target Brands, Inc. A
ll rights reserved.