target practice: monetary policy implementation in a post
TRANSCRIPT

Target practice: Monetary policy implementation in a
post-crisis environment∗
Elizabeth Klee and Viktors Stebunovs†
April 2013
Abstract
Traditionally, the Federal Reserve targeted the federal funds rate, expecting this rate to
transmit a monetary policy stance to other short-term and longer-term rates. However, at the
height of the financial crisis, the pass-through from the federal funds rate to other short-term
rates deteriorated. Furthermore, market participants reportedly anticipate that the inception
of liquidity requirements might weaken the federal funds market and therefore its linkages with
other money markets. At the same time, however, most anticipate that high quality collateral
repo markets should remain active. We argue that, in principle, instead of the federal funds
rate, the Federal Reserve can target the Treasury General Collateral repurchase agreement
rate, and explore the Federal Reserve’s capacity to do so empirically. Our results suggest that
a target repo rate might be an alternative policy tool to the target federal funds rate in the
post-crisis environment.
Keywords: target federal funds rate, Treasury general collateral repo rate, liquidity cov-
erage requirements, liquidity effect, monetary policy implementation framework, open market
operations, M3.
∗Very preliminary. Do not cite or quote without permission. The views expressed in this paper are solely theresponsibility of the authors and should not be interpreted as reflecting the views of the Board of Governors of theFederal Reserve System or of anyone else associated with the Federal Reserve System.
†We thank the discussant, Gabriel Perez Quiro, and the participants of the ECB workshop “The post-crisisdesign of the operational framework for the implementation of monetary policy”, the discussant, Tobias Adrian, andthe participants at the 2013 Federal Reserve ”Day-Ahead” Conference on Financial Markets and Institutions, andseminar participants at the Swiss National Bank and the Office of Financial Research for helpful comments. We alsothank Refet Gurkaynak and Jonathan Wright for helpful conversations. Win Monroe and Brett Schulte providedexpert research assistance. Viktors Stebunovs thanks the Office of Financial Stability and Policy Research for itshospitality. Contact information: Elizabeth Klee, Division of Monetary Affairs, [email protected]; and ViktorsStebunovs, Division of International Finance, [email protected]; Federal Reserve Board, 20th and C StreetsNW, Washington, DC 20551.
1

1 Introduction
Traditionally, the Federal Open Market Committee (FOMC) targeted the federal funds rate, ex-
pecting this rate to transmit its monetary policy stance to other short-term and longer-term rates.
However, at the height of the recent financial crisis, the pass-through from the federal funds rate to
other short-term rates deteriorated as the zero lower bound set in and money markets underwent
structural changes. Furthermore, market participants anticipate that the inception of regula-
tory liquidity requirements will undermine selected unsecured money markets and their linkages
by discouraging short-term financing among banks. Going forward, with the federal funds market
potentially experiencing encumbrances, if the Federal Reserve wishes to implement monetary policy
by targeting a money market rate, is there a viable alternative to the target federal funds rate?
We argue that, instead of the federal funds rate or term money market rates, the Federal Reserve
can target the overnight Treasury General Collateral (GC) repurchase agreement (repo) rate. The
Treasury GC repo market is a secured, multi-trillion dollar money market with a much wider set of
participants than in the federal funds market, including depository institutions (“banks”), primary
dealers, investment banks, central banks, insurance companies, industrial companies, municipalities,
pension funds, hedge funds, and mutual funds.1 Moreover, the size of the System Open Market
Account (SOMA) portfolio of Treasury securities relative to the repo market is substantial, and so
in principle, the Federal Reserve can put significant upward pressure on the repo rate if needed.
Hence, by targeting the repo rate, the Federal Reserve can affect the cost of funding (or the rate of
return) for various institution types, strengthening the cost channel of monetary policy transmission,
as well as be liquidity source to a broad set of financial institutions.2
We perform several empirical exercises to support our conjecture that the repo rate might be
a more feasible target rate in a post-crisis environment. First, we document that the size of
the Federal Reserve’s portfolio of Treasury securities is comparable to that of the triparty repo
market, suggesting that the Federal Reserve can potentially drain the entire repo market liquidity
by ”repoing out” its portfolio. We also show that in the past, there was a reasonably predictable
high-frequency demand schedule for Treasury general collateral repo that, in particular, suggests
a daily “liquidity effect,” or a price response to a change in the quantity of collateral. We argue
that consequently, there is potential for monetary policy implementation on a daily basis. Second,
1We use the colloquial term “banks” to mean the more accurate term depository institutions.”2The financial crisis also demonstrated that a broader set of financial institutions, rather than just banks, required
access to a liquidity source, such as the Federal Reserve. As such, the Federal Reserve established several facilitiesto provide liquidity to borrowers and investors in key credit markets, such as the Primary Dealer Credit Facility, theTerm Securities Lending Facility, and the Term Asset-Backed Securities Loan Facility. These facilities alleviatedmarket strains, as shown in [Fleming et al. (2010)]. In addition, institutions still may have counterparty credit riskconcerns at the forefront of concern, and looming liquidity regulations may restrict funding flexibility for moneymarket participants. To alleviate these, one option might be to target money market rates for loans with maturityof over 30 days, which would comply with the regulation. But this setup might be unnecessarily complex, possiblyrequiring retirement of these loans once their remaining maturity reaches 30 days (to satisfy the liquidity coveragerequirements), and suffer from pronounced anticipation effects way ahead of the target rate change days.
2
we show the existence of a limited liquidity effect at lower frequencies, using M3 data. This result
points to a relationship between the amount of repo “money” – defined as outstanding repurchase
agreement transactions – and interest rates. And third, we show that while there is evidence
of a diminished transmission mechanism from the federal funds rate to longer-term interest rates,
transmission from repo has remained relatively more intact. This exercise relies on a series of tests
of the expectations hypothesis involving the federal funds and Treasury GC repo rates.
The paper proceeds as follows. Section 2 provides background on key overnight funding markets,
both secured and unsecured. It also discusses the potential impact of liquidity requirements on
these markets as well as monetary policy implementation regimes in areas other than the U.S.
Section 3 describes the empirical framework and reports the estimation results for the short-run
liquidity effect. It also characterizes the implications of targeting the repo rate for balance sheet
of depository institutions and provides back-of-the envelope calculations for upward pressure the
Federal Reserve can put on the repo rate through large-scale reverse repos. Section 4 gives evidence
of a longer-term liquidity effect in the repo market. Section 5 reports some simple results of
transmission of monetary policy across the yield curve. Section 6 concludes.
2 Background
This section reviews basic facts on the repo market and the federal funds market, the potential effects
of liquidity requirements on these markets, and monetary policy implementation under different
regimes. We discuss each in turn.
2.1 The repo and federal funds markets
2.1.1 Repurchase agreements
A repurchase agreement is a sale of a security coupled with an agreement to repurchase the security
at a specified price at a later date. It is economically similar to a collateralized loan, where the
lender of cash receives securities as collateral, and the borrower pays the lender interest on the
overnight loan the following day. From the perspective of the borrower of cash, the transaction is
called a “repo,” and from the perspective of the lender of cash, it is a “reverse repo.”3 If the rate
on a repurchase agreement is low relative to other market rates, it indicates a relative abundance
of cash and shortage of collateral, and as a result, the borrower does not have to pay much interest
for using the funds overnight. By contrast, if the rate on a repurchase agreement is relatively high,
3There is a quirk in nomenclature when discussing the repo market and the Federal Reserve. For the FederalReserve, repos are defined by the effect on the counterparty. Therefore, if the Federal Reserve lends securities andborrows cash, it is called a reverse repo, and if the Federal Reserve lends cash and borrows securities, it is called arepo.
3

it signals a relative abundance of collateral and shortage of cash, and the borrower has to pay a
higher interest rate in order to obtain funds.
Data on aggregate repo market activity is not generally available.4 However, there are a few
sources of information on repo market volume that can help to characterize its size. One source
is statistics compiled by the Federal Reserve Bank of New York (FRBNY) on the triparty repo
market. In a triparty repo transaction, there is a custodial bank that acts as agent for buyer and
seller in the transaction. The triparty repo market represents a substantial share of the total repo
market, but not the entire market. As displayed in figure 1, the triparty market peaked near $3
trillion in 2007, and has since settled around $1.75 trillion.
Another source is statistics compiled by FRBNY on repurchase agreements conducted by the
primary dealers, which are the banks and broker-dealers that trade directly with the Open Market
Desk (the “Desk”) at FRBNY for the purposes of open market operations.5 As shown in figure
2, within the primary dealer community, total repurchase agreement market volume in Treasury
securities averaged about $50 billion in 1994, and then started to climb steadily through the 2000s,
peaking at a little below $200 billion. Interestingly, the volume of repos brokers executed outside
of the primary dealer community more than quadrupled in 10 years, while the volume within the
community only doubled. At the onset of the crisis, repo market volume climbed even higher, but
then backed down to pre-crisis levels near the end of 2009 and the start of 2010.
2.1.2 Federal funds
Federal funds are unsecured loans of reserve balances at Federal Reserve banks that account holders
at the Federal Reserve make to one another. The rate at which these transactions occur is called
the federal funds rate and the market in which these transactions occur is the federal funds market.
In many ways, the federal funds market is similar to the repo market, in that they are both used
as short-term funding markets, have overlapping participants, and are generally very liquid. But,
there are important differences. Traditionally, the federal funds market was used by banks to buy
funds in order to satisfy reserve requirements, or to sell funds in excess of those requirements. Banks
satisfy reserve requirements on the basis of average balances held over a 14 day period, and previous
research shows that funds rate behavior differed according to the day of the maintenance period.6
Moreover, this research also provided evidence of a short-term “liquidity effect,” or a price response
to changes in the level of reserve balances. In addition, participation in the federal funds market
is more restricted than the repo market in its participants; it is limited to banks, government-
sponsored enterprises (GSEs) and selected other entities. This has the important implication that
while all financial institutions are theoretically able to participate in the repo market, the federal
4Some market observers attempt to estimate the size of the repo market; refer to [Gorton (2010)], for example.5The broker-dealer volume reported here includes both direct trades and triparty trades.6For example, refer to [Hamilton (1996)], [Carpenter and Demiralp (2006a)], and [Judson and Klee (2010)].
4

funds market is restricted only to selected institution types, which could temper opportunities for
arbitrage across markets.
Even though the federal funds market has traditionally been very important for monetary policy
implementation, the market is quite small and by many measures, federal funds market volume is
much lower than repo market volume. Moreover, federal funds volume has dropped considerably
since the start of the financial crisis. For example, figure 3 plots federal funds transactions identified
in the Fedwire data.7 Indexing this series to its level at the beginning of 2000, federal funds volume
nearly doubled before the start of the financial crisis, before falling to near its value at the start of
2000 in the second quarter of 2012. For reference, federal funds volume growth generally outpaced
that of nominal GDP before the crisis, but backed down considerably since then. The decline in
federal funds volume could be associated with the large volume of reserves outstanding emerging
from the crisis, diminishing the possibility that institutions would be short on reserves. In addition,
the introduction of interest on reserves may have also dampened the need for institutions to lend
excess cash, as these institutions would still earn interest on excess balances left at the Federal
Reserve.
2.1.3 Comparing the two money markets
These observations regarding the size of the federal funds market relative to the size of the repo
market suggest that the funds market is quite a bit smaller than the repo market. Indeed, these
data are consistent with data from the Call reports, which suggest that commercial bank federal
funds market volume is only a small share of total repo market volume, and that commercial
banks’ federal funds market activity is smaller than the repo market activity. As shown in figure
4, federal funds sold peaked at around $250 billion near the start of the financial crisis, and then
dropped to less than half that volume by March 2010. As a percentage of assets, federal funds
peaked much earlier, in 2003. Notably, federal funds purchased generally exceeds federal funds
sold, indicating that commercial banks are net buyers of funds.8 Moreover, while federal funds
sold stayed relatively steady from 2002 to 2007, securities purchased to resell, or reverse repos, rose
at a moderate pace, and then began to rise rapidly through the end of 2008. Repos, or securities
sold to be repurchased, peaked noticeably earlier than reverse repos, and at a higher level. Still,
7The data on federal funds volume are constructed using proprietary transaction-level data from the FedwireFunds Service, using an algorithm pioneered by [Furfine (1999)] to match and form plausible overnight fundingtransactions, likely related to the federal funds market. The algorithm matches an outgoing Fedwire funds transfersent from one account and received by another with a corresponding incoming transfer on the next business daysent by the previous day’s receiver and received by the previous day’s sender. This pair of transfers is considered afederal funds transaction if the amount of the incoming transfer is equal to the amount of the outgoing transfer plusinterest at a rate consistent with the rates reported by major federal funds brokers. However, because we have noindependent way to verify if these are actual federal funds transactions, our identified trades and characteristics ofthese trades are subject to error.
8Commercial banks can purchase funds from other institutions in the federal funds market, including thriftinstitutions, foreign institutions, and government-sponsored enterprises (GSEs).
5

for a majority of the sample period, commercial banks had more of their balance sheets in repos
than in federal funds, and consequently, were a more prominent share of the portfolio.
Even though the volumes in these markets are quite different and there is imperfect overlap
between the two markets, over much of the past decade or so, these rates have moved together quite
closely. Consistent with earlier evidence discussed in [Happ (1986)] and [Griffiths and Winters (1997)],
figure 5 plots the spread between the federal funds rate and the repo rate from 2002 to 2010. As is
evident from the figure, these rates were similar up until 2007. Because federal funds transactions
are unsecured while repo transactions are secured, the repo rate is usually a bit below federal funds.
Spreads started to widen in the beginning of the financial crisis, from August 2007 onward, and
then skyrocketed during the crisis as investors flocked to the relative safety of secured overnight
lending in repo.
2.2 Monetary policy implementation
There is a special connection between the federal funds market and the repo market for Federal
Reserve monetary policy implementation. In the textbook version of monetary policy implemen-
tation, the Federal Reserve buys securities from dealers in the repo market, which gives the dealers
cash which they deposit in their bank’s accounts, and the banks then proceed to sell the funds
in the federal funds market. By sizing this “open market operation” appropriately, the Federal
Reserve could ensure that the federal funds rate – the policy rate – was close to the target set by
the FOMC.
This operating procedure and target interest rate worked for many years. Repo rates and
federal funds rates traded in line with each other, and longer-term interest rates moved up and
down with the federal funds rate. According to [Simmons (1954)] , repurchase agreements were
used as part of the Federal Reserve System’s operations since 1917. In addition, as documented
by [Friedman and Schwartz (1963)], as early as the 1920s, open market operations were part of
the Federal Reserve’s preferred operating procedure. Still, as described by [Meulendyke (1998)],
use of temporary open market operations was limited until after the Treasury Accord in 1951.
Furthermore, before the FOMC started announcing an explicit target federal funds rate, market
participants would gauge any changes to the target federal funds rate by observing the sizes of the
open market operations immediately following an FOMC meeting. Although market participants
arguably stopped looking to repos for a signal regarding the stance of policy once target announce-
ments began, open market operations remained an important tool, as the Desk used repos almost
daily to adjust the level of reserves so that federal funds would trade close to the target federal
funds rate.
Monetary policy implementation changed with the recent financial crisis, although not all at
once. At the start of the crisis in August 2007, the Federal Reserve relied on larger-than-normal
6

repo operations to inject liquidity into the federal funds market. Later, in the fall of 2008, the
Federal Reserve conducted reverse repos in order to drain reserves from the system as well as to add
some collateral back to the market. However, because reserve balances were elevated, the effective
federal funds rate traded well below the target rate. In addition to the reverse repos, the Federal
Reserve also conducted 28-day single-tranche repos in which dealers pledged agency MBS collateral.
These provided dealers with financing for agency MBS when the spread between one month agency
MBS repo and one-month Treasury general collateral repo was particularly wide.9 Although regular
repo activity by the Desk ceased in the early part of 2009, more recently, the Desk has conducted
a series of small value reverse repurchase agreements with a broad set of counterparties as part of
its operational readiness program for tools to use in the future to drain reserve balances.10
Given the Federal Reserve’s history, it seems like it would be a major change to target the
repo rate instead of the federal funds rate. But, this development, were it to occur, would not
be a radical shift in monetary policy implementation more generally. For example, the Central
Bank of Brazil explicitly targets a rate on overnight transactions collateralized by securities issued
by the central bank (the Sistema Especial de Liquidao e de Custdia (SELIC) rate) in the market
with a wide range of participants including commercial banks, universal banks, investment banks,
savings banks, dealers and brokers, mutual investment funds, etc. However, as shown in table 1,
the practice of targeting an explicit rate, be it either secured or unsecured, is not widespread among
advanced foreign economies. In contrast to the Federal Reserve approach, other central banks tend
to target money market rates in a more general way. In order to measure their success at reaching
a particular target, central banks often consider one or more indicative rates, predominantly on
unsecured overnight interbank loans. The only exception to this practice appears to the choice
of indicator rates in Canada, where the central bank looks at both the overnight money market
financing rate and (to a lesser extent) the Canadian Overnight Repo Rate Average (CORRA).
2.3 Potential impact of liquidity coverage ratios on the repo and federal
funds markets
Most of our discussion so far has been focused on the characteristics of the repo and federal funds
markets in the past and present; a future development may impact these markets as well. In
response to the global financial crisis, the Basel Committee on Banking Supervision introduced the
Liquidity Coverage Ratio (LCR), which is intended to measure the amount of liquid assets that
are available (the numerator of the LCR formula) to meet the potential outflow of funding over a
30-day period (the denominator).11 Compliance with the LCR is achieved by maintaining a greater
pool of liquid assets than net outflows of cash (a ratio of 100 percent or greater).
9For details, refer to [Federal Reserve Bank of New York (2009)].10Refer to http://www.newyorkfed.org/markets/rrp_op_policies.html for details.11BCBS “International Framework for Liquidity Risk Measurement, Standards and Monitoring”, December 2010.
7

Per the LCR rules, reserve balances of depository institutions at the Federal Reserve and (unen-
cumbered) U.S. Treasury securities are equivalent in the LCR numerator. The numerator consists
of narrowly-defined “Level 1” and “Level 2” unencumbered assets that are more likely to generate
funds without incurring deep discounts due to fire sales, even in times of acute stress. While Level
1 assets count at 100 percent of their value in the LCR, the contribution of Level 2 assets is set at
85 percent. Level 1 assets include such assets as cash, debt securities rated AA- or higher issued by
foreign or domestic sovereigns, foreign or domestic central banks, and central bank reserves. Level
2 assets include such assets as agency debt and mortgage-backed securities. Although reserve
balances and (unencumbered) U.S. Treasury securities function similarly in the LCR numerator,
carrying Treasury securities on banks’ balance sheets appears to be more advantageous than carry-
ing reserve balances, as Treasury securities can be used as collateral in other types of transactions,
while lending reserve balances is an unsecured transaction.
The unsecured nature of federal funds lending vis a vis Treasury securities lending is particularly
important in the calculation of the denominator of the LCR. The denominator corresponds to a
stressed net cash outflow scenario over a 30-day period, incorporating idiosyncratic and market-
wide shocks, such as, for example, credit rating downgrades and loss of funding. The cash outflows
are simulated by multiplying the amount of balance sheet LCR-eligible liabilities by specific run-off
factors. In particular, federal funds borrowings fall under unsecured wholesale funding due to
financial institutions and have a 100 percent run-off rate.12 In contrast, borrowing of U.S. Trea-
sury securities has a zero percent runoff rate. As a result, repo market counts more favorably in
the LCR denominator than borrowing in the federal funds market. Consistently, market partic-
ipants reportedly anticipate that the federal funds and other unsecured money markets might be
undermined significantly by the inception of the LCR.
In an appendix available upon request, we work out in several examples the impact of (reverse)
repos conducted by the Federal Reserve with depository institutions and extended counterparties
(mutual funds and GSEs) on regulatory metrics of depository institutions. Overall, in the target
repo rate environment, banks face volatile balance sheets and leverage ratios but stable risk-weighted
capital ratios. In addition, cash-adding repos by the Federal Reserve tend to worsen the LCR
standing of banks, while cash-draining Fed repos tend to improve it.
3 The short-run liquidity effect
In this section, we explore the existence of a short-run liquidity effect in the repurchase agreement
market. First, we show that, analogous to the Fed’s ability to control the federal funds rate via
the adjustment in the level of reserve balances, because the Federal Reserve has a large portfolio
12Operational deposits generated by clearing, custody and cash management activities are subject to a 25 percentrun-off rate.
8

of Treasury securities relative to the repo market, the Federal Reserve has a credible position
in its ability to sway market rates in one direction or another. Second, similar to research by
[Lou, Yan, and Zhang (2011)] on the (primary) Treasury market, we find that there is a persistent
liquidity effect in the (derivative) repo market.
3.1 Preliminaries: The credibility of the Federal Reserve’s target repo
rate
By analogy with the implementation of the federal funds target rate, the key prerequisite for the
proposed monetary policy implementation framework is the credibility of the Federal Reserve’s
target repo rate.13 For example, the Federal Reserve, the ultimate supplier of reserve balances in
charge of setting reserve requirements, can impose a structural reserves deficiency on the banking
system, and support any level of the federal funds target rate. This setup is credible to such an
extent that trades at an anticipated federal funds target rate occur even before a FOMC announce-
ment of the new target, that is, before the Desk at FRBNY implements the new target.14 So, the
question is whether the Federal Reserve’s target repo rate could command similar credibility.
To that end, comparing the size of the System Open Market Account portfolio (that includes of
Treasury securities, agency debt, and agency MBS) to that of the triparty repo market is instructive.
As figure 1 shows, the sizes of the Federal Reserve’s of Treasury securities portfolio on its own and
of the triparty repo market are comparable, around $1.6-1.75 trillion as of early 2012, indicating
that, in principle, the Federal Reserve can drain the repo market out of liquidity entirely (through
large-scale reverse repos), hence putting significant upward pressure on the repo rate.15 If the needs
might arise to supply rather than drain liquidity, the Federal Reserve can add as much liquidity to
the market as market participants can absorb given their collateral. The capacity to drain or add
sizable liquidity volumes should reinforce the credibility of the Federal Reserve to target any level
of the Treasury GC rate.
Having argued that the repo market might be a viable alternative to the federal funds market
for monetary policy implementation, we turn to the question whether a stable short-run liquidity
effect is present in the Treasury general collateral repo market. This liquidity effect is what might
13 We are well aware of the Lucas critique–that it is naive to try to predict the effects of a change in economicpolicy entirely on the basis of relationships observed in historical data, especially highly aggregated historical data.In fact, we acknowledge that our work is subject to the Lucas critique. We do not rule out the possibility that a mereannouncement that the Federal Reserve might target the repo rate will change the way the repo market functions.
14There is ample literature on the anticipation effects in the federal funds market, see for example,[Carpenter and Demiralp (2006b)].
15If the size of the SOMA holdings of Treasury securities (possibly of a particular security type) is not sufficient toconduct a reverse repo of a desired size, the Federal Reserve can increase the size of its portfolio through permanentopen market operations. Of note, high frequency data for the size of the triparty repo market is not available forthe 2002-2008 period; for those years, we interpolated the available low frequency observations. The ratio of theSOMA Treasury securities holdings to the triparty repo market size reached a low of 40 percent when the FederalReserve shrank its portfolio in order to partially sterilize the credit and liquidity facilities, but, more recently, theratio has been closer to one.
9

allow the Federal Reserve to target a particular level of the Treasury general collateral repo rate,
offsetting shocks to either supply or demand for repos.
In theory, the liquidity effect is a negative relationship between a money measure and an interest
rate: there exits a demand curve for some type of money that depends negatively on an interest
rate and the liquidity effect refers to the slope of this demand curve. In practice, methodologies
and evidence of the liquidity effect are mixed. In lower frequency data, there is often a lack of
correlation between monetary aggregates and interest rates. By contrast, in high frequency data,
[Hamilton (1997)] and others find a significant liquidity effect.
In a traditional liquidity effect estimation framework, the demand for reserve balances is usually
posited as a (possibly nonlinear) function:
Dt = F (fft, St, Zt) + et
where fft is the federal funds rate, St is an exogenous shifter of cash supply (or its corollary–
collateral supply) and Zt is a set of controls. The empirical specification, however, usually focuses
on a change in the interest rate as a function of an exogenous change in the quantity of money.
On a daily frequency, [Hamilton (1997)] used the “forecast miss” in the level of the Treasury’s
General Account at the Federal Reserve to identify the quantity of reserve balances outstanding.
Later research, including [Carpenter and Demiralp (2006a)] extended the sample and broadened
the definition of the forecast miss and found liquidity effects of varying degrees. In many of these
studies, the error term, et, is specified as a GARCH process to control for heteroscedasticity in the
error-generating process.
We examine the repo market liquidity effects using three measures of St, the exogenous shifter
of cash supply: total net Treasury issuance, net Treasury bill issuance, and net Treasury coupon
issuance. We divide the analysis for a few reasons. First, although Treasury bills are reportedly
one of the most liquid forms of collateral, given the current skewed composition of the Federal
Reserve’s portfolio towards Treasury notes and bonds, we document the existence and significance
of the liquidity effects for each collateral type separately. Second, as described by [?], there may
be different ultimate holders of each collateral type. For example, dealers could be more likely
to purchase and hold cash management bills than other market participants, perhaps suggesting
a different demand function for bills than for coupon securities. And third, there may be some
”specialness” attached to selected issues of coupon securities that could also affect the demand for
those securities or close substitutes; coupon securities are generally more likely to be trading special
than bill securities.
10

3.2 Specification
Our tool of choice for evaluating the liquidity effect at a daily frequency is an error-correction model.
We posit that the repo rate and the target federal funds rate have the following relationship:
∆rrt = α (c+ βfftart−1) + Φrr(L)∆rrt +Φff (L)∆fftart +ΘZt + ΞSt + et (1)
where
• rrt is the repo rate; fftart is the target federal funds rate;
• c is a cointegrating constant (a proxy for credit risk); β is a cointegrating slope; α is a speed
of adjustment coefficient, Φ is a set of distributed lag coefficients;
• St is an exogenous shifter of cash/collateral supply such as net issuance of Treasury securities;
• et is an error term, possibly modeled with allowances for heteroscedasticity.
We include the target federal funds rate into the model to control for the intended level of money
market rates. We envisage that in the environment where the Federal Reserve targets the repo rate,
the credibility of the institution, the size of its portfolio of Treasury securities, and, ultimately, the
possibility of intervention if the repo rates deviates too much from its target will make the target
repo rate credible, ensuring that the repo rate follows the target over time. In that environment,
the cointegrating relationship will be between the market repo rate and its target.
In addition to the lagged values of the repo rate and the target federal funds rate, the other
variables included are factors that likely shift the demand schedule for repos on a daily basis. These
factors are captured in the Zt vector, with coefficients to be estimated, Θ. We specify Zt as
Zt = (repo market factorst, riskt)
where the two terms represent groups of variables that proxy for financial market risk measures (a
few are similar to those used in [Collin-Dufresne et al. (2001)], plus some factors that are specific
controls for the funds market and for the repo market.
The first group of factors includes factors related to the repo market, for example, a measure
of how heavily weighted primary dealers’ books are towards trades with other dealers versus with
non-dealers.16 This gives some idea of market concentration in the Treasury market. To address
market functioning, delivery fails in Treasury securities are included as an independent variable;
these are reported by primary dealers to the Federal Reserve Bank of New York on a weekly basis.
In addition, actions on the SOMA Treasury portfolio are added as controls, including the level of
16This variable is defined as transactions outside the dealer community as a share of total transactions. The datasource is the FR2004.
11

Treasury securities lent through the SOMA securities lending programs. Securities lending tends to
increase during times of market stress and for particular CUSIPs that are considered to be trading
on “special” in the market.
The second group controls for overall indications of financial risk. Over the estimation period,
market sentiment changed dramatically with the advent of the financial crisis. As a result, indicators
such as the Libor-OIS spread, and the monetary policy outlook – as proxied by the slope of the yield
curve (the 10-year Treasury rate less the 2-year Treasury rate) – generally reflected more negative
sentiment about the financial markets and the economy towards the second half of the sample.
We use net issuance of Treasury securities or net issuance of Treasury bills or net issuance of
Treasury coupon securities as an exogenous shifter of cash/collateral supply in the repo market.
The U.S. Treasury issues its securities according to a predetermined and well-publicized schedule.
The composition of Treasury security issuance is not dictated by the developments in the repo
market, and, to a large extent, it is guided by the financing needs of the Federal government.
Reportedly, issuance of Treasury bills has a more profound effect on the repo market than that
of Treasury coupon securities, so to examine this suggestion formally we estimate models with
either bill or coupon issuance. Because repo rates experience pronounced movements on Treasury
issuance days, and these effects generally linger for a few days before and after the issuance, we
include net Treasury issuance, both contemporaneous and lagged by a day.
A casual observation of the repo rates indicates several periods with volatility clustering; in
addition, preliminary estimation results suggest that there exists heteroscedasticity of the residuals
for which controls are needed. As a result, in conjunction with the mean equation described above,
we also estimate a variance equation with GARCH components.
To estimate the error correction model with a GARCH error process, we employ a two-stage
estimation procedure similar to [Engle and Granger (1987)]. In the first stage, we test for coin-
tegration of the repo rate and the federal funds rate and construct the cointegrating term using
ordinary least squares. In the second stage, we estimate an error correction equation with a
GARCH/TARCH error term via maximum likelihood. Although it is possible that some efficiency
is lost using this procedure, it allows us to use a GARCH specification relatively easily in the second
stage estimation. We determine the number of lags to use in each specification as suggested by the
Schwarz Information Criterion (SIC) test.17 Furthermore, significance of all coefficients is reported
with respect to Bollerslev-Wooldridge robust standard errors.
Because we are interested in the stability of the demand schedule for repos over different time
periods, we estimate the error correction model over three samples: the benchmark period from
January 2002 to July 2007 and the crisis period from August 2007 to June 2009. Over the post-
17Although some tests occasionally reveal statistically significant autocorrelated lags further out, these are generallyten business days or more in the past. We try to balance a more parsimonious specification versus controlling for allof these lags, and moreover, we feel that movements more than two weeks previous are likely irrelevant once othercontrols are included in the specification.
12

crisis period from July 2009 to August 2012, the target federal funds rate stayed at the effective
lower bound of 0-25 basis points; as a result, there is no variation and identifying a cointegrating
relationship is not possible. For this period, we fit an autoregressive model with the same set
of controls and cash/collateral supply shifters and a GARCH error process as we use in the error
correction models.
3.3 Data description
The daily data used in this study are observations on the target federal funds rate and the overnight
Treasury general collateral repo rate from January 2, 2002 to March 29, 2013. The Treasury general
collateral repo rate is a collateral-weighted average of a survey of all primary dealers conducted daily
between 8:00 a.m. and 9:00 a.m.18 Over most of the sample period, the repo rate has a unit root,
as confirmed by a battery of Dickey-Fuller and Phillips-Perron tests. In previous work such as
[Bech, Klee and Stebunovs (forthcoming)], we established cointegrating relationships between the
effective federal funds rate and the repo rate. In the current work, we test for cointegration between
the target federal funds rate and the repo rate. Tests for the pre-crisis and crisis samples show
that the series are cointegrated; however, a test of this kind does not make as much sense for the
post-crisis period, as the target federal funds rate did not change during this time.
3.4 Results
Table 2 displays the estimated cointegrating relationship formulated in equation (1). In the bench-
mark period, the repo rate almost perfectly followed the target federal funds rate, with an estimated
β coefficient close to 1, and a constant term, or long-run average deviation of the Treasury GC repo
rate from the target federal funds rate, of less than one basis point. Consistent with this, the spec-
ification explains over 99 percent of the variation in the repo rate over time. By stark contrast,
in the August 2007 through June 2009 crisis period, the coefficient on the target federal funds rate
drops to 0.94, and the spread between the repo rate and the target rate widens to nearly 20 basis
points. The amount of variation in the repo rate explained by this specification drops about 9
percentage points, to 91 percent. Still, although the correlation between the target federal funds
rate and the repo rate deteriorated in the crisis, it did not fade away completely.
As described above, we construct the residuals from the results of the estimated equation re-
ported in table 2, and use the lag of the residual as an independent variable in the estimation
of equation (1). This, along with our proxies for Treasury market supply as well as controls for
market conditions more generally gives us our estimated liquidity effects, shown in table 3. Each
time period has three set of results, one for each of our exogenous shifters of cash/collateral supply
18The DTCC GCF Repo Index that became available on March 1, 2011, appears to track rather well the surveyrepo rate and the two series are highly correlated.
13

in the repo market: net issuance of all types of Treasury securities, net issuance of Treasury bills,
and net issuance of Treasury coupon securities. We model all three issuance groups because we are
interested in whether there is a liquidity effect from net issuance of Treasury securities in general,
but also, whether this effect is attributable to the issuance of Treasury bills or Treasury coupon
securities. In addition, we explore timing patterns of the liquidity effect. First and foremost, we
are interested in identifying a contemporaneous liquidity effect; however, we also want to investigate
how long liquidity effects might linger.
3.4.1 Benchmark: January 2002-August 2007
As shown in the left set of columns, in the benchmark period of normal times, the coefficient on
the cointegration term suggests that the half-life of a one unit disequilibrium in the relationship
between the repo rate and the target federal funds rate is between four and five days.19 This result
is in line with that reported in [Bech, Klee and Stebunovs (forthcoming)], which suggested that
disequilibria between the effective federal funds rate and the Treasury GC repo rate disappeared
relatively quickly, as both rates readjusted to reach equilibrium during normal times. In addition,
the negative coefficient on the autoregressive lags shown in the bottom rows of the table suggest that
there is some reversion to baseline in the Treasury GC repo series; the effects of positive changes
in the repo rate dissipate with time. Of course, in the case of the target federal funds rate and
the Treasury GC repo rate, the target rate moves infrequently, and therefore, all of the adjustment
occurs through the repo rate, perhaps slowing down the adjustment relative to the effective federal
funds rate, which may have moved along with the repo rate in reaction to similar factors.
Our key results concerning the liquidity effect are presented in the second line of the table. The
coefficient suggests a modest contemporaneous liquidity effect of 1 basis point per $50 billion of
net Treasury issuance. However, the models with net Treasury bill and coupon securities issuance
suggest that lingering effects might exist; the effect on the repo rate of $50 billion in net issuance
is about 1.5 basis points. On net, the pattern and magnitude of the liquidity effects identified
through net Treasury securities issuance reflect that of net Treasury coupon issuance, as evidenced
by the results reported in the next two columns. Our estimation results suggest that repo rates
soften with bill issuance, but firm considerably with coupon issuance. Much of the effect of coupon
issuance fades the next day, while rates tend to firm somewhat the day after bill issuance. Even
with some of these differences in patterns across asset types, the results point to a significant effect
of Treasury supply on the repo rate.
Turning next to indicators of market risk, neither changes in the Libor-OIS spread nor in the
slope of the Treasury yield curve appear to have much significant effect on changes in the repo
19As explained in [Bech, Klee and Stebunovs (forthcoming)], the half-life of a shock to the cointegrating relation-ship is the number of periods it takes for 50 percent of a one unit deviation from equilibrium to fade. This is solvedfor by simple recursive substitution using the coefficient α.
14

rate. As for the factors that control for repo market conditions, a larger share of Treasury repo
transactions by dealers tend to be associated with upward pressure on the repo rate. The intuition
behind this result could be that if dealers need to do a large number of transactions in repo, then
collateral is likely fairly plentiful, and cash relatively scarce, pushing up the repo rate.
The next three lines show the effect of changes in the target rate on the repo rate. The results
suggest both contemporaneous changes in the repo rate as well as anticipatory changes in the repo
rate as a result of changes in the target federal funds rate. Interestingly, there appears to have
been positive anticipatory changes in the repo rate, while on the actual day of the change, repo
rates actually softened a bit. This subsample period encompassed the “measured pace” tightening
cycle in domestic monetary policy. As documented by [Carpenter and Demiralp (2006b)] and
[Judson and Klee (2010)], there were notable anticipation effects in the federal funds market during
this period; as such, the repo rate may have also moved higher along with the funds rate in advance
of the actual firming of the target federal funds rate.
The error process for the repo rate exhibits marked heteroscedasticity as well as some significant
asymmetries. As indicated by the coefficient on the squared residual term, volatility tends to persist
in the repo market. In addition, as shown by the leverage term, a negative shock to the repo rate
is generally associated with increased volatility relative to a positive shock to the repo rate, largely
consistent with observations on leverage effects in other financial markets.
Finally, this specification explains a little under 25 percent of the variation in changes in the
Treasury GC repo rate over the sample period. While this is certainly not the plurality of variation
in the repo rate, this analysis does point to factors that were associated systematically with changes
in the repo rate over this period. Notably, we do not include calendar effects in this specification.
The additional variation explained by these calendar effects are less than 5 percentage points as
measured by the R-squared statistic. In addition, as will be explained below, calendar effects
became much less important in the subsequent subsamples, and in order to promote comparability
across time periods, we eliminate them from the analysis.
3.4.2 Crisis: August 2007 to June 2009
The relationship between these two rates changed markedly with the advent of the financial crisis.
Over the crisis period, as shown in the three middle columns of table 2, the adjustment speed from
disequilibrium slowed to a crawl, with the coefficients suggesting about 28 business days until about
half of a one-point deviation in the long-run relationship between the repo rate and the target rate
would be resolved. Given that the target federal funds rate moved at nearly every FOMC meeting,
and many of the intervening periods were only about 30 business days in length, the estimate
suggests that even though the repo rate still remained cointegrated with the target rate, moves in
the target were slow to translate into changes in the repo rate.
While the adjustment speed of the repo rate slowed considerably, the sensitivity to Treasury
15

issuance jumped. Overall, the effect of $50 billion in issuance nearly doubled to a firming of
3.5 basis points, suggesting a much more sensitive response of rates to changes in the amount of
collateral. This effect was much stronger in bills than in coupons, consistent with heightened
demand for short-dated, liquid, very safe instruments that characterized the height of the financial
crisis. Demand for newly-issued coupons was much more muted; in fact, the contemporaneous
effect has the “wrong sign” and the lagged effect suggests that all effects dissipate within one day.20
The next few lines show the correlation of changes in the repo rate with general market con-
ditions. The change in the Libor-OIS spread has a large impact on the change in the Treasury
GC repo rate; for each 10 basis point increase in this spread, the repo rate falls by 2 basis points.
Similarly, the widening in the spread between the 10 year Treasury rate and the 2 year Treasury
rate was associated with a fall in the repo rate, consistent with rates in the near term falling quickly
as conditions worsened in financial markets.
Turning to the factors that proxy for conditions in overnight secured funding markets, securities
lending operations by the Federal Reserve, which provide more collateral to the market, are associ-
ated with upward movements in the Treasury GC repo rate. Although the coefficients are slightly
smaller than those on net Treasury issuance, the differences are minimal and suggest a similar effect
of provision of collateral on repo markets, regardless of the source.
Somewhat surprisingly, as shown in the next few lines of the table, repo rates plummet on days
with target rate changes. During this period, financial markets were in turmoil and surprise rate
changes occurred more frequently than they had in recent times. As a result, the demand for
safe collateral likely increased markedly. In addition, most of these moves were downward shifts
in the level of rates, suggesting that the repo rate fell along with the target federal funds rate.
Anticipation effects were somewhat more muted during the crisis period, perhaps as more changes
in the target rate were either at unscheduled FOMC meetings or of magnitudes not expected by
market participants.
The autoregressive terms suggest some continued persistence of changes in the Treasury GC repo
rate, although to a lesser extent than in normal times. However, as measured by the coefficients
on the GARCH terms, volatility apparently increased from normal times, with both the coefficients
on the ARCH and GARCH terms as well as the leverage terms increasing in magnitude. Perhaps
as a result of the increased volatility during this period, our specification explains only about 10
percent of the variation of change in the Treasury GC repo rate during this period.
20 [Fleming et al. (2010)] estimate the slope coefficient on Treasury securities issuance/redemption of 1 basis pointper $1 billion. The difference in the estimates is likely attributed to differences in specification and control variables.
16

3.4.3 Post-crisis period
The last three columns of 2 display results on the post-crisis period. Because the target federal
funds rate did not move over this period, we do not include a cointegration term or controls for
days with target rate changes.
Interestingly, in the post-crisis period the effect of bill issuance on the repo rate again became
less important than coupon issuance, consistent with the pre-crisis period. in fact, the overall
coefficients are somewhat close to those observed pre-crisis, consistent with relatively stable demand
for Treasury GC repo over time. From a monetary policy implementation perspective, should the
Committee decide to target the Treasury GC repo rate, this stable demand may be comforting, as
it suggests that the underlying demand for the instrument does not change radically, even if general
market conditions do.
Consistent with relatively unchanged demand for Treasury collateral over time, changes in the
Libor-OIS spread are associated with changes in the Treasury GC repo rate with approximately
the same magnitude during the crisis as in the post-crisis period. Indeed, even though strains in
financial markets dissipated in the post-crisis period relative to during the acute part of the crisis,
some pressures were still evident and the Treasury GC repo rate moved in a similar manner as a
result.
With the stability of the target federal funds rate over this subsample, the persistence of changes
in the Treasury GC repo rate increased. Our specification suggests that changes in the repo rate
continued to have effects up to 7 business days after they occurred. While this seems like quite
a long time, as evidenced by figure 6, the Treasury GC repo rate was remarkably stable over this
time, moving within a relatively tight range for much of the period. Volatility of the Treasury
GC repo rate also declined; the model was estimated without leverage effects as comparisons of the
Akaike information criterion (AIC) across specifications suggested that the leverage effects did not
improve the fit of the model. The fit of the model as measured by the R-squared statistic reverted
back to its pre-crisis level, with this specification explaining about a quarter of the variation in
changes in the Treasury GC repo rate.
3.5 Implications and back-of-the-envelope estimates of upward pressure
on the repo rate
Although the demand schedule for repos appears to be rather flat, the size of the System Open
Market Account portfolio of Treasury securities relative to the repo market size is substantial,
indicating that, in principle, the Federal Reserve can put significant upward pressure on the repo
rate through large-scale reverse repos.21
21Large-scale repos, which add balances, do not require the Federal Reserve to pledge any collateral.
17
We compute two back-of-the-envelope estimates for upward pressure on the repo rate that the
Federal Reserve potential can achieve by doing a large scale reverse repo. The first estimate is based
on the current size of the Federal Reserve’s portfolio of Treasury securities. As of March 2013, the
size of the Federal Reserve’s Treasury securities portfolio was about $1.8 trillion. Multiplying this
size by the contemporaneous estimate for the liquidity effect gives an estimate of 80 basis points (0.05
basis point per $1 billion·$1800 billion) for the upward pressure the Federal Reserve can orchestrate.
The second estimate is based on the size of that portfolio under ”normal circumstances”, that is,
when currency in circulation is the main determinant of the size of the Federal Reserve’s portfolio.
As of March 2013, currency in circulation was about $1.2 trillion, giving the estimate of the upward
pressure from a reverse repo of 55 basis points. If the size of the SOMA holdings of Treasury
securities (possibly of a particular security type) is not sufficient to conduct a reverse repo of a
desired size, the Federal Reserve can increase the size of its portfolio through permanent open
market operations.
Obviously, a reverse repo of such enormous size (of either $1 trillion or $1.8 trillion) might drive
up the repo rates much higher than the estimated 50-80 basis points for two reasons. First, the
demand schedule for repos might be very steep over the region with very little cash going around the
repo market. In the worst case scenario, these enormous repos might cause significant disruptions
in the repo market driving repo rates to extremely high levels, at least in the short run. Second, our
simple exercise does not take into account the propagation mechanism (the lag structure, the repo
multiplier effect, the cross effects with other money markets) of a change to supply of cash/collateral
to the repo market. As we discuss below, the multiplier effect might be rather sizeable.
4 The longer-run liquidity effect and money demand
Against the backdrop of our finding of a short-term liquidity effect, we now turn to look for one in
lower-frequency data and over a longer period. The lower-frequency liquidity effects are of interest
because of their relevance for Federal Reserve’s longer-term repos. In addition, we take another
look at a traditional ”money demand” framework to ascertain whether repo money is significantly
associated with macroeconomic activity. While this is not necessarily a prerequisite for an effective
operational target rate, some central banks (such as the European Central Bank) put some weight
on the behavior of intermediate targets when formulating monetary policy decisions.
4.1 The longer-run liquidity effect
Typically, researchers fail to find a liquidity effect at low frequency for various money measures.22
In fact, the absence of the liquidity effect at lower frequency at a first glance appears to be somewhat
22For a summary, refer to [Friedman and Kuttner (2010)].
18

puzzling. However, as [Carpenter and Demiralp (2008)] argue, much of the research into the link
between money and interest rates suffers from misspecification – that is, the measure of money and
the measure of interest rates are not always well matched. In our exercise above, we show that
by using an appropriate proxy of short-run changes in cash supply in the repo market–net issuance
of Treasury securities–we find some evidence of a liquidity effect. If net issuance is positive, cash
is drained from the repo market and repo rates rise. Likewise, if net issuance is negative, cash
is added to the market and repo rates fall. As such, there is a clear liquidity effect that we can
document.
Besides the short-term liquidity effect from Treasury issuance, we are interested in a broader
liquidity effect–the liquidity effect from cash inflow into the short-term repo component of M3. M3
is the broadest measure of money that was published by the Federal Reserve.23 M3 includes M2, as
well as all large time deposits, institutional money-market funds, short-term repurchase agreements
(as they show up in banks’ liabilities), along with other liquid assets.
To provide information on the magnitude of M3 and its non-M2 components, figure 7 plots the
evolution of the two measures from 1970 to 2006. The growth in non-M2 M3 components picked
up in the late 1970s, in a high inflation environment, as new short-term investment vehicles such as
money-market funds, emerged. The volume of short-term repurchase agreements nearly quadrupled
between the early 1990s and the mid-2000s from about $140 billion to $550 billion. Towards the end
of the sample period, the share of short-term repurchase agreements in the non-M2 M3 components,
became rather sizable and reached about 15 percent.
Economic intuition tells us that the broader liquidity effect should be larger than the Treasury
securities liquidity effect because of the rehypothecation multiplier effect. An additional dollar
of cash flowing into the repo market can be used to buy an additional dollar worth of collateral,
which in turn can be rehypothecated subject to a haircut, RR percent, and the proceeds from the
rehypothecation, (1-1·RR) dollars, can be used for next collateral purchase, and so on. In the limit,
assuming the subsequent haircuts does not vary, the multiplier will result in 1/RR dollars of cash
being created. In particular, the rehypothecation multiplier is analogous to the money multiplier
in a fractional-reserve banking system. It should be noted, that, in practice, the multiplier is much
small than 1/RR as the rehypothecation practice is rather limited in the U.S. In the triparty repo
market, collateral is safely tucked away at a clearing bank and only accessible to the cash lender
in case of the borrower default. In the bilateral repo market, though, rehypothecation might be
widespread. Moreover, at least the earlier years of our sample period for this particular exercise,
bilateral trades were likely dominant in the market. Consequently, we do expect that there would
be some multiplier effect of Treasury issuance observed in the money data.
23The publication of the M3 monetary aggregate on the H.6 release was discontinued in March 2006. At that time,M3 did not appear to convey any additional information about economic activity that was not already embodied inM2 and had not played a role in the monetary policy process for many years. Consequently, the Federal ReserveBoard judged that the costs of collecting the underlying data and publishing M3 outweighed the benefits.
19
In order to investigate whether there exists a liquidity effect at a lower frequency, we use weekly
and monthly specifications to investigate the relationship between the repo rate and the repo
component of M3. The data are weekly averages of the repo rate and the target federal funds rate
described above over the period from 1998 (when fails data are available) to February 2006. The
M3 data availability determines the end point of our sample. Over this period, unit root tests
suggest that the repo rate and the target federal funds rate are nonstationary and the Johansen
test implies that the rates are cointegrated.
We use a similar specification in our medium-run liquidity effect investigation to that used for
the short-run liquidity effect. Specifically, we use an error correction model, with a model setup
similar to that used for studying high-frequency liquidity effects above:
△rrt = α (c+ βfftart−1) + Φrr(L)∆rrt +Φff (L)∆fftart + ΞSt + et,
where
• rrt is the repo rate, fftart is the target federal funds rate, St is an exogenous shifter of cash
supply;
• c is a cointegrating constant, β is a cointegrating slope, α is a speed of adjustment coefficient,
Φ is a set of distributed lag coefficients;
• et is an error term.
Unlike a very short-run liquidity effect based on Treasury issuance only, we believe that there
may be some endogeneity in the amount of repo money available given the repo rate. In particular,
we believe that cash inflows into short-term repo agreements might be sensitive to the repo rate: a
higher repo rate might attract additional cash investors, so that the repo rate and cash inflows might
have (spurious) positive correlation. Hence, we estimate a set of models using instrumented cash
inflows. After a series of specification tests, we settle on net Treasury issuance as our instrumental
variable. Net Treasury issuance is set well in advance by the Treasury and reflects an exogenous
supply-side shock to repo money available. The shifts in the supply curve allow us to trace out
the demand curve, and hence the change in the repo rate to a shift in cash available in the market.
Moreover, as a result of the possibility of a multiplier effect and in the spirit of a classic money
demand model, we estimate the model in terms of percent changes in the amount of repo cash
available to the market.
The second stage estimation results of liquidity effects are shown in table 4. As in table 3,
we separate our analysis according to the collateral type, that is, into all securities, bills only, and
coupons only. We note that we are limited in the choice of controls. For example, the Libor-OIS
spread is highly correlated with changes in the repo and federal funds rates and the slope, so it
20

had to be omitted. Moreover, changes in Treasury debt outstanding have some seasonality, which
precludes having calendar effects in this lower-frequency model.24
Similar to the results concerning the short-run liquidity effect, the contemporaneous liquidity
effects of total Treasury securities issuance and of Treasury bills issuance are rather close—between
0.07 and 0.1 basis point per $1 billion of issuance—and remain statistically significant. Most of
this result appears to be driven by Treasury bills, as the effect from Treasury coupon issuance is
not statistically significant.
The next row down shows the liquidity effect as identified by the instrumented repo component
of M3, which is a measure of cash supply to the repo market. We instrument by two lags of total
net Treasury borrowing, bills, and coupons in the first, second, and third columns respectively.
By contrast to the contemporaneous liquidity effect of securities issuance, the contemporaneous
liquidity effect of cash supply is statistically significant and is an order of magnitude larger than
that of Treasury issuance —about 1 basis point per $1 billion in increase in cash supply. This
magnitude difference illustrates the possibility of a multiplier effect in the creation of repo “money”
as discussed above.
5 Transmission of the repo rate to the short end of the yield
curve
As the recent financial crisis has demonstrated, seemingly resilient linkages between financial mar-
kets may suddenly weaken or disappear. Often assumed to work seamlessly is the first step in
this transmission—the transmission of the monetary policy stance from the federal funds market to
other money markets. [Bech, Klee and Stebunovs (forthcoming)] examines this most immediate
step: the paper focuses on the transmission of the monetary policy stance from the overnight federal
funds market to the overnight U.S. Treasury GC repo market. The federal funds and Treasury
GC repo markets have been tightly linked, in part, because of the U.S. monetary policy implemen-
tation framework. As the participants in the federal funds market and other short-term markets
frequently overlap, controlling for risk, collateral, and other frictions, all rate differences should be
arbitraged quickly away. The federal funds rate, being controlled by the Federal Reserve, should
lead this rate tandem. Their results suggest that pass-through from the federal funds rate to the
repo deteriorated somewhat during the crisis and zero lower bound periods, likely due to limits to
arbitrage and idiosyncratic market factors. In addition, during the early part of the crisis, the
pricing of federal funds relative to repurchase agreements indicated a marked jump in perceived
credit risk. Moreover, the liquidity effect in the federal funds market weakened with the increase
24Two simple examples of this seasonality include that securities issuance occurs on specific days of the month,and bill issuance tends to build up leading into tax season and wane soon after.
21

in reserve balances over the crisis, implying a non-linear demand curve for federal funds. In con-
trast, the liquidity effects in the Treasury GC repo market, on balance, has remained unchanged.
Consequently, emerging from the crisis, the two money market interest rates appear to commove
less tightly as they had before the crisis. However, the presence of the liquidity effects in both the
federal funds and repo markets implies that hypothetical liquidity draining by the Federal Reserve,
for example, via large-scale reverse repos, may boost somewhat the two money market rates in
absence of an increase in the policy rates, such as the target federal funds rate, the primary credit
rate, or the rate paid on reserves.
We now turn to the transmission up each security’s “own” yield curve. In this section, we
explore the transmission of the repo rate to the short end of its yield curve. In particular, if the
repo rate is to be the “new” targeted monetary policy rate, then it should have better “transmission”
properties to the rest of its curve than the federal funds rate does to its curve.
In order to investigate this issue further, we perform a few simple tests of the expectations
hypothesis for term federal funds and repo rates. The expectations hypothesis asserts that the rate
earned on a long-term investment should be equal to the rate earned on a series of shorter-term in-
vestments, plus a term premium. With this definition, as in [Campbell, Lo and MacKinlay (1997)],
we can express a long-term interest rate rt,t+k from date t to date t+ k as a function of the short
rate s on days j, j = t, ..., t+ k − 1 plus a term premium ρ as
rt,t+k = Et
t+k−1∏j=t
(1 + sj)− 1
+ ρmt,t+k (2)
Many, many authors have found that this relationship does not hold for longer-dated tenors of
the yield curve. That said, [Longstaff (2000)] found that this relationship held surprisingly well
for very short term rates, defined as rates on securities with less than three months maturity. He
tested his hypothesis on the repo market specifically. Following Longstaff’s empirical specification,
we can rewrite equation (2) equivalently as
St+k − rt,t+k = ρt,t+k + βrt,t+k + ϵt+k (3)
where St+k = Et
[∏t+k−1j=t (1 + sj)− 1
]. If the expectations hypothesis holds, then there should
be no additional information contained in the long-term interest rate rt,t+k and so the hypothesis
that the estimated coefficient β is equal to zero should not be rejected. The error term ϵ is
necessarily correlated across the maturity tenor being tested. In order to control for this, we
report Newey-West standard errors with a lag length equal to t+ k − 1 in all our results.
We estimate equation (3) using data from Bloomberg over the same sample period as that for
the daily liquidity effect regressions. Table 5 displays the estimation results. As shown in the
top half of the table, before the crisis, in general, it appears that the expectations hypothesis was
22
satisfied for the repo rate at all tenors, and for the federal funds rate, at some tenors. In addition,
there appeared to be about a 3 basis point term premium in repo, but no discernable term premium
in federal funds. That said, even though there was some significant correlation in federal funds,
the magnitude of the correlation was fairly small and around a basis point. Moreover, at the 30
and 60 day tenors, there was no such correlation.
These patterns changed markedly at the start of the crisis for federal funds, but not nearly as
much for repo. In particular, the correlation at all tenors was now significant for the federal funds
rate. In addition, the magnitude of the coefficient was many multiples what it was during the
crisis, reflecting over half a percentage point and nearly a percentage point in some cases. The term
premium also increased significantly, to about 8 basis points in the three month security.
By contrast, the transmission across the repo yield curve remained intact. Indeed, although the
term premium increased slightly from the 3 basis points before the crisis to about 4 or 5 basis points,
this change is not particularly material and at least is suggestive of a continued well-functioning
transmission from the overnight rate to the short end of the yield curve.
These results are certainly suggestive that the ability of term repo rates to move sensibly with
changes in the overnight rate is somewhat more than for term federal funds rate. Combined with
the short- and long-run liquidity effects discussed above, it appears that the repo rate satisfies many
of the (admittedly ad-hoc) “requirements” for a good target policy rate.
6 Conclusion
Going forward, we argue that past experience with federal funds and repo rates suggests the Federal
Reserve can target the Treasury General Collateral repurchase agreement rate, and that financial
market conditions in the past may well have been able to support such a regime. First, we argue
that the SOMA portfolio of Treasury securities is about the same size as that for the U.S. triparty
repo market, suggesting that the Federal Reserve can potentially drain a substantial fraction of the
repo market of liquidity by ”repoing out” its portfolio of Treasury securities. We also note that the
Federal Reserve can add as much liquidity to the market as market participants can absorb given the
participants’ collateral. The capacity to add or drain enormous liquidity volumes should reinforce
the credibility of the Federal Reserve to target any level of the Treasury GC rate. Second, we show
that there is a fairly predictable demand schedule for Treasury general collateral repo at both daily
and monthly frequencies. Third, the schedule is downward sloping, and the estimates of the schedule
slope appear to be rather stable over time. We find that the daily liquidity effect in the repo market
(identified through the impact of net issuance of Treasury securities) is about 0.04 basis point per
$1 billion, which is an order of magnitude smaller than the daily liquidity effect in the federal funds
market before the financial crisis (0.3 to 0.5 basis point per $1 billion) but is somewhat larger than
that after the crisis (about 0.01 basis point per $1 billion). We estimate that the monthly liquidity
23

effect (identified through the impact of net issuance of Treasury securities) is about 0.07 to 0.1
basis point per $1 billion, while taking into account the repo multiplier effect, the monthly liquidity
effect (identified through instrumented cash supply) is an order of magnitude larger (about 1 basis
point per $1 billion). The latter estimated liquidity effects are of the same order of magnitude
smaller as that in the federal funds market over the pre-crisis period. ([Judson and Klee (2010)]).
Fourth, although the demand schedule is rather flat, the size of SOMA’S portfolio of Treasury
securities relative to the repo market size is substantial, indicating that the Federal Reserve can
put significant upward pressure on the repo rate through large-scale reverse repos. Our estimated
range suggests something along the lines of 50 to 80 basis points. This estimated range clearly
understates the likely impact of draining all of the liquidity from the repo market. Taken together,
these findings suggest the Federal Reserves can target a given level of the repo rate on a daily or
term basis, offsetting shocks to supply of either cash or collateral to the market.
Moreover, we submit that the target repo rate might prove to be a more effective policy tool
than the target federal funds rate in the future because of a broader set of repo market participants,
including broker-dealers, government-sponsored enterprises, and money market funds. By targeting
the repo rate, the Federal Reserve can directly affect the cost of funding (or the rate of return) for
various institution types, rather than working through the federal funds market, thereby potentially
strengthening the cost channel of monetary policy transmission. And finally, the Federal Reserve
already has in place measures to address market functioning issues in repo markets – for example,
the SOMA securities lending program can address some repo market strains, such as particular
Treasury securities trading ”special”. In addition, there may be other reasons to target the repo
rate, rather than simply relying on interest on excess reserves to transmit the policy stance. From
a governance point of view, the IOER rate is a Board – not FOMC – decision. If there were a
switch to using IOER as the main policy decision rate, this would represent a change in monetary
policy decision-making. From an implementation point of view, targeting a rate that is ultimately
decided by market forces rather than targeting a rate that does not necessarily show through to
broader markets could be viewed as potentially more economically efficient.
We leave exploration of macroeconomic implications of targeting a secured rate for future re-
search. For now, we will bring up just a few points. Before the recent financial crisis, with
counterparty credit concerns muted, there was no material spread between secured and unsecured
money market rates. Hence, it did not matter what type of rate the Federal Reserve targeted. But
as the crisis demonstrated, the central bank should not rely on these rates moving together tightly.
In fact, a central bank might face a dilemma whether to judge (and pursue) its monetary policy
stance based on a relatively risk-free real interest rate (such as the repo rate minus a measure of
expected inflation) or based on a real interest rate which reflects both a general risk-free real interest
rate (which is more relevant for the entire economy) and a counterparty credit risk premium.25
25Recall that at this point the share of federal funds loans in bank liabilities is very small. Moreover, non-bank
24
Our proposal is, of course, subject to the Lucas critique. The Federal Reserve’s active in-
volvement in the repo market might likely change the way this market functions. However, the
change might be to the Federal Reserve’s advantage: it might be sufficient for the Federal Reserve
to announce a target rate and, given its potentially high credibility of large-scale liquidity additions
or draining of collateral in the repo market, trades will cluster around the target rate.
References
[Bartolini et al. (2010) ] Bartolini, L., S. Hilton, S. Sundaresan, and C. Tonetti 2010. “Collateral
values by asset class: Evidence from Primary Securities Dealers,” Review of Financial Studies,
forthcoming.
[Bech, Klee and Stebunovs (forthcoming)] Bech, M., E. Klee, and V. Stebunovs. 2012. “The repo
and federal funds markets before, during, and emerging from the financial crisis”, in ”Macroe-
conomics and the Term Structure of Interest Rates,” edited by Professor Jagjit Chadha, Alain
Durr, Michael Joyce and Professor Lucio Samo, Cambridge University Press.
[Brunnermeier and Pedersen] Brunnermeier, M. and L. Pedersen. 2009. “Market Liquidity and
Funding Liquidity,” Review of Financial Studies,” vol. 22, no. 6, pp. 2201-2238.
[Campbell, Lo and MacKinlay (1997)] Campbell, John Y., Lo, Andrew W. and MacKinlay, A.
Craig. 1997. The Econometrics of Financial Markets, Princeton: Princeton University Press.
[Carpenter and Demiralp (2006a)] Carpenter, Seth and Demiralp, Selva. 2006. “The Liquidity
Effect in the Federal Funds Market: Evidence from Daily Open Market Operations,” Journal
of Money, Credit, and Banking, vol. 38, no. 4, p. 900-920.
[Carpenter and Demiralp (2006b)] Carpenter, Seth, and Demiralp, Selva. 2006. “Anticipation of
Monetary Policy and Open Market Operations,” International Journal of Central Banking,
vol. 2, no. 2, p. 25-63.
[Carpenter and Demiralp (2008)] Carpenter S. and S. Demiralp. 2008. “The Liquidity Effect in
the Federal Funds Market: Evidence at the Monthly Frequency,” Journal of Money, Credit,
and Banking, vol. 40, pp. 1-24.
[Copeland, Duffie, Martin, and McLaughlin (2012)] Copeland, Adam, Duffie, Darrell, Martin, An-
toine, and McLaughlin, Susan. 2012. “Key Mechanics of the U.S. Tri-Party Repo Market,”
Federal Reserve Bank of New York Economic Policy Review, December.
providers of retail or wholesale credit cannot have federal funds liabilities by definition.
25

[Coffey, Hrung and Sarkar] Coffey, N., W. Hrung, and A. Sarkar 2009. “Capital Constraints, Coun-
terparty Risk, and Deviation from Covered Interest Rate Parity,” Federal Reserve Bank of New
York Staff Report no. 393, September
[Collin-Dufresne et al. (2001)] Collin-Dufrense, P., R. Goldstein, J. Martin. 2001. “The Determi-
nants of Credit Spread Changes,” Journal of Finance, vol. 56, no. 6, pp. 2177-2207.
Duffie, D. 1996. “Special Repo Rates,” Journal of Finance, vol. 51, no 2, p. 493-526, June
[Engle and Granger (1987)] Engle, R. and C. Granger. 1987. “Cointegration and Error-Correction
Model: Representation, Estimation, and Testing,” Econometrica, vol. 55, no. 2, pp. 251-276
[Federal Reserve Bank of New York (2009)] Federal Reserve Bank of New York. 2009. Domestic
Open Market Operations during 2008, January.
Federal Reserve Bank of New York 2010. “Tri-party Repo Infrastructure Reform,” May 17.
Fisher M. 2002. “Special repo rates: An introduction,” Economic Review, Federal Reserve
Bank of Atlanta, Second quarter
[Fleming et al. (2010)] Fleming, M., W. Hrung, and F. Keane. 2010. “Repo Market Effects of the
Term Securities Lending Facility,”American Economic Review: Papers and Proceedings, vol.
100, p. 591-596, May.
[Fleming and Rosenberg (2008)] Fleming, Michael, and Rosenberg, Jason. 2008. ”How do Trea-
sury dealers manage their positions?,” Federal Reserve Bank of New York Staff Report no.
299, March.
[Friedman and Kuttner (2010)] Friedman, B., and Kuttner, K. 2010. “Implmenetation of Mone-
tary Policy: How do Central Banks Set Interest Rates?” in Friedman and Woodford (eds.),
Handbook of Monetary Economics, vol. 38.
[Friedman and Schwartz (1963)] Friedman, M. and A. Schwartz. 1963. A Monetary History of the
United States. Cambridge: NBER.
[Furfine (1999)] Furfine, C. 1999. “The Microstructure of the Federal Funds Market,” Financial
Markets, Institutions, and Instruments, vol. 8, no. 5, pp. 24-44.
[Friedman and Kuttner (2010)] Friedman, Benjamin, and Kuttner, Kenneth. 2010. “Implemen-
tation of monetary policy: How do central banks set interest rates?” Handbook of Monetary
Economics, vol. 3, p. 1345-1438.
[Griffiths and Winters (1997)] Griffiths, M. and D. Winters. 1997. “The effect of Federal Reserve
accounting rules on the equilibrium level of overnight repo rates,” Journal of Business Finance
and Accounting, vol. 24, no. 6, pp. 815-832.
26

[Gorton (2010)] Gorton, Gary. 2010. “Questions and Answers about the Financial Crisis,” Remarks
prepared for the U.S. Financial Crisis Inquiry Commission
[Hamilton (1996)] Hamilton, J. 1996. “The daily market for federal funds,” Journal of Political
Economy, vol. 104, no. 1, pp. 26-56.
[Hamilton (1997)] Hamilton, J. 1997. “Measuring the liquidity effect,” American Economic Re-
view, vol. 87, no. 1, pp. 80-97.
[Happ (1986)] Happ, S. 1986. “The behavior of rates on federal funds and repurchase agreements,”
The American Economist, vol. 30, no. 2, pp. 22-32
[Johansen (1995)] Johansen, S. 1995. “Identifying restrictions of liner equations with applications
to simultaneous equations and cointegration,” Journal of Econometrics, vol. 69 (1), pp. 111-132
[Judson and Klee (2010)] Judson, Ruth A., and Klee, Elizabeth. 2010. “Whither the liquidity
effect?: The impact of Federal Reserve open market operations in recent years,” Journal of
Macroeconomics, vol. 32, no. 3, p. 713-731.
[Krishnamurthy (2002)] Krishnamurthy, A. 2002. “The bond/old bond spread,” Journal of Fi-
nancial Economics, vol. 66, pp. 463-506
[Longstaff (2000)] Longstaff, Francis. A. 2000. “The term structure of very short-term rates: New
evidence for the expectations hypothesis,” Journal of Financial Economics, vol. 58, p. 397-415.
[Lutkepohl (2007)] Lutkepohl, H. 2007. New Introduction to Multiple Time Series Analysis. Berlin:
Springer-Verlag.
[Lou, Yan, and Zhang (2011)] Lou, Dong, Yan, Hongjun, and Zhang, Jinfan. 2011. “Anticipated
and Repeated Shocks in Liquid Markets,” London School of Economics, June.
[Meulendyke (1998)] Meulendyke, Anne-Marie. 1998. U.S. Monetary Policy and Financial Mar-
kets, available for download at http://www.newyorkfed.org/education/addpub/monpol.
[Simmons (1954)] Simmons, E. 1954. “Sales of Government Securities to Federal Reserve Banks
Under Repurchase Agreements,” The Journal of Finance, vol. 9, no. 1, pp. 23-40.
[Stigum and Credenzi (2007)] Stigum, M. and A. Credenzi. 2007. The Money Market. McMillian:
New York.
[Thornton (2004)] Thornton, D. 2004. “Tests of the expectations hypothesis: Resolving some
anomalies when the short-term rate is the federal funds rate,” Journal of Banking and Finance,
vol. 29, pp. 2541-2556.
27

Figure 1: Triparty repo market
0
.2
.4
.6
.8
1
1.2
Rat
io
0
500
1000
1500
2000
2500
3000
$ B
illio
ns
Apr 2
002
Apr 2
003
Apr 2
004
Apr 2
005
Apr 2
006
Apr 2
007
Apr 2
008
Apr 2
009
Apr 2
010
Apr 2
011
Apr 2
012
Weekly
SOMA Treasury Holdings Tri−Party Repo Volume SOMA Tres Holdings / Repo (Right Axis)
Apr. 2002 − PresentSOMA Treasury Holdings and Repo Market Size
28

Figure 2: Primary dealers transaction volume
0
200
400
600
800
1000
$ bi
llion
s
1994 1996 1998 2000 2002 2004 2006 2008 2010 2012
Total Treasury
Volume of Treasury, Agency Debt, and MBS Repos with Inter−Dealer Brokers
0
200
400
600
800
1000
$ bi
llion
s
1994 1996 1998 2000 2002 2004 2006 2008 2010 2012
Total Treasury
Source. FR2004.
Volume of Treasury, Agency Debt, and MBS Repos with Others
29

Figure 3: Federal funds market volume
0
25
50
75
100
125
150
175
Inde
x (Q
1 20
00=
100)
Mar
200
0
Apr 2
001
Apr 2
002
Apr 2
003
Apr 2
004
Apr 2
005
Apr 2
006
Apr 2
007
Apr 2
008
Apr 2
009
Apr 2
010
Apr 2
011
Apr 2
012
Quarterly
Fed Funds Volume NGDP
2002 − PresentFed Funds Volume vs NGDP
30

Figure 4: Federal funds and repos at commercial banks: Quarterly
50
100
150
200
250
300
$ bi
llion
s
Jan 2002Jan 2004Jan 2006Jan 2008Jan 2010Jan 2012Jan 2014
Federal Funds Purchased
0
1
2
3
4
perc
ent
Jan 2002 Jan 2004 Jan 2006 Jan 2008 Jan 2010 Jan 2012 Jan 2014
Percent of Liabilities
50
100
150
200
250
$ bi
llion
s
Jan 2002Jan 2004Jan 2006Jan 2008Jan 2010Jan 2012Jan 2014
Federal Funds Sold
.5
1
1.5
2
2.5
3
perc
ent
Jan 2002Jan 2004Jan 2006Jan 2008Jan 2010Jan 2012Jan 2014
Percentage of Assets
100
120
140
160
180
200
220
240
260
280
300
320
$ bi
llion
s
Jan 2002Jan 2004Jan 2006Jan 2008Jan 2010Jan 2012Jan 2014
Securities Purchased to Resell
1.4
1.6
1.8
2
2.2
2.4
2.6
2.8
3
perc
ent
Jan 2002Jan 2004Jan 2006Jan 2008Jan 2010Jan 2012Jan 2014
Percent of Assets
240
260
280
300
320
340
360
380
400
420
440
$ bi
llion
s
Jan 2002Jan 2004Jan 2006Jan 2008Jan 2010Jan 2012Jan 2014
Securities Sold to be Repurchased
2.5
3
3.5
4
4.5
5
5.5
6
perc
ent
Jan 2002Jan 2004Jan 2006Jan 2008Jan 2010Jan 2012Jan 2014
Percent of Liabilities
31

Figure 5: Spread between federal funds and Treasury GC repo
−50
0
50
100
150
200
250
Bas
is p
oint
s
2000 2002 2004 2006 2008 2010 2012Daily.
Federal Funds−Overnight GC Repo Spread
32

Figure 6: Treasury GC repo rate
−.5
0
.5
1
1.5
2
2.5
3
3.5
4
4.5
5
5.5
6
6.5
7
Per
cent
age
Poi
nts
Jan
2002
Jan
2003
Jan
2004
Jan
2005
Jan
2006
Jan
2007
Jan
2008
Jan
2009
Jan
2010
Jan
2011
Jan
2012
Jan
2013
Daily
Jan. 2002 − Sep. 2012Overnight Repo Rates
33

Figure 7: M2, M3, and the repo component of M3
0
100
200
300
400
500
600
Bill
ions
$ (
Rep
o)
0
500
1000
1500
2000
2500
3000
3500
4000
4500
5000
5500
6000
6500
7000
7500
8000
8500
9000
9500
10000
10500
11000
Bill
ions
$
Jan
1970
Jan
1971
Jan
1972
Jan
1973
Jan
1974
Jan
1975
Jan
1976
Jan
1977
Jan
1978
Jan
1979
Jan
1980
Jan
1981
Jan
1982
Jan
1983
Jan
1984
Jan
1985
Jan
1986
Jan
1987
Jan
1988
Jan
1989
Jan
1990
Jan
1991
Jan
1992
Jan
1993
Jan
1994
Jan
1995
Jan
1996
Jan
1997
Jan
1998
Jan
1999
Jan
2000
Jan
2001
Jan
2002
Jan
2003
Jan
2004
Jan
2005
Jan
2006
Monthly
M2 M3
M3−M2 Repo (Right Hand Axis)
1970 − Present
Monetary and Repo Trends
34

Table 1: Monetary policy implementation across countriesC
ou
ntr
yC
on
stru
ctio
nU
nd
erl
yin
g i
nst
rum
en
ts
Ra
teD
esc
rip
tio
n
Au
stra
lia
Ca
sh r
ate
Th
e R
ese
rve
Ba
nk
of
Au
stra
lia
's m
ea
sure
of
the
ca
sh r
ate
is
the
inte
rest
ra
te w
hic
h b
an
ks
pa
y o
r ch
arg
e t
o b
orr
ow
fu
nd
s fr
om
or
len
d f
un
ds
to o
the
r b
an
ks
on
an
ov
ern
igh
t u
nse
cure
d b
asi
s.
[Th
e R
BA
als
o s
urv
ey
s b
an
ks
ab
ou
t th
eir
ov
ern
igh
t se
cure
d
len
din
g a
nd
bo
rro
win
gs.
]
Tra
nsa
ctio
n-b
ase
d.
Th
e R
ese
rve
Ba
nk
of
Au
stra
lia
(R
BA
)
calc
ula
tes
an
d p
ub
lish
es
this
ca
sh r
ate
ea
ch d
ay
on
th
e b
asi
s o
f
da
ta c
oll
ect
ed
dir
ect
ly f
rom
ba
nk
s. T
he
Ba
nk
of
Au
stra
lia
con
du
cts
a d
ail
y s
urv
ey
of
act
ua
l tr
an
sact
ion
s re
cord
ed
by
aro
un
d 2
0 o
ut
of
the
50
or
so b
an
ks
wit
h a
ctiv
e s
ett
lem
en
t
acc
ou
nts
; th
e s
urv
ey
pa
rtic
ipa
nts
co
mp
rise
aro
un
d 9
0 p
erc
en
t
of
da
ily
flo
ws
thro
ug
h t
he
RB
A's
Re
al-
Tim
e G
ross
Se
ttle
me
nt
syst
em
.
Un
secu
red
.
Ca
na
da
Tw
o p
rox
ies
(in
dic
ato
r ra
tes)
(1)
Th
e o
ve
rnig
ht
mo
ne
y m
ark
et
fin
an
cin
g r
ate
(2
) T
he
Ca
na
dia
n O
ve
rnig
ht
Re
po
Ra
te A
ve
rag
e (
CO
RR
A)
(1)
Su
rve
y.
De
riv
ed
fro
m a
n e
nd
-of-
da
y s
urv
ey
of
ma
jor
pa
rtic
ipa
nts
in
th
e c
oll
ate
rali
zed
ma
rke
t. S
om
e c
ou
nte
rpa
rtie
s
in t
his
ma
rke
t, s
uch
as
pe
nsi
on
fu
nd
s, d
o n
ot
ha
ve
acc
ess
to
th
e
Ba
nk
of
Ca
na
da
’s d
ep
osi
t fa
cili
ty.
(2
) Q
uo
ted
. C
ov
era
ge
is
lim
ite
d t
o o
n-s
cre
en
re
po
tra
nsa
ctio
ns.
Co
lla
teri
zed
. T
he
un
coll
ate
rali
zed
in
terb
an
k m
ark
et
acc
ou
nts
for
a v
ery
sm
all
pro
po
rtio
n o
f o
ve
rnig
ht
len
din
g a
ctiv
ity
.
Eu
ro a
rea
EO
NIA
Th
e E
ON
IA,
the
"E
uro
Ov
erN
igh
t In
de
x A
ve
rag
e"
rate
, is
th
e
ind
ica
tor
rate
.
Su
rve
y.
Th
e E
ON
IA r
ate
is
ba
sed
on
re
po
rte
d t
ran
sact
ion
s in
th
e
inte
rba
nk
ma
rke
t in
itia
ted
by
a p
an
el
of
aro
un
d 5
0 c
on
trib
uti
ng
ba
nk
s a
ctiv
e i
n t
he
eu
ro a
rea
. T
he
pa
ne
l m
em
be
rs a
re s
ub
ject
to t
he
EC
B's
re
serv
e r
eq
uir
em
en
ts a
nd
wo
uld
no
rma
lly
ha
ve
acc
ess
to
EC
B 's
re
fin
an
cin
g o
pe
rati
on
s a
nd
sta
nd
ing
fa
cili
tie
s.
All
sp
eci
fie
d t
ran
sact
ion
s in
itia
ted
du
rin
g t
he
bu
sin
ess
da
y a
re
rep
ort
ed
by
th
e p
an
el
ba
nk
s in
ag
gre
ga
te,
so t
he
n t
he
EO
NIA
rate
is
a w
eig
hte
d a
ve
rag
e o
f th
ese
ag
gre
ga
tes.
Un
secu
red
. T
he
EO
NIA
ra
te i
s b
ase
d o
n o
ve
rnig
ht
un
secu
red
len
din
g t
ran
sact
ion
s in
th
e i
nte
rba
nk
ma
rke
t in
itia
ted
by
a
pa
ne
l o
f a
rou
nd
50
co
ntr
ibu
tin
g b
an
ks
act
ive
in
th
e e
uro
are
a.
Jap
an
Ca
ll r
ate
Th
e u
nco
lla
tera
lize
d o
ve
rnig
ht
call
ra
te,
wh
ich
is
the
Ba
nk
’s
targ
et
inte
rest
ra
te,
is t
he
va
lue
-we
igh
ted
av
era
ge
ra
te f
or
tra
nsa
ctio
ns
ma
de
th
rou
gh
ta
nsh
i co
mp
an
ies
(mo
ne
y m
ark
et
bro
ke
rs).
[T
he
Ba
nk
of
Jap
an
als
o t
rack
s a
n o
ve
rnig
ht
rep
o r
ate
.]
Tra
nsa
ctio
n-b
ase
d.
Th
e B
an
k o
f Ja
pa
n r
ece
ive
s d
ata
fro
m i
ts
cou
nte
rpa
rtie
s (m
ajo
r p
art
icip
an
ts i
n m
on
ey
ma
rke
ts,
such
as
ba
nk
s, s
ecu
riti
es
com
pa
nie
s, a
nd
ta
nsh
i co
mp
an
ies)
an
d
rele
ase
s th
e a
gg
reg
ate
d d
ata
to
th
e p
ub
lic.
Un
secu
red
. T
he
un
coll
ate
rali
zed
ov
ern
igh
t ca
ll r
ate
is
a d
ail
y
we
igh
ted
av
era
ge
of
tra
nsa
ctio
ns
in t
he
un
coll
ate
rali
zed
ov
ern
igh
t m
ark
et.
Pa
rtic
ipa
nts
in
th
e m
ark
et
incl
ud
e d
om
est
ic
city
, re
gio
na
l, a
nd
tru
st b
an
ks,
fo
reig
n b
an
ks,
se
curi
tie
s
com
pa
nie
s, a
nd
oth
er
firm
s d
ea
lin
g i
n J
ap
an
ese
mo
ne
y
ma
rke
ts.
No
rwa
yT
wo
pro
xie
s
(in
dic
ato
r ra
tes)
(1)
A m
ain
me
asu
re o
f n
ext
-da
y f
un
din
g c
ost
s, c
all
ed
eff
ect
ive
NIB
OR
(N
orw
eg
ian
In
terb
an
k O
ffe
red
Ra
te),
is
pu
bli
she
d b
y
Re
ute
rs (
2)
An
un
off
ica
l m
ea
sure
: R
ate
s d
eri
ve
d f
rom
qu
ote
s o
n
the
Re
ute
rs D
ea
lin
g t
rad
ing
pla
tfo
rm o
f th
e N
orw
eg
ian
kro
ne
/
U.S
. d
oll
ar
tom
orr
ow
-ne
xt e
xch
an
ge
ra
te a
nd
a c
orr
esp
on
din
g
tom
orr
ow
-ne
xt U
.S.
do
lla
r in
tere
st r
ate
.
(1)
Su
rve
y.
NIB
OR
is
ba
sed
on
in
dic
ati
ve
ra
tes
of
bo
rro
win
g
cost
s q
uo
ted
by
a p
an
el
of
ba
nk
s a
ctiv
e i
n t
he
No
rwe
gia
n
ma
rke
t. (
2)
Qu
ote
d.
Be
cau
se f
ore
ign
ba
nk
s e
sta
bli
she
d o
uts
ide
of
No
rwa
y c
an
tra
de
on
th
is p
latf
orm
, th
is m
ea
sure
im
pli
citl
y
incl
ud
es
the
tra
nsa
ctio
ns
of
cou
nte
rpa
rtie
s w
ith
ou
t a
cce
ss t
o
sig
ht
de
po
sit
acc
ou
nts
at
No
rge
s B
an
k.
(1)
Un
secu
red
. N
IBO
R i
s in
ten
de
d t
o r
efl
ect
th
e i
nte
rest
ra
te
lev
el
len
de
rs r
eq
uir
e f
or
un
secu
red
mo
ne
y m
ark
et
len
din
g i
n
the
No
rwe
gia
n k
ron
e.
(2)
Cu
rre
ncy
sw
ap
s.
Sw
ed
en
ST
IBO
R
Th
e m
ain
me
asu
re o
f sh
ort
-te
rm i
nte
rba
nk
ra
tes
in S
we
de
n i
s
the
ST
IBO
R (
the
Sto
ckh
olm
In
terb
an
k O
ffe
red
Ra
te),
a n
ext
-da
y
rate
.
Su
rve
y.
Th
is r
ep
rese
nts
a t
rim
me
d m
ea
n o
f ra
tes
for
un
coll
ate
rali
zed
bo
rro
win
g r
ep
ort
ed
by
ma
jor
com
me
rcia
l
ba
nk
s in
th
e m
ark
et,
an
d t
hu
s is
no
t b
ase
d o
n a
ctu
al
tra
nsa
ctio
ns.
Mix
ed
. S
ho
rt-t
erm
fu
nd
ing
(fu
nd
ing
wit
h m
atu
riti
es
ran
gin
g
fro
m o
ve
rnig
ht
to u
p t
o a
we
ek
) is
pri
ma
rily
ob
tain
ed
th
rou
gh
un
secu
red
in
terb
an
k d
ep
osi
t co
ntr
act
s, r
ep
urc
ha
se
ag
ree
me
nts
, o
r fo
reig
n e
xch
an
ge
sw
ap
arr
an
ge
me
nts
, w
ith
th
e
thre
e t
yp
es
of
arr
an
ge
me
nts
co
mp
risi
ng
ro
ug
hly
eq
ua
l sh
are
s o
f
tota
l a
ctiv
ity
.
U.K
.S
ON
IA
Th
e c
on
dit
ion
of
mo
ne
y m
ark
ets
is
typ
ica
lly
ga
ug
ed
wit
h
refe
ren
ce t
o t
he
ste
rlin
g o
ve
rnig
ht
inte
rba
nk
av
era
ge
(S
ON
IA)
rate
.
Tra
nsa
ctio
n-b
ase
d.
Th
e t
ran
sact
ion
s in
clu
de
d i
n t
he
av
era
ge
are
th
ose
bro
ke
red
in
Lo
nd
on
by
Wh
ole
sale
Ma
rke
ts B
rok
ers
'
Ass
oci
ati
on
me
mb
ers
be
twe
en
mid
nig
ht
an
d 4
:15
p.m
., w
ith
a
min
imu
m d
ea
l si
ze o
f £
25
mil
lio
n.
Un
secu
red
. T
he
SO
NIA
ra
te i
s a
we
igh
ted
av
era
ge
of
un
secu
red
ste
rlin
g o
ve
rnig
ht
tra
nsa
ctio
n r
ate
s. T
he
se t
ran
sact
ion
s m
ay
inv
olv
e p
art
icip
an
ts t
ha
t a
re n
ot
rese
rve
acc
ou
nt
ho
lde
rs
an
d/o
r d
ep
osi
t fa
cili
ty m
em
be
rs,
such
as
sma
ll b
an
ks,
lo
cal
au
tho
riti
es,
an
d s
om
e c
orp
ora
tio
ns.
U.S
.E
ffe
ctiv
e f
ed
era
l
fun
ds
rate
Th
e e
ffe
ctiv
e f
ed
era
l fu
nd
s ra
te i
s th
e a
ve
rag
e o
f in
tere
st r
ate
at
wh
ich
de
po
sito
ry i
nst
itu
tio
ns
an
d g
ov
ern
me
nt
spo
nso
red
en
terp
rise
s a
ctiv
ely
tra
de
ba
lan
ces
he
ld a
t th
e F
ed
era
l R
ese
rve
,
typ
ica
lly
ov
ern
igh
t.
Tra
nsa
ctio
n-b
ase
d.
Th
e t
ran
sact
ion
s in
clu
de
d i
n t
he
av
era
ge
are
th
ose
bro
ke
red
by
fe
de
ral
fun
ds
bro
ke
rs i
n N
.Y.
Un
secu
red
.
Ta
rge
t/in
dic
ato
r ra
te
35

Table 2: Estimated cointegrating relationshipDependent variable: Treasury GC repo rate
Coeff. Std. err. Coeff. Std. err.
Target 0.987** 0.001 0.944** 0.014
Constant -0.997** 0.386 -19.233** 3.761
Adjusted R-sq 0.998 0.908
Observations 1410 475
Benchmark Crisis
∗∗ indicates significant at the 5 percent level.
36
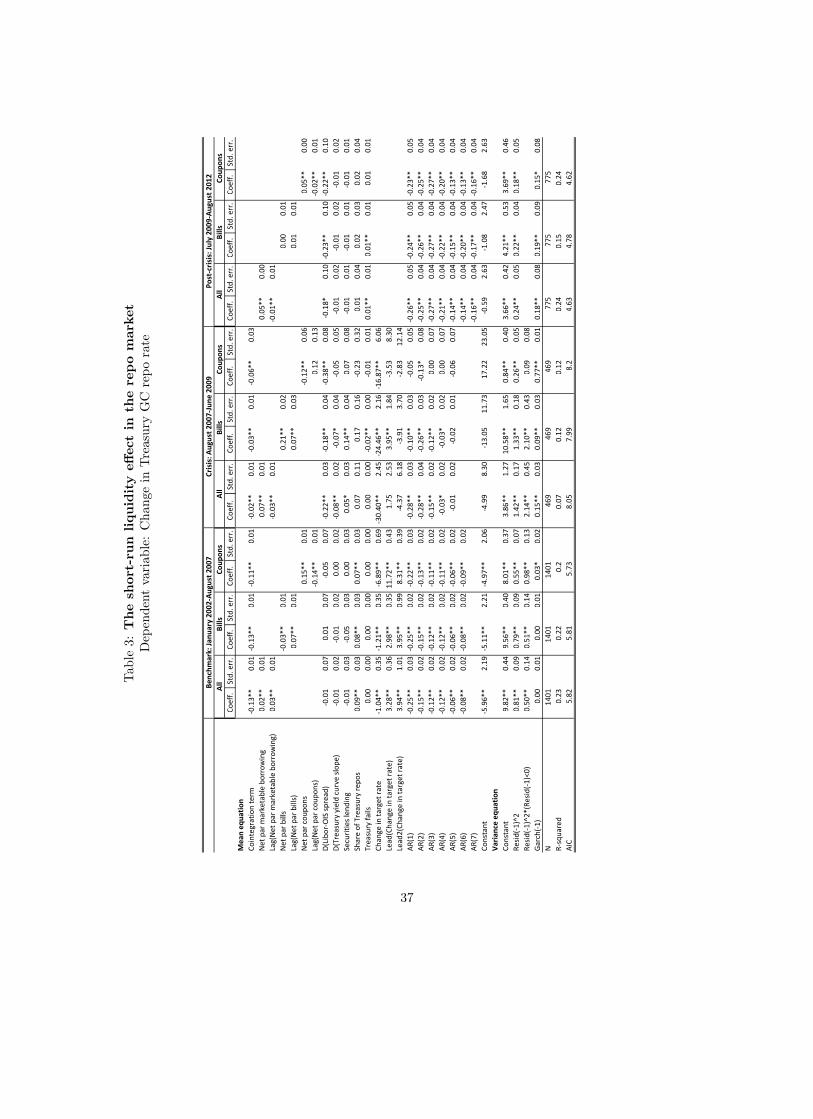
Tab
le3:
Thesh
ort-run
liquidityeffectin
there
pomark
et
Dep
endentvariab
le:Chan
gein
Treasury
GC
reporate
Co
eff
.S
td.
err
.C
oe
ff.
Std
. e
rr.
Co
eff
.S
td.
err
.C
oe
ff.
Std
. e
rr.
Co
eff
.S
td.
err
.C
oe
ff.
Std
. e
rr.
Co
eff
.S
td.
err
.C
oe
ff.
Std
. e
rr.
Co
eff
.S
td.
err
.
Me
an
eq
ua
tio
n
Co
inte
gra
tio
n t
erm
-0.1
3*
*0
.01
-0.1
3*
*0
.01
-0.1
1*
*0
.01
-0.0
2*
*0
.01
-0.0
3*
*0
.01
-0.0
6*
*0
.03
Ne
t p
ar
ma
rke
tab
le b
orr
ow
ing
0.0
2*
*0
.01
0.0
7*
*0
.01
0.0
5*
*0
.00
Lag
(Ne
t p
ar
ma
rke
tab
le b
orr
ow
ing
)0
.03
**
0.0
1-0
.03
**
0.0
1-0
.01
**
0.0
1
Ne
t p
ar
bil
ls-0
.03
**
0.0
10
.21
**
0.0
20
.00
0.0
1
Lag
(Ne
t p
ar
bil
ls)
0.0
7*
*0
.01
0.0
7*
*0
.03
0.0
10
.01
Ne
t p
ar
cou
po
ns
0.1
5*
*0
.01
-0.1
2*
*0
.06
0.0
5*
*0
.00
Lag
(Ne
t p
ar
cou
po
ns)
-0.1
4*
*0
.01
0.1
20
.13
-0.0
2*
*0
.01
D(L
ibo
r-O
IS s
pre
ad
)-0
.01
0.0
70
.01
0.0
7-0
.05
0.0
7-0
.22
**
0.0
3-0
.18
**
0.0
4-0
.38
**
0.0
8-0
.18
*0
.10
-0.2
3*
*0
.10
-0.2
2*
*0
.10
D(T
rea
sury
yie
ld c
urv
e s
lop
e)
-0.0
10
.02
-0.0
10
.02
0.0
00
.02
-0.0
8*
*0
.02
-0.0
7*
0.0
4-0
.05
0.0
5-0
.01
0.0
2-0
.01
0.0
2-0
.01
0.0
2
Se
curi
tie
s le
nd
ing
-0.0
10
.03
-0.0
50
.03
0.0
00
.03
0.0
5*
0.0
30
.14
**
0.0
40
.07
0.0
8-0
.01
0.0
1-0
.01
0.0
1-0
.01
0.0
1
Sh
are
of
Tre
asu
ry r
ep
os
0.0
9*
*0
.03
0.0
8*
*0
.03
0.0
7*
*0
.03
0.0
70
.11
0.1
70
.16
-0.2
30
.32
0.0
10
.04
0.0
20
.03
0.0
20
.04
Tre
asu
ry f
ail
s0
.00
0.0
00
.00
0.0
00
.00
0.0
00
.00
0.0
0-0
.02
**
0.0
0-0
.01
0.0
10
.01
**
0.0
10
.01
**
0.0
10
.01
0.0
1
Ch
an
ge
in
ta
rge
t ra
te-1
.04
**
0.3
5-1
.21
**
0.3
5-6
.89
**
0.6
9-3
0.4
0*
*2
.45
-24
.46
**
2.1
6-1
6.8
7*
*6
.06
Lea
d(C
ha
ng
e i
n t
arg
et
rate
)3
.28
**
0.3
62
.98
**
0.3
51
1.7
2*
*0
.43
1.7
52
.53
3.9
5*
*1
.84
-3.5
38
.30
Lea
d2
(Ch
an
ge
in
ta
rge
t ra
te)
3.9
4*
*1
.01
3.9
5*
*0
.99
8.3
1*
*0
.39
-4.3
76
.18
-3.9
13
.70
-2.8
31
2.1
4
AR
(1)
-0.2
5*
*0
.03
-0.2
5*
*0
.02
-0.2
2*
*0
.03
-0.2
8*
*0
.03
-0.1
0*
*0
.03
-0.0
50
.05
-0.2
6*
*0
.05
-0.2
4*
*0
.05
-0.2
3*
*0
.05
AR
(2)
-0.1
5*
*0
.02
-0.1
5*
*0
.02
-0.1
3*
*0
.02
-0.2
8*
*0
.04
-0.2
6*
*0
.03
-0.1
3*
0.0
8-0
.25
**
0.0
4-0
.26
**
0.0
4-0
.25
**
0.0
4
AR
(3)
-0.1
2*
*0
.02
-0.1
2*
*0
.02
-0.1
1*
*0
.02
-0.1
5*
*0
.02
-0.1
2*
*0
.02
0.0
00
.07
-0.2
7*
*0
.04
-0.2
7*
*0
.04
-0.2
7*
*0
.04
AR
(4)
-0.1
2*
*0
.02
-0.1
2*
*0
.02
-0.1
1*
*0
.02
-0.0
3*
0.0
2-0
.03
*0
.02
0.0
00
.07
-0.2
1*
*0
.04
-0.2
2*
*0
.04
-0.2
0*
*0
.04
AR
(5)
-0.0
6*
*0
.02
-0.0
6*
*0
.02
-0.0
6*
*0
.02
-0.0
10
.02
-0.0
20
.01
-0.0
60
.07
-0.1
4*
*0
.04
-0.1
5*
*0
.04
-0.1
3*
*0
.04
AR
(6)
-0.0
8*
*0
.02
-0.0
8*
*0
.02
-0.0
9*
*0
.02
-0.1
4*
*0
.04
-0.2
0*
*0
.04
-0.1
3*
*0
.04
AR
(7)
-0.1
6*
*0
.04
-0.1
7*
*0
.04
-0.1
6*
*0
.04
Co
nst
an
t-5
.96
**
2.1
9-5
.11
**
2.2
1-4
.97
**
2.0
6-4
.99
8.3
0-1
3.0
51
1.7
31
7.2
22
3.0
5-0
.59
2.6
3-1
.08
2.4
7-1
.68
2.6
3
Va
ria
nce
eq
ua
tio
n
Co
nst
an
t9
.82
**
0.4
49
.56
**
0.4
08
.01
**
0.3
73
.86
**
1.2
71
0.5
8*
*1
.65
0.8
4*
*0
.40
3.6
6*
*0
.42
4.2
1*
*0
.53
3.6
9*
*0
.46
Re
sid
(-1
)^2
0.8
1*
*0
.09
0.7
9*
*0
.09
0.5
5*
*0
.07
1.4
2*
*0
.17
1.3
3*
*0
.18
0.2
6*
*0
.05
0.2
4*
*0
.05
0.2
2*
*0
.04
0.1
8*
*0
.05
Re
sid
(-1
)^2
*(R
esi
d(-
1)<
0)
0.5
0*
*0
.14
0.5
1*
*0
.14
0.9
8*
*0
.13
2.1
4*
*0
.45
2.1
0*
*0
.43
0.0
90
.08
Ga
rch
(-1
)0
.00
0.0
10
.00
0.0
10
.03
*0
.02
0.1
5*
*0
.03
0.0
9*
*0
.03
0.7
7*
*0
.01
0.1
8*
*0
.08
0.1
9*
*0
.09
0.1
5*
0.0
8
N1
40
11
40
11
40
14
69
46
94
69
77
57
75
77
5
R-s
qu
are
d0
.23
0.2
20
.20
.07
0.1
20
.12
0.2
40
.15
0.2
4
AIC
5.8
25
.81
5.7
38
.05
7.9
98
.24
.63
4.7
84
.62
Bil
ls
Co
up
on
s
Be
nch
ma
rk:
Jan
ua
ry 2
00
2-A
ug
ust
20
07
Cri
sis:
Au
gu
st 2
00
7-J
un
e 2
00
9P
ost
-cri
sis:
Ju
ly 2
00
9-A
ug
ust
20
12
All
Bil
ls
Co
up
on
sA
llB
ills
C
ou
po
ns
All
37

Tab
le4:
Thelong-run
liquidityeffectin
there
pomark
et
Dep
endentvariab
le:Chan
gein
Treasury
GC
reporate
Se
con
d s
tag
e:
Inst
rum
en
tal
va
ria
ble
re
gre
ssio
ns
for
M3
re
po
co
mp
on
en
t li
qu
idit
y e
ffe
ct
All
Bil
ls
Co
up
on
s
D.r
ep
oD
.re
po
D.r
ep
o
Lag
(co
inte
rm)
-88
.61
9*
-83
.96
2*
-87
.00
8*
(6.0
98
)(8
.39
9)
(6.5
03
)
Ne
t p
ar
ma
rke
tab
le b
orr
ow
ing
0.0
95
*
(0.0
21
)
Ne
t p
ar
bil
ls0
.07
2*
(0.0
25
)
Ne
t p
ar
cou
po
ns
0.0
08
(0.0
69
)
D.(
Re
po
M3
) -0
.45
3-1
.18
9*
*0
.20
9
(0.4
04
)(0
.57
7)
(0.2
97
)
D(s
lop
e o
f y
ield
cu
rve
)-0
.27
9-0
.38
0*
*-0
.24
4
-0.1
97
-0.1
83
-0.1
95
Tre
asu
ry f
ail
s-0
.03
8-0
.05
0*
*-0
.01
4
(0.0
23
)(0
.02
5)
(0.0
19
)
Ch
an
ge
in
fe
de
ral
fun
ds
targ
et
1.0
25
*0
.97
6*
1.0
20
*
(0.0
95
)(0
.11
3)
(0.0
78
)
Co
nst
an
t1
.05
11
.72
-0.5
63
(1.2
09
)(1
.30
0)
(0.9
09
)
Ob
serv
ati
on
s4
21
42
14
21
Ne
we
y-W
est
he
tero
ske
da
stic
-au
toco
rre
lati
on
ro
bu
st e
rro
rs i
n p
are
nth
ese
s.
+ s
ign
ific
an
t a
t 1
0%
; *
* s
ign
ific
an
t a
t 5
%;
* s
ign
ific
an
t a
t 1
%
38

Tab
le5:
Testingth
eexpecta
tionshypoth
esis
71
42
13
06
09
07
14
21
30
60
90
Be
fore
On
e w
ee
k-0
.01
5*
*0
.00
1
(0.0
05
)(0
.00
1)
Tw
o w
ee
ks
-0.0
14
**
0
(0.0
05
)(0
.00
2)
Th
ree
we
ek
s-0
.01
4*
-0.0
02
(0.0
06
)(0
.00
2)
On
e m
on
th-0
.01
3-0
.00
3
(0.0
07
)(0
.00
3)
Tw
o m
on
ths
-0.0
15
-0.0
03
(0.0
08
)(0
.00
5)
Th
ree
mo
nth
s-0
.02
0*
-0.0
06
(0.0
10
)(0
.00
9)
Co
nst
an
t0
.00
4-0
.00
4-0
.00
9-0
.01
8-0
.03
2-0
.04
10
.02
5*
*0
.03
2*
*0
.03
6*
*0
.03
6*
*0
.03
0.0
23
(0.0
15
)(0
.01
4)
(0.0
15
)(0
.01
8)
(0.0
23
)(0
.03
2)
(0.0
04
)(0
.00
6)
(0.0
08
)(0
.01
1)
(0.0
18
)(0
.02
7)
Ob
serv
ati
on
s2
36
82
36
82
36
82
36
82
36
82
36
82
36
82
36
82
36
82
36
82
36
82
36
8
Aft
er
On
e w
ee
k-0
.42
5*
*-0
.06
8
(0.0
36
)(0
.06
4)
Tw
o w
ee
ks
-0.5
05
**
-0.0
75
(0.0
66
)(0
.09
1)
Th
ree
we
ek
s-0
.53
5*
*-0
.09
(0.1
07
)(0
.10
9)
On
e m
on
th-0
.62
7*
*-0
.09
3
(0.0
92
)(0
.10
8)
Tw
o m
on
ths
-0.7
65
**
-0.0
87
(0.1
12
)(0
.14
8)
Th
ree
mo
nth
s-0
.83
5*
*-0
.11
8
(0.0
86
)(0
.19
2)
Co
nst
an
t0
.03
5*
*0
.03
8*
*0
.03
70
.04
9*
0.0
76
*0
.08
5*
*0
.05
1*
*0
.04
9*
*0
.04
7*
*0
.04
6*
*0
.04
0*
0.0
38
(0.0
06
)(0
.01
3)
(0.0
22
)(0
.02
2)
(0.0
31
)(0
.02
9)
(0.0
06
)(0
.00
8)
(0.0
10
)(0
.01
1)
(0.0
16
)(0
.02
2)
Ob
serv
ati
on
s7
52
75
27
52
75
27
52
75
27
52
75
27
52
75
27
52
75
2
Ne
we
y-W
est
sta
nd
ard
err
ors
in
pa
ren
the
ses
* s
ign
ific
an
t a
t 5
%;
**
sig
nif
ica
nt
at
1%
Fe
de
ral
fun
ds
Tre
asu
ry G
C r
ep
o
39