targeted interventions, mapping & health analyses for western tidewater health district
DESCRIPTION
Targeted Interventions, Mapping & Health Analyses for Western Tidewater Health District. Nancy M. Welch, MD, MHA, MBA, Acting Director Western Tidewater Health District October 21, 2010. Why Evaluate?. Responsible Program Management Program Planning Program Implementation - PowerPoint PPT PresentationTRANSCRIPT
1
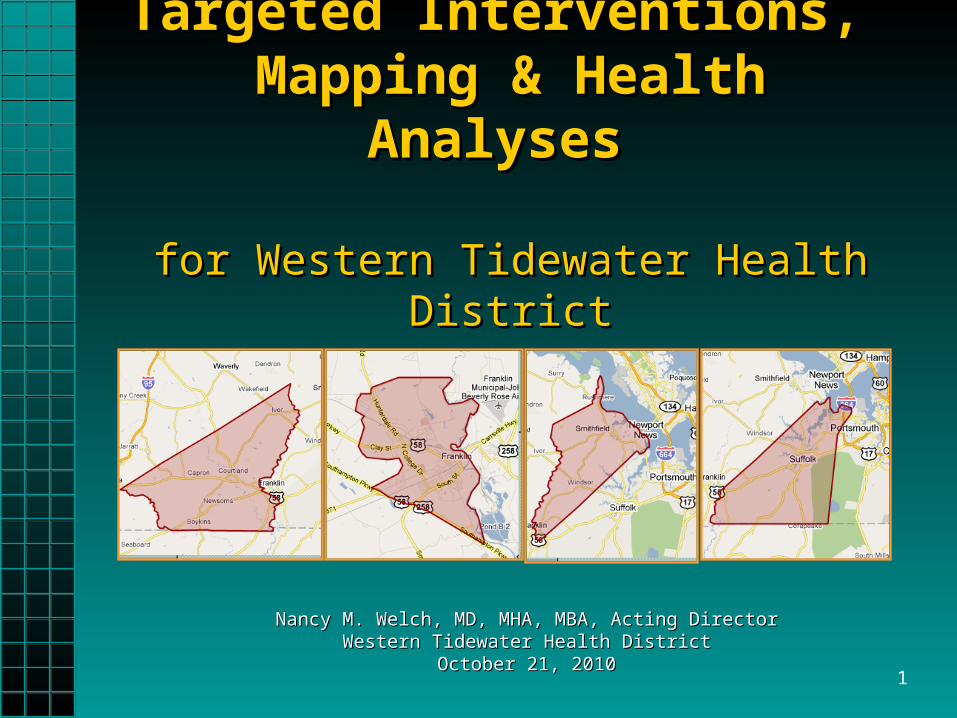
Targeted Interventions, Targeted Interventions, Mapping & Health Mapping & Health
AnalysesAnalyses
for Western Tidewater Health Districtfor Western Tidewater Health District
Nancy M. Welch, MD, MHA, MBA, Acting DirectorNancy M. Welch, MD, MHA, MBA, Acting DirectorWestern Tidewater Health DistrictWestern Tidewater Health District
October 21, 2010October 21, 2010
2
Why Evaluate?Why Evaluate?
• Responsible Program ManagementResponsible Program Management– Program PlanningProgram Planning– Program ImplementationProgram Implementation– Program EffectivenessProgram Effectiveness– Program EfficiencyProgram Efficiency– Cost EffectivenessCost Effectiveness
• Program AccountabilityProgram Accountability– Required by funding agenciesRequired by funding agencies– Justify use of dollarsJustify use of dollars

3
Research vs. EvaluationResearch vs. Evaluation
““Research seeks to Research seeks to proveprove; ;
evaluation seeks to evaluation seeks to improveimprove…”…”
--M. Q. Patton--M. Q. Patton

4
Gather Credible EvidenceGather Credible Evidence
• Start with evaluation purpose and over-Start with evaluation purpose and over-arching questionsarching questions
• Develop indicators--specific, measurableDevelop indicators--specific, measurable
• From whom do you want to collect From whom do you want to collect information?information?
• Determine the best way to measure the Determine the best way to measure the indicatorsindicators
– Data that already existsData that already exists
– New dataNew data
How to Start --How to Start --

5
Trends…Trends…

6
Rates = Mathematical Conversion of Rates = Mathematical Conversion of Absolute NumbersAbsolute Numbers
(as if all represent same population size)(as if all represent same population size)
• Use rates--not absolute numbersUse rates--not absolute numbers
– Benefits:Benefits:
• Honest trend no matter change in Honest trend no matter change in populationpopulation
• Enables comparisonsEnables comparisons
7
Rates -- Examples:Rates -- Examples:
• Disease or Entity Rate per 100,000 Disease or Entity Rate per 100,000 population or 1,000 personspopulation or 1,000 persons
• Risk in different age groupsRisk in different age groups
• Remember “Percent” is also a rateRemember “Percent” is also a rate
8
Su
ffol
k T
een
Pre
gnan
cy R
ates
Su
ffol
k T
een
Pre
gnan
cy R
ates
(per
1,0
00 f
emal
es a
ge 1
0 –
19)
(per
1,0
00 f
emal
es a
ge 1
0 –
19)
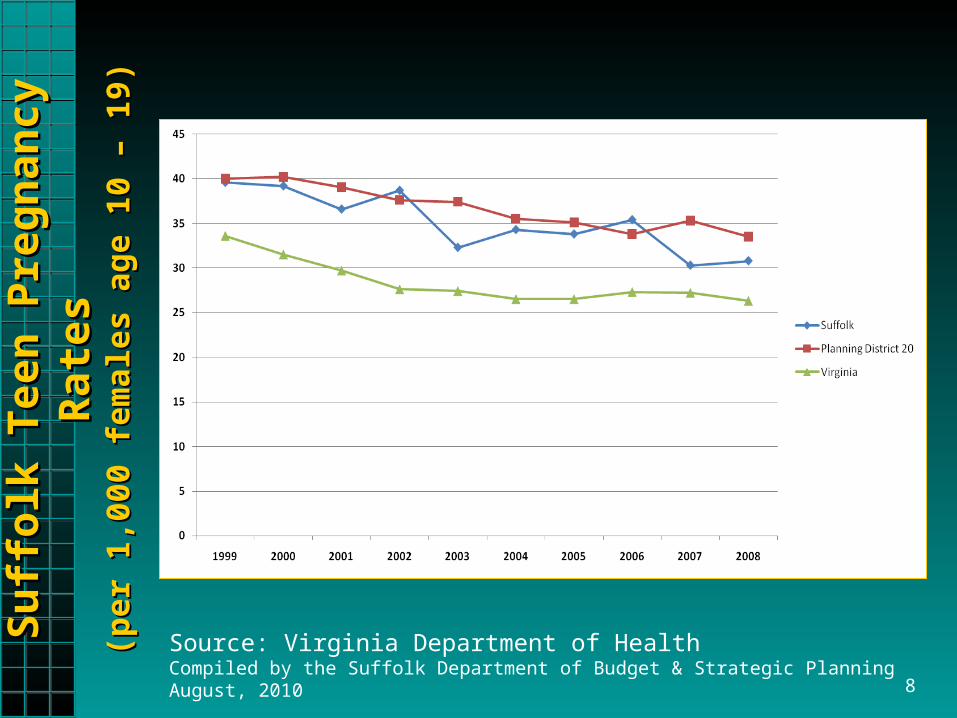
Source: Virginia Department of HealthCompiled by the Suffolk Department of Budget & Strategic Planning August, 2010
9
WT
HD
Tee
n B
irth
Tre
nd
sW
TH
D T
een
Bir
th T
ren
ds
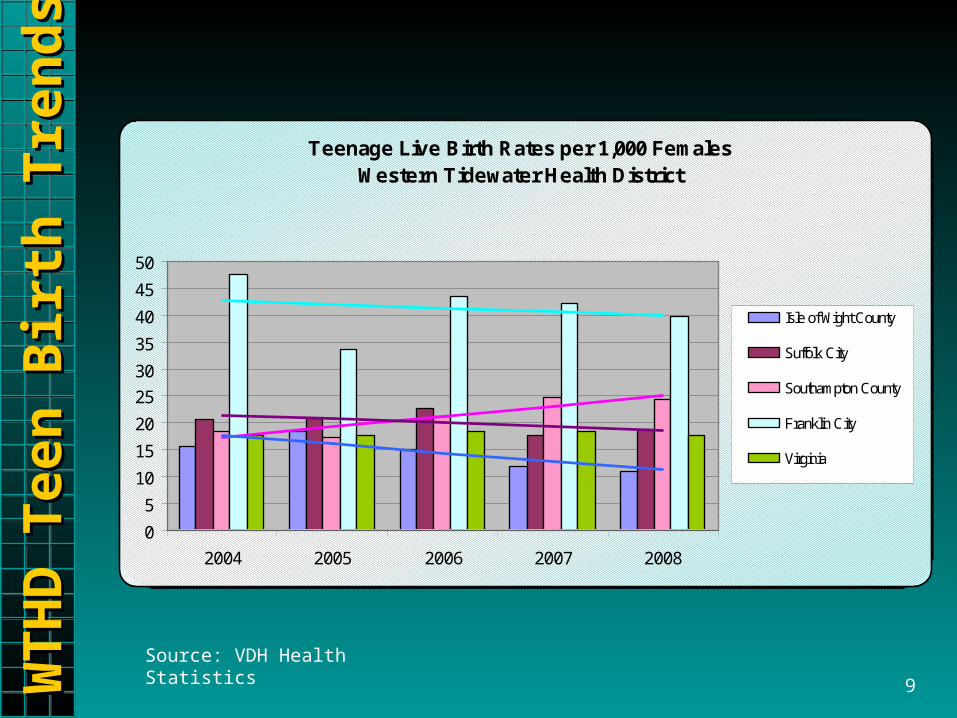
Teenage Live Birth Rates per 1,000 FemalesWestern Tidewater Health District
0
5
10
15
20
25
30
35
40
45
50
2004 2005 2006 2007 2008
Isle of Wight County
Suffolk City
Southampton County
Franklin City
Virginia
Linear (Franklin City )
Linear (SouthamptonCounty )Linear (Suffolk City )
Linear (Isle of WightCounty )
Source: VDH Health Statistics
10
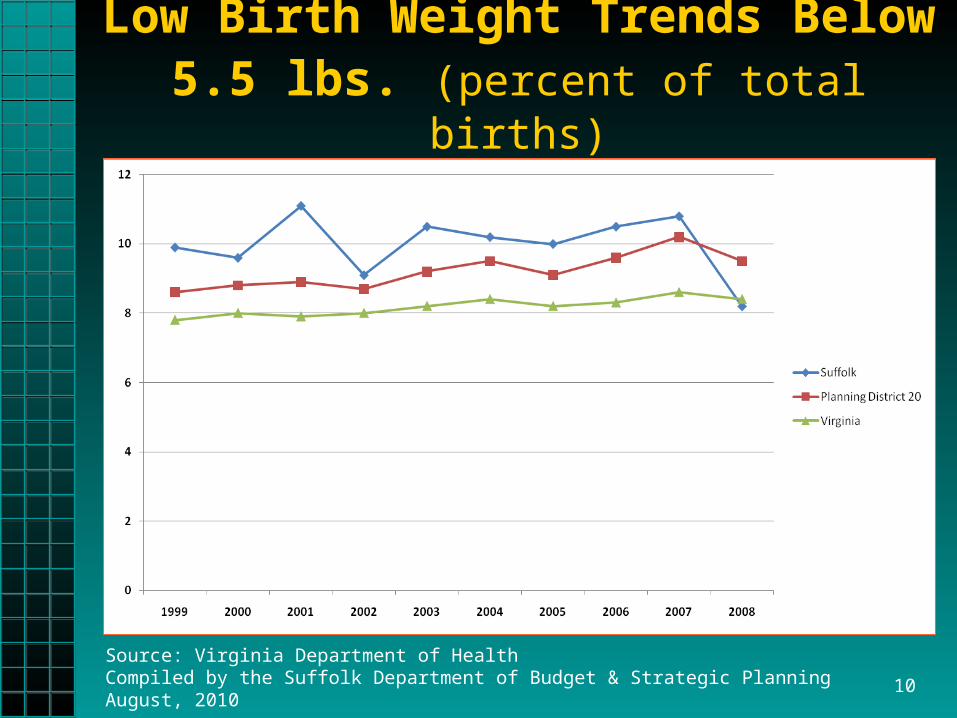
Low Birth Weight Trends Below 5.5 lbs. (percent of total births)
Source: Virginia Department of HealthCompiled by the Suffolk Department of Budget & Strategic Planning August, 2010
11Sex
uall
y T
rans
mit
ted
Dis
ease
sS
exua
lly
Tra
nsm
itte
d D
isea
ses
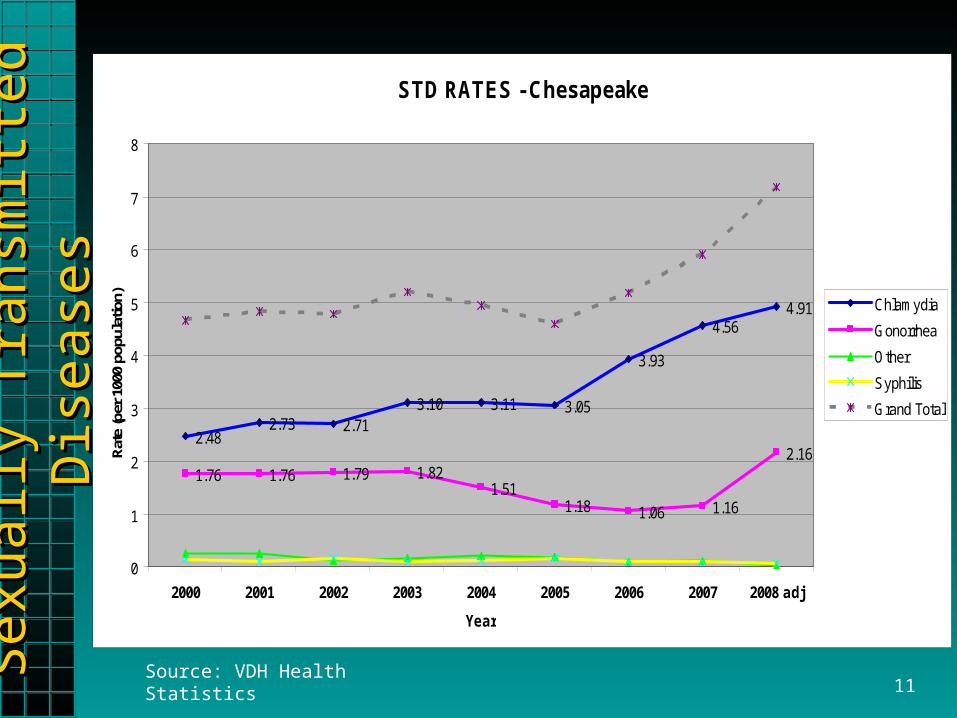
STD RATES - Chesapeake
2.482.73 2.71
3.10 3.11 3.05
3.93
4.564.91
1.76 1.76 1.79 1.821.51
1.18 1.06 1.16
2.16
0
1
2
3
4
5
6
7
8
2000 2001 2002 2003 2004 2005 2006 2007 2008 adj
Year
Rat
e (p
er 1
000
popu
latio
n) Chlamydia
Gonorrhea
Other
Syphilis
Grand Total
Source: VDH Health Statistics
12
Targeted Intervention…Targeted Intervention…
13
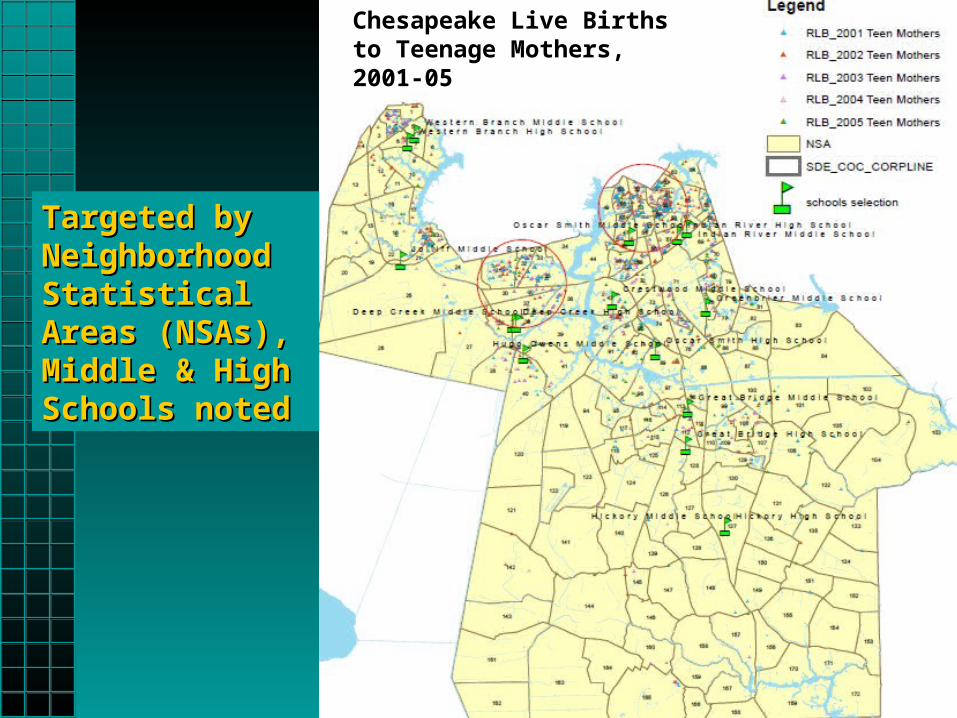
Targeted by Targeted by Neighborhood Neighborhood Statistical Areas Statistical Areas (NSAs), Middle & (NSAs), Middle & High Schools High Schools notednoted
Chesapeake Live Births to Teenage Mothers, 2001-05
14
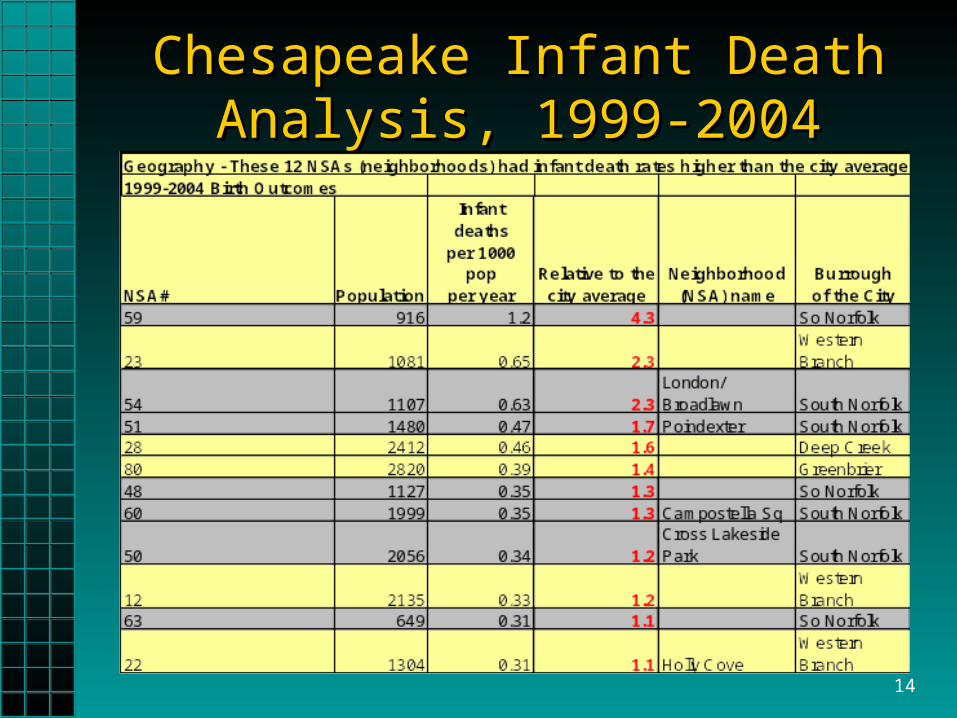
Chesapeake Infant Death Analysis, Chesapeake Infant Death Analysis, 1999-20041999-2004
15
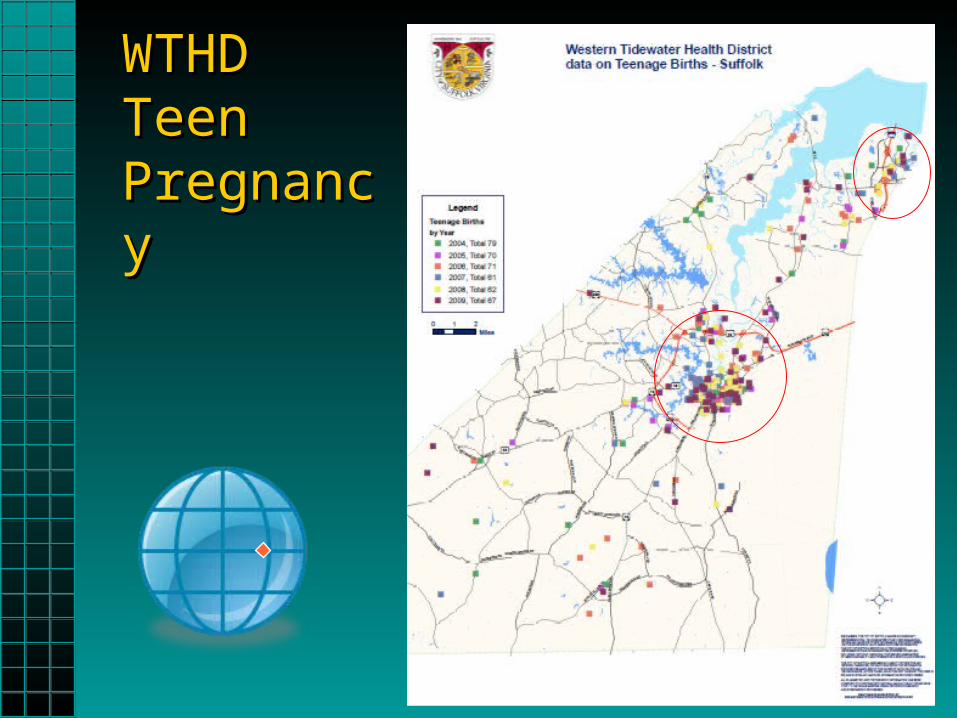
WTHDWTHDTeen Teen PregnancyPregnancy
16
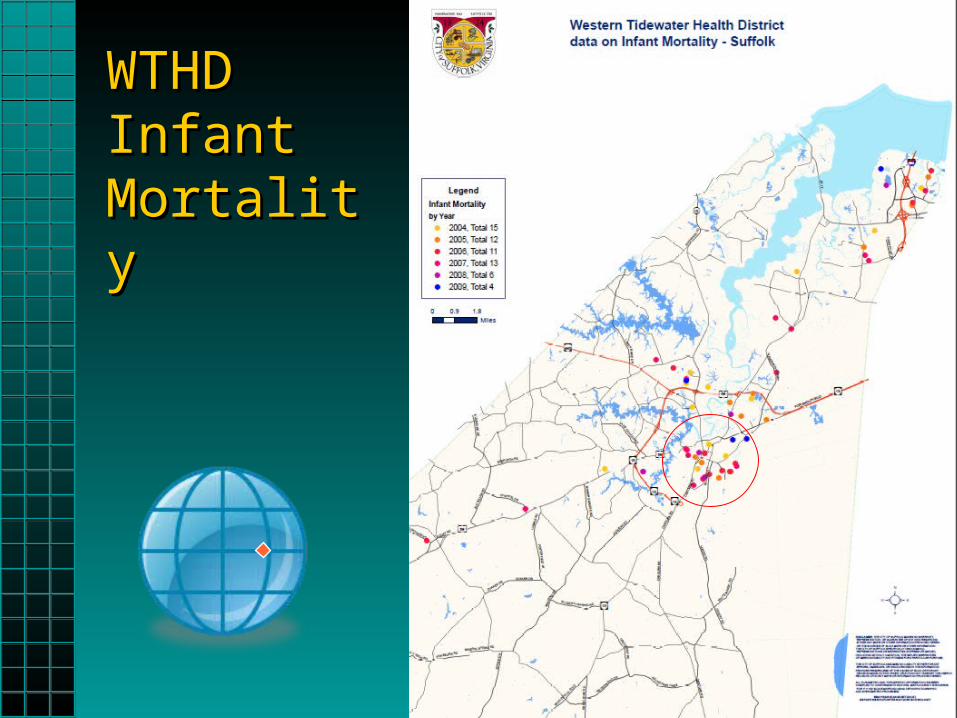
WTHD WTHD Infant Infant MortalityMortality

17

18
Socio-economic Breakdown by Census Tract, Chesapeake-2006
Definitions:Lower income census tract -- both % on Food Stamps & % Receiving TANF are >= the City-wide percentageMedium income census tract -- either % on Food Stamps OR % Receiving TANF is >= the City-wide percentageHighest income census tract -- both % on Food Stamps & % Receiving TANF are < the City-wide percentage

19
Cost Benefit Analysis…Cost Benefit Analysis…
20
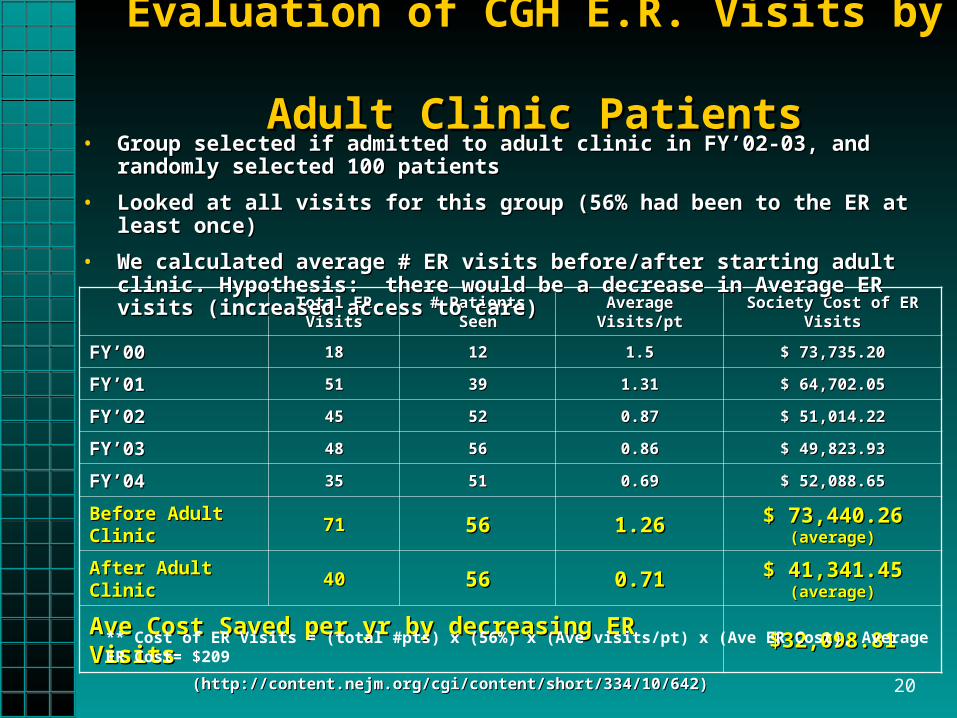
Evaluation of CGH E.R. Visits by Evaluation of CGH E.R. Visits by Adult Clinic PatientsAdult Clinic Patients
Total ER VisitsTotal ER Visits # Patients Seen# Patients Seen Average Visits/ptAverage Visits/pt Society Cost of ER VisitsSociety Cost of ER Visits
FY’00FY’00 1818 1212 1.51.5 $ 73,735.20$ 73,735.20
FY’01FY’01 5151 3939 1.311.31 $ 64,702.05$ 64,702.05
FY’02FY’02 4545 5252 0.870.87 $ 51,014.22$ 51,014.22
FY’03FY’03 4848 5656 0.860.86 $ 49,823.93$ 49,823.93
FY’04FY’04 3535 5151 0.690.69 $ 52,088.65$ 52,088.65
Before Adult ClinicBefore Adult Clinic 7171 5656 1.261.26 $ 73,440.26 $ 73,440.26 (average)(average)
After Adult ClinicAfter Adult Clinic 4040 5656 0.710.71 $ 41,341.45 $ 41,341.45 (average)(average)
Ave Cost Saved per yr by decreasing ER VisitsAve Cost Saved per yr by decreasing ER Visits $32,098.81$32,098.81
** Cost of ER Visits = (total #pts) x (56%) x (Ave visits/pt) x (Ave ER Cost), Average ER Cost= $209
(http://content.nejm.org/cgi/content/short/334/10/642)(http://content.nejm.org/cgi/content/short/334/10/642)
• Group selected if admitted to adult clinic in FY’02-03, and randomly selected Group selected if admitted to adult clinic in FY’02-03, and randomly selected 100 patients 100 patients
• Looked at all visits for this group (56% had been to the ER at least once)Looked at all visits for this group (56% had been to the ER at least once)
• We calculated average # ER visits before/after starting adult clinic. Hypothesis: We calculated average # ER visits before/after starting adult clinic. Hypothesis: there would be a decrease in Average ER visits (increased access to care)there would be a decrease in Average ER visits (increased access to care)
21
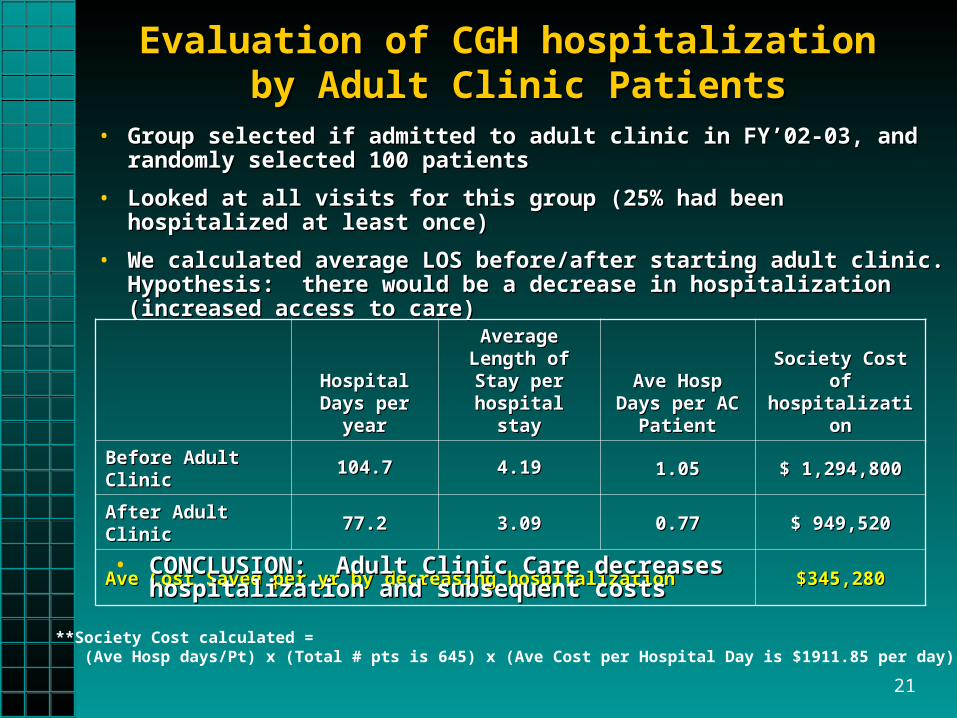
Evaluation of CGH hospitalization Evaluation of CGH hospitalization by Adult Clinic Patientsby Adult Clinic Patients
• Group selected if admitted to adult clinic in FY’02-03, and randomly selected Group selected if admitted to adult clinic in FY’02-03, and randomly selected 100 patients 100 patients
• Looked at all visits for this group (25% had been hospitalized at least once)Looked at all visits for this group (25% had been hospitalized at least once)
• We calculated average LOS before/after starting adult clinic. Hypothesis: We calculated average LOS before/after starting adult clinic. Hypothesis: there would be a decrease in hospitalization (increased access to care)there would be a decrease in hospitalization (increased access to care)
Hospital Days Hospital Days per yearper year
Average Length Average Length of Stay per of Stay per
hospital stayhospital stayAve Hosp Days Ave Hosp Days per AC Patientper AC Patient
Society Cost of Society Cost of hospitalizationhospitalization
Before Adult ClinicBefore Adult Clinic 104.7104.7 4.194.19 1.051.05 $ 1,294,800$ 1,294,800
After Adult ClinicAfter Adult Clinic 77.277.2 3.093.09 0.770.77 $ 949,520$ 949,520
Ave Cost Saved per yr by decreasing hospitalizationAve Cost Saved per yr by decreasing hospitalization $345,280$345,280
• CONCLUSION: Adult Clinic Care decreases hospitalization and CONCLUSION: Adult Clinic Care decreases hospitalization and subsequent costssubsequent costs
**Society Cost calculated = (Ave Hosp days/Pt) x (Total # pts is 645) x (Ave Cost per Hospital Day is $1911.85 per day)
22
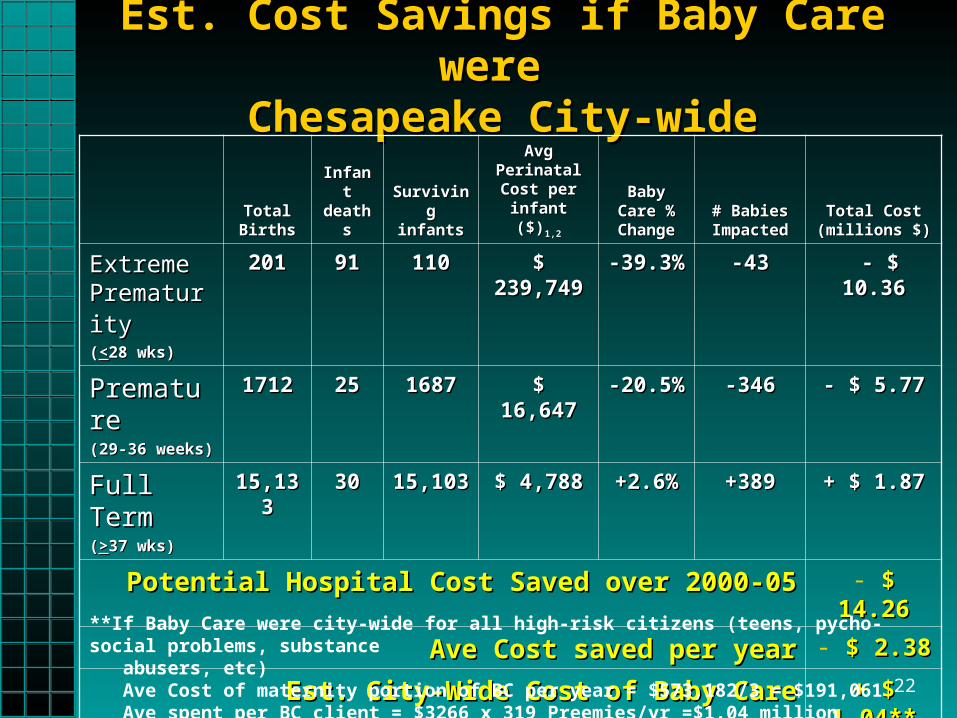
Est. Cost Savings if Baby Care were Est. Cost Savings if Baby Care were Chesapeake City-wideChesapeake City-wide
Total Total BirthsBirths
Infant Infant deathsdeaths
Surviving Surviving infantsinfants
Avg Avg Perinatal Perinatal Cost per Cost per
infant ($)infant ($)1,21,2
Baby Baby Care % Care % ChangeChange
# Babies # Babies ImpactedImpacted
Total Cost Total Cost (millions $)(millions $)
Extreme Extreme PrematurityPrematurity ((<<28 wks)28 wks)
201201 9191 110110 $ 239,749$ 239,749 -39.3%-39.3% -43-43 - $ 10.36- $ 10.36
Premature Premature (29-36 weeks)(29-36 weeks)
17121712 2525 16871687 $ 16,647$ 16,647 -20.5%-20.5% -346-346 - $ 5.77- $ 5.77
Full Term Full Term ((>>37 wks)37 wks)
15,13315,133 3030 15,10315,103 $ 4,788$ 4,788 +2.6%+2.6% +389+389 + $ 1.87+ $ 1.87
Potential Hospital Cost Saved over 2000-05Potential Hospital Cost Saved over 2000-05 - $ 14.26$ 14.26
Ave Cost saved per yearAve Cost saved per year - $ 2.38 $ 2.38
Est. City-Wide Cost of Baby CareEst. City-Wide Cost of Baby Care + $ 1.04**+ $ 1.04**
Return on InvestmentReturn on Investment 129%129%**If Baby Care were city-wide for all high-risk citizens (teens, pycho-social problems, substance abusers, etc) Ave Cost of maternity portion of BC per year = $573,182/3 = $191,061 Ave spent per BC client = $3266 x 319 Preemies/yr =$1.04 million
23
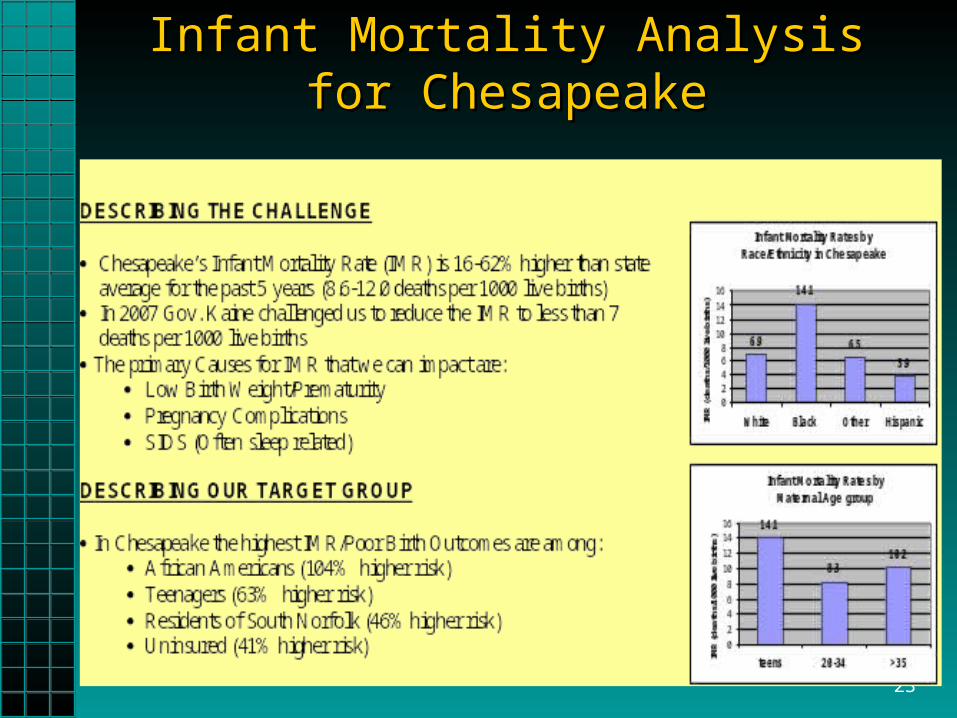
Infant Mortality Analysis for ChesapeakeInfant Mortality Analysis for Chesapeake
24
25
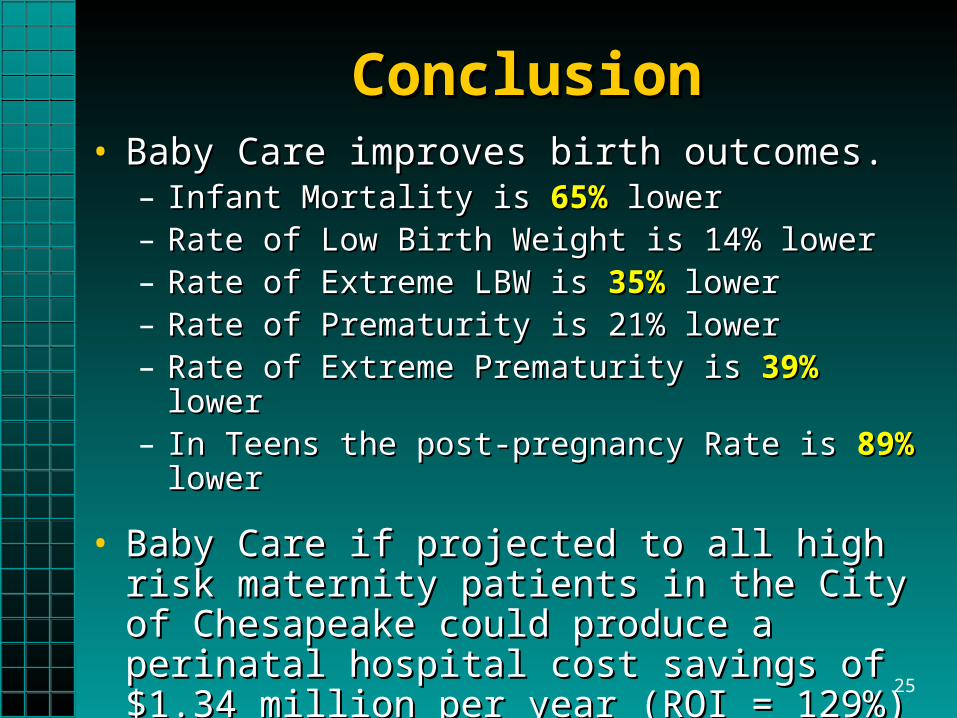
ConclusionConclusion• Baby Care improves birth outcomes.Baby Care improves birth outcomes.
– Infant Mortality is Infant Mortality is 65%65% lower lower– Rate of Low Birth Weight is 14% lowerRate of Low Birth Weight is 14% lower– Rate of Extreme LBW is Rate of Extreme LBW is 35%35% lower lower– Rate of Prematurity is 21% lowerRate of Prematurity is 21% lower– Rate of Extreme Prematurity is Rate of Extreme Prematurity is 39%39% lower lower– In Teens the post-pregnancy Rate is In Teens the post-pregnancy Rate is 89%89% lower lower
• Baby Care if projected to all high risk maternity Baby Care if projected to all high risk maternity patients in the City of Chesapeake could patients in the City of Chesapeake could produce a perinatal hospital cost savings of produce a perinatal hospital cost savings of $1.34 million per year (ROI = 129%) by reducing $1.34 million per year (ROI = 129%) by reducing premature births.premature births.

26
Questions?Questions?