targeted knockout of ppors encoding an ancient type iii
TRANSCRIPT

Targeted knockout of PpORS encoding an ancient type III polyketide synthase
in the moss Physcomitrella patens
A Thesis
Submitted to the Faulty of Graduate Studies and Research
In Partial Fulfillment of the Requirements
For the Degree of
Master of Science
in
Biochemistry
University of Regina
By
Li Li
Regina, Saskatchewan
December, 2015
Copyright 2015: L. Li
UNIVERSITY OF REGINA
FACULTY OF GRADUATE STUDIES AND RESEARCH
SUPERVISORY AND EXAMINING COMMITTEE
Li Li, candidate for the degree of Master of Science in Biochemistry, has presented a thesis titled, Targeted knockout of PpORS encoding an ancient type III polyketide synthase in the moss Physomitrella patens, in an oral examination held on December 11, 2015. The following committee members have found the thesis acceptable in form and content, and that the candidate demonstrated satisfactory knowledge of the subject material. External Examiner: Dr. Harold Weger, Department of Biology
Supervisor: Dr. Dae-Yeon Suh, Department of Chemistry and Biochemistry
Committee Member: Dr. Neil Ashton, Department of Biology
Committee Member: Dr. Tanya Dehms, Department of Chemistry and Biochemistry
Chair of Defense: Dr. Maria Velez, Department of Geology *Not present at defense

i
Abstract
The ubiquitous presence of type III polyketide synthases (PKS) in the plant
kingdom suggests their important roles in plant evolution. Among plant type III PKSs,
PpORS from the model moss, Physcomitrella patens, has previously been suggested to
closely resemble the most recent common ancestor of plant type III PKSs. In vitro
analysis of PpORS revealed its function as a 2'-oxoalkylresorcinol synthase. PpORS is
highly expressed in gametophores, but not in protonema. This, together with previous
phytochemical analysis, suggested that in planta PpORS products may be incorporated
into the moss cuticular structure to confer protection from environmental stresses. In this
study, to gain insight into the in planta function of PpORS, PpORS was targeted for
knockout in Physcomitrella. Three stable transformants were confirmed by PCR,
Southern blot and RT-PCR, and PpORS stable transformants (ors) were phenotypically
analyzed. Ors plants were similar to the wild-type plant in developmental characteristics,
including branch numbers and spore viability. Both the wild-type and ors plants
responded similarly to UV-B irradiation, suggesting that UV protection is not a main
function of PpORS. In contrast, abnormal leaves, including (i) curly leaves with a large
number of protuberances, (ii) highly deformed leaves, (iii) irregularly shaped leaves, and
(iv) leaves with cell outgrowths on the surface or margin, were frequently observed in
ors. Abnormal leaves were heavily stained by a hydrophilic dye Toluidine Blue O,
whereas both normal and abnormal leaves were stained by Sudan IV. Interestingly, the
incidence of morphological abnormalities in ors leaves significantly decreased with
water immersion treatment. These results suggest that ors shoots may be covered with a
defective cuticle layer.

ii
Acknowledgements
Firstly, I would like to express my sincere gratitude to my advisor, Dr. Dae-Yeon
Suh, for his patience, enthusiasm and the continuous support throughout my study. His
guidance helped me in all the time of research and writing of this thesis. Besides my
advisor, I would also like to thank Dr. Neil Ashton for providing the use of his laboratory
space and equipment, and his insightful comments, encouragement and immense
knowledge. My sincere thanks also go to Drs. Tomoaki Nishiyama and Mitsuyasu
Hasebe for providing the pTN182 vector.
I would like to show my gratitude to my fellow labmates, especially Rhys Daku,
Fazle Rabbi, Dr. Sun Young Kim and Dr. Elizabeth Barker for their help and guidance.
I must also acknowledge my family and friends, especially my parents, Yanping
Zhang and Hongsheng Li, for the endless love and support they provided me through my
entire life. Thank you both for giving me the strength to pursue my dreams and your
understanding and encouragement in my many moments of crisis.
I gratefully appreciate funding provided by the Natural Sciences and Engineering
Research Council of Canada, the Faculty of Graduate Studies and Research, and the
Department of Chemistry and Biochemistry.

iii
Table of Contents
Abstract ............................................................................................................................... i
Acknowledgements ............................................................................................................ ii
List of Tables .................................................................................................................... vi
List of Figures .................................................................................................................. vii
List of Appendices .......................................................................................................... viii
List of Abbreviations ........................................................................................................ ix
1. Introduction .................................................................................................................... 1
1.1 Plant type III polyketide synthases ........................................................................... 1
1.2 Physcomitrella patens as a model system for the study of land plant evolution ...... 2
1.3 Phylogenetic analysis of plant type III PKSs ........................................................... 2
1.4 Enzymatic properties and expression profile of PpORS .......................................... 3
1.4.1 In vitro and in planta functions of PpORS ........................................................ 3
1.4.2 Expression profile of PpORS ............................................................................. 7
1.5 Hypothesis of PpORS in planta functions ............................................................... 8
1.6 Objective ................................................................................................................ 10
2. Material and methods ................................................................................................... 11
2.1 Plant material, media and culture conditions ......................................................... 11
2.2 Preparation for PpORS knockout ........................................................................... 12
2.3 Physcomitrella transformation and selection of stable transformants .................... 12
2.4 Confirmation of single target insertion by PCR and Southern blot analyses ......... 14
2.4.1 gDNA extraction .............................................................................................. 14
2.4.2 PCR analysis for confirmation of homologous recombination ....................... 15

iv
2.4.3 Confirmation of single target insertion by Southern blot analysis .................. 15
2.5 RT-PCR analysis .................................................................................................... 16
2.6 Phenotypic analysis ................................................................................................ 17
2.6.1 Gametophytic morphology of pabB4 and ors ................................................. 17
2.6.2 Phenotypic analysis of sporophytes and spores ............................................... 17
2.6.3 Spore viability .................................................................................................. 18
2.6.4 Cytochemical analysis ..................................................................................... 19
2.6.5 UV irradiation .................................................................................................. 19
2.6.6 Water immersion treatment ............................................................................. 20
3. Results .......................................................................................................................... 21
3.1 Molecular analyses of stable transformants ........................................................... 21
3.1.1 PCR analysis for PpORS allele replacement ................................................... 21
3.1.2 Southern blot analysis ...................................................................................... 21
3.1.3 RT-PCR analysis ............................................................................................. 24
3.2 Phenotypic analyses of stable transformants .......................................................... 24
3.2.1 Morphological differences between pabB4 and ors gametophyte................... 24
3.2.2 Sporophytic and spore morphology of pabB4 and ors .................................... 35
3.2.3 Spore viability .................................................................................................. 35
3.2.4 Cytochemical analysis ..................................................................................... 39
3.2.5 Protection from UV irradiation ........................................................................ 49
3.2.6 The effect of water immersion on the development of abnormal leaves ......... 49
4. Discussion .................................................................................................................... 53
4.1 Confirmation of knockout strains of PpORS by molecular analyses ..................... 53
v
4.2 Morphology of ors leaves ....................................................................................... 53
4.3 Cytochemical comparison between pabB4 and the three ors strains ..................... 55
4.4 UV irradiation study .............................................................................................. 57
4.5 Effects of water immersion on the development of abnormal leaves on ors ......... 58
5. Conclusion and future works ....................................................................................... 59
References ........................................................................................................................ 60
APPENDIX A .................................................................................................................. 65
APPENDIX B .................................................................................................................. 67

vi
List of Tables
Table 1. List of primers used in this study. ..................................................................... 13
Table 2. Effects of water immersion on the development of abnormal leaves. .............. 52

vii
List of Figures
Figure 1. Type III PKSs that produce alkylresorcylic lipids. ............................................ 5
Figure 2. Strategy for targeted knockout of PpORS and genotyping the resulting stable
transformants by PCR. ..................................................................................... 23
Figure 3. Southern blot analysis. ..................................................................................... 27
Figure 4. RT-PCR analysis of PpORS expression in pabB4 and ors. ............................. 28
Figure 5. Comparison of gametophyte growth rate of pabB4 and ors. ........................... 29
Figure 6. Protonemal development of pabB4 and ors. ................................................... 30
Figure 7. Abnormal leaves found on ors gametophytic shoots. ...................................... 33
Figure 8. Phenotypic analyses of pabB4 and ors. ........................................................... 34
Figure 9. Morphological comparison of pabB4 and ors sporophytes. ............................ 36
Figure 10. Morphological comparison of mature spores from pabB4 and ors. .............. 37
Figure 11. Germination of mature spores from pabB4 and ors. ..................................... 38
Figure 12. Bright-field microscopic images of TBO stained gametophytic shoots. ....... 41
Figure 13. Bright-field microscopic images of TBO stained abnormal leaves. .............. 44
Figure 14. Bright-field microscopic images of Sudan IV stained gametophytic shoots. 45
Figure 15. Bright-field microscopic images of Sudan IV stained leaves. ....................... 46
Figure 16. Bright-field microscopic images of TBO and Sudan IV stained sporophytes.
.......................................................................................................................................... 48
Figure 17. Gametophytic growth after UV-B irradiation. ............................................... 51

viii
List of Appendices
APPENDIX A– Raw Data of the Percentage of Shoots with Abnormal Leaves. ........... 65
APPENDIX B– Raw Data of the Water Immersion Effect Experiments. ...................... 67

ix
List of Abbreviations
ARAS alkylresorcylic acid synthase
ASCL anther-specific chalcone synthase-like enzyme
bp base pair
CaMV cauliflower mosaic virus
CSPD chloro-5-substituted adamantyl-1,2-dioxetane phosphate
CHS chalcone synthase
EST expressed sequence tag
LACS long-chain acyl-CoA synthetase
MRCA most recent common ancestor
NcORAS Neurospora crassa oxoalkylresorcylic acid synthase
nptII neomycin phosphotransferase II
paba para-aminobenzoic acid
PCR polymerase chain reaction
PEG polyethylene glycol
PKS polyketide synthase
SDS sodium dodecyl sulfate
SSC saline sodium citrate
TBO Toluidine blue O
UTR untranslated region
VLCFA-CoA very long chain fatty acyl-CoA esters
1
1. Introduction
1.1 Plant type III polyketide synthases
Polyketide natural products are a diverse group of secondary metabolites produced
by polyketide synthases (PKSs), and there are three types of PKSs. Type I and II PKSs
are commonly found in fungi and bacteria. In contrast, type III PKSs are found only in
selective species of microorganisms, while ubiquitous in plants (Katsuyama and Ohnishi,
2012). There are more than 20 different type III PKSs in plants, including chalcone
synthase (CHS), stilbene synthase and alkylresorcinol synthase. The diversity of plant
type III PKSs is the consequence of gene duplication and functional diversification. They
are collectively responsible for producing different plant secondary metabolites. For
example, flavonoids are involved in UV protection; alkylresorcinols are responsible for
antifungal defense; and flavonols participate in pollen tube growth. CHS is the
representative member of the plant-specific type III PKSs, and it is also the first type III
PKS discovered based on its important role in flavonoid biosynthesis (Austin and Noel,
2003). CHS is responsible for the production of chalcone, which is the precursor of
diverse flavonoids.
As mentioned above, type III PKSs are ubiquitous in plants, while found in only
selected species in microorganisms. This suggests that type III PKSs successfully co-
evolved with plants, and also raises the question of what roles ancestral plant type III
PKSs played during the early evolution of land plants. About 500 million years ago,
early land plants began to adapt to terrestrial environments by, among other things,
producing protective metabolites to overcome various stresses. Such stresses included

2
UV radiation, desiccation, and microbe attack and physical abrasion. The extracellular
matrices such as cutin, sporopollenin and lignin were developed by land plants to protect
themselves from desiccation and gravity (Bowman et al., 2007). Bryophytes, including
mosses, liverworts and hornworts, are the earliest-diverging lineages of all land plants,
and are thought to be the closest living relatives of early land plants. Therefore,
bryophytes have been studied as the optimal plant model for the study of early plant
evolution.
1.2 Physcomitrella patens as a model system for the study of land plant evolution
In addition to being among the oldest non-vascular land plants, mosses have
unique genetic and biological properties. The dominant development stage in mosses is
the haploid gametophyte, and mosses can rapidly develop under simple growth
conditions. Recently, the moss Physcomitrella patens has been chosen as a model
bryophyte (Quatrano et al., 2007). The Physcomitrella genome has been sequenced, and
a large number of expressed sequence tag (EST) sequences are available from different
tissues of the plant (Nishiyama et al., 2003). Physcomitrella is the first moss that was
genetically transformed, and it has been accepted as one of the most important model
plants for the studies of plant physiology and land plant evolution (Schaefer and Zryd,
2001).
1.3 Phylogenetic analysis of plant type III PKSs
The Physcomitrella genome contains 21 putative type III PKS genes (Koduri et al.,
2010). Of the 21 PKS genes, 16 genes are closely related, with >90% deduced amino
acid sequence identity, and most likely encode CHSs (Jiang et al., 2006). On the other
3
hand, PpORS (formerly PpCHS11) shows 36% of deduced amino acid sequence identity
to a Physcomitrella CHS (Koduri et al., 2010). An earlier phylogenetic analysis showed
that PpORS is positioned next to a cyanobacterial type III PKS and forms a separate
sister group to the other members of the Physcomitrella type III PKSs in phylogenetic
trees (Jiang et al., 2008). Later, an expanded phylogenetic analysis of the plant type III
PKSs revealed that PpORS and its two paralogs from Physcomitrella are separated from
the rest of plant type III PKSs, and they form a unique clade at the base of the
phylogenetic tree (Kim et al., 2013). Therefore, PpORS appears to closely resemble the
most recent common ancestor (MRCA) of plant type III PKSs. Subsequently, the in vitro
enzymatic properties of PpORS have been studied.
1.4 Enzymatic properties and expression profile of PpORS
1.4.1 In vitro and in planta functions of PpORS
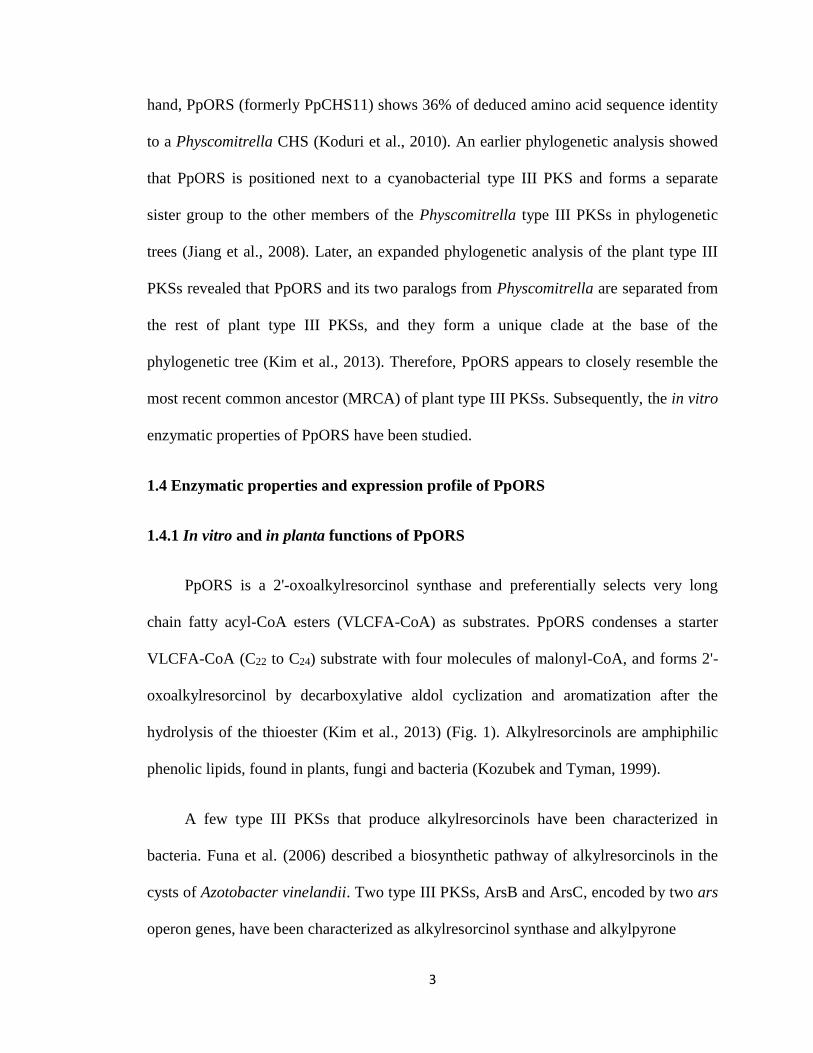
PpORS is a 2'-oxoalkylresorcinol synthase and preferentially selects very long
chain fatty acyl-CoA esters (VLCFA-CoA) as substrates. PpORS condenses a starter
VLCFA-CoA (C22 to C24) substrate with four molecules of malonyl-CoA, and forms 2'-
oxoalkylresorcinol by decarboxylative aldol cyclization and aromatization after the
hydrolysis of the thioester (Kim et al., 2013) (Fig. 1). Alkylresorcinols are amphiphilic
phenolic lipids, found in plants, fungi and bacteria (Kozubek and Tyman, 1999).
A few type III PKSs that produce alkylresorcinols have been characterized in
bacteria. Funa et al. (2006) described a biosynthetic pathway of alkylresorcinols in the
cysts of Azotobacter vinelandii. Two type III PKSs, ArsB and ArsC, encoded by two ars
operon genes, have been characterized as alkylresorcinol synthase and alkylpyrone

4
O
S CoA
malonyl-CoA
2'-oxoalkylresorcinol
2'-oxoalkylresorcylic acid
ArsB
alkylresorcylic acid
2 malonyl-CoA
malonyl-CoA
O O O
S CoA
O O O O
S CoA
O O O O O
S CoA
OH
OH
OH
OH
O OH
O
OH
OH
O
OH
OH
OHO
alkylresorcinol
R
R
R
R
RARAS
R
R
ORAS
R
ORS

5
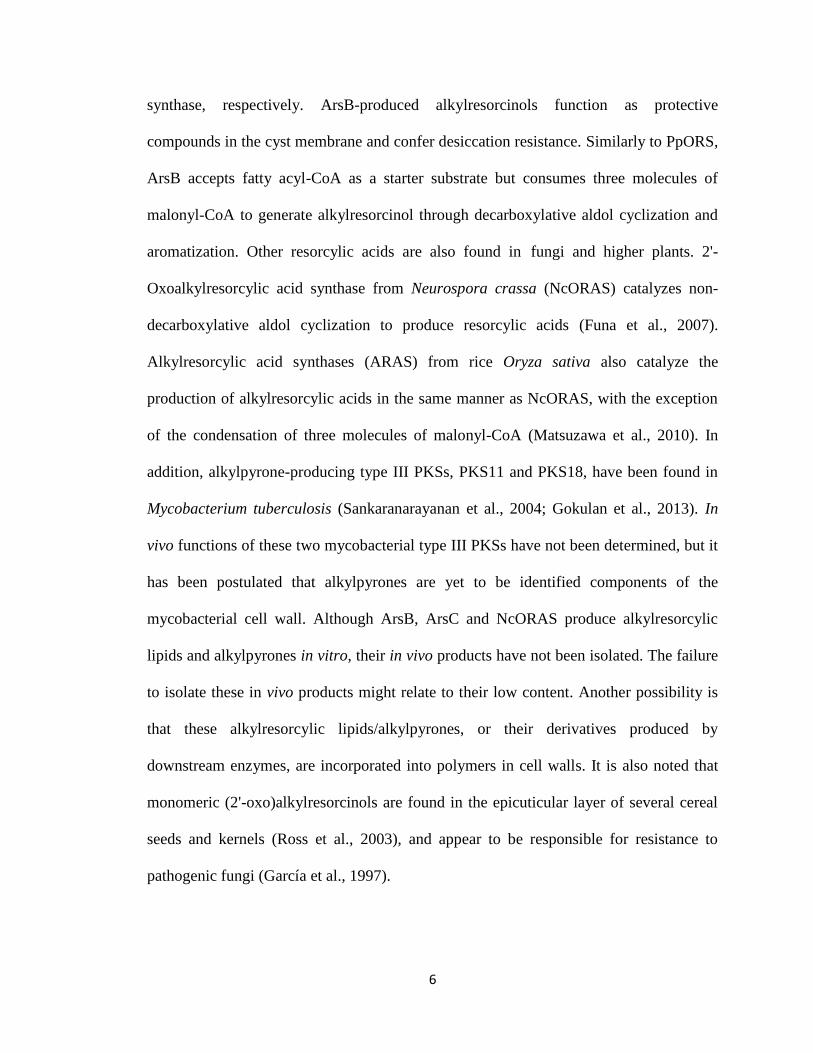
Figure 1. Type III PKSs that produce alkylresorcylic lipids.
Diverse type III PKSs iteratively condense a fatty acyl-CoA ester with malonyl-CoAs to
produce different linear polyketide intermediates, which are converted to corresponding
resorcylic acids or resorcinols by aldol cyclization or decarboxylative aldol cyclization
respectively. ARAS, alkylresorcylic acid synthase; ORAS, 2'-oxoalkylresorcylic acid
synthase; ORS, 2'-oxoalkylresorcinol synthase.
6
synthase, respectively. ArsB-produced alkylresorcinols function as protective
compounds in the cyst membrane and confer desiccation resistance. Similarly to PpORS,
ArsB accepts fatty acyl-CoA as a starter substrate but consumes three molecules of
malonyl-CoA to generate alkylresorcinol through decarboxylative aldol cyclization and
aromatization. Other resorcylic acids are also found in fungi and higher plants. 2'-
Oxoalkylresorcylic acid synthase from Neurospora crassa (NcORAS) catalyzes non-
decarboxylative aldol cyclization to produce resorcylic acids (Funa et al., 2007).
Alkylresorcylic acid synthases (ARAS) from rice Oryza sativa also catalyze the
production of alkylresorcylic acids in the same manner as NcORAS, with the exception
of the condensation of three molecules of malonyl-CoA (Matsuzawa et al., 2010). In
addition, alkylpyrone-producing type III PKSs, PKS11 and PKS18, have been found in
Mycobacterium tuberculosis (Sankaranarayanan et al., 2004; Gokulan et al., 2013). In
vivo functions of these two mycobacterial type III PKSs have not been determined, but it
has been postulated that alkylpyrones are yet to be identified components of the
mycobacterial cell wall. Although ArsB, ArsC and NcORAS produce alkylresorcylic
lipids and alkylpyrones in vitro, their in vivo products have not been isolated. The failure
to isolate these in vivo products might relate to their low content. Another possibility is
that these alkylresorcylic lipids/alkylpyrones, or their derivatives produced by
downstream enzymes, are incorporated into polymers in cell walls. It is also noted that
monomeric (2'-oxo)alkylresorcinols are found in the epicuticular layer of several cereal
seeds and kernels (Ross et al., 2003), and appear to be responsible for resistance to
pathogenic fungi (García et al., 1997).

7
In an attempt to determine if in planta products of PpORS are present either in
monomeric or polymeric forms, Physcomitrella gametophore tissues were extracted with
acetone and the extract was analyzed with thin-layer chromatography. No
(oxo)alkylresorcinols were detected with Fast Blue B staining even after alkali treatment
(Kim et al., 2013). This suggested that in planta products of PpORS may exist in
monomeric forms at a level below the detection limit or as a part of polymeric
structure(s). That PpORS produces in vitro oxoalkyresorcinols, but not alkylresorcinols,
suggests that the oxo group may be important for in planta functions of the PpORS
products. Anther-specific chalcone synthase-like enzyme (ASCL) is a plant type III PKS
that is involved in sporopollenin biosynthesis (Kim et al., 2010). The oxo group in the
ASCL-produced 2'-oxoalkylpyrone was shown to be reduced to a hydroxyl group by
downstream reductases for polymerization in the pollen cell wall (Grienenberger et al.,
2010). PpORS-produced oxoalkylresorcinols may also be reduced by downstream
reductase(s) to generate an additional hydroxyl group that may be used for cross-linking
through an ester or ether bond.
1.4.2 Expression profile of PpORS
In order to examine the expression pattern of PpORS, EST abundance and
transcriptome data were analyzed. The NCBI UniGene transcriptome database, which
contains EST libraries prepared from different Physcomitrella tissues, indicates that
PpORS is highly expressed in the upper half of gametophores, in gametangia, and in
shoot apices with antheridia and archegonia, but is less expressed in green sporophytes
and sporophytes with surrounding archegonia. In addition, no evidence is found for
PpORS expression in protonemata and regenerated protoplasts. The results obtained

8
from a microarray analysis supported the expression pattern inferred from the EST data
(Kim et al., 2013). Moreover, according to the gene expression data available from an
online source (https://www.genevestigator.com/gv/plant.jsp), the expression of PpORS is
up-regulated by exposure to sunlight or UV-B (305 nm), and after dedifferentiation
(growth of filaments from detached leaflets) (Busch et al., 2013).
1.5 Hypothesis of PpORS in planta functions
As discussed above, evolution of the developmental innovations of cuticle and
lignin or lignin-like materials in land plants was crucial for their adaption to and
ultimately their dominance of the terrestrial ecosystem.
Ultrastructure of the cuticle is highly varied among different plant species and
developmental stages. Nevertheless, the typical plant cuticles covering the outside of
epidermal cell walls mainly consist of two components: cuticular wax and cutin polymer
matrix. From the outermost to the innermost, plant cuticle is composed of several layers;
they are the epicuticular wax layer deposited to the outside of the cutin polymer, the
cuticle proper, also known as the intracuticular wax layer, which is interlocked with the
cutin polymer, and the cuticular layer which contains cutin, intracuticular waxes and
polysaccharides of the cell wall (Pollard et al., 2008). Although plant cuticles are mainly
hydrophobic, the presence of hydrophilic materials, such as cell wall polysaccharides,
has been revealed in previous studies. These polysaccharide fibrils were found to be
impregnated within the cuticle layer and capable of reaching the outer surface allowing
for the transport of water and other hydrophilic materials through the cuticles (Burghardt
and Riederer, 2006). Moreover, the cuticular structure can also protect plants from
physical damage caused by constant UV exposure, which seems to be more crucial to
9
early land plants due to the relatively high levels of UV radiation at that time (Rozema et
al., 2002). Another function of the plant cuticle is to form a protective film against
pathogens (Neinhuis and Barthlott, 1997). The fossilized cuticles provide strong
evidence for the evolution of cuticular structure from bryophytes (Kenrick and Crane,
1997). Additionally, the occurrence of cuticles on specific mosses has been revealed in
several studies. For instance, the cuticular waxes were identified on the leaves of two
desert mosses, Polytrichum commune and Syntrichia caninervis (Potter et al., 1996; Xu
et al., 2009). Another study demonstrated the presence of a multi-layer cuticle on the
calyptra (a tiny hood covering the top of sporophyte capsule) of the moss Funaria
hygrometrica (Budke et al., 2011). Furthermore, recent cytochemical analyses showed
that leaves of Physcomitrella patens are also covered with a cuticle (Wyatt et al., 2008;
Ricci, 2013).
The other important chemical compound synthesized by land plants is lignin,
which is an amorphous heteropolymer that results from the oxidative coupling of
monolignol monomers mediated by both laccases and class III plant peroxidases (Weng
and Chapple, 2010). The emergence of lignin in xylem tracheids, which are the water-
conducting cells of vascular plants, provides them with the ability of long-distance
transport of water and minerals, enlargement of body size and the physical support to
stand upright. Originally, lignin was thought to be a unique compound present in
vascular plants, but recent studies have demonstrated the presence of lignin or lignin-like
materials in non-vascular plants, such as bryophytes and algae (Weng and Chapple,
2010). For example, lignin-like molecules have been detected in the cell walls of
hydroids in moss. Hydroids are the water-transporting cells in the stems or leaves of

10
moss gametophores and considered as analogous to the tracheids of vascular plants
(Ligrone et al., 2000). Although non-protonemal cells of the moss gametophores and
sporophytes are covered with cuticles (Wyatt et al., 2008; Cook and Graham, 1998),
mosses do not have lignin (Weng and Chapple 2010; Ligrone et al., 2000). The
Physcomitrella genome contains homologs of most of the lignin biosynthetic genes (Xu
et al., 2009); however, it lacks a bona fide cinnamyl alcohol dehydrogenase that
catalyzes the last step in monolignol biosynthesis (Guo et al., 2010). Instead, a
substantial amount of lignin-like polyphenolic material was found in Physcomitrella cell
walls (Espiñeira et al., 2011; Ligrone et al., 2008). Also, peroxidase activity capable of
oxidizing monolignols in vitro was found in Physcomitrella tissue homogenates
(Espiñeira et al., 2011).
Therefore, the presence of lignin-like polyphenolic compounds and cuticles in the
moss gametophores and sporophytes suggests that PpORS-produced 2'-
oxoalkylresorcinols could possibly exist as components of lignin-like or cuticular
materials unique in bryophyte non-protonemal tissues.
1.6 Objective
The objective of this study is to elucidate the in planta function of PpORS and to
gain insight into its role in the early evolution of land plants. The first aim was to
construct targeted knockouts of PpORS and to perform genotypic characterization of the
mutants. The second aim was to identify loss-of-function phenotypes in the mutants.

11
2. Material and methods
2.1 Plant material, media and culture conditions
The plant strain used in this study was pabB4, which is a mutant derived from wild
type Physcomitrella patens (Hedw.) (Ashton and Cove, 1977). PabB4 grows fast and
produces a large number of sporophytes on medium containing para-aminobenzoic acid
(paba) under continuous illumination.
Gametophytic tissues of the plant were grown axenically on solid NO3TPN
medium (Knight et al., 1988), as either point inoculations in Petri plates (1.2% agar)
covered by a sheet of clear resin (Roscolux, No.114; MacPhon Industries, Calgary,
Canada) to reduce the evaporation rate or as 15 mL slant cultures in 30 mL glass culture
tubes (1.5% agar). The NO3TPN medium contains the following: FeSO47H2O (4.5 10-
5 M), Ca(NO3)24H2O (5.0 10-3 M), MgSO47H2O (1.0 10-3 M), KH2PO4 (1.8 10-3
M, pH 6.5), paba (1.8 10-6 M), thiamine-HCl (1.5 10-6 M), nicotinic acid (8.1 10-6
M), H3BO3 (9.9 10-6 M), MnCl24H2O (2.0 10-6 M), CuSO45H2O (2.2 10-7 M),
ZnSO47H2O (1.9 10-7 M), CoCl26H2O (2.3 10-7 M), KI (1.7 10-7 M),
Na2MoO42H2O (1.0 10-7 M). Protonemal cultures used for gDNA extraction and
protoplast isolation were generated by grinding gametophytic tissues in sterile ddH2O
using an Omni-Mixer (Sorvall). The homogenates were then pipetted onto NO3TPN
medium supplemented with 5 mM ammonium tartrate (NH4TPN medium) overlaid with
sterile cellophane discs (Grimsley et al., 1977). All cultures were grown at 25 C under
24 h illumination supplied by cool-white fluorescent tubes (Sylvania) with photo flux of
2550 mol cm-2 s-1.

12
2.2 Preparation for PpORS knockout
The pTN182 plasmid (Sakakibara et al., 2008), provided by Dr. M. Hasebe (NIBB,
Japan), was used to prepare the knockout construct. The plasmid contains a neomycin
phosphotransferase II (nptII) gene, a cauliflower mosaic virus (CaMV) 35S terminator,
and a modified CaMV 35S promoter to confer kanamycin resistance in Escherichia coli
and G418 resistance in Physcomitrella (Sakakibara et al., 2008). Two homologous
regions were amplified from pabB4 gDNA at the PpORS locus by polymerase chain
reaction (PCR). Primers were designed to include restriction sites for ligation into the
two multiple cloning sites on both sides of the pTN182 resistance cassette (Table 1). The
1070 base pair (bp) 5' homologous region, containing the 404 bp 5'-untranslated region
(UTR), was amplified with forward primer PpORS-5'-F-KpnI and reverse primer
PpORS-5'-R-ClaI. The 976 bp 3' homologous region, which contains the 381 bp 3'-UTR,
was amplified with forward primer PpORS-3'-F-XbaI and reverse primer PpORS-3'-R-
BamHI. To generate the PpORS knockout construct, PpORS-pTN182-KO, the two
homologous regions were ligated one at a time into the appropriately restricted pTN182
vector using T4 DNA ligase (5 U/L). The linear knockout construct was prepared by
PCR amplification from the PpORS-pTN182-KO plasmid using PpORS-5'-F-KpnI and
PpORS-3'-R-BamHI primers. The resulting knockout construct was gel purified, ethanol
precipitated, resuspended in sterile ddH2O, and used for transformation.
2.3 Physcomitrella transformation and selection of stable transformants
For protoplast isolation and transformation, pabB4 protonemal tissue was grown
for six to eight days on ammonium tartrate-supplemented NO3TPN medium overlaid

13
Table 1. List of primers used in this study.
Primer name Sequence (5' 3') Primer
binding sitea
Linear knockout construct generationb
PpORS-5'-F-KpnI GGTACCATCCTCCGCTTCGCAGTCAC –403…–384c
PpORS-5'-R-ClaI ATCGATTCGTCCAAGGAAGGCTCACC 647…666
PpORS-3'-F-XbaI TCTAGACACCCAGCATGGTCTTGACG 1162…1181
PpORS-3'-R-BamHI GGATCCCGTGTGCGCAATCGTGAGAT 2118…2137
PCR analysis of stable transformants
PpORS-gDNA-F AAGTTCTGCTATCACGCTCATTCTTAATTC –856…–827
PpORS-gDNA-R CACAATACTTAGTAGTTTCCATCAGCGTGT 2133…2162
PpORS-pTN182-5'-R TTGAAAAGTGTCAATAGCCCTTTGG –379…–355d
PpORS-pTN182-3'-F ATTGGTATCAGGGCCATGAATAGGT 1416…1440
Southern blot analysis
SBP 1-5'-F GACGATGGACTCAAGGACAC –44…–25
SBP 1-3'-R ATTGAACTCAGGCTTTGCCA 182…201
RT-PCR
ORS-F AATCAAACATATGTCAGACTTGGGCACTG –10...19
ORS-R GGAATTCCCATGGTAAATATTACGGAGC 1701...1719
Actin3-F ATGGCTGGAGAGGGTGAGGATGTCC 1…25e
Actin3-R CCACATCTGCTGGAACGTACTCAGCG 1236…1261
a Nucleotide numbering is in relation to the translation start codon, starting with number
1 at the A of the ATG. b Restriction enzyme sites are underlined. c PpORS gene sequence (locus name, Phpat. 014G079100) is available in the Phytozome
database (http://phytozome.jgi.doe.gov/pz/portal.html). d Gene accession number of pTN182 is AB267706. Nucleotide numbering of pTN182
specific primers is in relation to the translation initiation codon of nptII. e Gene accession number of Physcomitrella Actin3 is AY382283.

14
with sterile cellophane discs. Two to four plates of moss culture were digested with
Driselase (1.4% (w/v) in 8% mannitol) (Kyowa Hakko Kogyo Co. Ltd., Tokyo, Japan).
The complete digestion was verified by generation of round green protoplasts observed
under a microscope. The resulting protoplast mixture was filtered through a sterile
protoplast filter into a sterile 15 mL tube and centrifuged to remove supernatant. The
protoplast pellet was resuspended in 0.44 M mannitol for osmotic balance, and then the
number of protoplasts was counted. The protoplast suspension was centrifuged again and
resuspended in an appropriate volume of 0.56 M mannitol, 15 mM MgCl2, and 51 mM 2-
(N-morpholino)ethanesulfonic acid-KOH (MMM solution). The resulting protoplast
suspension was transferred into a new sterile 15 mL tube and mixed with 20 g of the
PpORS knockout construct and 0.1 M polyethylene glycol (PEG) 4000 solution (2 g
PEG 4000, 0.1 M CaCl2, 10 mM Tris-HCl). The mixture was then heat shocked for 5
min at 45 °C. The resulting protoplast suspension was placed onto NH4TPN medium
overlaid with sterile cellophane. Stable transformants are those that survived after
subsequent cycles of G418 and non-G418 selection (Schaefer et al., 1991).
2.4 Confirmation of single target insertion by PCR and Southern blot analyses
2.4.1 gDNA extraction
For PCR analysis, 7 day old protonemal tissue was used to isolate a small amount
of gDNA with the DNeasy Plant Mini Kit (Qiagen). Following the manufacturer's
instructions, one plate of culture was ground into fine powder under liquid nitrogen, and
purified with the QIAshredder Mini-spin and DNeasy Mini-spin columns. For large scale
gDNA extraction for Southern blot analysis, 23 plates of 714 day old protonemal

15
culture was ground in liquid nitrogen, and gDNA was purified using the DNeasy Plant
Maxi Kit (Qiagen).
2.4.2 PCR analysis for confirmation of homologous recombination
PCR analysis was used to identify double homologous recombination between the
linear knockout construct and wild type gDNA at the PpORS locus. The target insertions
of both 5' and 3' ends of the knockout construct were confirmed using two sets of
primers (Table 1), PpORS-gDNA-F and PpORS-pTN182-5'-R for 5' insertion, and
PpORS-pTN182-3'-F and PpORS-gDNA-R for 3' insertion. The proper size of the
recombinant construct was confirmed using PpORS-gDNA-F and PpORS-gDNA-R
primers.
2.4.3 Confirmation of single target insertion by Southern blot analysis
For Southern blot gDNA restriction, approximately 10 g of gDNA was incubated
at 37 °C with restriction enzyme PscI or AseI for 18 h. Digestion products were then
concentrated by ethanol precipitation, and resuspended in 20 l sterile ddH2O. The
restricted gDNA samples were resolved electrophoretically using a 1.2% agarose gel.
The DNA was then denatured by immersing the gel in 1.5 M sodium chloride and 0.5 M
sodium hydroxide followed by neutralization with 3 M sodium chloride and 0.5 M Tris-
HCl (pH 7). The denatured DNA restriction fragments were transferred to a Hybond-N+
positively charged nylon membrane (Amersham Biosciences). The DNA samples were
UV cross-linked (UV Stratalinker, Stratagene) to the membrane for hybridization.
16
For Southern blot hybridization, the probe targeted to the knockout construct was
produced by PCR amplification of a 246 bp sequence specific to the 5’ homologous
region of the PpORS locus, using the primers SBP 1-5'-F and SBP 1-3'-R (Table 1). The
PCR product was gel purified, and then labeled overnight using the DIG High Prime
DNA Labeling and Detection Starter Kit II (Roche). The labeling efficiency was
determined according to the manufacturer's instructions. The DIG-labeled probe was
denatured by boiling for 5 min and incubated overnight at 53 °C with the blotted
membrane at a probe concentration of 25 ng mL-1 in DIG Easy Hyb buffer. The
membrane was then treated with two step stringency washes, first in 2 saline sodium
citrate (SSC), 0.1% sodium dodecyl sulfate (SDS) solution at 23 °C for 10 min, and
subsequently in 0.5 SSC, 0.1% SDS solution at 68 °C for 30 min. For immunological
hybridization detection, the membrane was incubated in 100 mL of blocking solution for
30 min, and then incubated in 20 mL of antibody solution for 30 min, according to the
manufacturer's instructions. The membrane was washed twice in 100 mL washing buffer,
equilibrated in 20 mL of detection buffer for 5 min, and then sealed in a development
folder with chloro-5-substituted adamantyl-1,2-dioxetane phosphate (CSPD) for
chemiluminescent visualization. The sealed membrane was exposed to Lumi-Film
Chemiluminescent Detection film (Roche). Multiple exposures were done to obtain good
contrast, and the exposed film was developed and fixed (GBX Developer and Fixer,
Kodak).
2.5 RT-PCR analysis
For RT-PCR experiments, total mRNA was extracted from one week old
protonemal and two month old gametophytic tissues using the RNeasy Plant Mini Kit

17
(Qiagen), following the manufacturer's protocol. The resulting mRNA samples were
reverse transcribed into cDNAs using an Omniscript Reverse Transcription kit (Qiagen).
PCR experiments were performed using KOD Hot Start polymerase (Novagen) and gene
specific primers, ORS-F and ORS-R (Table 1). Physcomitrella Actin3 served as a
positive control (Table 1). The touchdown PCR program initially started with a 95 °C
denaturation for 4 min, followed by 5 cycles of 95 °C for 15 s, 65 °C for 30 s and 70 °C
for 1.5 min. The annealing temperature was lowered to 60 °C for the next 5 cycles,
lowered again to 55 °C for another 5 cycles, and then to 50 °C for the final 25 cycles.
2.6 Phenotypic analysis
2.6.1 Gametophytic morphology of pabB4 and ors
To evaluate phenotypic alternations of gametophytes, point inoculation was
performed with pabB4 and ors leaves. Single leaves were removed from 4 month old
colonies, and used as inocula on fresh NO3TPN medium both in Petri plates and in 30
mL glass culture tubes. PabB4 and the three ors strains were cultured in the same Petri
plates equally divided into four portions. The development of the cultures was examined
and phenotypes were recorded using a DS-Fi1 digital camera, mounted on a Nikon
SMZ1500 stereoscopic microscope.
2.6.2 Phenotypic analysis of sporophytes and spores
For sporophyte production, gametophytic tissues were point inoculated onto
slanted NO3TPN medium in glass culture tubes and grown in the 25 °C culture room
under constant illumination for two months. Five tubes each of pabB4 and ors strains
were stored in the 16 °C culture room for four weeks, and then irrigated with 5 mL of
18
sterile ddH2O containing 18 M paba (Courtice et al., 1978). Cultures were further
incubated at 16 °C with constant illumination. To observe sporophytes, gametophores
with sporophytes were removed from one culture tube for each strain, and then placed in
a Petri plate containing sterile ddH2O. Sporophyte phenotypes were recorded using a
Nikon SMZ1500 stereoscopic microscope. Green, yellow and orange sporophytes were
observed 2, 3 and 4 weeks after irrigation, respectively.
For observation of mature spores, yellow sporophytes were placed into a 200 L of
sterile ddH2O. The sporophytes were then ruptured with fine forceps under sterile
conditions to isolate the spores from the sporophytic coat. Spores (10 L) were pipetted
onto a slide, overlaid with a cover slip, and the edges of the cover slip were sealed with
nail polish. Spore phenotypes were recorded using a DS-Ri1 digital camera mounted on
a Nikon Eclipse 80i compound light microscope.
2.6.3 Spore viability
For the germination study, one sporophyte was chosen from orange ors and pabB4
sporophytes and placed into 200 l sterile ddH2O. Spores were released by gently
bursting the capsule with sterile fine forceps and the sporophytic coat was removed.
Spore suspensions were transferred onto four plates containing NO3TPN medium. Sterile
ddH2O (5 mL) was added to each plate and spores were evenly distributed on the
medium. Phenotypes of germinated spores were recorded for 28 days using a DS-Ri1
digital camera mounted on a Nikon Eclipse 80i compound light microscope.

19
2.6.4 Cytochemical analysis
PabB4 and ors tissues for Toluidine blue O (TBO) and Sudan IV staining were
collected from gametophytic cultures grown on NO3TPN medium in one Petri plate
under the same conditions and from sporophytic tissues at different developmental stages
grown in glass culture tubes. An aqueous solution of 0.05% (w/v) TBO was prepared
according to Tanaka et al. (2004), and a solution of 0.7% (w/v) Sudan IV in ethylene
glycol was prepared according to Chiffelle and Putt (1951). For TBO staining, shoots of
approximately 0.5 cm in length were removed from 2, 4 and 8 month old cultures by
carefully detaching the bottom of the shoots from the plants with fine forceps, and then
stained for 20 min by immersing the shoot from the top into a 30 L drop of the TBO
solution. Care was taken not to immerse the bottom of shoot in the staining solution. For
Sudan IV staining, the shoots were dehydrated in ethylene glycol for 30 sec, and then
immersed into a 40 µL drop of the Sudan IV solution on microscopic slides and overlaid
with coverslips. The slides were heated in a boiling water bath for 4 min. The samples
were then rinsed three times in ddH2O, and immediately observed using a Nikon
SMZ1500 stereoscopic microscope and a Nikon Eclipse 80i compound light microscope.
2.6.5 UV irradiation
Two month old pabB4 and ors gametophytic cultures grown on NO3TPN medium
in one Petri plate were used for UV-B exposure in a biosafety cabinet (BM4-2A-49,
Canadian Cabinets, Ottawa, Canada). The covers of the Petri plates were removed, and
the plates were wrapped with plastic food wrap to avoid dehydration. The morphology of
the colonies was recorded using a Nikon SMZ1500 stereoscopic microscope before

20
irradiation, and the phenotypic alternations were recorded immediately after UV-B
exposure as well as after a recovery period in the culture room.
2.6.6 Water immersion treatment
Gametophytic cultures of pabB4 and ors were inoculated with normal leaves and
cultured on NO3TPN medium in glass culture tubes. The tubes of each strain were
divided into two subgroups. The first subgroup of 2.5 week old pabB4 and ors plants
was grown while immersed in H2O for 3 weeks before dissection. The second group of 4
week old plants was grown while immersed in H2O for 2 weeks before dissection. Prior
to adding water, the absence and presence of abnormal leaves in each tube was recorded
to determine the number of abnormal leaves that appeared during the water treatment.

21
3. Results
3.1 Molecular analyses of stable transformants
3.1.1 PCR analysis for PpORS allele replacement
Among over 100 stable transformants, three colonies (ors-1, ors-3 and ors-6) were
selected for further study. PCR was employed to confirm targeted insertion of the
knockout construct into the PpORS locus through double homologous recombination.
Two external primers (primers 1 and 4 in Fig. 2a, b) were used to amplify the
recombined knockout construct at the PpORS locus, resulting in a 4596 bp amplicon for
each stable transformant and a 3020 bp amplicon for pabB4, respectively (Fig. 2c). PCR
reactions with two sets of PpORS locus-specific and G418 resistance cassette-specific
primers produced a 1643 bp and a 1183 bp amplicon in the three ors transformants,
respectively (Fig. 2b, d). As expected, PCR with the same sets of primers produced no
bands in pabB4 (Fig. 2d). These results demonstrated that there were legitimate,
homologous recombination events at both 5’ and 3’ ends of the PpORS locus in the three
ors strains.
3.1.2 Southern blot analysis
Southern blot analysis was performed to ascertain a single gene replacement event
at the PpORS locus in the three ors strains. The PscI- or AseI-restricted gDNA from
pabB4, ors-1, ors-3 and ors-6 were hybridized with a DIG-labeled probe specific to the
5' end of the PpORS locus. The 246 bp probe, containing both the 5’-UTR (45 bp) and
PpORS coding sequence (201 bp), was hybridized to the 5' end of the PpORS locus in
pabB4 and to the 5' end of a single copy of the knockout construct in the ors strains (Fig.

22
(a)
(b)
(c)
(d)

23
Figure 2. Strategy for targeted knockout of PpORS and genotyping the resulting stable
transformants by PCR.
(a) Schematic diagram of insertion of the linear knockout construct into the PpORS locus
via double homologous recombination is shown. Two black rectangles indicate 5' and 3'
homologous regions and the green rectangle indicates the PpORS coding region that was
replaced with the G418 resistance cassette. The two white thick bars refer to the introns.
35S-P CaMV 35S promoter, 35S-T CaMV 35S terminator, nptII neomycin
phosphotransferase II gene. (b) Schematic diagram of PpORS locus after successful
recombination. White arrows indicate the locations of two external primers specific to
the PpORS locus, PpORS-gDNA-F (primer 1) and PpORS-gDNA-R (primer 4), and
black arrows indicate the locations of two internal primers specific to the G418
resistance cassette, PpORS-pTN182-5'-R (primer 2) and PpORS-pTN182-3'-F (primer 3).
(c) Successful recombination in the PpORS knockout locus was detected by PCR using
two external primers specific to the PpORS locus. Larger bands were observed in three
stable transformants. (d) Targeted insertions of the 5' and 3' homologous regions in the
recombined knockout locus were further examined by two PCR amplifications. Primers
1 and 2 and primers 3 and 4 were used to amplify the 5' (1643 bp) and 3' (1183 bp)
recombined regions respectively. PCR products were separated on 1.2% agarose gels,
and visualized with ethidium bromide fluorescence.

24
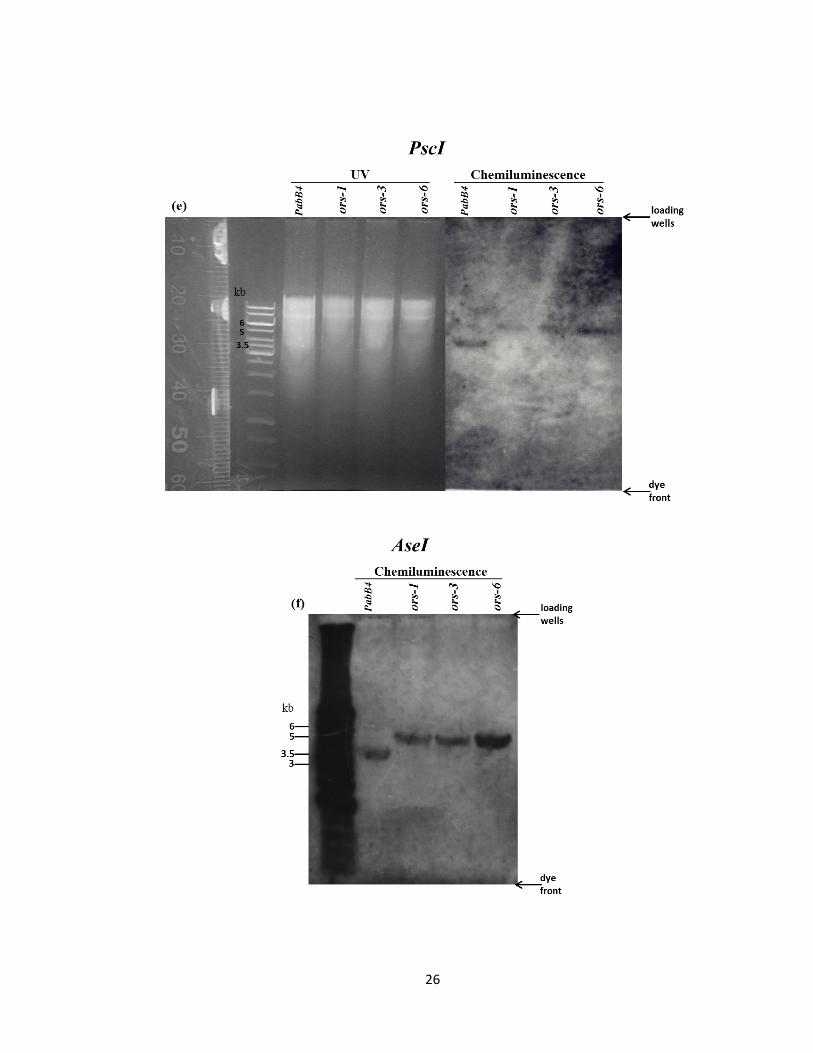
3a–d). With the pabB4 gDNA, a single band of 3.5 kb was detected both in PscI- and
AseI-restricted gDNA while the expected size was 3451 bp and 3552 bp after restriction
with PscI and AseI respectively (Fig. 3e, f). In contrast, a single band of 5 kb was
detected after restriction with each ors gDNA, which was in good agreement with the
expected size of 5028 bp and 5129 bp after PscI- and AseI-restriction respectively (Fig.
3e, f).
3.1.3 RT-PCR analysis
To provide further evidence for gene knockout in the three ors strains, PpORS
expression in pabB4 and the mutants was examined by RT-PCR using the primers, ORS-
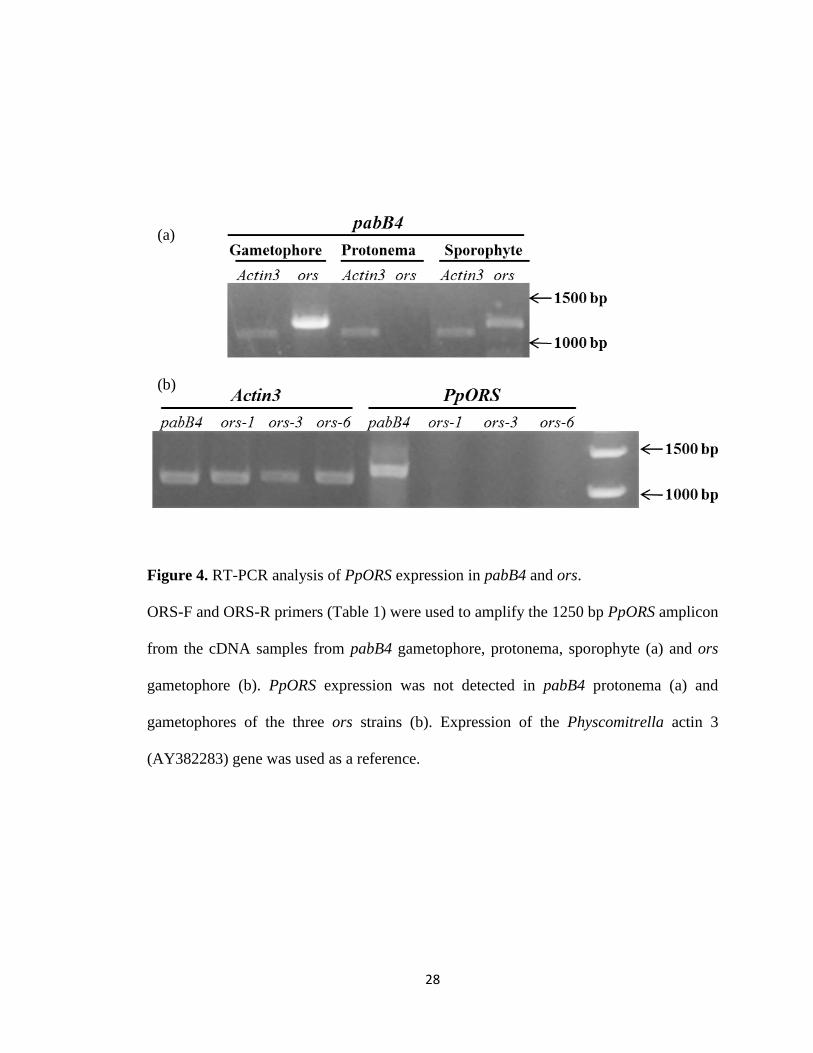
F and ORS-R (Table 1). PpORS is strongly expressed in the pabB4 gametophore and, to
a lesser extent, in sporophytes. In contrast, PpORS expression was not detected in
protonemata (Fig. 4a). On the other hand, the 1250 bp-long PpORS transcript was not
detected in the gametophytes of the three ors strains (Fig. 4b).
3.2 Phenotypic analyses of stable transformants
3.2.1 Morphological differences between pabB4 and ors gametophytes
Single leaf inoculation onto NO3TPN medium in Petri plates and glass culture
tubes was performed to observe the vegetative propagation of pabB4 and ors. Both
pabB4 and ors colonies showed similar growth rates at different developmental stages
(Fig. 5). They appeared to have typical protonemal development and grow by
consecutive division of apical cells (Fig. 6). Initially, chloronema filaments were formed.
They contained cell walls that are perpendicular to the growth axis and filled with large
amount of chloroplasts, and then some chloronemal filaments developed through apical

25
26

27
Figure 3. Southern blot analysis.
(a)(d) Schematic diagram of Southern blot analysis of pabB4 and the three ors strains.
The two black rectangles in (a)(d) indicate 5' and 3' homologous regions, while the
green rectangle in (a) and (b) refers to the region that was replaced with the G418
resistance cassette. Southern blots of PscI restricted- (e) or AseI restricted- (f) pabB4 and
ors gDNA are also shown. Restricted gDNA was hybridized with a DIG-labelled probe
specific to the 5' end of the PpORS locus. The binding sites of the probe are indicated by
a set of arrows in the figures. Position and size (in kb) of ladder bands are indicated on
the left. The expected sizes of the PscI restriction fragments from pabB4 and ors alleles
are 3451 bp and 5028 bp respectively. Similarly, the expected sizes of the AseI
restriction fragments from pabB4 and ors alleles are 3552 bp and 5129 bp respectively.
28
Figure 4. RT-PCR analysis of PpORS expression in pabB4 and ors.
ORS-F and ORS-R primers (Table 1) were used to amplify the 1250 bp PpORS amplicon
from the cDNA samples from pabB4 gametophore, protonema, sporophyte (a) and ors
gametophore (b). PpORS expression was not detected in pabB4 protonema (a) and
gametophores of the three ors strains (b). Expression of the Physcomitrella actin 3
(AY382283) gene was used as a reference.
(a)
(b)

29
Figure 5. Comparison of gametophyte growth rate of pabB4 and ors.
Bright-field microscopic images of gametophores 1, 3 and 4 weeks after single leaf point
inoculation. Colonies of pabB4 gametophores at different stages are shown (a, e, i),
along with those of the three ors gametophores. Scale bars = 1000 m.
(a)
(b)
(c)
(d)
(e)
(f)
(g)
(h)
(i)
(j)
(k)
(l)
pabB4
ors-1
ors-3
ors-6

30
Figure 6. Protonemal development of pabB4 and ors.
Bright-field microscopic images of protonemata of pabB4 and the ors strains three weeks
after single leaf point inoculation. Scale bars = 100 m.
pabB4
ors-1
ors-3
ors-6
31
division into caulonemal filaments that contain fewer chloroplasts. Afterwards the leafy
buds were produced from caulonemal cells and further developed into leafy
gametophytes. The morphological difference between pabB4 and ors colonies became
apparent two weeks after inoculation. Typical morphological abnormalities frequently
observed in the leaves of the ors strains are classified into four distinctive groups. The
first group consists of abnormal leaves that have a curly surface with a large number of
protrusions (Fig. 7a, b) or completely deformed leaves with irregular margins (Fig. 7c, d).
In addition, the size of this type of abnormal leaf is significantly smaller than that of the
normal leaf, and the leaf cells forming protrusions and the surrounding cells also have
highly abnormal orientation and shape. The second group includes leaves with twisted
tips and necrosis (Fig. 7e, f). The third group includes leaves with irregular shape or
missing midrib (Fig. 7gj). The fourth group is comprised of leaves with a cell
outgrowth on the surface or margins (Fig. 7kn). The leaf morphological abnormalities
randomly appeared in ors colonies. Interestingly, the majority of the aberrant leaves were
found at or near the apex of the shoots. On the contrary, pabB4 leaves showed only one
type of phenotypic abnormality, cell outgrowth on the leaf surface or margins, with
much less frequency.
The incidence of phenotypic deviations was statistically analyzed and the data are
summarized in Fig. 8. PabB4 and ors grown on the NO3TPN media in an individual Petri
plate and glass culture tubes were dissected two months after inoculation. Among the 60
ors and 20 pabB4 colonies examined, approximately 11% of ors shoots had at least one
abnormal leaf, whereas only 1.5% of pabB4 shoots had abnormal leaves (Fig. 8a). The
percentages of shoots with abnormal leaves were not significantly different when the

32
(a)
(b)
(c)
(d)
(e)
(f)
(g)
(h)

33
Figure 7. Abnormal leaves found on ors gametophytic shoots.
Bright-field microscopic images of abnormal leaves of ors gametophytic shoots are
shown. Abnormal characteristics are leaves with a curly surface and a large number of
protrusions (a, b), highly disformed leaves (c, d), a twisted tip and necrosis (e, f),
irregular shape or missing midrib (gj), and cell outgrowth on the surface or margins
(kn). Scale bar (a, c, e, g, i, k, m) = 500 m; (b, d, f, h, j, l, n) = 100 m.
(i)
(j)
(k)
(l)
(m)
(n)

34
Figure 8. Phenotypic analyses of pabB4 and ors.
The percentage of shoots with abnormal leaves (a), the percentage of shoots with
branches (b) and the number of sporophytes produced (c) in an individual colony of
pabB4 or ors are shown. Error bars represent standard errors. The incidence of shoots
with abnormal leaves was significantly different in pabB4 compared to the three ors
strains. The p value was 0.0000002 when analyzed using a binomial generalized linear
mixed effects model (courtesy of Dr. Mark Vanderwel, Department of Biology,
University of Regina). The percentage of shoots with branches and the number of
sporophytes were not significantly different (p > 0.05).
(a)
(b) (c)
*p = 0.0000002

35
plants were grown either in plates or in glass tubes (p > 0.1, Student’s t-test). PabB4 and
ors plants were grown in the same plates in order to eliminate the possibility that the
increased leaf abnormality observed in ors is due to different growth conditions, e.g.
humidity or light. Raw data of the incidence of abnormal leaves in pabB4 and ors are
presented in Appendix A.
Next, shoot branching and sporophyte production were examined. When the
percentage of gametophytic shoots with branches and the number of sporophytes in a
colony were compared, no significant difference was observed between pabB4 and ors
colonies (Fig. 8b, c).
3.2.2 Sporophytic and spore morphology of pabB4 and ors
Sporophyte development in two month old gametophytic cultures was promoted by
irrigation at 16 °C. PabB4 and ors sporophytes at various developmental stages and the
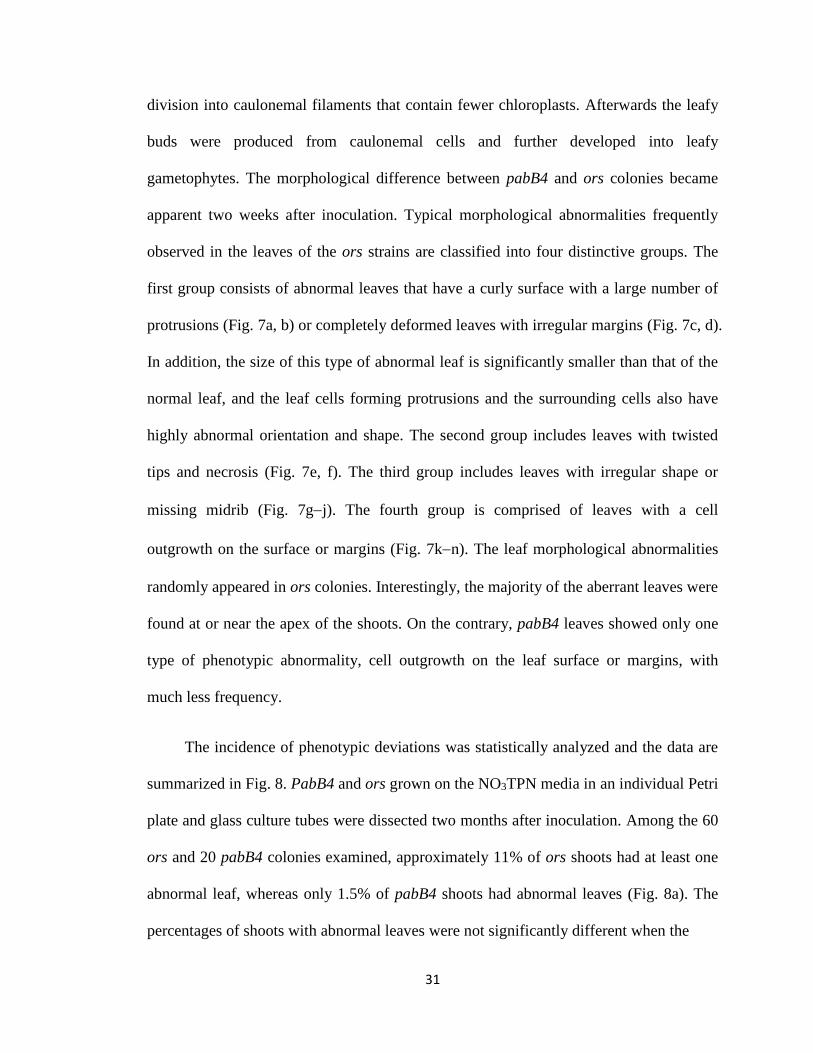
spores harvested from orange sporophytes are shown in Figs. 9 and 10. No detectable
phenotypic differences between pabB4 and the mutants were observed during the
development of sporophytes and spores, which may be due to the low expression of
PpORS in sporophytes (Fig. 4a; Kim et al., 2013).
3.2.3 Spore viability
A germination study was performed to examine the viability of pabB4 and ors
spores. When grown on NO3TPN medium, germination of both pabB4 and ors-3 spores
initiated after 4 days. By the seventh day, the majority of spores had begun to germinate
(Fig. 11a, b). Both pabB4 and ors-3 spores germinated with similar frequencies and

36
Figure 9. Morphological comparison of pabB4 and ors sporophytes.
Bright-field microscopic images of pabB4 and ors sporophytes at different
developmental stages. Green (ad), yellow (eh) and orange sporophytes (il) were
harvested 2, 3 and 4 weeks after irrigation. Scale bars = 100 m.
pabB4 ors-1 ors-3 ors-6
(a) (b) (c) (d)
(e) (f) (g) (h)
(i) (j) (k) (l)
37
Figure 10. Morphological comparison of mature spores from pabB4 and ors.
Bright-field microscopic images of pabB4 and ors spores harvested from orange
sporophytes are shown. Scale bars = 10 m.
pabB4 ors-1
ors-3 ors-6

38
Figure 11. Germination of mature spores from pabB4 and ors.
Bright-field microscopic images of the germination process of pabB4 and ors spores.
Images were taken 7 (a, b). 14 (c, d), 21 (e, f) and 28 days (g, h) after plantation. Scale
bars (a, b) = 10 m; (cf) = 50 m; (g, h) = 100 m.
(a)
(b)
(c)
(d)
(e)
(f)
(g)
(h)
7 d 14 d 21 d 28 d
pabB4
ors-3

39
underwent indistinguishable germination processes. After 14 days of culture, germinated
spores started to develop chloronemata and caulonemata (Fig. 11c, d). Initial division of
a spore generated a chloronema apical stem cell and subsequently underwent tip growth
to produce more chloronema cells which formed chloronemal filaments or chloronemal
side branch initials. The caulonema apical stem cells derived from chloronema apical
stem cells underwent tip growth as well to generate caulonemal filaments or side branch
initials, from which some of them further developed into leafy buds.
Interestingly, both in pabB4 and ors, spore coat (or sporopollenin) still remained
attached to the filaments even after 4 weeks of germination (Fig. 11g, h).
3.2.4 Cytochemical analysis
3.2.4.1 TBO and Sudan IV staining of gametophytic tissues
When stained with TBO under the conditions employed, pabB4 and ors shoots
without abnormal leaves remained unstained (Fig. 12a, b). A few slightly deformed
pabB4 leaves often showed spotty staining (Fig. 12d and 13a, b), and pabB4 stems were
stained at the base of the leaves (Fig. 12c). In contrast, ors shoots with abnormal leaves
were strongly stained, especially at the base of leaves (Fig. 12e) and abnormal leaves
themselves (Fig. 12f). In order to ascertain that the observed abnormal leaves and their
staining by TBO are not artifacts of the transformation procedures, a different
Physcomitrella knockout strain was also examined. Few abnormal leaves were observed
from 4, 8 and 12 months old cultures of ascl-2, and ascl-2 shoots, which showed a
similar staining pattern as pabB4 shoots (Fig. 12g). Ascl-2 is a knockout strain of
PpASCL, which encodes an anther specific chalcone synthase-like enzyme. Ascl-2

40
41
Figure 12. Bright-field microscopic images of TBO stained gametophytic shoots.
(a, b, g) Normal gametophytic shoots treated with TBO. (c, e) Gametophytic shoots with
abnormal leaves stained with TBO. (d, f) Abnormal leaves stained with TBO. Scale bars
(a, b, c, e, g) = 1 mm; (d, f) = 500 m.

42
produces aborted spores but otherwise is indistinguishable from pabB4 in gametophore
morphology (Daku et al. unpublished data).
TBO staining of abnormal leaves with different morphological characteristics was
examined in more detail. Firstly, abnormal leaves with cell outgrowth were stained only
at the outgrowth (Fig. 13a–d). Secondly, only the protuberances of curly leaves were
severely stained, giving rise to a spotty staining pattern (Fig. 13e, f). Thirdly, highly
deformed leaves were stained in their entirety (Fig. 12f and 13g, h). Lastly, irregular
shaped leaves were partially stained near the leaf base (Fig. 13i, j). Interestingly, some
apparently normal leaves from ors shoots containing extremely abnormal leaves were
also largely stained (Fig. 13k, l). Although images shown in Figs. 12 and 13 are obtained
with ors-3, the same leaf abnormalities were also observed in the other two ors strains.
When stained with Sudan IV under the conditions employed, pabB4 and ors
gametophytic shoots without abnormal leaves were stained in their entirety (Fig. 14a, b).
Typical staining patterns of pabB4 and ors shoots with abnormal leaves are shown in
Figs. 14 and 15. PabB4 and ors shoots with abnormal leaves showed similar staining
patterns as the normal shoots (Fig. 14c–f). Both normal leaves (Fig. 14c, e) and leaves
with cell outgrowth on the surface (Fig. 14d, 15a, b) or a large number of protuberances
(Fig. 14f, 15c, d) were strongly stained by Sudan IV.
3.2.4.2 TBO and Sudan IV staining of sporophytic tissues
Green (Fig. 16a, b), yellow (Fig. 16c, d) and orange (Fig. 16e, f) sporophytes from
pabB4 and ors remained unstained after treating with TBO under the same conditions
used for gametophyte staining. Interestingly, only one type of abnormality, leaves with
43
44
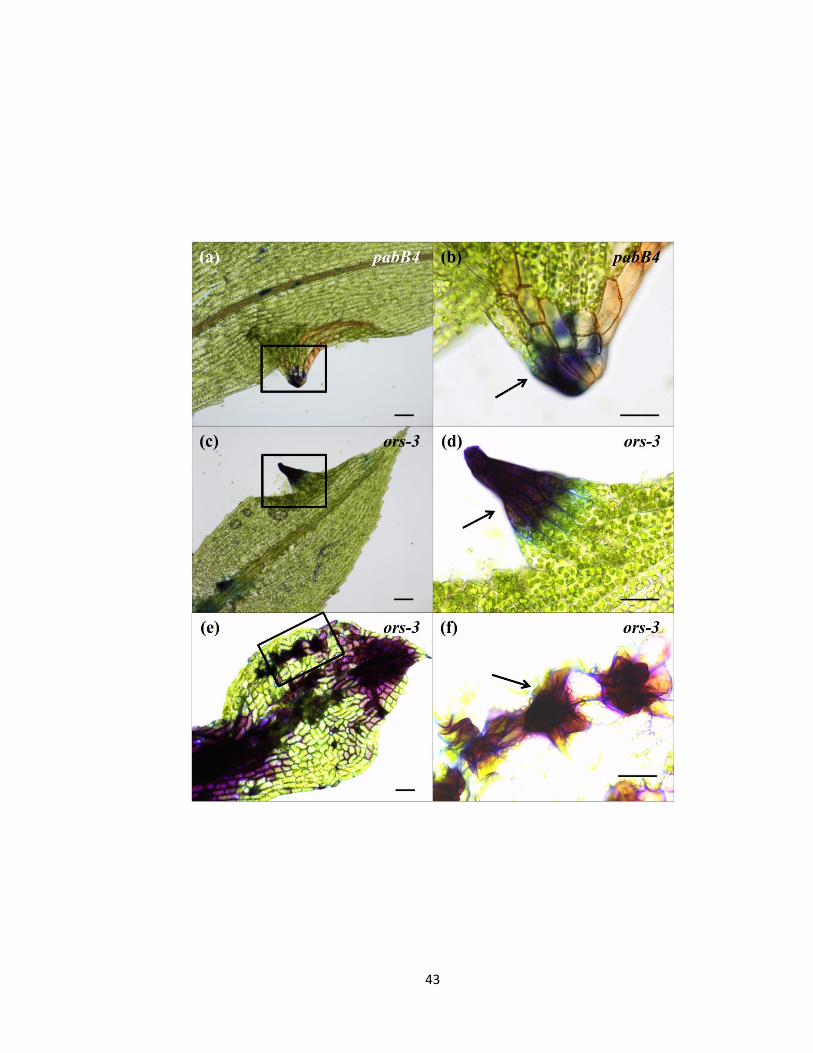
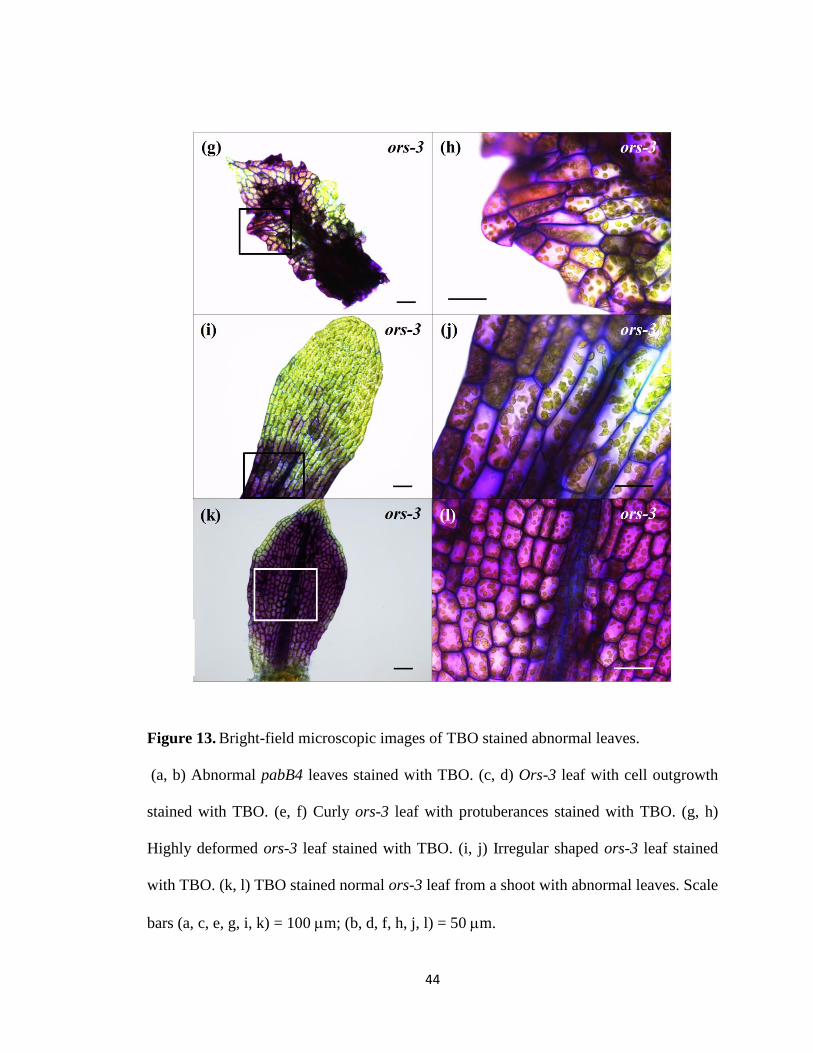
Figure 13. Bright-field microscopic images of TBO stained abnormal leaves.
(a, b) Abnormal pabB4 leaves stained with TBO. (c, d) Ors-3 leaf with cell outgrowth
stained with TBO. (e, f) Curly ors-3 leaf with protuberances stained with TBO. (g, h)
Highly deformed ors-3 leaf stained with TBO. (i, j) Irregular shaped ors-3 leaf stained
with TBO. (k, l) TBO stained normal ors-3 leaf from a shoot with abnormal leaves. Scale
bars (a, c, e, g, i, k) = 100 m; (b, d, f, h, j, l) = 50 m.

45
Figure 14. Bright-field microscopic images of Sudan IV stained gametophytic shoots.
(a, b) Normal gametophytic shoots stained with Sudan IV. (c, e) Gametophytic shoots
with abnormal leaves stained with Sudan IV. (d, f) Abnormal leaves stained with Sudan
IV. The white spots on the leaves are reflections from light. Scale bars (a, b, c, e) = 1 mm;
(d, f) = 500 m.
pabB4
pabB4
ors-3
ors-3
pabB4
ors-3
(a) (b)
(c) (d)
(e) (f)

46
Figure 15. Bright-field microscopic images of Sudan IV stained leaves.
(a, b) Abnormal pabB4 leaf stained with Sudan IV. (c, d) Abnormal ors leaf stained with
Sudan IV. Scale bars (a, c) = 100 µm; (b, d) = 50 µm.
(a)
(c) (d)
(b)

47
pabB4
pabB4
pabB4
ors-3
ors-3
(a) (b)
(c) (d)
(e) (f)
pabB4
pabB4
pabB4
ors-3
ors-3
ors-3
(a) (b)
(c) (d)
(e) (f)

48
Figure 16. Bright-field microscopic images of TBO and Sudan IV stained sporophytes.
Green (a, b), yellow (c, d), and orange (e, f) sporophytes from pabB4 and ors cultures
stained with TBO. The dark spot on the pabB4 yellow sporophyte is the stained spores
from other burst sporophytes. (g, h) PabB4 and ors abnormal leaves stained with TBO. (i,
j) PabB4 and ors sporophytes stained with Sudan IV. Scale bars (a–h) = 500 µm; (i, j) =
1 mm.
ors-3 ors-3 (g) (h) pabB4
pabB4
ors-3
ors-3
(g) (h)
(i) (j)

49
outgrowth on the surface or margin, was observed from the 10 tubes of sporophytic
cultures examined in this study. When pabB4 and ors shoots bearing sporophyte and
abnormal leaves were stained with TBO, only the outgrown cells were stained (Fig. 16g,
h). PabB4 and ors sporophytes were uniformly stained in their entirety by Sudan IV (Fig.
16 i, j).
3.2.5 Protection from UV irradiation
Changes in morphology of both pabB4 and ors were observed after UV-B exposure
for 4, 8 and 12 h. No detectable phenotypic alternations were observed from 1 h UV-B
exposure under the conditions employed. Tissue damage of pabB4 and ors plants,
including bleached gametophytic shoots, and curvy and twisted leaves, were detected
even after 2, 7 and 12 d of recovery from 4 and 8 h UV-B exposure (Fig. 17). No
difference of morphological changes between pabB4 and ors was observed after UV-B
irradiation.
3.2.6 The effect of water immersion on the development of abnormal leaves
After water treatment for 2 or 3 weeks, an individual colony was examined for
abnormal leaves. The total number of shoots, the number of shoots with abnormal leaves,
and the total number of abnormal leaves in a colony were counted, and the percentage of
shoots with abnormal leaves in the colony was calculated (Appendix B). The length of
growth in water (2 or 3 weeks) had no significant difference, and, therefore, the two
subgroups were combined for analysis.
During the 2 or 3 week growth period, numerous abnormal leaves appeared in
most ‘grown in air’ ors colonies to which water was not added. In sharp contrast, no
50
abnormal leaves appeared in ‘grown in water’ ors colonies except one ors-1 colony that
had a single abnormal leaf (Appendix B). Thus, the mean percentage of shoots with
abnormal leaves was significantly reduced when water was added in the three ors
colonies (p<0.05, Student’s t-test; Table 2). For example, the mean percentage of shoots
with abnormal leaves in ors-1 colonies decreased from 14 to 3.1% when grown in water.

51
UV-B irradiation for 4 h UV-B irradiation for 8 h
Figure 17. Gametophytic growth after UV-B irradiation.
Gametophytic cultures of pabB4 and ors-3 were grown on the NO3TPN medium for 2
months, and exposed to UV-B. Bright-field microscopic images of pabB4 and ors-3
gametophytes after 4 h (ah) and 8 h (ip) UV-B irradiation are shown. Scale bars = 5
mm.
(a) (e) (i) (m)
(b)
(c)
(d)
(f)
(g)
(h)
(j)
(k)
(l)
(n)
(o)
(p)
pabB4 pabB4 ors-3 ors-3
Before
exposure
2 d
7 d
12 d

52
Table 2. Effects of water immersion on the development of abnormal leaves.
Percentage of shoots with abnormal leaves
pabB4 ors-1 ors-3 ors-6
Grown in air 0.91 ± 0.91a
(n = 11)b
14 ± 4.0
(n = 11)
11 ± 3.4
(n = 10)
18 ± 4.4
(n = 11)
Grown in water 3.6 ± 3.6
(n = 4)
3.1 ± 3.1c
(n = 4)
0 ± 0d
(n = 5)
0 ± 0e
(n = 4)
a Mean S.E. b Number of colonies. c p = 0.026, d p = 0.0051, e p = 0.00099 when compared to the ‘grown in air’ group
(Student’s t-test).

53
4. Discussion
4.1 Confirmation of knockout strains of PpORS by molecular analyses
Southern blot and PCR analyses indicated that each ors stable transformant
resulted from single-copy allele replacement by legitimate homologous recombination
during transformation with the PpORS knockout construct. PpORS was strongly
expressed in pabB4 gametophores, less expressed in sporophytes, and not expressed in
protonemata, which is in agreement with the EST abundance and microarray data (Kim
et al., 2013). The absence of the PpORS transcript in the three stable transformants
indicated successful knockout of the PpORS gene in the three ors strains, and
consequently the three ors strains should lack ORS enzyme activity.
Consistent with these results from molecular analyses, the development of
protonema and sporophyte is indistinguishable between pabB4 and the three ors stains.
However, phenotypic deviations in the mutants began to appear at early gametophytic
developmental stages.
4.2 Morphology of ors leaves
Developmental patterns of pabB4 and ors were indistinguishable until the
generation of leafy gametophores. As protonemata developed, the side branch initials
were generated from caulonemal filaments and ultimately underwent consecutive
oblique divisions to produce tetrahedral bud apical cells, which initiated the formation of
gametophytic shoots. Diverse phenotypic deviations were initially observed in the leaves
of two week old ors colonies, including highly distorted shapes, concentrated
distribution of protrusions on the leaf lamina or midrib, absence of leaf midribs, necrotic
54
spots, single protrusion on the leaf lamina and cell outgrowths from the margin. These
morphological alternations frequently appeared at the upper leaves of ors shoots, which
is in agreement with the EST data that PpORS is highly expressed in the upper half of
gametophytic shoots (Kim et al., 2013). On the contrary, pabB4 abnormal leaves only
showed single cell outgrowth on the surface or margin. The phenotypic deviations in ors
leaves could be the direct result of impaired leaf development or indirect consequences
of a defective cuticle.
Similar phenotypic alternations in leaf morphology have been described in a few
Physcomitrella knockout transformants. Polyploidization of Physcomitrella, which is
induced by transformation of transposon-mutagenised cDNAs with protoplasts, resulted
in various mutant phenotypes similar to those of the ors strains. The features including
leaf shape alternation, missing midrib, twisted leaf tip, leaf necrosis and cell outgrowth
were mainly observed in diploid plants (Schween et al., 2005; Egener et al., 2002). The
loss of function of DICERLIKE4 protein, which is involved in the specific RNA
silencing pathway in Physcomitrella, also resulted in dramatic phenotypic abnormalities
throughout vegetative and reproductive development, such as club-shaped elongated
leaves and dwarfish gametophores, which showed resemblance to the abnormal
phenotypes found in ors leaves. Dicer-like4 plants also exhibited reduced coverage of
the colonies with gametophores and female sterility (Arif et al., 2012). Comparing with
the lower plant, a homologous Arabidopsis DICERLIKE4 mutant showed minor
developmental defects, for example, slightly elongated and curly leaves (Xie et al., 2005).
Meanwhile, knockout of genes involved in cuticle biogenesis in Physcomitrella or
higher plants resulted in a variety of cuticular developmental defects or a decline of

55
essential components in the cuticular structure. Physcomitrella mutant ABCG7, which
encodes an ATP binding cassette transporter required for cuticular wax deposition,
appeared to have similar phenotypic defects to those observed in ors. Nevertheless, the
PpABCG7 mutant also exhibited significant abnormality of sporophytic development,
and specific decrease in the level of cuticular wax content (Buda et al., 2013). When
WBC11, another ABC transporter gene, was knocked out in Arabidopsis, a reduced
density of wax crystal and a less electron-opaque cuticle layer were observed in the
mutant leaves (Ukitsu et al., 2007). Also, developmental defects in the WBC11 mutants
resulted in the production of non-expanded leaves and stunted and seedless plants
(Ukitsu et al., 2007). The Arabidopsis mutant of ACR4, a gene for a receptor-like protein
kinase implicated in differentiation and/or maintenance of epidermis-related tissues, also
developed abnormal leaves with spherical protrusions and disorganized cell arrangement
(Watanabe et al., 2004).
4.3 Cytochemical comparison between pabB4 and the three ors strains
Cytochemical analyses were performed using TBO and Sudan IV. TBO is a
hydrophilic dye known to interact with hydrophilic cell walls as well as cellular
components, and is commonly used in histological studies (Tanaka et al., 2004; Ricci,
2013). In the literature, two distinct staining patterns have been reported for diverse
Arabidopsis mutants with cuticular defects: staining of whole leaf with no or defective
cuticle and various degrees of staining of leaves with discontinuous cuticle, including
patchy stains, staining of lower or upper part of leaf, and staining of trichomes
(outgrowth or appendages on plants) (Tanaka et al., 2004). The Physcomitrella
gametophore is covered with a hydrophobic cuticle, and therefore, TBO staining is not

56
expected to be observed on the leaves or stems (Ricci, 2013). In this study, abnormal and
normal leaves and shoots from both pabB4 and ors were treated with TBO for the same
duration and under the same conditions. The results, however, were highly
distinguishable between pabB4 and the mutants. In ors, whole leaf staining was observed
in highly deformed leaves and in relatively smaller but regular-shaped leaves from
shoots containing severely defective leaves, while patchy staining of the leaves with a
large number of protuberances, staining of the thread-like outgrowths, and staining of the
lower part of the irregular-shaped leaves were also observed. Interestingly, the stems of
ors shoots containing highly deformed leaves were also strongly stained with TBO. In
comparison with ors, the naturally arisen, slightly deformed leaves of pabB4 showed a
spotty staining on the few protuberances, and the stems of pabB4 shoots containing
abnormal leaves were also slightly stained with TBO.
Different Arabidopsis mutants with defective cuticles also showed diverse TBO
staining patterns. For example, Arabidopsis mutants, AtWBC11-5 and ACR4, showed
whole leaf staining and staining of both protruded and normal regions, respectively
(Ukitsu et al., 2007; Watanabe et al., 2004). When Arabidopsis long-chain acyl-CoA
synthetase 2 (LACS2) and LACS3, required for the biosynthesis of cutin and wax
components respectively, were knocked out, intense spotty staining with TBO was
observed (Weng et al., 2010). Similarly, spotty staining was observed both in barley cer-
zv mutant with a defect in cutin and in the pe lg double mutant with disrupted cuticle
layer (Li et al., 2013). Taken together, the observed diverse staining patterns of the ors
strains showed conspicuous similarity to those of higher plant mutants with defective
cuticles (Tanaka et al., 2004), suggesting that ors gametophytic tissues have defective

57
cuticles with enhanced permeability. It should be noted that Physcomitrella leaves also
became stainable with TBO after depolymerization of the leaf cuticle with 10 % NaOH
treatment (Wyatt et al., 2008). On the other hand, the sporophyte capsules of ors and
pabB4 remained unstained after the same TBO treatment. This may be due to a lesser
contribution of PpORS products to the cuticular integrity in sporophytes, as indicated by
the lower expression of PpORS in sporophytes, compared to gametophores.
Sudan IV, a hydrophobic dye, is known to positively stain hydrophobic materials
in cuticles (Chiffelle and Putt, 1951). In this study, Sudan IV was used to detect the
presence of cuticular structures in Physcomitrella gametophores and sporophytes. As
expected, the gametophytic and sporophytic tissues of pabB4 and ors showed dark red
staining. Normal pabB4 and ors shoots were similarly stained with Sudan IV in their
entirety, which is consistent with the observations of Wyatt et al. (2008). Ors shoots with
various types of abnormal leaves showed similar staining patterns as the normal shoots.
PabB4 and ors sporophytes were also positively stained in their entirety. The results
confirm the existence of cuticles in the gametophores and sporophytes of pabB4 and ors.
The staining pattern of all types of ors abnormal leaves indicate that hydrophobic
components, such as cutin and wax, exist in the defective ors cuticle which appears to be
relatively uniform on the surface.
4.4 UV irradiation study
PpORS expression was shown to be upregulated after irradiation of UV at 345 nm
(UV-A) and 303 nm (UV-B) (http://www.genevestigator.com/gv/plant.jsp). Under the
conditions employed in this study, pabB4 and ors exhibited similar susceptibility to UV-

58
B radiation. It could be that our irradiation conditions were severe for the relatively mild
UV-B protective effects of PpORS products. Many attempts with varying irradiation
time to demonstrate possible UV-B protective effects of PpORS were unsuccessful.
4.5 Effects of water immersion on the development of abnormal leaves on ors
Although preliminary, the data obtained in this study showed that the incidence of
morphological abnormalities in ors leaves significantly decreased by water immersion
treatment. The preventive effect of water may indicate that abnormal leaves are formed
as a result of a failed control in local water content due to a defective cuticle in ors.
As noted earlier, the abnormal subtype of cell outgrowth on the surface or margin
was the only subtype found in pabB4 (Fig. 13a, b). Interestingly, this particular
abnormality was also found persistently in pabB4 and ors after growth in water for
sporophyte development (Fig 16g, h). This suggested that the cell outgrowth may arise
independently from the defect caused by the PpORS knockout.

59
5. Conclusion and future work
In this study, to elucidate in planta function of PpORS and its proposed role in
land plant evolution, PpORS knockout transformants were constructed. PCR and RT-
PCR analyses were used to confirm successful knockout of PpORS in ors stable
transformants. Southern blot analyses were performed to confirm single targeted
insertion of the transgenic DNA in ors stable transformants. Ors spores were viable and
the ors plants developed normally except that ors gametophores produced abnormal
leaves at an early growth stage with a significantly higher frequency. Phenotypic
analyses, including staining and water treatment experiments, suggested that the PpORS
knockout may lead to a discontinuous cuticle.
For further characterization of ors, the following experiments would be appropriate.
Firstly, chemical complementation of ors by PpORS-produced 2'-oxoalkylresorcinols
can be performed to confirm that the phenotypic abnormalities in ors are the result of the
PpORS knockout. Additionally, 14C-labelled 2'-oxoalkylresorcinols can be used in the
complementation experiment to determine the distribution of PpORS products in the
plants. Secondly, high-resolution microscopy, including transmission electron
microscopy and atomic force microscopy, may be used to visualize the ultrastructure of
potentially defective ors cuticles. Finally, the chemical components of cuticles from
pabB4 and ors may be studied by phytochemical analysis, such as liquid
chromatography–mass spectrometry, in order to determine the difference in cuticle
composition of the wild type and mutant strains. These experiments should provide a
more detailed morphological and chemical characterization of ors and further insights
into the in planta function of PpORS and its proposed role in land plant evolution.

60
References
Arif MA, Fattash I, Ma Z, Cho SH, Beike AK, Reski R, Axtell MJ, Frank W. (2012).
DICER-LIKE3 activity in Physcomitrella patens DICER-LIKE4 mutants causes severe
developmental dysfunction and sterility. Molecular Plant 5: 12811294.
Ashton NW, Cove DJ. (1977). The isolation and preliminary characterisation of
auxotrophic and analogue resistant mutants of the moss, Physcomitrella patens.
Molecular & General Genetics 154: 8795.
Austin MB, Noel JP. (2003). The chalcone synthase superfamily of type III polyketide
synthases. Natural Product Reports 20: 79110.
Bowman JL, Floyd SK, Sakakibara K. (2007). Green genes-comparative genomics of
the green branch of life. Cell 129: 229234.
Buda GJ, Barnes WJ, Fich EA, Park S, Yeats TH, Zhao L, Domozych DS, Rose JK.
(2013). An ATP binding cassette transporter is required for cuticular wax deposition and
desiccation tolerance in the moss Physcomitrella patens. Plant Cell 25: 40004013.
Budke JM, Goffinet B, Jones CS. (2011). A hundred-year-old question: is the moss
calyptra covered by a cuticle? A case study of Funaria hygrometrica. Annals of Botany
107: 1279–1286.
Burghardt M, Riederer M. (2006). Cuticular transpiration. Annual Plant Reviews 23:
292–309.
Busch H, Boerries M, Bao J, Hanke ST, Hiss M, Tiko T, Rensing
SA. (2013). Network theory inspired analysis of time-resolved expression data reveals
key players guiding P. patens stem cell development. PLoS One 8: e60494.
Chiffelle TL and Putt FA. (1951). Propylene and ethylene glycol as solvents for Sudan
IV and Sudan Black B. Stain Technology 26: 51–56.
Courtice GRM, Ashton NW, Cove DJ. (1978). Evidence for the restricted passage of
metabolites into the sporophyte of the moss Physcomitrella patens (Hedw.) Br. Eur.
Journal of Bryology 2: 191–198.
Cook ME, Graham LE. (1998). Structural similarities between surface layers of
selected charophycean algae and bryophytes and the cuticles of vascular plants.
International Journal of Plant Sciences 159: 780787. Egener T, Granado J, Guitton MC, Hohe A, Holtorf H, Lucht JM, Rensing SA,
Schlink K, Schulte J, Schween G, Zimmermann S, Duwenig E, Rak B, Reski R.

61
(2002). High frequency of phenotypic deviations in Physcomitrella patens plants
transformed with a gene-disruption library. BMC Plant Biology 2: 6.
Espiñeira JM, Novo Uzal E, Gómez Ros LV, Carrión JS, Merino F, Barceló Ros A,
Pomar F. (2011). Distribution of lignin monomers and the evolution of lignification
among lower plants. Plant Biology 13: 5968.
Funa N, Awakawa T, Horinouchi S. (2007). Pentaketide resorcylic acid synthesis by
type III polyketide synthase from Neurospora crassa. Journal of Biological Chemistry
282: 1447614481.
Funa N, Ozawa H, Hirata A, Horinouchi S. (2006). Phenolic lipid synthesis by type
III polyketide synthases is essential for cyst formation in Azotobacter
vinelandii. Proceedings of the National Academy of Sciences, USA 103: 63566361.
García S, García C, Heinzen H, Moyna P. (1997). Chemical basis of the resistance of
barley seeds to pathogenic fungi. Phytochemistry 44: 415418.
Grienenberger E, Kim SS, Lallemand B, Geoffroy P, Heintz D, Souza Cde A, Heitz
T, Douglas CJ, Legrand M. (2010). Analysis of TETRAKETIDE -PYRONE
REDUCTASE function in Arabidopsis thaliana reveals a previously unknown, but
conserved, biochemical pathway in sporopollenin monomer biosynthesis. Plant Cell 22:
40674083.
Grimsley NH, Ashton NW, Cove DJ. (1977). The production of somatic hybrids by
protoplast fusion in the moss, Physcomitrella patens. Molecular Genetics and Genomics
154: 97–100.
Gokulan K, O'Leary SE, Russell WK, Russell DH, Lalgondar M, Begley TP,
Ioerger TR, Sacchettini JC. (2013). Crystal structure of Mycobacterium tuberculosis
polyketide synthase 11 (PKS11) reveals intermediates in the synthesis of methyl-
branched alkylpyrones. Journal of Biological Chemistry 288: 1648416494.
Guo DM, Ran JH, Wang XQ. (2010). Evolution of the cinnamyl/sinapyl alcohol
dehydrogenase (CAD/SAD) gene family: the emergence of real lignin is associated with
the origin of bona fide CAD. Journal of Molecular Evolution 71: 202218.
Jiang C, Schommer CK, Kim SY, Suh DY. (2006). Cloning and characterization of
chalcone synthase from the moss, Physcomitrella patens. Phytochemistry 67: 25312540.
Jiang C, Kim SY, Suh DY. (2008). Divergent evolution of the thiolase superfamily and
chalcone synthase family. Molecular Phylogenetics and Evolution 49: 691701.
Katsuyama Y, Ohnishi Y. (2012). Type III polyketide synthases in microorganisms.
Methods in Enzymology 515: 359377.

62
Kenrick P and Crane PR. (1997). The origin and early evolution of plants on land. Nature 389: 33–39. Kim SS, Grienenberger E, Lallemand B, Colpitts CC, Kim SY, Souza Cde A, Geoffroy P, Heintz D, Krahn D, Kaiser M, Kombrink E, Heitz T, Suh DY, Legrand M, Douglas CJ. (2010). LAP6/POLYKETIDE SYNTHASE A and LAP5/POLYKETIDE SYNTHASE B encode hydroxyalkyl alpha-pyrone synthases required for pollen development and sporopollenin biosynthesis in Arabidopsis thaliana. Plant Cell 22: 40454066. Kim SY, Colpitts CC, Wiedemann G, Jepson C, Rahimi M, Rothwell JR, McInnes AD, Hasebe M, Reski R, Sterenberg BT, Suh DY. (2013). Physcomitrella PpORS, basal to plant type III polyketide synthases in phylogenetic trees, is a very long chain 2'-oxoalkylresorcinol synthase. Journal of Biological Chemistry 288: 27672777. Knight C, Cove DJ, Boyd P, Ashton NW. (1988). The isolation of biochemical and developmental mutants in Physcomitrella patens. In: Glime J, ed. Methods in Bryology. Nichinan, Miyazaki, Japan : Hattori Botanical Laboratory, 47–58. Koduri PK, Gordon GS, Barker EI, Colpitts CC, Ashton NW, Suh DY. (2010). Genome-wide analysis of the chalcone synthase superfamily genes of Physcomitrella patens. Plant Molecular Biology 72: 247263. Kozubek A, Tyman JHP. (1999). Resorcinolic lipids, the natural non-isoprenoid phenolic amphiphiles and their biological activity. Chemical Reviews 99: 126. Li C, Wang A, Ma X, Pourkheirandish M, Sakuma S, Wang N, Ning S, Nevo E, Nawrath C, Komatsuda T, Chen G. (2013). An eceriferum locus, cer-zv, is associated with a defect in cutin responsible for water retention in barley (Hordeum vulgare) leaves. Theoretical and Applied Genetics 126: 637–646. Ligrone R, Carafa AG, Duckett J, Renzaglia KS, Ruel K. (2008). Immunocytochemical detection of lignin-related epitopes in cell walls in bryophytes and the charalean alga Nitella. Plant Systematics and Evolution 270: 257272. Ligrone R, Ducket JG, Renzaglia KS. (2000). Conducting tissues and phyletic relationships of bryophytes. Philosophical Transactions of the Royal Society B: Biological Sciences 355: 795813.
Matsuzawa M, Katsuyama Y, Funa N, Horinouchi S. (2010). Alkylresorcylic acid synthesis by type III polyketide synthases from rice Oryza sativa. Phytochemistry 71: 10591067.
Neinhuis C and Barthlott W. (1997). Characterization and Distribution of Water-repellent, Self-cleaning Plant Surfaces. Annals of Botany 79: 667–677.

63
Nishiyama T, Fujita T, Shin-I T, Seki M, Nishide H, Uchiyama I, Kamiya A,
Carninci P, Hayashizaki Y, Shinozaki K, Kohara Y, Hasebe M. (2003). Comparative
genomics of Physcomitrella patens gametophytic transcriptome and Arabidopsis thaliana:
implication for land plant evolution. Proceedings of the National Academy of Sciences,
USA 100: 80078012.
Pollard M, Beisson F, Li Y, Ohlrogge JB. (2008). Building lipid barriers: biosynthesis
of cutin and suberin. Trends in Plant Sciences 13: 236–246.
Potter L, Foot JP, Caporn SJM and Lee JA. (1996). The Effects of Long-Term
Elevated Ozone Concentrations on the Growth and Photosynthesis of Sphagnum
recurvum and Polytrichum commune. New Phytologist 134: 649–656.
Quatrano RS, McDaniel SF, Khandelwal A, Perroud PF, Cove DJ. (2007).
Physcomitrella patens: mosses enter the genomic age. Current Opinion in Plant Biology
10: 182-189.
Ricci EJ. (2013). Investigating the leaf cuticle of the moss Physcomitrella patens.
Master’s Theses, Dissertations, Graduate Research and Major Papers Overview. Paper
62. http://digitalcommons.ric.edu/etd/62
Rozema J, Björn LO, Bornman JF, Gaberscik A, Häder DP, Trost T, Germ M,
Klisch M, Gröniger A, Sinha RP, Lebert M, He YY, Buffoni-Hall R, de Bakker NV,
van de Staaij J, Meijkamp BB. (2002). The role of UV-B radiation in aquatic and
terrestrial ecosystems--an experimental and functional analysis of the evolution of UV-
absorbing compounds. Journal of Photochemistry and Photobiology B 66: 2–12.
Ross AB, Shepherd MJ, Schupphaus M, Sinclair V, Alfaro B, Kamal-Eldin A,
Aman P. (2003). Alkylresorcinols in cereals and cereal products. Journal of Agricultural
and Food Chemistry 51: 41114118.
Sakakibara K1, Nishiyama T, Deguchi H, Hasebe M. (2008). Class 1 KNOX genes
are not involved in shoot development in the moss Physcomitrella patens but do function
in sporophyte development. Evolution & Development 10: 555–566.
Sankaranarayanan R, Saxena P, Marathe UB, Gokhale RS, Shanmugam VM,
Rukmini R. (2004). A novel tunnel in mycobacterial type III polyketide synthase reveals
the structural basis for generating diverse metabolites. Nature Structural & Molecular
Biology 11: 894900.
Schaefer DG, Zryd JP. (2001). The moss Physcomitrella patens, now and then. Plant
Physiology 127: 14301438. Schaefer DG, Zryd JP, Knight CD, Cove DJ. (1991). Stable transformation of the
moss Physcomitrella patens. Molecular and General Genetics 226: 418–424.

64
Schween G, Schulte J, Reski R, Hohe A. (2005). Effect of ploidy level on growth,
differentiation, and morphology in Physcomitrella patens. The Bryologist 108: 2735.
Tanaka T, Tanaka H, Machida C, Watanabe M, Machida Y. (2004). A new method
for rapid visualization of defects in leaf cuticle reveals five intrinsic patterns of surface
defects in Arabidopsis. Plant Journal 37: 139146.
Ukitsu H, Kuromori T, Toyooka K, Goto Y, Matsuoka K, Sakuradani E, Shimizu
S, Kamiya A, Imura Y, Yuguchi M, Wada T, Hirayama T, Shinozaki K. (2007).
Cytological and biochemical analysis of COF1, an Arabidopsis mutant of an ABC
transporter gene. Plant Cell Physiology 48: 15241533.
Watanabe M, Tanaka H, Watanabe D, Machida C, Machida Y. (2004). The ACR4
receptorlike kinase is required for surface formation of epidermisrelated tissues in
Arabidopsis thaliana. Plant Journal 39: 298308.
Weng H, Molina I, Shockey J, Browse J. (2010). Organ fusion and defective cuticle
function in a lacs1 lacs2 double mutant of Arabidopsis. Planta 231: 10891100.
Weng JK, and Chapple C. (2010). The origin and evolution of lignin biosynthesis. New
Phytologist 187: 273285.
Wyatt HDM, Ashton NW, Dahms TES. (2008). Cell wall architecture of
Physcomitrella patens is revealed by atomic force microscopy. Botany 86: 385397.
Xie Z, Allen E, Wilken A, Carrington J.C. (2005). DICER-LIKE 4 functions in trans-
acting small interfering RNA biogenesis and vegetative phase change in Arabidopsis
thaliana. Proceedings of the National Academy of Sciences, USA 102: 12984–12989.
Xu Z, Zhang D, Hu J, Zhou X, Ye X, Reichel KL, Stewart NR, Syrenne RD, Yang X,
Gao P, Shi W, Doeppke C, Sykes RW, Burris JN, Bozell JJ, Cheng MZ, Hayes DG,
Labbe N, Davis M, Jr SNC, Yuan JS. (2009). Comparative genome analysis of lignin
biosynthesis gene families across the plant kingdom. BMC Bioinformatics 10:
14711485.

65
APPENDIX A– Raw Data of the Percentage of Shoots with Abnormal Leaves.
1. Cultures in Petri plates (n = 12)
pabB4 ors-1
Total
number
of shoots
per
colony
Number
of shoots
with
abnormal
leaves
% Shoots
with
abnormal
leaves
Total
number
of
abnormal
leaves
Total
number
of shoots
per
colony
Number
of shoots
with
abnormal
leaves
% Shoots
with
abnormal
leaves
Total
number
of
abnormal
leaves
36
24
24
22
22
30
28
25
30
29
40
35
0
0
0
0
0
1
1
0
0
1
1
2
0
0
0
0
0
3.3
3.6
0
0
3.4
2.5
5.7
0
0
0
0
0
3
3
0
0
2
1
6
30
25
27
35
28
20
23
36
28
27
29
34
2
2
3
3
1
1
5
6
1
8
3
4
6.7
8.0
11
8.6
3.6
5.0
22
17
3.6
30
10
12
9
7
10
9
1
1
18
18
9
57
8
22
1.5 0.59%a 12 2.7%a
ors-3 ors-6
Total
number
of shoots
per
colony
Number
of shoots
with
abnormal
leaves
% Shoots
with
abnormal
leaves
Total
number
of
abnormal
leaves
Total
number
of shoots
per
colony
Number
of shoots
with
abnormal
leaves
% Shoots
with
abnormal
leaves
Total
number
of
abnormal
leaves
26
34
24
27
26
31
38
28
32
44
29
31
2
3
0
5
5
5
7
1
4
7
4
3
7.7
8.8
0
19
19
16
18
3.6
13
16
14
9.7
5
18
0
14
25
26
43
4
12
43
19
19
25
27
38
34
25
23
30
24
30
25
32
36
4
0
2
6
1
2
5
1
2
0
3
5
16
0
5.3
18
4.0
8.7
17
4.2
6.7
0
9.4
14
14
0
8
23
1
9
27
8
9
0
14
24
12 1.8%a 8.5 1.8%a
a Mean S.E., % shoots with abnormal leaves in a colony
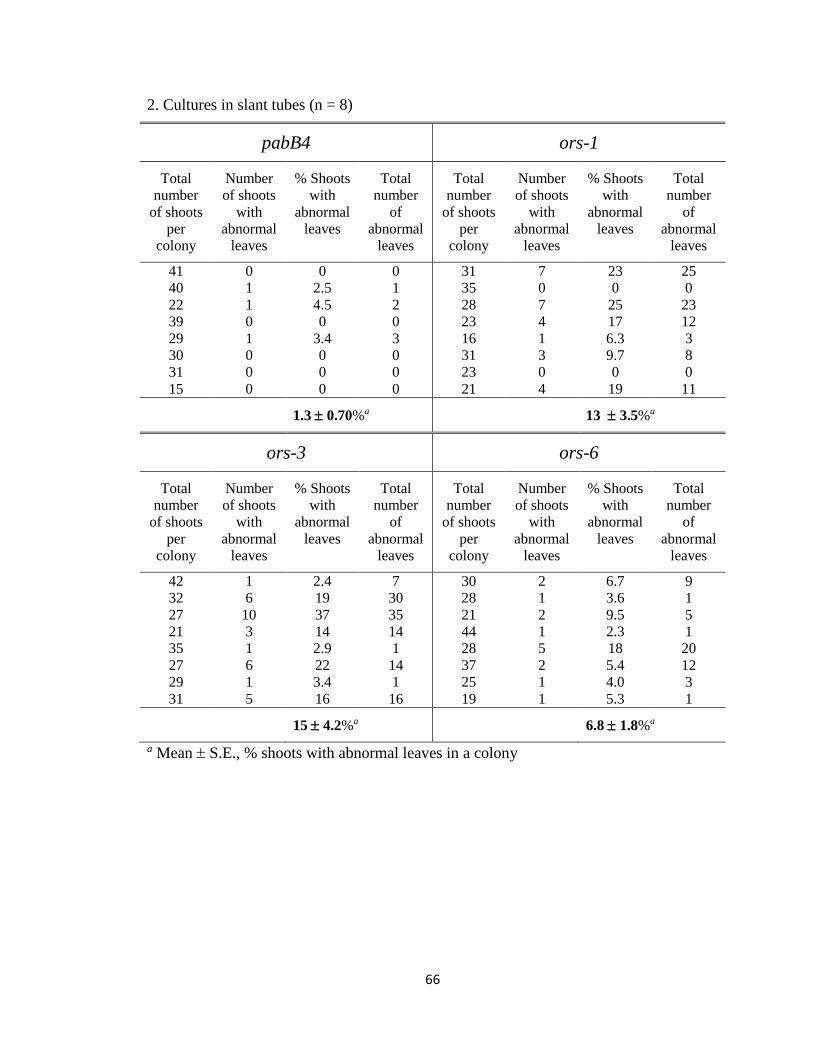
66
2. Cultures in slant tubes (n = 8)
pabB4 ors-1
Total
number
of shoots
per
colony
Number
of shoots
with
abnormal
leaves
% Shoots
with
abnormal
leaves
Total
number
of
abnormal
leaves
Total
number
of shoots
per
colony
Number
of shoots
with
abnormal
leaves
% Shoots
with
abnormal
leaves
Total
number
of
abnormal
leaves
41
40
22
39
29
30
31
15
0
1
1
0
1
0
0
0
0
2.5
4.5
0
3.4
0
0
0
0
1
2
0
3
0
0
0
31
35
28
23
16
31
23
21
7
0
7
4
1
3
0
4
23
0
25
17
6.3
9.7
0
19
25
0
23
12
3
8
0
11
1.3 0.70%a 13 3.5%a
ors-3 ors-6
Total
number
of shoots
per
colony
Number
of shoots
with
abnormal
leaves
% Shoots
with
abnormal
leaves
Total
number
of
abnormal
leaves
Total
number
of shoots
per
colony
Number
of shoots
with
abnormal
leaves
% Shoots
with
abnormal
leaves
Total
number
of
abnormal
leaves
42
32
27
21
35
27
29
31
1
6
10
3
1
6
1
5
2.4
19
37
14
2.9
22
3.4
16
7
30
35
14
1
14
1
16
30
28
21
44
28
37
25
19
2
1
2
1
5
2
1
1
6.7
3.6
9.5
2.3
18
5.4
4.0
5.3
9
1
5
1
20
12
3
1
15 4.2%a 6.8 1.8%a
a Mean S.E., % shoots with abnormal leaves in a colony

67
APPENDIX B– Raw Data of the Water Immersion Effect Experiments.
TNS: Total number of shoots per colony at dissection
#SAL: Number of shoots with abnormal leaves that appeared while growing in air or
in water
%SAL: % Shoots with abnormal leaves at dissection
TNAL: Total number of abnormal leaves that appeared while growing in air or in water
pabB4 ors-1
TNS #SAL %SAL TNAL TNS #SAL %SAL TNAL
Grown in air
7b
7
10
6
9
6
7
8 c
10
8
11
0
0
0
0
0
0
0
0
1
0
0
0
0
0
0
0
0
0
0
10
0
0
0
0
0
0
0
0
0
0
1
0
0
9
9
7
8
11
10
7
5
5
7
7
4
1
1
1
3
2
0
0
0
1
1
44
11
14
13
27
20
0
0
0
14
14
10
2
1
3
10
7
0
0
0
3
1
0.9 0.9%a 14 4.0%a
Grown in water
7
5
7
4
0
0
1
0
0
0
14
0
0
0
1
0
9
8
6
5
0
1
0
0
0
13
0
0
0
1
0
0
3.6 3.6%a 3.1 3.1%a
ors-3 ors-6
TNS #SAL %SAL TNAL TNS #SAL %SAL TNAL
Grown in air
11
9
7
7
5
7
7
3
13
9
2
1
0
0
1
0
2
0
3
1
18
11
0
0
20
0
29
0
23
11
3
1
1
1
4
0
5
0
4
4
5
8
7
8
9
8
5
5
4
5
5
0
2
1
1
3
3
1
2
0
1
0
0
25
14
13
33
38
20
40
0
20
0
0
10
2
3
8
10
1
5
0
2
0
11 3.4%a 18 4.4%a
Grown in water
7
7
6
6
3
0
0
0
0
0
0
0
0
0
0
0
0
0
0
0
5
4
5
4
0
0
0
0
0
0
0
0
0
0
0
0
0 0%a 0 0%a

68
a Mean S.E., % Shoots with abnormal leaves at dissection b The data in normal numerals were obtained from experiments in which water was
added to 4 week old plants and the plants were grown in water for 2 weeks. c The data in italic numerals were obtained from experiments in which water was added
to 2.5 week old plants and the plants were grown in water for 3 weeks.
There was no significant difference between the two groups. Thus, the two datasets were
combined to obtain means and S.E. values.