targeted subsidies in urban transport - gpoba.org webinar - urban transport_0.pdf · output ($/pkm)...
TRANSCRIPT

Targeted Subsidies
in Urban transport The experience thus far
OBA Webinar Series April 24, 2014
Shomik Mehndiratta & Camila Rodriguez
and next steps
with Output-Based Aid

Presentation Outline
• Sector Challenges Need for finding a balance between social inclusive
subsidy schemes and guarantee cost-recovery of public
transport systems
• Experiences with targeted subsidy schemes Bogota, Colombia: Pro-poor targeted subsidy scheme for
SITP (GPOBA financed)
Analytical work in Argentina
• GPOBA Global Study on OBA in Urban
Transport 2

Output Based Aid: core concepts
• Pro-poor targeting: to create incentives for service providers to
provide service access to the poor
• Accountability: performance and financial risk is transferred to
service providers
subsidies are paid on attainment of measurable outputs.
• Innovation: Service providers have an incentive to be innovative
and identify appropriate solutions to achieve outputs & trigger
subsidy payments
• Efficiency: per capita subsidy costs are kept within acceptable
limits – lower cost achieved through competition
• Sustainability: Ideally subsidy is one-off subsidy, cost recovery
is achieved through tariff collection
• Output verification and monitoring: independent verification of
agreed outputs by a third party is needed
3

Targeted subsidies
Examples in urban transport
http://blogs.worldbank.org/transport/will-you-take-me-1000-pesos-making-
sure-public-transport-subsidies-really-target-poor

Cost recovery vs sustainability
• US FTA experience with operating subsidies
Impact on productive efficiency – unsustainable
Neither poor nor service quality benefited
• Buenos Aires fares frozen in 2002
Impact on service quality – unsustainable
Most of the subsidy benefits the middle class
• Bogota, Brazilian cities
Cost recovery
Unaffordable for the poor – particularly the informal sector
• London experience
Competitive concessions to pick operators
Financing from congestion pricing
Improvements in service quality – mode choice
5

What makes for a ‘good’ subsidy scheme?
Efficiency
Productive
- cost per unit of
output ($/pkm)
Administrative
- Cost of
implementaton
Sustainability
Impact on service
-Quality, quantity of
service
-Subsequent system
impacts
Impact on
government
-Overall fiscal impact
-Control over impact
Can not isolate one from others. Well designed
scheme reflects appropriate balance.
Meeting policy goals
- How much of the
target group is getting
served?
- How much of the
subsidy is ‘wasted’
outside target group
Effectiveness

Early experience with targeting
Productive
Efficiency
Effectiveness at
targeting poor
Sustainability
User groups;
elderly, students
No impact Convenient more
than accurate
Does government
pay?
Brazil vale
transport for
employees
Reduces cost
discipline for
operators – users
don’t have stake
in costs
Self-selects poor
employees with
6% threshold BUT
informal workers
left out
Some reselling.
Labor tax on poor
employees
USA TransitChek No impact All employees –
not poor but mode
shift
Government
forgoes tax
revenue
Pereira “free
morning”
No impact Self-selected Low fiscal impact
Chile fuel subsidy No impact Appropriate but
not public
transport
No impact
7

Moving towards targeted subsidies
• Characterizing the travel needs of the
poor
• Who and how much?
Building on existing social programs
“Affordability indices”
• Evaluating alternative schemes
Effectiveness at targeting poor
Operational and financial impacts
• Implementation issues
8

Process
9
Understanding Beneficiary
Travel Patterns
• Use existing databases to identify and target low-income households.
• Survey current transport users as well as beneficiaries currently not using the system.
Indentifying Who to
Subsidize and How Much
• Use the affordability index and other tools to guide political decisions about who to fund and how much.
Comparing Alternative
Subsidy Schemes
• Compare in- and exclusion errors; share of subsidy reaching intended beneficiaries; Fare Affordability Index levels and other measures; and aggregate financial impact.
Considering System
Conditions and Financial
Implications
• Estimate impacts on system conditions, overal ridership, revenues, and operating costs.
Planning for Implementatio
n
• Minimize leaking and abuse by using smartcards, ICT tools, and adminstrative processes.
• Consider user and operator incentives.
24.0%
20.1%
4.5%6.4%
39.4%
5.6%11.7%
36.1%
1.2%5.8%
38.2%
6.9%
Automobile
On foot
Subway
Railway
Bus
Other
Poor Non-Poor
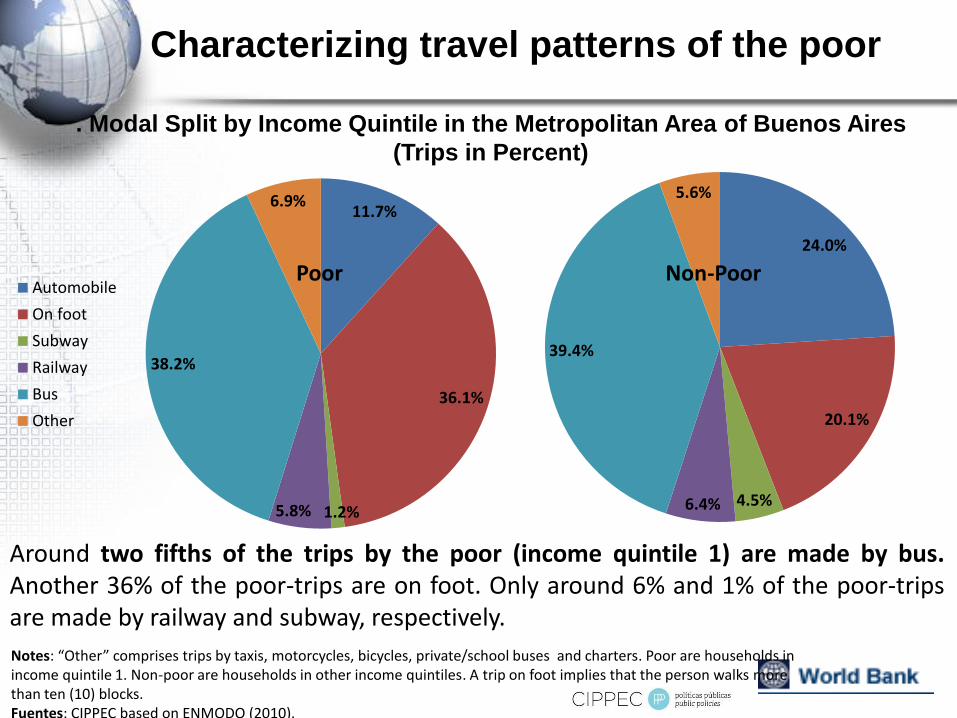
. Modal Split by Income Quintile in the Metropolitan Area of Buenos Aires
(Trips in Percent)
Notes: “Other” comprises trips by taxis, motorcycles, bicycles, private/school buses and charters. Poor are households in income quintile 1. Non-poor are households in other income quintiles. A trip on foot implies that the person walks more than ten (10) blocks. Fuentes: CIPPEC based on ENMODO (2010).
Around two fifths of the trips by the poor (income quintile 1) are made by bus. Another 36% of the poor-trips are on foot. Only around 6% and 1% of the poor-trips are made by railway and subway, respectively.
Characterizing travel patterns of the poor

11
85% of the trips of the poor (income quintile 1) are made by bus and only around 13% and 3% by train and subway, respectively. Use of buses and railways decreases with income, whereas the use of the subway increases with income quintile.
Public Transport Modal Split (Legs) by Income Quintile in the Metropolitan Area of BA
84.5% 81.7% 80.5% 77.5%72.9%
12.8%12.8% 13.2%
13.0%12.1%
2.7% 5.5% 6.3% 9.6%15.0%
0%
10%
20%
30%
40%
50%
60%
70%
80%
90%
100%
Quintile 1 Quintile 2 Quintile 3 Quintile 4 Quintile 5
Bus Railway SubwayPoor
Characterizing travel patterns of the poor

• Trip frequency increases with income quintile. • Around a third of the poor (income quintile 1) make only one or
two round trips per week. 12
Trips per Week by Income Quintile (%)
23.0% 22.5% 21.3% 19.9% 18.2%
5.3% 4.9% 4.8% 5.8% 5.9%
6.4% 6.0% 8.5% 8.1% 7.3%
2.6% 2.5% 3.2% 3.6% 4.6%
52.3% 52.7% 50.7% 52.2% 55.3%
10.3% 11.5% 11.5% 10.4% 8.8%
0%
10%
20%
30%
40%
50%
60%
70%
80%
90%
100%
Quintile 1 Quintile 2 Quintile 3 Quintile 4 Quintile 5
6 a week
5 a week
4 a week
3 a week
2 a week
1 a week
Poor
Characterizing travel patterns of the poor

13 13
Fuentes: CIPPEC sobre la base de ENMODO (2010).
Social Program Beneficiaries in Buenos Aires
16,2%
3,6% 5,1%13,9%
1,9%
0,4% 2,1%
1,8%
6,1%
4,7%5,0%
5,8%
5,6%
2,8%6,6%
5,5%
1,4%
0,5%0,9%
1,3%
68,8%
88,0%80,4%
71,7%
0%
10%
20%
30%
40%
50%
60%
70%
80%
90%
100%
Bus Subte Tren Total
Estudiantes Beneficiarios de Plan Social Jubilados
Empleados domésticos Discapacitados Otros
Who? Build on other social programs
• Bogota: SISBEN
• Buenos Aires: All social program beneficiaries

(a) Average household (b) Quintile 1 8.4%
7.5%
6.1%
4.8%
3.8%
3.3%3.6%
2.8%
2.2%2.4%
3.0%
0.0%
1.0%
2.0%
3.0%
4.0%
5.0%
6.0%
7.0%
8.0%
9.0%
2003 2004 2005 2006 2007 2008 2009 2010 2011 2012 2013
43.1%
34.6%
27.3%
21.7%
16.6%
13.9%15.0%
11.6%
8.6% 8.6%
11.2%
0.0%
5.0%
10.0%
15.0%
20.0%
25.0%
30.0%
35.0%
40.0%
45.0%
50.0%
2003 2004 2005 2006 2007 2008 2009 2010 2011 2012 2013
14
For the typical household in BA, expenditure in public transport as a share of total income
decreased from 8.4% in 2003 to 2.4% in 2012; and,
For the average household in income quintile 1, expenditure in public transport as a
share of total income fell from 43.1% in 2003 to 11.2% in 2013.
Buenos Aires: Affordability of Public Transport, 2003-2013
How much? Affordability index
• Actual use vs Basket of trips
• Complementarity of transport and land markets

15
Promedio Quintil 1
1 Sao Paulo 727.7 72.8 78.1 10.7% 107.3%
2 Rio de Janeiro 1,193.8 119.4 75.2 6.3% 63.0%
3 Brasilia 1,082.1 108.2 64.1 5.9% 59.2%
4 Cape Town 1,204.3 120.4 45.5 3.8% 37.8%
5 Buenos Aires (2004) 552.1 102.7 33.8 6.1% 32.9%
6 Mumbai 715.4 293.3 67.3 9.4% 23.0%
7 Kuala Lumpur 1,529.3 336.4 73.0 4.8% 21.7%
8 Mexico City 818.3 126.8 23.6 2.9% 18.6%
9 Chennai 309.8 127.0 23.6 7.6% 18.6%
10 Manila 813.1 219.5 37.8 4.6% 17.2%
11 Krakow 1,298.3 473.9 78.4 6.0% 16.5%
12 Amsterdam 2,347.5 856.8 136.0 5.8% 15.9%
13 Moscow 1,346.2 329.8 50.8 3.8% 15.4%
14 Guangzhou 763.8 229.1 33.1 4.3% 14.4%
15 Buenos Aires (2010) 930.2 218.6 24.9 2.7% 11.4%
16 Warsaw 2,168.7 791.6 85.5 3.9% 10.8%
17 New York 4,311.6 1,164.1 120.0 2.8% 10.3%
18 Los Angeles 3,540.3 955.9 96.0 2.7% 10.0%
19 Chicago 4,025.0 1,086.8 108.0 2.7% 9.9%
20 Singapore 3,233.1 808.3 78.2 2.4% 9.7%
21 Beijing 1,198.3 359.5 33.1 2.8% 9.2%
22 Seoul 1,398.7 559.5 51.3 3.7% 9.2%
23 Buenos Aires (2012) 1,101.0 277.0 18.8 1.7% 6.8%
24 Shanghai 1,734.5 520.4 33.1 1.9% 6.4%
25 Cairo 593.1 255.0 15.7 2.6% 6.1%
26 Budapest 1,842.2 921.1 53.6 2.9% 5.8%
27 London 4,421.4 1,348.5 69.8 1.6% 5.2%
28 Prague 2,729.8 1,419.5 52.8 1.9% 3.7%
29 Bangkok 1,698.8 526.6 19.3 1.1% 3.7%
Índice de accesibilidad Ingreso mensual
per cápita
U$PPP
Ingreso mensual
per cápita Quintil 1
U$PPP
Gasto mensual en
transporte
público
Ciudad
Affordability index allows benchmarking

16
Buenos Aires
proposed Bogota adopted
Errors of exclusion (% intended beneficiaries left out) 13.6% 68%
Errores of inclusion (% beneficiaries that are unintened) 19.8% 0%
Share of total subsidy obtained by the poor 35.1% 100%
PT Affordability index for the poor 9.5% 7.1%
PT Affordability index for the population as a whole 6.4% NA
Subsidy as share of total operator revenue 1.6% 5.6%
Evaluating alternative schemes
Effectiveness
Notes: [1] For Buenos Aires, the proposed fare structure reflects an increase in the general fare with a reduced fare for card-holders
of identified ‘categories’ (elderly, students, household workers, unemployed). The poor /intended beneficiaries are defined as the
poorest quintile of households; [2] In Bogota, the proposed fare structure reflects the structure actually implemented by Bogota (see
Box 2). The intended beneficiaries are households with a SISBEN score below 100. For budget reasons, however, the subsidy has
been extended only to a section of this population with SISBEN scores below 40,excluding those who have a car, are younger than
16 years old and have another type of public transit subsidy (disabled or old age). SISBEN is recognized as only an approximate
measure to identify potential beneficiaries of social programs in Bogota and is being continuously and incrementally improved.
Indicator was only calculated for trips taken in zonal buses of the SITP, does not include trips in trunk corridors. With proposed
subsidy, indicator decreased from 8.2% to 7.1%.
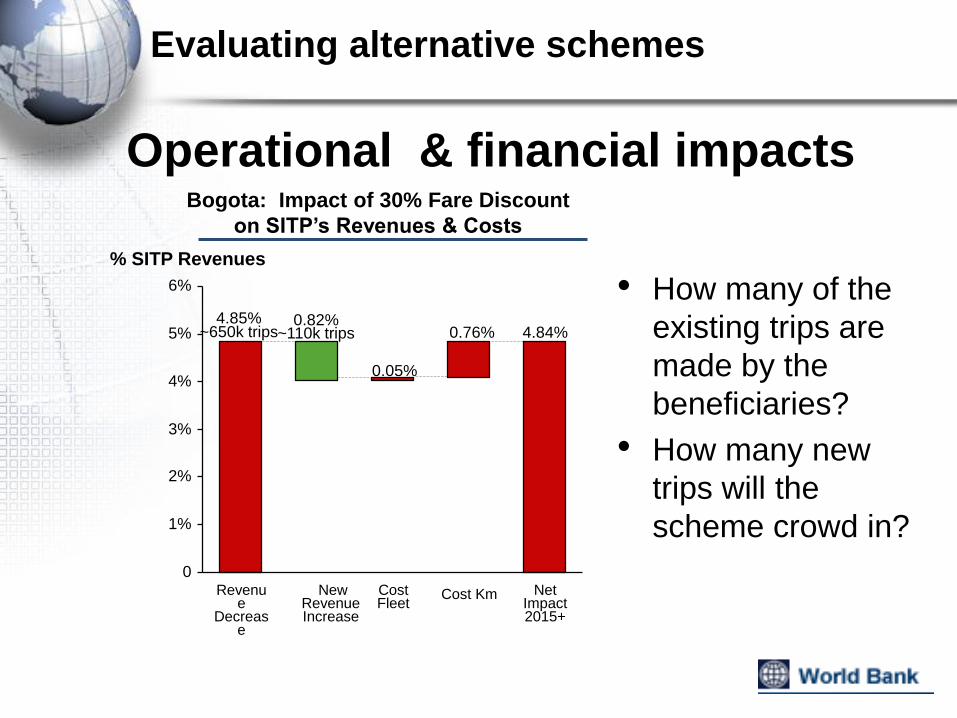
Bogota: Impact of 30% Fare Discount
on SITP’s Revenues & Costs
6%
5%
4%
3%
2%
1%
0 Net
Impact 2015+
4.84%
Cost Km
0.76%
Cost Fleet
0.05%
New Revenue Increase
0.82% ~110k trips
Revenue
Decrease
4.85% ~650k trips
% SITP Revenues
Operational & financial impacts
• How many of the
existing trips are
made by the
beneficiaries?
• How many new
trips will the
scheme crowd in?
Evaluating alternative schemes

Targeted Subsidy Implementation
Registration Delivery Usage
Biometrics
Means-tested
• Online
• By phone
• Customer Service
Desk
• Courier Service
• Verification of users identity:
• Drivers revision
• Supervision staff
• Distinctive set of lights
• Cards including photo ID
• Time restriction of 75 minutes in
the same station.
• Subsidy locked in non-used cards.
• Cards differently colored.
• Algorithms analysis to detect
suspicious patterns of use
• Biometric identification and authentication systems, seem to offer a promising tool to
support governments deploy targeted subsidies efficiently.
• Aracaju (Brazil). The city compiled information on biometric characteristics
(fingerprints) of users that could benefit from discounted fares (elderly, students,…), and
then installed biometric validation in buses/stations. The total costs of adapting the
system were US$3,100 per bus/station. After two years, 91% of users succeed
fingerprint validation on their first try, and of the 3% validation failures recorded, 2.6% are
fraud attempts and 0.4% is due to recognition problems.
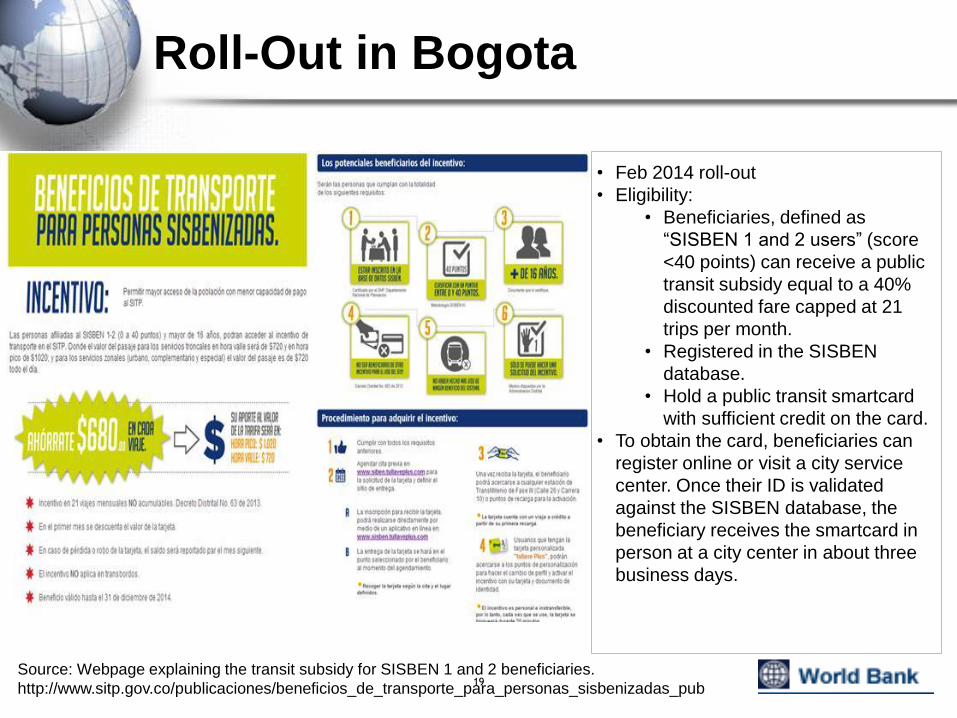
Roll-Out in Bogota
19 Source: Webpage explaining the transit subsidy for SISBEN 1 and 2 beneficiaries.
http://www.sitp.gov.co/publicaciones/beneficios_de_transporte_para_personas_sisbenizadas_pub
• Feb 2014 roll-out
• Eligibility:
• Beneficiaries, defined as
“SISBEN 1 and 2 users” (score
<40 points) can receive a public
transit subsidy equal to a 40%
discounted fare capped at 21
trips per month.
• Registered in the SISBEN
database.
• Hold a public transit smartcard
with sufficient credit on the card.
• To obtain the card, beneficiaries can
register online or visit a city service
center. Once their ID is validated
against the SISBEN database, the
beneficiary receives the smartcard in
person at a city center in about three
business days.

Experience so far in Bogota
20
• Still very early on but as of March: o Estimated total beneficiary population ≈750,000 (SISBEN 1 and 2
users, except those who have a car, are younger than 16 years old,
and have other subsidies such as old age, disabled)
o 32 city centers have been enabled with personnel and computers to
register potential beneficiaries
o 9,102 appointments had been scheduled to register for the subsidy,
2,079 cards actually distributed, and 10,649 subsidized trips
effectively used (March 23, 2014 Transmilenio)
• Next steps: work with Bogota to design and launch an
impact evaluation of the subsidy policy.
• Blog: http://blogs.worldbank.org/transport/will-you-take-me-1000-pesos-
making-sure-public-transport-subsidies-really-target-poor

Output Based Aid: core concepts
• Pro-poor targeting: to create incentives for service providers to
provide service access to the poor
• Accountability: performance and financial risk is transferred to
service providers
subsidies are paid on attainment of measurable outputs.
• Innovation: Service providers have an incentive to be innovative
and identify appropriate solutions to achieve outputs & trigger
subsidy payments
• Efficiency: per capita subsidy costs are kept within acceptable
limits – lower cost achieved through competition
• Sustainability: Ideally subsidy is one-off subsidy, cost recovery
is achieved through tariff collection
• Output verification and monitoring: independent verification of
agreed outputs by a third party is needed
21

Next Steps: Global Study
Objectives:
• Define OBA in urban transport
• Identify needed conditions to implement OBA
in urban transport
different level of development of urban transport
systems
• Identify range of OBA schemes that could be
implemented
e.g. ongoing direct-user subsidy transitional
subsidies for introducing new schedules or routes
22

Next Steps: Global Study
Objectives:
• Identify cities in GPOBA priority countries to
develop OBA schemes (that could benefit from
GPOBA support)
• Proposed TA activities to develop OBA
schemes
Priority countries mostly in Sub-Saharan Africa and
South Asia: India, Nepal, Bangladesh, Thailand, Pakistan,
Afghanistan, Tajikistan, Kyrgyzstan, Syria, Occupied
Palestinian Territories, Yemen, Somalia, Ethiopia, Kenya,
Sudan, South Sudan, Uganda, Rwanda, Tanzania, Democratic
Republic of Congo, Zambia, Malawi, Zimbabwe, Mozambique,
South Africa, Nigeria, Ghana, Liberia, Sierra Leone.
23

Next Steps: Mexico
• Diagnostics of existing subsidy
schemes
• Empirical data collection on Metro
• Targeted subsidy as part of a
package of measures
24

Next Steps: OBA in Urban
Transport - priority countries
• OBA as a spur for broader reform
for formalization of public transport
• Other options
OBA in informal systems?
Targeted concessions – feeder
services?
Concession contracts with OBA
features – demand risk for the poor
Interventions in land-use markets
25

Conclusions
• OBA has potential to create efficient
mechanisms that focus subsidy to those
who need it most
• Targeted subsidy for the poor is one step
‘social infrastructure’ provides a base for
mechanism design
‘smartcard’ technologies can help monitoring
• More pilots and innovation still needed
Informal systems
Addressing OBA concerns of sustainability &
risk
26