targeting excessive free radicals with peels and juices of ... · 1 targeting excessive free...
TRANSCRIPT

1
Targeting excessive free radicals with peels and juices of citrus fruits:
grapefruit, lemon, lime and orange
RAFAELA GUIMARÃES, LILLIAN BARROS, JOÃO C.M. BARREIRA, Mª JOÃO SOUSA, ANA
MARIA CARVALHO, ISABEL C.F.R. FERREIRA*
CIMO/Escola Superior Agrária, Instituto Politécnico de Bragança, Campus de Santa
Apolónia, Apartado 1172, 5301-855 Bragança, Portugal.
* Author to whom correspondence should be addressed (e-mail: [email protected]
telephone +351-273-303219; fax +351-273-325405).

2
ABSTRACT
A comparative study between the antioxidant properties of peel (flavedo and albedo)
and juice of some commercially grown citrus fruit (Rutaceae), grapefruit (Citrus
paradisi), lemon (Citrus limon), lime (Citrus x aurantiifolia) and sweet orange (Citrus
sinensis) was performed. Different in vitro assays were applied to the volatile and polar
fractions of peels and to crude and polar fraction of juices: 2,2-diphenyl-1-
picrylhydrazyl (DPPH) radical scavenging capacity, reducing power and inhibition of
lipid peroxidation using β-carotene-linoleate model system in lipossomes and
thiobarbituric acid reactive substances (TBARS) assay in brain homogenates. Reducing
sugars and phenolics were the main antioxidant compounds found in all the extracts.
Peels polar fractions revealed the highest contents in phenolics, flavonoids, ascorbic
acid, carotenoids and reducing sugars, which certainly contribute to the highest
antioxidant potential found in these fractions. Peels volatile fractions were clearly
separated using discriminat analysis, which is in agreement with their lowest
antioxidant potential.
KEYWORDS: Citrus fruits; Antioxidants; Scavenging activity; Peroxidation
inhibition.

3
1. Introduction
During the past years, reactive oxygen species (ROS) and reactive nitrogen species
(RNS) have been implicated in the oxidative deterioration of food products as well as in
the pathogenesis of several human diseases such as atherosclerosis, diabetes mellitus,
chronic inflammation, neurodegenerative disorders and certain types of cancer
(Halliwell, 1996). Recently, interest has increased considerably in finding naturally
occurring antioxidants for use in food or pharmaceutical applications, which can protect
the human body from free radicals and retard the progress of many chronical diseases as
well as retard lipid oxidative rancidity in food (Prior, 2003). In fact, many antioxidant
compounds extracted from plant sources (phytochemicals) have been identified as free
radical or active oxygen scavengers (Ramarathnam et al., 1995).
Citrus (Citrus L. from Rutaceae) is one of the most important world fruit crops and is
consumed mostly as fresh produce or juice because of its nutritional value and special
flavour. Most popular within European and North American consumers are grapefruits
(Citrus paradisi), lemons (Citrus limon), limes (Citrus × aurantiifolia) and sweet
oranges (Citrus sinensis) (Mabberley, 1997; Citrus Pages, 2009). Consumption of citrus
fruit or juice is found to be inversely associated with several diseases (Joshipura et al.,
2001). The health benefits of citrus fruit have mainly been attributed to the presence of
bioactive compounds, such as phenolics (e.g. flavanone glycosides, hydroxycinnamic
acids) (Marchand, 2002), vitamin C (Halliwell, 1996), and carotenoids (Rao and Rao,
2007). Although, the fruits are mainly used for dessert, they are also sources of essential
oils due to their aromatic compounds (Minh Tu et al., 2002; Chutia et al., 2009). For
instance, lime flavours are used in beverage, confectionary, cookies and desserts
(Dharmawan et al., 2007; Chutia et al., 2009). Many authors have reported antioxidant

4
and radical-scavenging properties of essential oils (Sacchetti et al., 2005) and in some
cases, a direct food-related application also (Madsen and Bertelsen, 1995).
So far, studies on bioactive compounds and antioxidant activity of citrus have mainly
focused on the fruits (peels, pulps and juices) polar fractions (Abeysinghe et al., 2007;
Gorinstein et al., 2001). Herein we developed a comparative study between four citrus
fruits (peels and juices) in order to understand which of them are preferable for dietary
prevention of cardiovascular and other diseases related to oxidative stress. Volatile and
polar fractions of grapefruits, lemons, limes and oranges studied and compared
considering free radical scavenging properties, reducing power, and inhibition of lipid
peroxidation capacity (in lipossomes and in brain homogenates). Antioxidant molecules
such as phenolics, sugars, ascorbic acid and carotenoids were also quantified in order to
understand their contribution to the overall bioactive properties.
2. Materials and methods
2.1. Samples
Commercially grown grapefruit (Citrus paradisi ‘Star Ruby’), lime (Citrus ×
aurantiifolia (Christm.) Swingle) were purchased from a local supermarket, and lemon
(Citrus limon (L.) Burm.f.) and sweet orange (Citrus sinensis (L.) Osbeck, ‘Valencia’
group) from a rural market, in February 2009. The citrus taxa studied were botanically
classified using the synthetic proposal of Mabberley (1997) and the information
published in Citrus Pages (http://users.kymp.net/citruspages/introduction.html, last
update April 2009). Morphological characterization of the samples (8 fruits analysed per
sample and species) was performed (Table 1) for botanical description and comparison
in future research. Size, shape, form of the basal (stem) and apical (stylar) ends, and

5
other distinctive general characters (Figure 1), such as peel (flavedo and albedo)
thickness and the smoothness of the surface, number of segments of the endocarp,
central axis or medulla, some special structures that are or may be present in the apex
(areole, mammilla, navel) and seed presence were described according to horticultural
criteria defined by Hodgson (1986). Fruits range in size is expressed by the average D/H
index (Table 1). The D/H index is obtained by dividing the diameter of each fruit
measured by its height (distance from stem to apex).
2.2. Standards and reagents
All the solvents were of analytical grade purity; methanol was supplied by Lab-Scan
(Lisbon, Portugal). The standards used in the antioxidant activity assays: BHA (2-tert-
butyl-4-methoxyphenol), TBHQ (tert-butylhydroquinone), L-ascorbic acid, α-
tocopherol, gallic acid and (+)-catechin were purchased from Sigma (St. Louis, MO,
USA). 2,2-Diphenyl-1-picrylhydrazyl (DPPH) was obtained from Alfa Aesar (Ward
Hill, MA, USA). The standard butylated hydroxytoluene (BHT) was purchased from
Merck (Darmstadt, Germany). All other chemicals were obtained from Sigma Chemical
Co. (St. Louis, MO, USA). Water was treated in a Milli-Q water purification system
(TGI Pure Water Systems, USA).
2.3. Volatile fraction
The essential oils were isolated from the fresh material (~150 g peels plus 350 mL of
distilled ultra pure water) by hydro-distillation for 3 h, using a Clevenger-type
apparatus. The extracts were dried with anhydrous sodium sulphate and concentrated
under reduced pressure by rotary evaporator (Büchi R-210). The extraction yield was
calculated in g of oil/100 g of fresh material. The collected oil was weighed, dissolved

6
in methanol at a concentration of 500 mg/mL, and stored in sealed vials at -20 ◦C for
further use.
2.4. Polar fraction
Lyophilized (Ly-8-FM-ULE, Snijders, HOLLAND) powdered samples (peels and juice;
~3 g) were extracted by stirring with 50 mL of methanol at 25 ºC at 150 rpm for 12h
and filtered through Whatman nº 4 paper. The residue was then extracted with one
additional 50 mL portion of the methanol. The extracts were evaporated to dryness and
redissolved in methanol at a concentration of 20 mg/mL, and stored at 4 ºC for further
use. Also, the lyophilized juices were directly dissolved in water at a concentration of
20 mg/mL (Crude juices), and stored at 4 ºC for further use.
Total phenolics were estimated by a colorimetric assay, based on procedures described
by (Wolfe et al., 2003) with some modifications. An aliquot of the extract solution was
mixed with Folin-Ciocalteu reagent (5 ml, previously diluted with water 1:10 v/v) and
sodium carbonate (75 g/l, 4 ml). The tubes were vortexed for 15 s and allowed to stand
for 30 min at 40 °C for colour development. Absorbance was then measured at 765 nm
(Analytikijena 200-2004 spectrophotometer). Gallic acid was used to calculate the
standard curve (0.05-0.8 mM; y = 1.9799x + 0.0299; R2 = 0.9997), and the results were
expressed as mg of gallic acid equivalents (GAEs) per g of extract.
Total flavonoids contents were determined spectrophotometrically using the method of
Jia et al. (1999) based on the formation of a complex flavonoid-aluminum, with some
modifications. An aliquot (0.5 ml) of the extract solution was mixed with distilled water
(2 ml) and subsequently with NaNO2 solution (5%, 0.15 ml). After 6 min, AlCl3
solution (10%, 0.15 ml) was added and allowed to stand further 6 min, thereafter,
NaOH solution (4%, 2 ml) was added to the mixture. Immediately, distilled water was

7
added to bring the final volume to 5 mL. Then the mixture was properly mixed and
allowed to stand for 15 min. The intensity of pink colour was measured at 510 nm. (+)-
Catechin was used to calculate the standard curve (0.0156-1.0 mM; y = 0.9186x -
0.0003; R2 = 0.9999) and the results were expressed as mg of (+)-chatequin equivalents
(CEs) per g of extract.
Ascorbic acid was determined according to the method of Klein and Perry (1982). A
fine powder (20 mesh) of sample (150 mg) was extracted with metaphosphoric acid
(1%, 10 ml) for 45 min at room temperature and filtered through Whatman Nº 4 filter
paper. The filtrate (1 ml) was mixed with 2,6-dichloroindophenol (9 ml) and the
absorbance was measured within 30 min at 515 nm against a blank. Content of ascorbic
acid was calculated on the basis of the calibration curve of authentic L-ascorbic acid
(0.006-0.1 mg/ml; y = 3.0062x + 0.007; R2 = 0.9999), and the results were expressed as
µg of ascorbic acid per g of extract.
For β-carotene and lycopene determination a fine dried powder (150 mg) was
vigorously shaken with 10 mL of acetone–hexane mixture (4:6) for 1 min and filtered
through Whatman No. 4 filter paper. The absorbance of the filtrate was measured at
453, 505, 645 and 663 nm (Barros et al., 2008). Contents of β-carotene and lycopene
were calculated according to the following equations: lycopene (mg/100 mL) = - 0.0458
× A663 + 0.204 × A645 + 0.372 × A505 - 0.0806 × A453; β-carotene (mg/100 mL) = 0.216
× A663 – 1.220 × A645 - 0.304 × A505 + 0.452 × A453. The results were expressed as μg of
carotenoid per g of extract.
Reducing sugars were determined by the DNS (dinitrosalicylic acid) method and
glucose was used to calculate the standard curve (250-1500 µg/mL; Y=0.0007X-0.0567;
R2=0.9997); the results were expressed as g of reducing sugars per g of extract.

8
2.5. Radical scavenging activity
This methodology was performed using an ELX800 Microplate Reader (Bio-Tek
Instruments, Inc). The reaction mixture in each one of the 96-wells consisted of extract
solution (30 μL) and aqueous methanolic solution (80:20 v/v, 270 μL) containing DPPH
radicals (6x10⁻⁵ mol/L). The mixture was left to stand for 60 min in the dark. The
reduction of the DPPH radical was determined by measuring the absorption at 515 nm.
The radical scavenging activity (RSA) was calculated as a percentage of DPPH
discolouration using the equation: % RSA = [(ADPPH-AS)/ADPPH] × 100, where AS is the
absorbance of the solution when the sample extract has been added at a particular level,
and ADPPH is the absorbance of the DPPH solution. The extract concentration providing
50% of radicals scavenging activity (EC50) was calculated from the graph of RSA
percentage against extract concentration. BHA and α-tocopherol were used as
standards.
2.6. Reducing power
This methodology was performed using the Microplate Reader described above. The
extract solutions (0.5 mL) were mixed with sodium phosphate buffer (200 mmol/L, pH
6.6, 0.5 mL) and potassium ferricyanide (1% w/v, 0.5 mL). The mixture was incubated
at 50 ºC for 20 min, and trichloroacetic acid (10% w/v, 0.5 mL) was added. The mixture
(0.8 mL) was poured in the 48-wells, as also deionised water (0.8 mL) and ferric
chloride (0.1% w/v, 0.16 mL), and the absorbance was measured at 690 nm. The extract
concentration providing 0.5 of absorbance (EC50) was calculated from the graph of
absorbance at 690 nm against extract concentration. BHA and α-tocopherol were used
as standards.

9
2.7. Inhibition of lipid peroxidation
β-carotene bleaching inhibition. The antioxidant activity of the extracts was evaluated
by the β-carotene linoleate model system, as described previously by us (Barros et al.,
2008). A solution of β-carotene was prepared by dissolving β-carotene (2 mg) in
chloroform (10 mL). Two millilitres of this solution were pipetted into a round-bottom
flask. After the chloroform was removed at 40ºC under vacuum, linoleic acid (40 mg),
Tween 80 emulsifier (400 mg), and distilled water (100 mL) were added to the flask
with vigorous shaking. Aliquots (4.8 mL) of this emulsion were transferred into
different test tubes containing different concentrations of the extracts (0.2 mL). The
tubes were shaken and incubated at 50ºC in a water bath. As soon as the emulsion was
added to each tube, the zero time absorbance was measured at 470 nm using a
spectrophotometer. A blank, devoid of β-carotene, was prepared for background
subtraction. β-Carotene bleaching inhibition was calculated using the following
equation: (β-carotene content after 2h of assay/initial β-carotene content) × 100. The
extract concentration providing 50% antioxidant activity (EC50) was calculated by
interpolation from the graph of β-carotene bleaching inhibition percentage against
extract concentration. TBHQ was used as standard.
Inhibition of lipid peroxidation using thiobarbituric acid reactive substances (TBARS).
Brains were obtained from pig (Sus scrofa) of body weight ~150 Kg, dissected and
homogenized with a Polytron in ice-cold Tris–HCl buffer (20 mM, pH 7.4) to produce a
1:2 (w/v) brain tissue homogenate which was centrifuged at 3000g for 10 min. An
aliquot (0.1 ml) of the supernatant was incubated with the extracts solutions (0.2 mL) in
the presence of FeSO4 (10 μM; 0.1 ml) and ascorbic acid (0.1 mM; 0.1 ml) at 37ºC for 1
h. The reaction was stopped by the addition of trichloroacetic acid (28% w/v, 0.5 mL),

10
followed by thiobarbituric acid (TBA, 2%, w/v, 0.38 mL), and the mixture was then
heated at 80 ºC for 20 min. After centrifugation at 3000g for 10 min to remove the
precipitated protein, the colour intensity of the malondialdehyde (MDA)-TBA complex
in the supernatant was measured by its absorbance at 532 nm. The inhibition ratio (%)
was calculated using the following formula: Inhibition ratio (%) = [(A – B)/A] x 100%,
where A and B were the absorbance of the control and the compound solution,
respectively. The extract concentration providing 50% lipid peroxidation inhibition
(EC50) was calculated from the graph of TBARS inhibition percentage against extract
concentration (Barros et al., 2008). BHA was used as standard.
2.8. Statistical analysis
For each one of the fruits three samples were analysed and also all the assays were
carried out in triplicate. The results are expressed as mean values and standard error
(SE) or standard deviation (SD). The statistical differences represented by letters were
obtained through one-way analysis of variance (ANOVA) followed by Tukey’s
honestly significant difference post hoc test with α = 0.05, coupled with Welch’s
statistic.
Discriminant function analysis was done following stepwise method, aiming to
determine which variables discriminate between the four naturally occurring groups.
The values of F to enter and F to remove are the guidelines of the stepwise procedure.
The F-value for a variable indicates its statistical significance in the discrimination
between groups. Discriminant analysis defines an optimal combination of varieties in a
way that the first function furnishes the most general discrimination between groups, the
second provides the second most, and so on (Benitez et al., 2006).
These treatments were carried out using SPSS v. 16.0 program.

11
3. Results and discussion
The yields obtained in the extraction of volatiles and polar compounds of citrus peels
and in the extraction of juice polar compounds are presented in Table 2. Juices polar
fractions gave extraction yields higher than 95% (measured as ratio between the extract
weight and the dry weight of each sample), followed by the peels polar fraction. As
expected, the yields obtained for the peels volatile fractions (calculated as ratio between
the oil weight and the fresh weight of each sample) were significantly lower (less than
1.3%).
The antioxidant properties of citrus fruits were evaluated considering the separate
contribution of peels volatile fraction (including essential oils) and polar fraction
(including antioxidants such as phenolics, flavonoids, ascorbic acid, carotenoids and
reducing sugars). The corresponding juices were also evaluated considering the polar
fraction and the crude juice. Numerous tests have been developed for measuring the
antioxidant capacity of food and biological samples. However, there is no universal
method that can measure the antioxidant capacity of all samples accurately and
quantitatively. Clearly, matching radical source and system characteristics to
antioxidant reaction mechanisms is critical in the selection of appropriate assessing
antioxidant capacity assay methods, as is consideration of the end use of the results
(Prior et al., 2005). In this way, to screen the antioxidant properties of the samples, four
different in vitro assays were performed: DPPH radical scavenging capacity, reducing
power and inhibition of lipid peroxidation using β-carotene-linoleate model system in
lipossomes and TBARS assay in brain homogenates.
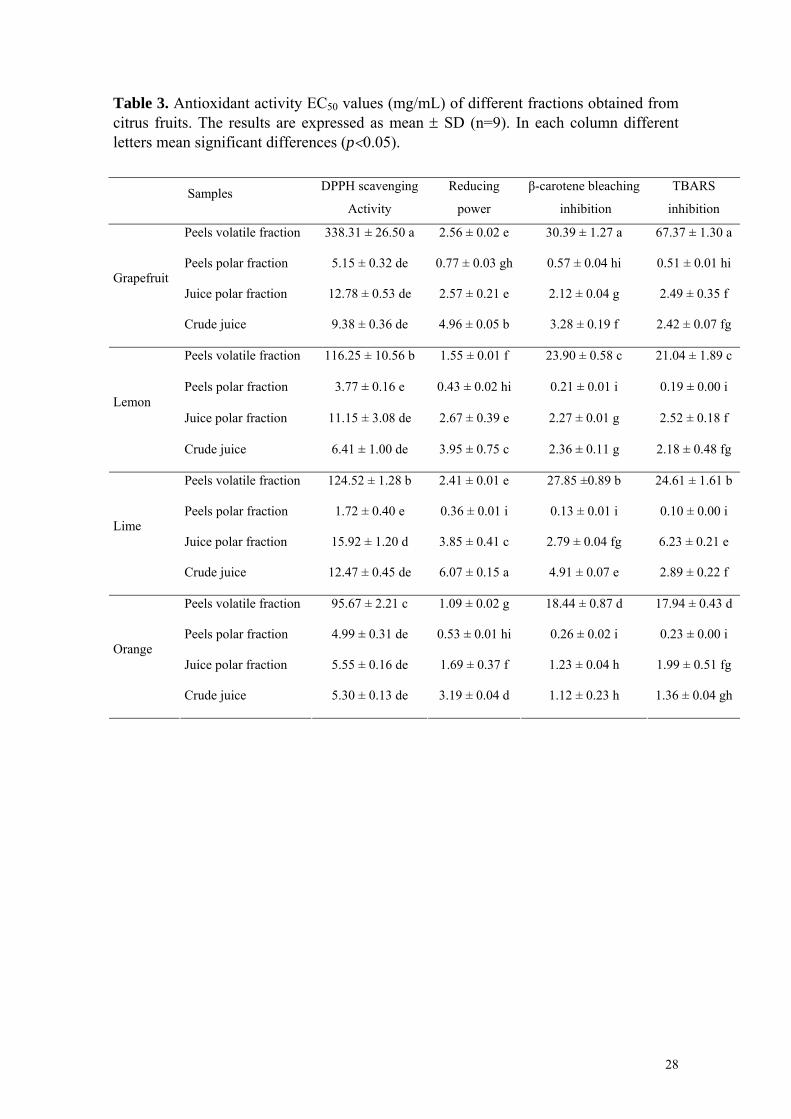
The peels polar fractions revealed the highest antioxidant properties (significantly lower
EC50 values; p<0.05), while the peels volatile fractions gave the lowest antioxidant

12
potential (Table 3). For all citrus fruits, peels gave better results than the corresponding
juices. Orange revealed the highest antioxidant potential in all the studied fractions,
with the exception of peels polar fraction, in which lime gave the best results.
Grapefruits peels and lime juices gave the lowest antioxidant properties.
Using peels volatile fractions, the best results of antioxidant activity were obtained in
the reducing power assay (Table 3). In this assay, the transformation of Fe3+ into Fe2+ in
the presence of various fractions was measured. The antioxidants present cause the
reduction of Fe3+/ferricyanide complex (FeCl3/K3Fe(CN)6) to the ferrous form (Fe2+).
Therefore, depending on the reducing power of the samples, the yellow colour of the
test solution changes to various shades of green or blue (Amarowicz et al., 2004); this
can be measured spectrophotometrically at 700 nm determining the reducing power
(redox cycle) of the tested substances faced with a certain metal responsible for free
radicals production and in some cases for antioxidants regeneration.
The chemistry of iron-based assays may be summarized with the following reaction
equation:
Fe3+ –L + antioxidant Fe2+ –L + oxidized antioxidant
where L is the ferrous-selective chromogenic ligand producing the colored species Fe2+
–L as a result of the concerned redox reaction. Either the oxidant species is Fe3+ –L or
Fe(CN)63− (in the composite ferricyanide reagent), the reduction product with the
antioxidant, either Fe2+ –L or Fe(CN)64−, respectively, combines with the other reagent
component to produce Prussian blue, KFe[Fe(CN)6], as the coloured product (Berker et
al., 2007).
For peels polar fractions and crude juices, the best results of antioxidant activity were
obtained in the TBARS assay (Table 3). This procedure measures the malondialdehyde
(MDA) formed as the split product of an endoperoxide of unsaturated fatty acids

13
resulting from oxidation of a lipid substrate. It is postulated that the formation of MDA
from fatty acids with less than three double bonds (e.g., linoleic acid) occurs via the
secondary oxidation of primary carbonyl compounds (e.g., non-2-enal) (Fernández et
al., 1997). The MDA is reacted with thiobarbituric acid (TBA) to form a pink pigment
(TBARS) that is measured spectrophotometrically at 532 nm (Ng et al., 2000).
Using juice polar fractions, the best results of antioxidant activity were obtained in the
β-carotene-linoleate assay (Table 3). Decolourization of β-carotene can be monitored
by spectrophotometry at 470 nm and can be employed as an assay of antioxidant
activity. The β-carotene undergoes a rapid discoloration in the absence of an antioxidant
since the free linoleic acid radical attacks the β-carotene molecule, which loses the
double bonds and, consequently, loses its characteristic orange colour. β-carotene is
extremely sensitive to free radical mediated oxidation of linoleic acid (Gutierrez et al.,
2006). Classical antioxidants can donate hydrogen atoms to quench radicals and prevent
decolourization of carotenoids:
β-carotene – H (orange) + ROO• β-carotene• (bleached) + ROOH
β-carotene – H (orange) + ROO• + AH β-carotene – H (orange) + ROOH + A•
Antioxidants can neutralize any free radicals formed within the system (e.g., the
linoleate free radical) and, consequently, may delay decolourization of β-carotene
(Jayaprakasha et al., 2001; Amarowicz et al., 2004). Accordingly, the absorbance
decreased rapidly in samples without antioxidant, whereas in the presence of an
antioxidant, they retained their colour, and thus absorbance, for a longer time.
DPPH assay gave the highest EC50 values in all the fractions (Table 3). The 2,2-
diphenyl-1-picrylhydrazyl radical (DPPH•) is a stable organic nitrogen radical, is
commercially available and has a deep purple colour. The radical scavenging activity
(RSA) assay measures the reducing capacity of antioxidants toward DPPH•. Upon

14
reduction, the colour of DPPH• solution fades and this colour change is conveniently
monitored spectrophotometrically at 517 nm. Therefore, test compounds with high
antioxidant activity result in a rapid decline in the absorbance of the DPPH• (Antolovich
et al., 2002; Amarowicz et al., 2004). When a solution of DPPH• is mixed with a
substance that can donate a hydrogen atom, the reduced form of the radical is generated
accompanied by loss of colour (Ali et al., 2008). Representing the DPPH• by X• and the
donor molecule by AH, the primary reaction is:
As the polar fractions gave better antioxidant activity results than volatile fractions, it
was investigated the composition of the polar extracts (peels and juices) in antioxidant
compounds, including phenolics, flavonoids, ascorbic acid, carotenoids and reducing
sugars (Table 4). Reducing sugars and phenolics were the main antioxidant compounds
found in all the extracts. Although, it should be pointed out that ascorbic acid (vitamin
C) is very fragile in polar solutions and might be destroyed upon exposure to air, light
or heat. Peels polar fractions revealed the highest contents in phenolics, flavonoids,
ascorbic acid, carotenoids and reducing sugars, which certainly contribute to the highest
antioxidant potential found in these fractions (Table 3). The better scavenging activity,
reducing power and lipid peroxidation inhibition showed by lime peels polar fraction
(Table 3) might be due to the highest levels and synergy between phenolics, ascorbic
acid and lycopene found in this sample (Table 4). Orange peels polar fraction also
revealed high antioxidant potential (Table 3) with the contribution of β-carotene and
reducing sugars, found in this sample in high levels (Table 4). Considering flavonoids,
lemon gave the highest concentrations, which is in agreement with reports available in
literature (Del Rio et al., 2004).
X• + AH XH + A•

15
Statistical Analysis
In the discriminant analysis (DA) several combinations of the obtained results were
used (Table 5). As it can be seen in Figures 2 and 3, only the first two functions
defined in each one of the DA studies were plotted.
Regarding antioxidant activity assays, the DA defined four functions, with 96.4% of the
observed variance explained by the first two (Figure 2). The first function separates
primarily peels volatile fraction samples from the other citric components (means of the
canonical variance, MCV: orange peels volatile fraction (9) = 27.256, lemon peels
volatile fraction (10) = 40.305, lime peels volatile fraction (11) = 50.280 and grapefruit
peels volatile fraction (12) = 108.12), and revealed to be more powerfully correlated
with TBARS and β-carotene bleaching inhibition assays. The second dimension
confirmed the separation of 9, 10, 11 and 12, separating also lime juice polar fraction
(3) (MCV: (3) = 5.699, (9) = -10.238, (10) = -15.394, (11) = -17.293 and (12) = 19.978)
and showed to be more correlated with β-carotene bleaching and TBARS inhibition
assays. Neither function 1 nor function 2 were able to separate the remaining samples.
Concerning bioactive compounds content, DA defined five dimensions, being 99.3% of
the observed variance explained by the first two (Figure 3). The first function separates
primarily orange peels polar fraction (5) (MCV: (5) = 454.91), and revealed to be more
effectively correlated with carotenoids. The second function separates the polar
fractions of lemon (6), lime (7) and grapefruit (8) from the other samples (MCV: (6) =
91.705, (7) = 134.83 and (8) = 16.921) and showed to be more correlated with
phenolics. Neither function 1 nor function 2 separated clearly crude juice and juice polar
fractions samples.
From the seven functions defined when the antioxidant activity assays results were
considered together with bioactive compounds content, using only crude juice and juice
16
polar fraction samples, the first two explained 96.4% of the observed variance (Figure
4). The first function separates mostly orange (1) and grapefruit (4) juice polar
extractions and lime (15) and grapefruit (16) crude juices (MCV: (1) = 53.212, (4) =
44.064, (15) = -48.973 and (16) = -59.795), and revealed to be more strongly correlated
with ascorbic acid and β-carotene bleaching inhibition assay. The second function
separated the remaining samples (MCV: lemon juice polar fraction (2) = -11.113, lime
juice polar extraction (3) = -4.3283, orange crude juice (13) = 28.566 and lemon crude
juice (14) = -2.0461) and showed to be more correlated with reducing sugars and
carotenoids.
In summary, the different samples could only be clustered in individual groups, when
the algorithm was applied for selecting variables according with different parameters.
Peels volatile fractions were separated with high clearness according with antioxidant
activity assays. In the other hand, only bioactive compounds contents made the
individualization of peels polar fractions possible. The DA revealed also very close
proximity among the results obtained for juices, either in the crude form, as well as the
corresponding polar fractions. Actually, the results for juices samples were only
clustered individually when data regarding peels where removed.
Overall it was found that peels of fruits are major sources of different antioxidants and
these by-products of the juice extraction industry could be used as natural antioxidants.
Otherwise, the use of the whole extract instead of individual antioxidants allows taking
advantage of additive and synergistic effects of different phenolics, flavonoids, ascorbic
acid, carotenoids and reducing sugars present in the samples.
Acknowledgements

17
The authors are grateful to the Foundation for Science and Technology (Portugal) for
financial support to the research centre CIMO and L. Barros grant
(SFRH/BPD/4609/2008).
References
Abeysinghe, D.C., Li, X., Sun, C.D., Zhang, W, Zhou, C., Chen, K. 2007. Bioactive
compounds and antioxidant capacities in different edible tissues of citrus fruit of
four species. Food Chem. 104, 1338–1344.
Ali S.S., Kasoju N., Luthra A., Singh A., Sharanabasava H., Sahu A., Bora U. 2008.
Indian medicinal herbs as sources of antioxidants. Food Res. Int. 41, 1-15.
Amarowicz, R., Pegg, R.B., Rahimi-Moghaddam, P., Barl, B., Weil, J.A. 2004. Free-
radical scavenging capacity and antioxidant activity of selected plant species from
the Canadian prairies. Food Chem. 84, 551-562.
Antolovich, M., Prenzler, P.D., Patsalides, E., McDonald, S., Robards, K. 2002. Methods
for testing antioxidant activity. Analyst 127, 183-198.
Barros, L., Venturini, B., Baptista, P., Estevinho, L., Ferreira, I.C.F.R. 2008. Chemical
Composition and Biological Properties of Portuguese Wild Mushrooms: A
comprehensive study. J. Agric. Food Chem. 56, 3856-3862.
Benitez, E., Nogales, R., Campos, M., Ruano, F. 2006. Biochemical variability of olive-
orchard soils under different management systems. App. Soil Ecol. 32, 221-231.
Berker, K.I, Güçlü, K., Tor, I., Apak, R. 2007. Comparative evaluation of Fe(III)
reducing power-based antioxidant capacity assays in the presence of
phenanthroline, batho-phenanthroline, tripyridyltriazine (FRAP), and ferricyanide
reagents. Talanta 72, 1157-1165.

18
Chutia, M., Deka, P., Bhuyan, Pathak, M.G., Sarma, T.C., Boruah, P. 2009. Antifungal
activity and chemical composition of Citrus reticulata Blanco essential oil against
phytopathogens from North East India. LWT 42, 777–780.
Citrus Pages. http://users.kymp.net/citruspages/introduction.html, last update March
2009.
Del Rio, J.A., Fuster, M.D., Gómez, P., Porras, I., García-Lidón, A., Ortuño, A. 2004.
Citrus limon: a source of flavonoids of pharmaceutical interest. Food Chem. 84,
457-461.
Dharmawan, J., Kasapis, S., Curran, P., Johnson, J.R. 2007. Characterization of volatile
compounds in selected citrus fruits from Asia. Part I: freshly-squeezed juice.
Flavour Fragr. J. 22, 228–232.
Fernández, J., Perez-Alvarez, J.A.,. Fernández-Lopez, J.A. 1997. Thiobarbituric acid test
for monitoring lipid oxidation in meat. Food Chem. 59, 345-353.
Gorinstein, S., Belloso, O.M., Park, Y.-S., Haruenkit, R., Lojek, A., Cíz, M., Caspi, A.,
Libman, I., Trakhtenberg, S. 2001. Comparison of some biochemical
characteristics of different citrus fruits. Food Chem. 74, 309–315.
Gutierrez, R.M.P., Luna, H.H., Garrido, S.H. 2006. Antioxidant activity of Tagates
erecta essential oil. J. Chil. Chem. Soc. 51, 883-886.
Halliwell, B. 1996. Antioxidants in human health and disease. Ann. Rev. Nutrition 16,
33-50.
Hodgson R.W. 1986. Horticultural Varieties of Citrus. In Wardowski, W.F., Nagy, S.
and Grierson, W. Fresh Citrus Fruits. Macmillan UK
Jayaprakasha, G.K., Singh, R.P., Sakariah, K.K. 2001. Antioxidant activity of grape seed
(Vitis vinifera) extracts on peroxidation models in vitro. Food Chem. 73, 285-290.

19
Jia, Z., Tang, M., Wu, J. 1999. The determination of flavonoid contents in mulberry and
their scavenging effects on superoxide radicals. Food Chem. 64, 555-559.
Joshipura, K. J., Hu, F. B., Manson, J. E., Stampfer, M. J., Rimm, E. B., Speizer, F.E.
2001. The effect of fruit and vegetable intake on risk for coronary heart disease.
Ann. Int. Med. 134, 1106–1114.
Mabberley, D. J. 1997. A classification for edible Citrus (Rutaceae). Telopea 7, 167-172.
Madsen, H. L., Bertelsen, G. 1995. Spices as antioxidants. Trends Food Sci. Technol. 6,
271–277.
Marchand, L. 2002. Cancer preventive effects of flavonoids - a review. Biomed.
Pharmacother. 56, 296–301.
Minh Tu, N.T., Thanh, L.X., Une, A., Ukeda, H., Sawamura, M. 2002. Volatile
constituents of Vietnamese pummelo, orange, tangerine and lime peel oils. Flav.
Fragr. J. 17, 169–174.
Ng, T.B., Liu, F., Wang, Z. 2000. Antioxidative activity of natural products from plants.
Life Sci. 66, 709-723.
Prior R.L. 2003. Fruits and vegetables in the prevention of cellular oxidative damage.
Am. J. Clin. Nutr. 78, 570S-578S.
Prior, R.L., Wu, X.L., Schaich, K. 2005. Standardized methods for the determination of
antioxidant capacity and phenolics in foods and dietary supplements. J. Agric.
Food Chem. 53, 4290-4302.
Ramarathnam, N., Osawa, T., Ochi, H., Kawakishi, S. 1995. The contribution of plant
food antioxidants to human health. Trends Food Sci. Technol. 6, 75-82.
Rao, A.V., Rao, L.G. 2007. Carotenoids and human health. Pharmacol. Res. 55, 207–
216.

20
Sacchetti, G., Maietti, S., Muzzoli, M., Scaglianti, M., Manfredini, S., Radice, M. 2005.
Comparative evaluation of 11 essential oils of different origin as functional
antioxidants, antiradicals and antimicrobials in foods. Food Chem. 91, 621–632.
Wolfe, K., Wu, X., Liu, R.H. 2003. Antioxidant activity of apple peels. J. Agric. Food
Chem. 51, 609-614.

21
Figure 1. 1 – Flavedo (the orange peripheral surface of the peel or epicarp); 2 – Albedo
(the white soft fiber middle layer of the peel or mesocarp); 3 – The inside layer of the
fruit or endocarp, divided in segments or carpels with juicy vesicles; 4 – central column
or medulla.
Figure 2. Canonical analysis of citric fruits samples based on antioxidant activity results.
Orange (1), lemon (2), lime (3) and grapefruit (4) juice polar fractions; orange (5),
lemon (6), lime (7) and grapefruit (8) peels polar fractions; orange (9), lemon (10), lime
(11) and grapefruit (12) peels volatile fractions; orange (13) = 28.566, lemon (14); lime
(15) and grapefruit (16) crude juices.
Figure 3. Canonical analysis of crude juice, juice polar fractions and peels polar
fractions samples based on bioactive compounds contents.
Orange (1), lemon (2), lime (3) and grapefruit (4) juice polar fractions; orange (5),
lemon (6), lime (7) and grapefruit (8) peels polar fractions; orange (13) = 28.566, lemon
(14); lime (15) and grapefruit (16) crude juices.
Figure 4. Canonical analysis of crude juice and juice polar fractions samples based on
antioxidant activity results and bioactive compounds contents.
Orange (1), lemon (2), lime (3) and grapefruit (4) juice polar fractions; orange (13) =
28.566, lemon (14); lime (15) and grapefruit (16) crude juices.

22
Figure 1.
4
1
3
3
2

23
Figure 2.

24
Figure 3.

25
Figure 4.

26
Table 1. Morphological characterization of citrus fruits samples purchased in local markets. Grapefruit and lime collection date unknown; Lemon and orange collected in January 2009. Average values and patrons.
Samples Origin Weight (g) H/D Shape Skin Flavedo
(mm) Albedo (mm)
Segments number
Medulla (core) Apex Seed
Grapefruit Spain 296.4 0.80 subglobose smooth dotted 2.0 4.0 12.8 hollow
flattened slightly
depressed vestigial
Lemon Portugal (Trás-os-Montes) 102.3 1.27 elliptical rough 0.9 4.4 7.4 solid nipple seedless
Lime Spain 76.6 1.22 ovate smooth 1.0 1.3 9.5 solid small papilla seedless
Orange Portugal (Trás-os-Montes 168.7 1.21 spherical smooth 1.3 2.8 10.3 semi
solid navel seedless

27
Table 2. Yields obtained in the extraction of volatiles and polar compounds of citrus fruits. In each column different letters mean significant differences (p<0.05).
Samples Yield (%)
Peels volatile fraction 0.19 ± 0.05 i
Peels polar fraction 50.13 ± 0.65 c Grapefruit
Juice polar fraction Quantitative
Peels volatile fraction 0.18 ± 0.04 j
Peels polar fraction 44.68 ± 0.59 d Lemon
Juice polar fraction Quantitative
Peels volatile fraction 1.26 ± 0.16 g
Peels polar fraction 15.18 ± 0.20 f Lime
Juice polar fraction 99.37 ± 1.36 a
Peels volatile fraction 0.32 ± 0.09 h
Peels polar fraction 37.27 ± 0.81 e Orange
Juice polar fraction 95.30 ± 2.02 b
28
Table 3. Antioxidant activity EC50 values (mg/mL) of different fractions obtained from citrus fruits. The results are expressed as mean ± SD (n=9). In each column different letters mean significant differences (p<0.05).
Samples DPPH scavenging
Activity
Reducing
power
β-carotene bleaching
inhibition
TBARS
inhibition
Peels volatile fraction 338.31 ± 26.50 a 2.56 ± 0.02 e 30.39 ± 1.27 a 67.37 ± 1.30 a
Peels polar fraction 5.15 ± 0.32 de 0.77 ± 0.03 gh 0.57 ± 0.04 hi 0.51 ± 0.01 hi
Juice polar fraction 12.78 ± 0.53 de 2.57 ± 0.21 e 2.12 ± 0.04 g 2.49 ± 0.35 f Grapefruit
Crude juice 9.38 ± 0.36 de 4.96 ± 0.05 b 3.28 ± 0.19 f 2.42 ± 0.07 fg
Peels volatile fraction 116.25 ± 10.56 b 1.55 ± 0.01 f 23.90 ± 0.58 c 21.04 ± 1.89 c
Peels polar fraction 3.77 ± 0.16 e 0.43 ± 0.02 hi 0.21 ± 0.01 i 0.19 ± 0.00 i
Juice polar fraction 11.15 ± 3.08 de 2.67 ± 0.39 e 2.27 ± 0.01 g 2.52 ± 0.18 f Lemon
Crude juice 6.41 ± 1.00 de 3.95 ± 0.75 c 2.36 ± 0.11 g 2.18 ± 0.48 fg
Peels volatile fraction 124.52 ± 1.28 b 2.41 ± 0.01 e 27.85 ±0.89 b 24.61 ± 1.61 b
Peels polar fraction 1.72 ± 0.40 e 0.36 ± 0.01 i 0.13 ± 0.01 i 0.10 ± 0.00 i
Juice polar fraction 15.92 ± 1.20 d 3.85 ± 0.41 c 2.79 ± 0.04 fg 6.23 ± 0.21 e Lime
Crude juice 12.47 ± 0.45 de 6.07 ± 0.15 a 4.91 ± 0.07 e 2.89 ± 0.22 f
Peels volatile fraction 95.67 ± 2.21 c 1.09 ± 0.02 g 18.44 ± 0.87 d 17.94 ± 0.43 d
Peels polar fraction 4.99 ± 0.31 de 0.53 ± 0.01 hi 0.26 ± 0.02 i 0.23 ± 0.00 i
Juice polar fraction 5.55 ± 0.16 de 1.69 ± 0.37 f 1.23 ± 0.04 h 1.99 ± 0.51 fg Orange
Crude juice 5.30 ± 0.13 de 3.19 ± 0.04 d 1.12 ± 0.23 h 1.36 ± 0.04 gh

29
Table 4. Antioxidant compounds present in the polar factions obtained from citrus fruits. The results are expressed as mean ± SD (n=9). In each column different letters mean significant differences (p<0.05).
Samples Phenolics
(mg GAE/g extract)
Flavonoids
(mg CE/g extract)
Ascorbic acid
(μg/g extract)
Carotenoids
(μg/g extract)
Reducing sugars
(mg/g extract)
Peels polar fraction 55.88 ± 2.45 d 2.29 ± 0.19 de 822.77 ± 5.65 c 2.18 ± 0.03 b 273.68 ± 20.23 b
Juice polar fraction 8.93 ± 0.16 gh 1.96 ± 0.18 e 519.34 ± 8.65 f 0.22 ± 0.03 f 6.56 ± 0.05 e Grapefruit
Crude juice 9.46 ± 0.17 g 0.32 ± 0.08 gh 97.31 ± 5.49 k 0.20 ± 0.02 f 10.44 ± 0.67 de
Peels polar fraction 87.77 ± 1.42 b 15.96 ± 0.24 a 938.00 ± 1.35 b 1.59 ± 0.04 c 291.26 ± 17.03 b
Juice polar fraction 8.43 ± 0.02 gh 1.43 ± 0.07 f 348.76 ± 3.30 h 0.07 ± 0.00 h 6.88 ± 0.09 e Lemon
Crude juice 11.17 ± 0.05 f 0.22 ± 0.02 h 417.44 ± 10.87 g 0.06 ± 0.02 h 22.43 ± 0.03 de
Peels polar fraction 124.63 ± 0.52 a 13.61 ± 0.64 b 1779.55 ± 77.95 a 1.27 ± 0.18 d 38.34 ± 5.47 cd
Juice polar fraction 7.51 ± 0.06 h 2.36 ± 0.04 d 280.40 ± 1.70 i 0.17 ± 0.01 fg 6.83 ± 0.03 e Lime
Crude juice 9.01 ± 0.09 g 0.43 ± 0.03 gh 190.52 ± 3.82 j 0.08 ± 0.01 gh 23.81 ± 2.79 de
Peels polar fraction 79.75 ± 1.25 c 3.97 ± 0.21 c 766.80 ± 20.20 d 31.57 ± 0.06 a 358.93 ± 61.61 a
Juice polar fraction 13.43 ± 0.10 e 0.56 ± 0.06 gh 693.01 ± 1.08 e 0.26 ± 0.01 f 33.62 ± 2.94 cde Orange
Crude juice 12.41 ± 0.07 ef 0.62 ± 0.09 g 523.89 ± 5.10 f 0.80 ± 0.02 e 63.07 ± 1.86 c

30
Table 5. The most important parameters defined for discrimination between different
fruit components considering antioxidant activity assays (A), bioactive compounds with
all samples (B) and bioactive compounds with juices (C).
Wilks’ Lambda F-remove p-Level Tolerance 1-Tolerance (R2)
A
TBARS inhibition 0.0000 43.113 < 0.001 0.9861 0.0139
β-carotene bleaching 0.0000 1107.9 < 0.001 0.8897 0.1103
Reducing power 0.0000 436.06 < 0.001 0.9983 0.0017
DPPH scavenging 0.0000 6.1685 < 0.001 0.8824 0.1176
B
Carotenoids 0.0000 61064 < 0.001 0.9963 0.0037
Phenolics 0.0000 816.82 < 0.001 0.8877 0.1123
Flavonoids 0.0000 1410.0 < 0.001 0.4815 0.5185
Ascorbic acid 0.0000 701.37 < 0.001 0.4848 0.5152
Reducing sugars 0.0000 139.49 < 0.001 0.9327 0.0673
C
Ascorbic acid 0.0000 547.02 < 0.001 0.0685 0.9315
Reducing sugars 0.0000 114.70 < 0.001 0.2554 0.7446
Phenolics 0.0000 38.229 < 0.001 0.0878 0.9122
β-carotene bleaching 0.0000 77.323 < 0.001 0.8111 0.1889
TBARS inhibition 0.0000 33.591 < 0.001 0.1693 0.8307
Carotenoids 0.0000 27.288 < 0.001 0.7918 0.2082
Reducing power 0.0000 7.6667 < 0.001 0.9203 0.0797
Flavonoids 0.0000 4.3288 < 0.001 0.1334 0.8666