taroborah coal project voids will remain at the completion of the open cut mining stage of the...
TRANSCRIPT

Taroborah Coal Project
Appendix 14a – Final Pit Water Quality
Projections

81a Co l lege S t ree t Ba lma in NSW 2041 Aus t ra l i a T 61 2) 9810 8100 F 61 2) 98105542 E [email protected] W www.geochemistry.com.au
E n v i r o n m e n t a l G e o c h e m i s t r y I n t e r n a t i o n a l P t y L t d A B N 1 2 0 0 3 7 9 3 4 8 6
TO: IMC Mining
ATTENTION: Dave Thomas
DATE: 27 October 2014
SUBJECT: Modelling of Water Quality in Final Voids - Taroborah Coal Project
1. Background Two voids will remain at the completion of the open cut mining stage of the Taroborah Coal Project (Figure 1). At completion of the project the voids will be allowed to fill by natural inflows of ground water and rainfall within the void. Over the long term the water levels in the voids will stabilise at around RL 195 m, and when filled the volumes will be approximately 6.4 Mm3 for the void on the eastern side of the open cut, and 2.1 Mm3 for the western void. Geochemical studies carried out by EGi for the EIS indicated that the majority of overburden and spoil that will be produced during mining of the open cut will be non-acid forming (NAF). However some rock units within the stratigraphy that will be intersected by the open cut are sulphidic and will be potentially acid forming (PAF) and have the capacity to generate acidic rock drainage (ARD) if exposed to atmospheric conditions. In addition to the two coal seams, it is expected that the interburden between the two seams will be PAF, as will floor material below Seam B. The occurrence of PAF material is a potential concern in relation to the quality of water that will collect within the final voids. Monitoring of ground waters across the Project area indicates that ground waters within the Quaternary alluvium, Tertiary gravel, and the Aldebaran sandstone are alkaline, and hence ground water inflows to the voids at closure will serve to neutralise acid that is produced from PAF materials exposed around the final surfaces of the voids. Monitoring of local ground water bores indicates pHs typically around 7 to 8 and alkalinities typically in the range 200 to 500 mg/L. Monitoring also indicates that ground water inflows will be slightly brackish (or saline), predominantly due to elevated concentrations of sodium and chloride. The total dissolved salts (TDS) in ground water will likely average around 400 to 600 mg/L. This memorandum presents the results and findings of hydrogeochemical modelling of the Taroborah open cut voids carried out by EGi to predict the quality of water within the voids through time as water level rises. The modelling was carried out in association with ATC Williams (who provided data on surface water inflows) and also AGE Consultants (who provided data on ground water inflows). To date, modelling of water quality has focused on the larger eastern void. As the western void has essentially the same stratigraphy and will be subject to inflows of the same surface and ground waters, it is expected that the quality of the pit lake that develops in the western void will be comparable to that predicted for the eastern void.

2
E n v i r o n m e n t a l G e o c h e m i s t r y I n t e r n a t i o n a l P t y L t d
Figure 1: Plan of Taroborah open cut at closure 2. Model Software The hydrochemical model for the Taroborah open pit voids was based around Microsoft Excel and the Phreeqc chemical speciation program. The use of Phreeqc means the calculations of pH and void water chemistry were based on fundamental chemical principals. By using thermodynamic principals rather than empirical relationships, it is possible to predict pH and full water chemistry for different scenarios with respect to void dimensions, wall rock types (including NAF and PAF characteristics), runoff chemistries from individual rock types, different inflow regimes for surface and ground waters, and development of water bodies within the voids through time.
The Excel component of the hydrogeochemical model contains data relevant to the void shell (lithology,
NAF/PAF distribution), water balance information, and the chemistries assigned to runoffs from different wall
rock units, and ground water inflows. The Excel component also has embedded macros that produce an input
file that feeds into the Phreeqc computer program which predicts the pH and water quality of the combined pit
water. Phreeqc was developed and released for public use by the US Geological Survey (USGS), and is generally regarded as one of the leading hydrogeochemical programs currently available for simulating chemical reactions and transport processes in natural or contaminated water. Phreeqc has the capability to model the pH and chemical speciation reactions including solubility, redox, ion-exchange, and surface complexation for a
3
E n v i r o n m e n t a l G e o c h e m i s t r y I n t e r n a t i o n a l P t y L t d
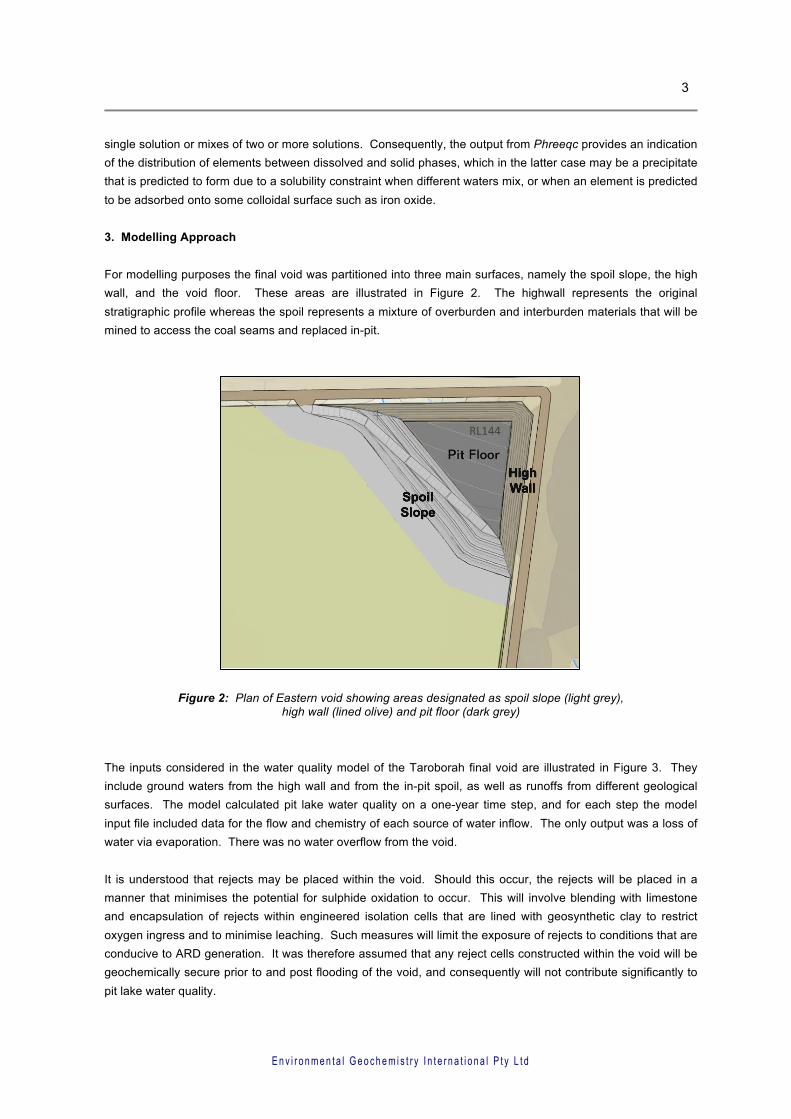
single solution or mixes of two or more solutions. Consequently, the output from Phreeqc provides an indication of the distribution of elements between dissolved and solid phases, which in the latter case may be a precipitate that is predicted to form due to a solubility constraint when different waters mix, or when an element is predicted to be adsorbed onto some colloidal surface such as iron oxide. 3. Modelling Approach For modelling purposes the final void was partitioned into three main surfaces, namely the spoil slope, the high wall, and the void floor. These areas are illustrated in Figure 2. The highwall represents the original stratigraphic profile whereas the spoil represents a mixture of overburden and interburden materials that will be mined to access the coal seams and replaced in-pit.
Figure 2: Plan of Eastern void showing areas designated as spoil slope (light grey), high wall (lined olive) and pit floor (dark grey)
The inputs considered in the water quality model of the Taroborah final void are illustrated in Figure 3. They include ground waters from the high wall and from the in-pit spoil, as well as runoffs from different geological surfaces. The model calculated pit lake water quality on a one-year time step, and for each step the model input file included data for the flow and chemistry of each source of water inflow. The only output was a loss of water via evaporation. There was no water overflow from the void. It is understood that rejects may be placed within the void. Should this occur, the rejects will be placed in a manner that minimises the potential for sulphide oxidation to occur. This will involve blending with limestone and encapsulation of rejects within engineered isolation cells that are lined with geosynthetic clay to restrict oxygen ingress and to minimise leaching. Such measures will limit the exposure of rejects to conditions that are conducive to ARD generation. It was therefore assumed that any reject cells constructed within the void will be geochemically secure prior to and post flooding of the void, and consequently will not contribute significantly to pit lake water quality.

4
E n v i r o n m e n t a l G e o c h e m i s t r y I n t e r n a t i o n a l P t y L t d
Figure 3: Schematic of input/outputs considered in the hydrogeochemical model of the pit lake in the Taroborah final void
4. Void Dimensions The total surface area of the eastern void is 346,505 m2. The spoil slope was assumed to be comprised of a homogenous material whereas the high wall was sub-divided into a number of strata representing the different rock units exposed on the wall at the completion of mining. A schematic of the layers within the high wall is given in Figure 4.
Figure 4: Schematic of high wall stratigraphy (not to scale)
Spoil slope runoff High wall runoff
Rain Evap
!"#$%&'()*+"',-#./''
!"#$%&'()*+"'0.12'()//'
Weathered } ~45m thick
Void Lake Surface
Mixed NAF/PAF-LC } ~20m thick
Seam Roof } ~5m thick
Coal Seam A } ~2m thick
Interburden } ~6m thick
Coal Seam B } ~2m thick
Pit FloorRL147
RL 225
RL 165
RL 195
RL150
RL 185

5
E n v i r o n m e n t a l G e o c h e m i s t r y I n t e r n a t i o n a l P t y L t d
The slope areas of different material surfaces within the Eastern void were provided by IMC and are summarised in Table 1. Plan areas for each material surface were also calculated by multiplying the spoil and high wall slope areas by a factor of 0.66.
Table 1: Surface areas for the Eastern pit void
The lowest point of the floor is at RL 147 m. It was assumed that the entire area of the floor will be exposed during the first year of filling, and thereafter entirely covered by water. The water level in the pit void was allowed to increase with inflows from ground water and surface runoff, based on staged storage capacities provided by IMC which are summarised in Table 2. It is understood from previous hydrologic modelling of the project area that the water level will rise to a maximum of RL 195 m.
Table 2: Volume and surface areas versus RL for the Eastern pit void
Void Surface Slope Area (m2) Plan Area (m2)
Pit Floor 86,274 86,274
Spoil Slope 140,007 92,405
High Wall 120,224 79,348
Total 346,505 258,026
High Wall Strata
HW Weathered 75,857 50,066
HW Mixed 18,435 12,167
HW Seam Roof 11,771 7,769
HW Coal Seam A 1,575 1,040
HW Interburden 10,233 6,754
HW Coal Seam B 2,353 1,553
Relative Water Level A.S.L (m) Volume (m3) Surface Area (m2)
150 365,452 85,154
155 828,847 99,054
160 1,345,494 107,641
165 1,905,613 116,442
170 2,510,241 125,441
175 3,179,744 138,959
180 3,900,173 149,250
185 4,672,628 159,770
190 5,523,845 176,370
195 6,399,712 185,906

6
E n v i r o n m e n t a l G e o c h e m i s t r y I n t e r n a t i o n a l P t y L t d
5. Ground Water and Surface Water Inflows The rates of ground water inflow to the void were based on data provided by AGE Consultants. Rates were staged during filling using 5 m RL increments. Rates of surface runoff were calculated from exposed plan areas of spoil slope or high wall assuming an annual rainfall of 610 mm and an average runoff factor for the year of 0.3. The surface inflows based on this approach were comparable to estimates provided by ATC Williams using more sophisticated hydrologic modelling methods. Evaporation loss from the pit lake surface was based on an annual pan evaporation rate of 2100 mm and a pan coefficient of 1.3 (i.e. actual evaporation from pit lake surface of approximately 1600 mm per year). Table 3 provides a schematic of inflows that contribute to pit water volume and quality as the void fills. The rates of inflow of ground water progressively decrease with increasing RL, as do the inflows of surface waters running off the spoil slope and the high wall as the void walls are progressively inundated. Conversely, the rate of inflow of rain directly into the pit lake, and the loss of pit lake water via evaporation, increase directly with increasing surface area of the lake. It should be noted that only wall rock above the water surface contributes to, or has any effect on, pit water chemistry (i.e. there is no chemical diffusion into or out of wall rock or the pit floor).
Table 3: Inflows contributing to pit lake volume and chemistry with increasing water level
The actual staged inflow rates for each input source are given in Table 4.
Runoff - HW Mixed
Inflow/Ouflow Source Relative Water Level A.S.L (m)150 155 160 165 170 175 180 185 190 195
Rain into Pit Lake
Runoff - Spoil Slope
Runoff - HW Weathered
Groundwater - High Wall
Runoff - HW Seam Roof
Runoff - HW Coal Seam A
Runoff - HW Interburden
Runoff - HW Coal Seam B
Runoff - Pit Floor
Groundwater - Spoil
7
E n v i r o n m e n t a l G e o c h e m i s t r y I n t e r n a t i o n a l P t y L t d
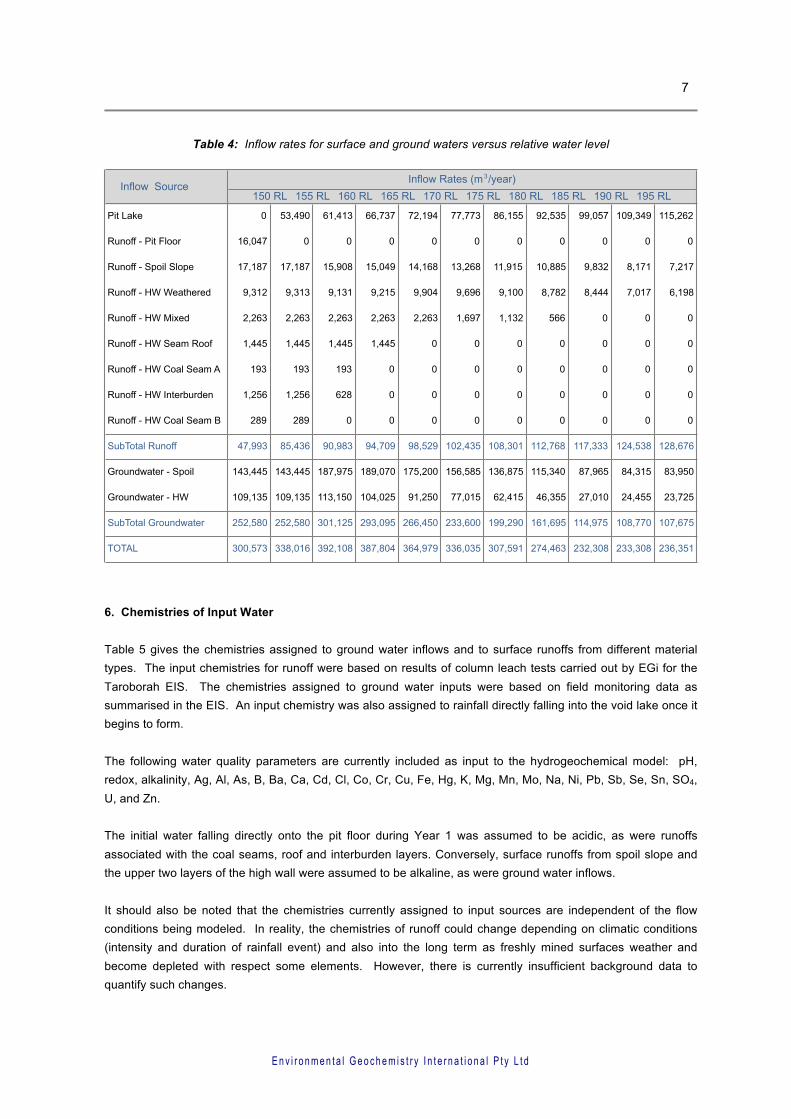
Table 4: Inflow rates for surface and ground waters versus relative water level
6. Chemistries of Input Water Table 5 gives the chemistries assigned to ground water inflows and to surface runoffs from different material types. The input chemistries for runoff were based on results of column leach tests carried out by EGi for the Taroborah EIS. The chemistries assigned to ground water inputs were based on field monitoring data as summarised in the EIS. An input chemistry was also assigned to rainfall directly falling into the void lake once it begins to form. The following water quality parameters are currently included as input to the hydrogeochemical model: pH, redox, alkalinity, Ag, Al, As, B, Ba, Ca, Cd, Cl, Co, Cr, Cu, Fe, Hg, K, Mg, Mn, Mo, Na, Ni, Pb, Sb, Se, Sn, SO4, U, and Zn. The initial water falling directly onto the pit floor during Year 1 was assumed to be acidic, as were runoffs associated with the coal seams, roof and interburden layers. Conversely, surface runoffs from spoil slope and the upper two layers of the high wall were assumed to be alkaline, as were ground water inflows. It should also be noted that the chemistries currently assigned to input sources are independent of the flow conditions being modeled. In reality, the chemistries of runoff could change depending on climatic conditions (intensity and duration of rainfall event) and also into the long term as freshly mined surfaces weather and become depleted with respect some elements. However, there is currently insufficient background data to quantify such changes.
Pit Lake
Runoff - Pit Floor
Runoff - Spoil Slope
Runoff - HW Weathered
Runoff - HW Mixed
Runoff - HW Seam Roof
Runoff - HW Coal Seam A
Runoff - HW Interburden
Runoff - HW Coal Seam B
SubTotal Runoff
Groundwater - Spoil
Groundwater - HW
SubTotal Groundwater
TOTAL
190 RL 195 RLInflow Rates (m3/year)
Inflow Source150 RL 155 RL 160 RL 165 RL 170 RL 175 RL 180 RL 185 RL
109,349
16,047 0 0 0 0 0 0 0 0 0
0 53,490 61,413 66,737 72,194 77,773 86,155 92,535 99,057
8,171
9,312 9,313 9,131 9,215 9,904 9,696 9,100 8,782 8,444 7,017
17,187 17,187 15,908 15,049 14,168 13,268 11,915 10,885 9,832
0
1,445 1,445 1,445 1,445 0 0 0 0 0 0
2,263 2,263 2,263 2,263 2,263 1,697 1,132 566 0
0
1,256 1,256 628 0 0 0 0 0 0 0
193 193 193 0 0 0 0 0 0
0
47,993 85,436 90,983 94,709 98,529 102,435 108,301 112,768
289 289 0 0 0 0 0 0 0
115,340
252,580 252,580 301,125 293,095 266,450 233,600 199,290 161,695
115,262
0
7,217
6,198
0
0
0
0
0
128,676
83,950
109,135 109,135 113,150 104,025 91,250 77,015 62,415 46,355 27,010 24,455 23,725
87,965 84,315
117,333 124,538
143,445 143,445 187,975 189,070 175,200 156,585 136,875
114,975 108,770 107,675
300,573 338,016 392,108 387,804 364,979 336,035 307,591 274,463 232,308 233,308 236,351

8
E n v i r o n m e n t a l G e o c h e m i s t r y I n t e r n a t i o n a l P t y L t d
Table 5: Chemistries of input waters included in the hydrogeochemical model (mg/L except pH)
Spoil High Wall Spoil Slope
HW Weathered
HW Mixed
HW Seam Roof
HW Coal Seam A
HW Interburden
HW Coal Seam B Pit Floor
pH 8.4 7.7 7.4 8.2 7.4 2.3 2.2 2.3 2.2 2.5 6.5
Ag 0.001 0.001 0.001 0.001 0.001 0.001 0.001 0.001 0.001 0.001 0
Al 0.01 0.01 2 0.3 2 337 1,000 135 1,000 54 0
As 0.003 0.003 0.04 0.1 0.0 2 3 0.3 3 0.09 0
B 0.07 0.07 0.08 0.2 0.08 0.05 0.1 0.05 0.1 0.05 0
Ba 0.18 0.18 0.03 0.02 0.03 0.005 0.01 0.01 0.01 0.01 0
Ca 71 53 314 40 314 102 100 66 100 71 0
Cd 0.0001 0.0001 0.006 0.0002 0.006 0.04 0.08 0.02 0.08 0.02 0
Cl 534 197 22 180 22 6.7 500 7 500 3 0
Co 0.002 0.002 0.2 0.002 0.2 2 4 1 4 2 0
Cr 0.001 0.001 0.002 0.001 0.002 0.5 1 0.2 1 0.08 0
Cu 0.001 0.001 0.03 0.01 0.03 2.0 4 1.11 4 1 0
Fe 1 1 7 0.1 7 2154 3000 648 3,000 190 0
Hg 0.0001 0.0001 0.0001 0.0001 0.0001 0.0001 0.0001 0.0001 0.0001 0.0001 0
K 6 6 26 3 26 1 5 4 5 3 0
Mg 95 55 492 61 492 100 800 77 800 168 0.1
Mn 0.03 0.03 20 0.03 20 5 20 6 20 28 0
Mo 0.005 0.005 0.001 0.009 0.001 0.05 0.1 0.008 0.1 0.001 0
Na 263 160 27 144 27 3 250 5 250 3 0
Ni 0.002 0.002 0.5 0.01 0.5 5 10 2 10 3 0
Pb 0.001 0.001 0.002 0.001 0.002 0.002 0.003 0.01 0.003 0.01 0
Sb 0.001 0.001 0.001 0.001 0.001 0.001 0.002 0.001 0.002 0.001 0
Se 0.001 0.001 0.09 0.02 0.09 0.2 0.5 0.09 0.5 0.03 0
Sn 0.001 0.001 0.001 0.003 0.001 0.007 0.01 0.004 0.01 0.004 0
SO4 150 100 2,871 243 2,871 8,618 15,000 3,202 15,000 1,922 0.1
U 0.001 0.001 0.003 0.001 0.003 1 1 0.2 1 0.09 0
Zn 0.005 0.005 0.8 0.008 1 12 24 12 24 10 0
Alkalinity 251 381 50 120 50 - - - - - 1
Groundwaters Surface RunoffParameter Rain to
Lake
9
E n v i r o n m e n t a l G e o c h e m i s t r y I n t e r n a t i o n a l P t y L t d
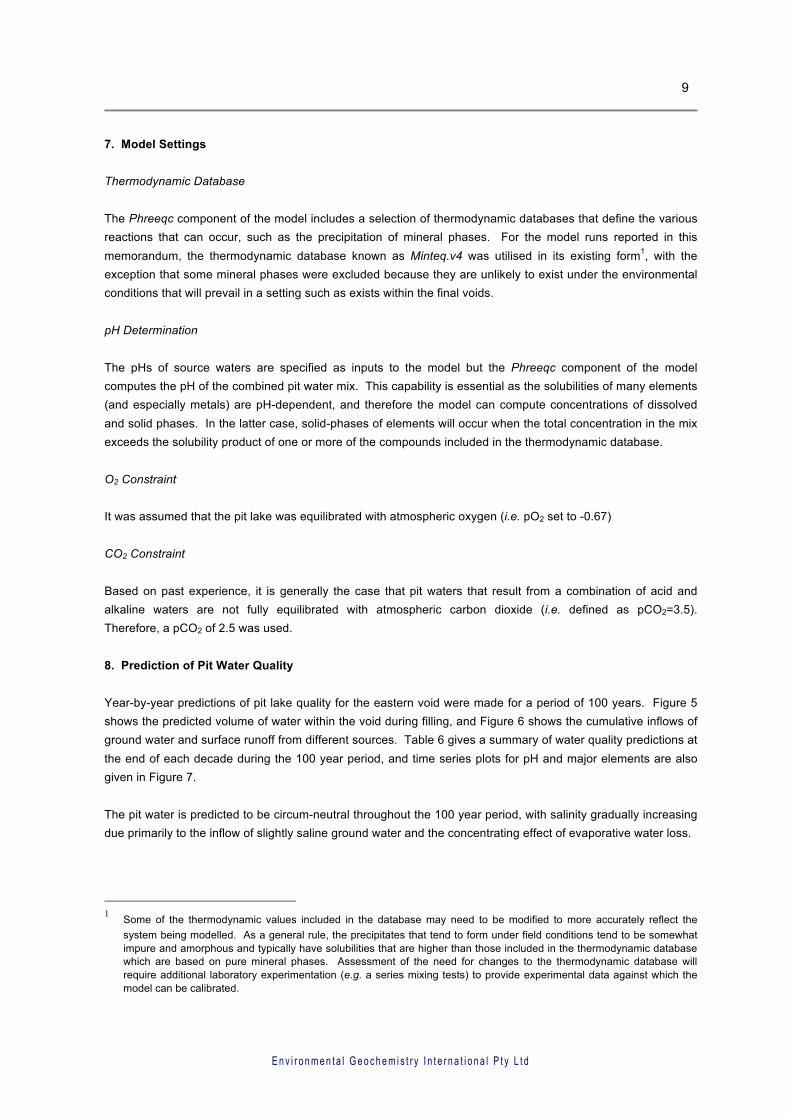
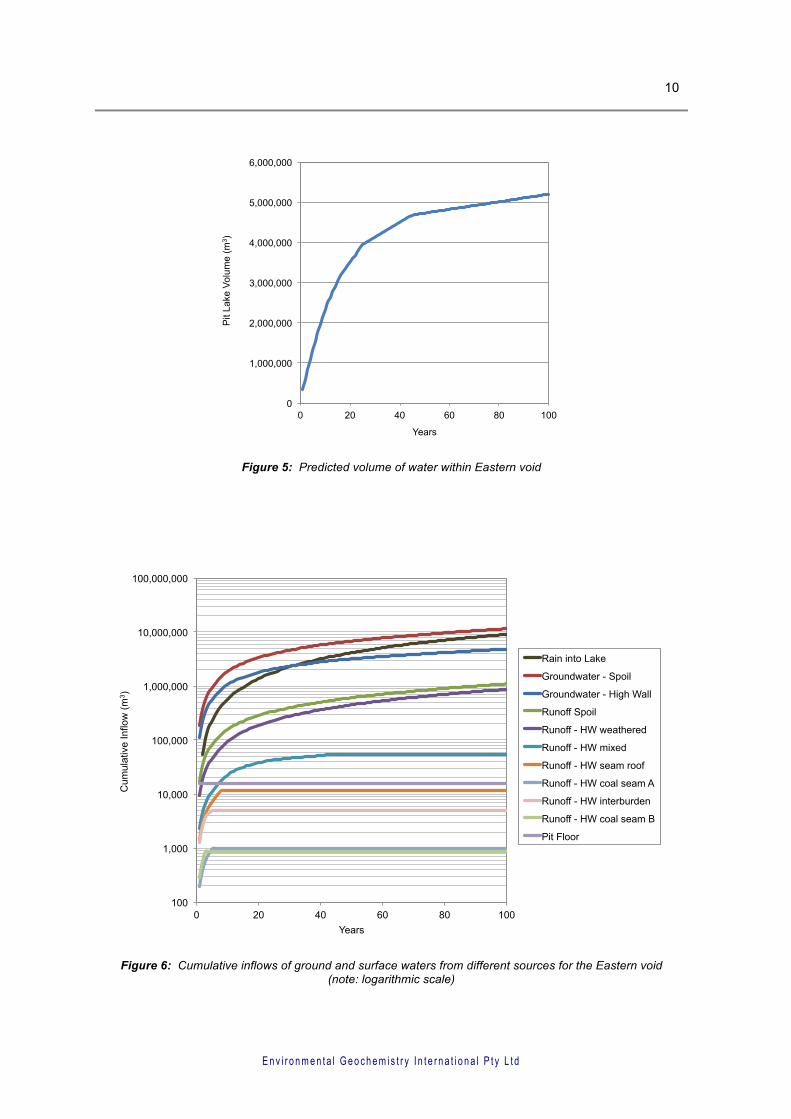
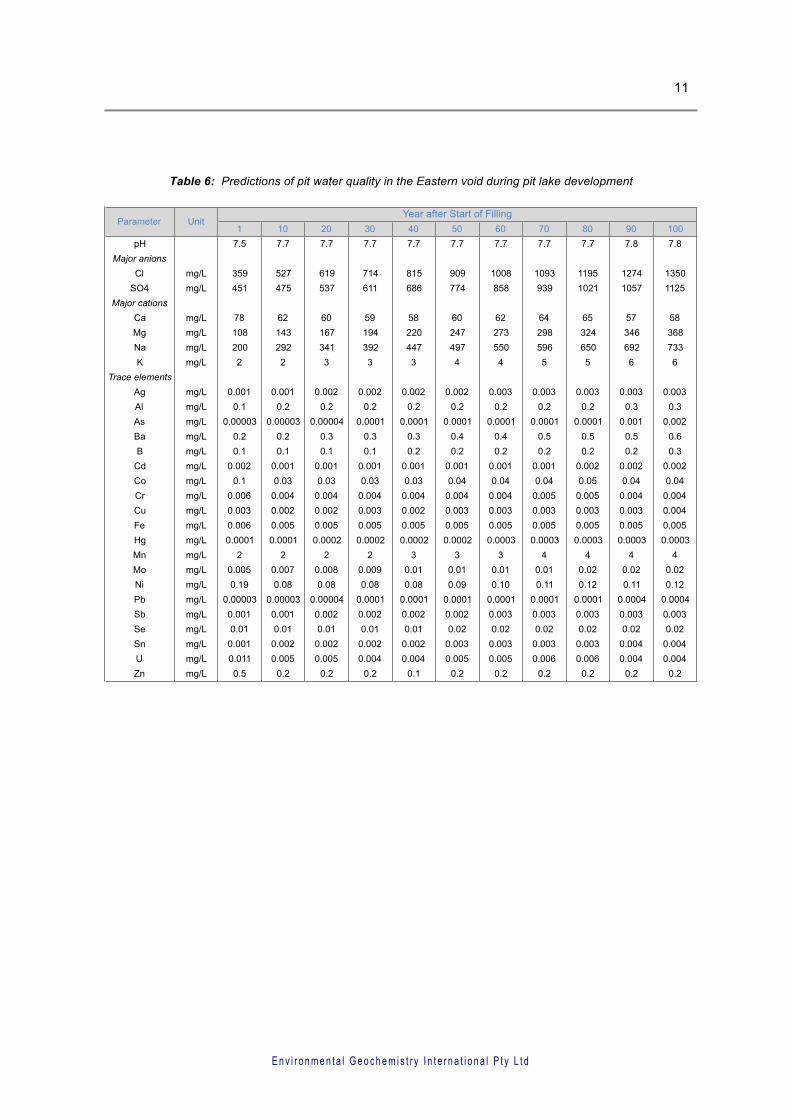
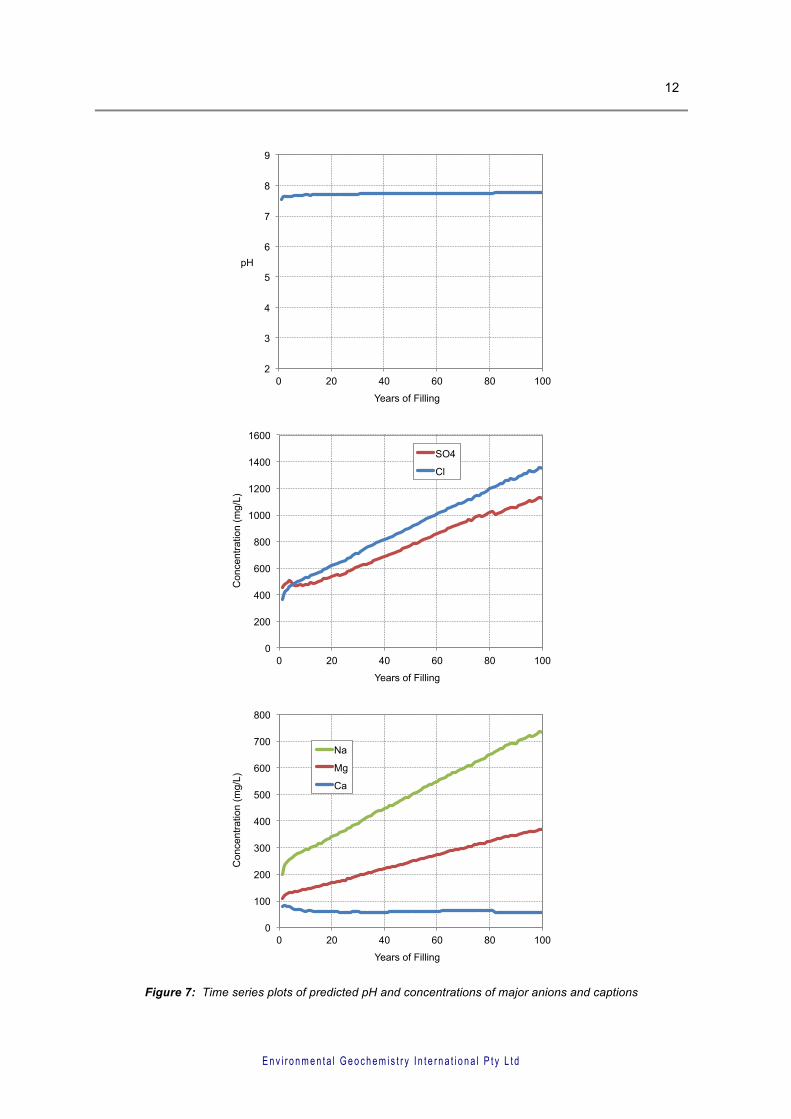
7. Model Settings Thermodynamic Database The Phreeqc component of the model includes a selection of thermodynamic databases that define the various reactions that can occur, such as the precipitation of mineral phases. For the model runs reported in this memorandum, the thermodynamic database known as Minteq.v4 was utilised in its existing form1, with the exception that some mineral phases were excluded because they are unlikely to exist under the environmental conditions that will prevail in a setting such as exists within the final voids. pH Determination The pHs of source waters are specified as inputs to the model but the Phreeqc component of the model computes the pH of the combined pit water mix. This capability is essential as the solubilities of many elements (and especially metals) are pH-dependent, and therefore the model can compute concentrations of dissolved and solid phases. In the latter case, solid-phases of elements will occur when the total concentration in the mix exceeds the solubility product of one or more of the compounds included in the thermodynamic database. O2 Constraint It was assumed that the pit lake was equilibrated with atmospheric oxygen (i.e. pO2 set to -0.67) CO2 Constraint Based on past experience, it is generally the case that pit waters that result from a combination of acid and alkaline waters are not fully equilibrated with atmospheric carbon dioxide (i.e. defined as pCO2=3.5). Therefore, a pCO2 of 2.5 was used. 8. Prediction of Pit Water Quality Year-by-year predictions of pit lake quality for the eastern void were made for a period of 100 years. Figure 5 shows the predicted volume of water within the void during filling, and Figure 6 shows the cumulative inflows of ground water and surface runoff from different sources. Table 6 gives a summary of water quality predictions at the end of each decade during the 100 year period, and time series plots for pH and major elements are also given in Figure 7. The pit water is predicted to be circum-neutral throughout the 100 year period, with salinity gradually increasing due primarily to the inflow of slightly saline ground water and the concentrating effect of evaporative water loss.
1 Some of the thermodynamic values included in the database may need to be modified to more accurately reflect the
system being modelled. As a general rule, the precipitates that tend to form under field conditions tend to be somewhat impure and amorphous and typically have solubilities that are higher than those included in the thermodynamic database which are based on pure mineral phases. Assessment of the need for changes to the thermodynamic database will require additional laboratory experimentation (e.g. a series mixing tests) to provide experimental data against which the model can be calibrated.
10
E n v i r o n m e n t a l G e o c h e m i s t r y I n t e r n a t i o n a l P t y L t d
Figure 5: Predicted volume of water within Eastern void
Figure 6: Cumulative inflows of ground and surface waters from different sources for the Eastern void (note: logarithmic scale)
0
1,000,000
2,000,000
3,000,000
4,000,000
5,000,000
6,000,000
0 20 40 60 80 100
Pit
Lake
Vol
ume
(m3 )
Years
100
1,000
10,000
100,000
1,000,000
10,000,000
100,000,000
0 20 40 60 80 100
Cum
ulat
ive
Inflo
w (m
3 )
Years
Rain into Lake
Groundwater - Spoil
Groundwater - High Wall
Runoff Spoil
Runoff - HW weathered
Runoff - HW mixed
Runoff - HW seam roof
Runoff - HW coal seam A
Runoff - HW interburden
Runoff - HW coal seam B
Pit Floor
11
E n v i r o n m e n t a l G e o c h e m i s t r y I n t e r n a t i o n a l P t y L t d
Table 6: Predictions of pit water quality in the Eastern void during pit lake development
1 10 20 30 40 50 60 70 80 90 100pH 7.5 7.7 7.7 7.7 7.7 7.7 7.7 7.7 7.7 7.8 7.8
Major anions
Cl mg/L 359 527 619 714 815 909 1008 1093 1195 1274 1350SO4 mg/L 451 475 537 611 686 774 858 939 1021 1057 1125
Major cations
Ca mg/L 78 62 60 59 58 60 62 64 65 57 58Mg mg/L 108 143 167 194 220 247 273 298 324 346 368Na mg/L 200 292 341 392 447 497 550 596 650 692 733K mg/L 2 2 3 3 3 4 4 5 5 6 6
Trace elements
Ag mg/L 0.001 0.001 0.002 0.002 0.002 0.002 0.003 0.003 0.003 0.003 0.003Al mg/L 0.1 0.2 0.2 0.2 0.2 0.2 0.2 0.2 0.2 0.3 0.3As mg/L 0.00003 0.00003 0.00004 0.0001 0.0001 0.0001 0.0001 0.0001 0.0001 0.001 0.002Ba mg/L 0.2 0.2 0.3 0.3 0.3 0.4 0.4 0.5 0.5 0.5 0.6B mg/L 0.1 0.1 0.1 0.1 0.2 0.2 0.2 0.2 0.2 0.2 0.3
Cd mg/L 0.002 0.001 0.001 0.001 0.001 0.001 0.001 0.001 0.002 0.002 0.002Co mg/L 0.1 0.03 0.03 0.03 0.03 0.04 0.04 0.04 0.05 0.04 0.04Cr mg/L 0.006 0.004 0.004 0.004 0.004 0.004 0.004 0.005 0.005 0.004 0.004Cu mg/L 0.003 0.002 0.002 0.003 0.002 0.003 0.003 0.003 0.003 0.003 0.004Fe mg/L 0.006 0.005 0.005 0.005 0.005 0.005 0.005 0.005 0.005 0.005 0.005Hg mg/L 0.0001 0.0001 0.0002 0.0002 0.0002 0.0002 0.0003 0.0003 0.0003 0.0003 0.0003Mn mg/L 2 2 2 2 3 3 3 4 4 4 4Mo mg/L 0.005 0.007 0.008 0.009 0.01 0.01 0.01 0.01 0.02 0.02 0.02Ni mg/L 0.19 0.08 0.08 0.08 0.08 0.09 0.10 0.11 0.12 0.11 0.12Pb mg/L 0.00003 0.00003 0.00004 0.0001 0.0001 0.0001 0.0001 0.0001 0.0001 0.0004 0.0004Sb mg/L 0.001 0.001 0.002 0.002 0.002 0.002 0.003 0.003 0.003 0.003 0.003Se mg/L 0.01 0.01 0.01 0.01 0.01 0.02 0.02 0.02 0.02 0.02 0.02Sn mg/L 0.001 0.002 0.002 0.002 0.002 0.003 0.003 0.003 0.003 0.004 0.004U mg/L 0.011 0.005 0.005 0.004 0.004 0.005 0.005 0.006 0.006 0.004 0.004Zn mg/L 0.5 0.2 0.2 0.2 0.1 0.2 0.2 0.2 0.2 0.2 0.2
Year after Start of FillingParameter Unit
12
E n v i r o n m e n t a l G e o c h e m i s t r y I n t e r n a t i o n a l P t y L t d
Figure 7: Time series plots of predicted pH and concentrations of major anions and captions
2
3
4
5
6
7
8
9
0 20 40 60 80 100
pH
Years of Filling
0
200
400
600
800
1000
1200
1400
1600
0 20 40 60 80 100
Con
cent
ratio
n (m
g/L)
Years of Filling
SO4
Cl
0
100
200
300
400
500
600
700
800
0 20 40 60 80 100
Con
cent
ratio
n (m
g/L)
Years of Filling
Na
Mg
Ca

13
E n v i r o n m e n t a l G e o c h e m i s t r y I n t e r n a t i o n a l P t y L t d
9. Sensitivity of Pit Water pH to Runoff from PAF Strata The first few years will be of greatest concern in relation to ARD as this is when PAF floor rock and high wall strata will be exposed. Based on current assumptions, the model predicts that at the end of the first year there will be sufficient inflow of alkaline ground water and alkaline runoff from the spoil slope and weathered portion of the high wall to negate the acidity of surface runoff from PAF rock exposed around the base of the void. The model predicts that in Year 1, the inflows from PAF units represents less than 6% of total inflow, and in Years 2 and 3 when the pit floor is fully submerged the percentage of inflows from PAF units decreases to less than 1%. From Year 9 onward all PAF units are fully submerged. In the event that surface runoff during the first few years is higher than currently assumed relative to the inflow of ground water inflow, then the pH of the developing pit lake could initially be lower than the base case shown in Figure 7. Figure 8 shows the effect of increasing the percentage of total inflow from PAF strata runoff on the pH of pit water for Year 1. The pH under the base case is marked as Point A in Figure 8. If the relative contribution of runoff from PAF strata was double in comparison to the base case then pit water at the end of the first year would be approximately pH 5 (Point B). At thee-times higher the pH would be less than 4 (Point C).
Figure 8: Effect of the relative percentage of inflow from PAF strata on the predicted pH of pit water in Year 1.
However, it can be assumed that floor rock and PAF strata in the high wall will only contribute acidic runoff when they occur above the water level in the pit. This is based on the premise that a water cover, whilst not always preventing sulphide oxidation, will invariably decrease the availability of oxygen to submerged material to a level where the rates of sulphide oxidation and acid generation are unlikely to be inconsequential to the surrounding environment. Therefore, even if the relative contribution of surface runoff from PAF strata is much higher than expected during the first few years, it is expected that the amount of acid generation within the void
2
3
4
5
6
7
8
0% 5% 10% 15% 20%
Pre
dict
ed p
H o
f pit
wat
er a
t end
of Y
ear 1
Percentage of total inflow from PAF strata in Year 1

14
E n v i r o n m e n t a l G e o c h e m i s t r y I n t e r n a t i o n a l P t y L t d
will be markedly lower once the void floor is fully inundated, and will effectively cease once the water level rises above the seam roof (around Year 7). The pH of the pit lake will then trend higher due to dilution and neutralisation by ongoing inflows of alkaline ground water and surface runoff from NAF spoil and the weathered portion of the high wall. Figure 9 shows the predicted change in pit water pH for a scenario where the proportion of inflow from surface runoff is about three times higher than for the base case. The pH of the pit water is predicted to be moderately acidic for the first six years, then increase markedly in Year 7, and remain circum-neutral thereafter.
Figure 8: Effect of the relative percentage of inflow from PAF strata on the predicted pH of pit water in Year 1.
10. Summary This memorandum provides predictions of pit lake quality for the final voids within the proposed Taroborah open cut. The predictions were based on a hydrogeochemical model developed for the eastern void that combined a mass-balance component for water and chemical inflows from a number of ground water and surface runoff sources, and a chemical speciation component (Phreeqc) for computation of the pH and chemical composition of the pit lake through time. The pit floor and lower strata of the high wall (roof, coal seams and interburden) will comprise PAF materials and have the potential to generate ARD. However, the model predicts that inflows of alkaline ground water, together with alkaline runoff from in-pit spoil and upper weathered strata of the high wall, should be sufficient to neutralise acidity produced by the PAF rock units. Based on the assumptions made in the model, pit water is predicted to be circum-neutral throughout the 100 year period modelled. It is also predicted that salinity will gradually increase due to the inflow of slightly saline ground water and the concentrating effect of evaporative water loss.
2
3
4
5
6
7
8
0 1 2 3 4 5 6 7 8 9 10 11
Pre
dict
ed p
H o
f pit
wat
er
Year since start of filling