task force i meeting cross border electricity trade · pdf filetask force i meeting cross...
TRANSCRIPT

Task Force I Meeting
Cross Border Electricity Trade
24th – 25th July, 2013 Dhaka
Department of Hydropower & Power Systems MoEA, RGoB

Hydropower Potential & Development Status
Initiatives undertaken to Accelerate Hydropower Development
Policies/Acts
10,000 MW by 2020 & Power Evacuation Arrangements
Prevailing Power Trading Arrangement with India
Power Trading Opportunities
Opportunities for Cross Border Electricity Trade
Presentation Outline

Area – 38,394 sq km Population ~ 650,000 Altitude ~100 to +7500 masl

4
Energy Sector Structure
BPC CHP, THP, KHP &
Basochhu UNDER
CONSTRUCTION
DHI
PHPA-I & II
MHPA DGPC
DHPC (SPV)
Ministry
of
Finance
Other
Shareholders
BEA
Power
sector
regulatory
functions
11/7/2013
DRE
Renewable
Energy
DHMS
Hdyromet
services
DOT
Fossil
Fuels
DHPS
Hydro &
Trans.
Ministry of Economic Affairs
JV Projects CPSUs

The steep and rugged Himalayan mountains and fast running rivers promise huge hydropower potential 30,000 MW potential 23,760 MW (76 sites of >10 MW)
techno-economically viable for development
Hydropower Potential

Sl.No. River-basins Area
(km2)
Schemes Potential
(MW)
Energy
(GWh)
1 Amochhu (Basin I) 2,400 6 2,060 9,656
2 Wangchhu (Basin I) 4,689 10 2,740 11,139
3 Punatsangchhu (Basin II) 10,355 19 8,099 25,495
4 Mangdechhu/Manas-West (Basin III) 7,392 17 3,889 18,322
5 Drangmechhu/Manas-East (Basin III) 9,207 20 6,692 33,422
6 Jaldhaka, Mau, Nyeraamari, Dhansiri 2,750 4 280 1,213
7 Others 1,601
Total 38,394 76 23,760 99,247
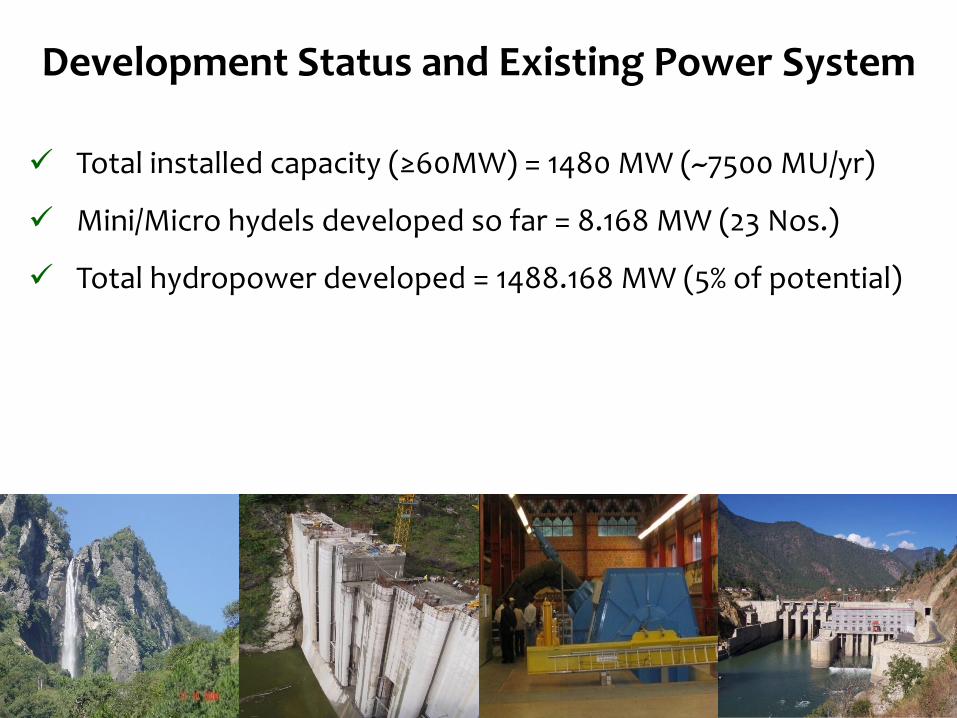
Total installed capacity (≥60MW) = 1480 MW (~7500 MU/yr)
Mini/Micro hydels developed so far = 8.168 MW (23 Nos.)
Total hydropower developed = 1488.168 MW (5% of potential)
7
Development Status and Existing Power System

DEVELOPMENT MODE
8
Sl. #
Power Plant COD Bilateral Assistance
Financing Mode
1 Chukhha ( 336MW)
1986-88 Govt. of India 60% Grant & 40% Loan at 5% interest rate
2 Kurichhu (60MW)
2001-02 Govt. of India 60% Grant & 40% Loan at 10.75% interest rate
3 Basochhu Upper Stage (24MW)
2001 Austrian Govt. 38% Grant & 49% interest free Loan and rest by RGoB
4 Basochhu Lower Stage(40MW)
2005 Austrian Govt.
Full Loan at 2.786% interest rate
5 Tala( 1,020MW) 2006-07 Govt. of India 60% Grant and 40% Loan at 9% interest rate
6 HV Transmission Lines & associated Substations
Govt. of India Constructed with grant financing and along with HPPs

INITIATIVES UNDERTAKEN TO ACCELERATE HYDROPOWER DEVELOPMENT
9
Updation of PSMP in 2002-2004 to identify and prioritize hydropower projects.
Umbrella Agreement between RGoB and GoI (2006) ~ Target of 5,000MW by 2020 and further development of HPP and trade in electricity to be through public and private sector participation.
Newly elected democratic Govt. enhanced the HPP development target to 10,000 MW by 2020 in 2008.
Visit of Indian Prime Minister in May 2008 and commitment of full assistance of GoI to achieve the 10,000 MW by 2020.
Protocol to 2006 Umbrella Agreement signed in 2009 to incorporate new target and mechanism to fast track implementation of 10,000 MW development plan.
Identification of projects and DPR preparation/updation initiated.
Preparation of National Transmission Grid Master Plan Study completed (2010-12).
Bhutan Sustainable Hydropower Development Policy to promote HPP development through public/private sector participation initiated in 2007 and approved in 2008.

SALIENT FEATURES OF SUSTAINABLE HYDROPOWER DEVELOPMENT POLICY
10
Investment model and period – BOOT & 30 years ( Above 25 MW HEPs)
Project Ownership – Public-Public, Public-Private, IPP, Strategic Partnership
Bidding based on Upfront Premium (fixed) and Royalty Energy (min 12% for 12 yrs and 18% thereafter)
Certified Emission Reduction (CER) or any other credits will be the property of the Project Proponents.
Social consideration –
Land acquisition as per Land Act (land compensation in cash/substitution)
10,000 Units per acre per year (Perpetual)
1% of project cost for R&R
Basic infrastructure as part of project (local area development)
Employment (1 member of PAFs)
SALIENT FEATURES OF ALTERNATIVE RENEWABLE ENERGY POLICY
11
Investment model and period – BOOT & 30 years(Hydro- 25 MW and below ) – BOO & 20-25 yrs (Non-Hydro)
Project Ownership – Pvt. Sector including FDI. ( FDI not permitted in Mini/ Micro hydropower projects(upto 1 MW).
For export oriented projects, bidding based on Royalty Energy.
All RE projects shall be encouraged to avail benefits from CDM or any future international carbon market mechanisms to reduce GHG emissions.
Social consideration –
Land acquisition as per Land Act. (land compensation in cash/substitution)
Note: Energy Efficiency Policy being drafted

ELECTRICITY ACT 2001
12
Section 22.1 ( vi) – Trading is covered as a distinct license activity
Section 11.1 (b) – Tariff setting including tariff for generation not regulated by PPA
BEA not mandated to regulate tariff for power export/import through power exchange but if power procured through exchange is to be sold to the internal customers by the Licensees, BEA will required to regulate the prices as per Section 11.1(b).
** It is observed that transaction procedure of Power Exchange is regulated by CERC , hence if power
exchange materializes, what will be roles and responsibilities of regulators of individual country relating to price determination and approval of power sold through the exchange ?
The Act does not mandate BEA to look at dispute resolution of cross border power trade. Regulatory framework/Agreement required among regulators, Forums like SAFIR etc.

ELECTRICITY ACT 2001 (CONTD.)
13
Though Section 11.2(ii) of the Act requires the BEA to encourage competition in electricity generation, transmission and supply. The Act provides for a regulated generation, transmission, distribution and supply business scenario, therefore deregulation and introduction of completion in areas of generation might require a competition policy in place first.

TOTAL: 11,560
MW 14
Inter-Governmental Projects Joint- Venture Projects
Project Name: Puna-I Puna-II
Mangde chhu
Sankosh
Amochhu
Kuri-Gongri
Chamkhar chhu-I
Bunakha
Wang chhu
Kholong
chhu
Installed Capacity
(MW) 1,200 1,020 720 2,560 540 2,640 770 180 570 600
90% dependable
year generation
(MU)
5700 4350 2924 6216 1835 10056 3249 1651 2526 2599
Project Cost (in
millions): 94,000 54,000 28,963 114,719 43,778 128,000 146,799 29,963 46,368 33,049
Project Start Date: 2008 2010 2010 2013 2013 2014 2013 2013 2013 2013
Year of
Commissioning: 2016 2017 2018 2020 2021 2023 2022 2021 2021 2021

15

7-Nov-13 16
NATIONAL TRANSMISSION GRID MASTER PLAN 2020

POWER EXPORT ARRANGEMENT WITH INDIA FOR EXISTING HPPS
17
Long term PPA between designated agencies of two Govts. (DHPS and PTC).
Duration of PPA: CHP – 15 years w.e.f. 2002, THP – 35 years w.e.f. 2006, KHP – 25 years w.e.f. 2002 and DHPC – 25 years
Terms & conditions of the PPA generally in accordance with agreed principles of the Inter-Governmental Agreement .
• RGoB to export only surplus power after meeting its internal demand and GoI agreed to buy all surplus power from the project.
• Export tariff mutually determined by two Govts.
• To ensure predictability, the export tariff is reviewed by two Govts.

EXPORT TARIFF OF HPPS
18
Sl. # Power Plants/Project
Export Tariff Remarks
1 CHP (336 MW, 1865 MU/yr)
Nu. 2.0/kWh (USC 4.45/kWh)
Reviewed every four years based on parameters such as increase in O&M costs, average % increase in cost of generation in eastern-north-eastern part of India.
2 THP (1020 MW, 4865 MU/yr)
Nu. 1.98/kWh (USC 4.0/kWh) - Increased by 10% every 5 years till
the loan is fully repaid and thereafter 5% every 5 years.
- Suitable adjustment in tariff in case of any unforeseen event requiring excessive expenditure not covered by insurance.
3 KHP (60 MW, 400 MU/yr)
Nu. 1.98/kWh (USC 4.0/kWh)
4 DHPC (126 MW, 500 MU/yr)
Nu. 2.4/kWh (USC 5.33/kWh)
Increased by 2% every year on a compounded basis.

7-Nov-13 19
0
1000
2000
3000
4000
5000
6000
7000
8000
Electricity Export to India
Annual Gross Generation(GWh)
Year
GW
h
About 75% of electricity generated is exported to India

● Available power trading volume from Bhutan will be dependent on royalties and short term power allocations available to the country
● Two scenarios determine the volume of power available for trade:
– 12% power to be given to Bhutan, as royalty over the project life
– 12% royalty PLUS 30% short term power allocation new capacities
0.0
150.0
300.0
450.0
600.0
Apr May
Jun Jul Aug Sep Oct Nov Dec Jan Feb Mar
2017-18 2018-19 2019 - 20
2020-21 2021-22
Million U
nits
0.0
400.0
800.0
1200.0
1600.0
2000.0
Ap
r
May
Ju
n
Ju
l
Au
g
Sep
Oct
No
v
Dec
Jan
Feb
Mar
Million U
nits
Project Estimated Generation
In MUs
Scenario 1 12% royalty
In MUs
Scenario 2 12% royalty + 30% ST Power
In MUs
Punatsangchhu-I 5,671 612 1,960
Punatsangchhu-II 4,357 471 1,506
Mangedechu 2,924 316 1,010
Sankosh 6,267 677 2,166
Amochhu 1,835 198 634
Kuri Gongri 10,056 1,086 3,475
Chamkarchhu-I 3,253 351 1,124
Bunakha 1,669 180 577
Wangchhu 2,526 273 873
Kholongchu 2,593 280 896
Total 41,151 4,444 14,222
Power Trading Volume available in Bhutan Power Trading Volume available in Bhutan

7-Nov-13 21
● Most North Indian states historically have large peak and energy deficits
● The following depicts the energy deficit (in Million Units) in Uttar Pradesh, Haryana, Delhi and Rajasthan:
2010-11 Demand Supply Deficit
Uttar Pradesh 76,292 64,846 11,446
Haryana 34,552 32,626 1,926
Delhi 25,625 25,559 66
Rajasthan 45,261 44,836 425
Total 181,730 167,867 13,863
● The four states together accounted for ~14,000 MUs of energy deficit for 2010-11.
● Bhutan’s available surplus volume from upcoming projects, even under Scenario II, i.e. 12% royalty plus 30% ST power, amounting to 15,555 units, can be almost entirely utilized by the North Indian states, being delivered at most competitive transmission and wheeling cost.
Collective deficit from four to five major States in the North of India maybe sufficient to absorb the available power from Bhutan from upcoming generation projects in plan 2020.
Demand and Supply in Select North Indian States
April - July 2012 Demand Supply Deficit
Uttar Pradesh 31,739 27,207 4,532
Haryana 14,821 13,400 1,421
Delhi 10,630 10,545 85
Rajasthan 17,727 16,682 1,045
Total 74,917 67,834 7,083
Demand and Supply in Select North Indian States

7-Nov-13 22
• The weighted average price of electricity transacted through trading licensees and power exchange has increased
three times during the period i.e. from Rs.2.32/kWh in 2004-05 to Rs.7.31/kWh in 2008-09 but is witnessing a
drop since 2009-10.
• A peak was observed in FY2009 on account of elections, when states scrambles to purchase RTC power without any
black-out.
• The average price of electricity transacted through IEX and PXI was Rs.3.47/kWh and Rs.3.64/kWh respectively in
2011-12
0
2
4
6
8
FY2005 FY2006 FY2007 FY2008 FY2009 FY2010 FY2011 FY2012
2.32
3.23
4.51 4.52
7.31
5.28
4.46 3.99
Pric
es in
Rs./
kw
hr
Weighted Average Price of Electricity Traded by Licencees and Power Exchange
Short Term Trade Price Trends in Indian Market, FY2005 – FY2012 Short Term Trade Price Trends in Indian Market, FY2005 – FY2012

Harmonization of the studies on Regional Energy cooperation conducted by SAARC/SARIE/BIMSTEC etc to achieve synergies.
Cross Border(bilateral) interconnections is imperative for exploring the possibilities of establishing the cross border electricity market beyond two countries. ( Example Bhutan-India-Bangladesh)
Political commitment at the highest level can create an enabling environment for Regional Electricity trade.
To direct the conclusion of the SAARC Inter-governmental Framework Agreement for Energy(Electricity) Cooperation- ( 17th SAARC Summit declaration , 17th
Nov, 2011)
23
Opportunities- Cross Border Electricity Trade( beyond 2 countries)
