task order 9.b energy savings performance contracting for...
TRANSCRIPT

Task Order 9.B
Energy Savings Performance Contracting for UH-Hilo


Task Order 9.C
Review of Life of Contract Plan Template


Task Order 9.E
Energy Savings Performance Contracting to the Board of Water Supply (BWS)


Task Order 9.F
Develop Frequently Asked Questions (FAQS) List


Task Order 12
Final Narrative Progress Report


�
�
�
�
�
�
�
�
�
�
�
APPENDIX 2.0
MAJOR DELIVERABLES
�
�
�
�

�
�
�
�
�
�
�
�
�
�
�
APPENDIX 2.1
Solar Water Heating Impact Assessment

STATE OF HAWAII
SOLAR WATER HEATING IMPACT ASSESSMENT
(1992 - 2011)
Prepared For: Department of Business and Economic Development and Tourism (DBEDT)
State of Hawaii
FINAL
December 18, 2012
Prepared by:
828 Fort Street Mall, Suite 500 � Honolulu, Hawaii 96813
Tel: 808 521-3773

AcknowledgmentThis material is based upon work supported by the U.S. Department of Energy under Award Number DE-EE0000216 through State of Hawai‘i Contract Number 59499, Supplement No. 1.
Disclaimer��"This�report�was�prepared�as�an�account�of�work�sponsored�by�an�agency�of�the�United�States�Government�and�the�State�of�Hawai‘i.��Neither�the�United�States�Government�nor�any�agency�thereof,�the�State�of�Hawai‘i,�nor�any�of�their�employees,�makes�any�warranty,�expressed�or�implied,�or�assumes�any�legal�liability�or�responsibility�for�the�accuracy,�completeness,�or�usefulness�of�any�information,�apparatus,�product,�or�process�disclosed,�or�represents�that�its�use�would�not�infringe�privately�owned�rights.��Reference�herein�to�any�specific�commercial�product,�process,�or�service�by�trade�name,�trademark,�manufacturer,�or�otherwise�does�not�necessarily�constitute�or�imply�its�endorsement,�recommendation,�or�favoring�by�the�United�States�Government,�the�State�of�Hawai‘i,�or�any�agency�thereof.��The�views�and�opinions�of�authors�expressed�herein�do�not�necessarily�state�or�reflect�those�of�the�United�States�Government,�the�State�of�Hawai‘i,�or�any�agency�thereof."��

TABLE OF CONTENTS
1.0 EXECUTIVE SUMMARY ...................................................................................... 1
2.0 SOLAR WATER HEATING IMPACT ASSESSMENT ........................................... 1
3.0 METHODOLOGY /BASIS FOR ASSESSMENT ANALYSIS ................................. 6
3.1 Quantification of Solar Water Systems Installations .................................. 6
3.2 Estimate of Avoided Electrical Use Per Solar Water Heating System Installation .................................................................................... 7
3.3 Estimate of Avoided Fossil Fuel and Carbon Dioxide Emissions .............. 8
4.0 REFERENCES ...................................................................................................... 8
LIST OF TABLE Table 1 Solar Water Heating System Impact Assessment (1992 - 2011)
LIST OF FIGURES Figure 1 Number of Solar Water Heating Systems Installed Statewide Per year (1992-2011) Figure 2 Aggregate Impact of Solar Water Heating Systems Installed Statewide on Avoided Electrical Consumption Per Year (1992-2011) Figure 3 Aggregate Impact of Solar Water Heating Systems Installed Statewide on
Avoided Fuel Oil Use and CO2 Emissions Per year (1992-2011)
ATTACHMENTS Attachment 1 Tax Credits Claimed (1977-2011) Attachment 2 PY11 - Hawaii Energy Technical Reference Manual No. 2011 (Pages 18-
26) Section 8. (REEM) Residential Energy Efficiency Measures Attachment 3 Energy Star - Save Money And More With Energy Star Qualified Solar
Water Heaters Attachment 4 Saying Mahalo To Solar Savings: A Billing Analysis Of Solar Water
Heaters In Hawaii Attachment 5 EPA Combined Heat And Power Partnership, Fuel And Carbon Dioxide
Emissions Savings Calculation Methodology For Combined Heat And Power Systems, August 2012
Attachment 6 U.S. Energy Information Administration, State Energy Data System, Table F15: Total Petroleum Consumption Estimate, 2010
Attachment 7 Hawaii Energy Statistics Attachment 8 Energy-Data-Trend, Table 5.8 Residential Energy Consumption Per
Household

�
1
STATE OF HAWAII SOLAR WATER HEATING IMPACT ASSESSMENT (1977-2011)
1.0 EXECUTIVE SUMMARY:
This report reviews the number of solar water heating systems installed throughout the State of
Hawaii since the state tax credit for solar systems was first implemented in 1977, and analyzes
the savings in fossil fuels and electricity realized by their installation over the past 20 years from
1992 through 2011. The primary findings of this analysis are as follows:
� The total number of solar water heating systems installed since 1977 is 103,305.
� Based on an average 20 year life expectancy, the 74,018 total aggregate systems
installed from 1992 through 2011 currently saves the State 152,847 MWh in electricity
per year, which is sufficient to power 21,695 homes annually.
� This avoided electricity savings corresponds to an annual savings of 221,337 barrels of
fuel oil that would have otherwise been required to generate this electricity, and a
resulting reduction of 116,699 tons in annual avoided CO2 emissions.
� The total estimated value of the solar water installations that were installed cumulatively
over the 20 year period from 1992 through 2011 is approximately $332 million.
� The estimated value of the State Tax Credits that were provided under the same period
totaled approximately $116 million.
� There is a direct correlation between the number of solar water heating installations
installed annually and the level of support from State and Federal credits.
2.0 SOLAR WATER HEATING IMPACT ASSESSMENT
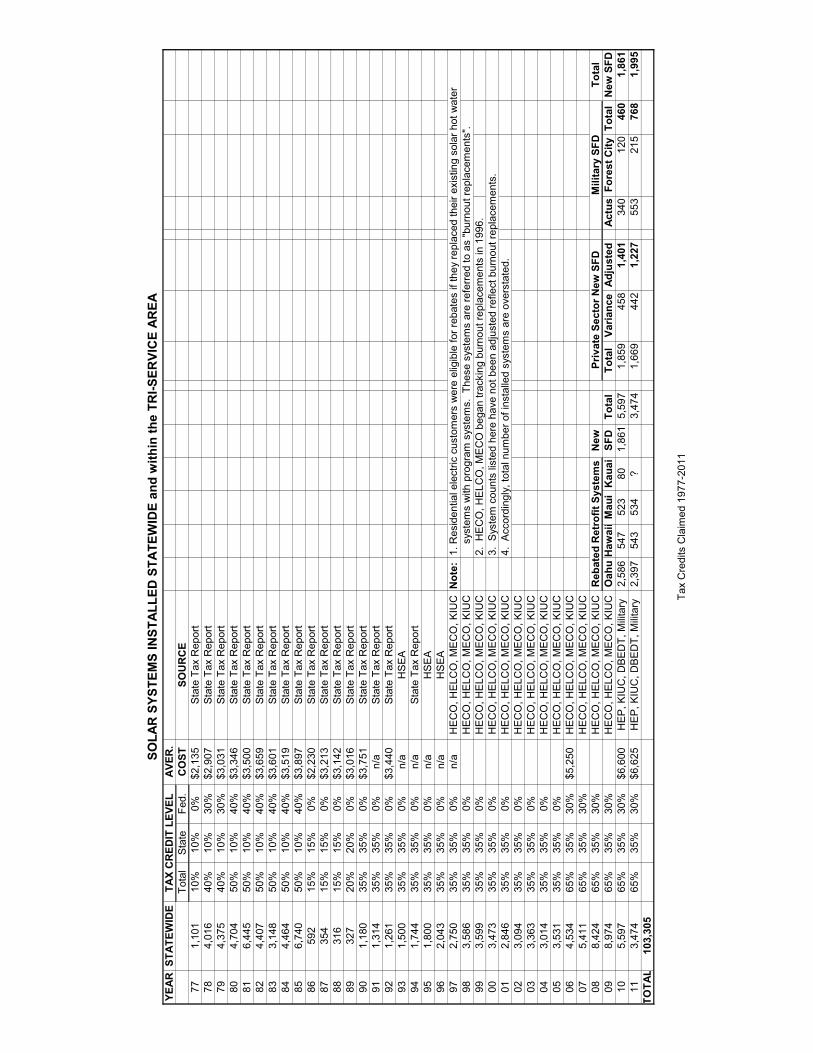
From the inception of the State Tax Credit for solar water heating systems, the total number of
solar systems that have been installed in the State of Hawaii from 1977 to 2011 was 103,305.
These installations include those that were replaced over the years so the actual number of
solar systems in service is lower.
Since solar water heating systems have a 20 year project life, the present impact of the solar
heating systems that are installed and operating is conservatively estimated based on the
systems that have been installed over the past 20 years from 1992 through 2011. Based on
the methodology and basis for assessment analysis presented in the subsequent sections, the
annual aggregate and cumulative impact of the installation of the solar water systems over the

�
2
most current 20 year period is conservatively estimated and summarized in Table 1 below and
in the Figures that follow:
For the purpose of comparison with the latest available data on Hawaii total petroleum use and
total electrical consumption in 2010, the 70,544 total solar water heating systems that were
installed over the past 19 years from 1992 to 2010 saved an aggregate of 145,673 MWh per
year in electricity. This amounted to an annual savings of 210,949 barrels of fuel oil that would
have otherwise been required to generate this electricity, and a resulting reduction of 111,222

�
3
tons in avoided CO2 emissions. Accordingly to Table F15: Total Petroleum Consumption
Estimates, 2010, (Attachment 6) and the Hawaii Energy Statistics (Attachment 7), the State of
Hawaii consumed a total of 12,610,000 barrels of oil to generate 10,013,000 MWh of electricity
in 2010. The 70,544 total solar water heating systems that were in use in 2010 resulted in a
1.7% reduction in total fuel oil used for electricity and a 1.5% reduction in electrical consumption
Statewide. The total aggregate electrical savings in 2010 from the installation of solar water
heating systems was sufficient to displace the total annual electrical use of 20,677 homes,
based on the average household electrical use of 7,045 kwh per year from the State of Hawaii
Energy Data and Trends March 2011 Table 5.8 (Attachment 8).
For the most recent year in 2011, the 74,018 total solar water heating systems that have been
installed over the past 20 years saved an aggregate of 152,847 MWh per year in electricity.
This amounted to an annual savings of 221,337 barrels of fuel oil that would have otherwise
been required to generate this electricity, and a resulting reduction of 116,699 tons in avoided
CO2 emissions. Using the same State of Hawaii Energy Data and Trends data, the total
aggregate electrical savings in 2011 from the installation of solar water heating systems was
sufficient to displace the electricity used by 21,695 homes annually.
The total estimated value of the solar water installations that were installed cumulatively over
the 20 year period from 1992 through 2011 is approximately $332 million, and the estimated
value of the State Tax Credits that were provided totaled approximately $116 million.
Figure 1 illustrates the number of solar water installations that have been installed annually from
1992 through 2011. There is a significant increase in the number of systems installed during
the 2008 through 2010 timeframe which appears attributable to the reinstitution of the Federal
tax credits in 2006.

�
4
The aggregate impact of the number of solar water installations that have been installed from
1992 through 2011 on avoided electrical use is shown in Figure 2. The cumulative to date
savings resulting from the 74,018 total solar water heating systems installed between 1992
through 2011 totaled 1,237,356 MWh in electricity over this 20 year period.
0%
10%
20%
30%
40%
50%
60%
70%
0
1,000
2,000
3,000
4,000
5,000
6,000
7,000
8,000
9,000
10,000
Figure�1.��Number�of�Solar�Hot�Water�Heating�Systems�Installed�Annually��Versus�the�Total�Tax�Credit��Rate�(1992�2011)
Solar�Water�Heater�Systems�Installed
Total�Tax�Credit�Rate�(State�+�Federal)

�
5
The aggregate impact of the number of solar water installations that have been installed from
1992 through 2011 on avoided fuel oil use and CO2 emissions is shown in Figure 3. The
cumulative impact of the solar water heating systems has resulted in a total savings of
1,791,810 barrels of fuel oil that would have otherwise been required to generate this electricity,
and a 944,722 ton reduction in avoided CO2 emissions over the entire period from 1992-2011.
Aggregate�Num
ber�of�Solar�Systems�Installed
Aggr
egat
e�An
nual
�Ele
ctric
al�S
avin
gs�(M
Wh)
�

�
6
Based on this assessment, the installation of solar water heating systems in Hawaii over the
past 20 years has made a significant contribution in reducing electrical energy use and the
amount of fuel oil imported to the State, while also lowering the amount of CO2 and other flue
stack air emissions that would have otherwise been generated.
3.0 METHODOLOGY/BASIS FOR ASSESSMENTANALYSIS:
3.1 Quantification of Solar Water Heating Systems Installations:
The number of solar water heating system installations in the State of Hawaii for the period from
1992 through 2011 of 74,018 systems installed cumulatively over this period was derived from
“Solar System Tax Credits Claimed (1977-2011)” (See Attachment 1). This data was derived
and compiled from the following sources which are documented on page 2 of the report: the
State of Hawaii Tax Reports, the Hawaii Solar Energy Association (HSEA), the electric utility
companies (HECO, HELCO, MECO, and KIUC), Hawaii Energy, DBEDT, and the Military. The
Aggr
egat
e�Fu
el�O
il�Sa
ving
s�(Bb
ls/yr
)�
Aggregate�Avoided�CO2�Em
issions�(Tons)

�
7
solar water installations tallied during this period reflect the number of systems that were
documented to have received State and Federal tax credits and electric utility rebates. Since
the life expectancy of a solar water heating system is 20 years (see Attachment 2 - Solar Water
Heaters : ENERGY STAR), it is assumed all of the solar water systems installed over the past
20 years are still in service at this time. While some of these systems may have already been
replaced, it is reasonable to assume that the majority of these systems have remained
operational. In addition, some of the older solar water systems during the preceding period from
1977 through 1991 that total an additional 29,287 installations that are not included in this
assessment also remain functional and would actually increase the impact of the solar system
installed over the past 20 years if they were also counted. It is also assumed that all of these
solar water heating systems were installed to displace the use of electrical water heaters since
the electric utility company rebates provided a significant incentive for their installation.
3.2 Estimate of Avoided Electrical Use per Solar Water Heating System Installation:
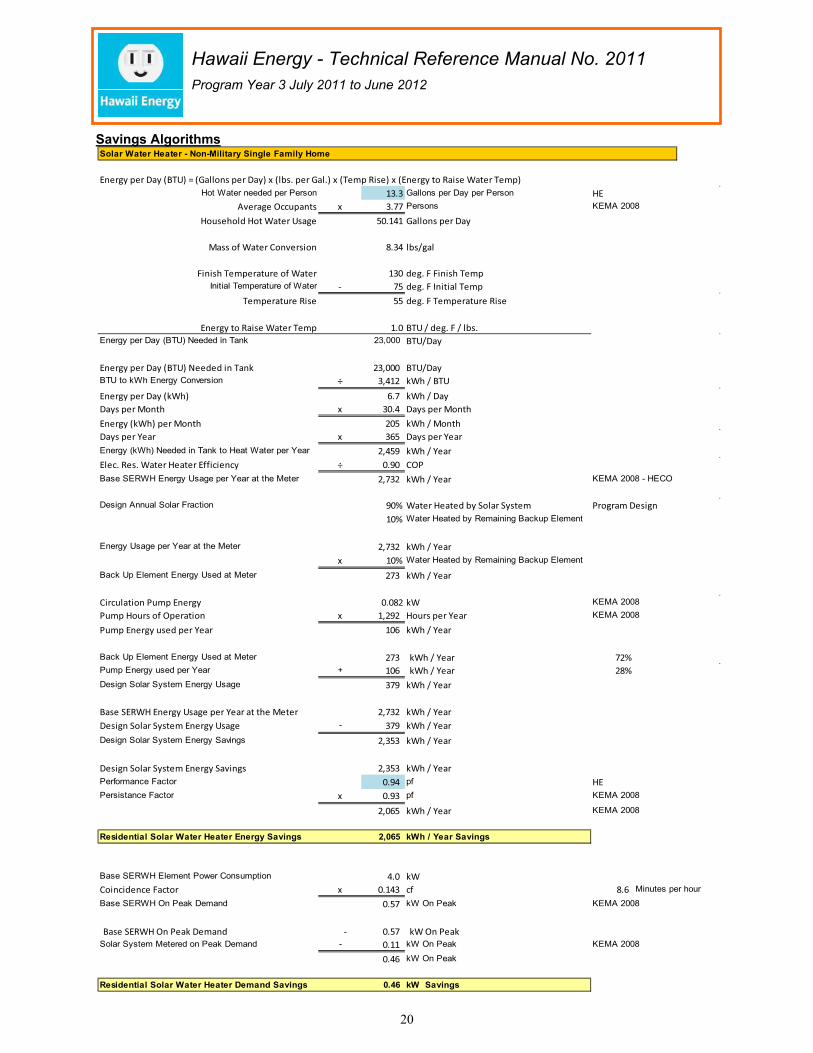
The avoided electrical consumption per solar water heating system of 2,065 kwh per year per
system is based on the analysis from Hawaii Energy - Technical Reference Manual No. 2011
Program Year 3 July 2011 to June 2012 (Excerpt pages 18-26 – Attachment 3). This analysis
is based on the following which appear to be reasonable:
1. Average Hot Water Use Per Person: 13.3 Gallons per day
2. Average Occupants per Solar Water Heating System: 3.77
3. Final Water Heating Temperature: 130 degrees F
4. Initial Cold Water Supply Temperature: 75 degrees F
5. Electrical Resistance Heater COP: 0.90
6. Fraction of Water Heating Accomplished by Solar on an Annual Basis: 90%
The Hawaii Energy estimate of 2,065 kwh per year of electricity use avoided by installation of
each solar water heating system is also consistent with an independent study, “Saying Mahalo
to Solar Savings: A Billing Analysis of Solar Water Heaters in Hawaii,” (Attachment 4) that was
prepared in conjunction with the Hawaii Public Utilities Commission . This report calculated the
savings of solar water heating installations in Hawaii using a statistical analysis of the utility bills
before and after the solar water heating systems were installed in 6,302 homes in 2009 and
2010. According to their summary, “ … Our impact estimate of 1,912 kWh is close to the
current ex ante savings value of 2,066 kWh included in the Hawaii Energy PY2010 Technical

�
8
Reference Manual (TRM). Given that the savings estimates are so close, we did not
recommend any change to the TRM value currently in use by the program…”
Based on these two reports, the avoided electrical consumption per solar water heating system
of 2,065 kwh per year per system appears reasonable and is the basis for the electrical savings
utilized in this assessment.
3.3 Estimate of Avoided Fossil Fuel and Carbon Dioxide Emissions:
The fossil fuel consumption and carbon dioxide emissions avoided from the savings in electricity
due to the installation of the solar hot water heating systems is based on the heat rate of 9,123
Btu/kwh and a CO2 Emission Factor of 1,527 lb/Mwh for the average of all electrical power
generation in the Hawaiian Islands. These figures were developed in the analysis from “Fuel
and Carbon Dioxide Emissions Savings Calculation Methodology for Combined Heat and Power
Systems, U.S. Environmental Protection Agency, Combined Heat and Power Partnership
August 2012” (Attachment 5). A conversion factor of 150,000 Btu per gallon was used to
convert from energy to residual fuel oil.
4.0 REFERENCES:
1. Solar System Tax Credits Claimed (1977-2011), Ron Richmond (Attachment 1)
2. Solar Water Heaters : ENERGY STAR,
http://www.energystar.gov/index.cfm?c=solar_wheat.pr_savings_benefits (Attachment 2)
3. Hawaii Energy - Technical Reference Manual No. 2011 Program Year 3 July 2011 to June
2012 (Excerpt pages 18-26 – Attachment 3)
4. Saying Mahalo to Solar Savings: A Billing Analysis of Solar Water Heaters in Hawaii,
Jenny Yaillen, Evergreen Economic/Chris Ann Dickerson, CAD Consulting/Wendy
Takanishi and John Cole, Hawaii Public Utilities Commission (Attachment 4)
5. Fuel and Carbon Dioxide Emissions Savings Calculation Methodology for Combined Heat
and Power Systems, U.S. Environmental Protection Agency, Combined Heat and Power
Partnership August 2012 (Attachment 5)
6. Table F15: Total Petroleum Consumption Estimates, 2010, U.S. Energy Information
Administration (Attachment 6)
7. Hawaii Energy Statistics http://energy.hawaii.gov/resources/dashboard-statistics
(Attachment 7)
8. State of Hawaii Energy Data and Trends March 2011 Table 5.8 (Attachment 8)

��������
ATTACHMENT�1��
TAX�CREDITS�CLAIMED�(1977�2011)��� �

Cha
rt '7
7-'1
1Ta
x C
redi
ts C
laim
ed 1
977-
2011
0
1,00
0
2,00
0
3,00
0
4,00
0
5,00
0
6,00
0
7,00
0
8,00
0
9,00
0
7779
8183
8587
8991
9395
9799
0103
0507
0911
1,101 4,016
4,375 4,704
6,445 4,407
3,148 4,464
6,740 592
354 316 327
1,180 1,314 1,261
1,500 1,744 1,800
2,043 2,750
3,586 3,599
3,473 2,846
3,094 3,363
3,014 3,531
4,534 5,411
8,424 8,974
5,597 3,474
# of solar water heating systems Ef
fect
of I
ncen
tives
for S
olar
Wat
er H
eatin
g Sy
stem
s
in H
awai
i
Avai
labl
e cr
edits
& re
bate
s 10
% s
tate
10
% s
tate
/30%
fede
ral
10%
sta
te/4
0% fe
dera
l 15
% s
tate
20
% s
tate
35
% s
tate
35
% s
tate
+ u
tility
reba
te
35%
sta
te/3
0% fe
d +
utili
ty re
bate
SOLA
R S
YSTE
MS
INST
ALLE
D S
TATE
WID
E an
d w
ithin
the
TRI-S
ERVI
CE
AREA
YEAR
STAT
EWID
ETA
X C
RED
IT L
EVEL
AVER
.To
tal
Sta
teFe
d.C
OST
SOU
RC
E77
1,10
110
%10
%0%
$2,1
35S
tate
Tax
Rep
ort
784,
016
40%
10%
30%
$2,9
07S
tate
Tax
Rep
ort
794,
375
40%
10%
30%
$3,0
31S
tate
Tax
Rep
ort
804,
704
50%
10%
40%
$3,3
46S
tate
Tax
Rep
ort
816,
445
50%
10%
40%
$3,5
00S
tate
Tax
Rep
ort
824,
407
50%
10%
40%
$3,6
59S
tate
Tax
Rep
ort
833,
148
50%
10%
40%
$3,6
01S
tate
Tax
Rep
ort
844,
464
50%
10%
40%
$3,5
19S
tate
Tax
Rep
ort
856,
740
50%
10%
40%
$3,8
97S
tate
Tax
Rep
ort
8659
215
%15
%0%
$2,2
30S
tate
Tax
Rep
ort
8735
415
%15
%0%
$3,2
13S
tate
Tax
Rep
ort
8831
615
%15
%0%
$3,1
42S
tate
Tax
Rep
ort
8932
720
%20
%0%
$3,0
16S
tate
Tax
Rep
ort
901,
180
35%
35%
0%$3
,751
Sta
te T
ax R
epor
t91
1,31
435
%35
%0%
n/a
Sta
te T
ax R
epor
t92
1,26
135
%35
%0%
$3,4
40S
tate
Tax
Rep
ort
931,
500
35%
35%
0%n/
aH
SEA
941,
744
35%
35%
0%n/
aS
tate
Tax
Rep
ort
951,
800
35%
35%
0%n/
aH
SEA
962,
043
35%
35%
0%n/
aH
SEA
972,
750
35%
35%
0%n/
aH
EC
O, H
ELC
O, M
EC
O, K
IUC
Not
e:1.
Res
iden
tial e
lect
ric c
usto
mer
s w
ere
elig
ible
for r
ebat
es if
they
repl
aced
thei
r exi
stin
g so
lar h
ot w
ater
98
3,58
635
%35
%0%
HE
CO
, HE
LCO
, ME
CO
, KIU
C
sys
tem
s w
ith p
rogr
am s
yste
ms.
The
se s
yste
ms
are
refe
rred
to a
s "b
urno
ut re
plac
emen
ts".
993,
599
35%
35%
0%H
EC
O, H
ELC
O, M
EC
O, K
IUC
2. H
EC
O, H
ELC
O, M
EC
O b
egan
trac
king
bur
nout
repl
acem
ents
in 1
996.
003,
473
35%
35%
0%H
EC
O, H
ELC
O, M
EC
O, K
IUC
3. S
yste
m c
ount
s lis
ted
here
hav
e no
t bee
n ad
just
ed re
flect
bur
nout
repl
acem
ents
.01
2,84
635
%35
%0%
HE
CO
, HE
LCO
, ME
CO
, KIU
C4.
Acc
ordi
ngly
, tot
al n
umbe
r of i
nsta
lled
syst
ems
are
over
stat
ed.
023,
094
35%
35%
0%H
EC
O, H
ELC
O, M
EC
O, K
IUC
033,
363
35%
35%
0%H
EC
O, H
ELC
O, M
EC
O, K
IUC
043,
014
35%
35%
0%H
EC
O, H
ELC
O, M
EC
O, K
IUC
053,
531
35%
35%
0%H
EC
O, H
ELC
O, M
EC
O, K
IUC
064,
534
65%
35%
30%
$5,2
50H
EC
O, H
ELC
O, M
EC
O, K
IUC
075,
411
65%
35%
30%
HE
CO
, HE
LCO
, ME
CO
, KIU
C08
8,42
465
%35
%30
%H
EC
O, H
ELC
O, M
EC
O, K
IUC
New
Tota
l09
8,97
465
%35
%30
%H
EC
O, H
ELC
O, M
EC
O, K
IUC
Oah
uH
awai
iM
aui
Kau
aiSF
DTo
tal
Tota
lVa
rianc
eAd
just
edAc
tus
Fore
st C
ityTo
tal
New
SFD
105,
597
65%
35%
30%
$6,6
00H
EP, K
IUC
, DBE
DT,
Milit
ary
2,58
654
752
380
1,86
15,
597
1,85
945
81,
401
340
120
460
1,86
111
3,47
465
%35
%30
%$6
,625
HEP
, KIU
C, D
BED
T, M
ilitar
y2,
397
543
534
?3,
474
1,66
944
21,
227
553
215
768
1,99
5TO
TAL
103,
305
Priv
ate
Sect
or N
ew S
FDM
ilita
ry S
FDR
ebat
ed R
etro
fit S
yste
ms
Tax
Cre
dits
Cla
imed
197
7-20
11

��������
ATTACHMENT�2��
PY11���HAWAII�ENERGY�TECHNICAL�REFERENCE�MANUAL�NO.�2011�(PAGES�18�26)�SECTION�8.�(REEM)�RESIDENTIAL�ENERGY�EFFICIENCY�MEASURES�
�� �

Hawaii Energy - Technical Reference Manual No. 2011 Program Year 3 July 2011 to June 2012
18
8 (REEM) Residential Energy Efficiency Measures
8.1 High Efficiency Water Heating
8.1.1 Solar Water Heater Measure ID: See Table 7.3 Version Date & Revision History Draft date: February 24, 2010 Effective date: July 1, 2010 End date: TBD
Referenced Documents: � Energy and Peak Demand Impact Evaluation Report of the 2005-2007 Demand
Management Programs – (KEMA 2005-07) � Econorthwest TRM Review – 6/23/10 � Evergreen TRM Review – 2/23/12
TRM Review Actions:
� 6/23/10 Rec. # 6 – For PY 2010, adjust claimed demand savings based on participant data from all service territories covered. Adjust Demand Savings based on participant data weighted average of KEMA results across all counties. Change from 0.50 to 0.46 kW. non-military – Adopted and incorporated into PY2010-1 TRM.
� 6/23/10 Rec. # 7 - For PY 2010, include a discussion of shell losses in the savings analysis and supporting documentation. Discussion included in PY2010-1 TRM.
� 10/5/11 – Currently Under Review.
Major Changes: � Eliminated Military figure as no foreseeable military retrofit applications will be received. � Demand change to weighted average from KEMA 2008. 0.46 kW � Changed individual water usage from 13.3035 to 13.3
Measure Description: Replacement of Electric Resistance Water Heater with a Solar Water Heater designed for a 90% Solar Fraction. The new Solar Water Heating systems most often include an upgrade of the hot water storage tank sized at 80 or 120 gallons. Systems must comply with Hawaii Energy Solar Standards and Specifications which call out:
� Panel Ratings � System Sizing � Installation orientation de-rating factors � Hardware and mounting systems
Shell Losses: The increase in size from a 40 or 60 gallon to an 80 or 120 gallon standard electric resistance water heater would in and of itself increase the “shell” losses of the system. These shell losses are the result of a larger surface area exposing the warm water to the cooler environment and thus more heat lost to the environment through conduction through the tank. Engineering calculations by Econorthwest puts this at a 1% increase in losses. This is further reduced by 90% as the solar water system provides that fraction of the annual water heating requirements.

Hawaii Energy - Technical Reference Manual No. 2011 Program Year 3 July 2011 to June 2012
19
Baseline Efficiencies: Baseline usage is a 0.9 COP Electric Resistance Water Heater. The baseline water heater energy consumption is by a single 4.0kW electric resistance element that is controlled thermostatically on/off controller based of tank finish temperature set point. The tank standby loss differences between baseline and high efficiency case are assumed to be negligible. Demand Baseline has been determined by field measurements by KEMA 2005-07 report. The energy baseline also comes from the KEMA 2005-07 report and is supported by engineering calculations shown in this TRM.
Building Types Demand Baseline(kW) Energy Baseline (kWh) Residential 0.57 2,733
High Efficiency: Solar Water Heater designed for a 90% Solar Fraction. The Solar Systems use solar thermal energy to heat the water 90% of the time and continue to utilize electricity to operate the circulation pump and provide heating through a 4.0 kW electric resistance element when needed. Solar Contractors do not favor Photo-Voltaic powered DC circulation pumps as they have proven less reliable in the field than an AC powered circulation pump. The electric resistance elements in the high efficiency case do not have load control timers on them. The energy is the design energy of a 90% solar fraction system with circulation pump usage as metered by KEMA 2008. The on peak demand is the metered demand found by KEMA 2008.
Building Types Demand High Efficiency (kW)
Energy High Efficiency (kWh)
Circ. Pump %
Residential 0.07 379 28% Energy Savings: Solar Water Heater Gross Savings before operational adjustments:
Building Types Demand Savings (kW)
Energy Savings (kWh)
Residential 0.46 2,354
Operational Factor Adjustment Factor Solar Fraction Performance (sfp) 0.94 Persistence Factor (pf) 0.93 Demand Coincidence Factor (cf) 1.0
Solar Water Heater Net Savings after operational adjustments:
Building Types Demand Savings (kW)
Energy Savings (kWh)
Residential 0.46 2,065
Hawaii Energy - Technical Reference Manual No. 2011 Program Year 3 July 2011 to June 2012
20
Savings Algorithms
Solar Water Heater - Non-Military Single Family Home
Hot Water needed per Person 13.3 Gallons per Day per Person HEAverage�Occupants x 3.77 Persons KEMA 2008
Household�Hot�Water�Usage 50.141 Gallons�per�Day
Mass�of�Water�Conversion 8.34 lbs/gal
Finish�Temperature�of�Water 130 deg.�F�Finish�TempInitial Temperature of Water � 75 deg.�F�Initial�Temp
Temperature�Rise 55 deg.�F�Temperature�Rise
Energy�to�Raise�Water�Temp 1.0 BTU�/�deg.�F�/�lbs.Energy per Day (BTU) Needed in Tank 23,000 BTU/Day
Energy�per�Day�(BTU)�Needed�in�Tank 23,000���� BTU/DayBTU to kWh Energy Conversion ÷ 3,412������ kWh�/�BTUEnergy�per�Day�(kWh) 6.7����������� kWh�/�DayDays�per�Month x 30.4��������� Days�per�MonthEnergy�(kWh)�per�Month 205���������� kWh�/�MonthDays�per�Year x 365���������� Days�per�YearEnergy (kWh) Needed in Tank to Heat Water per Year 2,459������ kWh�/�YearElec.�Res.�Water�Heater�Efficiency ÷ 0.90��������� COPBase SERWH Energy Usage per Year at the Meter 2,732������ kWh�/�Year KEMA 2008 - HECO
Design Annual Solar Fraction 90% Water�Heated�by�Solar�System Program�Design10% Water Heated by Remaining Backup Element
Energy Usage per Year at the Meter 2,732������ kWh�/�Yearx 10% Water Heated by Remaining Backup Element
Back Up Element Energy Used at Meter 273���������� kWh�/�Year
Circulation�Pump�Energy 0.082 kW KEMA 2008Pump�Hours�of�Operation x 1,292������ Hours�per�Year KEMA 2008
Pump�Energy�used�per�Year 106���������� kWh�/�Year
Back Up Element Energy Used at Meter 273���������� kWh�/�Year 72%Pump Energy used per Year + 106���������� kWh�/�Year 28%Design Solar System Energy Usage 379���������� kWh�/�Year
Base�SERWH�Energy�Usage�per�Year�at�the�Meter 2,732������ kWh�/�YearDesign�Solar�System�Energy�Usage - 379���������� kWh�/�YearDesign Solar System Energy Savings 2,353������ kWh�/�Year
Design�Solar�System�Energy�Savings 2,353������ kWh�/�YearPerformance Factor 0.94��������� pf HEPersistance Factor x 0.93��������� pf KEMA 2008
2,065������ kWh�/�Year KEMA 2008
Residential Solar Water Heater Energy Savings 2,065 kWh / Year Savings
Base SERWH Element Power Consumption 4.0����������� kW��Coincidence�Factor x 0.143������ cf 8.6����������� Minutes per hour
Base SERWH On Peak Demand 0.57��������� kW On Peak KEMA 2008
Base�SERWH�On�Peak�Demand ������������ 0.57��������� kW�On�PeakSolar System Metered on Peak Demand - 0.11��������� kW On Peak KEMA 2008
0.46��������� kW On Peak
Residential Solar Water Heater Demand Savings 0.46 kW Savings
Energy�per�Day�(BTU)�=�(Gallons�per�Day)�x�(lbs.�per�Gal.)�x�(Temp�Rise)�x�(Energy�to�Raise�Water�Temp)

Hawaii Energy - Technical Reference Manual No. 2011 Program Year 3 July 2011 to June 2012
21
Operating Hours See Table above.
Loadshape TBD
Freeridership/Spillover Factors TBD
PersistenceThe persistence factor has been found to be 0.93 based in the KEMA 2005-07 report that found 7% of the systems not operational.
Lifetime 15 years Measure Costs and Incentive Levels Table 1 – SWH Measure Costs and Incentive Levels
Description Unit Incentive Incremental Cost Non-Military $ 750 $6,600�
Component Costs and Lifetimes Used in Computing O&M Savings TBD
Reference Tables None

Hawaii Energy - Technical Reference Manual No. 2011 Program Year 3 July 2011 to June 2012
22
8.1.2 Solar Water Heating Loan Interest Buydown (LIB) Measure ID: See Table 7.3 Version Date & Revision History Draft date: May 22, 2011 Effective date: November 1, 2011 End date: TBD
Referenced Documents: � Energy and Peak Demand Impact Evaluation Report of the 2005-2007 Demand
Management Programs – (KEMA 2005-07) � Econorthwest TRM Review – 6/23/10 � Evergreen TRM Review – 2/23/12
TRM Review Actions:
� 6/23/10 Rec. # 6 – For PY 2010, adjust claimed demand savings based on participant data from all service territories covered. Adjust Demand Savings based on participant data weighted average of KEMA results across all counties. Change from 0.50 to 0.46 kW. non-military – Adopted and incorporated into PY2010-1 TRM.
� 6/23/10 Rec. # 7 - For PY 2010, include a discussion of shell losses in the savings analysis and supporting documentation. Discussion included in PY2010-1 TRM.
� 10/5/11 – Currently Under Review.
Major Changes: � Eliminated Military figure as no foreseeable military retrofit applications will be received. � Demand change to weighted average from KEMA 2008. 0.46 kW � Changed individual water usage from 13.3035 to 13.3
Measure Description: The Solar Water Heating Loan Interest Buydown Program offers eligible borrowers an interest buy down of $1,000 (with a minimum loan of $5,000) toward the financing of a solar water heating system from a participating lender – see www.hawaiienergy.com for a list of participating lenders. Replacement of Electric Resistance Water Heater with a Solar Water Heater designed for a 90% Solar Fraction. The new Solar Water Heating systems most often include an upgrade of the hot water storage tank sized at 80 or 120 gallons. Systems must comply with Hawaii Energy Solar Standards and Specifications which call out:
� Panel Ratings � System Sizing � Installation orientation de-rating factors � Hardware and mounting systems
Shell Losses: The increase in size from a 40 or 60 gallon to an 80 or 120 gallon standard electric resistance water heater would in and of itself increase the “shell” losses of the system. These shell losses are the result of a larger surface area exposing the warm water to the cooler environment and thus more heat lost to the environment through conduction through the tank. Engineering calculations by Econorthwest puts this at a 1% increase in losses. This is further reduced by 90% as the solar water system provides that fraction of the annual water heating requirements. Baseline Efficiencies: Baseline usage is a 0.9 COP Electric Resistance Water Heater. The baseline water heater energy consumption is by a single 4.0 kW electric resistance element that is controlled thermostatically on/off

Hawaii Energy - Technical Reference Manual No. 2011 Program Year 3 July 2011 to June 2012
23
controller based of tank finish temperature set point. The tank standby loss differences between baseline and high efficiency case are assumed to be negligible. Demand Baseline has been determined by field measurements by KEMA 2005-07 report. The energy baseline also comes from the KEMA 2005-07 report and is supported by engineering calculations shown in this TRM.
Building Types Demand Baseline(kW) Energy Baseline (kWh) Residential 0.57 2,733
High Efficiency: Solar Water Heater designed for a 90% Solar Fraction. The Solar Systems use solar thermal energy to heat the water 90% of the time and continue to utilize electricity to operate the circulation pump and provide heating through a 4.0 kW electric resistance element when needed. Solar Contractors do not favor Photo-Voltaic powered DC circulation pumps as they have proven less reliable in the field than an AC powered circulation pump. The electric resistance elements in the high efficiency case do not have load control timers on them. The energy is the design energy of a 90% solar fraction system with circulation pump usage as metered by KEMA 2008. The on peak demand is the metered demand found by KEMA 2008.
Building Types Demand High Efficiency (kW)
Energy High Efficiency (kWh)
Circ. Pump %
Residential 0.07 379 28%
Energy Savings: Solar Water Heater Gross Savings before operational adjustments:
Building Types Demand Savings (kW)
Energy Savings (kWh)
Residential 0.46 2,354
Operational Factor Adjustment Factor Solar Fraction Performance (sfp) 0.94 Persistence Factor (pf) 0.93 Demand Coincidence Factor (cf) 1.0
Solar Water Heater Net Savings after operational adjustments:
Building Types Demand Savings (kW)
Energy Savings (kWh)
Residential 0.46 2,065

Hawaii Energy - Technical Reference Manual No. 2011 Program Year 3 July 2011 to June 2012
24
Savings Algorithms
Operating Hours See Table above.
Loadshape TBD
Freeridership/Spillover Factors TBD
Solar Water Heater - Non-Military Single Family Home
Hot Water needed per Person 13.3 Gallons per Day per Person HEAverage�Occupants x 3.77 Persons KEMA 2008
Household�Hot�Water�Usage 50.141 Gallons�per�Day
Mass�of�Water�Conversion 8.34 lbs/gal
Finish�Temperature�of�Water 130 deg.�F�Finish�TempInitial Temperature of Water � 75 deg.�F�Initial�Temp
Temperature�Rise 55 deg.�F�Temperature�Rise
Energy�to�Raise�Water�Temp 1.0 BTU�/�deg.�F�/�lbs.Energy per Day (BTU) Needed in Tank 23,000 BTU/Day
Energy�per�Day�(BTU)�Needed�in�Tank 23,000���� BTU/DayBTU to kWh Energy Conversion ÷ 3,412������ kWh�/�BTUEnergy�per�Day�(kWh) 6.7����������� kWh�/�DayDays�per�Month x 30.4��������� Days�per�MonthEnergy�(kWh)�per�Month 205���������� kWh�/�MonthDays�per�Year x 365���������� Days�per�YearEnergy (kWh) Needed in Tank to Heat Water per Year 2,459������ kWh�/�YearElec.�Res.�Water�Heater�Efficiency ÷ 0.90��������� COPBase SERWH Energy Usage per Year at the Meter 2,732������ kWh�/�Year KEMA 2008 - HECO
Design Annual Solar Fraction 90% Water�Heated�by�Solar�System Program�Design10% Water Heated by Remaining Backup Element
Energy Usage per Year at the Meter 2,732������ kWh�/�Yearx 10% Water Heated by Remaining Backup Element
Back Up Element Energy Used at Meter 273���������� kWh�/�Year
Circulation�Pump�Energy 0.082 kW KEMA 2008Pump�Hours�of�Operation x 1,292������ Hours�per�Year KEMA 2008
Pump�Energy�used�per�Year 106���������� kWh�/�Year
Back Up Element Energy Used at Meter 273���������� kWh�/�Year 72%Pump Energy used per Year + 106���������� kWh�/�Year 28%Design Solar System Energy Usage 379���������� kWh�/�Year
Base�SERWH�Energy�Usage�per�Year�at�the�Meter 2,732������ kWh�/�YearDesign�Solar�System�Energy�Usage - 379���������� kWh�/�YearDesign Solar System Energy Savings 2,353������ kWh�/�Year
Design�Solar�System�Energy�Savings 2,353������ kWh�/�YearPerformance Factor 0.94��������� pf HEPersistance Factor x 0.93��������� pf KEMA 2008
2,065������ kWh�/�Year KEMA 2008
Residential Solar Water Heater Energy Savings 2,065 kWh / Year Savings
Energy�per�Day�(BTU)�=�(Gallons�per�Day)�x�(lbs.�per�Gal.)�x�(Temp�Rise)�x�(Energy�to�Raise�Water�Temp)

Hawaii Energy - Technical Reference Manual No. 2011 Program Year 3 July 2011 to June 2012
25
PersistenceThe persistence factor has been found to be 0.93 based in the KEMA 2005-07 report that found 7% of the systems not operational.
Lifetime 15 years Measure Costs and Incentive Levels Hawaii Energy will be allowed to claim credit for the fraction of the energy and demand savings and total resource benefits that is proportional to the share of customer incentive cost paid with PBFA funds. The following distribution is provided for energy and demand impacts: PBFA (Public Benefit Fee Administrator) 25% ARRA (American Recovery and Reinvestment Act) 75%
Component Costs and Lifetimes Used in Computing O&M Savings TBD
Reference Tables None
Energy�Savings 2065 kWh/yearDemand�Savings 0.46 kW�
Unit�Incentive Incremental�Cost Unit�Incentive %�ContributionEnergy�Savings
(kWh/year)Demand�Savings
(kW) Unit�Incentive %�ContributionEnergy�Savings
(kWh/year)Demand�Savings
(kW)Military 1,000$��������������������� 4,400$�������������������� 250$������������������ 25% 516 0.12 750$������������������ 75% 1549 0.35Non�Military 1,000$��������������������� 6,600$�������������������� 250$������������������ 25% 516 0.12 750$������������������ 75% 1549 0.35
Unit�Incentive Incremental�Cost Unit�Incentive %�ContributionEnergy�Savings
(kWh/year)Demand�Savings
(kW) Unit�Incentive %�ContributionEnergy�Savings
(kWh/year)Demand�Savings
(kW)Military 1,750$��������������������� 4,400$�������������������� 250$������������������ 14% 295 0.07 1,500$�������������� 86% 1770 0.39Non�Military 1,750$��������������������� 6,600$�������������������� 250$������������������ 14% 295 0.07 1,500$�������������� 86% 1770 0.39
PBF ARRA
PBF ARRA
Pre�Bonus�Period�(11/1/10���3/21/11)
Bonus�Period�(3/22/11���6/30/11)

Hawaii Energy - Technical Reference Manual No. 2011 Program Year 3 July 2011 to June 2012
26
8.1.3 Solar Water Heater Energy Hero Gift Packs Measure ID: Version Date & Revision History Draft date: October 4, 2011 Effective date: July 1, 2011 End date: June 30, 2012
Referenced Documents: � Energy and Peak Demand Impact Evaluation Report of the 2005-2007 � Demand Management Programs – KEMA (KEMA 2005-07) � Econorthwest TRM Review – 6/23/10 � Energy and Peak Demand Impact Evaluation Report of the 2005-2007 Demand Management
Programs – (KEMA 2005-07) � Evergreen TRM Review – 2/23/12
TRM Review Actions:
� 10/5/11 – Currently Under Review.
Major Changes: � 11/22/11 – LED algorithm updated. See section 8.2.2 for changes. � 11/22/11 – Akamai Power Strip kWh savings updated based on NYSERDA Measure
Characterization for Advanced Power Strips. � 11/22/11 – Updated content in headings Description, Base Case, High Efficiency Case, and
Energy Savings in regard to LED lamps to match section 8.2.2. � 11/29/11 – Low Flow Shower Head algorithm updated – previously claiming only 50% of total
energy savings due to inaccurately calculating hot and cold water mix. Also updated Energy Savings table as necessary.
� 4/17/12 – Updated CFL and LED algorithms to refer to CFL and LED sections in TRM to ensure accuracy. Updated energy savings numbers to be consistent with EMV revisions.
� 8/1/12 – Updated Low Flow Shower Head algorithm to reduce demand savings from 40% to 20% as per EM&V review (Feb. 2012)
Description: Potential gift pack components:
� Compact Fluorescent Lamp � Akamai Power Strip � LED Lamp � Low Flow Shower Head
Base Case
� 60 W incandescent lamps � Standard power strip or no power strip � 25% 60W incandescent, 25% 40W incandescent, 25% 23W CFLs and 25% 13W CFLs (See LED
TRM) � Low Flow Shower Head rated at 2.5 gpm
High Efficiency Case
� 15W CFLs � Akamai Power Strip � 50% 7W LED Lamp and 50% 12.5W LED Lamp � Low Flow Shower Head rated at 1.5 gpm

��������
ATTACHMENT�3��
ENERGY�STAR���SAVE�MONEY�AND�MORE�WITH�ENERGY�STAR�QUALIFIED�SOLAR�WATER�HEATERS�
�� �

An
ENER
GY
STA
R q
ualif
ied
sola
r wat
er h
eatin
g sy
stem
can
cut
you
r ann
ual h
otw
ater
cos
ts in
hal
f, an
d is
gen
eral
ly d
esig
ned
for u
se w
ith a
n el
ectri
c or
gas
bac
k-up
wat
er h
eate
r. D
emon
stra
te y
our e
nviro
nmen
tal l
eade
rshi
p by
vot
ing
with
you
r wal
let
for r
enew
able
ene
rgy
solu
tions
. Pur
chas
e an
EN
ERG
Y S
TAR
qua
lifie
d so
lar w
ater
heat
er fo
r you
r hom
e an
d en
joy
thes
e be
nefit
s:
Save
mon
ey. B
y us
ing
suns
hine
to h
eat o
r pre
heat
you
r wat
er, y
ou c
an c
ut y
our w
ater
heat
ing
bill
in h
alf.
This
mea
ns y
ou c
an sa
ve $
190
annu
ally
if y
ou c
ombi
ne so
lar w
itha
back
up g
as-s
tora
ge w
ater
hea
ter i
nste
ad o
f usi
ng th
e ga
s wat
er h
eate
r alo
ne. I
f you
have
an
elec
tric
tank
wat
er h
eate
r for
bac
k-up
, you
'll sa
ve a
bout
$25
0 ea
ch y
ear o
nel
ectri
city
bill
s. La
rge
fam
ilies
with
gre
ater
hot
wat
er n
eeds
can
save
eve
n m
ore.
Inve
st in
a b
ette
r env
ironm
ent.
Wat
er h
eate
d by
the
sun
just
feel
s bet
ter.
The
purc
hase
of a
sola
r sys
tem
can
take
abo
ut 1
0 ye
ars t
o pa
y fo
r its
elf,
but b
y ta
king
adva
ntag
e of
Fed
eral
tax
cred
its y
ou c
an re
coup
the
pric
e pr
emiu
m m
ore
quic
kly.
Inth
e m
eant
ime,
you
r inv
estm
ent w
ill p
ay d
ivid
ends
for t
he e
nviro
nmen
t. EN
ERG
YST
AR
qua
lifie
d so
lar w
ater
hea
ters
can
cut
you
r car
bon
diox
ide
emis
sion
s in
half.
Inst
allin
g a
qual
ified
sola
r wat
er h
eate
r will
redu
ce th
e lo
ad o
f you
r ele
ctric
wat
erhe
ater
by
alm
ost 2
,500
kW
h pe
r yea
r, pr
even
ting
4,00
0 po
unds
of c
arbo
n di
oxid
e fr
omen
terin
g th
e at
mos
pher
e an
nual
ly. T
his i
s the
equ
ival
ent o
f not
driv
ing
your
car
for
four
mon
ths e
very
yea
r!
Long
life
time.
The
ave
rage
life
exp
ecta
ncy
of q
ualif
ied
sola
r wat
er h
eatin
g sy
stem
s is
20 y
ears
, muc
h lo
nger
than
stan
dard
gas
or e
lect
ric st
orag
e w
ater
hea
ters
.
Sola
r Wat
er H
eate
rs :
ENER
GY
STA
Rht
tp://
ww
w.e
nerg
ysta
r.gov
/inde
x.cf
m?c
=sol
ar_w
heat
.pr_
savi
ngs_
bene
fits
1 of
211
/27/
2012
7:4
9 P M

Follo
w u
s
Shar
e Shar
e / S
ave
EPA
Hom
eEP
A Se
arch
DO
E Ho
me
DO
E Se
arch
Abou
t ENE
RGY
STAR
Prod
ucts
Hom
e Im
prov
emen
tNe
w Ho
mes
Build
ings
& P
lant
sPa
rtner
Res
ourc
esKi
dsPu
blic
atio
ns
News
Roo
mFA
Qs
Con
tact
Us
Priva
cySi
te In
dex
Recu
rsos
en
Espa
ñol
View
erFl
ash
View
erPo
werP
oint
Vie
wer
Exce
l Vie
wer
Sola
r Wat
er H
eate
rs :
ENER
GY
STA
Rht
tp://
ww
w.e
nerg
ysta
r.gov
/inde
x.cf
m?c
=sol
ar_w
heat
.pr_
savi
ngs_
bene
fits
2 of
211
/27/
2012
7:4
9 P M

��������
ATTACHMENT�4��
SAYING�MAHALO�TO�SOLAR�SAVINGS:��A�BILLING�ANALYSIS�OF�SOLAR�WATER�HEATERS�IN�HAWAII�
�� �

Saying Mahalo to Solar Savings: A Billing Analysis of Solar Water Heaters in Hawaii
Jenny Yaillen, Evergreen Economics Chris Ann Dickerson, CAD Consulting
Wendy Takanish and John Cole, Hawaii Public Utilities Commission
ABSTRACT
Over the last several years, the market share for solar water heaters has steadily increased in the state of Hawaii. The Hawaiian government mandated that all new homes have solar water heaters installed, and the state offers incentives to homeowners who opt to purchase solar water heaters for their existing homes. The evaluation of savings and market conditions associated with this equipment is important as other markets consider the energy savings potential of solar water heating technology. This paper provides the results of a billing analysis used to estimate savings of residential solar water heaters in the state of Hawaii and feedback from consumers and contractors on the remaining potential.
The billing analysis was conducted with a monthly panel data regression model using utility billing data and program tracking data for 2,457 customers who installed solar water heaters during program year 2009, estimating changes in household electricity consumption between the pre- and post-installation periods.
The results of this paper are significant because they help provide an updated savings value for solar water heaters in Hawaii and give a current assessment of market conditions. While Hawaii’s climate is unique, these savings and market findings can assist other regions in tapping solar water heater potential in their markets. These results will be of interest to other states with sunny climates that have a high solar energy potential. Introduction, Background, and Summary of Findings
This paper presents the results of a solar water heater billing analysis conducted as part of
a larger evaluation of Hawaii Energy’s conservation and efficiency programs. The analysis focused on the residential installation of solar water heaters for the program year 2009 (PY2009) and 2010 (PY2010).1 This paper also presents some findings on the condition of the market for solar water heaters in Hawaii.
The Hawaiian market for solar energy efficiency equipment is somewhat different from the rest of the country. To start, Hawaii’s climate and abundance of sunshine make it an ideal locale for the success of a measure like solar water heaters. In addition, the high energy prices that Hawaiian consumers face provide even more reason to invest in a technology like solar water heating.
Interest in solar water heating and renewable energy as a whole has a long history in Hawaii. As early as 1976, Hawaii provided energy tax credits for residents and businesses that purchased and installed renewable energy systems, including solar water heaters. In 1996 a
������������ ����������� ��������������� �������������������������������� ������������������������� ��!������"���#�$������ ����������"��������������
1-341©2012 ACEEE Summer Study on Energy Efficiency in Buildings

rebate was made available through the public benefit fund of Hawaii Energy Efficiency Programs. The public benefits fund was originally collected and administered by Hawaii Electric Company (HECO) and Maui Electric Company (MECO). Since 2009, the energy efficiency programs and rebates have been administered through Hawaii Energy. Rebates for solar water heaters are currently funded by the public benefits fee paid into by ratepayers along with some funding from the American Recovery and Reinvestment Act (ARRA).
Hawaii Energy is a third-party organization that implements conservation and energy efficiency programs throughout Hawaii. They operate a portfolio of programs that cover the residential and commercial sectors, with some programs targeted specifically toward new construction and residential low-income customers. The solar water heater program is currently a part of their residential program offerings. The last time these programs were evaluated was in 2008 when KEMA, Inc. conducted an impact evaluation of the 2005-2007 program cycle of the residential and commercial portfolio.
Our analysis focused on the solar water heater program since coming under the control of Hawaii Energy in 2009. Total solar water heater program participation for PY2009 and PY2010 is shown in Table 1. In our final model, participants from PY2010 are used as a control group to determine the savings realized by PY2009 participants, as the PY2010 participants had not yet installed the solar water heater in 2009 (the year used for the billing analysis). Including the PY2010 customers in the sample provides an additional control for external influences (e.g., economic conditions, household and structural changes) that may impact energy use.
Table 1. Solar Water Heater Participants
Program Year Number of Participants
2009 3,607 2010 2,695 Total 6,302
The annual savings estimate for solar water heaters found as a result of this analysis is
shown below in Table 2, along with a 95 percent confidence interval. Our impact estimate of 1,912 kWh is close to the current ex ante savings value of 2,066 kWh included in the Hawaii Energy PY2010 Technical Reference Manual (TRM).2 Given that the savings estimates are so close, we did not recommend any change to the TRM value currently in use by the program.
Table 2. Savings Estimate and 95% Confidence Interval
Annual Savings (kWh)
95 % Conf. Interval LOWER BOUND
95 % Conf. Interval UPPER BOUND
Current TRM Value (kWh)
1,912 1,714 2,111 2,066 Source: Analysis by Evergreen Economics of data provided by Hawaii Energy
��%&�'(�����%)*���!����!����������++�#,&����$��"����&����-�!��������$ �.�*/�0 ������&����12���3��������"��"���"�������������������&� &�� ��""���������&��������&�������������" ��
1-342©2012 ACEEE Summer Study on Energy Efficiency in Buildings

Billing Regression For the billing regression, we developed a fixed effects billing regression model using
monthly panel data to estimate changes in household electricity consumption between the baseline (“pre”) and post-measure-installation periods. The billing regression model relates normalized monthly electricity consumption by household by month to:
1. An indicator variable for the months in which the solar water heater was installed 2. Monthly dummy variables to control for external factors3 3. Interaction terms between the indicator for solar water heater installation and monthly
dummy variables
Interactions between the first two independent variables were examined and ultimately included in the model. The final model was estimated using the linear values of the dependent and independent variables.4 While a number of different specifications were explored, the final fixed effects model was specified as follows:
kWhit � �0 � �1SWHit � �2Monthit ��3Monthit * SWHit � eit
Where:kWh = Normalized monthly electricity consumption for each month (in kWh)
SWH = Indicator variable for post-period solar water heater installation periodMonth = Indicator variables for each month excluding December
Month * SWH = Interaction terms between indicator for post-period solar water heater installation and monthly indicators
i = Index for household (i = 1,..., n)t =Index for monthly time period (t=1,2,..., T)
�0,...,�3,� �= Coefficients to be estimated in the model
e� �= Error term assummed normally distributed
Data Used in Analysis
Monthly electricity billing data and information related to the timing of solar water heater installation were provided by Hawaii Energy for participants in program years 2009 and 2010. Utility billing data were provided from April 2008 to July 2011.
Weather or temperature data were not included in this analysis since water heater use is not greatly affected by daily outdoor temperature and temperatures are relatively constant throughout the year in Hawaii. However, monthly indicator variables were included in the final
��4 �$������� ��""�����!��"���� �� �������� �$����"�"��!����$����5�/�������"�����&��������!����������������������&�"�"��!����$���"6����&��"�"��!����$���$ ��&�������������� �����
1-343©2012 ACEEE Summer Study on Energy Efficiency in Buildings

model specification to capture any seasonal or monthly effects that may exist. Variables included in the billing regression model are defined below in
Table 3.
Table 3. Description of Model Variables Variable Description kWh Normalized monthly electricity consumption by month (calculated by scaling
usage from number of meter read days to the average number of days per month) SWH Indicator variable for months after solar water heater installation (equals 1 if in
post-installation period; else equals 0) Month (January, February, March, etc.)
A vector of indicator variables for month of year (equals 1 if observation falls in that month; else equals 0)
Month_SWH (Jan_SWH, Feb_SWH, Mar_SWH, etc.)
A vector of indicator variables for month of year and solar water heater installation (equals 1 if in post-installation period and observation falls in that month; else equals 0)
Data screens were employed to ensure that only participants within a reasonable
consumption range were included in the analysis. This data screen was based on monthly kWh usage and participants were selected for analysis if their monthly usage fell between 50 and 3,000 kWh. The effect of implementing this screen on the data is shown in Table 4 below.
Table 4. Summary of Data Screens
Program Year Total Participants Participants with Billing Data
Participants Meeting kWh
Criteria 2009 3,607 3,606 2,457 2010 2,695 2,693 1,951 Total 6,302 6,299 4,408
Source: Analysis by Evergreen Economics of data provided by Hawaii Energy
This data screen was used in the final model presented in this paper. Column four of Table 4 shows the number of individual participants included in the final model. Pre- and post-installation data were included for all 2,457 PY2009 participants shown in this table. The 1,951 participants from PY2010 were included as a control group, and as such only their pre-installation billing data were included in the analysis.
Billing Model Estimation Results
The results from the billing regression model are shown below in Table 5. All of the
estimated coefficients are of the expected sign (either negative or positive) and the primary variable of interest (SWH) is statistically significant at the 5 percent level. About half of the monthly indicator variables are statistically significant at the 5 percent level as well. The coefficients on monthly indicators and interaction terms show that kWh usage varies by month, with February, March, April, and May showing statistically significant lower usage per month, on average, than December (the omitted variable).
1-344©2012 ACEEE Summer Study on Energy Efficiency in Buildings

The coefficient of interest with respect to solar water heater energy savings is �1 (the coefficient on the post-installation indicator). This coefficient is negative, indicating that, after accounting for monthly variations in electricity usage and holding all else constant, participants experienced an estimated base decrease of 159.37 kWh per month after installation of a solar water heater. This translates to an annual savings of 1,912 kWh due to the solar water heater installation.
Note that this result captures all changes in usage in the post period and attributes them to the solar water heater installation. To the extent that there are external influences that are reducing energy use outside the program and are not controlled for in our model, then the savings estimates derived from the model will overstate the actual energy savings of the solar water heaters.
Table 5. Regression Results
Variable Coefficient Std. Error t-statistic p-value (�0) Constant 845.62 4.56 185.59 0.00 (�1) SWH -159.37 8.43 -18.90 0.00 (�2) January 13.14 6.56 2.00 0.05 (�2) February -27.05 6.79 -3.98 0.00 (�2) March -33.46 6.63 -5.04 0.00 (�2) April -39.69 6.86 -5.78 0.00 (�2) May -33.50 7.04 -4.76 0.00 (�2) June -7.60 6.23 -1.22 0.22 (�2) July -1.12 6.24 -0.18 0.86 (�2) August 11.26 6.32 1.78 0.08 (�2) September 7.61 6.31 1.21 0.23 (�2) October 1.69 6.38 0.27 0.79 (�2) November 4.93 6.57 0.75 0.45 (�3) January_SWH 8.37 11.77 0.71 0.48 (�3) February_SWH -6.30 12.06 -0.52 0.60 (�3) March_SWH 4.81 11.45 0.42 0.68 (�3) April_SWH -7.80 11.82 -0.66 0.51 (�3) May_SWH 5.20 11.82 0.44 0.66 (�3) June_SWH -10.30 11.17 -0.92 0.36 (�3) July_SWH -1.37 11.28 -0.12 0.90 (�3) August_SWH -2.33 12.51 -0.19 0.85 (�3) September_SWH -0.16 12.25 -0.01 0.99 (�3) October_SWH 6.43 12.26 0.52 0.60 (�3) November_SWH 4.54 12.31 0.37 0.71
Source: Analysis by Evergreen Economics of data provided by Hawaii Energy
The coefficient on SWH (�1) in Table 5 above was used to calculate the annual savings attributable to solar water heaters. The data used in the model was on a monthly basis, so the coefficient estimate of -159.37 indicates that an average of 159.37 kWh in savings were realized in each month that a solar water heater was installed. To get an annual savings value, this number was simply multiplied by 12. The formula used to calculate annual savings is shown below:
Estimated change in annual energy use due to Solar Water Heater = Coefficient on SWH * 12
1-345©2012 ACEEE Summer Study on Energy Efficiency in Buildings

Table 6 below shows the estimated annual savings for solar water heaters installed by PY2009 participants along with a 95 percent confidence interval and the existing savings value in Hawaii Energy’s PY2010 Technical Reference Manual (TRM).
Table 6. Billing Regression Savings Estimate and 95% Confidence Interval
Annual Savings (kWh)
95 % Conf. Interval LOWER BOUND
95 % Conf. Interval UPPER BOUND
2010 TRM Savings (kWh)
1,912 1,714 2,111 2,066 Source: Analysis by Evergreen Economics of data provided by Hawaii Energy
Comparison to Existing Savings Values
These billing regression results are slightly lower than, although generally consistent
with, the savings value calculated in the PY2010 TRM. The TRM value for solar water heater savings is 2,066 kWh annually and assumes an average household occupancy of 3.77 people. The average household occupancy reported by the surveyed PY2009 participants was 3.53, which is slightly lower than that assumed by the TRM. A lower occupancy is generally associated with less hot water use and consequently these households may see slightly smaller annual savings than the TRM suggests.
In addition, the annual kWh consumption of the sample households is lower than the average found in earlier solar water heater impact evaluations. The average annual base consumption in the model data was 10,147 kWh, whereas the annual base consumption found in the 2001-03 Impact Evaluation prepared by KEMA was 11,096 kWh. The kWh savings reported by KEMA for solar water heaters in that report was 2,201 kWh. The small difference in occupancy and base consumption between these groups may explain some of the difference in savings found by our analysis. Despite these differences, the TRM savings value of 2,066 kWh does fall within the 95 percent confidence interval of our estimated savings, indicating that our analysis confirms the existing value for solar water heaters.
Solar Water Heater Market Findings
The solar water heating market provides considerable opportunity for energy savings in
Hawaii. Based on the findings in this analysis, installed residential solar water heaters can save the average Hawaii household nearly 20 percent on their annual electric bill, which is equivalent to about $500 to $700 annually, depending on the electricity rate for each island.5 The expected lifetime of a solar water heater is 15 years, and the savings will persist over that time. These savings have been significant enough that the Hawaii State Senate passed SB no. 644, which requires all new single-family residences constructed after January 1, 2010 to include a solar water heater system. Despite this requirement for new residential homes, there is still a large market for retrofitting solar water heaters in existing homes. The current estimates are that roughly 75 percent of homes in Hawaii do not have a solar water heater system.
The Hawaii Energy solar water heater program recently transitioned its focus to retrofitted solar water heating systems in order to comply with the new Senate Bill that mandated solar water heating on all new homes. The retrofit market often consists of those customers that 1�/!�������"������ ��� �� ������������������������!���"������7���153���8�&�����7���3�����9�����
1-346©2012 ACEEE Summer Study on Energy Efficiency in Buildings

are the most difficult and costly to serve and, as a result, the incentive program is even more vital to installations of solar water heaters for this market segment. The incremental cost of a solar water heater is listed as $6,600 in the PY2010 TRM and has a rebate amount of $750. The additional electricity cost savings provided by the solar water heater adds an extra incentive for retrofit customers.
At the end of 2009 there was a significant rush of solar water heater installations by new construction builders and customers in order to take advantage of the rebate before the expiration date. There was also an initial boost in install rates at the beginning of the 2010 program year, and again at the end of calendar year 2010. In March 2011, Hawaii Energy was approved to use ARRA funding to double the cash rebate amount for solar water heater systems, which resulted in 800 systems being sold in one month and completely exhausting the additional approved funds.
The current solar water heater program is strong, and interviews with solar water heater contractors reveal that they see it as a reliable technology, which requires little more than routine maintenance. To assist in this routine maintenance, Hawaii Energy has started offering a rebate for solar water heater tune-ups in PY2011 at a cost of $250 to participants after a $50 rebate. In addition to contractor satisfaction with the equipment, participant surveys revealed that 97 percent of PY2009 participants and 96 percent of PY2010 participants were “somewhat satisfied” or “very satisfied” with their solar water heater purchase. Together these two results indicate that solar water heaters have a positive market presence in Hawaii.
Summary and Conclusions
Using a billing regression model and a sample of 2009 and 2010 solar water heater
participants, we estimated annual savings from this measure of 1,912 kWh. This generally confirms the savings value of 2,066 kWh in use by Hawaii Energy for PY2010, as that value lies within the 95 percent confidence interval of our savings estimate. The slight difference may be explained by lower occupancy rates and/or lower household energy consumption in our analysis sample relative to the values found in previous impact evaluations. For these reasons, we did not recommend any changes to the current ex ante value of 2,066 kWh used by Hawaii Energy for solar water heaters.
The market for solar water heaters in Hawaii now relies heavily on retrofitting water heating systems in existing homes due to the recent legislation requiring solar water heaters in all new construction projects. Our research found that there is still considerable potential in the retrofit market, and that incentives can be a substantial driver toward replacement. Additionally, interviews with contractors revealed that solar water heaters are a reliable technology that requires little maintenance and surveys of participants revealed high satisfaction rates with the installed equipment. References Hawaii Energy. 2011. Technical Reference Manual (TRM) No. 2010-1. Honolulu, HI. Hawaii Energy. 2011. Technical Reference Manual (TRM) No. 2011. Honolulu, HI.
1-347©2012 ACEEE Summer Study on Energy Efficiency in Buildings

Hawaiian Electric Company. Average Electric Rates for Hawaiian Electric Co., Maui Electric Co. and Hawaii Electric Light Co. http://www.heco.com/portal/site/heco/menuitem.508576f78baa14340b4c0610c510b1ca/?vgnextoid=692e5e658e0fc010VgnVCM1000008119fea9RCRD&vgnextchannel=10629349798b4110VgnVCM1000005c011bacRCRD&vgnextfmt=default&vgnextrefresh=1&level=0&ct=article
KEMA, Inc. 2008. Energy and Peak Demand Impact Evaluation Report of the 2005-2007
Demand Side Management Programs. Oakland, CA. KEMA-XENERGY, Inc. 2004. Energy and Peak Demand Impact Evaluation Report of the
2001-2003 Demand Side Management Programs. Oakland, CA.
1-348©2012 ACEEE Summer Study on Energy Efficiency in Buildings

��������
ATTACHMENT�5��
EPA�COMBINED�HEAT�AND�POWER�PARTNERSHIP�FUEL�AND�CARBON�DIOXIDE�EMISSIONS�SAVINGS�CALCULATION�METHODOLOGY�
FOR�COMBINED�HEAT�AND�POWER�SYSTEMS,�AUGUST�2012��
� �

Fuel and Carbon Dioxide Emissions Savings Calculation Methodology for Combined Heat and Power Systems
U.S. Environmental Protection Agency
Combined Heat and Power Partnership
August 2012

The U.S. Environmental Protection Agency (EPA) CHP Partnership is a voluntary program that seeks to reduce the environmental impact of power generation by promoting the use of CHP. The CHP Partnership works closely with energy users, the CHP industry, state and local governments, and other stakeholders to support the development of new CHP projects and promote their energy, environmental, and economic benefits.
The CHP Partnership provides resources about CHP technologies, incentives, emissions profiles, and other information on its website at www.epa.gov/chp. For more information, contact the CHP Partnership Helpline at [email protected] or (703) 373-8108.
i

Table of Contents
1.0 Introduction ....................................................................................................................................... 1
2.0 What Is CHP? ................................................................................................................................... 3
2.1 How CHP Systems Save Fuel and Reduce CO2 Emissions............................................................ 4
3.0 Calculating Fuel and CO2 Emissions Savings from CHP................................................................... 6
3.1 Fuel Use and CO2 Emissions from Displaced On-site Thermal Production and Displaced Grid Electricity ....................................................................................................................................... 7
3.1.1 Fuel Use and CO2 Emissions from Displaced On-site Thermal Production ............................. 7
3.1.2 Fuel Use and CO2 Emissions from Displaced Grid Electricity .................................................. 9
3.2 Fuel Use and CO2 Emissions of the CHP System ....................................................................... 10
Appendix A: EPA CHP Emissions Calculator Example Calculation........................................................ 13
Appendix B: Displaced Grid Electricity Fuel Use and CO2 Emissions..................................................... 20
ii

1.0 Introduction
Amid growing concerns about energy security, energy prices, economic competitiveness, and climate change, combined heat and power (CHP) has been recognized for its significant benefits and the part it can play in efficiently meeting society’s growing energy demands while reducing environmental impacts. Policy makers, project developers, end users, and other CHP stakeholders often need to quantify the fuel and carbon dioxide (CO2) emissions savings of CHP projects compared to conventional separate heat and power (SHP) in order to estimate projects’ actual emissions reductions. An appropriate quantification of the energy and CO2 emissions savings from CHP plays a critical role in defining its value proposition. At this time, there is no established methodology to quantify and make this estimation.
This paper provides the EPA Combined Heat and Power Partnership’s (the Partnership) recommended methodology for calculating fuel and CO2 emissions savings from CHP compared to SHP.1 This methodology recognizes the multiple outputs of CHP systems and compares the fuel use and emissions of the CHP system to the fuel use and emissions that would have normally occurred in providing energy services through SHP.
Although the methodology recommended in this paper is useful for the specific purposes mentioned above, it is not intended as a substitute methodology for organizations quantifying and reporting GHG inventories. EPA recommends that organizations use accepted GHG protocols, such as the World Resources Institute’s Greenhouse Gas Protocol2 or The Climate Registry’s General Reporting Protocol3, when calculating and reporting a company’s carbon footprint.
However, the CO2 emissions savings amounts estimated using the methodology recommended in this paper can be reported as supplemental information in an organization’s public disclosure of its GHG inventory in order to help inform stakeholders of the emissions benefits of CHP and to highlight the organization’s commitment to energy-efficient and climate-friendly technologies.
Summary of Key Points
• To calculate the fuel and CO2 emissions savings of a CHP system, both electric and thermal outputs of the CHP system must be accounted for.
• The CHP system’s thermal output displaces the fuel normally consumed in and emissions emitted from on-site thermal generation in a boiler or other equipment, and the power output displaces the fuel consumed and emissions from grid electricity.
• To quantify the fuel and CO2 emissions savings of a CHP system, the fuel use of and emissions released from the CHP system are subtracted from the fuel use and emissions that would normally occur without the system (i.e., using SHP).
• A key factor in estimating the fuel and CO2
emissions savings for CHP is determining the heat rate and emissions factor of the displaced grid electricity. EPA’s Emissions & Generation Resource Integrated Database (eGRID) is the recommended source for these factors. See Appendix B for information about these inputs.
1 CHP can also reduce emissions of methane and nitrous oxide along with other air pollutants. Although methane and nitrous oxide are not discussed in this paper they are accounted for in the CHP Emissions Calculator. The CHP Emissions Calculator is available at: http://www.epa.gov/chp/basic/calculator.html. 2 The Greenhouse Gas Protocol is available at: http://www.ghgprotocol.org/. 3 The Climate Registry General Reporting Protocol is available at: http://www.theclimateregistry.org/resources/protocols/general-reporting-protocol/.
1

The paper is organized as follows:
• Section 2 introduces CHP and explains the basis for fuel and CO2 emissions savings from CHP compared to SHP.
• Section 3 presents a methodology for calculating the fuel and CO2 emissions savings from CHP. • Appendix A presents a sample calculation of fuel and CO2 emissions savings using the EPA CHP
Emissions Calculator.4
• Appendix B explains the use of EPA’s Emissions & Generation Resource Integrated Database (eGRID) as a source for two important variables in the calculation of fuel and CO2 emissions savings from displaced grid electricity: displaced grid electricity heat rate5 and CO2 emissions factors. It also describes how to select values for these variables.
4 The EPA CHP Emissions Calculator is available at: http://www.epa.gov/chp/basic/calculator.html. 5 Heat rate is the ratio of fuel energy input as heat (Btu) per unit of net power output (kWh).
2

2.0 What Is CHP?
Combined heat and power (CHP) is a highly efficient method of providing power and useful thermal energy (heating or cooling) at the point of use with a single fuel source. By employing waste heat recovery technology to capture a significant portion of the heat created as a by-product of fuel use, CHP systems typically achieve total system efficiencies of 60 to 80 percent. An industrial or commercial entity can use CHP to produce electricity and thermal energy instead of obtaining electricity from the grid and producing thermal energy in an on-site furnace or boiler. In this way, CHP can provide significant energy efficiency, cost savings, and environmental benefits compared to the combination of grid-supplied electricity and on-site boiler use (referred to as separate heat and power or SHP).
CHP plays important roles both in efficiently meeting U.S. energy needs and in reducing the environmental impact of power generation. Currently, CHP systems represent approximately 8 percent of the electric generating capacity in the United States.6 Benefits of CHP include:
• Efficiency benefits: CHP requires less fuel than SHP to produce a given energy output, and because electricity is generated at the point of use, transmission and distribution losses that occur when electricity travels over power lines from central power plants are displaced.
• Reliability benefits: CHP can be designed to provide high-quality electricity and thermal energy on site without relying on the electric grid, decreasing the impact of outages and improving power quality for sensitive equipment.
• Environmental benefits: Because less fuel is burned to produce each unit of energy output, CHP reduces emissions of greenhouse gases (GHG) and other air pollutants.
• Economic benefits: Because of its efficiency benefits, CHP can help facilities save money on energy. Also, CHP can provide a hedge against fluctuations in electricity costs.
In the most common type of CHP system, known as a topping cycle (see Figure 1), fuel is used by a prime mover7 to drive a generator to produce electricity, and the otherwise-wasted heat from the prime mover is recovered to provide useful thermal energy. Examples of the two most common topping cycle CHP configurations are:
• A reciprocating engine or gas turbine burns fuel to generate electricity and a heat recovery unit captures heat from the exhaust and cooling system. The recovered heat is converted into useful thermal energy, usually in the form of steam or hot water.
• A steam turbine uses high-pressure steam from a fired boiler to drive a generator producing electricity. Low-pressure steam extracted from or exiting the steam turbine is used for industrial processes, space heating or cooling, domestic hot water, or for other purposes.
6 CHP Installation Database developed by ICF International for Oak Ridge National Laboratory and the U.S. DOE; 2012. Available at http://www.eea-inc.com/chpdata/index.html. 7 Prime movers are the devices (e.g., reciprocating engine, gas turbine, microturbine, steam turbine) that convert fuels to electrical energy via a generator.
3

Figure 1: Typical Reciprocating Engine/Gas Turbine CHP Configuration (Topping Cycle)
In another type of CHP system, known as a bottoming cycle, fuel is used for the purpose of providing thermal energy in an industrial process, such as a furnace, and heat from the process that would otherwise be wasted is used to generate power.
2.1 How CHP Systems Save Fuel and Reduce CO2 Emissions
CHP’s efficiency benefits result in reduced primary energy8 use and thus lower CO2 emissions.
Figure 2 shows the efficiency advantage of CHP compared to SHP.9 CHP systems typically achieve total system efficiencies of 60 to 80 percent compared to about 45 to 55 percent for SHP. As shown in Figure 2, CHP systems not only reduce the amount of total fuel required to provide electricity and thermal energy, but also shift where that fuel is used. Installing a CHP system on site will generally increase the amount of fuel that is used at the site, because additional fuel is required to operate the CHP system compared to the equipment that otherwise would have been used on site to produce needed thermal energy.
In the example shown in Figure 2, the on-site fuel use increases from 56 units in the SHP case to 100 units in the CHP case. However, despite this increase in on-site fuel use, the total fuel used to provide the facility with the required electrical and thermal energy drops from 147 units in the SHP case, to 100 units in the CHP case, a 32 percent decrease in the amount of total fuel used.
8 Primary energy is the fuel that is consumed to create heat and/or electricity. 9 Like Figure 1, Figures 2 and 3 illustrate the most common CHP configuration known as the topping cycle. See section 2.0 for more information.
4

Figure 2: Energy Efficiency - CHP Versus Separate Heat and Power (SHP) Production (Topping Cycle)
Note: Conventional power plant delivered efficiency of 33% (higher heating value [HHV]) is based on eGRID 2012 (2009 data) and reflects the national average all fossil generating efficiency of 35.6% and 7% transmission and distribution losses. eGRID provides information on emissions and fuel resource mix for individual power plants, generating companies, states, and subregions of the power grid. eGRID is available at http://www.epa.gov/cleanenergy/energy-resources/egrid/index.html.
Using less fuel to provide the same amount of energy reduces CO2 and other emissions. Figure 3 shows the annual CO2 emissions savings of a natural gas combustion turbine CHP system compared to SHP. In this case, the CHP system produces about half the annual CO2 emissions of SHP while providing the same amount of energy to the user.
Figure 3: CO2 Emissions - CHP Versus Separate Heat and Power (SHP) Production (Topping Cycle)
Note: Emissions savings are based on the efficiencies included in Figure 2 for SHP and a 5 MW gas turbine CHP system and 7,000 annual operating hours. Power plant CO2 emissions are based on eGRID 2012 national all fossil generation average (2009 data).
5

3.0 Calculating Fuel and CO2 Emissions Savings from CHP
To calculate the fuel or CO2 emissions savings of a CHP system, both outputs of the CHP system— thermal energy and electricity—must be accounted for. The CHP system’s thermal output typically displaces the fuel otherwise consumed in an on-site boiler, and the electric output displaces fuel consumed at central station power plants.10 Moreover, the CHP system’s electric output also displaces fuel consumed to produce electricity lost during transmission and distribution.
The displaced fuel use and CO2 emissions associated with the operation of a CHP system can be determined by:
a. Calculating the fuel use and emissions from displaced separate heat and power (SHP) (i.e., grid-supplied electricity and on-site thermal generation such as a boiler) b. Calculating the fuel use and emissions from CHP c. Subtracting (b) from (a)
Equation 1 presents the recommended approach for calculating the fuel savings of a CHP system. Equation 2 presents the recommended approach for calculating CO2 emissions savings of a CHP system.
Note: Sections 3.1 and 3.2 present the approaches for calculating the individual terms found in Equations 1 and 2. Appendix A presents a sample calculation of CO2 savings using the EPA CHP Emissions Calculator which uses the methodology and equations outlined in this section.
Equation 1: Calculating Fuel Savings from CHP
FS = (FT + FG) – FCHP
where:
FS = Total Fuel Savings (Btu) FT = Fuel Use from Displaced On-site Thermal Production (Btu) FG = Fuel Use from Displaced Grid Electricity (Btu) FCHP = Fuel Used by the CHP System (Btu)
Step 1: Calculate FT and FG using Equation 3 (page 8) and Equation 6 (page 10), respectively.
Step 2: Calculate FCHP through direct measurement or using Equations 8 (page 11), 9 (page 11) or 10 (page 12).
Step 3: Calculate FS.
10 The thermal output from CHP can also be used to produce cooling in an absorption or adsorption chiller. Accounting for cooling introduces complexities that are not addressed in the methodology presented in this paper. However, the CHP Emissions Calculator does account for cooling.
6
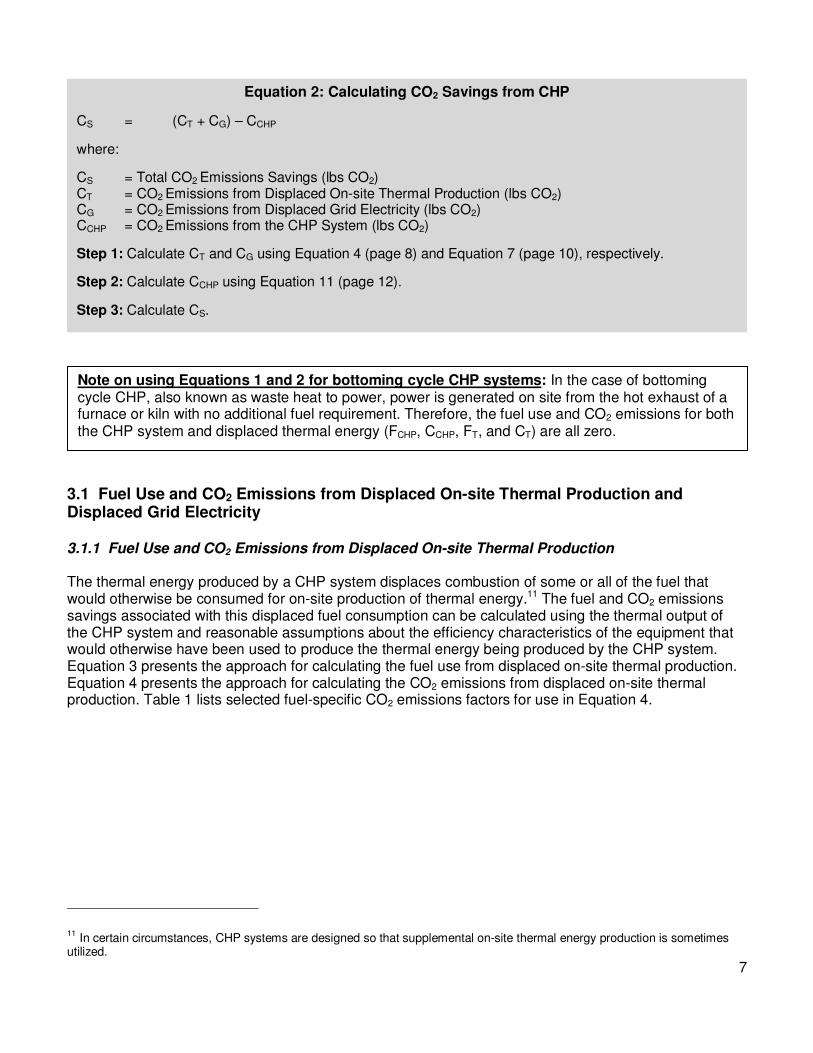
Equation 2: Calculating CO2 Savings from CHP
CS = (CT + CG) – CCHP
where:
CS = Total CO2 Emissions Savings (lbs CO2) CT = CO2 Emissions from Displaced On-site Thermal Production (lbs CO2) CG = CO2 Emissions from Displaced Grid Electricity (lbs CO2) CCHP = CO2 Emissions from the CHP System (lbs CO2)
Step 1: Calculate CT and CG using Equation 4 (page 8) and Equation 7 (page 10), respectively.
Step 2: Calculate CCHP using Equation 11 (page 12).
Step 3: Calculate CS.
Note on using Equations 1 and 2 for bottoming cycle CHP systems: In the case of bottoming cycle CHP, also known as waste heat to power, power is generated on site from the hot exhaust of a furnace or kiln with no additional fuel requirement. Therefore, the fuel use and CO2 emissions for both the CHP system and displaced thermal energy (FCHP, CCHP, FT, and CT) are all zero.
3.1 Fuel Use and CO2 Emissions from Displaced On-site Thermal Production and Displaced Grid Electricity
3.1.1 Fuel Use and CO2 Emissions from Displaced On-site Thermal Production
The thermal energy produced by a CHP system displaces combustion of some or all of the fuel that would otherwise be consumed for on-site production of thermal energy.11 The fuel and CO2 emissions savings associated with this displaced fuel consumption can be calculated using the thermal output of the CHP system and reasonable assumptions about the efficiency characteristics of the equipment that would otherwise have been used to produce the thermal energy being produced by the CHP system. Equation 3 presents the approach for calculating the fuel use from displaced on-site thermal production. Equation 4 presents the approach for calculating the CO2 emissions from displaced on-site thermal production. Table 1 lists selected fuel-specific CO2 emissions factors for use in Equation 4.
11 In certain circumstances, CHP systems are designed so that supplemental on-site thermal energy production is sometimes utilized.
7
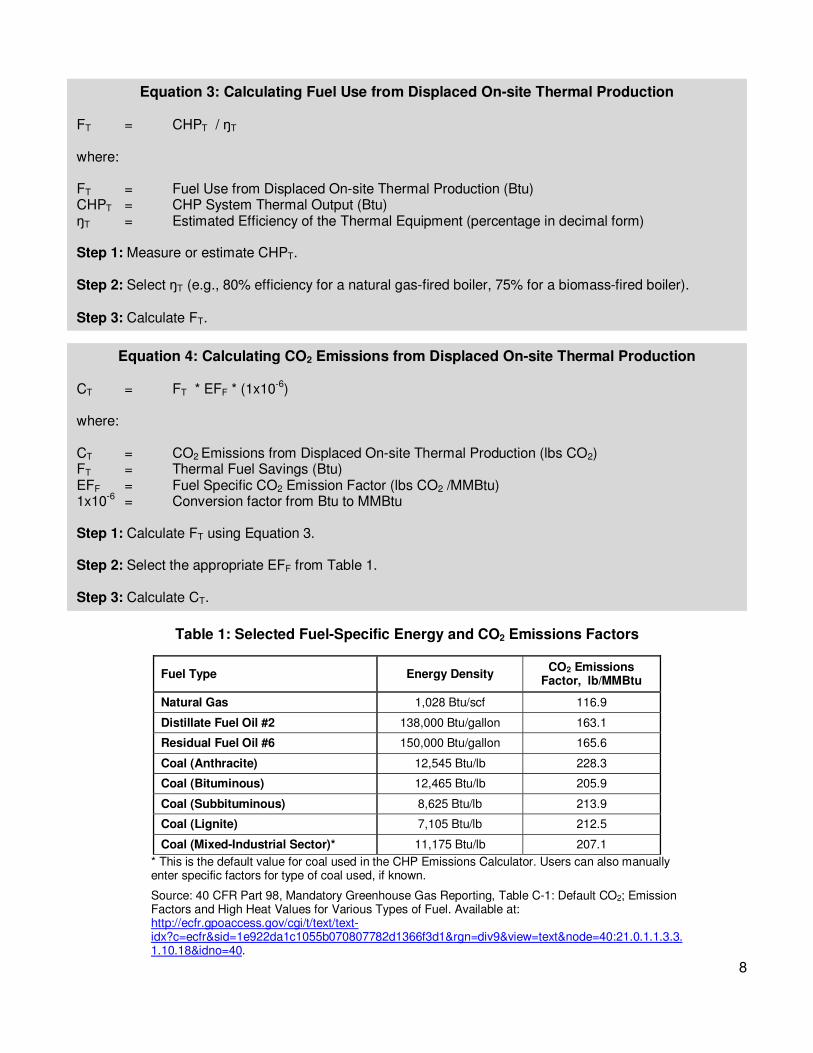
Equation 3: Calculating Fuel Use from Displaced On-site Thermal Production
FT = CHPT / �T
where:
FT = Fuel Use from Displaced On-site Thermal Production (Btu) CHPT = CHP System Thermal Output (Btu) �T = Estimated Efficiency of the Thermal Equipment (percentage in decimal form)
Step 1: Measure or estimate CHPT.
Step 2: Select �T (e.g., 80% efficiency for a natural gas-fired boiler, 75% for a biomass-fired boiler).
Step 3: Calculate FT.
Equation 4: Calculating CO2 Emissions from Displaced On-site Thermal Production
CT = FT * EFF * (1x10⁻⁶)
where:
CT = CO2 Emissions from Displaced On-site Thermal Production (lbs CO2) FT = Thermal Fuel Savings (Btu) EFF = Fuel Specific CO2 Emission Factor (lbs CO2 /MMBtu) 1x10-6 = Conversion factor from Btu to MMBtu
Step 1: Calculate FT using Equation 3.
Step 2: Select the appropriate EFF from Table 1.
Step 3: Calculate CT.
Table 1: Selected Fuel-Specific Energy and CO2 Emissions Factors
Fuel Type Energy Density CO2 Emissions Factor, lb/MMBtu
Natural Gas 1,028 Btu/scf 116.9
Distillate Fuel Oil #2 138,000 Btu/gallon 163.1
Residual Fuel Oil #6 150,000 Btu/gallon 165.6
Coal (Anthracite) 12,545 Btu/lb 228.3
Coal (Bituminous) 12,465 Btu/lb 205.9
Coal (Subbituminous) 8,625 Btu/lb 213.9
Coal (Lignite) 7,105 Btu/lb 212.5
Coal (Mixed-Industrial Sector)* 11,175 Btu/lb 207.1 * This is the default value for coal used in the CHP Emissions Calculator. Users can also manually enter specific factors for type of coal used, if known.
Source: 40 CFR Part 98, Mandatory Greenhouse Gas Reporting, Table C-1: Default CO2; Emission Factors and High Heat Values for Various Types of Fuel. Available at: http://ecfr.gpoaccess.gov/cgi/t/text/text-idx?c=ecfr&sid=1e922da1c1055b070807782d1366f3d1&rgn=div9&view=text&node=40:21.0.1.1.3.3. 1.10.18&idno=40.
8

3.1.2 Fuel Use and CO2 Emissions from Displaced Grid Electricity
Grid electricity savings associated with on-site CHP include the grid electricity displaced by the CHP output and related transmission and distribution losses.
When electricity is transmitted over power lines, some of the electricity is lost. The amount delivered to users 12 is therefore less than the amount generated at central station power plants, usually by an average of about 6 to 9 percent.13,14 Consequently, generating 1 MWh of electricity on site means that more than 1 MWh of electricity no longer needs to be generated at central station power plants.15 Fuel and CO2 emissions savings from displaced grid electricity should therefore be based on the corresponding amount of displaced grid electricity generated and not on the amount of grid electricity delivered (and consumed).
Equation 5 presents the approach for calculating the displaced grid electricity from CHP. Once the displaced grid electricity from CHP is determined, the fuel use (Equation 6) and CO2 emissions (Equation 7) from displaced grid electricity can be calculated.
Note: Key factors needed to calculate the fuel use and CO2 emissions from displaced grid electricity are the heat rate and CO2 emissions factor for the grid electricity displaced. EPA’s Emissions & Generation Resource Integrated Database (eGRID) is the recommended source for these factors. CHP fuel and CO2 emissions savings calculations should be based on the heat rates and emissions factors of the eGRID subregion where the CHP system is located, utilizing the eGRID all fossil or non-baseload emissions factors as appropriate. See Appendix B for information about using eGRID.
Equation 5: Calculating Displaced Grid Electricity from CHP
EG = CHPE / (1-LT&D)
where:
EG = Displaced Grid Electricity from CHP (kWh) CHPE = CHP System Electricity Output (kWh) LT&D = Transmission and Distribution Losses (percentage in decimal form)
Step 1: Measure or estimate CHPE.
Step 2: Select LT&D. (Use the eGRID transmission and distribution loss value for the appropriate U.S. interconnect power grid*)
Step 3: Calculate EG.
* eGRID lists the estimated transmission and distribution loss for each of the five U.S. interconnect power grids (i.e., Eastern, Western, ERCOT, Alaska, and Hawaii). (eGRID Technical Support Document: http://www.epa.gov/cleanenergy/documents/egridzips/eGRID2012_year09_TechnicalSupportDocument.pdf).
12 For clarity, the amount of electricity generated by a central station power plant is referred to as “generated” electricity and the amount of electricity consumed by a facility supplied by the grid is referred to as “delivered” electricity. 13 EPA eGRID Technical Support Document. April 2012. http://www.epa.gov/cleanenergy/documents/egridzips/eGRID2012_year09_TechnicalSupportDocument.pdf 14 DOE Energy Information Administration. State Electricity Profiles. http://205.254.135.24/cneaf/electricity/st_profiles/e_profiles_sum.html 15 For example, assume a consumer without CHP requires 1.0 MWh of electricity each year and T&D losses equal 8%. The delivered electricity is 1.0 MWh/yr, and the generated electricity is 1.087 MWh/yr (= 1/(1-0.08)).
9

Equation 6: Calculating Fuel Use from Displaced Grid Electricity
FG = EG * HRG
where:
FG = Fuel Use from Displaced Grid Electricity (Btu) EG = Displaced Grid Electricity from CHP (kWh) HRG = Grid Electricity Heat Rate (Btu/kWh) for the appropriate subregion
Step 1: Determine EG using Equation 5.
Step 2: Select HRG for the appropriate subregion. (See Appendix B for information about appropriate values and eGRID as a source for grid electricity heat rates.)
Step 3: Calculate FG.
Equation 7: Calculating CO2 Emissions from Displaced Grid Electricity
CG = EG * EFG
where:
CG = CO2 Emissions from Displaced Grid Electricity (lbs CO2) EG = Displaced Grid Electricity from CHP (kWh) EFG = Grid Electricity Emissions Factor (lbs CO2 /kWh) for the appropriate subregion
Step 1: Determine EG using Equation 5.
Step 2: Select EFG for the appropriate subregion. (See Appendix B for information about appropriate values and eGRID as a source for grid electricity CO2 emission factors).
Step 3: Calculate CG.
3.2 Fuel Use and CO2 Emissions of the CHP System
The energy content of the fuel consumed by the CHP system (FCHP in Equation 1) can be determined through several methods. Direct measurement (option 1) produces the most accurate results, but if direct measurement is not an option the Partnership recommends the use of options 2, 3, or 4.
1) Direct measurement of the higher heating value (HHV) of the fuel consumed (typically in MMBtuHHV). No calculation required.
2) Converting the fuel volume into an energy value (Btu equivalent) using a fuel-specific energy density using Equation 8.
3) Converting the fuel weight into an energy value (Btu equivalent) using a fuel-specific energy density (mass basis) using Equation 9.
4) Applying the electrical efficiency of the CHP system to the CHP system’s electric output using Equation 10.
10

Equation 8: Calculating Energy Content of the Fuel Used by CHP from the Fuel Volume
FCHP = VF * EDF
where:
FCHP = Fuel Used by the CHP System (Btu) VF = Volume of CHP Fuel Used (cubic foot, gallon, etc.) EDF = Energy Density of CHP Fuel (Btu/cubic foot, Btu/gallon, etc.)
Step 1: Measure or estimate VF.
Step 2: Select the appropriate value of EDF. (See Table 1 on page 8)
Step 3: Calculate FCHP.
Equation 9: Calculating Energy Content of the Fuel Used by CHP from the Fuel Weight
FCHP = WF * EDF
where:
FCHP = Fuel Used by the CHP System (Btu) WF = Weight of CHP Fuel Used (lbs) EDF = Energy Density of CHP Fuel – Mass Basis (Btu/lb)
Step 1: Measure or estimate WF.
Step 2: Select the appropriate EDF. In order to be used here, the values in Table 1 (page 8) must be converted to a mass basis using the fuel-specific density.
Step 3: Calculate FCHP.
Equation 10: Calculating Energy Content of the Fuel Used by CHP from the CHP Electric Output
FCHP = (CHPE / EECHP) * 3412
where:
FCHP = Fuel Used by the CHP System (Btu) CHPE = CHP System Electricity Output (kWh) EECHP = Electrical Efficiency of the CHP System (percentage in decimal form) 3412 = Conversion factor between kWh and Btu
Step 1: Measure or estimate CHPE.
Step 2: Determine EECHP. (This value should account for parasitic losses, and is usually available in a product specification sheet provided by the manufacturer of the equipment.)
Step 3: Calculate FCHP.
11

The CO2 emissions from the CHP system are a function of the type and amount of fuel consumed. CO2
emissions rates are commonly presented as pounds of emissions per million Btu of fuel input (lb/MMBtu). Table 1 on page 8 lists common fuel-specific CO2 emissions factors. Equation 11 presents the approach for calculating CO2 emissions from a CHP system (CCHP in Equation 2).
Equation 11: Calculating CO2 Emissions from the CHP System
CCHP = FCHP * EFF
where:
CCHP = CO2 Emissions from the CHP System (lbs CO2) FCHP = Fuel Used by the CHP System (Btu) EFF = Fuel Specific Emissions Factor (lbs CO2 /MMBtu)
Step 1: Measure or calculate FCHP using Equations 8 (page 11), 9 (page 11), or 10 (page 12).
Step 2: Select the appropriate EFF from Table 1 on page 8.
Step 3: Calculate CCHP the CO2 emissions from the CHP system.
12

Appendix A: EPA CHP Emissions Calculator Example Calculation
The Partnership developed the EPA CHP Emissions Calculator to help users calculate the fuel and CO2
emissions reductions achieved by CHP compared to SHP.16 The default values in the Calculator are based on the guidelines in this paper. However, users can also input selected CHP system characteristics and emissions factors for CHP fuel, displaced thermal fuel, and displaced grid electricity.
The EPA CHP Emissions Calculator is available at: http://www.epa.gov/chp/basic/calculator.html.
The following example shows how a user would operate the CHP Emissions Calculator to determine the fuel and CO2 savings achieved by a CHP system. The example system is a 5 MW natural gas-fired combustion turbine and heat recovery boiler CHP system that provides heating for an industrial process at a facility in Pennsylvania. The CHP system is displacing thermal energy provided by an existing natural gas boiler and grid electricity in the RFC East subregion (the eGRID subregion that includes Pennsylvania).17
Calculator Input
The following figures show the calculator inputs that are needed to evaluate this system. Figure 4 shows the Calculator inputs related to the CHP system itself. For this example, the Calculator default values were used for the electric efficiency and the power-to-heat ratio of the CHP system.
16 The CHP Emissions Calculator also accounts for methane (CH4), nitrogen oxides (NOx), nitrous oxide (N2O), and sulfur dioxide (SO2). 17 Information about eGRID subregions is contained in Appendix B.
13

Figure 4: CHP Emissions Calculator – CHP System Characteristics
After entering the information about the CHP system to be evaluated, information is entered related to the displaced on-site thermal energy production (i.e., the thermal energy produced by the CHP system that replaces thermal energy formerly produced by an on-site boiler). Information about the thermal equipment and fuel provides the basis for calculating the displaced thermal fuel use and CO2 emissions. Figure 5 shows the Calculator inputs related to the displaced thermal energy.
14

Figure 5: CHP Emissions Calculator – Displaced Thermal Energy
The equations for calculating fuel use and CO2 emissions from displaced on-site thermal energy production are:
Fuel Use from Displaced On-site Thermal Energy Production (Equation 3):
FT = CHPT / �T
257,964 MMBtu/yr = 206,371 MMBtu/yr / 80%
where: FT = Fuel Use from Displaced On-site Thermal Production (Btu) CHPT = CHP System Thermal Output (Btu) �T = Thermal Equipment Efficiency (%)
CO2 Emissions from Displaced On-site Thermal Production (Equation 4):
CT = FT * EFF
30,155,992 lbs CO2 = 257,964 MMBtu/yr * 116.9 lb CO2/MMBtu
where: CT = CO2 emissions from displaced on-site thermal production (lbs CO2) FT = Thermal Fuel Savings (Btu) EFF = Fuel Specific Emissions Factor (lbs CO2/MMBtu)
The CHP Emissions Calculator inputs related to the displaced grid electricity are shown in Figure 6 below. eGRID emissions rates include: Total Output Emissions Rate, Fossil Fuel Output Emissions
15

Rate, and Non-Baseload Output Emissions Rate. The Partnership recommends using the Fossil Fuel Output Emissions Rate because it most accurately reflects the emissions of generation displaced by CHP(see eGRID information in Appendix B). The Partnership also recommends using the rate for the RFC East eGRID subregion which includes eastern Pennsylvania where this system is located. For transmission and distribution (T&D) losses, the Partnership recommends using the eGRID value for grid losses from the appropriate U.S. interconnect power grid. There are five U.S. interconnect power grids (Eastern, Western, ERCOT, Alaska, and Hawaii), and the appropriate grid for this example is the Eastern grid, with an average T&D losses of 5.82%.
Figure 6: CHP Emissions Calculator – Displaced Electricity
The total fuel use and CO2 emissions of displaced grid electricity are calculated using the following equations:
Displaced Grid Electricity from CHP (Equation 5):
EG = CHPE / (1-LT&D) 39,817.4 MWh/year = 37,500 MWh/year / (1 – 5.82%)
where: EG = Displaced Grid Electricity from CHP (kWh) CHPE = CHP System Electricity Output (kWh) LT&D = Transmission and Distribution Losses (%)
Fuel Use from Displaced Grid Electricity (Equation 6):
FG = EG * HRG
380,909 MMBtu/year = 39,817.4 MWh/year * 9,566 Btu/kWh / 1000
where: FG = Fuel Use from Displaced Grid Electricity (Btu) EG = Displaced Grid Electricity from CHP (kWh) HRG = Grid Electricity Heat Rate (Btu/kWh)
CO2 Emissions from Displaced Grid Electricity (Equation 7):
CG = EG * EFG
16

67,211,771,200 lbs CO2 = 39,817.4 MWh/year * 1,688 lb CO2/kWh * 1000
where: CG = CO2 Emissions from Displaced Grid Electricity (lbs) EG = Displaced Grid Electricity from CHP (kWh) EFG = Grid Electricity Emissions Factor (CO2 lb/kWh)
Calculator Results
Once the user has entered all of the information on the Inputs page of the Calculator and clicked the “Go to Results” button the Results page is displayed. Figure 7 illustrates the results for this example, which shows that the CHP system reduces overall fuel consumption by 196,018 MMBtu/year and CO2
emissions by 22,794 tons/year.
Figure 7: CHP Emissions Calculator – Fuel and Emissions Savings Results
17

The equations for the relationship for total fuel savings and CO2 savings are as follows:
Total Fuel Savings from CHP (Equation 1):
FS = (FT + FG) – FCHP
196,018 MMBtu/year = (257,964 MMBtu/year + 380,909 MMBtu/year) – 442,855 MMBtu/year
where: FS = Total Fuel Savings FT = Fuel Use from Displaced On-site Thermal Production FG = Fuel Use from Displaced Grid Electricity FCHP = Fuel Used by the CHP System
Total CO2 Savings from CHP (Equation 2):
CS = (CT + CG) – CCHP
22,794 lbs CO2 = (15,078 lbs + 33,601 lbs) – 25,885 lbs
where: CS = Total CO2 Emissions Savings CT = CO2 Emissions from Displaced On-site Thermal Production CG = CO2 Emissions from Displaced Grid Electricity CCHP = CO2 Emissions from the CHP System
Figure 8 shows the outputs of the CHP system in more detail, and Figure 9 shows the emissions rates for the CHP system as well as those from the displaced thermal production and displaced electricity generation.
Figure 8: CHP Emissions Calculator, CHP Outputs
18

Figure 9: CHP Emissions Calculator, Emissions Rates
19

Appendix B: Displaced Grid Electricity Fuel Use and CO2
Emissions
The displaced fuel use and CO2 emissions associated with the operation of a CHP system can be determined by:
a. Calculating the fuel use and emissions from displaced separate heat and power (SHP) (i.e., grid-supplied electricity and on-site thermal generation such as a boiler) b. Calculating the fuel use and emissions from CHP c. Subtracting (b) from (a)
The challenge of calculating the fuel use and emissions associated with displaced grid electricity stems from the fact that grid electricity is generated by a large number of sources with different fuels and different heat rates. The sources that are reasonably expected to be displaced must therefore be determined in order to estimate the displaced fuel use and emissions.
Section 3.1.1 of this paper presents the Partnership’s recommended methodology for calculating the fuel use and emissions from displaced thermal generation, and section 3.1.2 presents the recommended methodology for calculating the fuel use and emissions from displaced grid electricity. Section 3.2 presents the recommended methodology for calculating the fuel use and emissions from CHP.
This appendix complements the methodology provided in section 3.1.2 by:
• Discussing use of EPA’s Emissions & Generation Resource Integrated Database (eGRID) as a resource for the grid electricity heat rate (HRG) and the grid electricity emissions factor (EFG) needed to calculate the fuel and CO2 emissions associated with displaced grid electricity from CHP.
• Explaining why, when calculating fuel and CO2 emissions savings associated with CHP, the Partnership recommends using the following factors:
o the eGRID all fossil emissions factor and heat rate for the eGRID subregion where the CHP system is located for baseload CHP (i.e., greater than 6,500 annual operating hours), and
o the eGRID non-baseload emissions factor and heat rate for the eGRID subregion where the CHP system is located for CHP systems with relatively low annual capacity factors (i.e., less than 6,500 annual operating hours) and with most generation occurring during periods of high system demand.
B.1 EPA’s Emissions & Generation Resource Integrated Database (eGRID)
Background
EPA’s eGRID18 is a comprehensive and widely-used resource19 for information about electricity-generating plants that provide power to the electric grid and report data to the U.S. government. eGRID provides data on:
18 EPA has generated and published detailed information on electricity generation and emissions since 1998. The most recent edition of eGRID, eGRID2012 version 1.0, was released in 2012 and contains data collected in 2009. More information is available at. http://www.epa.gov/cleanenergy/energy-resources/egrid/index.html
20

• Generation (MWh) • Fuel use • Plant heat rate • Resource mix (e.g., coal, gas nuclear, wind, solar) • Emissions associated with power generation in the United States
In order to enhance the usability of this data, eGRID separates and organizes it into useful levels of aggregation, as follows:
• Plant • State • Electric generating company (EGC) • Power control area (PCA) • eGRID subregion • North American Electric Reliability Corporation (NERC) region • U.S. total
Note: • eGRID consists of historic sets of recent data; it does not include projections of the operating
characteristics of generating units in the future. • The generation data and related data categories provided by eGRID are based on generated
electricity, not consumed (i.e., delivered) electricity and therefore do not include the impact of transmission and distribution (T&D) losses (see Section 3.1.2 and Equation 5 for more information on T&D losses).
Aggregation Level – eGRID subregion
EPA defines eGRID subregions based on NERC regions and PCAs. There are 26 eGRID subregions (see Figure B-1) in eGRID2012, and each consists of one PCA or a portion of a PCA. eGRID subregions generally represent sections of the grid that have similar resource mix and emissions characteristics.
19 According to the eGRID Technical Support Document, more than 40 tools, applications, and programs (public and private) rely on eGRID data.
21

Figure B-1: eGRID Subregion Map20
Emissions and Heat Rate Data
eGRID presents the heat rate of each listed plant, and emissions data aggregated by fuel type and by generation source category (e.g., all fossil fuels). eGRID also presents emissions data for several pollutants—carbon dioxide (CO2), nitrogen oxides (NOX), sulfur dioxide (SO2), methane (CH4), nitrous oxide (N2O) and mercury (Hg)—in the form of emissions rates on an output basis (lb/MWh) and on a fuel input basis (lb/MMBtu).
Notes on Terminology. For the sake of clarity and consistency, eGRID emission rates (lb/MWh) are referred to in this appendix as emissions factors. Also note that, because this document addresses how to calculate avoided CO2 emissions, all subsequent references to eGRID emissions data in this appendix refer to CO2 emissions only.
Three types of generation rates provided in eGRID are discussed in this appendix21:
• Total Output The Total Output rates are based on data for all power generation regardless of energy source (i.e., fossil, nuclear, hydro, and renewables) within a defined region or subregion. One CO2
emissions factor (lb/MWh) and one heat rate (Btu/kWh) value are associated with the category for each NERC region and eGRID subregion.
20 Many of the boundaries shown on this map are approximate because they are based on company location rather than on strict geographical boundaries. 21 In addition to the three eGRID generation categories listed here, eGRID also includes an “annual combustion output” category. This category is not discussed in this appendix since it was primarily developed to estimate NOX and SO2 emissions from combustion generating units that are dispatched to respond to marginal increases in electricity demand, and thus not applicable to CO2 calculations involving CHP.
22
• Fossil Fuel Output The Fossil Fuel Output rates are based on data for power generation from fossil fuel-fired plants within a defined region or subregion. One CO2 emission factor (lb/MWh) and one heat rate (Btu/kWh) value are associated with the category for each NERC region and eGRID subregion. EPA characterizes this emissions factor as “a rough estimate to determine how much emissions could be avoided if energy efficiency and/or renewable energy displaces fossil fuel generation.”22
The EPA CHP Partnership’s CHP Emissions Calculator uses the emissions factor and heat rate from this category to determine emissions and fuel use from displaced grid electricity when evaluating CHP systems.23
eGRID also provides emissions factors by specific fossil fuel type (i.e., for coal-, natural gas-, and oil-fired generating plants). These emissions factors are useful in assessing the different impacts of fossil fuels, but they are rarely used to evaluate the relationship between CHP and displaced grid electricity emissions.
• Non-baseload Output The Non-baseload Output rates are based on data for power generation from combustion generating units within a defined region or subregion that do not serve as baseload units. One CO2 emissions factor (lb/MWh) and one heat rate (Btu/kWh) value are associated with the category for each NERC region and eGRID subregion. The term “baseload” refers to those plants that supply electricity to the grid even when demand for electricity is relatively low. Baseload plants are usually brought online to provide electricity to the grid regardless of the level of demand, and they generally operate continuously except when undergoing routine or unscheduled maintenance. EPA developed the non-baseload output emissions factors to estimate emissions reductions from energy efficiency projects and certain types of clean energy projects based on the emissions from generating units that are dispatched to respond to marginal increases in electricity demand.24 eGRID calculates the non-baseload factors by weighting each plant's emissions and generation according to its capacity factor. The generation and emissions from plants that operate most of the time, (that is, baseloaded plants with annual capacity factors greater than 0.8) are excluded. All the generation and emissions from fuel-based plants that operate infrequently during the year (for example, peaking units with capacity factors less than 0.2) are included. A portion of the emissions and generation from the remaining fuel-based plants (i.e., those with capacity factors between 0.2 and 0.8) are included, with higher portions used for plants with lower capacity factors and lower portions used for plants with higher capacity factors.
Table B-1 provides the all generation, all fossil, and non-baseload emissions factors from eGRID.
22 “EPA eGRID Technical Support Document. April 2012. http://www.epa.gov/cleanenergy/documents/egridzips/eGRID2012_year09_TechnicalSupportDocument.pdf 23 The CHP Emissions Calculator is available at: http://www.epa.gov/chp/basic/calculator.html 24 Rothschild, S. and Diem, A., “Guidance on the Use of eGRID Output Emissions Rates”, http://www.epa.gov/ttn/chief/conference/ei18/session5/rothschild.pdf
23