tata capital financial services limited annual report … · finance companies (“nbfc”)....
TRANSCRIPT

TATA CAPITAL FINANCIAL SERVICES LIMITED
Annual Report 2017-18
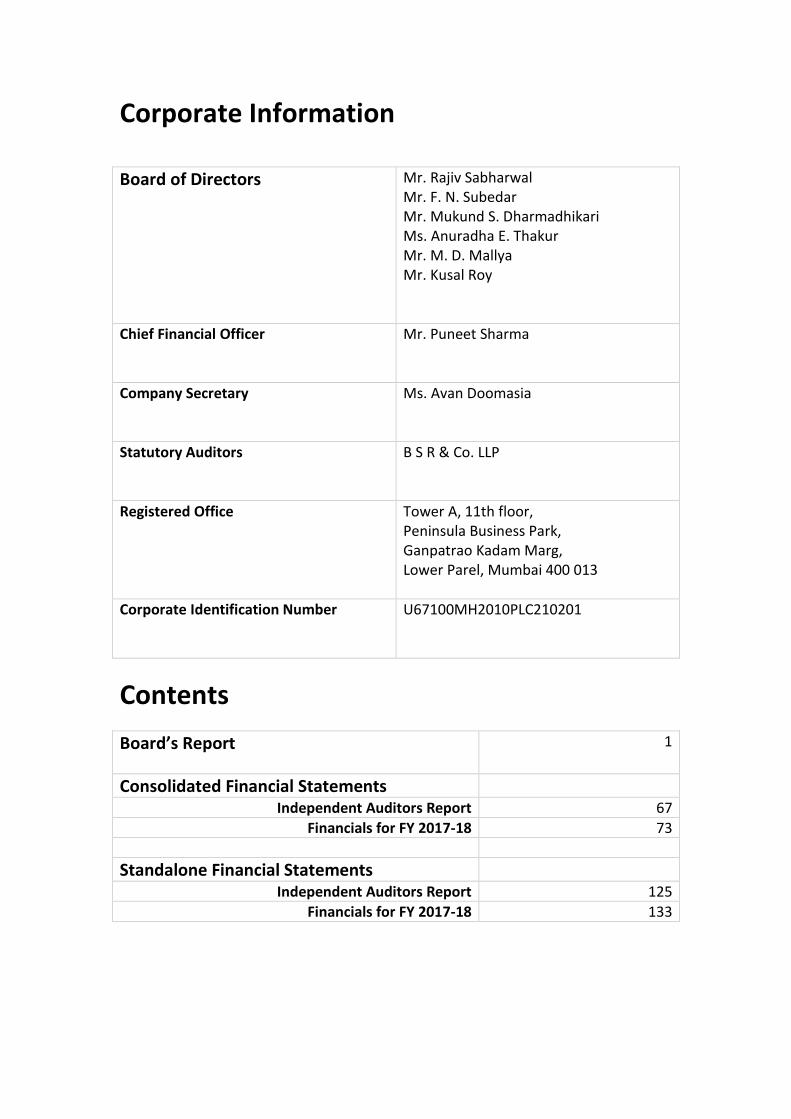
Corporate Information
Board of Directors
Mr. Rajiv Sabharwal Mr. F. N. Subedar Mr. Mukund S. Dharmadhikari Ms. Anuradha E. Thakur Mr. M. D. Mallya Mr. Kusal Roy
Chief Financial Officer Mr. Puneet Sharma
Company Secretary
Ms. Avan Doomasia
Statutory Auditors
B S R & Co. LLP
Registered Office
Tower A, 11th floor, Peninsula Business Park, Ganpatrao Kadam Marg, Lower Parel, Mumbai 400 013
Corporate Identification Number
U67100MH2010PLC210201
Contents
Board’s Report
1
Consolidated Financial Statements
Independent Auditors Report 67
Financials for FY 2017-18 73
Standalone Financial Statements
Independent Auditors Report 125
Financials for FY 2017-18 133
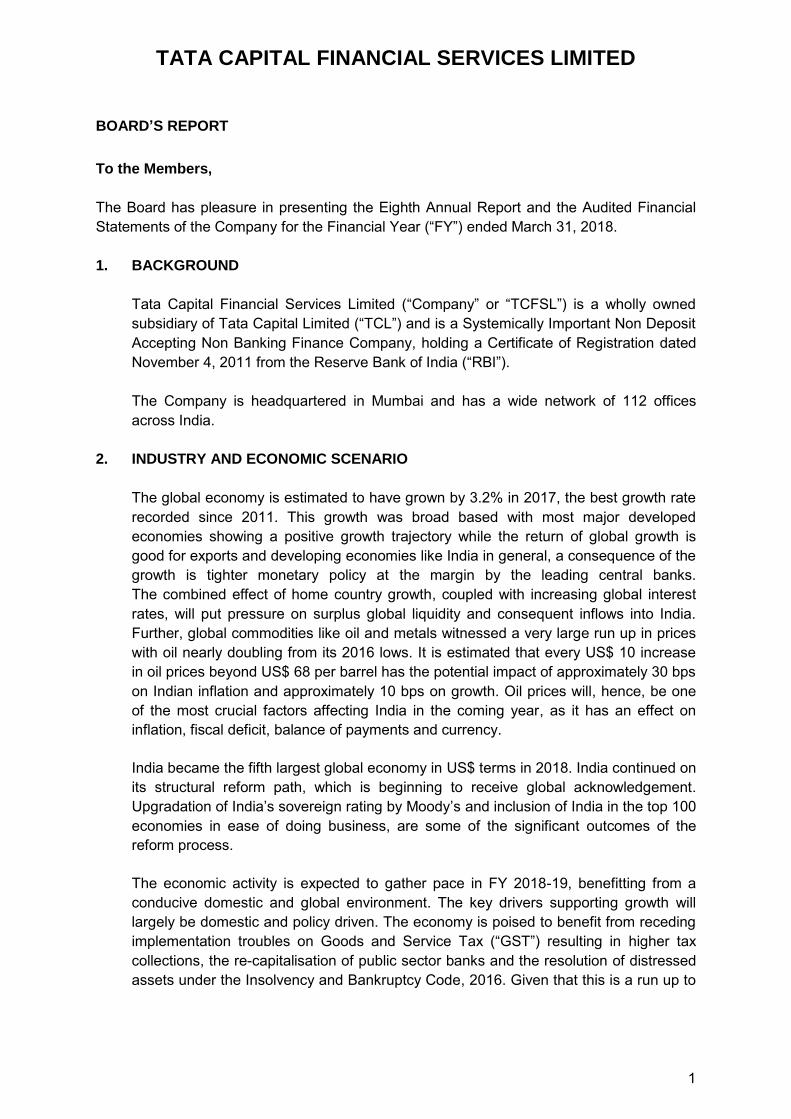
TATA CAPITAL FINANCIAL SERVICES LIMITED
BOARD’S REPORT
To the Members,
The Board has pleasure in presenting the Eighth Annual Report and the Audited Financial Statements of the Company for the Financial Year (“FY”) ended March 31, 2018. 1. BACKGROUND
Tata Capital Financial Services Limited (“Company” or “TCFSL”) is a wholly owned
subsidiary of Tata Capital Limited (“TCL”) and is a Systemically Important Non Deposit
Accepting Non Banking Finance Company, holding a Certificate of Registration dated November 4, 2011 from the Reserve Bank of India (“RBI”).
The Company is headquartered in Mumbai and has a wide network of 112 offices across India.
2. INDUSTRY AND ECONOMIC SCENARIO
The global economy is estimated to have grown by 3.2% in 2017, the best growth rate recorded since 2011. This growth was broad based with most major developed economies showing a positive growth trajectory while the return of global growth is good for exports and developing economies like India in general, a consequence of the growth is tighter monetary policy at the margin by the leading central banks. The combined effect of home country growth, coupled with increasing global interest rates, will put pressure on surplus global liquidity and consequent inflows into India. Further, global commodities like oil and metals witnessed a very large run up in prices with oil nearly doubling from its 2016 lows. It is estimated that every US$ 10 increase in oil prices beyond US$ 68 per barrel has the potential impact of approximately 30 bps on Indian inflation and approximately 10 bps on growth. Oil prices will, hence, be one of the most crucial factors affecting India in the coming year, as it has an effect on inflation, fiscal deficit, balance of payments and currency.
India became the fifth largest global economy in US$ terms in 2018. India continued on its structural reform path, which is beginning to receive global acknowledgement. Upgradation of India’s sovereign rating by Moody’s and inclusion of India in the top 100 economies in ease of doing business, are some of the significant outcomes of the reform process.
The economic activity is expected to gather pace in FY 2018-19, benefitting from a conducive domestic and global environment. The key drivers supporting growth will largely be domestic and policy driven. The economy is poised to benefit from receding implementation troubles on Goods and Service Tax (“GST”) resulting in higher tax collections, the re-capitalisation of public sector banks and the resolution of distressed assets under the Insolvency and Bankruptcy Code, 2016. Given that this is a run up to
1

TATA CAPITAL FINANCIAL SERVICES LIMITED
the election year, the Government’s thrust on Rural and Infrastructure sectors could
rejuvenate Rural demand as well as Infrastructure and Consumer spending.
The problem of Non-Performing Assets (“NPA”) in the banking sector is expected to peak by March 2019 at approximately 11% of gross banking advances. This will constrain the banking system from growing in aggregate. The changing behaviour of the retail consumer is reflected in credit off-take becoming increasingly broad-based and Financialisation of savings. All of these factors augur well for Non - Banking Finance Companies (“NBFC”).
Inflation decline in the month of February 2018 was only temporary and inflation is expected to remain within RBI’s tolerance limits. RBI is, hence, expected to remain
neutral on the policy rate front for most part of FY 2018-19, unless there is clearly an oil price based shock to inflation.
The Company has a cautiously optimistic outlook for the next financial year. Improving growth dynamics, domestic consumption and infrastructure spending and supportive tailwinds from global growth are likely positives for FY 2018-19. The Company will be closely watching the monsoons, timing of monetary policy tightening by the large central banks in advanced economies, protectionist tendencies of large global economies as they have the ability to impact liquidity and inflation, both critical variables impacting our largest resource – “Money”.
3. FINANCIAL RESULTS
3.1 Standalone Results
3.1.1 The performance of the Company for the Financial Year ended March 31, 2018,
on a Standalone basis is, summarized below: (Rs. in crore)
Particulars FY 2017-18 FY 2016-17 Gross Income 4,555 4,192 Less: Finance Costs 2,231 2,212 Establishment, Administrative and Other Expenses 1,340 1,500 Amortisation of expenses 6 5 Depreciation 236 143 Profit Before Tax 742 332 Less: Provision for Tax 259 116 Profit After Tax 483 216 Amount brought forward from previous year 375 324 Amount available for appropriation 858 540 Appropriations: Special Reserve Account 96 43 Debenture Redemption Reserve - - Interim Dividend on Equity Shares 45 59 Interim Dividend on Preference Shares 87 42
2
TATA CAPITAL FINANCIAL SERVICES LIMITED
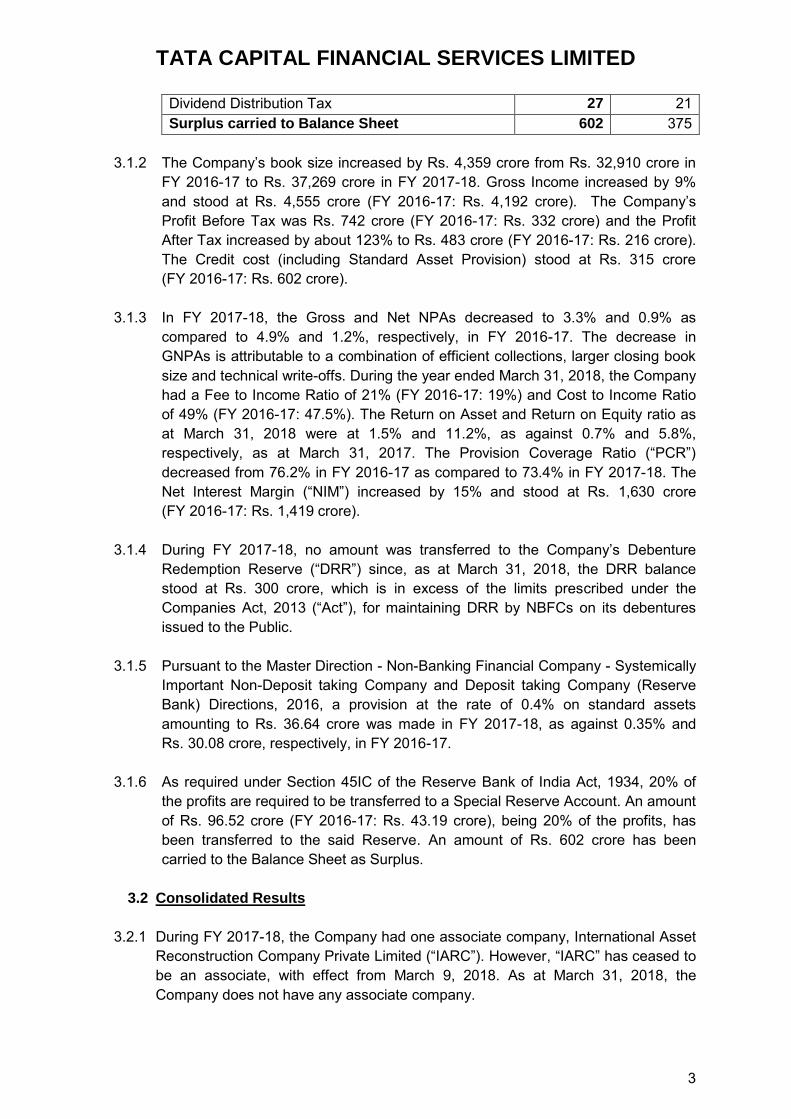
Dividend Distribution Tax 27 21 Surplus carried to Balance Sheet 602 375
3.1.2 The Company’s book size increased by Rs. 4,359 crore from Rs. 32,910 crore in
FY 2016-17 to Rs. 37,269 crore in FY 2017-18. Gross Income increased by 9% and stood at Rs. 4,555 crore (FY 2016-17: Rs. 4,192 crore). The Company’s
Profit Before Tax was Rs. 742 crore (FY 2016-17: Rs. 332 crore) and the Profit After Tax increased by about 123% to Rs. 483 crore (FY 2016-17: Rs. 216 crore). The Credit cost (including Standard Asset Provision) stood at Rs. 315 crore (FY 2016-17: Rs. 602 crore).
3.1.3 In FY 2017-18, the Gross and Net NPAs decreased to 3.3% and 0.9% as compared to 4.9% and 1.2%, respectively, in FY 2016-17. The decrease in GNPAs is attributable to a combination of efficient collections, larger closing book size and technical write-offs. During the year ended March 31, 2018, the Company had a Fee to Income Ratio of 21% (FY 2016-17: 19%) and Cost to Income Ratio of 49% (FY 2016-17: 47.5%). The Return on Asset and Return on Equity ratio as at March 31, 2018 were at 1.5% and 11.2%, as against 0.7% and 5.8%, respectively, as at March 31, 2017. The Provision Coverage Ratio (“PCR”)
decreased from 76.2% in FY 2016-17 as compared to 73.4% in FY 2017-18. The Net Interest Margin (“NIM”) increased by 15% and stood at Rs. 1,630 crore (FY 2016-17: Rs. 1,419 crore).
3.1.4 During FY 2017-18, no amount was transferred to the Company’s Debenture
Redemption Reserve (“DRR”) since, as at March 31, 2018, the DRR balance stood at Rs. 300 crore, which is in excess of the limits prescribed under the Companies Act, 2013 (“Act”), for maintaining DRR by NBFCs on its debentures
issued to the Public.
3.1.5 Pursuant to the Master Direction - Non-Banking Financial Company - Systemically Important Non-Deposit taking Company and Deposit taking Company (Reserve Bank) Directions, 2016, a provision at the rate of 0.4% on standard assets amounting to Rs. 36.64 crore was made in FY 2017-18, as against 0.35% and Rs. 30.08 crore, respectively, in FY 2016-17.
3.1.6 As required under Section 45IC of the Reserve Bank of India Act, 1934, 20% of the profits are required to be transferred to a Special Reserve Account. An amount of Rs. 96.52 crore (FY 2016-17: Rs. 43.19 crore), being 20% of the profits, has been transferred to the said Reserve. An amount of Rs. 602 crore has been carried to the Balance Sheet as Surplus.
3.2 Consolidated Results
3.2.1 During FY 2017-18, the Company had one associate company, International Asset Reconstruction Company Private Limited (“IARC”). However, “IARC” has ceased to
be an associate, with effect from March 9, 2018. As at March 31, 2018, the Company does not have any associate company.
3

TATA CAPITAL FINANCIAL SERVICES LIMITED
3.2.2 The performance of the Company for the Financial Year ended March 31, 2018, on a consolidated basis is, summarized below:
(Rs. in crore) Particulars FY 2017-18 FY 2016-17 Gross Income 4,555 4,192 Less: Finance Costs 2,231 2,212 Establishment, Administrative and Other Expenses 1,340 1,500 Amortisation of expenses 6 5 Depreciation 236 143 Profit Before Tax 742 332 Less: Provision for Tax 259 116 Profit After Tax 483 216 Share of Profit of Associates (upto March 8, 2018) 0.39 2 Profit for the year attributable to the
shareholders of the Company
483 218
4. SHARE CAPITAL
The paid-up Equity Share Capital of the Company as on March 31, 2018, was Rs. 1,297.55 crore, which was entirely held by TCL and its nominees. During FY 2017-18, the Company raised funds by issuing Compulsorily Convertible Cumulative Preference Shares (“CCCPS”) of Rs. 10 each aggregating Rs. 575 crore, on a Rights basis to TCL, carrying a dividend rate of 8.5% p.a. As a consequence of the aforesaid issuance, the paid-up Preference Share Capital of the Company stood at Rs. 1,520 crore, as on March 31, 2018.
5. DIVIDEND
5.1. Interim Dividend
During FY 2017-18, the Board of Directors of the Company declared Interim Dividend, as under:
(i) At the Meeting of the Board of Directors held on July 26, 2017, at the rate of 9% i.e.
Rs. 0.90 per CCCPS on 94,50,00,000 CCCPS of Rs. 10/- each, for a period of 91 days from April 1, 2017 upto June 30, 2017, aggregating Rs. 21.20 crore.
(ii) At the Meeting of the Board of Directors held on March 20, 2018:
At the rate of 9% p.a. i.e. Rs. 0.90 per CCCPS on 94,50,00,000 CCCPS of the Company, from July 1, 2017 to March 31, 2018, aggregating Rs. 63.85 crore;
At the rate of 8.5% p.a. i.e. Rs. 0.85 per CCCPS on 17,50,00,000 CCCPS of the Company, on a pro rata basis, from the date of issue up to March 31, 2018, aggregating Rs. 2.18 crore; and
At 3.50% p.a. i.e. Rs. 0.35 per Equity Share (FY 2016-17: Rs. 0.45 per Equity Share), aggregating Rs. 45.41 crore (FY 2016-17: Rs. 58.39 crore).
4

TATA CAPITAL FINANCIAL SERVICES LIMITED
The dividend distribution tax on the above dividend payments was Rs. 27.01 crore (FY 2016-17: Rs. 20.5 crore).
5.2. Final Dividend
The Directors do not recommend payment of any final dividend on the Equity Shares for FY 2017-18. Further, since the Company has paid Dividend aggregating Rs. 87.26 crore on the Preference Share Capital allotted up to March 8, 2018, for FY 2017-18, by way of an Interim Dividend, the Directors do not recommend any final dividend on those Preference Shares. At the Meeting of the Board of Directors held on April 30, 2018, the Board recommended the payment of a final dividend of 8.50% on the following CCCPS:
(i) 25,00,00,000 CCCPS aggregating Rs. 250 crore and allotted on March 21, 2018;
and (ii) 15,00,00,000 CCCPS aggregating Rs. 150 crore and allotted on March 31, 2018,
for FY 2017-18, on a pro rata basis up to March 31, 2018, subject to the approval of the Members at the ensuing Annual General Meeting (“AGM”). The said Dividend, if approved by the Members, would involve a cash outflow of Rs. 0.81 crore (including dividend distribution tax of Rs. 0.14 crore).
6. REVIEW OF OPERATIONS OF THE COMPANY
6.1. Corporate Finance Division
The Corporate Finance Division (“CFD”) comprises two broad business areas, viz. Commercial Finance and Infrastructure Finance, comprising the Special Assets Management Group (“SAMG”). The Closing Book of CFD stood at Rs. 21,352 crore (FY 2016-17: Rs. 19,264 crore), comprising Commercial Finance: Rs. 20,875 crore (97.8%) and SAMG: Rs. 477 crore (2.2%).
6.1.1 Commercial Finance:
The Commercial Finance Business specializes in product offerings ranging from Vanilla Term Loans, Working Capital Term Loans, Channel Finance, Bill Discounting, Construction Equipment (“CEQ”) Finance, Equipment Finance, Leasing Solutions, Lease Rental Discounting, Promoter Finance and Structured Products. This Business serves over 11,633 customers through its business verticals viz. Large Corporate, Mid and Emerging Corporate and Government Business. All the verticals are supported by the respective Product teams, which help these verticals in extending the right product mix to the customer. Further, a Syndication and Structured Finance
5

TATA CAPITAL FINANCIAL SERVICES LIMITED
team supports all the business verticals, with special focus on debt syndications, down selling and structured transactions. For the year under review, the Commercial Finance Business ended with a book of Rs. 20,875 crore as compared to Rs. 18,229 crore at the end of FY 2016-17. Gross Income grew by 7.4% from Rs. 1,928 crore in FY 2016-17 to Rs. 2,024 crore in FY 2017-18. This segment disbursed loans of Rs. 63,960 crore during FY 2017-18, through its diverse, customer-centric product offerings. During FY 2017-18, the Channel Finance Business continued to be the largest contributor of book in Commercial Finance. This Business ended FY 2017-18 with a book of Rs. 8,167 crore (FY 2016-17: Rs. 6,733 crore). During FY 2017-18, the CEQ Finance Business (including Rental Division) continued to be amongst the top five players in the industry. This Business ended FY 2017-18 with a book of Rs. 3,188 crore (FY 2016-17: Rs. 2,741 crore) and disbursed loans of Rs. 2,186 crore in FY 2017-18 (FY 2016-17: Rs. 1,874 crore). During FY 2017-18, Leasing Business continued to report good growth in its book and maintained asset quality in both, primary and secondary leases, despite the headwinds faced by the business due to GST roll-out and impact As at March 31, 2018, the outstanding book was about Rs. 1,136 crore consisting of a healthy mix of Capital Goods, Information Technology, Auto and Office Equipment leased to corporate entities. Operating leases constitute nearly 64% of the equipment provided on lease. TCFSL is emerging as the leading Leasing Solutions provider and a one-stop for customer providing a suite of financing and leasing solutions across varied assets. TCFSL aspires to scale up the business through strategic initiatives and leveraging a strong foothold in the Commercial Finance Business. The Commercial Finance Business is committed to being a complete financial solutions partner to its customers, through high quality service levels and innovative products, which provide value to its customers.
6.1.2 SAMG:
SAMG was formed on April 1, 2015 to manage the Project Finance portfolio of the erstwhile Infrastructure Finance division. SAMG managed a portfolio of Rs. 1,680 crore as at April 1, 2016 which reduced to Rs. 477 crore as at March 31, 2018, as a result of recovery and write off. The key objectives of SAMG are, as under:
• Primary responsibility of identifying, quantifying and minimizing the loss that could be incurred on impaired assets, with focus on reduction in impaired asset portfolio through proactive asset management, legal actions, disposals, debt re-structuring and portfolio monitoring, on an ongoing basis;
• Work out settlement proposals in such a way that the loss is minimized;
6

TATA CAPITAL FINANCIAL SERVICES LIMITED
• Identify / initiate dialogue with various special situation funds / NBFCs / lenders / Asset Reconstruction Companies (“ARC”) for takeover of the Company’s debt;
• Develop expertise to acquire stress portfolio from other NBFCs / Banks and undertake fee based stress advisory mandates.
During FY 2017-18, total Collections by SAMG team was Rs. 311 crore, comprising cash recoveries of Rs. 251 crore, income recognized as realised Rs. 47 crore and realization on assets held for sale of Rs. 13 crore.
6.2. Consumer Finance
The Company offers, through its Consumer Finance and Advisory Business (“CFAB”),
a wide range of consumer loans such as Auto Loans (New and Used Car Loans, Tractor Loans, Commercial Vehicle Loans and Two Wheeler Loans), Business Loans, Loans against Property, Personal Loans, Consumer Durables Loans and Loans against Securities. Disbursements in FY 2017-18 aggregated Rs. 10,868 crore as compared to Rs. 9,018 crore in FY 2016-17, representing an increase of about 21%. Gross Income grew by 14% from Rs. 1,966 crore in FY 2016-17 to Rs. 2,238 crore in FY 2017-18. Disbursement of Loans against Property increased from Rs. 2,854 crore in FY 2016-17 to Rs. 3,010 crore in FY 2017-18, representing a growth of 6% over the previous year. Disbursement of Personal Loans and Business Loans increased from Rs. 2,664 crore in FY 2016-17 to Rs. 3,285 crore in FY 2017-18, representing a growth of 23% over the previous year. Auto Loan disbursements of Rs. 2,530 crore constituted 23% of the overall CFAB disbursals for the year. Disbursements of high margin focus products remained flat at 35% during FY 2017-18. CFAB continued its focus on margin expansion while the overall interest rates decreased in the Indian economy which has an impact on the fixed yield portfolio. NIM increased from 6.6% in FY 2016-17 to 7% in FY 2017-18. Continued focus on leveraging the Tata ecosystem has resulted in disbursements increasing from Rs. 276 crore in FY 2016-17 to Rs. 432 crore, in FY 2017-18. As at March 31, 2018, the Assets Under Management of the Wealth Management business was Rs. 5,033 crore, crossing a major milestone of Rs. 5,000 crore during FY 2017-18 and the business posted a profit of Rs. 3 crore. Tata Cards, a White Label Credit Card in partnership with SBI Cards and Payments Services Limited, has nearly 1.9 lakh cards in force as at March 31, 2018. For FY 2017-18, CFAB’s closing book of Rs. 15,859 crore (FY 2016-17: Rs. 13,579 crore) comprised Auto Loans of Rs. 4,887 crore (31%), Business Loans and Personal Loans of Rs. 4,470 crore (28%), and Loans against Property of Rs. 5,816 crore (37%) the balance being other Retail loans. Loans against Property grew by 22% whereas Business Loans and Personal Loans grew by 31% in FY 2017-18 as compared to the previous year. These products have attained a strong market position in key high growth markets like Delhi NCR, Mumbai, Bengaluru and Hyderabad. Owing to these changes, the financial contribution of these businesses has shown material improvement.
7

TATA CAPITAL FINANCIAL SERVICES LIMITED
Going forward, CFAB plans to grow its business through partnership with Tata Group Consumer Companies as well as a continued focus on cross sell to its existing customers of Consumer Durable loans as well as Personal Loans. Additionally, it continues to focus on high NIM products, increase customer acquisition, especially through expanding its Consumer Durables loans business, Two Wheeler loans business, balancing its product mix, ramping up fee based income, optimizing operating costs and improving collection efficiency for further enhancing its profitability. CFAB also plans to leverage analytics capabilities to explore opportunities in the market and offer unique products and solutions to new as well as existing customers. There are plans to automate several processes to ensure Quick Turnaround. Cost Optimization initiatives have been taken to specifically focus on acquisition costs, manpower cost, process simplification, digitization and infrastructure cost.
7. OVERVIEW OF SUBSIDIARIES AND ASSOCIATES
As on March 31, 2018, the Company did not have any subsidiary company nor any associate company. IARC is registered with RBI under Section 3 of the Securitisation and Reconstruction of Financial Assets and Enforcement of Security Interest Act, 2002 (“SARFAESI”), as a
Securitisation and Reconstruction Company. IARC was promoted in 2002 by professionals from the banking and financial services sector, for reconstruction of financial assets. During FY 2017-18, on account of acquisition of 51% stake in the equity share capital of IARC by a new investor, TCFSL’s shareholding in IARC reduced from 25.37% to 16.57%. Accordingly, IARC ceased to be an associate of TCFSL, with effect from March 9, 2018.
8. CONSOLIDATED FINANCIAL STATEMENTS
Pursuant to the provisions of Section 129(3) of the Act, a separate statement containing the salient features of the Financial Statements of IARC, its Associate Company, in the prescribed Form No. AOC-1, is also included in the Annual Report at Page No. 194 . The Financial Statements of the Company, including the Consolidated Financial Statements, are also available on the website of the Company, www.tatacapital.com.
9. FINANCE
During FY 2017-18, the Company met its funding requirements through a combination of short term debt (comprising Commercial Papers, Inter-Corporate Deposits (“ICDs”)
and Bank Loans) and Long Term debt (comprising Non-Convertible Debentures (“NCDs”) and Bank Loans).
8

TATA CAPITAL FINANCIAL SERVICES LIMITED
During FY 2017-18, the Company issued NCDs on a private placement basis, under the following categories:
Category Amount
(Rs. in crore)
Secured Redeemable NCDs 6,075.80 Unsecured NCDs 800.00 Unsecured NCDs by way of Perpetual Debt 318.00
The Company securitized some of its receivables aggregating Rs. 414.43 crore. The aggregate debt outstanding as at March 31, 2018 was Rs. 31, 339 crore (of which, Rs. 18,471 crore was payable within one year). The Debt / Equity ratio as on March 31, 2018 was 6.73 times. The Company has been regular in servicing all its debt obligations.
10. CREDIT RATING
During the year under review, Rating Agencies reaffirmed / issued ratings to the Company, as under:
RATING
AGENCY
RATING NATURE OF SECURITIES
ICRA ICRA A1+ CRISIL A1+ (Short Term)
Commercial Paper
ICRA ICRA A1+ (Short Term) Bank Loan ICRA ICRA AA+ (Long Term) Secured NCDs on a private placement basis,
Secured NCDs issued to Public, NCDs by way of Subordinated Debt and Bank Loan
ICRA ICRA AA Unsecured NCDs by way of Perpetual Debt CARE CARE AA+ Secured NCDs on a private placement basis,
Secured NCDs issued to Public and NCDs by way of Subordinated Debt and Bank Loan
CARE CARE AA Unsecured NCDs by way of Perpetual Debt CRISIL CRISIL AA+ Secured NCDs on private placement basis
and Unsecured NCDs on private placement basis
CRISIL CRISIL AA Unsecured NCDs by way of Perpetual Debt (Upgraded from AA- to AA)
11. RISK MANAGEMENT
Risk Management is an integral part of the Company’s business strategy with focus on building risk management culture across the organisation. The Risk Management oversight structure includes Committees of the Board and Senior Management Committees. The Risk Management process is governed by the Comprehensive
9

TATA CAPITAL FINANCIAL SERVICES LIMITED
Enterprise Risk Management Framework which lays down guidelines for Risk identification, assessment and monitoring as an ongoing process that is supported by a robust risk reporting framework. It entails establishment of robust systems and processes within the Enterprise Risk Management Framework to mitigate risks effectively. Risk Management at the Company covers Credit Risk, Market Risk, Operational Risk, Fraud Risk and other risks. The Risk Management Practices of Tata Capital are compliant with ISO 31000:2009, which is the International Standard for Risk Management that lays down Principles, Guidelines and Framework for Risk Management in an organisation. TCFSL successfully underwent ISO 9001:2015 surveillance audit for the operations of its assets businesses, without any major non-conformity.
The Risk Management Committee (“RMC”) of the Board assists the Board in its oversight of various risks mentioned above. The RMC reviews compliance with risk policies, monitors risk tolerance limits, reviews and analyses risk exposures related to specific issues and provides oversight of risk across the organisation. The Credit Risk management structure includes separate credit policies and procedures for various businesses. The risk policies define prudential limits, portfolio criteria, exceptional approval metrics, etc. and cover Risk assessment for new product offerings. Concentration Risk is managed by analysing counter-party, industry sector, geographical region, single borrower and borrower group. While Credit Committees approve counter-party credit exposure in line with the Delegation of Power and Authority assigned by the Board of Directors, the Credit Monitoring Committee primarily focuses on post sanction monitoring. Retail Finance credit approval is based on product / programs and monitoring is primarily done at the portfolio level across products and programs. Periodic scenario analysis of the credit portfolio is conducted and necessary corrective measures are implemented. Management of Liquidity (Asset Liability and Interest Rate) and Market Risk is carried out using quantitative techniques such as sensitivity and stress testing. The Finance and Asset Liability Supervisory Committee reviews liquidity risk and the interest rate risk profile of the organization, on a regular basis. The Company has a Board approved Operational Risk Management framework. Ongoing monitoring of Key Risk Indicators (“KRI”) is done and corrective actions are implemented on KRI exceptions. An oversight committee of Senior Management representatives viz. the Operational Risk Management Committee, meets periodically to review the operational risk profile of the organisation. Risks associated with frauds are mitigated through a Fraud Risk Management framework. A Fraud Risk Management Committee comprising representatives of the Senior Management, reviews matters relating to fraud risk, including corrective and remedial actions as regards people and processes.
10
TATA CAPITAL FINANCIAL SERVICES LIMITED
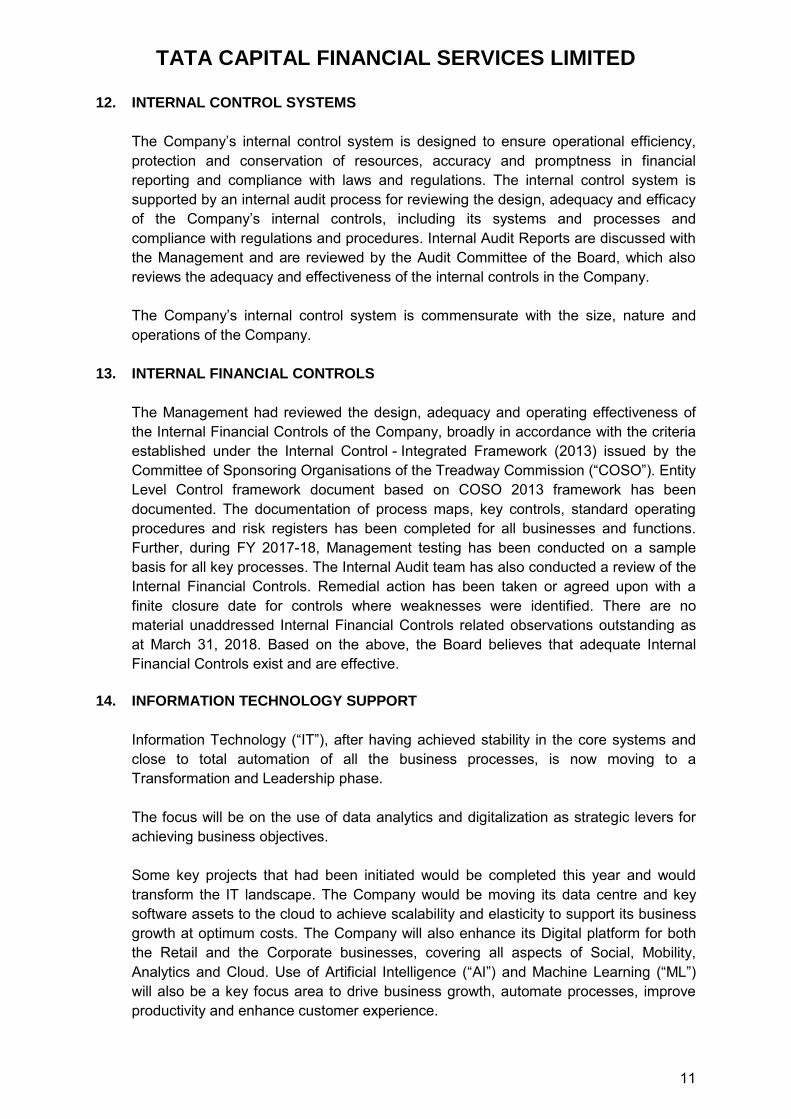
12. INTERNAL CONTROL SYSTEMS
The Company’s internal control system is designed to ensure operational efficiency,
protection and conservation of resources, accuracy and promptness in financial reporting and compliance with laws and regulations. The internal control system is supported by an internal audit process for reviewing the design, adequacy and efficacy of the Company’s internal controls, including its systems and processes and
compliance with regulations and procedures. Internal Audit Reports are discussed with the Management and are reviewed by the Audit Committee of the Board, which also reviews the adequacy and effectiveness of the internal controls in the Company. The Company’s internal control system is commensurate with the size, nature and operations of the Company.
13. INTERNAL FINANCIAL CONTROLS
The Management had reviewed the design, adequacy and operating effectiveness of the Internal Financial Controls of the Company, broadly in accordance with the criteria established under the Internal Control - Integrated Framework (2013) issued by the Committee of Sponsoring Organisations of the Treadway Commission (“COSO”). Entity
Level Control framework document based on COSO 2013 framework has been documented. The documentation of process maps, key controls, standard operating procedures and risk registers has been completed for all businesses and functions. Further, during FY 2017-18, Management testing has been conducted on a sample basis for all key processes. The Internal Audit team has also conducted a review of the Internal Financial Controls. Remedial action has been taken or agreed upon with a finite closure date for controls where weaknesses were identified. There are no material unaddressed Internal Financial Controls related observations outstanding as at March 31, 2018. Based on the above, the Board believes that adequate Internal Financial Controls exist and are effective.
14. INFORMATION TECHNOLOGY SUPPORT
Information Technology (“IT”), after having achieved stability in the core systems and close to total automation of all the business processes, is now moving to a Transformation and Leadership phase. The focus will be on the use of data analytics and digitalization as strategic levers for achieving business objectives. Some key projects that had been initiated would be completed this year and would transform the IT landscape. The Company would be moving its data centre and key software assets to the cloud to achieve scalability and elasticity to support its business growth at optimum costs. The Company will also enhance its Digital platform for both the Retail and the Corporate businesses, covering all aspects of Social, Mobility, Analytics and Cloud. Use of Artificial Intelligence (“AI”) and Machine Learning (“ML”) will also be a key focus area to drive business growth, automate processes, improve productivity and enhance customer experience.
11
TATA CAPITAL FINANCIAL SERVICES LIMITED
During FY 2017-18, the RBI had issued the ‘Master Direction – Information Technology Framework for the NBFC Sector’ (“Master Directions”) on June 8, 2017 and all NBFCs
were required to comply with these Master Directions by June 30, 2018. Accordingly, for adequate IT Governance, the Company, inter alia, adopted an Information Technology Policy, Information Security Policy and Cyber Security Policy.
15. DIGITAL PLATFORM
The Company has continued to evolve on its digital journey – and has, over the last year, invested in building a comprehensive set of products and a slew of new-to-market processes to improve efficiency, deliver best-in-class solutions to its customers and enhance productivity. The Company strongly believes that analytics, backed by top-of-the-line technology is core to the Company’s business strategy. It plays a key role in customer acquisition,
developing predictive models to help while creating a more personalised and seamless customer experience across all platforms and building superior underwriting capabilities. It has leveraged this through various initiatives launched in the year, including developing a scoring model using alternate data sources for acquisition, instituting a scorecard for small ticket Business Loans and through tie-ups with Industry experts, co-created score cards for credit risk assessment for smaller ticket commercial finance loans. With new-age solutions emerging at every corner, the Company has adapted by creating a robust and scalable set of solutions for all its retail and institutional customers. ‘TatkalCEQ loans’, which is an industry first web application for CEQ Finance; the ‘Digital Lending Platform’ for corporate customers, which makes
borrowing a very convenient and transparent process for customers; implementation of a superior CRM platform for improving internal process efficiencies and the introduction of Biometric eKYC to enable faster on-boarding of customers are some of the solutions that have been developed. Working with FinTechs has also helped the company tap new segments like Online Consumer Durable Loans and other End Use Loans. It has also enhanced the experience across current products and processes, including the Online Chatbot - which has moved beyond the realm of a simple service to a sales engagement channel and stimulating the customer at every step through an assisted contact centre. In the current year, FY 2018-19, Tata Capital will continue to build platforms for sales and service, create seamless product journeys and enhance self-service solutions while partnering with FinTechs to create more robust ecosystems.
16. HUMAN RESOURCES
The Company recognises people as its most valuable asset and it has built an open, transparent and meritocratic culture to nurture this asset.
12

TATA CAPITAL FINANCIAL SERVICES LIMITED
The Company had 2,612 permanent employees on the rolls of the Company as at March 31, 2018. Tata Capital’s mission of creating a high performance culture has been further
strengthened through areas such as building a capability model (identification of critical competencies), nurturing talent through interventions such as coaching, competency based training programs and cross functional projects. Tata Capital’s third Cultural Survey, based on the ten identified attributes and
conducted by the Gallup Organisation in 2017, has given it a very healthy and positive score of 4.31 on a scale of 5 (4.25 in 2015). Tata Capital’s focus on Employee Engagement has resulted in its overall Employee
Engagement Scores (Q12) climbing steadily from 3.52 in 2009 to 4.14 in 2016, in surveys, conducted by the Gallup Organisation. As part of the journey to becoming a benchmark organisation in HR practices, Tata Capital has achieved its People Capability Maturity Model (“P-CMM”) Level 3
Certification and further assessed at Level 4 (SCAMPI B equivalent assessment) and has now embarked on the journey of achieving Level 5 Certification. In addition, during the 8th CII HR Excellence Award process – 2017-18, Tata Capital was recognized with the “Significant Achievement in HR Excellence Award.” Tata Capital’s Learning & Development (“L&D”) initiatives are focused on enhancing the functional and behavioural competencies of its employees through L&D interventions, such as Executive Development Programs, e-learning and various classroom based training programs. Tata Capital was awarded the Kamikaze B2B Employee Engagement Awards for Best Use of Training in Employee Engagement and Best use of Voice of the Employee award for FY 2017-18. It was also awarded the Best Blended Learning Program at the TISS - Leapvault CLO Awards 2017.
Tata Capital also achieved key milestones in FY 2017-18, wherein some of the key HR processes were digitized and made fully operational, supporting the fast pace of our growing manpower and thus achieving an objective of improved employee experience, better employee insight and moving towards a paperless environment. Tata Capital is committed to maintain the highest standards of health, safety and security for its employees and business associates and to operate in a healthy and safe environment.
17. BUSINESS DEVELOPMENT
During the year, the Business Development Group (“BDG”) enabled opportunities and
relationships within and outside the Tata Group, to the benefit of various businesses of the Company. The BDG also enhanced its interactions with domestic industry and trade bodies and with other entities, with a view to promoting the Tata Capital brand and laying the groundwork for future business.
13

TATA CAPITAL FINANCIAL SERVICES LIMITED
18. CORPORATE SUSTAINABILITY AND CORPORATE SOCIAL RESPONSIBILITY
Corporate Social Responsibility is deeply rooted in the Tata Group’s business
philosophy. The Group companies have a sense of responsibility towards making use of its existing resources and knowledge to not only make profits but also solve social and environmental issues. The Company shares the Group’s belief that our society can truly progress, if every individual is included and empowered in the story of development. To guide us in this journey, the Company has defined a Corporate Social Responsibility (“CSR”) policy
which outlines the thrust areas of development, viz. Livelihood and Employability, Health, Education and Environment, as adopted by the CSR Committee and the Board of Directors of the Company, which is available on the Company’s website, www.tatacapital.com. For FY 2017-18, the CSR budget of the Company was Rs. 10.12 crore, this being 2 percent of the average net profit of the Company, in the three immediately preceding financial years, calculated as per Section 198 of the Act read with the Companies (Corporate Social Responsibility Policy) Rules, 2014. In addition to the approved CSR budget, the Company contributed Rs. 0.02 crore towards a charity engaged in cancer treatment. The aggregate CSR expenditure for FY 2017-18 was Rs. 10.14 crore.
The budget was spent towards projects and programmes, covered under Schedule VII to the Act, as approved by the CSR Committee of the Board. To conceptualise and implement the projects, the Company follows a robust process including appraising and selecting technically sound NGOs, planning the project based on baseline assessment, creating a project plan for implementation and monitoring & evaluation mechanisms. This helps to bring the desired positive and measurable results for the target beneficiaries. More details on the CSR activities is annexed herewith as Annexure ‘A’. Additionally, the Company adheres to the Tata Group’s Tata Affirmative Action
Programme based on the framework defined by Confederation of Indian Industries. The framework focusses on upliftment of Scheduled Castes and Scheduled Tribes and identifies 4Es as key areas of development i.e. Education, Employability, Employment and Entrepreneurship. In addition to the 4Es, the Company also adheres to ‘Essentials’ as another category to provide for basic services like shelter, water and electricity.
19. COMPLIANCE
The Company has complied with all the applicable regulations of RBI during FY 2017-18. With respect to provisioning of non-performing assets, the Company follows stricter norms than those prescribed by RBI. The Capital to Risk Assets Ratio of the Company is 16.70% as on March 31, 2018, which is more than the prescribed minimum of 15%.
14

TATA CAPITAL FINANCIAL SERVICES LIMITED
The Company has adopted a Compliance Risk Management Charter for monitoring and supervising the compliance requirements.
20. DEPOSITS
The Company did not hold any public deposits at the beginning of the year nor has it accepted any public deposits during the year under review.
21. DETAILS OF LOANS, GUARANTEES AND INVESTMENTS
The provisions of Section 186 of the Act pertaining to granting of loans to any persons or bodies corporate and giving of guarantees or providing security in connection with loans to any other bodies corporate or persons are not applicable to the Company, since the Company is an NBFC.
At the Extraordinary General Meeting of the Company held on March 30, 2015, the Members had approved a limit of Rs. 3,500 crore for making investment in securities of other companies. Details of investments made which are covered under the provisions of Section 186 of the Act, are given in Note No. 13 to the Financial Statements.
22. DIRECTORS
Based on the recommendation of the Nomination and Remuneration Committee (“NRC”) of the Company, the Board of Directors approved the appointments of the following Directors, during FY 2017-18: (i) Re-appointment of Mr. Praveen P Kadle (DIN: 00016814) as the Managing
Director & CEO of the Company, with effect from September 18, 2017 up to March 31, 2018. Mr. Kadle was also re-appointed as the Managing Director & CEO of TCL, the holding company, for the same period, his appointment in TCFSL being co-terminus with his appointment as Managing Director & CEO of TCL;
(ii) Appointment of Mr. Rajiv Sabharwal (DIN: 00057333) as an Additional Director and Non-Executive Director of the Company, with effect from April 1, 2018. The said appointment was approved by the RBI vide its letter dated March 28, 2018. Mr. Sabharwal holds office up to the ensuing Annual General Meeting (“AGM”) and is eligible for appointment as a Director; and
(iii) Appointment of Mr. Kusal Roy (DIN: 02268654), as the Managing Director of the
Company for a period of five years, with effect from April 1, 2018. The said appointment was approved by the RBI vide its letter dated March 28, 2018. Mr. Roy holds office up to the ensuing AGM and is eligible for appointment as a Director.
Further, based on the recommendation of the NRC, Mr. Rajiv Sabharwal was appointed as the Chairman of the Company, with effect from April 1, 2018. Apart from the above, during the year, Mr. Janki Ballabh (DIN: 00011206) retired as an Independent Director of the Company, with effect from end of day on
15

TATA CAPITAL FINANCIAL SERVICES LIMITED
October 23, 2017, in accordance with the Governance Guidelines on Board Effectiveness adopted by the Company and Mr. Praveen P. Kadle (DIN: 00016814) retired as the Founding Managing Director & CEO of Company, with effect from the end of day on March 31, 2018. The Directors place on record their appreciation for the valuable contribution made by Mr. Ballabh and Mr. Kadle, during their tenure as Directors of the Company.
In accordance with the provisions of the Act and the Articles of Association of the Company, Mr. Devadas Mallya Mangalore (“Mr. M. D. Mallya”) (DIN: 01804955), is
liable to retire by rotation at the ensuing AGM and is eligible for re-appointment. The Members of the Company may refer to the accompanying Notice of the AGM of the Company, for the brief Resumes of Mr. Mallya, Mr. Sabharwal and Mr. Roy. Pursuant to the ‘Fit and Proper’ Policy adopted by the Company under the RBI Master Directions for NBFCs, the Company has received the ‘Fit and Proper’ declarations from Mr. Mallya, Mr. Sabharwal and Mr. Roy for their respective re-appointment / appointment, as Directors of the Company, which have been taken on record by the NRC. The Company has received declarations from the Independent Directors, viz. Mr. Mukund S. Dharmadhikari (DIN: 05003224) and Ms. Anuradha Thakur (DIN: 06702919), stating that they meet the criteria of independence as provided in Section 149(6) of the Act.
23. EVALUATION OF THE BOARD, ITS COMMITTEES AND INDIVIDUAL DIRECTORS Pursuant to the provisions of the Act, the Board has carried out an annual evaluation of its own performance and of the individual Directors (including the Chairman) as well as an evaluation of the working of all the Committees of the Board. The Board of Directors was assisted by the NRC. The performance evaluation was carried out by seeking inputs from all the Directors / Members of the Committees, as the case may be. The Guidance Note on Board Evaluation (“Guidance Note”) issued by the Securities and Exchange Board of India (“SEBI”) had encouraged companies which were not covered under Chapter IV of the SEBI (Listing Obligations and Disclosure Requirements) Regulations, 2015 (“LODR Regulations”) to follow the criteria mentioned
in the Guidance Note. The Board of the Company followed the said criteria recommended under the Guidance Note for evaluating the performance of the Board as a whole, Committees of the Board, Individual Directors and Chairperson. The criteria for evaluation of the Board as a whole, inter alia, covered parameters such as Structure of the Board, Meetings of the Board and Functions of the Board. The criteria for evaluation of Individual Directors covered parameters such as details of professional qualifications and prior experience relevant to the Company, knowledge and competency, fulfillment of functions, ability to function as a team, etc. The criteria for evaluation of the Board Committees covered areas related to mandate and composition, effectiveness of the Committee, structure of the Committee and meetings, etc.
16

TATA CAPITAL FINANCIAL SERVICES LIMITED
The feedback of the Independent Directors on their review of the performance of Non-Independent Directors and the Board as a whole, the performance of the Chairman of the Company and the assessment of the quality, quantity and timeliness of flow of information between the Company Management and the Board was taken into consideration by the Board in carrying out the performance evaluation.
24. POLICY ON APPOINTMENT OF DIRECTORS AND REMUNERATION POLICY OF
THE COMPANY
The NRC develops the competency requirements of the Board based on the industry and strategy of the Company, conducts a gap analysis and recommends the reconstitution of the Board, as and when required. It also recommends to the Board, the appointment of Directors having good personal and professional reputation and conducts reference checks and due diligence of all Directors, before recommending them to the Board. Besides the above, the NRC ensures that the new Directors are familiarised with the operations of the Company and endeavours to provide relevant training to the Directors.
In accordance with the provisions of Section 178 of the Act, the Board of Directors have adopted a Policy on Board Diversity and Director Attributes and a Remuneration Policy. The Policy on Board Diversity and Director Attributes has been framed to encourage diversity of thought, experience, knowledge, perspective, age and gender in the Board. The Remuneration Policy for Directors, Key Managerial Personnel and all other employees is aligned to the philosophy on the commitment of fostering a culture of leadership with trust. The Remuneration Policy aims to ensure that the level and composition of the remuneration of the Directors, Key Managerial Personnel and all other employees is reasonable and sufficient to attract, retain and motivate them to successfully run the Company. The Policy on Board Diversity and Director Attributes as also the Remuneration Policy of the Company, are attached as Annexures ‘B’ and ‘C’, respectively.
The Company has also adopted a ‘Fit and Proper’ Policy for ascertaining the ‘fit and
proper’ criteria to be adopted at the time of appointment of directors and on a
continuing basis, pursuant to the RBI Master Directions for NBFCs. The Company has received the ‘Fit and Proper’ declarations from all the Directors of the Company in April 2018, which have been taken on record by the NRC.
25. KEY MANAGERIAL PERSONNEL
Mr. Praveen P. Kadle, Managing Director & CEO, Mr. Puneet Sharma, Chief Financial Officer and Ms. Avan Doomasia, Company Secretary, were the Key Managerial Personnel (“KMP”) of the Company as also the KMPs of TCL, the holding company, for FY 2017-18. During FY 2017-18, Mr. Praveen P. Kadle retired as the Founding Managing Director & CEO and TCL, with effect from end of day on March 31, 2018 and consequently ceased to be a Key Managerial Personnel of the Company.
17

TATA CAPITAL FINANCIAL SERVICES LIMITED
Mr. Kusal Roy has been appointed as the Managing Director and Key Managerial Personnel of the Company, with effect from April 1, 2018.
Accordingly, Mr. Kusal Roy, Managing Director, Mr. Puneet Sharma, Chief Financial Officer and Ms. Avan Doomasia, Company Secretary, are the KMPs of the Company, of which, Mr. Sharma and Ms. Doomasia are also the KMPs of TCL.
26. DIRECTORS’ RESPONSIBILITY STATEMENT
Based on the framework of internal financial controls and compliance systems established and maintained by the Company, work performed by the Internal, Statutory and Secretarial Auditors, including audit of internal financial controls over financial reporting by the Statutory Auditors and the reviews performed by the Management and the relevant Board Committees, including the Audit Committee, the Board is of the opinion that the Company’s internal financial controls were adequate and effective,
during FY 2017-18. Accordingly, pursuant to Section 134(5) of the Act, the Board of Directors, to the best of their knowledge and ability, confirm that:
a) in the preparation of the annual accounts, the applicable accounting standards and
guidance provided by The Institute of Chartered Accountants of India had been followed and that there are no material departures thereof;
b) they had selected such accounting policies and applied them consistently and made judgments and estimates that are reasonable and prudent so as to give a true and fair view of the state of affairs of the Company at the end of the financial year and of the profit and cash flows of the Company for the year;
c) they had taken proper and sufficient care for the maintenance of adequate accounting records in accordance with the provisions of the Act for safeguarding the assets of the Company and for preventing and detecting fraud and other irregularities;
d) they had prepared the annual accounts on a going concern basis; e) they had laid down internal financial controls to be followed by the Company and
that such internal financial controls are adequate and were operating effectively; and
f) they had devised proper systems to ensure compliance with the provisions of all applicable laws and that such systems were adequate and operating effectively.
27. CORPORATE GOVERNANCE
Company’s Philosophy on Corporate Governance
The Company recognises its role as a corporate citizen and endeavours to adopt the best practices and the highest standards of corporate governance through transparency in business ethics, accountability to its customers, Government and others. The Company’s activities are carried out in accordance with good corporate
practices and the Company is constantly striving to better them by adopting best practices.
18

TATA CAPITAL FINANCIAL SERVICES LIMITED
The Company will continue to focus its resources, strengths and strategies to achieve its vision of becoming a leading financial services company in India with a global footprint, while upholding the core values of transparency, integrity, honesty and accountability, which are fundamental to Tata companies. The Corporate Governance philosophy is further strengthened with the adherence to the Tata Business Excellence Model as a means to drive excellence, the Key Performance Metrics methodology for tracking progress on long-term strategic objectives and the Tata Code of Conduct (“TCOC”), which articulates the values, ethics and business principles and serves as a guide to the Company, its directors and employees, supplemented with an appropriate mechanism to report any concern pertaining to non-adherence to the said TCOC. In addition, the Company has adopted Governance Guidelines on Board Effectiveness, a Code of Conduct for Prevention of Insider Trading, a Code of Corporate Disclosure Practices, a Vigil Mechanism, a Fair Practices Code, an Affirmative Action Policy, a Policy against Sexual Harassment in the Workplace, a Fit and Proper Policy for ascertaining the fit and proper criteria of the directors at the time of appointment and on a continuing basis, a Policy on Board Diversity and Director Attributes, a Code of Conduct for Non-Executive Directors, Internal Guidelines on Corporate Governance, an Occupational Health and Safety Management System and an Anti-Bribery and Anti-Corruption (“ABAC”) Policy. TCL has signed the Tata Brand Equity and Business Promotion (“BEBP”) Agreement
with Tata Sons Limited on behalf of its subsidiaries, including TCFSL, for subscribing to the TATA BEBP Scheme. The Company abides by the TCOC and the norms for using the Tata Brand identity. a. Board of Directors
The Board of Directors, alongwith the Committees of the Board, provides leadership and guidance to the Company’s Management and directs, supervises and controls the activities of the Company.
The size of the Board is commensurate with the size and business of the Company. As on March 31, 2018, the Board comprised five Directors, viz. Mr. F. N. Subedar, Mr. M. D. Mallya, Mr. Mukund S. Dharmadhikari, Ms. Anuradha E. Thakur and Mr. Praveen P. Kadle. Mr. Praveen P. Kadle was re-appointed as the Managing Director & CEO of the Company, for a period commencing from September 18, 2017 and ending on March 31, 2018. Mr. Kadle retired as the Managing Director & CEO of the Company, with effect from the end of the day on March 31, 2018. Mr. Janki Ballabh ceased to be an Independent Director of the Company, with effect from the end of day on October 23, 2017, consequent upon his retirement in terms of the Governance Guidelines on Board Effectiveness adopted by the Company. Mr. Rajiv Sabharwal was appointed as a Non-Executive Director and the Chairman of the Board of Directors of the Company, with effect from April 1, 2018. Mr. Kusal Roy, who was appointed as the Managing Director, Designate, with effect from March 1,
19

TATA CAPITAL FINANCIAL SERVICES LIMITED
2018, was appointed as the Managing Director of the Company, with effect from April 1, 2018. Mr. Dharmadhikari and Ms. Thakur are the Independent Directors (“ID”) while Mr. Sabharwal, Mr. Subedar and Mr. Mallya are the Non-Executive Directors (“NED”), of the Company. The Meetings of the Board held in FY 2017-18 were generally chaired by Mr. Ballabh upto October 23, 2017 and thereafter, by Mr. Subedar. During FY 2017-18, ten Meetings of the Board of Directors were held on the following dates: April 28, 2017, May 10, 2017; July 26, 2017; September 18, 2017; September 27, 2017; November 2, 2017; January 29, 2018; February 23, 2018; February 28, 2018 and March 20, 2018. The details of Directors, their attendance at Board Meetings and at the previous AGM of the Company are, given below:
Name of Director Director
Identification
Number
Category Board Meetings Whether
present at
previous
AGM held on
August 21,
2017
Held Attended
Mr. Janki Ballabh1 00011206 Independent 10 5 Yes Mr. F. N. Subedar 00028428 Non –
Executive 10 8 No
Mr. M. D. Mallya2 01804955 Non – Executive
10 6 No
Mr. Mukund S. Dharmadhikari
05003224 Independent 10 8 Yes
Ms. Anuradha E. Thakur 06702919 Independent 10 10 Yes Mr. Praveen P. Kadle3 00016814 Managing
Director & CEO
10 10 Yes
Notes: 1. Mr. Janki Ballabh retired as an Independent Director of the Company, with effect from
end of day on October 23, 2017.
2. Mr. M. D. Mallya was appointed as a Non-Executive Director of the Company, with
effect from July 17, 2017.
3. Mr. Praveen P. Kadle retired as the Managing Director & CEO, with effect from end of
day March 31, 2018.
Mr. Janki Ballabh, Chairman of the Audit Committee and the NRC, had attended the last AGM of the Company. Mr. F. N. Subedar, Chairman of the Stakeholders Relationship Committee, had authorised Mr. Praveen P. Kadle, a Member of the Stakeholders Relationship Committee, to attend the last AGM on his behalf.
20

TATA CAPITAL FINANCIAL SERVICES LIMITED
The Company paid Sitting Fees to the NEDs and IDs for attending meetings of the Board and the Committees of the Board and will pay Commission for FY 2017-18, within the maximum prescribed limits, to the NEDs and IDs who were Directors of the Company during FY 2017-18, as recommended by the NRC and approved by the Board at their meetings held on April 30, 2018.
Details of Sitting Fees and Commission are, given below:
Name of Director(s) Sitting Fees paid for
attending Board and
Committee Meetings
during FY 2017-18
Commission
paid for
FY 2016-17
Commission
to be paid for
FY 2017-18
Mr. Janki Ballabh1 Rs. 6,90,000 Rs. 25,00,000 Rs. 15,00,000 Mr. F. N. Subedar Rs. 4,00,000 Rs. 25,00,000 Nil Mr. M. D. Mallya2 Rs. 6,90,000 Nil Rs. 19,00,000 Mr. Mukund S. Dharmadhikari
Rs. 9,30,000 Rs. 25,00,000 Rs. 25,00,000
Ms. Anuradha E. Thakur Rs. 12,60,000 Rs. 25,00,000 Rs. 25,00,000
Notes:
1. Mr. Janki Ballabh retired as an Independent Director of the Company, with effect from end of day on October 23, 2017, and hence, Commission will be paid only for part of FY 2017-18.
2. Mr. M. D. Mallya was appointed as a NED of the Company, with effect from July 17, 2017, and hence, Commission will be paid only for part of FY 2017-18.
None of the NEDs and IDs had any pecuniary relationships or transactions with
the Company during the year under review.
b. Committees of the Board
The Board has constituted Committees with specific terms of reference / scope to focus effectively on issues and ensure expedient resolution of diverse matters. These are the Audit Committee, Investment Credit Committee (“ICC”), Finance and Asset Liability Supervisory Committee (“ALCO”), Risk Management Committee (“RMC”), Stakeholders Relationship Committee (“SRC”), NRC, CSR Committee, and the Committee for Review of Policies (“RoP”). The Company Secretary is the Secretary of all the aforementioned Committees. The Board of Directors and the Committees also take decisions by circular resolutions which are noted by the Board / respective Committees of the Board at their next meetings. The minutes of the meetings of all Committees of the Board are circulated to the Board of Directors, for their noting.
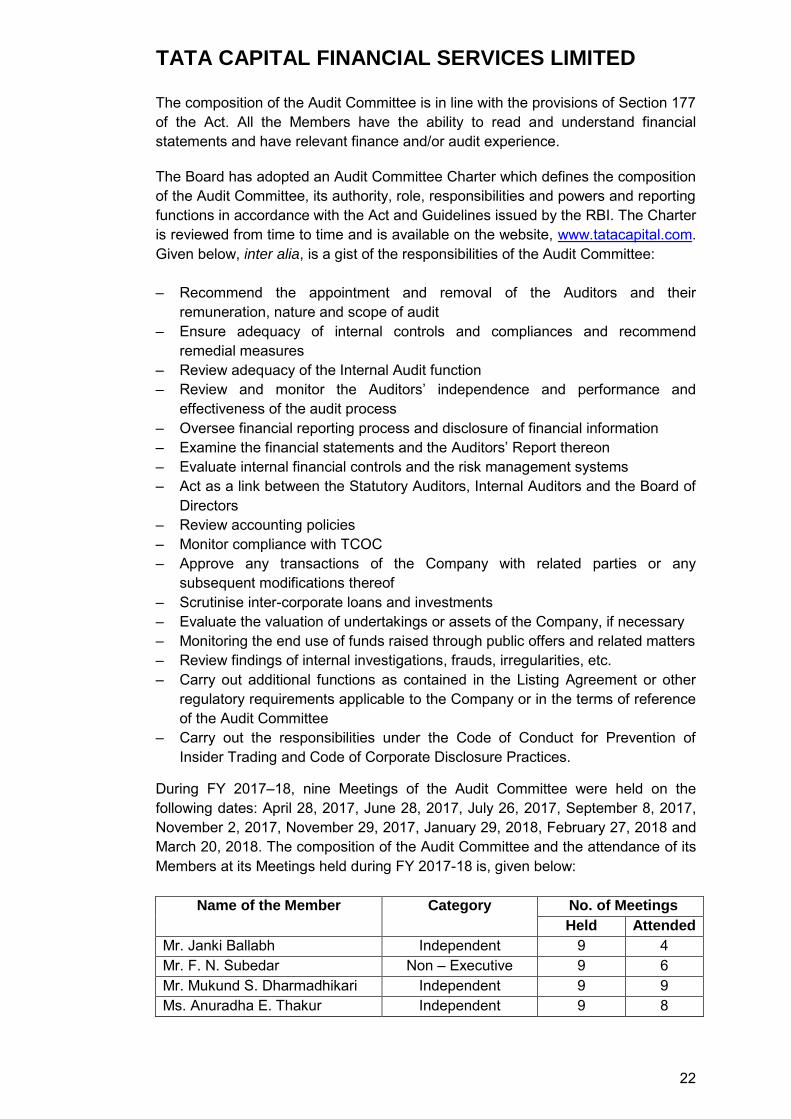
i) Audit Committee
The Audit Committee of TCFSL as on March 31, 2018, comprised Mr. Mukund S. Dharmadhikari, as Chairman, Mr. F. N. Subedar and Ms. Anuradha E. Thakur.
21
TATA CAPITAL FINANCIAL SERVICES LIMITED
The composition of the Audit Committee is in line with the provisions of Section 177 of the Act. All the Members have the ability to read and understand financial statements and have relevant finance and/or audit experience.
The Board has adopted an Audit Committee Charter which defines the composition of the Audit Committee, its authority, role, responsibilities and powers and reporting functions in accordance with the Act and Guidelines issued by the RBI. The Charter is reviewed from time to time and is available on the website, www.tatacapital.com. Given below, inter alia, is a gist of the responsibilities of the Audit Committee:
– Recommend the appointment and removal of the Auditors and their
remuneration, nature and scope of audit – Ensure adequacy of internal controls and compliances and recommend
remedial measures – Review adequacy of the Internal Audit function – Review and monitor the Auditors’ independence and performance and
effectiveness of the audit process – Oversee financial reporting process and disclosure of financial information – Examine the financial statements and the Auditors’ Report thereon – Evaluate internal financial controls and the risk management systems – Act as a link between the Statutory Auditors, Internal Auditors and the Board of
Directors – Review accounting policies – Monitor compliance with TCOC – Approve any transactions of the Company with related parties or any
subsequent modifications thereof – Scrutinise inter-corporate loans and investments – Evaluate the valuation of undertakings or assets of the Company, if necessary – Monitoring the end use of funds raised through public offers and related matters – Review findings of internal investigations, frauds, irregularities, etc. – Carry out additional functions as contained in the Listing Agreement or other
regulatory requirements applicable to the Company or in the terms of reference of the Audit Committee
– Carry out the responsibilities under the Code of Conduct for Prevention of Insider Trading and Code of Corporate Disclosure Practices.
During FY 2017–18, nine Meetings of the Audit Committee were held on the following dates: April 28, 2017, June 28, 2017, July 26, 2017, September 8, 2017, November 2, 2017, November 29, 2017, January 29, 2018, February 27, 2018 and March 20, 2018. The composition of the Audit Committee and the attendance of its Members at its Meetings held during FY 2017-18 is, given below:
Name of the Member Category No. of Meetings
Held Attended
Mr. Janki Ballabh Independent 9 4 Mr. F. N. Subedar Non – Executive 9 6 Mr. Mukund S. Dharmadhikari Independent 9 9 Ms. Anuradha E. Thakur Independent 9 8
22
TATA CAPITAL FINANCIAL SERVICES LIMITED
Notes:
1. Mr. Janki Ballabh ceased to be the Chairman, with effect from end of day on October
23, 2017; and
2. Mr. F. N. Subedar was appointed as the Chairman, with effect from November 2, 2017.
The Board has accepted all the recommendations made by the Audit Committee during the year. Besides the Members of the Committee, Meetings of the Audit Committee are attended by the Managing Director & CEO, the Chief Financial Officer, the Company Secretary, the Statutory Auditors and the Head - Internal Audit. Further, Meetings of the Audit Committee for consideration of Financials are also attended by the other Directors, as Invitees. The Internal Audit function is headed by the Head of Internal Audit of the Company, who reports to the Chairman of the Audit Committee to ensure independence of operations.
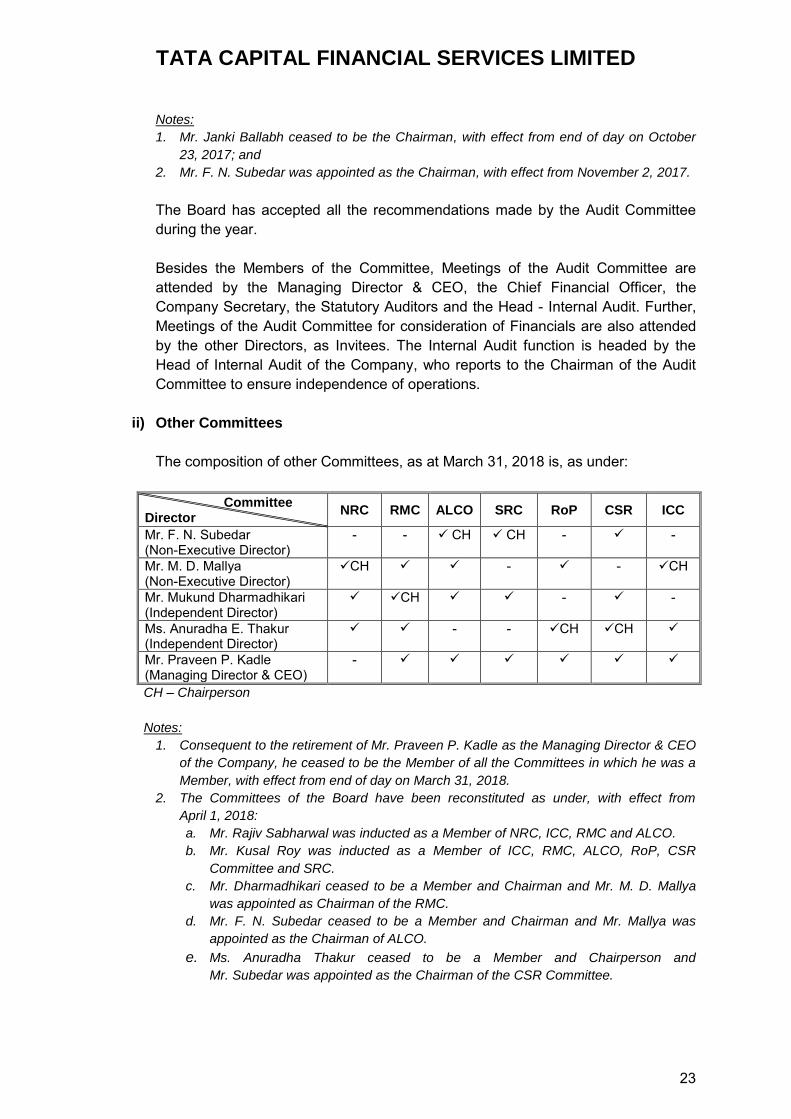
ii) Other Committees
The composition of other Committees, as at March 31, 2018 is, as under:
Committee Director
NRC RMC ALCO SRC RoP CSR ICC
Mr. F. N. Subedar (Non-Executive Director)
- - CH CH -
-
Mr. M. D. Mallya (Non-Executive Director)
CH - - CH
Mr. Mukund Dharmadhikari (Independent Director)
CH - -
Ms. Anuradha E. Thakur (Independent Director)
- - CH CH
Mr. Praveen P. Kadle (Managing Director & CEO)
-
CH – Chairperson
Notes:
1. Consequent to the retirement of Mr. Praveen P. Kadle as the Managing Director & CEO
of the Company, he ceased to be the Member of all the Committees in which he was a
Member, with effect from end of day on March 31, 2018.
2. The Committees of the Board have been reconstituted as under, with effect from
April 1, 2018:
a. Mr. Rajiv Sabharwal was inducted as a Member of NRC, ICC, RMC and ALCO.
b. Mr. Kusal Roy was inducted as a Member of ICC, RMC, ALCO, RoP, CSR
Committee and SRC.
c. Mr. Dharmadhikari ceased to be a Member and Chairman and Mr. M. D. Mallya
was appointed as Chairman of the RMC.
d. Mr. F. N. Subedar ceased to be a Member and Chairman and Mr. Mallya was
appointed as the Chairman of ALCO.
e. Ms. Anuradha Thakur ceased to be a Member and Chairperson and
Mr. Subedar was appointed as the Chairman of the CSR Committee.
23

TATA CAPITAL FINANCIAL SERVICES LIMITED
c. Secretarial Standards
The Company is in compliance with SS -1, i.e. Secretarial Standard on Meetings of the Board of Directors and SS – 2 i.e. Secretarial Standard on General Meetings, issued by the Institute of Company Secretaries of India .
d. Registered Office
The Registered Office of the Company has shifted from One Forbes, Dr. V. B. Gandhi Marg, Fort, Mumbai 400 001 to 11th Floor, Tower A, Peninsula Business Park, Ganpatrao Kadam Marg, Lower Parel, Mumbai 400 013, with effect from April 1, 2018.
e. Means of Communication
The ‘Investors’ section on the Company’s website keeps the investors updated
on material developments in the Company by providing key and timely information such as Financial Results, Annual Reports, etc. The debenture holders can also send in their queries / complaints at the designated email address: [email protected].
f. General Information for Members and Debenture holders
The half-yearly Financial Results of the Company are submitted to the Stock Exchanges in accordance with the SEBI (Listing Obligations and Disclosure Requirements) Regulations, 2015 and are published in a leading English daily newspaper and also communicated to the Debenture holders every six months through a half-yearly communiqué. Official news releases, including the half-yearly results, are also posted on the Company’s website, www.tatacapital.com. The Company is registered with the Registrar of Companies, Maharashtra, Mumbai. The Corporate Identity Number (“CIN”) allotted to the Company by the
Ministry of Corporate Affairs (“MCA”) is U67100MH2010PLC210201. The
Company’s NCDs issued to the public, are listed on the BSE Limited (“BSE”) and
the National Stock Exchange of India Limited (“NSE”). The Company has Debentures issued to the public and on a private placement basis listed on the Wholesale Debt Market segment of the NSE. Refer Note No. 5 in Financial Statements for details. Details of Debenture Trustees and the Registrar and Transfer Agents for the Debentures issued by the Company, are given below:
Debenture Trustees
Vistra ITCL (India) Limited (formerly known as IL & FS Trust Company Limited) The IL&FS Financial Centre, Plot C - 22, G Block, Bandra Kurla Complex, Bandra (E), Mumbai – 400 051. Website: www.itclindia.com Tel: +91 22 2659 3082, Fax: +91 22 2653 3297. e-mail: [email protected]
24

TATA CAPITAL FINANCIAL SERVICES LIMITED
IDBI Trusteeship Services Limited Asian Building, Ground Floor, 17, R. Kamani Marg, Ballard Estate, Mumbai – 400 001. Website: www.idbitrustee.com Tel: +91 22 4080 7000, Fax: +91 22 6631 1776. e-mail: [email protected] Registrar and Transfer Agents Non – Convertible Debentures issued to the Public Karvy Computershare Private Limited Karvy Selenium Tower B, Plot 31-32, Gachibowli, Financial District, Nanakramguda, Hyderabad – 500 032. Website: www.karvycomputershare.com Tel: +91 40-67161500, Fax: +91 40 2342 0814. e-mail: [email protected] Non – Convertible Debentures issued on a Private Placement basis TSR Darashaw Limited 6-10, Haji Moosa Patrawala Industrial Estate, 20, Dr. E Moses Road, Mahalaxmi, Mumbai – 400 011. Website: www.tsrdarashaw.com Tel: +91 22 6656 8484, Fax: +91 22 6656 8494. e-mail: [email protected]
Pursuant to the provisions of Section 124 of the Companies Act, 2013, the unclaimed interest on matured debentures as well as the unclaimed principal amount of the matured debentures would be transferred to the Investor Education and Protection Fund (“IEPF”) after completion of seven years from the date it becomes due for payment. During FY 2017-18, no amount was required to be transferred to the IEPF. The debenture holders are requested to claim the interest on matured debentures and the amount of matured debentures on the Public NCDs at the earliest, by contacting the Company or the Registrars. Pursuant to Section 125 of the Act, any person claiming to be entitled to the amount which has been transferred to IEPF, can apply to the concerned authority, for the payment of the money claimed.
28. VIGIL MECHANISM
The Company has established a Vigil Mechanism for its Directors and employees to report their concerns or grievances. The said mechanism, inter alia, encompasses the Whistle Blower Policy, the Fraud Risk Management Process, the Ethics mechanism under the TCOC and the Anti-Bribery and Anti-Corruption (“ABAC”) Policy, and it
provides for adequate safeguards against victimization of persons who use it. The Vigil Mechanism provides for access to Tata Capital’s Ethics Committee for reporting concerns and grievances. It also provides access to the Compliance Officer under the ABAC Policy and to the Chairperson of the Company’s Audit Committee /
25

TATA CAPITAL FINANCIAL SERVICES LIMITED
the Chief Ethics Counsellor under the Company’s Whistle Blower Policy. Information
regarding the mechanism and the channels for reporting concerns (including a third-party reporting channel) are communicated to the relevant stakeholders. The Vigil Mechanism, the Whistle Blower Policy, the TCOC and ABAC Policy are available on the website of the Company, www.tatacapital.com.
29. DISCLOSURE AS PER THE SEXUAL HARASSMENT OF WOMEN AT
WORKPLACE (PREVENTION, PROHIBITION AND REDRESSAL) ACT, 2013
The Company is committed to providing and promoting a safe and healthy work environment for all its employees. A ‘Prevention of Sexual Harassment’ (“POSH”)
Policy (“Policy”), which is in line with the statutory requirements, along with a structured reporting and redressal mechanism, is in place. During FY 2017-18, the Company received two complaints under the provisions of ‘The Sexual Harassment of Women at Workplace (Prevention, Prohibition and
Redressal) Act, 2013’, which were duly enquired and closed as per the Policy.
30. STATUTORY AUDITORS
At the Seventh AGM of the Company held on August 21, 2017, B S R & Co. LLP, Chartered Accountants (ICAI Firm Registration No. 101248W/W-100022) (“BSR”),
were appointed as the Statutory Auditors of the Company, for a term of five years, to hold office from the conclusion of the Seventh AGM till the conclusion of the Twelfth AGM of the Company to be held in 2022, subject to the ratification of their appointment by the Members at every AGM, if required under the Act. The Board recommends the ratification of the appointment of BSR as Statutory Auditors of the Company from the conclusion of the ensuing Eighth AGM upto the conclusion of the Ninth AGM of the Company, to the Members.
31. ACCOUNTING STANDARDS FOLLOWED BY THE COMPANY
The Financial Statements of the Company have been prepared in accordance with the Generally Accepted Accounting Principles in India (“Indian GAAP”) to comply with the Accounting Standards specified under Section 133 and other relevant provisions of the Act, as applicable. Further, the Company follows the RBI Master Directions for NBFCs. The Financial Statements have been prepared on an accrual basis under the historical cost convention. The Accounting Policies adopted in the preparation of the Financial Statements are consistent with those followed in the previous year.
32. EXPLANATION ON STATUTORY AUDITORS’ REPORT
There are no qualifications, reservations or adverse remarks or disclaimers made by B S R & Co. LLP, Statutory Auditors, in their Report dated April 30, 2018, on the Financial Statements of the Company for FY 2017-18.
26

TATA CAPITAL FINANCIAL SERVICES LIMITED
33. SECRETARIAL AUDITOR AND SECRETARIAL AUDIT REPORT
Pursuant to the provisions of Section 204 of the Act and the Companies (Appointment and Remuneration of Managerial Personnel) Rules, 2014, the Board of Directors had appointed M/s. Parikh & Associates, a firm of Company Secretaries in Practice, to undertake the Secretarial Audit of the Company for FY 2017-18. The Secretarial Audit Report, in the prescribed Form No. MR-3, is annexed as Annexure ‘D’. There are no qualifications, reservations or adverse remarks or disclaimers made by M/s. Parikh & Associates in their Secretarial Audit Report dated April 30, 2018, on the Secretarial and other related records of the Company, for FY 2017-18.
34. INFORMATION ON MATERIAL CHANGES AND COMMITMENTS
There are no material changes or commitments affecting the financial position of the Company which have occurred between March 31, 2018 and April 30, 2018, being the date of this Report.
35. RELATED PARTY TRANSACTIONS The Company has adopted a Policy and a Framework on Related Party Transactions for the purpose of identification, monitoring and approving of such transactions. The said Policy is attached as Annexure ‘E’. A Statement containing details of material contracts or arrangements or transactions with Related Parties on an arm’s length basis with respect to transactions as required
under Section 188(1) of the Act, in the prescribed Form No. AOC-2, is attached as Annexure ‘F’. Further, details of Related Party Transactions, as required to be disclosed by Accounting Standard – 18 on “Related Party Disclosures” specified under Section 133 of the Act read with Rule 7 of the Companies (Accounts) Rules, 2014, are given in the Notes to the Financial Statements. During the year, the Company has not entered into any transactions with Related Parties which are not in its ordinary course of business or not on an arm’s length basis
and which require disclosure in this Report in terms of the provisions of Section 188(1) of the Act.
36. ENERGY CONSERVATION, TECHNOLOGY ABSORPTION AND FOREIGN
EXCHANGE EARNINGS & OUTGO
(A) Conservation of energy:
i. Steps taken / impact on conservation of energy:
The operations of the Company, being Financial Services related, require normal consumption of electricity. The Company is taking every necessary step to reduce its consumption of energy.
ii. Steps taken by the Company for utilising alternate sources of energy:
27

TATA CAPITAL FINANCIAL SERVICES LIMITED
Tata Capital has installed a solar panel at its Thane office which produces close to 750 Watts of energy and which self illuminates and provides power to the garden and security lights on the campus from dusk to dawn. The garden lights at the Thane office have been retrofitted with LED bulbs that consume less electricity as compared to the conventional incandescent or CFL bulbs.
iii. Capital investment on energy conservation equipments:
In view of the nature of activities carried on by the Company, there is no capital investment on energy conservation equipments.
(B) Technology absorption:
i. The efforts made towards technology absorption;
ii. The benefits derived like product improvement, cost reduction, product
development or import substitution;
iii. In case of imported technology (imported during the last 3 years reckoned from the beginning of the financial year): (a) The details of technology imported; (b) The year of import; (c) Whether the technology been fully absorbed; (d) If not fully absorbed, areas where absorption has not taken place, and the
reasons thereof; and
iv. The expenditure incurred on Research and Development.
Given the nature of the activities of the Company, the above is not applicable to the Company.
(C) Foreign Exchange Earnings and Outgo:
Foreign Exchange earned in terms of actual inflows during the year under review was Nil and the Foreign Exchange Outgo during the year under review in terms of actual outflows, was Rs. 13.13 crore.
37. EXTRACT OF ANNUAL RETURN
An extract of the Annual Return as prescribed under Section 92(3) of the Act and the Companies (Management and Administration) Rules, 2014, in the prescribed Form No. MGT- 9, is attached as Annexure ‘G’.
38. DETAILS PERTAINING TO REMUNERATION AS REQUIRED UNDER SECTION
197(12) OF THE ACT READ WITH RULE 5 OF THE COMPANIES (APPOINTMENT
AND REMUNERATION OF MANAGERIAL PERSONNEL) RULES, 2014
A Statement giving the details required under Section 197(12) of the Act read with Rule 5(1) of the Companies (Appointment and Remuneration of Managerial Personnel) Rules, 2014, for the year ended March 31, 2018, is attached as Annexure ‘H’.
28
TATA CAPITAL FINANCIAL SERVICES LIMITED
The details required under Rule 5(2) and Rule 5(3) of the Companies (Appointment and Remuneration of Managerial Personnel) Rules, 2014, for the year ended March 31, 2018, are provided in a separate Annexure forming part of this Report. In terms of the first proviso to Section 136 of the Act, the Report and the Accounts are being sent to the Members, excluding the aforesaid Annexure. Any shareholder interested in obtaining a copy of the same may write to the Company Secretary, at the Registered Office of the Company. None of the employees listed in the said Annexure is related to any Director of the Company.
39. MANAGEMENT DISCUSSION AND ANALYSIS REPORT
The Management Discussion and Analysis Report is attached as Annexure ‘I’.
40. ACKNOWLEDGEMENTS
The Directors would like to place on record their gratitude for the valuable guidance and support received from RBI, SEBI, Registrar of Companies and other government and regulatory agencies and to convey their appreciation to TCL, the holding company, customers, bankers, lenders, vendors and all other business associates for the continuous support given by them to the Company. The Directors also place on record their appreciation for the commitment, commendable efforts, team work and professionalism of all the employees of the Company.
For and on behalf of the Board of Directors
Mumbai Rajiv Sabharwal April 30, 2018 Chairman
29

Annexure A
ANNUAL REPORT ON CORPORATE SOCIAL RESPONSIBILITY (“CSR”) ACTIVITIES
1. Brief outline of the Company’s CSR policy, including overview of projectsor programs proposed to be undertaken and reference to the web-link to the CSR policy and projects or programs:
Vision: To ensure sustainability by doing what is right, through the adoption of sustainable business practices, employee policies and technologies.
Purpose: To protect the interests of all the stakeholders of the Company and contribute to society at large, by making a measurable and positive difference through the four causes the Company supports viz. Livelihood & Employability, Health, Education and Environment.
Sectors and Issues: To focus on art and culture, education, sports, health, employability, entrepreneurship, environment, volunteering, disaster relief and Tata Group efforts.
For details of the CSR Policy, along with projects and programs, kindly refer to, http://www.tatacapital.com.
2. The composition of the CSR Committee:
The Board of Directors have constituted a CSR Committee in accordance with the requirements of Section 135(1) of the Companies Act, 2013 (“Act”). The composition of the Committee as at March 31, 2018 was, as under:
a) Ms. Anuradha Thakur, Independent Director (Chairperson)b) Mr. F. N. Subedar, Non – Executive Directorc) Mr. Mukund. S. Dharmadhikari, Independent Directord) Mr. Praveen P. Kadle, Managing Director & CEO
It may be noted that Mr. Praveen P. Kadle ceased to be a Member of the CSR Committee, with effect from end of day on March 31, 2018, consequent upon his retirement as the Managing Director & CEO of the Company. Accordingly, Mr. Kusal Roy, Managing Director of the Company, was inducted as a Member in place of Mr. Kadle, with effect from April 1, 2018.
3. Average Net Profit of the Company for last 3 Financial Years:
(in Rs.) Financial Year Net Profit*
FY 2014-15 4,08,63,00,000/- FY 2015-16 5,46,89,00,000/- FY 2016-17 5,62,08,00,000/- Average Net Profit 5,05,86,66,667/-
*Note: The above net profit has been calculated in accordance with the provisions ofSection 198 of the Act and the Companies (Corporate Social Responsibility Policy)Rules, 2014.
3030
4. Prescribed CSR expenditure (2% of Average Net Profit as indicated in
Point No. 3): The prescribed CSR expenditure for FY 2017-18 was Rs. 10,11,73,333/-, rounded off to Rs. 10,12,00,000/-. However, the aggregate CSR expenditure for FY 2017-18 was Rs. 10,14,40,400/-.
5. Details of CSR spend during FY 2017-18:
a. Total prescribed amount to be spent: Rs. 10,12,00,000/-. b. Amount unspent, if any: Nil c. Manner in which the amount was spent during FY 2017-18 is detailed
below:
31

Sr. No CSR Projects or
Activity Identified Sector in which
the project is covered
Projects or Programs
1) Local area or other,
2) Specify the state and
District where the projects or programs was
undertaken
Amount outlay (Budget) project or
Program wise (Rs.)
Amount spent on the projects
or Programs Sub heads:
Cumulative expenditure
upto the reporting
period (Rs.)
Amount Spent
Direct Expenditure on
projects or Programs
(Rs.)
Overheads Direct Implementing Agency
1 Cluster Development Promoting Education
Vikramgad, Palghar,
Maharashtra
24,96,305 24,96,305 - 24,96,305 Dnyan Prabodhini Shaikshanik Sanstha
3,54,280 3,54,280 - 3,54,280 Navneet Education Limited
1,78,252 1,78,252 - 1,78,252 Pragati Pratishthan
43,54,155 40,09,095 3,45,060 43,54,155 Pratham Education Foundation
31,97,718 30,11,463 1,86,255 31,97,718 Magic Bus India Foundation
2 CRY - Dooars Jagaron Promoting Education
Jalpaiguri, West Bengal
10,31,688 8,59,740 1,71,948 10,31,688 CRY – Child Rights and You
3 Pankh Scholarships and FAEA
Promoting Education
Mumbai, Maharashtra
and PAN India
31,18,339 31,18,339 - 31,18,339 PANKH, TCFSL
Pankh Scholarships
Promoting Education
Mumbai, Maharashtra
and PAN India
3,50,000 3,50,000 - 3,50,000 Foundation for Academic Excellence & Access (FAEA)
4 Financial Literacy for children and adults
Enhancing Skills and promoting
education
PAN India 20,08,385 19,06,921 1,01,464 20,08,385 Centre for Environmental Research and Education
5 Education Sudhagad Promoting Education
Sudhagad Pali, Raigad, Maharashtra
4,00,000 4,00,000 - 4,00,000 Sudhagad Taluka Rahivasi Seva Sangha Thane
Promoting Education
Ahmednagar, Maharashtra
5,10,918 5,10,918 - 5,10,918 Daffodil Industries
6 Social Centre Promoting Education
Ahmednagar, Maharashtra
4,00,000 4,00,000 - 4,00,000 Social Centre
7 MARG Promoting education
PAN India 5,00,000 5,00,000 - 5,00,000 The Marg Foundation
8 Skill Development Enhancing vocational skills
as livelihood enhancement
projects
PAN India 45,00,000 45,00,000 - 45,00,000 Pratham Education Foundation
42,56,500 42,56,500 - 42,56,500 Don Bosco Vyawasaik Prashikshan Kendra
2,47,500 2,47,500 - 2,47,500 BoscoNet
4,00,000 4,00,000 - 4,00,000 Dooars Jagaron
2,19,08,127 1,99,11,924 19,96,203 2,19,08,127 Tata Community Initiatives Trust (Tata STRIVE)
32

2,86,115 - 2,86,115 2,86,115 Teamlease Education Foundation
72,00,000 72,00,000 - 72,00,000 Aash Foundation GRAS Academy
27,61,462 27,61,462 - 27,61,462 NIDAN TMI e2E Academy Pvt. Ltd (with NIDAN NGO)
6,00,000 6,00,000 - 6,00,000 Maharashta Ex-servicemen Corporation Ltd.
9 Promoting arts, sports and culture
Promoting arts and culture
PAN India 17,00,000 17,00,000 -
17,00,000 Shakhri Begum Memorial Trust
10,00,000 10,00,000 - 10,00,000 Sanjog Charitable Trust
25,00,000 25,00,000 - 25,00,000 Maharashtra Lalit Kala Nidhi
17,00,000 17,00,000 - 17,00,000 Vrindaban Trust
5,00,000 5,00,000 - 5,00,000 The Suburban Music Circle
20,00,000 20,00,000 - 20,00,000 Shankar Mahadevan Academy
10,00,000 10,00,000 - 10,00,000 Vasantrao Deshpande Pratishthan
3,00,000 3,00,000 - 3,00,000 Wakankar Bharati Sanskruti Anveshan Nyas
10 Promoting athletic talent
Promoting Sports Bengaluru 47,50,000 47,50,000 - 47,50,000 Prakash Padukone Badminton Academy
60,000 60,000 - 60,000 All India Sports Council of Deaf
11 Support for hearing impaired individuals
Promoting healthcare
PAN India 96,52,324 96,52,324 - 96,52,324 AURED
12 Aditya Jyot Promoting Healthcare
Maharashtra 10,21,349 10,21,349 - 10,21,349 Aditya Jyot
13 Entrepreneurship trainings
Livelihood enhancement
projects
Aurangabad, Maharashtra
Dhamtari, Chattisgarh
5,08,402 5,08,402 - 5,08,402 International Resources for Fairer Trade
14 Project Garima Promoting Healthcare
Mumbai, Maharashtra
40,00,000 37,00,000 3,00,000 40,00,000 Tata Education and Development Trust Swasth Foundation
15 Disaster Relief Promoting Healthcare
Gujarat and Bihar
25,00,000 25,00,000 - 25,00,000 Tata Chemicals Society for Rural Development
7,00,000 7,00,000 - 7,00,000 Tata Power Community Development Trust
16 Impact Assessment Enhancing vocational skills
as livelihood enhancement
PAN India 19,02,189 19,02,189 - 19,02,189 Samhita Social Ventures
33

projects,
Entrepreneurship Enhancing
vocational skills as livelihood
enhancement projects,
Entrepreneurship
PAN India 10,48,384 10,48,384 - 10,48,384 IDOBRO
17 Admin expenses* Capacity Building, including
expenditure on administrative
overheads
PAN India 32,97,608 32,97,608 32,97,608 TCFSL
18 Promoting Healthcare Promoting Healthcare
PAN India 0 2,40,400 2,40,400 The dividend paid amount from the HDFC Charity Fund for Cancer Cure – Debt Plan is donated to Indian Cancer Society
TOTAL 10,12,00,000 9,80,53,355 33,87,045 10,14,40,400
* The Admin Expenses included Rs. 8.13 lakh spent on volunteering activities
34

6. In case the Company has failed to spend the 2% of the Average Net Profit of the last three financial years or any part thereof, reasons for not spending the amount: Not Applicable, as the amounts have been spent.
7. A responsibility statement of the CSR Committee that the implementation and monitoring of CSR policy, is in compliance with CSR objectives and policy of the Company: We hereby confirm that implementation and monitoring of the CSR Policy is in compliance with the CSR objectives and CSR Policy of the Company.
F. N. Subedar Mukund S. Dharmadhikari Chairman – CSR Committee Member – CSR Committee (Non-Executive Director) (Independent Director) Kusal Roy Member – CSR Committee (Managing Director) Mumbai April 30, 2018
35

Annexure B
POLICY ON BOARD DIVERSITY AND DIRECTOR ATTRIBUTES
1. PURPOSE
In terms of Section 178 of the Companies Act, 2013 (“Act”) and the Governance Guidelines on Board Effectiveness issued by Tata Sons Limited and adopted by the Board of Directors, the Nomination and Remuneration Committee (“NRC”) of the Board is, inter alia, required to formulate a Policy on Board Diversity and lay down the criteria for determining qualifications, positive attributes and independence of a director.
Diversity in the composition of the Board of Directors has become essential in view of the expansion of business, greater social responsibility, increasing emphasis on Corporate Governance, need for addressing concerns of diverse stakeholders and the necessity for managing risks in the business effectively. A Board composed of appropriately qualified and skilled people, with a broad range of experience relevant to the business, is important for effective corporate governance and sustained commercial success of a company. In view of the above, Tata Capital Financial Services Limited (“TCFSL” or “Company”) has framed this Policy on Board Diversity and Director Attributes (“Policy”) that encourages diversity of thought, experience, knowledge, perspective, age and gender in the Board. The Policy sets out the approach to diversity in the Board of Directors of the Company so as to ensure that the Board has an appropriate blend of functional and industry expertise. This Policy has been adopted by the Board of Directors of the Company, based on the recommendations of the NRC.
2. OBJECTIVES OF THE POLICY The Objectives of the Policy include:
i. Board to drive diversity and have an appropriate blend of functional and industry expertise;
ii. While recommending the appointment of a director to, inter alia, consider the manner in which the function and domain expertise of the individual contributes to the overall skill domain mix of the Board;
iii. To help the Company build a better Board that can draw upon a wide range of perspectives, expertise, knowledge and experience;
iv. To achieve an optimum and balanced Board, with a wide range of attributes; v. To encourage healthy and open discussion and promote independence of
judgement in Board and Committee deliberations; and vi. To have an optimum mix of Executive, Non-Executive and Independent Directors,
including Women Directors.
36

3. POLICY STATEMENT
To meet the above Objectives:
i. The Board of TCFSL will ensure that a transparent Board nomination process is in place that encourages diversity of thought, experience, skills, knowledge, perspective, age, nationality, gender, cultural and educational background;
ii. It will be ensured that the Board has an appropriate blend of functional and industry expertise and skills;
iii. The consideration and selection of candidates for appointment to the Board will be based on merit which shall include a review of any candidate’s integrity, experience, educational background, industry or related experience and more general experience;
iv. Candidates that bring a diversity of background and opinion from amongst those candidates with the appropriate background and industry or related expertise and experience and having the ability to devote sufficient time to the affairs of the Company, should be considered for appointment to the Board; and
v. While recommending the appointment of a Director, the NRC will consider the criteria as laid down under the Act and applicable Regulations/Guidelines issued by Statutory and Regulatory authorities, as also those issued by Tata Sons Limited, from time to time, and the manner in which the function and domain expertise of the individual will contribute to the overall skill-domain mix of the Board.
4. MEASURABLE OBJECTIVES
The NRC will largely rely on the regulatory provisions of the Act and the Regulations/Guidelines issued by the RBI (as applicable to a Non-Banking Financial Companies) as also the Guidelines circulated by Tata Sons Limited and review the measurable objectives for achieving diversity against these provisions and recommend the same to the Board for adoption. At any given point of time, the Board may seek to improve one or more aspects of its diversity and measure progress accordingly.
5. MONITORING AND REPORTING
The NRC will review the Policy periodically, which will include an assessment of the effectiveness of the Policy. The NRC will discuss any revision that may be required and recommend the same to the Board for approval.
37
Annexure C
Remuneration Policy
1. COMPENSATION PHILOSOPHY
Tata Capital Financial Services Limited (“Company”) has adopted a Remuneration Policy based on a defined formal compensation philosophy of Tata Capital Limited, the holding company. In order to build a high performance culture, aligned to the Company’s Vision and Goals, the Compensation Philosophy aims at providing a significant differential to superior performers and also segregating increments and performance payouts, based on the actual performance of various business verticals. The aforementioned Compensation philosophy helps the Company to manage long term fixed cost, keep up with market compensation and attract the right talent to help drive its growth plans. The performance of the Company and its Business Units / Functions is measured against annual budgets / targets, set as per the Balanced Score Card (“BSC”). Performance of individuals is measured against Key Result Areas (“KRAs”) set at beginning of year and after considering any revision of target during the year. The Annual Performance Rating would be considered for calculating the Performance Pay. Rating would be on a 5 point scale. Consistent with the principle of differential influence that an employee may have on the overall performance of the Company, different weights are assigned for the Company’s performance, the performance of Business Units / Functions and the performance of individuals. Thus, employees in entry level / junior management have greater weightage for individual performance, while employees in senior leadership roles have maximum weightage for Company and Business Unit Performance.
2. REMUNERATION POLICY FOR DIRECTORS, KEY MANAGERIAL PERSONNEL AND
OTHER EMPLOYEES
The philosophy for remuneration of Directors, Senior Leadership Team, Key Managerial Personnel (“KMP”) and all other employees of the Company is based on the commitment to fostering a culture of leadership with trust. The Remuneration Policy is aligned to this philosophy. This Remuneration Policy has been prepared pursuant to the provisions of Section 178(3) of the Companies Act, 2013 (“Act”). In case of any inconsistency between the provisions of law and this Remuneration Policy, the provisions of law shall prevail and the Company shall abide by the applicable law. In case there are any changes in the law, the Company shall comply with the applicable amended provisions. While formulating this Remuneration Policy, the Nomination and Remuneration Committee (“NRC”) has considered the factors laid down under Section 178(4) of the Act which are, as under: (a) the level and composition of remuneration is reasonable and sufficient to attract, retain
and motivate directors of the quality required to run the company successfully; (b) relationship of remuneration to performance is clear and meets appropriate
performance benchmarks; and (c) remuneration to Directors, Key Managerial Personnel and Senior Management
involves a balance between fixed and incentive pay reflecting short and long-term performance objectives appropriate to the working of the company and its goals.
38
The key principles governing this Remuneration Policy are, as follows: 2.1 Remuneration for Independent Directors and Non-Independent Non-Executive
Directors
(i) Independent Directors (“ID”) and Non-Independent Non-Executive Directors (“NED”)
may be paid Sitting Fees (for attending the meetings of the Board and of Committees of the Board of which they may be Members) and Commission within regulatory limits.
(ii) Within the parameters prescribed by law, the payment of Sitting Fees and Commission will be recommended by the NRC for the approval of the Board.
(iii) Overall remuneration (Sitting Fees and Commission) should be reasonable and sufficient to attract, retain and motivate Directors aligned to the requirements of the Company (taking into consideration, the challenges faced by the Company and its future growth imperatives).
(iv) Overall remuneration should be reflective of the size of the Company, complexity of the sector / industry / Company’s operations and the Company’s capacity to pay the remuneration.
(v) Overall remuneration practices should be consistent with recognized best practices. (vi) Quantum of Sitting Fees may be subject to review on a periodic basis, as required. (vii) The aggregate Commission payable to all the NEDs and IDs will be recommended
by the NRC to the Board based on Company performance, profits, return to investors, shareholder value creation and any other significant qualitative parameters, as may be decided by the Board.
(viii) The NRC will recommend to the Board, the quantum of Commission for each Director based upon the outcome of the evaluation process which is driven by various factors including attendance and time spent at Board and Committee meetings, individual contribution at the meetings and contributions made by Directors, other than at Board and Committee meetings.
(ix) In addition to the Sitting Fees and Commission, the Company may pay to any Director such fair and reasonable expenditure, as may have been incurred by the Director while performing his / her role as a Director of the Company. This could include reasonable expenditure incurred by the Director for attending Board / Board Committee meetings, General Meetings, court convened meetings, meetings with Shareholders / Creditors / Management, site visits, induction and training (arranged by the Company for D irectors) and in obtaining professional advice from independent advisors in the furtherance of his / her duties as a Director.
2.2 Remuneration for Managing Director (“MD”) / Executive Directors (“ED”) / KMP / rest
of the employees (Note 1) (i) The extent of overall remuneration to the MD / ED / KMPs / rest of the employees
should be sufficient to attract and retain talented and qualified individuals suitable for their roles. Hence, remuneration should be: market competitive (market for every role is defined as companies from which the
company attracts talent or companies to which the company loses talent); driven by the role played by the individual; reflective of the size of the company, complexity of the sector / industry /
Company’s operations and the Company’s capacity to pay; consistent with recognized best practices; and aligned to any regulatory requirements.
(ii) In terms of remuneration mix or composition:
the remuneration mix for the MD / EDs should be as per the contract approved by
39
the Shareholders. In case of any change which is beyond the remuneration approved by the Shareholders, the same would require the approval of the Shareholders.
basic / fixed salary is provided to all employees to ensure that there is a steady income in line with their skills and experience.
in addition to the basic / fixed salary, the Company provides employees with certain perquisites, allowances and benefits to enable a certain level of lifestyle and to offer scope for savings and tax optimization, where possible. The Company also provides all employees with a social security net (subject to limits) by covering medical expenses and hospitalization through re-imbursements or insurance cover and accidental death and dismemberment through personal accident insurance.
the Company provides retirement benefits, as applicable.
in addition to the basic / fixed salary, benefits, perquisites and allowances as provided above, the Company may provide MD / EDs such remuneration by way of Commission, calculated with reference to the Net Profits of the Company in a particular financial year, as may be determined by the Board, subject to the overall ceilings stipulated in Section 197 of the Act. The specific amount payable to the MD/ EDs would be based on the performance of the MD / EDs as evaluated by the Board or the NRC and approved by the Board.
OR
In addition to the basic/fixed salary, benefits, perquisites and allowances as provided
above, the Company may provide to its MD / ED, such remuneration by way of an annual incentive remuneration / performance linked bonus subject to the achievement of certain performance criteria and such other parameters as may be considered appropriate, from time to time, by the Board. An indicative list of factors that may be considered for determination of the extent of this component are: - Company’s performance on certain defined qualitative and quantitative
parameters, as may be decided by the Board from time to time - Industry benchmarks of remuneration - Performance of the individual
The Company will provide the rest of the employees, a performance linked incentive pay. The performance linked pay would be driven by the outcome of the performance appraisal process and the performance of the Company.
2.3 Remuneration payable to Director for services rendered in other capacity
No remuneration will be payable to the Directors for services rendered by such Director in any other capacity unless: a) The services rendered are of a professional nature; b) The NRC is of the opinion that the director possesses requisite qualification for the
practice of the profession; and c) Approval of the Central Government has been received, if required, for paying the
same.
2.4 Loans to employees
The Company may grant loans to its employees on such terms and conditions as may be
40

determined by the Board or any Committee of the Board, from time to time, in accordance with applicable laws.
2.5 Policy implementation
The NRC is responsible for recommending the Remuneration Policy to the Board. The Board is responsible for approving and overseeing implementation of the Remuneration Policy.
Note 1 Excludes employees covered by any long term settlements or specific term contracts. The remuneration for these employees would be driven by the respective long term settlements or contracts.
41

Annexure D
FORM No. MR-3 SECRETARIAL AUDIT REPORT
FOR THE FINANCIAL YEAR ENDED MARCH 31, 2018
(Pursuant to Section 204 (1) of the Companies Act, 2013 and rule No. 9 of the Companies
(Appointment and Remuneration of Managerial Personnel) Rules, 2014) To, The Members, TATA CAPITAL FINANCIAL SERVICES LIMITED
We have conducted the secretarial audit of the compliance of applicable statutory provisions and the adherence to good corporate practices by Tata Capital Financial Services Limited (hereinafter called the “Company”). Secretarial Audit was conducted in a manner that provided us a reasonable basis for evaluating the corporate conducts / statutory compliances and expressing our opinion thereon. Based on our verification of the Company’s books, papers, minute books, forms and
returns filed and other records maintained by the Company, the information provided by the Company, its officers, agents and authorised representatives during the conduct of secretarial audit, the explanations and clarifications given to us and the representations made by the Management, we hereby report that in our opinion, the Company has, during the audit period covering the financial year ended on March 31, 2018 generally complied with the statutory provisions listed hereunder and also that the Company has proper Board processes and compliance mechanism in place to the extent, in the manner and subject to the reporting made hereinafter: We have examined the books, papers, minute books, forms and returns filed and other records made available to us and maintained by the Company for the financial year ended on March 31, 2018 according to the provisions of: (i) The Companies Act, 2013 (the “Act”) and the rules made thereunder; (ii) The Securities Contract (Regulation) Act, 1956 (“SCRA”) and the rules made
thereunder; (iii) The Depositories Act, 1996 and the Regulations and Bye-laws framed thereunder; (iv) Foreign Exchange Management Act, 1999 and the rules and regulations made
thereunder to the extent of Foreign Direct Investment, Overseas Direct Investment and External Commercial Borrowings (Not applicable to the Company during the audit period);
42
(v) The following Regulations and Guidelines prescribed under the Securities and Exchange Board of India Act, 1992 (“SEBI Act”): (a) The Securities and Exchange Board of India (Substantial Acquisition of Shares
and Takeovers) Regulations, 2011; (b) The Securities and Exchange Board of India (Prohibition of Insider Trading)
Regulations, 2015; (c) The Securities and Exchange Board of India (Issue of Capital and Disclosure
Requirements) Regulations, 2009 and amendments from time to time (Not applicable to the Company during the audit period);
(d) The Securities and Exchange Board of India (Share Based Employee Benefits) Regulations, 2014; (Not applicable to the Company during the audit period);
(e) The Securities and Exchange Board of India (Issue and Listing of Debt Securities) Regulations, 2008;
(f) The Securities and Exchange Board of India (Registrars to an Issue and Share Transfer Agents) Regulations, 1993 regarding the Act and dealing with client (Not applicable to the Company during the audit period);
(g) The Securities and Exchange Board of India (Delisting of Equity Shares) Regulations, 2009; (Not applicable to the Company during the audit period); and
(h) The Securities and Exchange Board of India (Buyback of Securities) Regulations, 1998 (Not applicable to the Company during the audit period).
(vi) Other laws specifically applicable to the Company, namely:
(a) All the Rules, Regulations, Directions, Guidelines and Circulars issued by the Reserve Bank of India applicable to Non-Deposit Accepting Non-Banking Financial Companies which are specifically applicable to the Company
(b) Credit Information Companies (Regulation) Act, 2005 and Rules (c) Securities and Exchange Board of India (“SEBI”) Circulars and Guidelines for
Mutual Funds as applicable to a Mutual Fund Distributor (d) Guidelines with respect to SEBI KYC registration agency (KRA) Regulations,
2011 (e) SEBI (Investment Advisers) Regulations, 2013 (f) SEBI (Research Analysts) Regulations, 2014 (g) The Insurance Act, 1938 and the Insurance Regulatory and Development
Authority (Registration of Corporate Agents) Regulations, 2015 (h) The Prevention of Money-Laundering Act, 2002 and The Prevention of Money
Laundering (Maintenance of Records, etc) Rules, 2005 (i) SEBI (Prohibition of Fraudulent and Unfair Trade Practices relating to Securities
Market) Regulations, 2003
We have also examined compliance with the applicable clauses of the following: (i) Secretarial Standards issued by The Institute of Company Secretaries of India with
respect to board and general meetings.
(ii) The Listing Agreement entered into by the Company with National Stock Exchange of India Limited and BSE Limited with respect to Non-Convertible Debentures issued by
43

the Company read with the SEBI (Listing Obligations and Disclosure Requirements) Regulations, 2015.
During the period under review, the Company has complied with the provisions of the Act, Rules, Regulations, Guidelines, standards etc. mentioned above. We further report that: The Board of Directors of the Company is duly constituted with proper balance of Executive Directors, Non-Executive Directors and Independent Directors. The changes in the composition of the Board of Directors that took place during the period under review were carried out in compliance with the provisions of the Act. Adequate notice was given to all directors to schedule the Board Meetings, Agenda and detailed notes on Agenda were sent at least seven days in advance for Meetings other than those held at shorter notice, and a system exists for seeking and obtaining further information and clarifications on the agenda items before the meeting and for meaningful participation at the Meeting. Majority decision is carried through while the dissenting Members’ views are captured and
recorded as part of the Minutes of the Meetings. We further report that there are adequate systems and processes in the Company commensurate with the size and operations of the Company to monitor and ensure compliance with applicable laws, rules, regulations and guidelines. We further report that during the audit period the Company had following events which had bearing on the Company’s affairs in pursuance of the above referred laws, rules,
regulations, standards, guidelines etc.
A. During the year, the Company had issued and redeemed the following Non-Convertible Debentures:
(i) Issued 60,608 Secured Redeemable Non-Convertible Debentures for an aggregate
amount of Rs. 6,060.80 crore.
(ii) Issued 8,000 Unsecured Redeemable Non-Convertible Debentures for an aggregate amount of Rs. 800 crore
(iii) Issued 3,180 Unsecured Redeemable Non-Convertible Debentures in the nature
of Perpetual Debt for an aggregate amount of Rs. 318 crore (iv) Redeemed 71,038 Secured Redeemable Non-Convertible Debentures for an
aggregate amount of Rs. 7,103.80 crore (v) Redeemed 1,500 Unsecured Redeemable Non-Convertible Debentures for an
aggregate amount of Rs. 150 crore.
44

B. The Company had issued and allotted 57,50,00,000 Compulsorily Convertible
Cumulative Preference Shares of Rs. 10 each aggregating Rs. 575 crore, on a rights basis.
C. During the year, the shareholding of the Company in its associate company, i.e. International Asset Reconstruction Company Private Limited had reduced below 20% and thereby IARCL had ceased to be the associate of the Company.
For Parikh & Associates Company Secretaries
Signature
Jigyasa Ved
Mumbai Partner April 30, 2018 FCS No: 6488 CP No: 6018 This Report is to be read with our letter of even date which is annexed as Annexure I and
Forms an integral part of this report.
45

Annexure I To, The Members TATA CAPITAL FINANCIAL SERVICES LIMITED
Our report of even date is to be read along with this letter. 1. Maintenance of secretarial record is the responsibility of the management of the
Company. Our responsibility is to express an opinion on these secretarial records based on our audit.
2. We have followed the audit practices and process as were appropriate to obtain reasonable assurance about the correctness of the contents of the secretarial records. The verification was done on test basis to ensure that correct facts are reflected in secretarial records. We believe that the process and practices we followed, provide a reasonable basis for our opinion.
3. We have not verified the correctness and appropriateness of financial records and Books of Accounts of the Company.
4. Where ever required, we have obtained the Management Representation about the Compliance of laws, rules and regulations and happening of events, etc.
5. The Compliance of the provisions of Corporate and other applicable laws, rules, regulations, standards is the responsibility of management. Our examination was limited to the verification of procedure on test basis.
6. The Secretarial Audit report is neither an assurance as to the future viability of the Company nor of the efficacy or effectiveness with which the management has conducted the affairs of the Company.
For Parikh & Associates
Company Secretaries
Signature
Jigyasa Ved
Mumbai Partner April 30, 2018 FCS No: 6488 CP No: 6018
46

Annexure E
POLICY ON RELATED PARTY TRANSACTIONS
1. Executive Summary
This Policy is being framed with the objective of ensuring compliance with the provisions pertaining to Related Party Transactions in the Companies Act, 2013 (“Act”).
Related Party Transactions referred to throughout this Policy shall mean contracts / arrangements / transactions with a Related Party (as defined under the Act). Accordingly, Related Party Transactions may be entered into by the Company only in accordance with this Policy as amended from time to time.
The Policy covers following sections:-
Objective:- Lays down the intent and requirement for drafting this Policy.
Scope:- To give an overview of the legal provisions applicable to Related Party Transactions and lay down the processes for identifying Related Parties and the Related Party Transaction approval. Definition:- Specifies the key definitions stated in the Act.
Key Principles:- (a) Identification, Review of Related Party Transactions (b) Broad Parameters to Assess: Ordinary Course of Business (c) Broad Parameters to Assess: Arm’s Length (d) Materiality Thresholds for Related Party Transactions
Going forward, the Audit Committee would review and recommend amendments to the Policy, as and when required, subject to the approval of the Board.
2. Objective
Section 188 of the Act and the Rules made thereunder require the approval of the Board and the Shareholders of a company for certain transactions entered into by a company with its Related Parties. Related Party Transactions can present potential or actual conflicts of interest and may raise questions whether such transactions are in the best interest of the Company and its Shareholders. Therefore, this Policy has been adopted by the Company’s Board of Directors, to
ensure high standards of Corporate Governance while dealing with Related Parties and sets forth the procedures under which the Related Party Transactions must be reviewed, approved or ratified and reported.
47

This Policy has been drafted with an objective of ensuring compliance with the provisions pertaining to Related Party Transactions under the Act.
3. Scope
Accordingly, this Policy has been adopted to: (a) give an overview of the legal provisions applicable to Related Party Transactions; (b) lay down the process for identifying Related Parties; (c) identify factors for determinining whether a transaction with a Related Party is:
- on an Arm’s Length basis - in the Ordinary Course of Business
(d) for approval / noting of Related Party Transactions. Note 1:- This Policy is for the purpose of identifying Related Party Transactions and the relevant approval methodology for compliance with the Act and the Rules framed thereunder. Note 2:- Provisions of this Policy would be subject to revision / amendment in accordance with the Rules, Regulations, Notifications, etc. on the subject as may be issued by relevant statutory authorities, from time to time. In case of any amendment(s), clarification(s), circular(s), etc. issued by the relevant authorities, not being consistent with the provisions laid down under this Policy, then such amendment(s), clarification(s), circular(s), etc. shall prevail upon the provisions hereunder and this Policy shall stand amended accordingly from the effective date as laid down under such amendment(s), clarification(s), circular(s), etc.
4. Definition
All capitalised terms used in this Policy document but not defined herein shall have the meaning ascribed to such term in the Act and the Rules framed thereunder, as amended from time to time.
5. Identification and Monitoring of Related Parties
The Secretarial Team shall update the Reference List on the basis of intimations received from the Directors / KMPs or changes in corporate or investment structure, as informed from time to time. The names / details of all Related Parties identified shall be consolidated, as a Reference List and this Reference List shall be updated on a regular basis by the Secretarial Team. This Reference List and subsequent updates, as prepared by the Secretarial Team, shall be progressively shared by the Controllership Team with all Business Heads (Division Heads or higher) / Functional Heads, for compliance at their end. All Related Party Transactions for the period shall be reported to the Company Secretary who shall place the same for approval / noting / ratification by the Audit Committee, in accordance with this Policy.
48

To review a Related Party Transaction, the Board / Audit Committee will be provided with all the relevant information pertaining to the Related Party Transaction, including the name of the related party, the nature of the relationship, nature of the transaction, whether the transaction is in the ‘Ordinary Course of Business’, whether the transaction is at ‘Arm’s Length’ and any other matter, as may be required. The process and controls with respect to identification monitoring of Related Parties and execution of Related Party Transactions would be vis-à-vis an appropriate Framework, as approved by the Board, Audit Committee and Management, instituted for compliance with this Policy. For assessing whether the transaction is in the Ordinary Course of Business and Arm’s Length, Clause 6 of this Policy shall be referred to.
6. Key Principles
A. Broad Parameters to assess - Ordinary Course of Business
The phrase Ordinary Course of Business is not defined under the Act or Rules made thereunder. The Company shall adopt a reasonable approach / methodology to demonstrate ‘Ordinary Course of Business’ which shall, inter alia, include the Nature of the transaction, the frequency / regularity / length of time the company is engaged such transaction, such transaction / action is consistent with the past practices and was taken in the ordinary course of the normal day-to-day operations of such company, common commercial practice i.e. customarily taken, in the ordinary course of the normal day-to-day operations of other companies that is in the same / similar line of business.
The Company shall adopt an appropriate framework to assess whether transactions with related parties are done in the Ordinary Course of Business and Company adopts generally accepted practices and principles in determining whether the transaction is in the ‘Ordinary Course of Business’.
B. Broad Parameters to assess – Arm’s Length
For transactions between two related parties to be considered to be at Arm’s Length Pricing, the transaction should be conducted between the two parties as if the parties were unrelated, so that there is no conflict of interest i.e. Arm’s Length Pricing is the condition or the fact that the two related parties transact as independent (un-related) parties and on an equal footing from one or more of the following aspects viz. nature of goods / services, risk assumed, assets / resources employed, key terms / covenants. In the absence of any guidelines on Arm’s Length Pricing in the Act, the Company shall adopt reasonable approach / methodology to demonstrate Arm’s Length Pricing for the specified Related Party Transactions identified, which shall, inter alia, include, the nature of the transaction, description of functions to be performed, risks to be assumed and assets to be employed, key terms / special terms in the arrangement forming part of a composite transaction; The Company shall adopt an appropriate framework to assess whether transactions with related parties are done at an Arm’s Length and Company adopts generally accepted practices and principles in determining whether the transaction is at “Arm’s Length”.
49

C. Materiality Thresholds for Related Party Transactions
(a) The transactions with Related Parties in the Ordinary Course of Business and at Arm’s Length within the monetary threshold (“de minimis threshold”) as approved by the Audit Committee / Board, from time to time, will be placed before the Audit Committee for noting, on a half-yearly basis.
(b) The Board has stipulated that transactions with Related Parties in the Ordinary
Course of Business and at Arm’s Length that cross the de minimis threshold would require prior approval of the Audit Committee.
(c) The Company follows Materiality Thresholds for Related Party Transactions as per the Companies Act, 2013 and the applicable Rules framed thereunder for transactions with Related Parties which are not in the Ordinary Course of Business and / or not at Arm’s Length basis.
The Company shall institute appropriate framework to provide for approvals / noting of all Related Party Transactions to be in compliance with this Policy.
7. Disclosure
The Policy shall be published on the Company’s website http://www.tatacapital.com.
50

Annexure F
Form No. AOC - 2 (Pursuant to clause (h) of sub-section (3) of Section 134 of the Act and Rule 8(2) of the
Companies (Accounts) Rules, 2014)
Form for disclosure of particulars of contracts/arrangements entered into by the Company with related parties referred to in
sub-section (1) of Section 188 of the Companies Act, 2013 including certain arm’s length transactions under third proviso
thereto
1. Details of contracts or arrangements or transactions not at arm’s length basis - Not Applicable
2. Details of material contracts or arrangement or transactions at arm’s length basis:
Sr. No.
Name of the Related Party
Nature of Relationship
Nature of contracts/ arrangements /
transactions
Amount
(Rs in lakh) Duration of the
contracts / arrangements/
transaction
Salient terms of the contracts or
arrangements or transactions including
the value, if any
Amount paid as
advances, if any
1. Tata Capital Limited (“TCL”)
Holding Company
a) Issue of Compulsorily Convertible Cumulative Preference Shares (“CCCPS”) as Tier-I Capital
57,500 9 years Compulsorily Convertible into Equity Shares after completion of 9 years from the date of allotment or voluntary conversion at the option of the CCCPS holder; Rate of Dividend being 8.5% p.a.
__
b) Inter Corporate Deposits (“ICD”) accepted during the year
4,63,617 Tenor up to 1 year
Cost of Funds at market borrowing rate
__
c) ICDs repaid during the year 4,74,662 Tenor up to 1 year
Not Applicable __
d) Interest expense on ICDs during the year
6,747 Tenor up to 1 year
Cost of Funds at market borrowing rate
__
e) ICDs Outstanding - Payable
33,784 Tenor up to 1 year
Cost of Funds at market borrowing rate
__
f) Dividend paid during the year – Equity Shares
4,541 Not Applicable
Interim Dividend paid for FY 2017-18 during FY 2017-18, at the rate of Rs. 0.35 per Equity Share of Rs. 10 each of the Company.
__
g) Dividend paid during the year – Preference Shares
8,726 Not Applicable
Interim Dividend paid for FY 2017-18 during FY 2017-18, at the rate of 9% / 8.5% p.a, as applicable.
__
h) Security Deposit – Refund received
4,667 Tenor upto 5 years
As per the Agreement entered into between the Company and TCL
__
i) Security Deposit – Given
5,849 Tenor upto 5 years
As per the Agreement entered into between the Company and TCL
__
j) Security Deposit – Outstanding Receivable
5,847 Tenor upto 5 years
As per the Agreement entered into between the Company and TCL
__
k) Issue Perpetual Non-Convertible Debentures as Tier-I Capital
12,500 10 years Yield @ 8.90% p.a. __
51

l) Perpetual Non-Convertible Debentures as Tier-I Capital - Outstanding - Payable
12,500 10 years Yield @ 8.90% p.a. __
2. Tata Business Support Services Limited (“TBSS”)
Fellow Subsidiary
Service Provider Charges 4,374 Tenor upto 5years
Service Level Agreement and Manpower based agreement for Outsourcing services between the Company and TBSS. Key services provided by TBSS mainly includes File processing, Central Operations, Branch Operation, Field Investigation, Collection and Customer Call centre
__
3. Tata Consultancy Services Limited (“TCS”)
Fellow Subsidiary
Service Provider Charges 5,028 Tenor upto 4 years
Service Level Agreement for Information Technology services including Hardware and Software support for payment based on fixed run the business services and variable per assignment services between Company and TCS
__
4. Automotive Stamping And Assemblies Limited
Fellow Subsidiary
a) Loan given during year 4,900 Tenor upto 1 years
Interest @ 11.20% p.a. __
b) Loan repayment received during year
3,500 Tenor upto 1 years
Interest @ 11.20% p.a. __
c) Loan repayment received during year
450 Tenor upto 5 years
Interest @ 11.50% p.a. __
d) Loan – Outstanding - Payable
1,400 Tenor upto 1 years
Interest @ 11.50% p.a. __
e) Loan – Outstanding - Payable
1,184 Tenor upto 5 years
Interest @ 11.50% p.a. __
5 Taj Air Limited Fellow Subsidiary
a) Loan – repayment received
2,500 Tenor upto 5 years
Interest @ 11.00% p.a. __
b) Loan – repayment received
3,500 Tenor upto 5 years
Interest @ 11.25% p.a. __
Note:
1. Appropriate approvals have been taken for Related Party Transactions.
2. Materiality Thresholds for Reporting Related Party Transactions in the ordinary course of business and on an arm’s length bas is is as per the Framework for Related Party Transactions adopted by the Company.
For and on behalf of the Board of Directors
Mumbai Rajiv Sabharwal April 30, 2018 Chairman
52

Annexure G Form No. MGT-9
EXTRACT OF ANNUAL RETURN
as on the Financial Year ended on March 31, 2018 [Pursuant to section 92(3) of the Companies Act, 2013 and Rule 12(1) of the Companies
(Management and Administration) Rules, 2014]
I. REGISTRATION AND OTHER DETAILS
i) CIN: U67100MH2010PLC210201
ii) Registration Date (Date of Incorporation): November 19, 2010
iii) Name of the Company: Tata Capital Financial Services Limited
iv) a) Category: Company limited by shares
b) Sub-Category of the Company: Indian Non-Government Company
v) Address of the Registered Office and contact details:
One Forbes, Dr. V. B. Gandhi Marg, Fort, Mumbai – 400001, Maharashtra, India.
The Registered Office address has changed to 11th Floor, Tower A, Peninsula Business Park, Ganpatrao Kadam Marg, Lower Parel, Mumbai – 400013 with effect from April 1, 2018.
Contact details:
Tel: 91 22 6606 9000
E-mail id: [email protected]
vi) Whether listed company: Yes. As per Section 2(52) of the Companies Act, 2013, the Company is considered as a listed company since its debentures are listed on BSE Limited and the National Stock Exchange of India Limited.
vii) Name, Address and Contact details of Registrar and Transfer Agent, if any
Non – Convertible Debentures issued to the Public
Non – Convertible Debentures issued on a Private Placement basis
Karvy Computershare Private Limited Karvy Selenium Tower B, Plot 31-32, Gachibowli, Financial District, Nanakramguda, Hyderabad – 500 032 Tel: +91 04067161500 Fax: +91 040 23420814 www.karvycomputershare.com e-mail: [email protected]
TSR Darashaw Limited 6-10, Haji Moosa Patrawala Industrial Estate, 20, Dr. E Moses Road, Mahalaxmi, Mumbai – 400011 Tel: 022 66568484 Fax: 022 66568494 Contact: Ms. Nandini Nair e-mail: [email protected]
53

II. PRINCIPAL BUSINESS ACTIVITIES OF THE COMPANY
All the business activities contributing 10% or more of the total turnover of the Company shall be stated:
Sr.
No.
Name and Description of main
products / services
NIC Code of the
product / service
% to total turnover of
the company
1. Financing Activity 64990 91.89%
III. PARTICULARS OF HOLDING, SUBSIDIARY AND ASSOCIATE COMPANIES
Sr.
No.
Name and Address of
the Company
CIN/GLN Holding/
Subsidiary/
Associate
% of
Shares
Held
Applicable
Section
1 Tata Capital Limited1 One Forbes, Dr. V. B. Gandhi Marg, Fort, Mumbai – 400 001
U65990MH1991PLC060670 Holding Company
100% Section 2(46)
2 International Asset Reconstruction Company Private Limited2 709, 7th Floor, Ansal Bhawan, 16, Kasturba Gandhi Marg, New Delhi – 110001
U74999DL2002PTC117357 Associate Company
16.57% Section 2(6)
Note:
1. The Registered Office address has changed from One Forbes, Dr. V. B. Gandhi Marg, Fort,
Mumbai – 400001 to 11th Floor, Tower A, Peninsula Business Park, Ganpatrao Kadam Marg, Lower
Parel, Mumbai – 400013, with effect from April 1, 2018.
2. During FY 2017 – 18, the shareholding of the Company in International Asset Reconstruction
Company Private Limited (“IARC”) reduced from 25.37% to 16.57%. Hence, IARC ceased to be an
Associate of the Company with effect from March 9, 2018.
IV. A. SHARE HOLDING PATTERN (Equity Share Capital Breakup as percentage of Total
Equity)
(i) Category-wise Share Holding
Category of Shareholders
No. of Shares held at the beginning of the year No. of Shares held at the end of the year % Change during
the year
Demat Physical Total % of Total Shares
Demat Physical Total % of Total Shares
A. Promoters (1) Indian a) Individual/HUF b) Central Govt
c) State Govt (s)
d) Bodies Corp.
e) Banks / FI
f) Any Other….
-
-
-
-
-
-
-
-
-
-
-
-
-
-
-
-
-
-
-
-
-
-
129,75,50,000
-
129,75,50,000
-
-
129,75,50,000
-
129,75,50,000
-
-
100
-
100
-
-
-
-
-
-
129,75,50,000
- -
-
-
129,75,50,000
- -
-
-
100
- -
54

Sub-total (A) (1):- (2) Foreign a) NRIs - Individuals
b) Other – Individuals
c) Bodies Corp.
d) Banks / FI
e) Any Other….
Sub-total (A) (2):- Total shareholding of Promoter (A) = (A)(1)+(A)(2)
-
-
-
-
-
-
-
-
-
-
-
-
-
129,75,50,000
-
-
-
-
-
-
129,75,50,000
-
-
-
-
-
-
100
-
-
-
-
-
-
-
129,75,50,000
-
-
-
-
-
129,75,50,000
129,75,50,000
-
-
-
-
-
-
129,75,50,000
100
-
-
-
-
-
-
100
-
-
-
-
-
-
-
B. Public Shareholding
1. Institutions
a) Mutual Funds
b) Banks / FI
c) Central Govt
d) State Govt(s)
e) Venture Capital
Funds
f) Insurance Companies
g) FIIs
h) Foreign Venture Capital Funds
i) Others (specify) Sub-total (B)(1):-
2. Non-Institutions
a) Bodies Corp.
i) Indian
ii) Overseas b) Individuals
i) Individual shareholders holding nominal share capital upto Rs. 1 lakh
ii) Individual shareholders holding nominal share capital in excess of Rs 1 lakh
c) Others (specify) Sub-total (B)(2):- Total Public Shareholding (B)=(B)(1)+ (B)(2)
-
-
-
-
-
-
-
-
-
-
-
-
-
-
-
-
-
-
-
-
-
-
-
-
-
-
-
-
-
-
-
-
-
-
-
-
-
-
-
-
-
-
-
-
-
-
-
-
-
-
-
-
-
-
-
-
-
-
-
-
-
-
-
-
-
-
-
-
-
-
-
-
-
-
-
-
-
-
-
-
-
-
-
-
-
-
-
-
-
-
-
-
-
-
-
-
-
-
-
-
-
-
-
-
-
-
-
-
-
-
-
-
-
-
-
-
-
-
-
-
-
-
-
-
-
-
-
-
-
-
-
-
-
-
-
-
-
-
-
-
-
-
-
-
C. Shares held by Custodian for GDRs & ADRs
-
-
-
-
-
-
-
-
-
Grand Total (A+B+C)
- 129,75,50,000
129,75,50,000 100 - 129,75,50,000
129,75,50,000 100 -
55
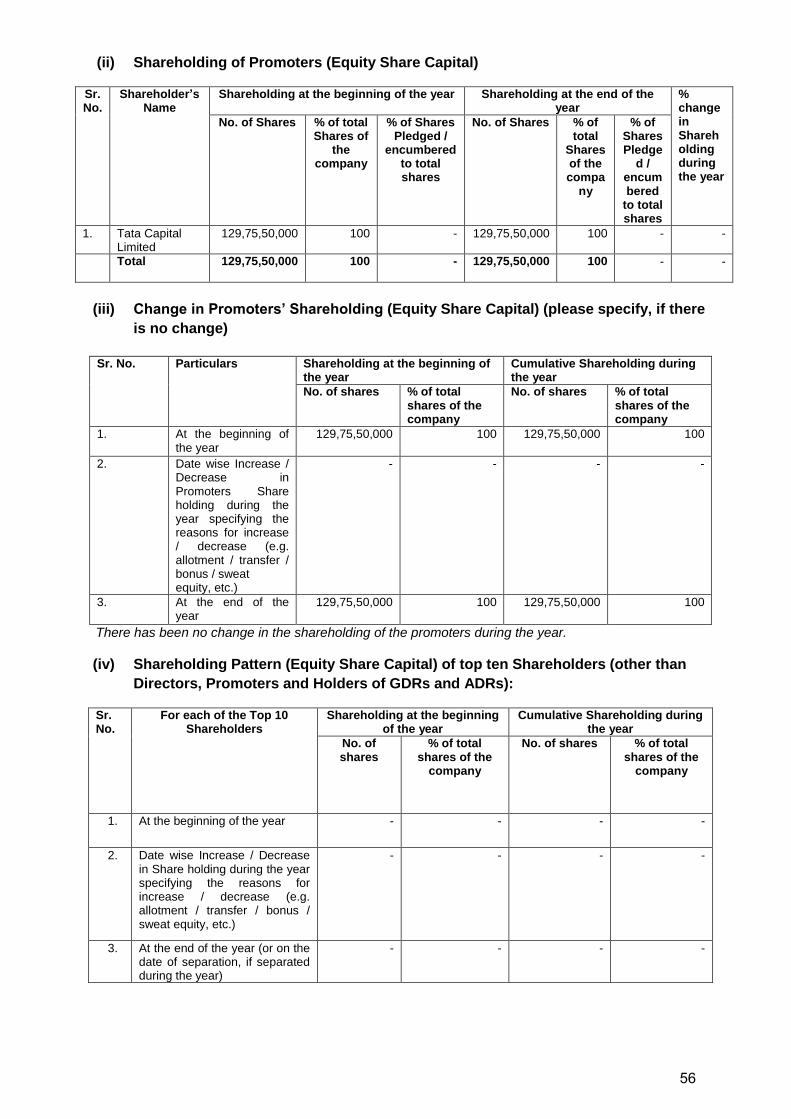
(ii) Shareholding of Promoters (Equity Share Capital)
Sr. No.
Shareholder’s Name
Shareholding at the beginning of the year Shareholding at the end of the year
% change in Shareholding during the year
No. of Shares % of total Shares of
the company
% of Shares Pledged /
encumbered to total shares
No. of Shares % of total
Shares of the compa
ny
% of Shares Pledge
d / encumbered
to total shares
1. Tata Capital Limited
129,75,50,000
100 - 129,75,50,000
100 - -
Total
129,75,50,000 100 - 129,75,50,000 100 - -
(iii) Change in Promoters’ Shareholding (Equity Share Capital) (please specify, if there
is no change)
Sr. No.
Particulars Shareholding at the beginning of the year
Cumulative Shareholding during the year
No. of shares % of total shares of the company
No. of shares % of total shares of the company
1. At the beginning of the year
129,75,50,000 100 129,75,50,000 100
2. Date wise Increase / Decrease in Promoters Share holding during the year specifying the reasons for increase / decrease (e.g. allotment / transfer / bonus / sweat equity, etc.)
- - - -
3. At the end of the year
129,75,50,000 100 129,75,50,000 100
There has been no change in the shareholding of the promoters during the year.
(iv) Shareholding Pattern (Equity Share Capital) of top ten Shareholders (other than
Directors, Promoters and Holders of GDRs and ADRs):
Sr. No.
For each of the Top 10 Shareholders
Shareholding at the beginning of the year
Cumulative Shareholding during the year
No. of shares
% of total shares of the
company
No. of shares
% of total shares of the
company
1. At the beginning of the year - - - -
2. 2.
Date wise Increase / Decrease in Share holding during the year specifying the reasons for increase / decrease (e.g. allotment / transfer / bonus / sweat equity, etc.)
- - - -
3. 3.
At the end of the year (or on the date of separation, if separated during the year)
- - - -
56

(v) Shareholding (Equity Share Capital) of Directors and Key Managerial Personnel:
Sr.
No.
For each of the Directors and KMP
Shareholding at the beginning
of the year
Cumulative Shareholding
during the year
No. of shares
% of total shares of the company
No. of shares % of total shares of the
company
1. At the beginning of the year - - - -
2. Date wise Increase / Decrease in Share holding during the year specifying the reasons for increase / decrease (e.g. allotment / transfer / bonus / sweat equity, etc.)
- - - -
3. At the end of the year - - - -
IV. B. SHARE HOLDING PATTERN (Preference Share Capital Breakup as percentage of Total
Preference)
(i) Category-wise Share Holding
Category of Shareholders
No. of Shares held at the beginning of the year No. of Shares held at the end of the year % Change during
the year
Demat Physical Total % of Total
Shares
Demat Physical Total % of Total
Shares
A. Promoters (1) Indian a) Individual/HUF b) Central Govt
c) State Govt (s)
d) Bodies Corp.
e) Banks / FI
f) Any Other….
Sub-total (A) (1):- (2) Foreign a) NRIs - Individuals
b) Other – Individuals
c) Bodies Corp.
d) Banks / FI
e) Any Other….
Sub-total (A) (2):- Total shareholding of Promoter (A) = (A)(1)+(A)(2)
-
-
-
-
-
-
-
-
-
-
-
-
-
-
-
-
-
94,50,00,000
-
-
94,50,00,000
--
-
-
-
-
-
94,50,00,000
-
-
-
94,50,00,000
-
-
94,50,00,000
-
-
-
-
-
-
94,50,00,000
-
-
-
100
-
-
100
-
-
-
-
-
-
100
-
-
-
-
-
-
-
-
-
-
-
-
-
-
-
-
-
152,00,00,000
-
-
152,00,00,000
--
-
-
-
-
-
152,00,00,000
-
-
-
152,00,00,000
-
-
152,00,00,000
-
-
-
-
-
-
152,00,00,000
-
-
-
100
-
-
100
-
-
-
-
-
-
100
-
-
-
100
-
-
100
-
-
-
-
-
-
100
57

B. Public Shareholding
1. Institutions
a) Mutual Funds
b) Banks / FI
c) Central Govt
d) State Govt(s)
e) Venture Capital
Funds
f) Insurance Companies
g) FIIs
h) Foreign Venture Capital Funds
i) Others (specify) Sub-total (B)(1):-
2. Non-Institutions
a) Bodies Corp.
i) Indian
ii) Overseas b) Individuals
i) Individual shareholders holding nominal share capital upto Rs. 1 lakh
ii) Individual shareholders holding nominal share capital in excess of Rs 1 lakh
c) Others (specify) Sub-total (B)(2):- Total Public Shareholding (B)=(B)(1)+ (B)(2)
-
-
-
-
-
-
-
-
-
-
-
-
-
-
-
-
-
-
-
-
-
-
-
-
-
-
-
-
-
-
-
-
-
-
-
-
-
-
-
-
-
-
-
-
-
-
-
-
-
-
-
-
-
-
-
-
-
-
-
-
-
-
-
-
-
-
-
-
-
-
-
-
-
-
-
-
-
-
-
-
-
-
-
-
-
-
-
-
-
-
-
-
-
-
-
-
-
-
-
-
-
-
-
-
-
-
-
-
-
-
-
-
-
-
-
-
-
-
-
-
-
-
-
-
-
-
-
-
-
-
-
-
-
-
-
-
-
-
-
-
-
-
-
-
C. Shares held by Custodian for GDRs & ADRs
-
-
-
-
-
-
-
-
-
Grand Total (A+B+C)
- 94,50,00,000 94,50,00,000 100
- 152,00,00,000 152,00,00,000 100 100
(ii) Shareholding (Preference Share Capital) of Promoters
Sr. No.
Shareholder’s Name
Shareholding at the beginning of the year Shareholding at the end of the year
% change in Shareholding during the year
No. of Shares
% of total Shares of the company
% of Shares Pledged / encumbered to total shares
No. of Shares % of total Shares of the company
% of Shares Pledged / encumbered to total shares
1. Tata Capital Limited
94,50,00,000 100
- 152,00,00,000 100 - 100
Total 94,50,00,000 100 - 152,00,00,000 100 - 100
58
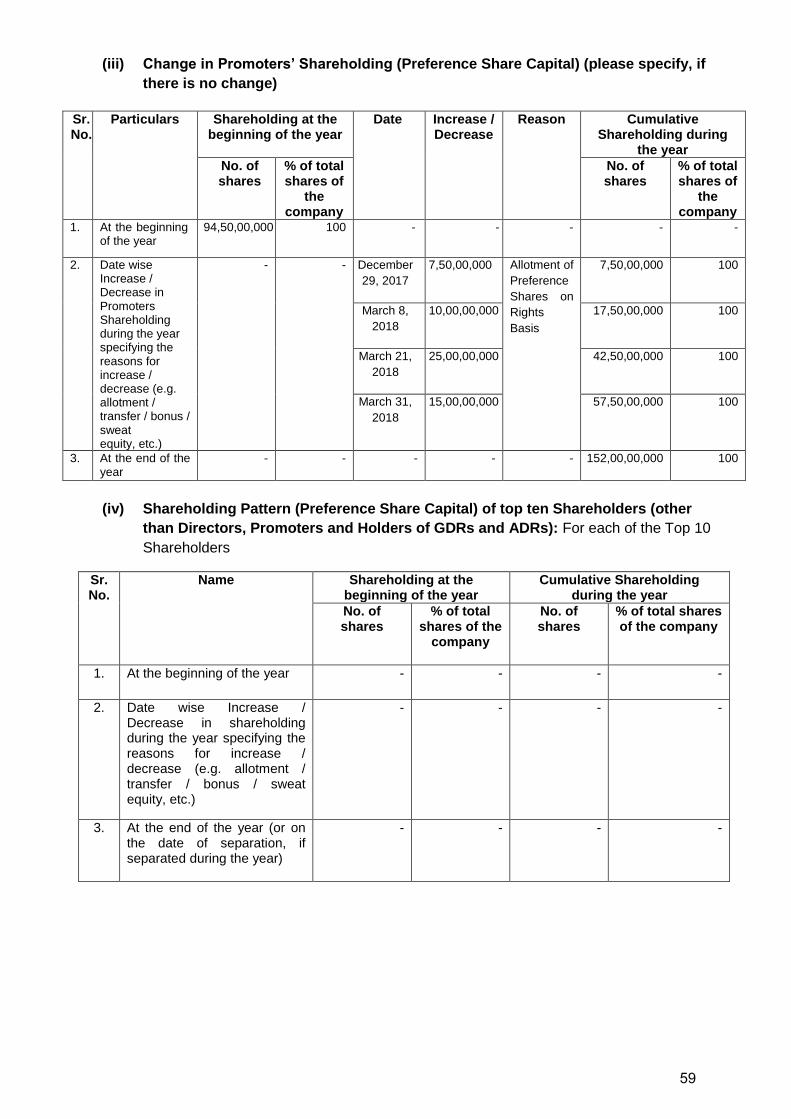
(iii) Change in Promoters’ Shareholding (Preference Share Capital) (please specify, if
there is no change)
Sr. No.
Particulars Shareholding at the beginning of the year
Date Increase / Decrease
Reason Cumulative Shareholding during
the year
No. of shares
% of total shares of
the company
No. of shares
% of total shares of
the company
1. At the beginning of the year
94,50,00,000 100 - - - - -
2. Date wise Increase / Decrease in Promoters Shareholding during the year specifying the reasons for increase / decrease (e.g. allotment / transfer / bonus / sweat equity, etc.)
- - December
29, 2017
7,50,00,000 Allotment of
Preference
Shares on
Rights
Basis
7,50,00,000 100
March 8,
2018
10,00,00,000 17,50,00,000 100
March 21,
2018
25,00,00,000 42,50,00,000 100
March 31,
2018
15,00,00,000 57,50,00,000 100
3. At the end of the year
- - - - - 152,00,00,000 100
(iv) Shareholding Pattern (Preference Share Capital) of top ten Shareholders (other
than Directors, Promoters and Holders of GDRs and ADRs): For each of the Top 10
Shareholders
Sr. No.
Name Shareholding at the beginning of the year
Cumulative Shareholding during the year
No. of shares
% of total shares of the
company
No. of shares
% of total shares of the company
1. At the beginning of the year - - - -
2. Date wise Increase / Decrease in shareholding during the year specifying the reasons for increase / decrease (e.g. allotment / transfer / bonus / sweat equity, etc.)
- - - -
3. At the end of the year (or on the date of separation, if separated during the year)
- - - -
59

(v) Shareholding (Preference Share Capital) of Directors and Key Managerial
Personnel:
Sr.
No.
For each of the Directors
and KMP
Shareholding at the beginning of
the year
Cumulative Shareholding during
the year
No. of shares % of total shares of the company
No. of shares
% of total shares of the company
1. At the beginning of the year - - - -
2. Date wise Increase / Decrease in Shareholding during the year specifying the reasons for increase / decrease (e.g. allotment / transfer / bonus / sweat equity, etc.)
- - - -
3. At the end of the year - - - -
V. INDEBTEDNESS
Indebtedness of the Company including interest outstanding / accrued but not due for payment
(Rs. in Lakhs)
Particulars
Secured Loans
(excluding deposits)
Unsecured
Loans
Deposits Total
Indebtedness
Indebtedness at the beginning of
the financial year:
i) Principal Amount
ii)
ii) Interest due but not paid
iii) Interest accrued but not due
16,48,299
-
72,036
10,45,745
-
13,368
45,544
-
62
27,39,588
-
85,466
Total (i+ii+iii) 17,20,335 10,59,113 45,606 28,25,054
Change in Indebtedness during the
financial year
Addition (Net)
Reduction
22,16,258
(21,90,770)
26,14,770
(22,36,300)
4,70,169
(4,74,662)
53,01,197
(49,01,732)
Net Change
25,488
3,78,470
(4,493)
3,99,465
Indebtedness at the
end of the financial year:
i) Principal Amount
ii) Interest due but not paid
iii) Interest accrued but not due
16,90,952
-
54,871
14,15,345
-
22,238
40,999
-
114
31,47,296
-
77,223
Total (i+ii+iii) 17,45,823 14,37,583 41,113 32,24,519
60

VI. REMUNERATION OF DIRECTORS AND KEY MANAGERIAL PERSONNEL
A. Remuneration to Managing Director, Whole-time Directors and/or Manager:
(Rs. in lakh) Sr. No.
Particulars of Remuneration Name of MD/WTD/ Manager
Total Amount
Mr. Praveen P. Kadle
1.
Gross salary
(a) Salary as per provisions contained in section 17(1) of the Income-tax Act, 1961
(b) Value of perquisites under section
17(2) of the Income-tax Act, 1961
(c) Profits in lieu of salary under section 17(3) of the Income-tax Act, 1961
- -
2. Stock Option
- -
3. Sweat Equity
- -
4. Commission - as % of profit - others, specify…
- -
5. Others, please specify
- -
Total (A)
- -
Ceiling as per the Act 2,170
Note:
Mr. Praveen P. Kadle, Managing Director & CEO, was also the Managing Director & CEO of Tata Capital Limited (“TCL”), the holding company and his entire remuneration was borne by TCL. Mr. Kadle retired as the Managing Director & CEO of the Company and of TCL, with effect from end of day on March 31, 2018.
B. Remuneration to other Directors:
(Rs. in lakh) Sr. No.
Particulars of Remuneration
Name of the Directors Total Amount
1. Independent Directors
Mr. Janki Ballabh Mr. Pranab Kumar Choudhury
Mr. Mukund S. Dharmadhikari
Fee for attending board / committee meetings
Commission
Others, please specify
6.90
25.00
---
17.00
9.30
25.00
16.20
67.00
Total (1) 31.90 17.00 34.30 83.20
2. Other Non-Executive Directors
Ms. Anuradha E. Thakur
Mr. M. D. Mallya Mr. F. N. Subedar
Fee for attending board / committee meetings
Commission
Others, please specify
12.60
25.00
6.90
-
4.00
25.00
23.50
50.00
Total (2) 37.60 6.90 29.00 73.50
Total (B)=(1+2) 156.70
Total Managerial Remuneration 156.70
Overall Ceiling as per the Act 4,774
61

Notes:
1. The Remuneration details as mentioned above include sitting fees paid in FY 2017-18 and Commission
paid for FY 2016-17 in FY 2017-18.
2. Mr. Janki Ballabh ceased to be an Independent Director of the Company, with effect from end of
day on October 23, 2017, consequent upon his retirement in terms of the Governance
Guidelines on Board Effectiveness adopted by the Company.
3. Mr. M. D. Mallya was appointed as a Non – Executive Director, with effect from July 17, 2017.
C. REMUNERATION TO KEY MANAGERIAL PERSONNEL OTHER THAN MD /
MANAGER / WTD
(Rs. in lakh)
Sr. No.
Particulars of Remuneration
Key Managerial Personnel
CEO
Ms. Avan Doomasia, Company Secretary
Mr. Puneet
Sharma, CFO
Total
1. Gross salary (a) Salary as per provisions contained in section 17(1)
of the Income-tax Act, 1961 (b) Value of perquisites under section 17(2) of the
Income-tax Act, 1961 (c) Profits in lieu of salary under section 17(3) of the
Income-tax Act, 1961
- -
- -
2. Stock Option - - - -
3. Sweat Equity - - - -
4. Commission - as % of profit - others, specify…
- - - -
5. Others, please specify - - - -
Total - - - -
Notes: 1. Mr. Praveen P. Kadle, Managing Director & CEO, was also the Managing Director & CEO of Tata Capital
Limited (“TCL”), the holding company and his entire remuneration was borne by TCL. Mr. Kadle retired as the Managing Director & CEO of the Company and of TCL with effect from end of day on March 31, 2018.
2. Mr. Puneet Sharma, Chief Financial Officer, is also the Chief Financial Officer of TCL, the holding company and his entire remuneration is borne by TCL.
3. Ms. Avan K. Doomasia, Company Secretary, is also the Company Secretary of TCL, the holding company and her entire remuneration is borne by TCL.
VII. PENALTIES / PUNISHMENT/ COMPOUNDING OF OFFENCES:
Type Section of the Companies
Act
Brief Description
Details of Penalty /
Punishment / Compounding fees imposed
Authority [RD / NCLT / COURT]
Appeal made, if any (give
Details)
A. COMPANY
Penalty - - - - - Punishment - - - - - Compounding - - - - - B. DIRECTORS
Penalty - - - - - Punishment - - - - - Compounding - - - - - C. OTHER OFFICERS IN DEFAULT
Penalty - - - - -
Punishment - - - - -
Compounding - - - - -
62

Annexure H
DETAILS REQUIRED UNDER SECTION 197(12) OF THE ACT READ WITH RULE 5(1) OF
THE COMPANIES (APPOINTMENT AND REMUNERATION OF MANAGERIAL
PERSONNEL) RULES, 2014 1. The ratio of the remuneration of each Director to the median remuneration of
the employees of the Company for the financial year.
The ratio of remuneration of each Director to the median remuneration of the employees of the Company for FY 2017-18 is, as under:
Name of Director(s) Ratio to Median
Mr. Janki Ballabh1 4.87 : 1 Mr. F. N. Subedar 4.42 : 1 Mr. M. D. Mallya2 3.65 : 1 Mr. Mukund S. Dharmadhikari 5.23 : 1 Ms. Anuradha E. Thakur 5.74 : 1 Mr. Praveen P. Kadle3 Not Applicable
Note:
1. Mr. Janki Ballabh ceased to be an Independent Director of the Company, with effect from end
of day on October 23, 2017, consequent upon his retirement in terms of the Governance
Guidelines on Board Effectiveness adopted by the Company.
2. Mr. M. D. Mallya was appointed as a Non – Executive Director of the Company, with effect from
July 17, 2017.
3. Mr. Praveen P. Kadle was the Managing Director & CEO of the Company and o f Tata
Capital Limited (“TCL”), the holding company. Mr. Kadle d id not draw any remuneration
from the Company and his entire remuneration was borne by TCL. In view of the above, the
ratio of his remuneration to the median remuneration of employees, has not been computed.
Mr. Kadle retired as the Managing Director & CEO with effect from end of day on
March 31, 2018.
2. The percentage increase in remuneration of each Director, Chief Financial Officer,
Chief Executive Officer, Company Secretary, or Manager, if any, in the financial year.
The percentage increase in remuneration of the Directors in FY 2017-18 is, given below:
Name of Director(s) % Increase in
Remuneration
Mr. Janki Ballabh1 16% Mr. F. N. Subedar 15.5% Mr. M. D. Mallya2 Not Applicable Mr. Mukund S. Dharmadhikari 4.3% Ms. Anuradha E. Thakur 20.9% Mr. Praveen P. Kadle3 Not Applicable
63

Note:
1. Mr. Janki Ballabh ceased to be an Independent Director of the Company, with effect from end of day on
October 23, 2017, consequent upon his retirement in terms of the Governance Guidelines on Board
Effectiveness adopted by the Company.
2. Mr. M. D. Mallya was appointed as a Non – Executive Director of the Company, with effect from July 17,
2017.
3. Mr. Praveen P. Kadle was the Managing Director & CEO of the Company and of TCL and
did not draw any remuneration from the Company. His entire remuneration was borne by TCL.
Mr. Kadle retired as the Managing Director & CEO, with effect from end of day on
March 31, 2018.
4. Mr. Puneet Sharma is the Chief Financial Officer of the Company and of TCL and does not
draw any remuneration from the Company. His entire remuneration is borne by TCL.
5. Ms. Avan Doomasia is the Company Secretary of the Company and of TCL and does not draw
any remuneration from the Company. Her entire remuneration is borne by TCL.
3. The percentage increase in the median remuneration of employees in the financial
year.
There is a decrease in the median remuneration of employees in FY 2017-18 by 23.3% as compared to FY 2016-17.
4. The number of permanent employees on the rolls of the Company.
The permanent employees on the rolls of the Company as on March 31, 2018, were 2,612.
5. Average percentile increase already made in the salaries of employees other
than the managerial personnel in the last financial year and its comparison with the
percentile increase in the managerial remuneration and justification thereof and
point out if there are any exceptional circumstances for increase in the managerial
remuneration.
The average percentage increase in the salaries of employees other than that of managerial personnel is 20.4% as compared to that of the percentage increase in the overall managerial remuneration of 24.6%. While the Key Managerial Personnel did not take any remuneration from the Company in FY 2017-18, the increase in the overall managerial remuneration can be attributed to the increase in Commission and also the Sitting Fees, paid to the Non-Executive Directors, on account of increase in the number of Meetings of the Board and its Committees.
6. Affirmation that the remuneration is as per the Remuneration Policy of the
Company.
It is affirmed that the remuneration paid is as per the Remuneration Policy adopted by the Company.
64

Annexure I
MANAGEMENT DISCUSSION AND ANALYSIS REPORT
1. Industry structure and developments
Please refer to Para 2 of the Board’s Report.
2. Opportunities and Threats
The NBFC sector in India is large with significant growth potential and has consistently created value for its shareholders. The NBFC sector has a double digit credit market share and has consistently gained market share from banks over the last 10 years. The growth in the sector appears sustainable as India has a low GDP to credit penetration. Further, many structural factors are supportive of NBFC growth namely weak banks, initiatives of the Reserve Bank of India (“RBI”) on policy alignment and latent credit demand in certain segments not catered to by banks. The sector has been delivering on average, approximately 1.5% to 2% better ROEs, as compared to select banks over the last many years. In order for the sector to sustain its advantages, companies in the sector need to grow in a prudent manner while focusing on automation, financial innovation, analytics, digital and adequate risk management systems and procedures. The RBI constantly issues new regulations and / or modifies existing regulations endeavouring to balance the multiple objectives of financial stability, consumer and depositor protection and regulatory arbitrage concerns. The RBI, however, implements major changes in a structured manner providing companies operating in the sector adequate time to adapt and adjust. The Company is amongst the few NBFCs that offers a full range of Retail and Corporate products and services. A balance in the mix of the portfolio and leveraging the cross-sell potential enables the Company to emerge as a preferred partner for all financial needs of the customer. The Company believes that its digital assets across social, mobile and web providing reach, operating efficiency and improved customer experience will be an opportunity for us to capitalize on in the coming years. Asset quality deterioration may not only wipe the profits out of the Company but eat into its Net Worth. The Company, therefore, needs to ensure that it maintains minimal delinquency levels through adequate levels of provisioning. It will be critical to retain talent at the right cost for effectively building a high performance organization, with an engaged and young workforce. Adequate funding, at the right cost and tenure will be critical to achieve business growth.
65

Newer regulatory updates pose a constant challenge for smooth operations of the Company. The Company needs to be equipped to quickly adapt to the constant changes in regulations and competitive landscape. With new entities like payment banks, small banks, new universal banks and fin-tech companies entering the market place, the Company needs to maintain its competitive edge through constant adaptation and creating strategies to protect its niche. The implementation of and the IND AS will pose its own set of challenges for the Company and NBFC sector as a whole.
3. Segment–wise or product-wise performance of the Company
Please refer to Para 6 of the Board’s Report.
4. Outlook
The Outlook of the Company for the year ahead is to drive profitable growth across all business segments and stabilize its asset quality across its Retail and Rural offerings. The Corporate Finance Division will keenly focus on key customer relationships and the Tata eco-system lending. This Division will look to grow its Supply Chain, Structured Finance and Leasing Business as it has sustainable advantages there. A specialized Remedial team will focus on the recovery and rehabilitation of Non-Performing Assets which have been entirely provided for. The Consumer Finance & Advisory Business will focus on changing its product mix and improving penetration in high yielding segments. The Rural Finance Business will adopt a dual strategy of improving Collection efficiency relating to the Tractor Business and shall increase its geographic presence and focus on marketing retail products in rural areas. The Company, as a whole, will focus on balanced measured growth, asset quality, cross selling opportunities, digital and analytics.
5. Risks and Concerns
Please refer to Para 11 of the Board’s Report.
6. Internal control systems and their adequacy
Please refer to Para 12 of the Board’s Report
7. Discussion on financial performance with respect to operational performance
Please refer to Para 3 of the Board’s Report
8. Material developments in Human Resources / Industrial Relations front, including
number of people employed
Please refer to Para 16 of the Board’s Report.
66

Consolidated Financial
Statements

Independent Auditor’s Report
To the Members of
Tata Capital Financial Services Limited
Report on audit of the Consolidated Financial Statements
We have audited the accompanying consolidated financial statements of Tata Capital Financial
Services Limited (hereinafter referred to as the “Holding Company”) and its associate, comprising
of the Consolidated Balance Sheet as at 31 March 2018, the Consolidated Statement of Profit and
Loss, the Consolidated Cash Flow Statement for the year then ended, and a summary of the
significant accounting policies and other explanatory information (hereinafter referred to as the
“consolidated financial statements”).
Management’s Responsibility for the Consolidated Financial Statements
The Holding Company’s Board of Directors is responsible for the preparation of these consolidated
financial statements in terms of the requirements of the Companies Act, 2013 (hereinafter referred
to as the “Act”) that give a true and fair view of the consolidated state of affairs, consolidated profit
and consolidated cash flows of the Holding Company including its associate in accordance with the
accounting principles generally accepted in India, including the Accounting Standards specified
under Section 133 of the Act., read with Rule 7 of the Companies (Accounts) Rules, 2014. The
respective Board of Directors of the Company and of its associate are responsible for maintenance
of adequate accounting records in accordance with the provisions of the Act for safeguarding of the
assets of the Holding Company and of its associate and for preventing and detecting frauds and other
irregularities; selection and application of appropriate accounting policies; making judgments and
estimates that are reasonable and prudent; and design, implementation and maintenance of adequate
internal financial controls, that were operating effectively for ensuring the accuracy and
completeness of the accounting records, relevant to the preparation and presentation of the
consolidated financial statements that give a true and fair view and are free from material
misstatement, whether due to fraud or error which have been used for the purpose of preparation of
the consolidated financial statements by the Directors of the Holding Company, as aforesaid.
In preparing the consolidated financial statements, the respective Board of Directors of the Holding
Company and its associate are responsible for assessing the ability of the Holding Company and its
associate to continue as a going concern, disclosing, as applicable, matters related to going concern
and using the going concern basis of accounting unless management either intends to liquidate the
Holding Company or to cease operations, or has no realistic alternative but to do so.
Auditor’s Responsibility
Our responsibility is to express an opinion on these consolidated financial statements based on our
audit.
While conducting our audit, we have taken into account the provisions of the Act, the accounting
and auditing standards and matters which are required to be included in the audit report under the
provisions of the Act and the Rules made thereunder.
We conducted our audit in accordance with the Standards on Auditing specified under Section
143(10) of the Act. Those Standards require that we comply with ethical requirements, and plan and
perform the audit to obtain reasonable assurance about whether the consolidated financial statements
are free from material misstatement.
67

Independent Auditor’s Report (Continued)
Tata Capital Financial Services Limited
Auditor’s Responsibility (Continued)
An audit involves performing procedures to obtain audit evidence about the amounts and the
disclosures in the consolidated financial statements. The procedures selected depend on the auditor’s
judgment, including the assessment of the risks of material misstatement of the consolidated financial
statements, whether due to fraud or error. In making those risk assessments, the auditor considers
internal financial control relevant to the Holding Company’s preparation of the consolidated
financial statements that give a true and fair view in order to design audit procedures that are
appropriate in the circumstances. An audit also includes evaluating the appropriateness of the
accounting policies used and the reasonableness of the accounting estimates made, as well as
evaluating the overall presentation of the consolidated financial statements.
We are also responsible to conclude on the appropriateness of management’s use of the going
concern basis of accounting and, based on the audit evidence obtained, whether a material
uncertainty exists related to events or conditions that may cast significant doubt on the entity’s ability
of the Holding Company to continue as a going concern. If we conclude that a material uncertainty
exists, we are required to draw attention in the auditor’s report to the related disclosures in the
consolidated financial statements or, if such disclosures are inadequate, to modify the opinion. Our
conclusions are based on the audit evidence obtained up to the date of the auditor’s report. However,
future events or conditions may cause an entity to cease to continue as a going concern.
We believe that the audit evidence we have obtained is sufficient and appropriate to provide a basis
for our audit opinion on the consolidated financial statements.
Opinion
In our opinion and to the best of our information and according to the explanations given to us and
on the other financial information of the associate, the aforesaid consolidated financial statements
give the information required by the Act in the manner so required and give a true and fair view in
conformity with the accounting principles generally accepted in India, of the state of affairs of the
Holding Company and its associate as at 31 March 2018 and its consolidated profit and its
consolidated cash flows for the year ended on that date.
Other matters
(a) The consolidated financial statements also include the Holding Company’s share of net
profit of Rs. 39 lakhs for the year ended 31 March 2018, in respect of an associate, whose
financial information have not been audited by us. These financial information are unaudited
and have been furnished to us by management and our opinion on the consolidated financial
statements, in so far as it relates to these amounts and disclosures included in respect of this
associate, and our report in terms of sub-section (3) and (11) of Section 143 of the Act in so
far as it relates to the aforesaid associate, is based solely on such unaudited financial
information.
(b) The comparative financial information of the Holding Company and its associate for the
year ended 31 March 2017 included in these financial statements have been audited by the
predecessor auditor who had audited the financial statements for the relevant periods. The
report of the predecessor auditor on the comparative financial information dated 28 April
2017 expressed an unmodified opinion.
Our opinion is not modified in respect of these matters.
Independent Auditor’s Report (Continued)
68

Tata Capital Financial Services Limited
Report on Other Legal and Regulatory Requirements
As required by Section 143(3) of the Act, based on our audit and the consideration of other financial
information of the associate, as noted in the ‘other matter’ paragraph, we report, to the extent
applicable, that:
(a) We have sought and obtained all the information and explanations which to the best of our
knowledge and belief were necessary for the purposes of our audit of the aforesaid
consolidated financial statements.
(b) In our opinion, proper books of account as required by law relating to preparation of the
aforesaid consolidated financial statements have been kept by the Holding Company so far as
it appears from our examination of those books;
(c) The Consolidated Balance Sheet, the Consolidated Statement of Profit and Loss and the
Consolidated Cash Flow Statement dealt with by this Report are in agreement with the relevant
books of account maintained for the purpose of preparation of the consolidated financial
statements.
(d) In our opinion, the aforesaid consolidated financial statements comply with the Accounting
Standards specified under Section 133 of the Act read with Rule 7 of the Companies
(Accounts) Rules, 2014;
(e) On the basis of the written representations received from the directors of the Holding Company
as on 31 March 2018 taken on record by the Board of Directors of the Holding Company, none
of the directors of the Holding Company is disqualified as on 31 March 2018 from being
appointed as a director in terms of Section 164 (2) of the Act;
(f) With respect to the adequacy of the internal financial controls over financial reporting with
reference to the consolidated financial statements of the Holding Company and its associate
and the operating effectiveness of such controls, refer to our separate Report in ”Annexure A”;
and
(g) With respect to the other matters to be included in the Auditor’s Report in accordance with
Rule 11 of the Companies (Audit and Auditor) Rules, 2014, in our opinion and to the best of
our information and according to the explanations given to us:
i. the Holding Company and its associate has no impact of pending litigations on its
financial position in its consolidated financial statements;
ii. Provision has been made in the consolidated financial statements, as required under the
applicable law or accounting standards, for material foreseeable losses, on long-term
contracts including derivative contracts – Refer Note 47(v) to the consolidated financial
statements; and
iii. there were no amounts which are required to be transferred to the Investor Education
and Protection Fund by the Holding Company.
69

Independent Auditor’s Report (Continued)
Tata Capital Financial Services Limited
Report on Other Legal and Regulatory Requirements
iv. The disclosures in the consolidated financial statements regarding holdings as well as
dealings in specified bank notes during the period from 8 November 2016 to 30
December 2016 have not been made since they do not pertain to the financial year ended
31 March 2018. However, amounts as appearing in the audited consolidated financial
statements for the year ended 31 March 2017 have been disclosed.
For B S R & Co. LLP
Chartered Accountants
Firm's Registration No: 101248W/W-100022
Mumbai Partner
30 April 2018 Membership No: 046882
70

Tata Capital Financial Services Limited
Annexure A to the Independent Auditor’s Report of even date on the
consolidated financial statements
Report on the Internal Financial Controls under Clause (i) of Sub-section 3 of Section
143 of the Companies Act, 2013 (the “Act”)
We have audited the internal financial controls over financial reporting of the Tata Capital
Financial Services Limited as of 31 March 2018 in conjunction with our audit of the consolidated
financial statements of the Holding Company for the year ended on that date.
Management’s Responsibility for Internal Financial Controls
The Holding Company’s management is responsible for establishing and maintaining internal
financial controls based on “the internal control over financial reporting criteria established by the
Holding Company considering the essential components of internal control stated in the Guidance
Note on Audit of Internal Financial Controls over Financial Reporting (the ‘Guidance Note’)
issued by the Institute of Chartered Accountants of India” (the ‘ICAI’). These responsibilities
include the design, implementation and maintenance of adequate internal financial controls that
were operating effectively for ensuring the orderly and efficient conduct of its business, including
adherence to company’s policies, the safeguarding of its assets, the prevention and detection of
frauds and errors, the accuracy and completeness of the accounting records, and the timely
preparation of reliable financial information, as required under the Act.
Auditors’ Responsibility
Our responsibility is to express an opinion on the Holding Company's internal financial controls
over financial reporting based on our audit. We conducted our audit in accordance with the
Guidance Note and the Standards on Auditing, issued by the ICAI and deemed to be prescribed
under section 143(10) of the Act, to the extent applicable to an audit of internal financial controls,
both applicable to an audit of Internal Financial Controls and, both issued by the ICAI. Those
Standards and the Guidance Note require that we comply with ethical requirements and plan and
perform the audit to obtain reasonable assurance about whether adequate internal financial controls
over financial reporting was established and maintained and if such controls operated effectively in
all material respects.
Our audit involves performing procedures to obtain audit evidence about the adequacy of the
internal financial controls system over financial reporting and their operating effectiveness. Our
audit of internal financial controls over financial reporting included obtaining an understanding of
internal financial controls over financial reporting, assessing the risk that a material weakness
exists, and testing and evaluating the design and operating effectiveness of internal control based
on the assessed risk. The procedures selected depend on the auditor’s judgment, including the
assessment of the risks of material misstatement of the financial statements, whether due to fraud
or error.
We believe that the audit evidence we have obtained is sufficient and appropriate to provide a basis
for our audit opinion on the Holding Company’s internal financial controls system over financial
reporting.
71
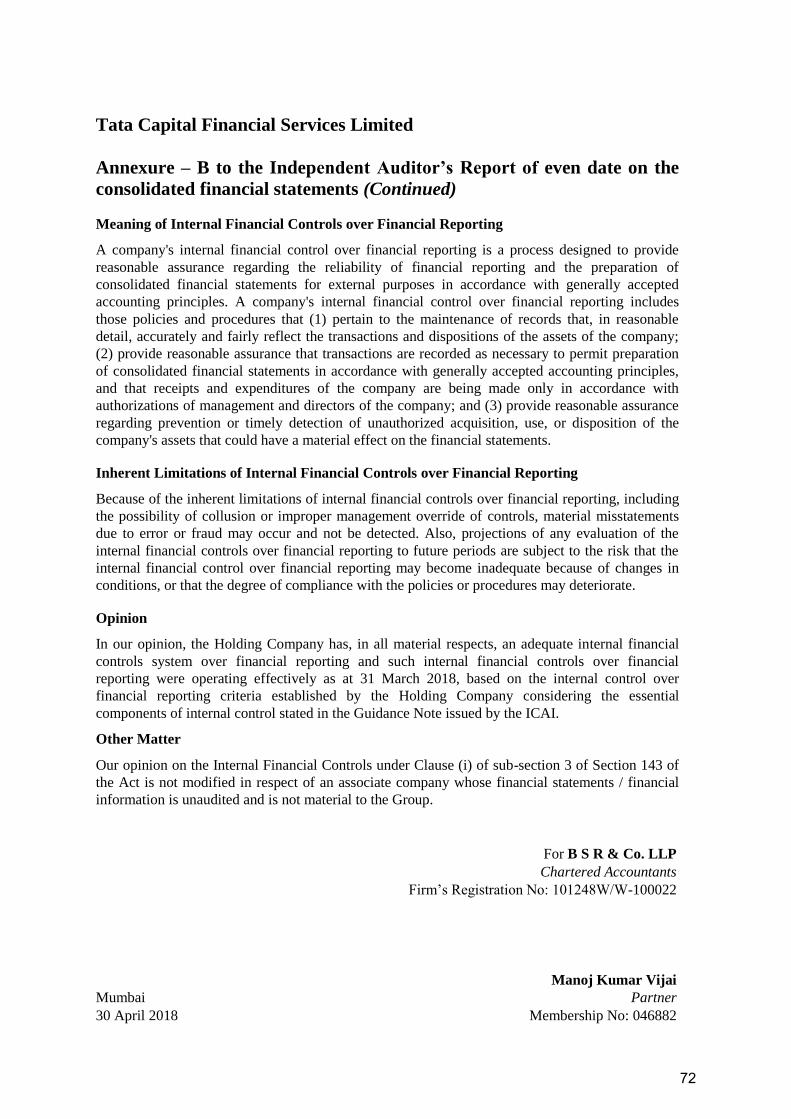
Tata Capital Financial Services Limited
Annexure – B to the Independent Auditor’s Report of even date on the
consolidated financial statements (Continued)
Meaning of Internal Financial Controls over Financial Reporting
A company's internal financial control over financial reporting is a process designed to provide
reasonable assurance regarding the reliability of financial reporting and the preparation of
consolidated financial statements for external purposes in accordance with generally accepted
accounting principles. A company's internal financial control over financial reporting includes
those policies and procedures that (1) pertain to the maintenance of records that, in reasonable
detail, accurately and fairly reflect the transactions and dispositions of the assets of the company;
(2) provide reasonable assurance that transactions are recorded as necessary to permit preparation
of consolidated financial statements in accordance with generally accepted accounting principles,
and that receipts and expenditures of the company are being made only in accordance with
authorizations of management and directors of the company; and (3) provide reasonable assurance
regarding prevention or timely detection of unauthorized acquisition, use, or disposition of the
company's assets that could have a material effect on the financial statements.
Inherent Limitations of Internal Financial Controls over Financial Reporting
Because of the inherent limitations of internal financial controls over financial reporting, including
the possibility of collusion or improper management override of controls, material misstatements
due to error or fraud may occur and not be detected. Also, projections of any evaluation of the
internal financial controls over financial reporting to future periods are subject to the risk that the
internal financial control over financial reporting may become inadequate because of changes in
conditions, or that the degree of compliance with the policies or procedures may deteriorate.
Opinion
In our opinion, the Holding Company has, in all material respects, an adequate internal financial
controls system over financial reporting and such internal financial controls over financial
reporting were operating effectively as at 31 March 2018, based on the internal control over
financial reporting criteria established by the Holding Company considering the essential
components of internal control stated in the Guidance Note issued by the ICAI.
Other Matter
Our opinion on the Internal Financial Controls under Clause (i) of sub-section 3 of Section 143 of
the Act is not modified in respect of an associate company whose financial statements / financial
information is unaudited and is not material to the Group.
For B S R & Co. LLP
Chartered Accountants
Firm’s Registration No: 101248W/W-100022
Manoj Kumar Vijai
Mumbai Partner
30 April 2018 Membership No: 046882
72

Note
No.
As at
March 31,
2018
As at
March 31,
2017
Rs in lakh Rs in lakh
I. EQUITY AND LIABILITIES
1. Shareholders' funds
(a) Share Capital 3 281,755 224,255
(b) Reserves and Surplus 4 214,963 182,694
496,718 406,949
2. Non-current liabilities
(a) Long-term borrowings 5 1,286,761 945,684
(b) Other long-term liabilities 6 841 7,019
(c) Long-term provisions 7 25,795 36,482
1,313,397 989,185
3. Current liabilities
(a) Short-term borrowings 8 1,293,081 1,006,630
(b) Trade payables 9
(i) Total outstanding dues of micro enterprises and small enterprises 9(a) - -
(ii) Total outstanding dues of creditors other than micro enterprises and small enterprises 52,497 44,538
(c) Other current liabilities 10 682,314 897,201
(d) Short-term provisions 11 90,685 106,050
2,118,577 2,054,419
3,928,692 3,450,553
II. ASSETS
1. Non-Current assets
(a) Property, plant and equipment 12
(i) Tangible assets 69,000 77,052
(ii) Intangible assets 2,314 1,109
(iii) Capital work-in-progress 101 518
(iv) Intangible assets under development 39 655
71,454 79,334
(b) Non-current investments 13 31,180 26,650
(c) Deferred tax assets (net) 14 37,568 43,483
(d) Long-term Loans and advances - financing activity 15 1,712,458 1,515,844
(e) Long-term Loans and advances - others 16 31,226 21,511
(f) Other non-current assets 17 7,436 7,078
1,819,868 1,614,566
2. Current assets
(a) Current investments 13 170 794
(b) Trade receivables 18 6,246 2,049
(c) Cash and bank balances 19 12,534 7,340
(d) Short-term Loans and advances - financing activity 15 1,978,866 1,704,903
(e) Short-term Loans and advances - others 20 23,953 26,603
(f) Other current assets 21 15,601 14,964
2,037,370 1,756,653
3,928,692 3,450,553
2
See accompanying notes forming part of the financial statements 1-45
In terms of our report of even date For and on behalf of the Board of Directors
For B S R & Co. LLP Mukund S. Dharmadhikari Anuradha E. Thakur F.N. Subedar
Chartered Accountants (Director) (Director) (Director)
Firms Registration No – 101248W/W-100022 (DIN No. : 05003224) (DIN No. : 06702919) (DIN No. : 00028428)
Manoj Kumar Vijai M. D. Mallya Rajiv Sabharwal Kusal Roy
Partner (Director) (Director) (Managing Director)
Membership No: 046882 (DIN No. : 01804955) (DIN No. : 00057333) (DIN No. : 02268654)
Place: Mumbai Puneet Sharma Avan Doomasia
(Chief Financial Officer) (Company Secretary)
TATA CAPITAL FINANCIAL SERVICES LIMITED
CONSOLIDATED BALANCE SHEET AS AT MARCH 31, 2018
TOTAL
TOTAL
Particulars
Date : April 30, 2018
Summary of significant accounting policies
73

Note
No.
For the Year Ended
March 31, 2018
For the Year Ended
March 31, 2017
F
o
r
t
Rs in lakh Rs in lakh R
s
I Revenue from operations 22 420,701 384,660
II Investment income 23 249 5,548
III Other income 24 34,587 28,996
IV Total Revenue (I + II + III) 455,537 419,204
V Expenses :
Finance costs 25 223,074 221,162
Employee benefit expenses 26 39,721 35,258
Other operating expenses 27 94,327 114,715
Depreciation and amortisation 12 23,637 14,273
Amortisation of expenses 21(a) 598 549
Total expenses 381,357 385,957
VI Profit before tax (IV - V) 74,180 33,247
VII Tax expense
(1) Current tax 20,007 19,618
(2) Deferred tax 5,915 (7,969)
Net tax expense 25,922 11,649
VIII 48,258 21,598
IX Share of profit of associates 39 204
X Profit for the year ( VIII + IX) 48,297 21,802
XI Earnings per equity share:
(1) Basic (in Rupees) 2.91 1.29
(2) Diluted (in Rupees) 2.91 1.29
Face Value per share (in Rupees) 10 10
Summary of significant accounting policies 2
See accompanying notes forming part of the financial statements 1-45
In terms of our report of even date For and on behalf of the Board of Directors
For B S R & Co. LLP Mukund S. Dharmadhikari Anuradha E. Thakur F.N. Subedar
Chartered Accountants (Director) (Director) (Director)
Firms Registration No – 101248W/W-100022 (DIN No. : 05003224) (DIN No. : 06702919) (DIN No. : 00028428)
Manoj Kumar Vijai M. D. Mallya Rajiv Sabharwal Kusal Roy
Partner (Director) (Director) (Managing Director)
Membership No: 046882 (DIN No. : 01804955) (DIN No. : 00057333) (DIN No. : 02268654)
Place: Mumbai Puneet Sharma Avan Doomasia
Date : April 30, 2018 (Chief Financial Officer) (Company Secretary)
TATA CAPITAL FINANCIAL SERVICES LIMITED
CONSOLIDATED STATEMENT OF PROFIT AND LOSS FOR THE YEAR ENDED MARCH 31, 2018
Particulars
Profit after tax before share of associates & minority interest (VI-VII)
74
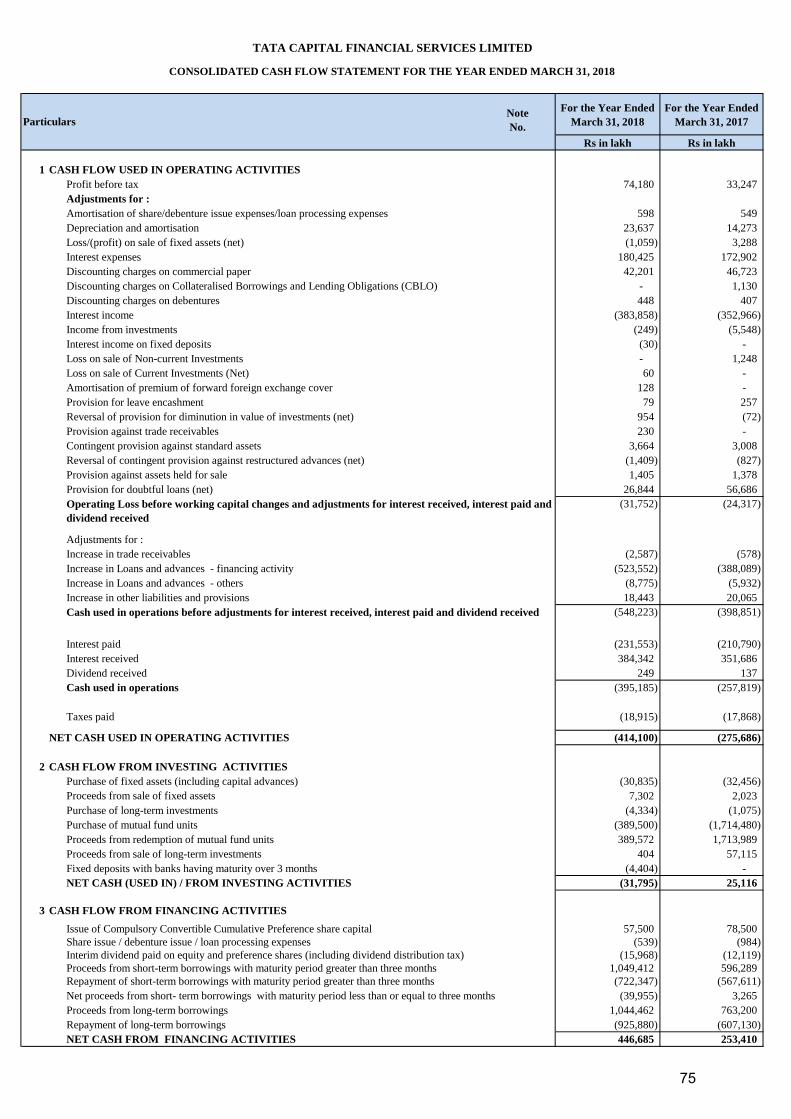
Note
No.
For the Year Ended
March 31, 2018
For the Year Ended
March 31, 2017
Rs in lakh Rs in lakh
1 CASH FLOW USED IN OPERATING ACTIVITIES
Profit before tax 74,180 33,247
Adjustments for :
Amortisation of share/debenture issue expenses/loan processing expenses 598 549
Depreciation and amortisation 23,637 14,273
Loss/(profit) on sale of fixed assets (net) (1,059) 3,288
Interest expenses 180,425 172,902
Discounting charges on commercial paper 42,201 46,723
Discounting charges on Collateralised Borrowings and Lending Obligations (CBLO) - 1,130
Discounting charges on debentures 448 407
Interest income (383,858) (352,966)
Income from investments (249) (5,548)
Interest income on fixed deposits (30) -
Loss on sale of Non-current Investments - 1,248
Loss on sale of Current Investments (Net) 60 -
Amortisation of premium of forward foreign exchange cover 128 -
Provision for leave encashment 79 257
Reversal of provision for diminution in value of investments (net) 954 (72)
Provision against trade receivables 230 -
Contingent provision against standard assets 3,664 3,008
Reversal of contingent provision against restructured advances (net) (1,409) (827)
Provision against assets held for sale 1,405 1,378
Provision for doubtful loans (net) 26,844 56,686
(31,752) (24,317)
Adjustments for :
Increase in trade receivables (2,587) (578)
Increase in Loans and advances - financing activity (523,552) (388,089)
Increase in Loans and advances - others (8,775) (5,932)
Increase in other liabilities and provisions 18,443 20,065
(548,223) (398,851)
Interest paid (231,553) (210,790)
Interest received 384,342 351,686
Dividend received 249 137
Cash used in operations (395,185) (257,819)
Taxes paid (18,915) (17,868)
NET CASH USED IN OPERATING ACTIVITIES (414,100) (275,686)
2 CASH FLOW FROM INVESTING ACTIVITIES
(30,835) (32,456)
7,302 2,023
Purchase of long-term investments (4,334) (1,075)
Purchase of mutual fund units (389,500) (1,714,480)
Proceeds from redemption of mutual fund units 389,572 1,713,989
Proceeds from sale of long-term investments 404 57,115
Fixed deposits with banks having maturity over 3 months (4,404) -
NET CASH (USED IN) / FROM INVESTING ACTIVITIES (31,795) 25,116
3 CASH FLOW FROM FINANCING ACTIVITIES
Issue of Compulsory Convertible Cumulative Preference share capital 57,500 78,500
Share issue / debenture issue / loan processing expenses (539) (984)
Interim dividend paid on equity and preference shares (including dividend distribution tax) (15,968) (12,119)
Proceeds from short-term borrowings with maturity period greater than three months 1,049,412 596,289
Repayment of short-term borrowings with maturity period greater than three months (722,347) (567,611)
Net proceeds from short- term borrowings with maturity period less than or equal to three months (39,955) 3,265
Proceeds from long-term borrowings 1,044,462 763,200
Repayment of long-term borrowings (925,880) (607,130)
NET CASH FROM FINANCING ACTIVITIES 446,685 253,410
CONSOLIDATED CASH FLOW STATEMENT FOR THE YEAR ENDED MARCH 31, 2018
TATA CAPITAL FINANCIAL SERVICES LIMITED
Operating Loss before working capital changes and adjustments for interest received, interest paid and
dividend received
Cash used in operations before adjustments for interest received, interest paid and dividend received
Proceeds from sale of fixed assets
Purchase of fixed assets (including capital advances)
Particulars
75

Cash flow statement continued….
Note
No.
For the Year Ended
March 31, 2018
For the Year Ended
March 31, 2017
Rs in lakh Rs in lakh
NET INCREASE IN CASH AND CASH EQUIVALENTS 790 2,840
CASH AND CASH EQUIVALENTS AS AT THE BEGINNING OF THE YEAR 7,284 4,444
CASH AND CASH EQUIVALENTS AS AT THE END OF THE YEAR 8,074 7,284
Reconciliation of cash and cash equivalents as above with cash and bank balances
Cash and Cash equivalents at the end of the year as per above 8,074 7,284
Add : Restricted Cash [Refer note 19(iii)] 53 53
Add: Fixed deposits with original maturity over 3 months 4,407 3
CASH AND BANK BALANCES AS AT THE END OF THE YEAR [REFER NOTE 19] 12,534 7,340
2
See accompanying notes forming part of the financial statements 1-45
In terms of our report of even date For and on behalf of the Board of Directors
For B S R & Co. LLP Mukund S. Dharmadhikari Anuradha E. Thakur F.N. Subedar
Chartered Accountants (Director) (Director) (Director)
Firms Registration No – 101248W/W-100022 (DIN No. : 05003224) (DIN No. : 06702919) (DIN No. : 00028428)
Manoj Kumar Vijai M. D. Mallya Rajiv Sabharwal Kusal Roy
Partner (Director) (Director) (Managing Director)
Membership No: 046882 (DIN No. : 01804955) (DIN No. : 00057333) (DIN No. : 02268654)
Puneet Sharma Avan Doomasia
Date : April 30, 2018 (Chief Financial Officer) (Company Secretary)
Place: Mumbai
Particulars
Summary of significant accounting policies
76

TATA CAPITAL FINANCIAL SERVICES LIMITED
NOTES FORMING PART OF THE FINANCIAL STATEMENTS
1. CORPORATE INFORMATION
2. SIGNIFICANT ACCOUNTING POLICIES
i. Basis of accounting and preparation of the consolidated financial statements
ii. Principles of Consolidation
iii. Use of Estimates
iv. Revenue recognition
a. Income on Loan transactions
b. Income from Non-current and Current Investments
c. Income from Services
d. Income from distribution of financial products
Sourcing income is recognised on accrual basis when there is a reasonable certainty of its ultimate realisation.
Tata Capital Financial Services Limited (the "Company") is a wholly owned subsidiary of Tata Capital Limited and a Systemically
Important Non Deposit Accepting Non-Banking Finance Company (“NBFC”), holding a Certificate of Registration from the Reserve Bank
of India (“RBI”) dated November 4, 2011.
The consolidated financial statements of Tata Financial Services Capital Limited (the "Company" / "Group") have been prepared in
accordance with the Generally Accepted Accounting Principles in India (Indian GAAP) to comply with the Accounting Standards
specified under Section 133 of the Companies Act, 2013 ("the Act") and the relevant provisions of the Act, as applicable. The
consolidated financial statements have been prepared on accrual basis under the historical cost convention. The accounting policies
adopted in the preparation of the consolidated financial statements are consistent with those followed in the previous year.
Current assets do not include elements which are not expected to be realised within one year and current liabilities do not include
items which are due after one year.
The preparation of financial statements require the management of the Company to make estimates and assumptions that affect the
reported balances of assets and liabilities and disclosures relating to the contingent liabilities as at the date of the financial
statements and reported amounts of income and expenses for the reporting period. The management believes that the estimates used
in preparation of the financial statements are prudent and reasonable. Future results could differ from these estimates. Any revision
to accounting estimates is recognised prospectively in the current and future periods. Example of such estimates includes provision
for non - performing loans, provision for employee benefit plans and provision for income taxes.
Interest income is recognized on a time proportion basis taking into account the amount outstanding and the interest rate
applicable, except that no income is recognised on non-performing assets as per the prudential norms for income recognition
issued by the RBI for NBFCs. Interest income on such assets is recognised on receipt basis.
Fees for financial advisory services are accounted based on stage of completion of assignments, when there is reasonable
certainty of its ultimate realisation.
Revenue from brokerage is recognised when the service is performed. Trail brokerage is recognised at the end of the
measurement period when the pre-defined thresholds are met. Revenue is net of taxes and sub-brokerage.
Premium / Discount on investments, which is the difference between the acquisition cost and face value of debt instrument is
recognised as interest income over the tenor of the instruments.
Redemption premium on investments (except on preference shares) is recognised as income over the tenor of the investment.
Upfront / processing fees collected from the customer for processing loans are primarily towards documentation charges. These
are accounted as income when the amount becomes due provided recovery thereof is reasonably certain.
Dealer subvention income and service charges are collected at the time of inception of the contract. These are accounted over
the tenure of the loan in the proportion of interest earned to total interest receivable during the tenure of loans.
Income from dividend on shares of corporate bodies and units of mutual funds is accounted on accrual basis when the
Company’s right to receive dividend is established.
Interest income on bonds and debentures is recognised on a time proportion basis taking into account the amount outstanding
and the rate applicable.
The consolidated financial statements relate to Tata Capital Financial Services Limited (the "Company") and the Company's share of
profit / loss in its associates. The consolidated financial statements have been prepared on the following basis:
a) The financial statements of associate used in the consolidation are drawn upto the same reporting date as that of the Company i.e.,
March 31, 2018 or upto the date on which it ceased to be an associate of the Company whichever is earlier.
b) The consolidated financial statements include the share of profit/ (loss) of associate company, which have been accounted for
using the equity method as per AS 23 (Accounting for Investments in Associates in Consolidated Financial Statements).
Accordingly, the share of profit/ (loss) of the associate company (the loss being restricted to the cost of the investment) has been
added/deducted to the costs of investments.
c) The difference between the cost of investment in the associate and the share of net assets at the time of acquisition of shares in the
associate is identified in the consolidated financial statements as Goodwill or Capital Reserve as the case may be and adjusted
against the carrying amount of investment in the associate.
77

e. Lease income
v. Provisions for Standard/Non-Performing Assets and Doubtful Debts
vi. Investments
Investments are classified into non-current and current investments.
a. Non-current investments
b. Current investments
vii. Property, plant and equipment
a. Tangible:
b. Intangible:
Acquired intangible assets other than Goodwill are measured at cost less amortisation.
c. Capital work-in-progress:
d. Intangible assets under development:
The Company provides an allowance for loan receivables and debentures/bonds in the nature of advance based on the prudential
norms issued by the Reserve Bank of India ('RBI') relating to income recognition, asset classification and provisioning for non-
performing assets. The provision for standard assets is made as per prudential norms prescribed by RBI, through master directions
or notifications as amended. In addition to the abovementioned provisioning norms as prescribed by RBI, the Company also fully
provides for/ writes off the entire receivables as per the Guidelines approved by the Board of Directors from time to time, where any
of the installments are overdue :
- for a period exceeding 27 months for loan against property
- for a period exceeding 11 months for construction equipments, auto and commercial vehicles
- for a period exceeding 10 months for two wheeler and personal loan and
- for a period exceeding 6 months for consumer durables
In addition, the Company provides for Restructured Assets (Standard Assets and Non-performing) as required by the directions
issued by the RBI from time to time.
Non-current investments are investments intended to be held for a period of more than a year. Non-current investments are
carried individually at cost less provision for diminution, other than temporary, in the value of such investments.
Projects under which tangible fixed assets are not yet ready for their intended use are carried at cost, comprising direct cost,
related incidental expenses and attributable interest.
Tangible property, plant and equipment acquired by the Company are reported at acquisition cost, with deductions for
accumulated depreciation and impairment losses, if any.
The acquisition cost includes any cost attributable for bringing asset to its working condition, which comprises of purchase
consideration, other directly attributable costs of bringing the assets to their working condition for their intended use and
attributable interest.
The Company has adopted the provisions of para 46 / 46A of AS 11 (The Effects of Changes in Foreign Exchange Rates),
accordingly, exchange differences arising on restatement / settlement of long-term foreign currency borrowings relating to
acquisition of depreciable property, plant and equipment are adjusted to the cost of the respective assets and depreciated over
the remaining useful life of such assets
Goodwill is stated at cost. Goodwill comprises the portion of a purchase price for an acquisition that exceeds the market value
of the identifiable assets, with deductions for liabilities, calculated on the date of acquisition.
Expenses on software support and maintenance are charged to the Statement of Profit and Loss during the year in which such
costs are incurred.
Assets given on operating lease are capitalised at cost. Rentals received or receivable by the Company are recognised in the
Statement of Profit and Loss on a straight-line basis over the lease term, provided recovery is certain
Assets given under finance lease are recognised as a receivable at an amount equal to the net investment in the lease. Lease
rentals are apportioned between principal and interest on the internal rate of return. The principal amount received reduces the
net investment in the lease and interest is recognised as revenue.
Expenditure on development eligible for capitalisation is carried as Intangible assets under development where such assets are
not yet ready for their intended use.
Current investments are investments intended to be held for a period of less than a year. Current investments are stated at the
lower of cost and market value, determined on an individual investment basis.
78
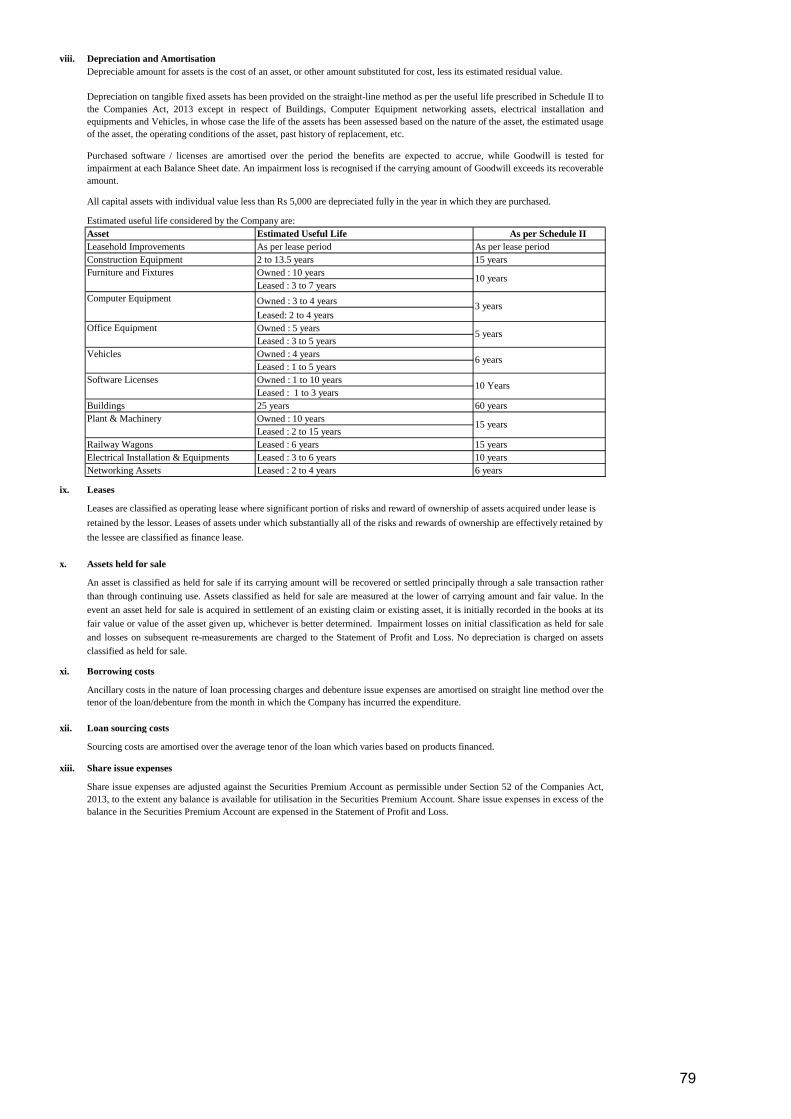
viii. Depreciation and Amortisation
Estimated useful life considered by the Company are:
Asset Estimated Useful Life
Leasehold Improvements As per lease period As per lease period
Construction Equipment 2 to 13.5 years 15 years
Owned : 10 years
Leased : 3 to 7 years
Owned : 3 to 4 years
Leased: 2 to 4 years
Owned : 5 years
Leased : 3 to 5 years
Vehicles Owned : 4 years
Leased : 1 to 5 years
Owned : 1 to 10 years
Leased : 1 to 3 years
Buildings 25 years 60 years
Owned : 10 years
Leased : 2 to 15 years
Railway Wagons Leased : 6 years 15 years
Electrical Installation & Equipments Leased : 3 to 6 years 10 years
Networking Assets Leased : 2 to 4 years 6 years
ix. Leases
x. Assets held for sale
xi. Borrowing costs
xii. Loan sourcing costs
xiii. Share issue expenses
An asset is classified as held for sale if its carrying amount will be recovered or settled principally through a sale transaction rather
than through continuing use. Assets classified as held for sale are measured at the lower of carrying amount and fair value. In the
event an asset held for sale is acquired in settlement of an existing claim or existing asset, it is initially recorded in the books at its
fair value or value of the asset given up, whichever is better determined. Impairment losses on initial classification as held for sale
and losses on subsequent re-measurements are charged to the Statement of Profit and Loss. No depreciation is charged on assets
classified as held for sale.
Depreciable amount for assets is the cost of an asset, or other amount substituted for cost, less its estimated residual value.
Depreciation on tangible fixed assets has been provided on the straight-line method as per the useful life prescribed in Schedule II to
the Companies Act, 2013 except in respect of Buildings, Computer Equipment networking assets, electrical installation and
equipments and Vehicles, in whose case the life of the assets has been assessed based on the nature of the asset, the estimated usage
of the asset, the operating conditions of the asset, past history of replacement, etc.
Purchased software / licenses are amortised over the period the benefits are expected to accrue, while Goodwill is tested for
impairment at each Balance Sheet date. An impairment loss is recognised if the carrying amount of Goodwill exceeds its recoverable
amount.
All capital assets with individual value less than Rs 5,000 are depreciated fully in the year in which they are purchased.
Software Licenses
Plant & Machinery
Computer Equipment
Office Equipment
Furniture and Fixtures
As per Schedule II
10 years
3 years
5 years
6 years
10 Years
15 years
Leases are classified as operating lease where significant portion of risks and reward of ownership of assets acquired under lease is
retained by the lessor. Leases of assets under which substantially all of the risks and rewards of ownership are effectively retained by
the lessee are classified as finance lease.
Ancillary costs in the nature of loan processing charges and debenture issue expenses are amortised on straight line method over the
tenor of the loan/debenture from the month in which the Company has incurred the expenditure.
Share issue expenses are adjusted against the Securities Premium Account as permissible under Section 52 of the Companies Act,
2013, to the extent any balance is available for utilisation in the Securities Premium Account. Share issue expenses in excess of the
balance in the Securities Premium Account are expensed in the Statement of Profit and Loss.
Sourcing costs are amortised over the average tenor of the loan which varies based on products financed.
79

xiv. Employee Benefits
xv. Provisions, Contingent Liabilities and Contingent Assets
xvi. Impairment of Assets
At each Balance Sheet date, the Company reviews, whether there is any indication of impairment of an asset. If any such condition
exists, the recoverable amount of the asset is estimated in order to determine the extent of impairment loss (if any).
Recoverable amount of the asset is the higher of an asset’s net selling price and value in use. In assessing the value in use, the
estimated future cash flow expected from continuing use of the asset and from its disposal is discounted to their present value using
a pre-tax discount rate that reflects the current market assessments of time value of money and the risk specific to the asset. If the
recoverable amount of an asset is estimated to be less than the carrying amount, the carrying amount of the asset is reduced to its
recoverable amount. An impairment loss is recognised immediately in the Statement of Profit and Loss. After impairment,
depreciation is provided on the revised carrying amount of the assets over its remaining useful life. A previously recognised
impairment loss is increased or reversed depending on changes in circumstances. However, the carrying value after reversal is not
increased above the lower of recoverable amount and the carrying value that would have prevailed by charging usual depreciation if
there was no impairment.
Employee benefits include provident fund, superannuation fund, employee state insurance scheme, gratuity fund, compensated
absences, long service awards and post-employment medical benefits.
Defined contribution plans
Long-term employee benefits
Compensated absences which are not expected to occur within twelve months after the end of the year in which the employee
renders the related service are recognised as a liability at the present value of the defined benefit obligation as at the balance sheet
date less the fair value of the plan assets out of which the obligations are expected to be settled. Long term service awards are
recognised as a liability at the present value of the defined benefit obligation as at the balance sheet date.
The eligible employees of the Company are entitled to receive benefits under the provident fund, a defined contribution plan, in
which both employees and the Company make monthly contributions at a specified percentage of the covered employees’ salary
(currently 12% of employees’ salary), which is recognised as an expense in the Statement of Profit and Loss in the year in which
they occur. The contributions as specified under the law are paid to the provident fund set up as irrevocable trust by the Company.
The Company is generally liable for annual contributions and any deficiency in interest cost compared to interest computed based on
the rate of interest declared by the Central Government under the employee provident scheme, 1952 is recognised as an expense in
the year in which it is determined.
The undiscounted amount of short-term employee benefits expected to be paid in exchange for the services rendered by employees
are recognised during the year when the employees render the service. These benefits include performance incentive and
compensated absences which are expected to occur within twelve months after the end of the year in which the employee renders
the related service.
The cost of short-term compensated absences is accounted as under :
(a) in case of accumulated compensated absences, when employees render the services that increase their entitlement of future
compensated absences; and
(b) in case of non-accumulating compensated absences, when the absences occur.
The Company's contribution to superannuation fund and employee state insurance scheme are considered as defined contribution
plans and are charged as an expense in the Statement of Profit and Loss based on the amount of contribution required to be made
and when services are rendered by the employees.
Defined benefit plans
For defined benefit plans in the form of gratuity, the cost of providing benefits is determined using the Projected Unit Credit
method, with actuarial valuations being carried out at each Balance Sheet date. Actuarial gains and losses are recognised in the
Statement of Profit and Loss in the year in which they occur. Past service cost is recognised immediately to the extent that the
benefits are already vested and otherwise is amortised on a straight-line basis over the average period until the benefits become
vested. The retirement benefit obligation recognised in the Balance Sheet represents the present value of the defined benefit
obligation as adjusted for unrecognised past service cost, as reduced by the fair value of scheme assets. Any asset resulting from
this calculation is limited to past service cost, plus the present value of available refunds and reductions in future contributions to
the schemes.
Short-term employee benefits
Provisions are recognised when the Company has present obligations, as result of past events, for which it is probable that an
outflow of economic benefits will be required to settle the obligation and a reliable estimate can be made. Provisions (excluding
retirement benefits) are not discounted to their present value and are determined based on best estimate required to settle the
obligation at the Balance Sheet date. These are reviewed at each Balance Sheet date and adjusted to reflect the current best
estimates. Contingent liabilities are not recognised but disclosed in the financial statements. A Contingent asset is neither
recognised nor disclosed in the financial statements.
80
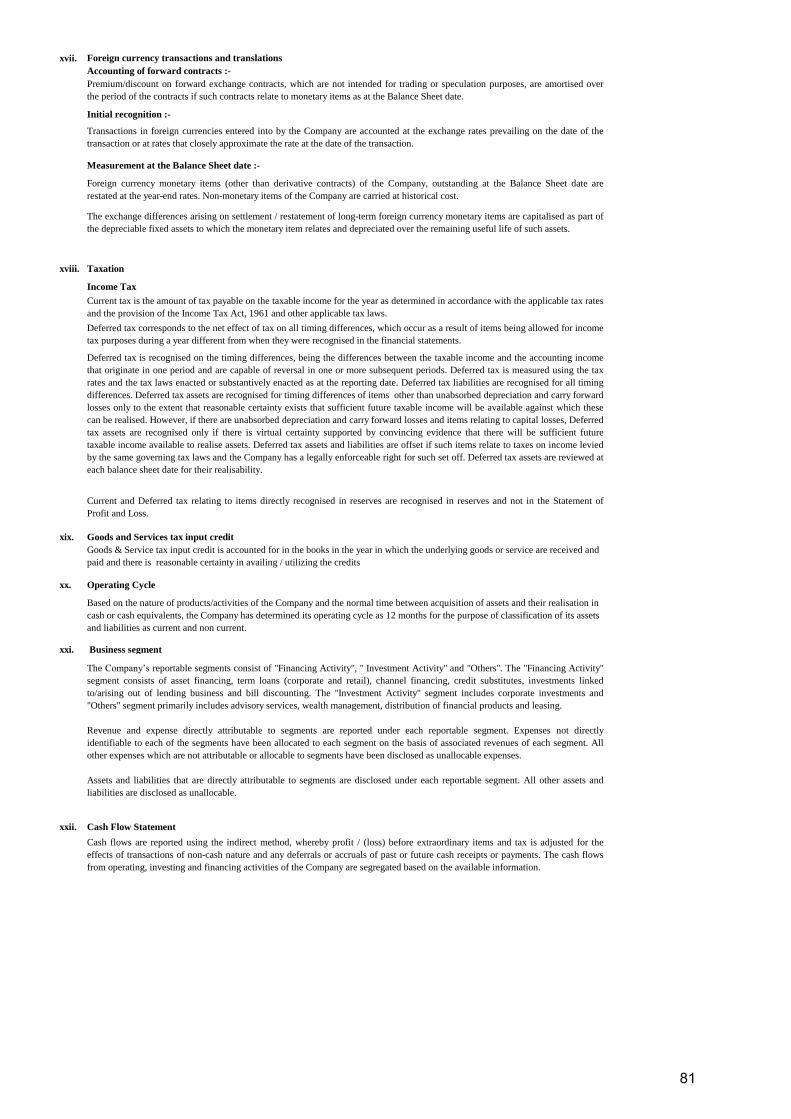
xvii. Foreign currency transactions and translations
Accounting of forward contracts :-
xviii. Taxation
xix.
xx.
xxi. Business segment
xxii. Cash Flow Statement
The Company’s reportable segments consist of "Financing Activity", " Investment Activity" and "Others". The "Financing Activity"
segment consists of asset financing, term loans (corporate and retail), channel financing, credit substitutes, investments linked
to/arising out of lending business and bill discounting. The "Investment Activity" segment includes corporate investments and
"Others" segment primarily includes advisory services, wealth management, distribution of financial products and leasing.
Revenue and expense directly attributable to segments are reported under each reportable segment. Expenses not directly
identifiable to each of the segments have been allocated to each segment on the basis of associated revenues of each segment. All
other expenses which are not attributable or allocable to segments have been disclosed as unallocable expenses.
Assets and liabilities that are directly attributable to segments are disclosed under each reportable segment. All other assets and
liabilities are disclosed as unallocable.
Cash flows are reported using the indirect method, whereby profit / (loss) before extraordinary items and tax is adjusted for the
effects of transactions of non-cash nature and any deferrals or accruals of past or future cash receipts or payments. The cash flows
from operating, investing and financing activities of the Company are segregated based on the available information.
Goods and Services tax input credit
Goods & Service tax input credit is accounted for in the books in the year in which the underlying goods or service are received and
paid and there is reasonable certainty in availing / utilizing the credits
Operating Cycle
Based on the nature of products/activities of the Company and the normal time between acquisition of assets and their realisation in
cash or cash equivalents, the Company has determined its operating cycle as 12 months for the purpose of classification of its assets
and liabilities as current and non current.
Current and Deferred tax relating to items directly recognised in reserves are recognised in reserves and not in the Statement of
Profit and Loss.
Deferred tax is recognised on the timing differences, being the differences between the taxable income and the accounting income
that originate in one period and are capable of reversal in one or more subsequent periods. Deferred tax is measured using the tax
rates and the tax laws enacted or substantively enacted as at the reporting date. Deferred tax liabilities are recognised for all timing
differences. Deferred tax assets are recognised for timing differences of items other than unabsorbed depreciation and carry forward
losses only to the extent that reasonable certainty exists that sufficient future taxable income will be available against which these
can be realised. However, if there are unabsorbed depreciation and carry forward losses and items relating to capital losses, Deferred
tax assets are recognised only if there is virtual certainty supported by convincing evidence that there will be sufficient future
taxable income available to realise assets. Deferred tax assets and liabilities are offset if such items relate to taxes on income levied
by the same governing tax laws and the Company has a legally enforceable right for such set off. Deferred tax assets are reviewed at
each balance sheet date for their realisability.
Deferred tax corresponds to the net effect of tax on all timing differences, which occur as a result of items being allowed for income
tax purposes during a year different from when they were recognised in the financial statements.
Income Tax
Current tax is the amount of tax payable on the taxable income for the year as determined in accordance with the applicable tax rates
and the provision of the Income Tax Act, 1961 and other applicable tax laws.
Transactions in foreign currencies entered into by the Company are accounted at the exchange rates prevailing on the date of the
transaction or at rates that closely approximate the rate at the date of the transaction.
Measurement at the Balance Sheet date :-
Foreign currency monetary items (other than derivative contracts) of the Company, outstanding at the Balance Sheet date are
restated at the year-end rates. Non-monetary items of the Company are carried at historical cost.
The exchange differences arising on settlement / restatement of long-term foreign currency monetary items are capitalised as part of
the depreciable fixed assets to which the monetary item relates and depreciated over the remaining useful life of such assets.
Premium/discount on forward exchange contracts, which are not intended for trading or speculation purposes, are amortised over
the period of the contracts if such contracts relate to monetary items as at the Balance Sheet date.
Initial recognition :-
81

xxiii. Earnings Per Share
xxiv. Securitised/Assignment Loans and Securitisation/Assignment Liabilities
xxv. Dividend (including dividend distribution tax)
Interim dividend declared to equity and / or preference shareholders, if any, is recognised as liability in the period in which the said
dividend has been declared by the Directors. Final proposed dividend declared to equity and / or preference shareholders, if any, is
recognised in the period in which the said dividend has been approved by the Shareholders.
Securitised/ Assigned assets are derecognised, if and only if, the Company looses control of the contractual rights that comprise the
corresponding pools or mortgages transferred. Transfers of pools of mortgages under the current programs involve transfer of
proportionate shares in the pools of mortgages. Such transfers result in de-recognition only of that proportion of the mortgages that
meet the de-recognition criteria. The portion retained by the Company continues to be accounted for as loans as described above. As
stated in the Guidance Note on Accounting for Securitisation issued by the Institute of Chartered Accountants of India, on de-
recognition, the difference between the book value of the securitised/ assigned asset and consideration received is recognised as gain
arising on securitization/ assignment in the Statement of Profit and Loss over the balance maturity period of the pool transferred.
Losses, if any, arising from such transactions, are recognised immediately in the Statement of Profit and Loss.
Basic earnings per share is computed by dividing the profit / (loss) after tax (including the post tax effect of extraordinary items, if
any) by the weighted average number of equity shares outstanding during the year. Diluted earnings per share is computed by
dividing the profit / (loss) after tax (including the post tax effect of extraordinary items, if any) as adjusted for dividend, interest and
other charges to expense or income (net of any attributable taxes) relating to the dilutive potential equity shares, by the weighted
average number of equity shares considered for deriving basic earnings per share and the weighted average number of equity shares
which could have been issued on the conversion of all dilutive potential equity shares. Potential equity shares are deemed to be
dilutive only if their conversion to equity shares would decrease the net profit per share from continuing ordinary operations.
Potential dilutive equity shares are deemed to be converted as at the beginning of the year, unless they have been issued at a later
date. The dilutive potential equity shares are adjusted for the proceeds receivable had the shares been actually issued at fair value
(i.e. average market value of the outstanding shares). Dilutive potential equity shares are determined independently for each period
presented. The number of equity shares and potentially dilutive equity shares are adjusted for share splits / reverse share splits and
bonus shares, as appropriate.
82

3. SHARE CAPITAL
As at
March 31,
2018
As at
March 31,
2017
Rs in lakh Rs in lakh
AUTHORISED
250,000 250,000
300,000 300,000
550,000 550,000
ISSUED, SUBSCRIBED & PAID UP
129,755 129,755
94,500 94,500
57,500 -
281,755 224,255
3. (a). Reconciliation of number of shares outstanding
No. of shares Rs in lakh
Equity Shares
Opening balance as on April 01, 2016 1,297,550,000 129,755
Additions during the year - -
Closing Balance as on March 31, 2017 1,297,550,000 129,755
Additions during the year - -
Closing Balance as on March 31, 2018 1,297,550,000 129,755
Preference Shares
Opening balance as on April 01, 2016 160,000,000 16,000
Additions during the year 785,000,000 78,500
Closing Balance as on March 31, 2017 945,000,000 94,500
Additions during the year 575,000,000 57,500
Closing Balance as on March 31, 2018 1,520,000,000 152,000
3. (b). Rights, preferences and restrictions attached to shares
Tranch-wise due date details for Compulsorily Convertible Cumulative Preference Shares ("CCCPS")
No. of Units Rs in lakh
31-Mar-18 31-Mar-27 150,000,000 15,000
21-Mar-18 21-Mar-27 250,000,000 25,000
8-Mar-18 8-Mar-27 100,000,000 10,000
29-Dec-17 29-Dec-26 75,000,000 7,500
31-Mar-17 31-Mar-26 100,000,000 10,000
28-Feb-17 28-Feb-26 200,000,000 20,000
29-Dec-16 29-Dec-25 100,000,000 10,000
28-Sep-16 28-Sep-25 100,000,000 10,000
28-Jun-16 28-Jun-25 285,000,000 28,500
23-Mar-16 23-Mar-25 125,000,000 12,500
29-Sep-15 29-Sep-24 35,000,000 3,500
1,520,000,000 152,000
3. (c).
No. of shares Rs in lakh
Equity Shares 1,297,550,000 129,755
1,297,550,000 129,755
1,297,550,000 129,755
Preference Shares 160,000,000 16,000
785,000,000 78,500
Closing Balance as on March 31, 2017 945,000,000 94,500
575,000,000 57,500
1,520,000,000 152,000
945,000,000 (as at March 31, 2017: 945,000,000 shares) 9% Compulsorily Convertible
Cumulative Preference shares of Rs.10 each fully paid up
PARTICULARS
Name of company
Equity Shares : The Company has one class of equity shares having a face value of Rs.10 per share. Each shareholder is eligible for one vote
per share held. The dividend proposed by the Board of Directors, if any, is subject to the approval of the shareholders in the ensuing Annual
General Meeting, except in case of interim dividend. In the event of liquidation, the equity shareholders are eligible to receive the remaining
assets of the Company after distribution of all preferential amounts, in proportion to their shareholding. Tata Sons Limited is the ultimate
holding company.
Investment by Tata Capital Limited (Holding company). The entire share capital is held by Tata Capital Limited and its
nominees.
Particulars of issue
2,500,000,000 (as at March 31, 2017: 2,500,000,000 shares) Equity shares of Rs.10 each
Particulars
1,297,550,000 (as at March 31, 2017: 1,297,550,000 shares) Equity shares of Rs.10 each fully
paid up
Total
3,000,000,000 (as at March 31, 2017: 3,000,000,000 shares) Preference shares of Rs.10 each
575,000,000 (as at March 31, 2017: NIL) 8.5% Compulsorily Convertible Cumulative Preference
shares of Rs.10 each fully paid up
During the year ended March 31, 2018, the Company has issued 57,50,00,000, 8.50% Compulsorily Convertible Cumulative Preference
Shares ("CCCPS") of face value Rs. 10/- each aggregating Rs. 575 crore, which are convertible into equity shares after the completion of 9
years from the date of allotment. However, CCCPS holders have an option to convert all or any part of the holding, into equity shares at any
time, prior to the completion of 9 years. Conversion of CCCPS into equity shares will be based on the fair value to be determined by an
independent valuer closer to the conversion date. The CCCPS holders have a right to receive dividend, prior to the Equity Shareholders. The
dividend proposed by the Board of Directors on the CCCPS is subject to the approval of the shareholders at an Annual General Meeting,
except in case of interim dividend. In the event of liquidation, the Preference Shareholders will carry a preferential right over the holder of
equity shares for payment of dividend and for payment of capital, in proportion to their shareholding.
Total
Tata Capital Limited (Holding Company)
Opening Balance as on April 1, 2016
"Rights" issue during the FY 2017-18
Date of Allotment Date of Conversion
The CCCPS holders may, at any time prior to the aforesaid period of conversion, requesting the conversion of all or any part of its holding into
Equity Shares.
"Rights" issue during the FY 2016-17
Closing Balance as on March 31, 2018
Closing Balance as on March 31, 2017
Opening Balance as on April 1, 2016
Closing Balance as on March 31, 2018
83
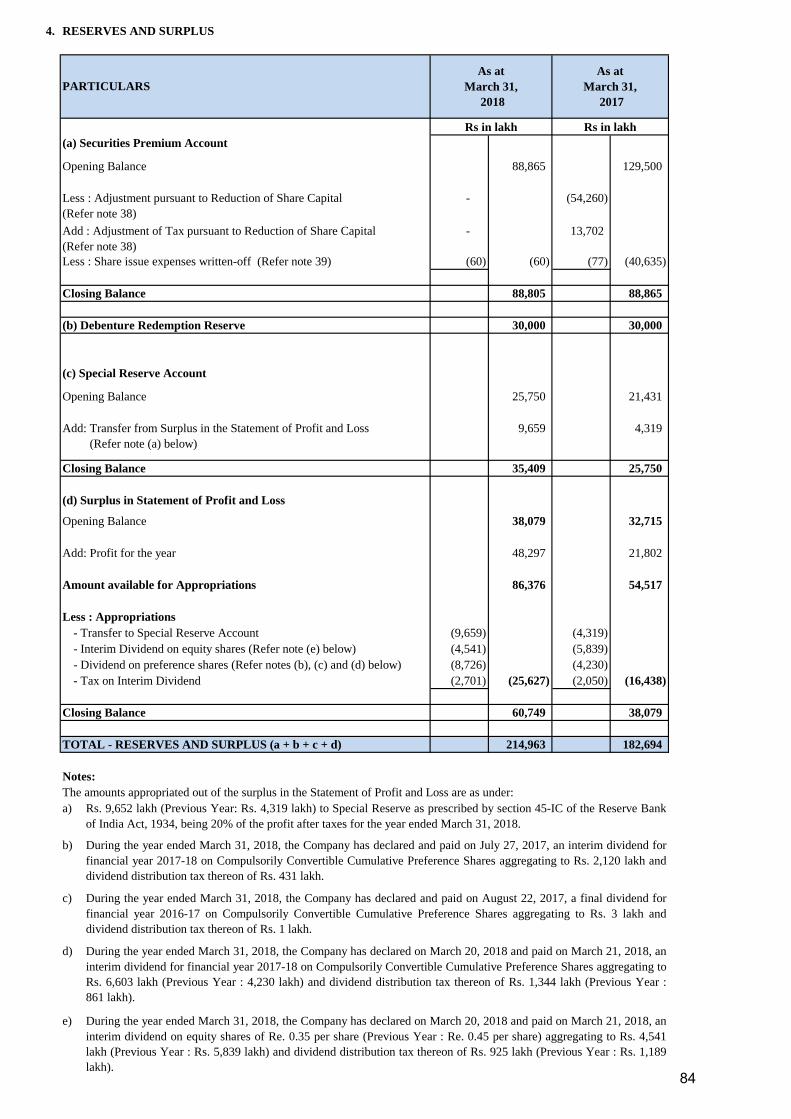
4. RESERVES AND SURPLUS
(a) Securities Premium Account
Opening Balance 88,865 129,500
- (54,260)
- 13,702
(60) (60) (77) (40,635)
Closing Balance 88,805 88,865
(b) Debenture Redemption Reserve 30,000 30,000
(c) Special Reserve Account
Opening Balance 25,750 21,431
9,659 4,319
Closing Balance 35,409 25,750
(d) Surplus in Statement of Profit and Loss
Opening Balance 38,079 32,715
Add: Profit for the year 48,297 21,802
Amount available for Appropriations 86,376 54,517
Less : Appropriations
- Transfer to Special Reserve Account (9,659) (4,319)
- Interim Dividend on equity shares (Refer note (e) below) (4,541) (5,839)
- Dividend on preference shares (Refer notes (b), (c) and (d) below) (8,726) (4,230)
- Tax on Interim Dividend (2,701) (25,627) (2,050) (16,438)
Closing Balance 60,749 38,079
TOTAL - RESERVES AND SURPLUS (a + b + c + d) 214,963 182,694
Notes:
a)
b)
c)
d)
e)
During the year ended March 31, 2018, the Company has declared and paid on August 22, 2017, a final dividend for
financial year 2016-17 on Compulsorily Convertible Cumulative Preference Shares aggregating to Rs. 3 lakh and
dividend distribution tax thereon of Rs. 1 lakh.
During the year ended March 31, 2018, the Company has declared and paid on July 27, 2017, an interim dividend for
financial year 2017-18 on Compulsorily Convertible Cumulative Preference Shares aggregating to Rs. 2,120 lakh and
dividend distribution tax thereon of Rs. 431 lakh.
Add: Transfer from Surplus in the Statement of Profit and Loss
(Refer note (a) below)
Less : Adjustment pursuant to Reduction of Share Capital
(Refer note 38)
As at
March 31,
2018
Rs in lakh
Less : Share issue expenses written-off (Refer note 39)
Add : Adjustment of Tax pursuant to Reduction of Share Capital
(Refer note 38)
The amounts appropriated out of the surplus in the Statement of Profit and Loss are as under:
PARTICULARS
During the year ended March 31, 2018, the Company has declared on March 20, 2018 and paid on March 21, 2018, an
interim dividend for financial year 2017-18 on Compulsorily Convertible Cumulative Preference Shares aggregating to
Rs. 6,603 lakh (Previous Year : 4,230 lakh) and dividend distribution tax thereon of Rs. 1,344 lakh (Previous Year :
861 lakh).
During the year ended March 31, 2018, the Company has declared on March 20, 2018 and paid on March 21, 2018, an
interim dividend on equity shares of Re. 0.35 per share (Previous Year : Re. 0.45 per share) aggregating to Rs. 4,541
lakh (Previous Year : Rs. 5,839 lakh) and dividend distribution tax thereon of Rs. 925 lakh (Previous Year : Rs. 1,189
lakh).
As at
March 31,
2017
Rs in lakh
Rs. 9,652 lakh (Previous Year: Rs. 4,319 lakh) to Special Reserve as prescribed by section 45-IC of the Reserve Bank
of India Act, 1934, being 20% of the profit after taxes for the year ended March 31, 2018.
84

5. LONG-TERM BORROWINGS
As at
March 31,
2018
As at
March 31,
2017
Rs in lakh Rs in lakh
(a) Debentures
Secured
684,267 446,120
Public issue of Non-Convertible Debentures (Refer notes 5.2 and 5.7 below) - 28,818
Unsecured
181,194 180,746
Non-Convertible Perpetual Debentures (Refer note 5.9 below) 91,800 60,000
Privately Placed Non-Convertible Debentures (Refer note 5.10 below) 80,000 70,000
(b) Term loans
Secured
From Banks (Refer notes 5.3 and 5.4 below) 104,500 30,000
Unsecured
From Banks (Refer note 5.4 below) 145,000 130,000
1,286,761 945,684
Notes
5.1.
5.2.
5.3.
PARTICULARS
Privately Placed Non-Convertible Debentures are secured by pari passu charge on the specific immovable property, specified
receivables arising out of loan, lease, hire purchase transactions and to the extent of shortfall in asset cover by a pari passu charge
on the current assets of the Company.
Public issue of Non-Convertible Debentures are secured by a pari passu charge on the specific immovable property, receivables
against unsecured loans, bills discounted and trade advances and other current assets of the Company.
As per terms of agreements loan from banks classified under long-term borrowing, short-term borrowing and current liabilities
aggregating Rs. 427,000 lakh (Previous Year: Rs. 216,000 lakh) are repayable at maturity ranging between 5 and 48 months from
the date of respective loan. Rate of interest payable on term loans varies between 7.45 % to 8.40% (Previous Year : 7.95 % to
9.15%.)
Total
Non-Convertible Subordinated Debentures (Refer note 5.8 and 5.11 below)
[Net of unamortised discount of Rs. 851 lakh (as at March 31, 2017 : Rs. 1,299 lakh)]
5.4
Loans and advances from banks are secured by pari passu charge on the receivables of the Company through Security Trustee.
Terms of repayment of term loans and rate of interest:
Privately Placed Non-Convertible Debentures (Refer notes 5.1 and 5.5 below)
[Net of unamortised premium of Rs. 57 lakh (as at March 31, 2017 : Nil)]
85

5. 5.
Number of
NCDs Rs in lakh
Number of
NCDs Rs in lakh
TCFSL NCD AF FY 2014-15-Option-I 8-Dec-14 6-Dec-24 600 6,000 600 6,000
TCFSL NCD AF FY 2014-15-Option-I 8-Dec-14 6-Dec-24 150 1,500 150 1,500
TCFSL NCD AA FY 2014-15 20-Nov-14 20-Nov-24 950 9,500 950 9,500
TCFSL NCD "P" FY 2017-18 22-Jan-18 20-Jan-23 480 4,800 - -
TCFSL NCD 'AH' FY 2012-13 5-Sep-12 5-Sep-22 500 5,000 500 5,000
TCFSL NCD "AL" FY 2016-17 31-Mar-17 31-Mar-22 400 4,000 400 4,000
TCFSL NCD "I" FY 2017-18 20-Jul-17 28-Feb-22 750 7,500 - -
TCFSL NCD "K" FY 2017-18 16-Aug-17 14-Jan-22 750 7,500 - -
TCFSL NCD "AG" FY 2016-17 28-Dec-16 28-Dec-21 2,720 27,200 2,720 27,200
TCFSL NCD 'G' FY 2016-17 30-May-16 28-May-21 500 3,500 500 2,000
TCFSL NCD "R" FY 2017-18 23-Mar-18 23-Mar-21 2,500 25,000 - -
TCFSL NCD "AB" FY 2015-16 21-Mar-16 19-Mar-21 100 1,000 100 1,000
TCFSL NCD "AA" FY 2015-16 16-Mar-16 16-Mar-21 70 700 70 700
TCFSL NCD "O" FY 2017-18 12-Jan-18 22-Jan-21 750 7,500 - -
TCFSL NCD "X" FY 2015-16 16-Dec-15 16-Dec-20 100 1,000 100 1,000
TCFSL NCD "E" FY 2017-18 6-Jul-17 6-Aug-20 500 5,000 - -
TCFSL NCD "G" FY 2017-18 12-Jul-17 10-Jul-20 250 2,500 - -
TCFSL NCD "U" FY 2016-17 26-Aug-16 1-Jul-20 150 1,500 150 1,500
TCFSL NCD "D" FY 2017-18 9-Jun-17 9-Jun-20 10,150 101,500 - -
TCFSL NCD "E" FY 2015-16 5-May-15 5-May-20 3,300 33,000 3,300 33,000
TCFSL NCD "AJ" FY 2016-17 1-Mar-17 28-Feb-20 250 2,500 250 2,500
TCFSL NCD "Q" FY 2017-18 24-Jan-18 24-Jan-20 7,000 70,000 - -
TCFSL NCD "I" FY 2016-17 Option - II 10-Jun-16 23-Dec-19 130 1,300 130 1,300
TCFSL NCD "AE" FY 2016-17 16-Nov-16 16-Dec-19 750 7,500 750 7,500
TCFSL NCD "AD" FY 2016-17 10-Nov-16 10-Dec-19 230 2,300 230 2,300
TCFSL NCD "AC" FY 2016-17 27-Oct-16 25-Oct-19 350 3,500 350 3,500
TCFSL NCD "L" FY 2017-18 29-Sep-17 27-Sep-19 2,000 20,000 - -
TCFSL NCD "V" FY 2016-17 - Option II 31-Aug-16 30-Aug-19 250 2,500 250 2,500
TCFSL NCD "T" FY 2016-17 25-Aug-16 23-Aug-19 250 2,500 250 2,500
TCFSL NCD "J" FY 2017-18 7-Aug-17 7-Aug-19 5,500 55,000 - -
TCFSL NCD "J" FY 2017-18 Further Issuance 1-Sep-17 7-Aug-19 2,478 24,837 - -
TCFSL NCD "P" FY 2016-17 29-Jul-16 29-Jul-19 100 1,000 100 1,000
TCFSL NCD "O" FY 2016-17 19-Jul-16 19-Jul-19 250 2,500 250 2,500
TCFSL NCD "H" FY 2017-18 18-Jul-17 18-Jul-19 5,000 50,000 - -
TCFSL NCD "N" FY 2016-17 12-Jul-16 12-Jul-19 2,000 20,000 2,000 20,000
TCFSL NCD "F" FY 2017-18 10-Jul-17 10-Jul-19 1,000 10,000 - -
TCFSL NCD C FY 2014-15 - Option-II 9-Jul-14 9-Jul-19 350 3,500 350 3,500
TCFSL NCD "I" FY 2016-17- Option I 10-Jun-16 24-Jun-19 250 2,500 250 2,500
TCFSL NCD "B" FY 2017-18 30-May-17 30-May-19 2,250 22,500 - -
TCFSL NCD "N" FY 2017-18 29-Nov-17 29-May-19 500 5,000 - -
TCFSL NCD "F" FY 2016-17 24-May-16 24-May-19 250 2,500 250 2,500
TCFSL NCD "Z" FY 2015-16 5-Feb-16 3-May-19 1,000 10,000 1,000 10,000
TCFSL NCD "D" FY 2016-17 20-Apr-16 19-Apr-19 100 1,000 100 1,000
TCFSL NCD "AC" FY 2015-16 31-Mar-16 18-Apr-19 213 2,130 213 2,130
TCFSL NCD "A" FY 2017-18 10-Apr-17 10-Apr-19 10,250 102,500 - -
TCFSL NCD "B" FY 2016-17 7-Apr-16 8-Apr-19 200 2,000 200 2,000
TCFSL NCD "M" FY 2017-18 16-Nov-17 28-Mar-19 7,500 75,000 - -
TCFSL NCD "AK" FY 2016-17 27-Mar-17 27-Mar-19 190 1,900 190 1,900
TCFSL NCD "AA" FY 2016-17 6-Oct-16 18-Mar-19 500 5,000 500 5,000
TCFSL NCD "X" FY 2016-17 8-Sep-16 8-Mar-19 2,500 25,000 2,500 25,000
TCFSL NCD "AI" FY 2016-17 8-Feb-17 4-Mar-19 1,000 10,000 1,000 10,000
TCFSL NCD "AH" FY 2016-17 6-Feb-17 6-Feb-19 1,500 15,000 1,500 15,000
TCFSL NCD "Y" FY 2015-16 8-Jan-16 8-Jan-19 250 2,500 250 2,500
TCFSL NCD "C" FY 2017-18 2-Jun-17 30-Nov-18 1,000 10,000 - -
TCFSL NCD "AF" FY 2016-17 29-Nov-16 29-Nov-18 3,000 30,000 3,000 30,000
TCFSL NCD AA FY 2011-12 21-Oct-11 21-Oct-18 150 1,500 150 1,500
TCFSL NCD "AB" FY 2016-17 14-Oct-16 12-Oct-18 5,450 54,500 5,450 54,500
TCFSL NCD R FY 2011-12 23-Sep-11 23-Sep-18 100 1,000 100 1,000
TCFSL NCD "W" FY 2016-17 6-Sep-16 6-Sep-18 2,500 25,000 2,500 25,000
TCFSL NCD "V" FY 2016-17 - Option I 31-Aug-16 31-Aug-18 300 3,000 300 3,000
TCFSL NCD "S" FY 2015-16 26-Aug-15 24-Aug-18 250 2,500 250 2,500
TCFSL NCD O FY 2013-14 20-Aug-13 20-Aug-18 430 4,300 430 4,300
TCFSL NCD M FY 2011-12 17-Aug-11 17-Aug-18 40 400 40 400
Particulars of Privately Placed Secured Non-Convertible Debentures ("NCDs") outstanding as on March 31, 2018
Description of NCDsIssue
Date
Redemption
Date
As at March 31, 2018* As at March 31, 2017*
86

Number of
NCDs Rs in lakh
Number of
NCDs Rs in lakh
TCFSL NCD "S" FY 2016-17 16-Aug-16 16-Aug-18 750 7,500 750 7,500
TCFSL NCD "R" FY 2016-17 12-Aug-16 13-Aug-18 250 2,500 250 2,500
TCFSL NCD "Q" FY 2016-17 2-Aug-16 2-Aug-18 1,500 15,000 1,500 15,000
TCFSL NCD 'Q' FY 2015-16 Option I 13-Jul-15 13-Jul-18 50 500 50 500
TCFSL NCD "L" FY 2015-16 22-Jun-15 22-Jun-18 3,800 38,000 3,800 38,000
TCFSL NCD G FY 2013-14 22-May-13 22-May-18 2,000 20,000 2,000 20,000
TCFSL NCD H FY 2013-14 22-May-13 22-May-18 250 2,500 250 2,500
TCFSL NCD D FY 2013-14 7-May-13 7-May-18 200 2,000 200 2,000
TCFSL NCD E FY 2013-14 7-May-13 7-May-18 500 5,000 500 5,000
TCFSL NCD A FY 2013-14 - Option-I 23-Apr-13 23-Apr-18 850 8,500 850 8,500
TCFSL NCD AK FY 2014-15-Option-II 15-Jan-15 5-Apr-18 59 590 59 590
TCFSL NCD AX FY 2014-15-Option-II 20-Mar-15 3-Apr-18 80 800 80 800
TCFSL NCD BF FY 2012-13 26-Mar-13 26-Mar-18 - - 50 500
TCFSL NCD "J" FY 2016-17- Option I 15-Jun-16 26-Mar-18 - - 300 3,000
TCFSL NCD "Y" FY 2016-17 30-Sep-16 26-Mar-18 - - 1,500 15,000
TCFSL NCD "Z" FY 2016-17 4-Oct-16 26-Mar-18 - - 3,500 35,000
TCFSL NCD "AY" FY 2014-15-Option-I 24-Mar-15 23-Mar-18 - - 150 1,500
TCFSL NCD "A" FY 2016-17 5-Apr-16 20-Mar-18 - - 1,250 12,500
TCFSL NCD "E" FY 2016-17 22-Apr-16 20-Mar-18 - - 700 7,000
TCFSL NCD "C" FY 2016-17 13-Apr-16 15-Mar-18 - - 2,500 25,000
TCFSL NCD AV FY 2014-15 - Option-II 10-Mar-15 9-Mar-18 - - 500 5,000
TCFSL NCD AT FY 2014-15 - Option-I 2-Mar-15 2-Mar-18 - - 650 6,500
TCFSL NCD AQ FY 2014-15 20-Feb-15 12-Feb-18 - - 60 600
TCFSL NCD AP FY 2014-15-Option-I 4-Feb-15 2-Feb-18 - - 500 5,000
TCFSL NCD AN FY 2014-15 29-Jan-15 29-Jan-18 - - 3,000 30,000
TCFSL NCD AL FY 2014-15 20-Jan-15 24-Jan-18 - - 210 2,100
TCFSL NCD AY FY 2012-13 22-Jan-13 22-Jan-18 - - 2,000 20,000
TCFSL NCD BA FY 2012-13 22-Jan-13 22-Jan-18 - - 250 2,500
TCFSL NCD 'AZ' FY 2012-13 22-Jan-13 22-Jan-18 - - 3,000 30,000
TCFSL NCD AX FY 2012-13 16-Jan-13 16-Jan-18 - - 650 6,500
TCFSL NCD AK FY 2014-15-Option-I 15-Jan-15 15-Jan-18 - - 97 970
TCFSL NCD AJ FY 2014-15 14-Jan-15 10-Jan-18 - - 162 1,620
TCFSL NCD "L" FY 2016-17 7-Jul-16 8-Jan-18 - - 250 2,500
TCFSL NCD AH FY 2014-15-Option-III 16-Dec-14 4-Jan-18 - - 90 900
TCFSL NCD "K" FY 2016-17 24-Jun-16 26-Dec-17 - - 250 2,500
TCFSL NCD "J" FY 2016-17- Option II 15-Jun-16 15-Dec-17 - - 250 2,500
TCFSL NCD AF FY 2014-15-Option-III 8-Dec-14 8-Dec-17 - - 50 500
TCFSL NCD AS FY 2012-13 5-Dec-12 5-Dec-17 - - 250 2,500
TCFSL NCD AB FY 2014-15-Option-III 21-Nov-14 29-Nov-17 - - 150 1,500
TCFSL NCD AB FY 2014-15-Option-II 21-Nov-14 27-Nov-17 - - 200 2,000
TCFSL NCD X FY 2014-15 - Option -II 14-Nov-14 24-Nov-17 - - 150 1,500
TCFSL NCD Y FY 2014-15 18-Nov-14 20-Nov-17 - - 100 1,000
TCFSL NCD AB FY 2014-15-Option-I 21-Nov-14 20-Nov-17 - - 380 3,800
19-Nov-14 15-Nov-17 - - 740 7,400
TCFSL NCD AQ FY 2012-13 12-Nov-12 10-Nov-17 - - 300 3,000
TCFSL NCD "W" FY 2015-16 10-Nov-15 10-Nov-17 - - 200 2,000
TCFSL NCD AJ FY 2012-13 9-Nov-12 9-Nov-17 - - 5,000 50,000
TCFSL NCD U FY 2014-15 21-Oct-14 20-Oct-17 - - 100 1,000
TCFSL NCD "V" FY 2015-16 21-Oct-15 20-Oct-17 - - 1,000 10,000
TCFSL NCD T FY 2014-15 - Option -III 13-Oct-14 18-Oct-17 - - 100 1,000
TCFSL NCD S FY 2014-15 - Option -I 9-Oct-14 9-Oct-17 - - 50 500
TCFSL NCD R FY 2014-15 - Option -III 30-Sep-14 29-Sep-17 - - 50 500
TCFSL NCD R FY 2014-15 - Option -II 30-Sep-14 28-Sep-17 - - 100 1,000
TCFSL NCD 'U' FY 2015-16 28-Sep-15 28-Sep-17 - - 2,000 20,000
TCFSL NCD S FY 2014-15 - Option -V 9-Oct-14 27-Sep-17 - - 22 220
TCFSL NCD T FY 2014-15 - Option -V 13-Oct-14 26-Sep-17 - - 250 2,500
TCFSL NCD T FY 2014-15 - Option -I 13-Oct-14 20-Sep-17 - - 1,500 15,000
TCFSL NCD AG FY 2012-13 10-Sep-12 8-Sep-17 - - 100 1,000
TCFSL NCD "M" FY 2016-17 8-Jul-16 8-Sep-17 - - 1,500 15,000
TCFSL NCD M FY 2014-15 4-Sep-14 4-Sep-17 - - 500 5,000
TCFSL NCD L FY 2014-15 - Option- I 1-Sep-14 1-Sep-17 - - 4,000 40,000
TCFSL NCD R FY 2013-14 26-Aug-13 25-Aug-17 - - 300 3,000
TCFSL NCD M FY 2011-12 - Partial Redemption 17-Aug-11 17-Aug-17 - - 30 300
TCFSL NCD "H" FY 2016-17 7-Jun-16 10-Aug-17 - - 400 4,000
TCFSL NCD AE FY 2012-13 9-Aug-12 9-Aug-17 - - 200 2,000
TCFSL NCD 'R' FY 2015-16 31-Jul-15 31-Jul-17 - - 1,570 15,700
Description of NCDsIssue
Date
Redemption
Date
As at March 31, 2018* As at March 31, 2017*
TCFSL NCD Z FY 2014-15
87

Number of
NCDs Rs in lakh
Number of
NCDs Rs in lakh
TCFSL NCD "H" FY 2015-16 Option - I 15-May-15 17-Jul-17 - - 1,270 12,700
TCFSL NCD F FY 2014-15 14-Jul-14 14-Jul-17 - - 100 1,000
TCFSL NCD C FY 2014-15 - Option-I 9-Jul-14 10-Jul-17 - - 250 2,500
TCFSL NCD 'O' FY 2015-16 Option II 7-Jul-15 7-Jul-17 - - 250 2,500
TCFSL NCD 'P' FY 2015-16 9-Jul-15 7-Jul-17 - - 2,500 25,000
TCFSL NCD "M" FY 2015-16 - Option I 24-Jun-15 23-Jun-17 - - 1,000 10,000
TCFSL NCD "M" FY 2015-16 - Option II 24-Jun-15 23-Jun-17 - - 750 7,500
TCFSL NCD "M" FY 2015-16 - Option III 24-Jun-15 23-Jun-17 - - 750 7,500
TCFSL NCD 'O' FY 2015-16 Option I 7-Jul-15 23-Jun-17 - - 2,500 25,000
TCFSL NCD "H" FY 2015-16 Option - V 15-May-15 20-Jun-17 - - 187 1,870
TCFSL NCD "I" FY 2015-16 Option - V 22-May-15 20-Jun-17 - - 67 670
TCFSL NCD "K" FY 2015-16 9-Jun-15 9-Jun-17 - - 5,000 50,000
TCFSL NCD "C" FY 2015-16 OPTION-IV 22-Apr-15 1-Jun-17 - - 340 3,400
TCFSL NCD "H" FY 2015-16 Option - VI 15-May-15 1-Jun-17 - - 175 1,750
TCFSL NCD "I" FY 2015-16 Option - I 22-May-15 1-Jun-17 - - 1,273 12,730
TCFSL NCD "G" FY 2015-16 - Option I 13-May-15 24-May-17 - - 350 3,500
TCFSL NCD "J" FY 2015-16 - Option II 26-May-15 24-May-17 - - 5,250 52,500
TCFSL NCD "H" FY 2015-16 Option - IV 15-May-15 24-May-17 - - 220 2,200
TCFSL NCD "B" FY 2015-16 20-Apr-15 22-May-17 - - 1,026 10,260
TCFSL NCD "H" FY 2015-16 Option - II 15-May-15 22-May-17 - - 780 7,800
TCFSL NCD "I" FY 2015-16 Option - II 22-May-15 17-May-17 - - 200 2,000
TCFSL NCD "H" FY 2015-16 Option - VIII 15-May-15 15-May-17 - - 100 1,000
TCFSL NCD "H" FY 2015-16 Option - III 15-May-15 12-May-17 - - 250 2,500
TCFSL NCD AU FY 2014-15-Option-III 5-Mar-15 2-May-17 - - 110 1,100
TCFSL NCD "G" FY 2015-16 - Option II 13-May-15 27-Apr-17 - - 90 900
TCFSL NCD "C" FY 2015-16 OPTION-III 22-Apr-15 25-Apr-17 - - 850 8,500
TCFSL NCD "C" FY 2015-16 OPTION-II 22-Apr-15 20-Apr-17 - - 70 700
TCFSL NCD "C" FY 2015-16 OPTION-I 22-Apr-15 19-Apr-17 - - 326 3,260
TCFSL NCD "D" FY 2015-16 OPTION-II 24-Apr-15 18-Apr-17 - - 88 880
TCFSL NCD "A" FY 2015-16 15-Apr-15 11-Apr-17 - - 180 1,800
TCFSL NCD "H" FY 2015-16 Option - VII 15-May-15 11-Apr-17 - - 120 1,200
TCFSL NCD AU FY 2014-15-Option-I 5-Mar-15 10-Apr-17 - - 115 1,150
TCFSL NCD "D" FY 2015-16 OPTION-IV 24-Apr-15 5-Apr-17 - - 510 5,100
TCFSL NCD "D" FY 2015-16 OPTION-I 24-Apr-15 3-Apr-17 - - 640 6,400
TCFSL NCD "D" FY 2015-16 OPTION-III 24-Apr-15 3-Apr-17 - - 190 1,900
1,053,757 1,156,500
Of which current maturities classified under "Current liabilities" in note 10 (369,490) (710,380)
TOTAL 684,267 446,120
TOTAL
*Note : Coupon rate of "NCDs" outstanding as on March 31, 2018 varies from 7.50% to 10.40% (Previous Year : 7.58% to 10.75%)
Description of NCDsIssue
Date
Redemption
Date
As at March 31, 2018* As at March 31, 2017*
88

5. 6. Particulars of Public issue of Secured Non-Convertible Debentures outstanding as on March 31, 2018
Redemption
Date
Number of
NCDsRs in lakh
TCFSL NCD Option I (2009) March 5, 2019 310 310
TCFSL NCD Option II (2009) March 5, 2019 177,875 1,779
TCFSL NCD Option IIII (2009) March 5, 2019 1,497,029 14,970
TCFSL NCD Option IV (2009) March 5, 2019 1,175,939 11,759
28,818
Note : Coupon rate of above outstanding as on March 31, 2018 varies from 9.75% to 10.50%
5. 7. Particulars of Public issue of Secured Non-Convertible Debentures outstanding as on March 31, 2017
Redemption
Date
Number of
NCDsRs in lakh
TCFSL NCD Option I (2009) March 5, 2019 310 310
TCFSL NCD Option II (2009) March 5, 2019 177,875 1,779
TCFSL NCD Option IIII (2009) March 5, 2019 1,497,029 14,970
TCFSL NCD Option IV (2009) March 5, 2019 1,175,939 11,759
28,818
Note : Coupon rate of above outstanding as on March 31, 2017 varies from 9.75% to 10.50%
5. 8.
Redemption
Date
Number of
NCDsRs in lakh *
TCFSL Tier-II Bond "B" FY 2016-17 26-Oct-26 150 1,500
TCFSL Tier-II Bond "A" FY 2016-17 11-Aug-26 2,000 20,000
TCFSL Tier II Bond 'B' FY 2015-16 30-Mar-26 2,000 20,000
TCFSL Tier II Bond 'A' FY 2015-16 22-Jul-25 900 9,000
TCFSL Tier II Bond 'D' FY 2014-15 31-Mar-25 2,000 20,000
TCFSL Tier II Bond 'C' FY 2014-15 30-Jan-25 750 7,500
TCFSL Tier II Bond 'B' FY 2014-15 7-Jan-25 350 3,500
TCFSL Tier II Bond 'A' FY 2014-15 26-Sep-24 1,000 10,000
TCL Tier II Bond 'H' FY 2009-10 24-Dec-19 1,000 5,000
TCL Tier II Bond 'G' FY 2009-10 18-Dec-19 3,000 15,000
TCL Tier II Bond 'E' FY 2009-10 15-Dec-19 5,725 28,625
TCL Tier II Bond F FY 2009-10 30-Nov-19 1,135 4,824
TCL Tier II Bond 'D' FY 2009-10 28-Oct-19 1,479 7,395
TCL Tier II Bond 'C' FY 2009-10 28-Oct-19 1,580 7,900
TCL Tier II Bond 'B' FY 2009-10 9-Sep-19 1,704 17,040
TCL Tier II Bond 'A' FY 2009-10 4-Aug-19 391 3,910
181,194
*Net of unamortised discount of Rs.851 lakh
Note : Coupon rate of above outstanding as on March 31, 2018 varies from 8.45% to 10.50%
March 6, 2009
Description of NCDIssue
Date
March 6, 2009
March 6, 2009
March 6, 2009
March 6, 2009
Total
Description of NCDIssue
Date
March 6, 2009
March 6, 2009
30-Jan-15
March 6, 2009
Total
Particulars of unsecured redeemable non-convertible subordinated debentures (Tier II Bonds) outstanding as on March
31, 2018
Description of NCDIssue
Date
26-Oct-16
11-Aug-16
30-Mar-16
22-Jul-15
31-Mar-15
7-Jan-15
26-Sep-14
24-Dec-09
18-Dec-09
15-Dec-09
30-Nov-09
28-Oct-09
28-Oct-09
9-Sep-09
4-Aug-09
Total
89

Redemption
Date
Number of
NCDsRs in Lakh*
TCFSL Tier-II Bond "B" FY 2016-17 26-Oct-26 150 1,500
TCFSL Tier-II Bond "A" FY 2016-17 11-Aug-26 2,000 20,000
TCFSL Tier II Bond 'B' FY 2015-16 30-Mar-26 2,000 20,000
TCFSL Tier II Bond 'A' FY 2015-16 22-Jul-25 900 9,000
TCFSL Tier II Bond 'D' FY 2014-15 31-Mar-25 2,000 20,000
TCFSL Tier II Bond 'C' FY 2014-15 30-Jan-25 750 7,500
TCFSL Tier II Bond 'B' FY 2014-15 7-Jan-25 350 3,500
TCFSL Tier II Bond 'A' FY 2014-15 26-Sep-24 1,000 10,000
TCL Tier II Bond 'H' FY 2009-10 24-Dec-19 1,000 5,000
TCL Tier II Bond 'G' FY 2009-10 18-Dec-19 3,000 15,000
TCL Tier II Bond 'E' FY 2009-10 15-Dec-19 5,725 28,625
TCL Tier II Bond F FY 2009-10 30-Nov-19 1,135 4,376
TCL Tier II Bond 'D' FY 2009-10 28-Oct-19 1,479 7,395
TCL Tier II Bond 'C' FY 2009-10 28-Oct-19 1,580 7,900
TCL Tier II Bond 'B' FY 2009-10 9-Sep-19 1,704 17,040
TCL Tier II Bond 'A' FY 2009-10 4-Aug-19 391 3,910
180,746
*Net of unamortised discount of Rs.1,299 lakh
Note : Coupon rate of above outstanding as on March 31, 2017 varies from 8.45% to 10.50%
5. 9. Particulars of unsecured non-convertible perpetual debentures outstanding as on March 31, 2018
Issue
Date
Number of
NCDsRs in lakh
TCL Perpetual 'A' FY 2010-11 15-Nov-10 15 75
TCL Perpetual 'B' FY 2010-11 14-Jan-11 18 90
TCL Perpetual 'A' FY 2011-12 5-May-11 20 100
TCL Perpetual 'B' FY 2011-12 8-Aug-11 61 305
TCL Perpetual 'C' FY 2011-12 28-Sep-11 10 50
TCL Perpetual 'D' FY 2011-12 7-Nov-11 5 25
TCFSL Perpetual 'A' FY 2013-14 27-Mar-14 1871 9,355
TCFSL Perpetual 'A' FY 2015-16 16-Jul-15 1000 10,000
TCFSL Perpetual 'B' FY 2015-16 6-Jan-16 500 5,000
TCFSL Perpetual 'C' FY 2015-16 2-Feb-16 500 5,000
TCFSL Perpetual 'D' FY 2015-16 9-Feb-16 1000 10,000
TCFSL Perpetual 'E' FY 2015-16 23-Mar-16 1000 10,000
TCFSL Perpetual 'A' FY 2016-17 30-Jun-16 500 5,000
TCFSL Perpetual 'B' FY 2016-17 13-Jan-17 100 1,000
TCFSL Perpetual 'C' FY 2016-17 8-Mar-17 400 4,000
TCFSL Perpetual 'A' FY 2017-18 21-Jun-17 500 5,000
TCFSL Perpetual 'B' FY 2017-18 14-Jul-17 500 5,000
TCFSL Perpetual 'C' FY 2017-18 11-Sep-17 930 9,300
TCFSL Perpetual 'D' FY 2017-18 26-Mar-18 1000 10,000
TCFSL Perpetual 'D' FY 2017-18 26-Mar-18 250 2,500
91,800
Note : Coupon rate of above outstanding as on March 31, 2018 varies from 8.61% to 11.25%
Particulars of unsecured non-convertible perpetual debentures outstanding as on March 31, 2017
Issue
Date
Number of
NCDsRs in lakh
TCL Perpetual A FY 2010-11 15-Nov-10 15 75
TCL Perpetual B FY 2010-11 14-Jan-11 18 90
TCL Perpetual A FY 2011-12 5-May-11 20 100
TCL Perpetual B FY 2011-12 8-Aug-11 61 305
TCL Perpetual C FY 2011-12 28-Sep-11 10 50
TCL Perpetual D FY 2011-12 7-Nov-11 5 25
TCFSL Perpetual A FY 2013-14 27-Mar-14 1871 9,355
TCFSL Perpetual A FY 2015-16 16-Jul-15 1000 10,000
TCFSL Perpetual B FY 2015-16 6-Jan-16 500 5,000
TCFSL Perpetual C FY 2015-16 2-Feb-16 500 5,000
TCFSL Perpetual D FY 2015-16 9-Feb-16 1000 10,000
TCFSL Perpetual E FY 2015-16 23-Mar-16 1000 10,000
TCFSL Perpetual 'A' FY 2016-17 30-Jun-16 500 5,000
TCFSL Perpetual 'B' FY 2016-17 13-Jan-17 100 1,000
TCFSL Perpetual 'C' FY 2016-17 8-Mar-17 400 4,000
60,000
Note : Coupon rate of above outstanding as on March 31, 2017 varies from 9.00% to 11.25%
Particulars of unsecured redeemable non-convertible subordinated debentures (Tier II Bonds) outstanding as on March
31, 2017
18-Dec-09
Description of NCDIssue
Date
26-Oct-16
11-Aug-16
30-Mar-16
22-Jul-15
31-Mar-15
30-Jan-15
7-Jan-15
26-Sep-14
24-Dec-09
15-Dec-09
30-Nov-09
28-Oct-09
28-Oct-09
9-Sep-09
4-Aug-09
Total
Description of NCD
Total
Description of NCD
Total
90
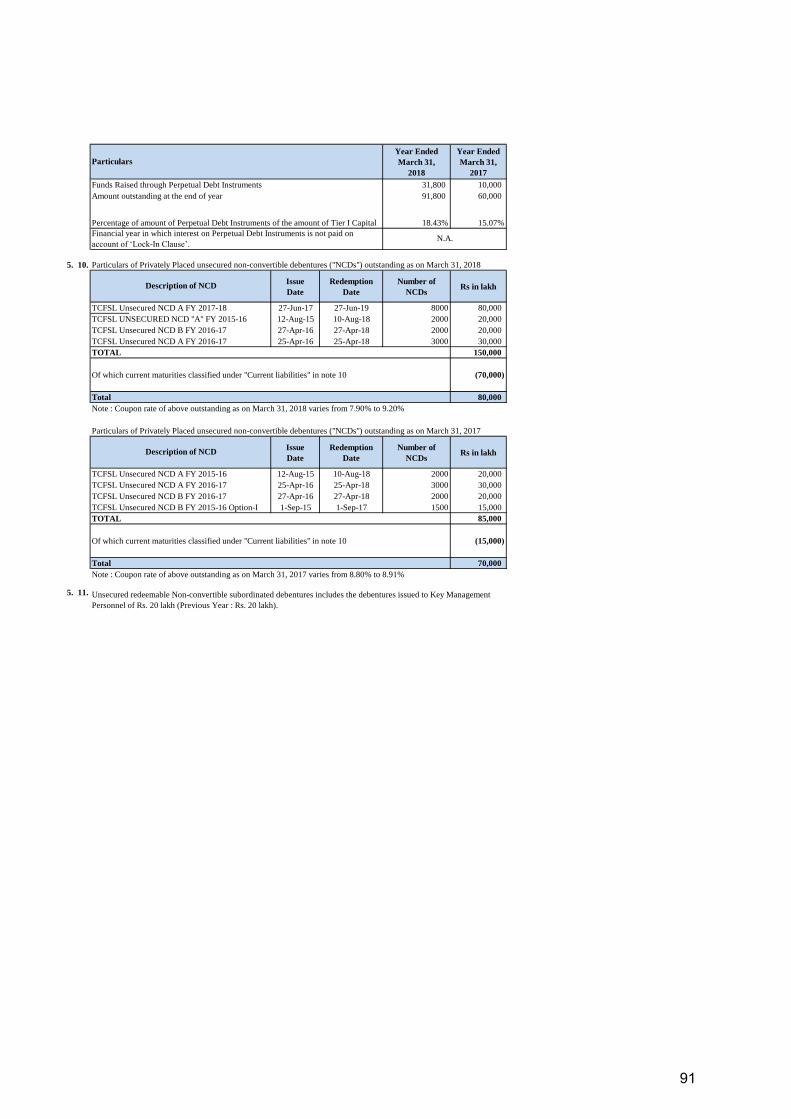
Year Ended
March 31,
2018
Year Ended
March 31,
2017
Funds Raised through Perpetual Debt Instruments 31,800 10,000
Amount outstanding at the end of year 91,800 60,000
18.43% 15.07%
5. 10. Particulars of Privately Placed unsecured non-convertible debentures ("NCDs") outstanding as on March 31, 2018
Issue
Date
Redemption
Date
Number of
NCDsRs in lakh
TCFSL Unsecured NCD A FY 2017-18 27-Jun-17 27-Jun-19 8000 80,000
TCFSL UNSECURED NCD "A" FY 2015-16 12-Aug-15 10-Aug-18 2000 20,000
TCFSL Unsecured NCD B FY 2016-17 27-Apr-16 27-Apr-18 2000 20,000
TCFSL Unsecured NCD A FY 2016-17 25-Apr-16 25-Apr-18 3000 30,000
150,000
Of which current maturities classified under "Current liabilities" in note 10 (70,000)
80,000
Note : Coupon rate of above outstanding as on March 31, 2018 varies from 7.90% to 9.20%
Particulars of Privately Placed unsecured non-convertible debentures ("NCDs") outstanding as on March 31, 2017
Issue
Date
Redemption
Date
Number of
NCDsRs in lakh
TCFSL Unsecured NCD A FY 2015-16 12-Aug-15 10-Aug-18 2000 20,000
TCFSL Unsecured NCD A FY 2016-17 25-Apr-16 25-Apr-18 3000 30,000
TCFSL Unsecured NCD B FY 2016-17 27-Apr-16 27-Apr-18 2000 20,000
TCFSL Unsecured NCD B FY 2015-16 Option-I 1-Sep-15 1-Sep-17 1500 15,000
85,000
Of which current maturities classified under "Current liabilities" in note 10 (15,000)
70,000
Note : Coupon rate of above outstanding as on March 31, 2017 varies from 8.80% to 8.91%
5. 11.
Particulars
Description of NCD
TOTAL
Total
Unsecured redeemable Non-convertible subordinated debentures includes the debentures issued to Key Management
Personnel of Rs. 20 lakh (Previous Year : Rs. 20 lakh).
Percentage of amount of Perpetual Debt Instruments of the amount of Tier I Capital
Financial year in which interest on Perpetual Debt Instruments is not paid on
account of ‘Lock-In Clause’.N.A.
Description of NCD
TOTAL
Total
91
6. OTHER LONG-TERM LIABILITIES
As at
March 31,
2018
As at
March 31,
2017
Rs in lakh Rs in lakh
(a) Interest accrued but not due on borrowings 213 4,317
(b) Income received in advance 173 215
(c) Payable for capital expenditure 205 -
(d) Sundry liabilities account (interest capitalisation) 250 2,487
841 7,019
7. LONG-TERM PROVISIONS
As at
March 31,
2018
As at
March 31,
2017
Rs in lakh Rs in lakh
(a) Provision for employee benefits 962 891
(b) Contingent provision against Standard Assets (Refer note 36) 6,732 5,160
(c) Provision for doubtful loans and credit substitutes 17,993 30,361
(d) Provision for restructured standard assets 108 70
25,795 36,482
PARTICULARS
Total
Total
PARTICULARS
92
8. SHORT-TERM BORROWINGS
As at
March 31,
2018
As at
March 31,
2017
Rs in lakh Rs in lakh
(a) Loans repayable on demand
Secured
From Banks
(i) Working capital demand loan (Refer notes 5.3 above and 8.2 below) 268,000 75,000
(ii) Bank Overdraft (Refer note 5.3 above) 210,934 301,969
Unsecured
From Banks
(i) Working capital demand loan (Refer notes 5.3 above and 8.2 below) 40,000 11,200
(b) Term loans
Secured
From Banks (Refer notes 5.3 and 5.4 above) 10,000 6,000
Unsecured
From Banks (Refer note 5.4 above) 82,500 -
Unsecured
641,363 567,632
33,784 44,829
6,500 -
1,293,081 1,006,630
Notes
8.1. Discount on commercial paper varies between 7.32 % to 8.25% (Previous year : 6.66% to 8.61% )
8.2. Rate of interest payable on WCDL varies between 7.60 % to 8.10% (Previous Year : 7.95 % to 8.70%.)
8.3. Rate of interest payable on Inter-corporate deposits varies between 7.25 % to 8.87% (Previous Year : 8.61 % to 8.87%.)
9. TRADE PAYABLES
As at
March 31,
2018
As at
March 31,
2017
Rs in lakh Rs in lakh
(i) Accrued expenses 18,586 16,170
98 28
33,252 27,422
(iv) Others 561 918
52,497 44,538
9.
As at
March 31,
2018
As at
March 31,
2017
(a) Amounts outstanding but not due as at year end - -
(b) Amounts due but unpaid as at year end - -
(c) Amounts paid after appointed date during the year - -
(d) Amount of interest accrued and unpaid as at year end - -
(e) The amount of further interest due and payable even in the succeeding year - -
- - Total
PARTICULARS
PARTICULARS
Total
Note - The information as required to be disclosed under the Micro, Small and Medium Enterprises Development Act, 2006 has been determined
to the extent such parties have been identified on the basis of information available with the Company. The amount of principal and interest
outstanding during the year is given below :
(ii) Payable to Related Parties
(a) Total outstanding dues of micro enterprises and small enterprises
(iii) Payable to Dealers/Vendors
PARTICULARS
Total
(c) Other loans and advances
(i) Commercial paper (Refer note 8.1 below)
[Net of unamortised discount of Rs. 12,637 lakh (as at March 31, 2017 : Rs. 9,868 lakh)]
(ii) Inter Corporate Deposits from Related Parties (Refer notes 8.3 below and 31)
(iii) Inter Corporate Deposits from Others (Refer note 8.3 below)
93

10. OTHER CURRENT LIABILITIES
As at
March 31,
2018
As at
March 31,
2017
Rs in lakh Rs in lakh
(a) Current maturities of long-term debt
(i) Debentures
Secured
369,490 710,380
28,818 -
Unsecured
Privately Placed Non-Convertible Debentures (Refer note 5.10 above) 70,000 15,000
(ii) Term Loans
Secured
From Banks (Refer notes 5.3 and 5.4 above) 15,000 50,000
Unsecured
From Banks (Refer note 5.4 above) 70,000 -
(iii) Other loans and advances
Unsecured
Inter-Corporate Deposits from Others (Refer note 8.3 above) 715 715
(b) Interest accrued but not due on borrowings 77,010 81,149
(c) Income received in advance 1,573 1,113
53 53
(e) Other payables
(i) Security deposit 31,719 22,475
(ii) Statutory dues 3,758 1,305
(iii) Payable for capital expenditure 1,637 908
(vi) Advances from customers 1,677 1,402
(v) Sundry liabilities account (interest capitalisation) 450 2,058
(vi) Amounts payable - assigned loans 2,997 5,727
(vii) Accrued employee benefit expense 6,524 4,321
(viii) Others 893 595
682,314 897,201
11. SHORT-TERM PROVISIONS
As at
March 31,
2018
As at
March 31,
2017
Rs in lakh Rs in lakh
(a) Provision for employee benefits 157 142
(b) Provision - Others
(i) Contingent Provision against Standard Assets (Refer note 34) 8,523 6,431
10,114 8,575
71,856 90,861
35 41
90,685 106,050 Total
Total
PARTICULARS
PARTICULARS
Privately Placed Non-Convertible Debentures (Refer notes 5.1 and 5.5 above)
(ii) Provision for tax [Net of advance tax Rs. 9,894 lakh
(As at March 31, 2017 Rs. 29,481 lakh)]
(d) Unclaimed matured debentures and accrued interest thereon
(iii) Provision for doubtful loans and credit substitutes
(iv) Provision for restructured standard assets
Public issue of Non-Convertible Debentures (Refer notes 5.2 and 5.6 above)
94

12. PROPERTY, PLANT AND EQUIPMENT
(Rs. in lakh)
Net Carrying
Value
Opening balance
as at April 1,
2017
Additions/
AdjustmentsDeletions
Written off
during the year*
Closing balance
as at March 31,
2018
Opening balance
as at April 1,
2017
Depreciation/
Amortisation for
the year
Deletions/
Adjustments
Closing balance
as at March 31,
2018
As at
March 31,
2018
TANGIBLE ASSETS
Buildings 4,975 - - - 4,975 1,298 200 - 1,498 3,477
4,975 - - - 4,975 1,098 200 - 1,298 3,677
Leasehold Improvements 3,554 365 56 - 3,863 1,853 547 46 2,354 1,509
4,191 338 975 - 3,554 2,343 424 914 1,853 1,701
Furniture & Fixtures 1,181 132 25 - 1,288 689 101 18 772 516
1,190 211 220 - 1,181 716 136 163 689 492
Computer Equipment 2,407 982 - - 3,389 789 604 - 1,393 1,996
945 1,579 117 - 2,407 614 292 117 789 1,618
Office Equipment 1,760 210 13 - 1,957 1,278 203 11 1,470 487
1,580 318 138 - 1,760 1,238 155 115 1,278 482
Plant & Machinery 520 4 21 - 503 263 52 16 299 204
668 - 148 - 520 319 64 120 263 257
Vehicles 934 83 128 - 889 482 181 90 573 316
1,000 266 332 - 934 575 209 302 482 452
ASSETS GIVEN UNDER OPERATING LEASE/RENTAL
Construction Equipment 24,047 1,787 7,602 - 18,232 9,748 2,827 3,919 8,656 9,576
22,843 1,435 231 - 24,047 6,905 2,894 51 9,748 14,299
Vehicles 3,497 1,913 2,210 - 3,200 1,916 897 1,266 1,547 1,653
4,769 793 2,065 - 3,497 2,797 798 1,679 1,916 1,581
Plant & Machinery 25,966 12,323 1,453 - 36,836 4,347 6,515 322 10,540 26,296
13,642 12,432 108 - 25,966 2,153 2,214 20 4,347 21,619
Computer Equipment 21,867 3,225 2,431 - 22,661 8,967 7,154 1,894 14,227 8,434
22,812 7,423 8,368 - 21,867 8,222 4,687 3,942 8,967 12,900
Furniture & Fixtures 1,046 123 - - 1,169 212 296 - 508 661
635 411 - - 1,046 126 86 - 212 834
Office Equipments 2,711 204 229 - 2,686 1,466 792 224 2,034 652
2,607 299 195 - 2,711 862 769 165 1,466 1,245
Railway Wagons 16,019 124 - - 16,143 1,186 2,580 - 3,766 12,377
8,265 7,754 - - 16,019 223 963 - 1,186 14,833
Electrical Installation & Equipments 1,176 12 - - 1,188 114 228 - 342 846
289 887 - - 1,176 2 112 - 114 1,062
111,660 21,487 14,168 - 118,979 34,608 23,177 7,806 49,979 69,000
90,411 34,146 12,897 - 111,660 28,193 14,003 7,588 34,608 77,052
Gross Block Accumulated depreciation and amortisation
Particulars
TANGIBLE ASSETS - TOTAL 95

Net Carrying
Value
Opening balance
as at April 1,
2017
Additions/
AdjustmentsDeletions
Written off
during the year*
Closing balance
as at March 31,
2018
Opening balance
as at April 1,
2017
Depreciation/
Amortisation for
the year
Deletions/
Adjustments
Closing balance
as at March 31,
2018
As at
March 31,
2018
Gross Block Accumulated depreciation and amortisation
Particulars
INTANGIBLE ASSETS
(other than internally generated)
Goodwill - - - - - - - - - -
7,804 - - 7,804 - - - - - -
Software 2,228 1,671 50 - 3,849 1,119 460 44 1,535 2,314
1,765 480 17 - 2,228 864 270 15 1,119 1,109
2,228 1,671 50 - 3,849 1,119 460 44 1,535 2,314
9,569 480 17 7,804 2,228 864 270 15 1,119 1,109
113,888 23,158 14,218 - 122,828 35,727 23,637 7,850 51,514 71,314
99,980 34,626 12,914 7,804 113,888 29,057 14,273 7,603 35,727 78,161
Capital work-in-progress 101
518
Intangible Assets under Development 39
655
71,454
79,334
Figures in italics relate to previous year
* Written off pursuant to Reduction of Share Capital (Refer note 38)
Total
Total
INTANGIBLE ASSETS - TOTAL
96

13. INVESTMENTS
Non- Current
Investment
Current portion
of Non-Current
Investment
Non- Current
Investment
Current portion
of Non-Current
Investment
Rs in lakh Rs in lakh Rs in lakh Rs in lakh
LONG-TERM INVESTMENTS (at cost)
Investment in Associates
Unquoted :
Investment in Equity Shares - - 3,854 -
Investment in Security Receipts - - 748 -
Investment in Others
Quoted :
Investment in Equity Shares 20,916 - 16,582 -
Investment in Mutual Fund 50 - 50 -
Unquoted :
Investment in Equity Shares 13,642 - 9,749 -
Investment in Mutual Fund 980 - 980 -
Investment in Security Receipts 395 -
Investment in Preference Shares - - - 90
Sub-total 35,983 - 31,963 90
(4,803) - (5,313) (90)
31,180 - 26,650 -
PARTICULARSAs at March 31,
2018
As at March 31,
2017
Quoted :
Investment in Equity Shares 170 794
Unquoted :
Investment in Equity Shares* 0 0
Total Current Investments 170 794
Non- Current
Investment
Current
Investment
Non- Current
Investment
Current
Investment
Rs in lakh Rs in lakh Rs in lakh Rs in lakh
Total Investments 31,180 170 26,650 794
Book value of Quoted investments (net) 17,776 170 11,833 794
Market value of Quoted investments 14,717 1,362 10,814 802
Book value of Unquoted investments (net) 13,404 - 14,817 -
* Amount less than Rs. 50,000.
Less: Provision for diminution in value of investments
PARTICULARS
TOTAL INVESTMENTS
Total Long-Term Investments
As at March 31, 2017
As at March 31, 2017
As at March 31, 2018
As at March 31, 2018
CURRENT INVESTMENTS (At lower of cost and fair value, unless otherwise stated)
97
Scrip-wise details of Investments:
No. of Units Non- Current
Investments
Current portion
of Non-Current
Investments
No. of Units Non- Current
Investments
Current portion
of Non-Current
Investments
Rs in lakh Rs in lakh Rs in lakh Rs in lakh
LONG-TERM INVESTMENTS
Investments in Associates
Unquoted
Investment in Equity Shares (Non-Trade)
10 - - - 13,946,295 3,854 -
- - 3,854 -
Investment in Security Receipts
1,000 - - - 104,135 748 -
- - 748 -
Investments in Others
Quoted :
Investment in Equity Shares (Non-Trade)
Hindustan Unilever Limited 1 2,000 5 - 2,000 5 -
Praj Industries Limited 2 13,422,400 16,577 - 13,422,400 16,577 -
The New India Assurance company Limited 5 541,688 4,334 - - - -
20,916 - 16,582 -
Investment in units of Mutual Funds
HDFC Debt Fund For Cancer Cure 10 500,000 50 - 500,000 50 -
50 - 50 -
Unquoted :
10 1,396,500 140 - 1,396,500 140 -
10 8 0 - 8 0 -
10 235,992 660 - 235,992 660 -
10 13,946,295 3,893 - - - -
10 2,223,569 3,935 - 2,223,569 3,935 -
TVS Logistics Services Limited 10 217,325 1,465 - 217,325 1,465 -
10 33,931,831 1,028 - 33,931,831 1,028 -
10 155,024 2,521 - 155,024 2,521 -
13,642 - 9,749 -
Investment in Security Receipts
1,000 104,135 395 - - - -
395 - - -
Investment in Preference Shares (Non-Trade)
10 - - - 900,000 - 90
- - - 90
Investment in units of Mutual Funds
Tata Money Market Fund 1,000 39,412 980 - 39,412 980 -
980 - 980 -
(4,803) - (5,313) (90)
Total Long Term Investments 31,180 - 26,650 -
Shriram Properties Private Limited
Face
value
Per Unit
(in Rs)
Adithya Automotives Private Limited
Investment in Equity Shares (Non-Trade unless otherwise
stated)
PARTICULARS
International Asset Reconstruction Company Private Limited
As at March 31, 2018
International Asset Reconstruction Company Private Limited
(Refer note 31)
International Asset Reconstruction Company Private Limited
Fincare Business Services Limited
Aricent Technologies Holdings Limited *
Less: Provision for diminution in value of investments
0.001% Share Microfin Limited Optionally Cumulative
Convertible Redeemable Preference Shares
As at March 31, 2017
Varroc Engineering Private Limited
SKS Ispat & Power Limited
International Asset Reconstruction Company Private Limited
98

No. of Units Rs in lakh Rs in lakh No. of Units Rs in lakh Rs in lakh
CURRENT INVESTMENTS
Quoted :
Investment in Equity Shares (Non-Trade)
3i Infotech Limited 10 23,280,000 1,013 - -
Consolidated Construction Consortium Limited 2 416,472 8 - -
Diamond Power Infra Limited 10 1,631,881 674 1,631,881 674
Gol Offshore Limited 10 644,609 282 644,609 282
IVRCL Limited 2 1,594,857 246 2,223 2,776,522 428 1,384
Less: MTM Provision on Current Investments (2,053) (590)
170 794
Unquoted :
Investment in Equity Shares (Non-Trade)
Coastal Projects Limited 10 4,101,806 410 4,101,806 410
Tata Tele Services Limited * (Refer note 38) 10 62,250,000 0 410 62,250,000 0 410
Less: Provision for dimunition on Current Investment (410) (410)
0 0
Total Current Investments 170 794
PARTICULARS
Non- Current
Investment
Current
Investments
Non- Current
Investment
Current
Investments
Rs in lakh Rs in lakh Rs in lakh Rs in lakh
TOTAL INVESTMENTS 31,180 170 26,650 794
Book value of Quoted investments (net) 17,776 170 11,833 794
Market value of Quoted investments 14,717 1,362 10,814 802
Book value of Unquoted investments (net) 13,404 - 14,817 -
* Amount less than Rs. 50,000.
As at March 31, 2018
As at March 31, 2018
As at March 31, 2017
As at March 31, 2017
PARTICULARS
Face
value
Per Unit
(in Rs)
99
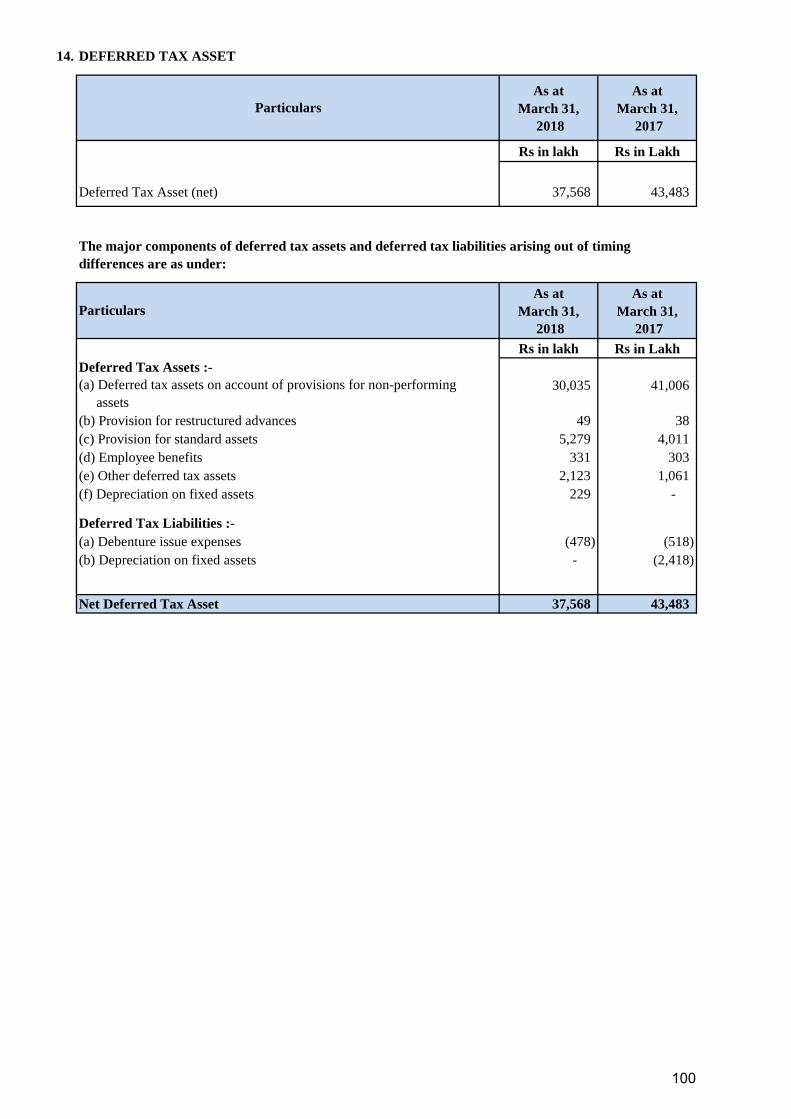
14. DEFERRED TAX ASSET
As at
March 31,
2018
As at
March 31,
2017
Rs in lakh Rs in Lakh
Deferred Tax Asset (net) 37,568 43,483
As at
March 31,
2018
As at
March 31,
2017
Rs in lakh Rs in Lakh
Deferred Tax Assets :-
30,035 41,006
(b) Provision for restructured advances 49 38
(c) Provision for standard assets 5,279 4,011
(d) Employee benefits 331 303
(e) Other deferred tax assets 2,123 1,061
(f) Depreciation on fixed assets 229 -
Deferred Tax Liabilities :-
(a) Debenture issue expenses (478) (518)
(b) Depreciation on fixed assets - (2,418)
37,568 43,483
Particulars
Particulars
Net Deferred Tax Asset
The major components of deferred tax assets and deferred tax liabilities arising out of timing
differences are as under:
(a) Deferred tax assets on account of provisions for non-performing
assets
100
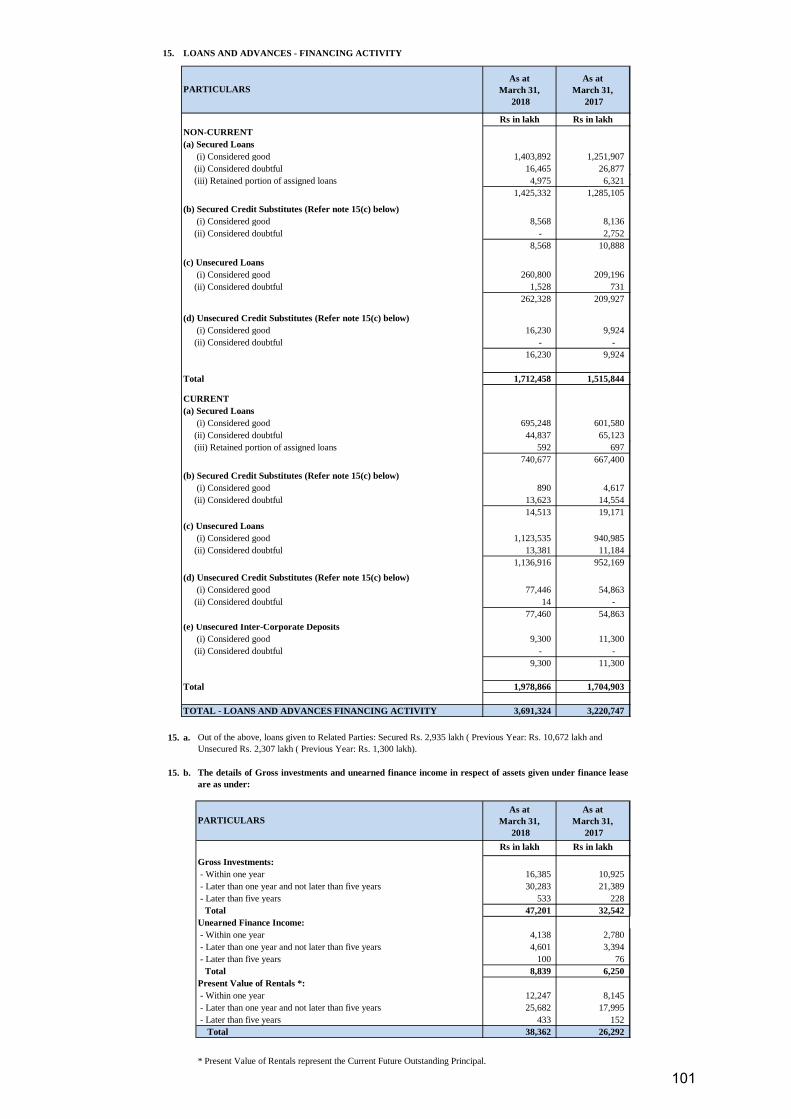
15. LOANS AND ADVANCES - FINANCING ACTIVITY
As at
March 31,
2018
As at
March 31,
2017
A
s
a
t
MRs in lakh Rs in lakh R
s NON-CURRENT
(a) Secured Loans
(i) Considered good 1,403,892 1,251,907
(ii) Considered doubtful 16,465 26,877
(iii) Retained portion of assigned loans 4,975 6,321
1,425,332 1,285,105
(b) Secured Credit Substitutes (Refer note 15(c) below)
(i) Considered good 8,568 8,136
(ii) Considered doubtful - 2,752
8,568 10,888
(c) Unsecured Loans
(i) Considered good 260,800 209,196
(ii) Considered doubtful 1,528 731
262,328 209,927
(d) Unsecured Credit Substitutes (Refer note 15(c) below)
(i) Considered good 16,230 9,924
(ii) Considered doubtful - -
16,230 9,924
Total 1,712,458 1,515,844
CURRENT
(a) Secured Loans
(i) Considered good 695,248 601,580
(ii) Considered doubtful 44,837 65,123
(iii) Retained portion of assigned loans 592 697
740,677 667,400
(b) Secured Credit Substitutes (Refer note 15(c) below)
(i) Considered good 890 4,617
(ii) Considered doubtful 13,623 14,554
14,513 19,171
(c) Unsecured Loans
(i) Considered good 1,123,535 940,985
(ii) Considered doubtful 13,381 11,184
1,136,916 952,169
(d) Unsecured Credit Substitutes (Refer note 15(c) below)
(i) Considered good 77,446 54,863
(ii) Considered doubtful 14 -
77,460 54,863
(e) Unsecured Inter-Corporate Deposits
(i) Considered good 9,300 11,300
(ii) Considered doubtful - -
9,300 11,300
Total 1,978,866 1,704,903
3,691,324 3,220,747
15. a.
15. b.
As at
March 31,
2018
As at
March 31,
2017
A
s
a
t Rs in lakh Rs in lakh R
s Gross Investments:
- Within one year 16,385 10,925
- Later than one year and not later than five years 30,283 21,389
- Later than five years 533 228
Total 47,201 32,542
Unearned Finance Income:
- Within one year 4,138 2,780
- Later than one year and not later than five years 4,601 3,394
- Later than five years 100 76
Total 8,839 6,250
Present Value of Rentals *:
- Within one year 12,247 8,145
- Later than one year and not later than five years 25,682 17,995
- Later than five years 433 152
Total 38,362 26,292
* Present Value of Rentals represent the Current Future Outstanding Principal.
The details of Gross investments and unearned finance income in respect of assets given under finance lease
are as under:
TOTAL - LOANS AND ADVANCES FINANCING ACTIVITY
PARTICULARS
PARTICULARS
Out of the above, loans given to Related Parties: Secured Rs. 2,935 lakh ( Previous Year: Rs. 10,672 lakh and
Unsecured Rs. 2,307 lakh ( Previous Year: Rs. 1,300 lakh).
101
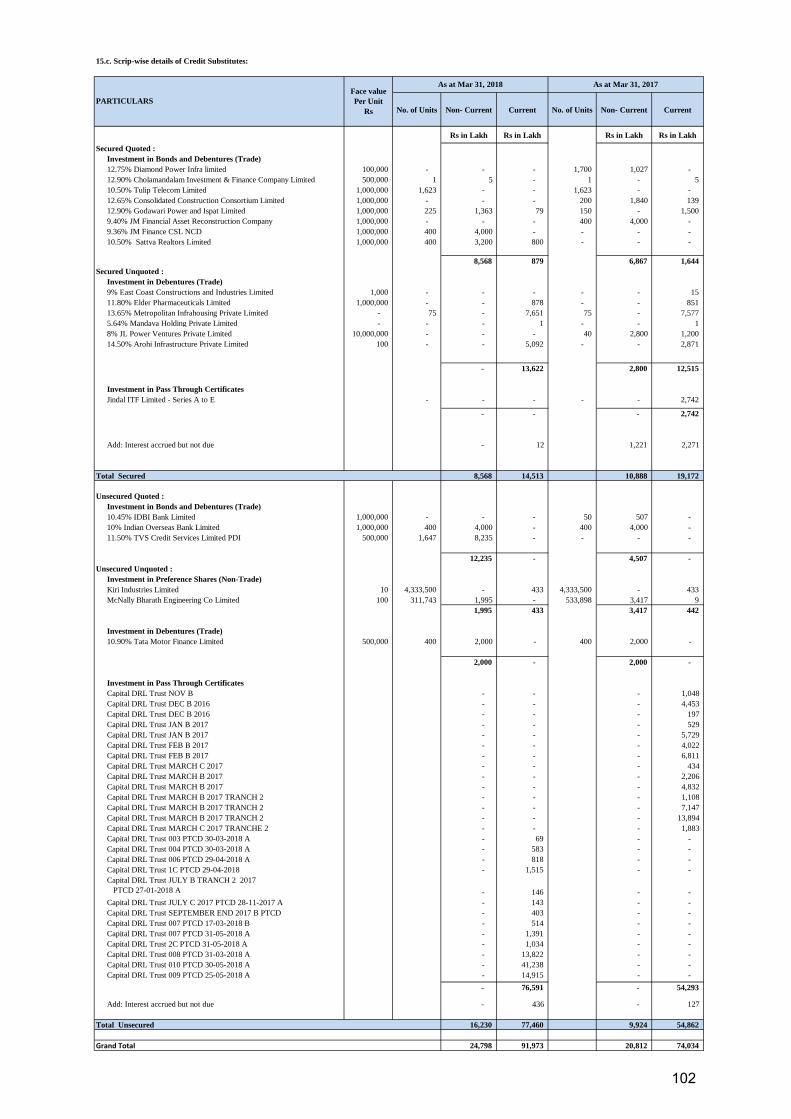
15.c. Scrip-wise details of Credit Substitutes:
No. of Units Non- Current Current No. of Units Non- Current Current
Rs in Lakh Rs in Lakh Rs in Lakh Rs in Lakh
Secured Quoted :
Investment in Bonds and Debentures (Trade)
100,000 - - - 1,700 1,027 -
500,000 1 5 - 1 - 5
1,000,000 1,623 - - 1,623 - -
12.65% Consolidated Construction Consortium Limited 1,000,000 - - - 200 1,840 139
12.90% Godawari Power and Ispat Limited 1,000,000 225 1,363 79 150 - 1,500
9.40% JM Financial Asset Reconstruction Company 1,000,000 - - - 400 4,000 -
9.36% JM Finance CSL NCD 1,000,000 400 4,000 - - - -
10.50% Sattva Realtors Limited 1,000,000 400 3,200 800 - - -
8,568 879 6,867 1,644
Secured Unquoted :
Investment in Debentures (Trade)
9% East Coast Constructions and Industries Limited 1,000 - - - - - 15
11.80% Elder Pharmaceuticals Limited 1,000,000 - - 878 - - 851
13.65% Metropolitan Infrahousing Private Limited - 75 - 7,651 75 - 7,577
5.64% Mandava Holding Private Limited - - - 1 - - 1
8% JL Power Ventures Private Limited 10,000,000 - - - 40 2,800 1,200
14.50% Arohi Infrastructure Private Limited 100 - - 5,092 - - 2,871
- 13,622 2,800 12,515
Investment in Pass Through Certificates
Jindal ITF Limited - Series A to E - - - - - 2,742
- - - 2,742
Add: Interest accrued but not due - 12 1,221 2,271
Total Secured 8,568 14,513 10,888 19,172
Unsecured Quoted : (7,914) (6,489) (8,346) (16,384)
Investment in Bonds and Debentures (Trade)
10.45% IDBI Bank Limited 1,000,000 - - - 50 507 -
10% Indian Overseas Bank Limited 1,000,000 400 4,000 - 400 4,000 -
11.50% TVS Credit Services Limited PDI 500,000 1,647 8,235 - - - -
12,235 - 4,507 -
Unsecured Unquoted :
Investment in Preference Shares (Non-Trade)
Kiri Industries Limited 10 4,333,500 - 433 4,333,500 - 433
100 311,743 1,995 - 533,898 3,417 9
1,995 433 3,417 442
Investment in Debentures (Trade)
10.90% Tata Motor Finance Limited 500,000 400 2,000 - 400 2,000 -
2,000 - 2,000 -
Investment in Pass Through Certificates
Capital DRL Trust NOV B - - - 1,048
Capital DRL Trust DEC B 2016 - - - 4,453
Capital DRL Trust DEC B 2016 - - - 197
Capital DRL Trust JAN B 2017 - - - 529
Capital DRL Trust JAN B 2017 - - - 5,729
Capital DRL Trust FEB B 2017 - - - 4,022
Capital DRL Trust FEB B 2017 - - - 6,811
Capital DRL Trust MARCH C 2017 - - - 434
Capital DRL Trust MARCH B 2017 - - - 2,206
Capital DRL Trust MARCH B 2017 - - - 4,832
Capital DRL Trust MARCH B 2017 TRANCH 2 - - - 1,108
Capital DRL Trust MARCH B 2017 TRANCH 2 - - - 7,147
Capital DRL Trust MARCH B 2017 TRANCH 2 - - - 13,894
Capital DRL Trust MARCH C 2017 TRANCHE 2 - - - 1,883
Capital DRL Trust 003 PTCD 30-03-2018 A - 69 - -
Capital DRL Trust 004 PTCD 30-03-2018 A - 583 - -
Capital DRL Trust 006 PTCD 29-04-2018 A - 818 - -
Capital DRL Trust 1C PTCD 29-04-2018 - 1,515 - -
- 146 - -
Capital DRL Trust JULY C 2017 PTCD 28-11-2017 A - 143 - -
Capital DRL Trust SEPTEMBER END 2017 B PTCD - 403 - -
Capital DRL Trust 007 PTCD 17-03-2018 B - 514 - -
Capital DRL Trust 007 PTCD 31-05-2018 A - 1,391 - -
Capital DRL Trust 2C PTCD 31-05-2018 A - 1,034 - -
Capital DRL Trust 008 PTCD 31-03-2018 A - 13,822 - -
Capital DRL Trust 010 PTCD 30-05-2018 A - 41,238 - -
Capital DRL Trust 009 PTCD 25-05-2018 A - 14,915 - -
- 76,591 - 54,293
Add: Interest accrued but not due - 436 - 127
Total Unsecured 16,230 77,460 9,924 54,862
Grand Total 24,798 91,973 20,812 74,034
(777) 43,894 (7,083) 21,296
McNally Bharath Engineering Co Limited
Capital DRL Trust JULY B TRANCH 2 2017
PTCD 27-01-2018 A
PARTICULARS
Face value
Per Unit
Rs
As at Mar 31, 2018 As at Mar 31, 2017
10.50% Tulip Telecom Limited
12.75% Diamond Power Infra limited
12.90% Cholamandalam Investment & Finance Company Limited
102

16. LONG-TERM LOANS AND ADVANCES - OTHERS (UNSECURED - CONSIDERED GOOD)
As at
March 31,
2018
As at
March 31,
2017
Rs in lakh Rs in lakh
(a) Capital advances 17,452 7,806
(b) Loans and advances to related parties - 249
(c) Security deposits 52 47
6,265 5,818
(e) Others
(i) Loan to TCL Employee Welfare Trust 7,302 7,302
(ii) Prepaid Expenses 155 289
31,226 21,511
17. OTHER NON-CURRENT ASSETS
As at
March 31,
2018
As at
March 31,
2017
Rs in lakh Rs in lakh
963 1,087
(b) Unamortised loan sourcing costs 6,399 5,752
(c) Gratuity Asset (Net) 49 239
(d) Fixed deposit with maturity more than 12 months 25 -
7,436 7,078
Total
Total
PARTICULARS
PARTICULARS
(a) Deferred revenue expenditure (to the extent not written off or adjusted)
(Refer note 21(a))
(d) Advance payment of Income tax [Net of provision for tax Rs. 92,845 lakh
(As at March 31, 2017 Rs. 54,789 lakh)]
103

18. TRADE RECEIVABLES
As at
March 31,
2018
As at
March 31,
2017
Rs in lakh Rs in lakh
(a) Over six months (from the date due for payment)
(i) Secured, considered good - -
(ii) Unsecured, considered good 243 86
(iii) Doubtful 230 -
473 86
Less: Provision for trade receivables 230 -
243 86
(b) Others
(i) Secured, considered good - -
(ii) Unsecured, considered good 6,003 1,963
(iii) Doubtful - -
6,003 1,963
Less: Provision for trade receivables - -
6,003 1,963
6,246 2,049
19. CASH AND BANK BALANCES
As at
March 31,
2018
As at
March 31,
2017
Rs in lakh Rs in lakh
(a) Cash on Hand 102 573
(b) Cheques on Hand 1,213 1,577
(c) Balances with banks
(i) In current accounts 6,812 5,187
(ii) In deposit accounts (Refer note (ii) below) 4,407 3
12,534 7,340
Note:
(i)
(ii)
(iii)
(iv)
(v)
SBNs
Other
Denomination
Notes
Total
1,168 1 1,169
- 870 870
- - -
1,168 801 1,969
- 70 70 Closing cash in hand as on 30/12/2016
PARTICULARS
Balance in current accounts includes Rs. 56 lakh (as at March 31, 2017 Rs.53 lakh) towards unclaimed debenture
application money and interest accrued thereon.
Balance in deposit accounts with Banks have an original maturity exceeding 3 months but balance maturity of under
12 months from the Balance Sheet date.
The details of the Specified Bank Notes (SBN) held and transacted during the period 08/11/2016 to 30/12/2016 are as
below (as per MCA Notification G.S.R. 307 (E) dated 30th March 2017 :
Opening Cash in hand as on 08/11/2016
(+) Permitted reciepts
(-) Permitted payments
(-) Amounts deposited in Banks (deposited before 11/11/2016)
The disclosures in the financial statements regarding holdings as well as dealings in specified bank notes during the
period from 08/11/2016 to 30/12/2016 have not been made since they do not pertain to the financial year ended 31
March 2018.
PARTICULARS
Of the above, the balances that meet the definition of Cash and Cash Equivalents as per AS 3 Cash Flow Statements is
Rs. 8,071 lakh (as at March 31, 2017 Rs. 7,284 lakh)
Total
Total
PARTICULARS
104
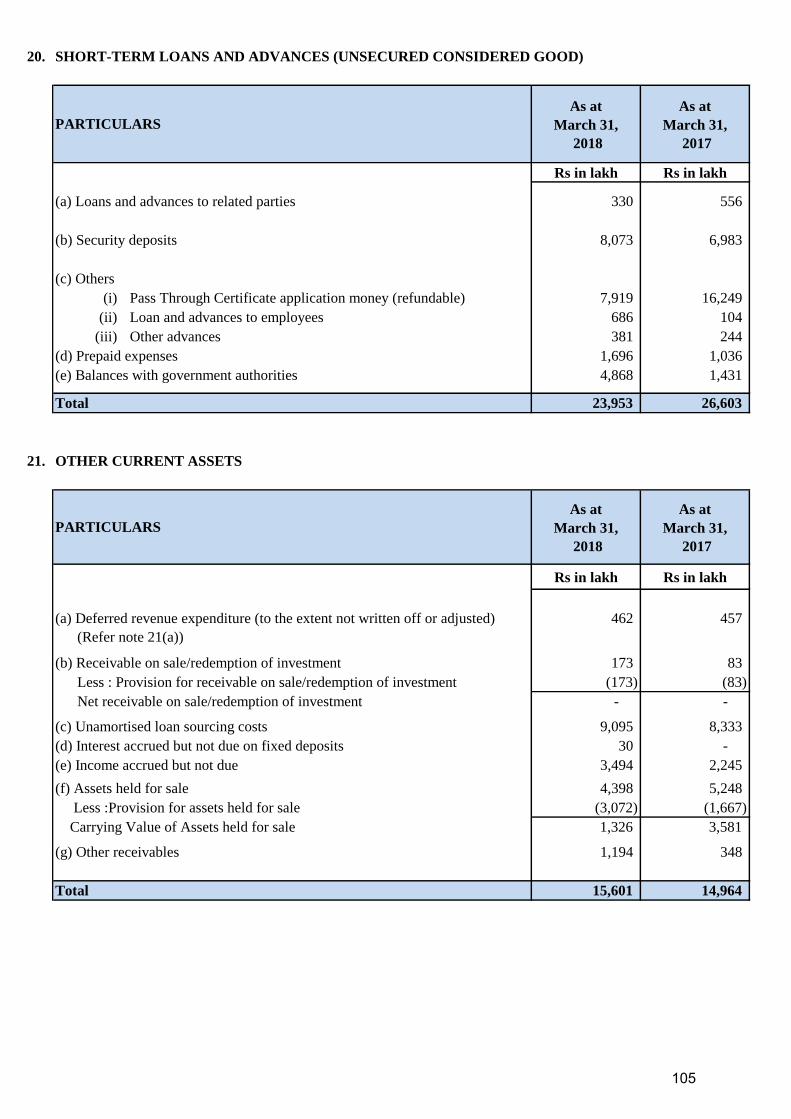
20. SHORT-TERM LOANS AND ADVANCES (UNSECURED CONSIDERED GOOD)
As at
March 31,
2018
As at
March 31,
2017
Rs in lakh Rs in lakh
(a) Loans and advances to related parties 330 556
(b) Security deposits 8,073 6,983
(c) Others
(i) Pass Through Certificate application money (refundable) 7,919 16,249
(ii) Loan and advances to employees 686 104
(iii) Other advances 381 244
(d) Prepaid expenses 1,696 1,036
(e) Balances with government authorities 4,868 1,431
23,953 26,603
21. OTHER CURRENT ASSETS
As at
March 31,
2018
As at
March 31,
2017
Rs in lakh Rs in lakh
462 457
(b) Receivable on sale/redemption of investment 173 83
Less : Provision for receivable on sale/redemption of investment (173) (83)
Net receivable on sale/redemption of investment - -
(c) Unamortised loan sourcing costs 9,095 8,333
(d) Interest accrued but not due on fixed deposits 30 -
(e) Income accrued but not due 3,494 2,245
(f) Assets held for sale 4,398 5,248
Less :Provision for assets held for sale (3,072) (1,667)
Carrying Value of Assets held for sale 1,326 3,581
(g) Other receivables 1,194 348
15,601 14,964
PARTICULARS
Total
Total
PARTICULARS
(a) Deferred revenue expenditure (to the extent not written off or adjusted)
(Refer note 21(a))
105

21 (a). Deferred Revenue Expenditure (to the extent not written off or adjusted)
PARTICULARS
As at
March 31,
2018
As at
March 31,
2017
Rs in lakh Rs in lakh
(a) Unamortised share issue expenses
Opening balance - 1
Add: Expenses incurred during the year - -
Less: written off through securities premium (Refer note 39) - 1
Less: written off during the year - -
Closing balance - -
(b) Unamortised debenture issue expenses
Opening balance 1,498 1,170
Add: Expenses incurred during the year 374 754
Less: written off during the year 490 426
Closing balance 1,382 1,498
(c) Unamortised loan processing charges
Opening balance 46 16
Add: Expenses incurred during the year 105 153
Less: written off during the year 108 123
Closing balance 43 46
1,425 1,544
PARTICULARS
Non-Current Current Non-Current Current
Rs in lakh Rs in lakh Rs in lakh Rs in lakh
(a) Unamortised debenture issue expenses 963 419 1,087 411
(b) Unamortised loan processing charges - 43 - 46
Total 963 462 1,087 457
Grand Total 1,425 1,544
Total
As at March 31, 2018 As at March 31, 2017
106

22. REVENUE FROM OPERATIONS
For the Year
Ended
March 31, 2018
For the Year
Ended
March 31, 2017
Rs in lakh Rs in lakh
(a) Interest Income
(i) From secured loans and credit substitutes 250,278 234,127
(ii) From unsecured loans and credit substitutes 129,748 113,911
(b) Income from Bill Discounting 3,832 4,928
(c) Others 36,843 31,694
420,701 384,660
23. INVESTMENT INCOME
For the Year
Ended
March 31, 2018
For the Year
Ended
March 31, 2017
Rs in lakh Rs in lakh
(a) Dividend from Non-current Investments 247 134
(b) Dividend from Current Investments 2 3
(c) Profit on sale of Non-current Investments - 3,278
(d) Profit on sale of Current Investments - 489
(e) Interest on Non-current Investments - 1,644
249 5,548
24. OTHER INCOME
For the Year
Ended
March 31, 2018
For the Year
Ended
March 31, 2017
Rs in lakh Rs in lakh
(a) Income from operating leases 25,555 24,165
(b) Interest Income on Fixed Deposits 30 -
(c) Advertisement income 1,787 555
(d) Income from distribution of financial products 3,745 3,930
(e) Profit on sale of Assets 2,222 68
(f) Interest on Income Tax Refund 307 -
(g) Miscellaneous Income 941 278
34,587 28,996
PARTICULARS
Total
PARTICULARS
Total
Total
PARTICULARS
107

25. FINANCE COSTS
For the Year
Ended
March 31, 2018
For the Year
Ended
March 31, 2017
Rs in lakh Rs in lakh
(a) Interest expense 180,425 172,902
(b) Discounting Charges
(i) On commercial paper 42,201 46,723
(ii) On Collateralised Borrowings and Lending Obligations (CBLO) - 1,130
(iii) On debentures 448 407
223,074 221,162
26. EMPLOYEE BENEFIT EXPENSES
For the Year
Ended
March 31, 2018
For the Year
Ended
March 31, 2017
Rs in lakh Rs in lakh
(a) Salaries, wages and bonus 36,037 31,349
(b) Contribution to provident and other fund (Refer note 30) 1,684 2,233
(c) Staff welfare expenses 2,000 1,676
39,721 35,258
PARTICULARS
Total
PARTICULARS
Total
108

27. OTHER OPERATING EXPENSES
Rs in Lakh Rs in Lakh Rs in lakh Rs in lakh
(a) Advertisements and publicity 2,005 2,186
(b) Brand Equity and Business Promotion 1,243 1,171
(c) Corporate social responsibility cost [Refer note 27(c) below] 1,014 910
(d) Donations 4 3
(e) Equipment hire charges 348 316
(f) Incentive / commission/ brokerage 17,517 13,380
(g) Information technology expenses 8,045 6,544
(h) Insurance charges 744 616
(i) Legal and professional fees 3,867 3,312
(j) Loan processing fees 2,199 1,837
(k) Printing and stationery 783 615
32,575 88,475
- (31,789)
(5,731) 26,844 - 56,686
(m) Write off - Loans and advances 62,501 34,552
Less : Provision reversal on write off (62,501) - (34,552) -
(n) Provision against assets held for sale 1,405 1,378
3,664 3,008
(1,409) (827)
(509) (455)
1463 732
- 1,463 (349) 383
- 14,318
- - (14,318) -
- 7,804
- - (7,804) -
230 -
(v) Power and fuel 905 838
(w) Repairs and maintenance
(i) Buildings 129 66
(ii) Annual maintenance charges 99 239
(iii) Others 174 402 129 434
(x) Rent 2,134 1,910
(y) Rates and taxes 119 133
(z) Stamp charges 502 541
(aa) Service providers' charges 14,045 10,814
(ab) Training and recruitment 510 597
(ac) Telephone, telex and leased line 767 653
(ad) Travelling and conveyance 2,630 2,214
(ae) Loss on sale of Non-current Investments - 1,248
(af) Loss on sale of Current Investments (Net) 60 -
(ag) Amortisation of premium of forward foreign exchange cover 128 -
(ah) Directors remuneration 221 232
(ai) Loss on sale of assets 1,188 3,355
(aj) Other expenses [Refer note 27(a) below] 1,259 683
94,327 114,715
For the Year Ended
March 31, 2017
For the Year Ended
March 31, 2018
Total
(q) Provision for diminution in value of investments
(net of reversals)
(l) Provision for doubtful loans (net of recoveries)
(o) Contingent provision against Standard Assets
(Refer note 36)
(s) Write-off - Investments
Less : Adjustment pursuant to Reduction of Share
Capital (Refer note 38)
(t) Write-off - Goodwill
Less : Adjustment pursuant to Reduction of Share
Capital (Refer note 38)
(u) Provision for Trade receivables
Less : Adjustment pursuant to Reduction of Share
Capital (Refer note 38)
Less : Adjustment pursuant to Reduction of Share
Capital (Refer note 38)
(p) Provision against Restructured Advances
(r) Provision on Current Investment
PARTICULARS
Less : Delinquency Support
109

27. (a) Auditors’ Remuneration (excluding taxes):
Particulars
For the Year
Ended
March 31, 2018
For the Year
Ended
March 31, 2017
Rs in lakh Rs in lakh
Audit Fees 106 110
Tax Audit Fees 4 5
Other Services 20 22
Out of Pocket Expenses 1 1
131 138
(Auditors' remuneration is included in Other expenses)
27. (b) Expenditure in Foreign Currency
Particulars
For the Year
Ended
March 31, 2018
For the Year
Ended
March 31, 2017
Rs in lakh Rs in lakh
Legal and professional fees 137 366
Commission paid 79 214
Information Technology Expenses 1,084 74
Training and recruitment 6 28
Other expenses 7 3
1,313 685
27. (c) Corporate social responsibility expenses
(ii) Amount spent during the year on:
Particulars Paid Yet to be paid Total
Rs in lakh Rs in lakh Rs in lakh
Construction/acquisition of any asset - - -
On purposes other than above 1,014 - 1,014
(i) Gross amount required to be spent by the company during the year was Rs. 1,014 lakh (PY. 910 lakh).
110

28. Contingent Liabilities and Commitments:
(i)
(Rs. in lakh)
As at
March 31, 2018
As at
March 31, 2017
1,916 1,786
71 420
(ii) Commitments :-
(a) Undrawn Commitment given to Borrowers
(b) Letter of Credit, Buyers Credit and Other Guarantees Rs. 44,200 lakh (Previous Year : Rs. 29,048 lakh)
(c) Leases entered but not executed Rs. 89,148 lakh (Previous Year : Rs. 66,473 lakh)
(d) Unamortised Forward Contract exposure Rs. 98 lakh (Previous Year : Rs. Nil lakh)
- Tangible: Rs. 1,111 lakh (Previous year : Rs. 817 lakh)
- Intangible: Rs. 199 lakh (Previous year : Rs. 1,459 lakh)
29.
30. Employee benefits
Reconciliation of Benefit Obligations and Plan Assets
(Rs in lakh)
Particulars 2017-18 2016-17
Change in Defined Benefit Obligation
Opening Defined Benefit Obligation 2,926 1,887
Current Service Cost 509 335
Interest Cost 211 148
Acquisitions Cost / (Credit) (25) (106)
Actuarial Losses / (Gain) (77) 816
Benefits Paid (219) (154)
Closing Defined Benefit Obligation 3,326 2,926
Change in the Fair Value of Assets
Opening Fair Value of Plan Assets 3,165 1,580
Transfer in (25) (106)
Expected Return on Plan Assets 253 184
Contributions by Employer - 1,433
Actuarial Gains / (Losses) (19) 74
Benefits paid - -
Closing Fair Value of Plan Assets 3,374 3,165
44% 33%
12% 16%
43% 41%
1% 10%
Total 100% 100%
As on March 31, 2018 Rs. 212,864 lakh (Previous Year: Rs. 211,584 lakh)
Less than 1 Year: Rs. 165,763 lakh (Previous Year: Rs. 178,908 lakh)
More than 1 Year: Rs. 47,101 lakh (Previous Year: Rs. 32,676 lakh)
Contingent Liabilities :-
Claims not acknowledged by the Company relating to cases contested by the Company and which are not likely to be devolved on the Company relating to the
following areas :
Particulars
Income Tax (Pending before Appellate authorities)
VAT (Pending before Appellate authorities)
(e) Estimated amount of contracts remaining to be executed on capital account and not provided for Rs.1,310 lakh
(as at March 31, 2017: Rs. 2,276 lakh).
The Company offers its employees defined-benefit plans in the form of a gratuity scheme (a lump sum amount) (included as part of Contribution to provident and other fund
in note 26 Employee Benefit Expenses). Benefits under the defined benefit plans are typically based on years of service and the employee’s compensation (generally
immediately before separation). The gratuity scheme covers all regular employees. Commitments are actuarially determined at year-end. These commitments are valued at
the present value of the expected future payments, with consideration for calculated future salary increases, using a discount rate corresponding to the interest rate estimated
by the actuary having regard to the interest rate on government bonds with a remaining term that is almost equivalent to the average balance working period of employees.
Actuarial valuation is done based on “Projected Unit Credit” method. Gains and losses of changed actuarial assumptions are charged to the Statement of Profit and Loss.
Employees of the Company may be entitled to Stock Purchase / Stock Options Scheme offered by Tata Capital Limited.
Defined Contribution Plans
The Company makes Provident Fund and Superannuation Fund contributions to defined contribution retirement benefit plans for eligible employees. Under the schemes, the
Company is required to contribute a specified percentage of payroll costs to fund the benefits. The contributions as specified under the law are paid to the provident fund set
up as a Trust by the Company. The Company is generally liable for annual contributions and any deficiency in interest cost compared to interest computed based on the rate
of interest declared by the Central Government under the Employee Provident Scheme, 1952 is recognised as an expense in the year in which it is determined.
Employee Stock Purchase/Option Scheme
Government Bonds
Insurer managed funds:
The provident fund set up as a Trust by the Company manages the contributions from the Company and other participating subsidiaries. As of March 31, 2018, the
accumulated members' corpus of the Company is Rs. 13,085 lakh whereas the total fair value of the assets of the fund and the total accumulated members’ corpus is Rs.
21,026 lakh and Rs. 20,658 lakh respectively. In accordance with an actuarial valuation, there is no deficiency in the interest cost as the present value of the expected future
earnings on the fund is greater than the expected amount to be credited to the individual members based on the expected guaranteed rate of interest of 8.55%. The actuarial
assumptions include discount rate of 7.70%.
Defined Benefits Plans
The Company recognised a charge of Rs. 1,189 lakh (Previous year Rs. 1,089 lakh) for provident fund and family pension fund contribution and Rs. 89 lakh (Previous year
Rs. 97 lakh) for contribution towards the superannuation fund in the Statement of Profit and Loss.
Equity of listed entities
Bonds / Debentures
Cash (including Special Deposits)
111

Particulars 2017-18 2016-17
Reconciliation of present value of the obligation and the fair value of the plan assets
Fair value of plan assets at the end of the year 3,374 3,165
Present value of the defined obligations at the end of the year 3,326 2,926
Funded status Surplus 49 239
Net Asset recognised in the Balance Sheet 49 239
Net Gratuity cost for the year ended March 31, 2018
Service Cost 509 335
Interest on Defined benefit Obligation 211 148
Expected return on plan assets (253) (184)
Net actuarial loss recognised in the year (58) 742
Net Gratuity Cost 409 1,041
Actual contribution and benefit payments for the year
Actual benefit payments (219) (154)
Actual contributions - 1,433
Categorization of plan assets is as follows
Investment Pattern 2017-18 2016-17
Assumptions
Discount Rate 7.70% 7.50%
Expected Rate of Return on Plan Assets 8.00% p.a 8.00% p.a
Salary Escalation Rate7.50% p.a for first 5
years and 6%
thereafter.
7.50% p.a for first 5
years and 6%
thereafter.
Mortality RateIndian Assured Lives
Mortality (2006-08)
(modified) Ult.
Indian Assured Lives
Mortality (2006-08)
(modified) Ult.
Withdrawal Rate 0-2 years - 10%
3-4 years - 5%
5-9 years - 2.5%
10 years & more -
1%
0-2 years - 10%
3-4 years - 5%
5-9 years - 2.5%
10 years & more - 1%
Experience History 2017-18 2016-17 2015-16 2014-15 2013-14
Present value of Defined Benefit Obligation (3,326) (2,926) (1,887) (1,571) (1,026)
Fair value of Plan Assets 3,374 3,165 1,580 1,506 946
Excess of (obligation over plan assets) 49 239 (307) (65) (80)
Experience Gain/ (Loss) Adjustment :
- On Plan Liabilities 34 (313) (228) (41) (96)
- On Plan Assets (19) 74 (90) 148 16
Acturial Gain / (Loss) due to change in assumptions 44 (503) 54 (279) 116
Long Term Service Award :
Long Term Service award is an employee benefit in recognition for their loyalty and continuity of service for five years and above, the same is actuarially valued (unfunded).
The Long Term Service awards expense for financial year 2017-18 is Rs. 6 lakh (Previous year Rs. 51 lakh) and the provision as at March 31, 2018 is Rs. 164 lakh (Previous
year Rs. 158 lakh).
The estimate of future salary increase, considered in the actuarial valuation, takes into account inflation, seniority, promotion, and other relevant factors. The above
information is certified by the actuary.
The Company expects to contribute approximately Nil (Previous year Rs. 484 lakh) to the gratuity fund for the year 2018-19.
112

31
The Particulars of investments in associates as on March 31, 2018 are as follows :
Sr No Name of AssociatesCountry of
Incorporataion
Ownership
Interest (%)
Original
Cost of
Investment
Amount of
goodwill/
(Capital
Reserve) in
original cost
Share of
post
acquisition
Reserves &
Surplus
Carrying
Amount of
Investments
1 India NA NA NA NA NA
25.37% 3,313 483 541 3,854
Note:
The Company has investments in the following associates, which are accounted for on the Equity Method in accordance with the Accounting Standard 23
on ‘Accounting for Investments in Associates in Consolidated Financial Statements’:
( Rs. in lakh )
International Asset Reconstruction Company Private
Limited (Refer footnote below)
International Asset Reconstruction Company Private Limited has ceased to be an Associate with effect from March 9th, 2018, figures in italics refer to
March 31, 2017.
113

32
As % of
consolidated
net assets
Rs in lakh
As % of
consolidat
ed net
assets
Rs in lakh
As % of
consolidated
profit or loss
Rs in lakh
As % of
consolidat
ed profit
or loss
Rs in lakh
Parent:
Tata Capital Financial Services Limited 100.00% 496,718 99.05% 403,095 99.92% 48,258 99.06% 21,598
Associates (Investment as per the equity method)
Indian
International Asset Reconstruction Company Private
Limited (Refer note 31)
0.00% - 0.95% 3,854 0.08% 39 0.94% 204
Total 100.00% 496,718 100.00% 406,949 100.00% 48,297 100.00% 21,802
Additional information as required by Paragraph 2 of the General Instructions for Preparation of Consolidated Financial Statements to Schedule III to the
Companies Act, 2013
Name of the entity
2017-18 2016-17 2017-18 2016-17
Net assets, i.e., total assets
minus total liabilities
Net assets, i.e., total
assets minus total
liabilities
Share of profit or loss Share of profit or loss
114

33. Disclosure as required by Accounting Standard (AS) – 18 on “Related Party Disclosures”
i. List of related parties and relationship :-
Ultimate Holding Company Tata Sons Limited
Holding Company Tata Capital Limited
Fellow Subsidiaries Tata Securities Limited
(with which the company had transactions) Tata Capital Pte. Limited
Tata Capital Advisors Pte Limited
Tata Capital Markets Pte Limited
Tata Capital General Partners LLP
Tata Capital Healthcare General Partners LLP
Tata Opportunities General Partners LLP
Tata Capital Plc
Tata Capital Housing Finance Limited
TC Travel and Services Limited (ceased to be subsidiary w.e.f. October 30, 2017)
Tata Capital Forex Limited (ceased to be subsidiary w.e.f. October 30, 2017)
Tata Cleantech Capital Limited
Subsidiaries of ultimate holding company
(with which the company had transactions)
Tata Consultancy Services Limited
Tata AIG General Insurance Company Limited
Tata AIA Life Insurance Company Limited
Infiniti Retail Limited
Tata Consulting Engineers Limited
Tata Housing Development Company Limited
Tata Asset Management Limited
Calsea Footwear Private Limited
Automotive Stamping and Assemblies Limited
Taj Air Limited
Tata Advanced Systems Limited
Tata Industries Limited
Tata Lockheed Martin Aerostructures Limited
Tata Teleservices Limited
Tata Teleservices (Maharashtra) Limited
MMP Mobi Wallet Payment Systems Limited
Ardent Properties Private Limited
Inshaallah Investments Limited
Sector 113 Gatevida Developers Private Limited
Associates
Key Management Personnel Mr. Praveen P Kadle - Managing Director & CEO
International Asset Reconstruction Company Private Limited (ceased to be an associate with effect from 9th
March 2018)
Conneqt Business Solutions Limited (formerly known as Tata Business Support Services Limited) (ceased to be
subsidiary w.e.f. November 27, 2017)
115

ii. Transactions with related parties :
(Rs in lakh)
Sr.
No.
Party Name Nature of transaction 2017-18 2016-17
1 Tata Sons Limited a) Expenses :
- Brand Equity and Business Promotion 1,243 1,171
- Rent 29 26
- Other charges 51 47
b) Income :
- Lease Income 6 8
c) Finance Lease Facility :
- Facility given during the year - 65
- Repaid during year 8 7
- Outstanding facility 50 58
d) Asset :
- Security deposit receivable - 12
- Security deposit refund received 12 -
- Balance receivable 5 16
e) Liability :
- Balance Payable 1,243 1,171
2 Tata Capital Limited a) Expenses :
- Interest expenses on Inter-Corporate Deposit 6,747 4,622
- Interest expenses on debentures 89 1,124
- Rent 1,036 1,203
- Marketing & managerial service fee 2,657 1,445
- Other Expenses 111 -
b) Income :
- Preference share arranger fees 515 435
- Reimbursement of Rent & Guest house expenses 41 42
- Fixed Asset transfer* 0 -
c) Amount raised by issue of Perpetual Non-Convertible debentures 12,500 -
d) Amount raised by issue of Compulsory Convertible Cumulative Preference
Shares
57,500 78,500
e) Interim dividend paid
- Equity Shares 4,541 5,839
- Preference Shares 8,726 4,230
f) Inter-Corporate Deposit accepted / repaid during the year
- Inter-Corporate Deposit received during year 463,617 693,970
- Inter-Corporate Deposit repaid during year 474,662 699,693
g) Security Deposit accepted / repaid during the year
- Security deposit given 5,849 -
- Security deposit received 4,667 -
h) Asset :
- Security Deposit Receivable 5,847 4,665
- Balance Receivable - 61
i) Liability :
- Inter-Corporate Deposit Payable 33,784 44,829
- Borrowings - Perpetual Non-Convertible debentures 12,500 5,000
- Balance Payable 374 -
3 Tata Securities Limited a) Expenses :
- Reimbursement of expenses 1 -
- Services Received 20 7
b) Income :
- Reimbursement of expenses - Rent & Others 49 138
c) Transfer of Fixed Assets (Purchase) 1 1
d) Asset :
- Balance Receivable 1 28
4 Tata Capital Pte. Limited a) Income :
- Income- SLA fees 13 13
- Reimbursement of expenses 10 10
b) Asset :
Balance Receivable 13 13
5 Tata Capital Advisors Pte Limited a) Income :
- Income- SLA fees 7 7
- Reimbursement of expenses 3 3
b) Asset :
Balance Receivable 7 7
6 Tata Capital Markets Pte Limited a) Income :
- Income- SLA fees 7 7
- Reimbursement of expenses 3 3
b) Asset :
- Balance Receivable 7 7
116

Sr.
No.
Party Name Nature of transaction 2017-18 2016-17
7 Tata Capital General Partners LLP a) Income :
- Income- SLA fees * 0 0
- Reimbursement of expenses 1 1
b) Asset :
- Balance Receivable * 0 0
8 Tata Capital Healthcare General Partners LLP a) Income :
- Income- SLA fees * 0 0
- Reimbursement of expenses 1 1
b) Asset :
- Balance Receivable * 0 0
9 Tata Opportunities General Partners LLP a) Income :
- Income- SLA fees * 0 0
- Reimbursement of expenses 1 1
b) Asset :
- Balance Receivable * 0 0
10 Tata Capital Plc a) Income :
- SLA fees 7 7
- Reimbursement of expenses 3 8
b) Asset :
- Balance Receivable 7 7
11 Tata Capital Housing Finance Limited a) Expenses :
- Sourcing Fee 1 6
- Rent & others 31 42
b) Income :
- Loan Sourcing Fee - 43
- Reimbursement of Rent & Other expenses 988 1,113
- Interest income on Tier II investment * - 0
c) Fixed Asset :
- Fixed Asset Purchased * 0 14
- Fixed Asset Sold 25 -
d) Asset :
- Balance Receivable 121 235
12 TC Travel and Services Limited a) Expenses :
-Travel related services 492 715
-Others - 35
b) Income :
- Reimbursement of Rent & Other expenses 55 106
c) Asset :
- Balance Receivable - 264
13 Tata Capital Forex Limited a) Income :
- Reimbursement of Rent & Other expenses 63 124
b) Expenses :
- Travel related services 4 9
c) Asset :
- Balance Receivable - 38
14 Tata Cleantech Capital Limited a) Expenses :
- Advisory Fees - 5
- Guest house expenses 23 13
- Management Fee - -
b) Income :
- Reimbursement of Rent & Other expenses 136 238
c) Fixed Asset transfer 1 -
d) Asset :
- Balance Receivable 6 16
15 Conneqt Business Solutions Limited a) Expenses :
(formerly known as Tata Business Support Services
Limited)
- Service Provider Charges 4,374 6,770
b) Income :
- Lease Income 453 512
- Processing Fee - 2
- Syndication Fee - -
- Reimbursement of Expenses 96 173
- Interest Income on Loan 14 122
c) Finance Lease Facility :
- Facility given during the year - -
- Repaid during year - 85
- Outstanding facility - 924
d) Asset :
- Loan Outstanding - 322
- Loan repaid during the year - 997
- Lease Debtors - 2
e) Liability :
- Security Deposit - 37
- Balance Payable - 896
117

Sr.
No.
Party Name Nature of transaction 2017-18 2016-17
16 Tata Consultancy Services Limited a) Expenses :
- Information technology expenses 5,511 4,721
b) Income :
- Lease Income 16 -
- Reimbursement of expenses - 4
c) Finance Lease Facility :
- Facility given during the year 217 -
- Repaid during year 6 -
- Outstanding facility 211 -
d) Fixed Assets Purchased 8 385
e) Asset :
- Balance Receivable - 4
f) Liability :
- Balance Payable 1,620 1,330
17 Tata AIG General Insurance Company Limited a) Expenses :
- Insurance Expenses 6 12
b) Income :
- Insurance related revenue 541 445
c) Asset :
- Balance Receivable 511 70
18 Tata AIA Life Insurance Company Limited a) Expenses :
- Insurance Expense for Employees 36 33
b) Income :
- Insurance related revenue 52 36
c) Asset :
- Balance Receivable 36 35
19 Infiniti Retail Limited a) Expenses :
- Incentive & others 904 726
b) Fixed Assets purchased 1 4
c) Income :
- Lease Income 210 132
- Processing fees 2 2
d) Liability :
- Security deposit payable 75 74
- Balance payable 11 -
e) Asset :
- Balance Receivable - 1
20 Tata Consulting Engineers Limited a) Income :
- Interest Income - 93
b) Asset :
- Inter-Corporate Deposit given during the year - 1,000
- Inter-Corporate Deposit repaid during the year - 2,000
21 Tata Housing Development Company Limited a) Income :
- Referral Fee 5 25
b) Asset :
- Balance Receivable - 14
22 International Asset Reconstruction Company Private
Limited
a) Redemption of Security Receipts during the year 353 236
b) Asset :
- Balance of Security Receipts - 748
23 Tata Asset Management Limited a) Income :
- Portfolio Management Service 17 17
b) Asset :
Balance Receivable - 3
24 Calsea Footwear Private Limited a) Income :
- Interest income on Inter-Corporate Deposit 141 124
b) Asset :
- Inter-Corporate Deposit given during the year 1,500 1,300
- Inter-Corporate Deposit repaid during the year 1,300 1,100
- Interest Accrued 38 35
- Outstanding Inter-Corporate Deposit 1,500 1,300
25 Automotive Stamping And Assemblies Limited a) Income :
- Term Loan - Interest 242 188
- Lease Rental 62 62
- Processing Fees 6 -
b) Asset :
- Loan given during the year 4,900 -
- Loan repaid during the year 3,950 240
- Outstanding loan 2,584 1,634
- Interest receivable 16 2
c) Liability :
- Balance in escrow account 35 -
118

Sr.
No.
Party Name Nature of transaction 2017-18 2016-17
26 Taj Air Limited a) Income :
- Term Loan - Interest 29 517
b) Asset :
- Loan given during the year - 2,500
- Loan repaid during the year 6,000 -
- Outstanding loan - 6,000
- Interest receivable - 39
27 Tata Advanced Systems Limited a) Income :
- Interest Income 7 3
- Interim Rent * - 0
b) Finance Lease Facility :
- Facility given during the year 33 30
- Repaid during year 16 4
- Outstanding facility 52 35
c) Asset :
- Balance receivable* 2 0
28 Tata Industries Limited a) Income :
- Lease Income 1,118 1,234
- Sale of Assets 49 6
b) Expenses :
- Project Expenses 22 47
c) Finance Lease Facility :
- Facility given during the year 13 199
- Repaid during year 155 327
- Outstanding facility 216 358
d) Asset :
- Balance Receivable 119 7
e) Liability :
- Balance Payable - 248
29 Tata Lockheed Martin Aerostructures Limited a) Income :
- Lease Income 1 1
b) Finance Lease Facility :
- Facility given during the year - -
- Repaid during year 2 9
- Interest Receivable* 0 0
- Outstanding facility 4 6
30 Tata Teleservices Limited a) Income :
- Lease Income 748 277
b) Expenses :
- Communication Expenses 111 31
- Rent Expenses 25 4
c) Finance Lease Facility :
- Facility given during the year 145 1,235
- Repaid during year 854 555
- Outstanding facility 625 1,333
d) Asset :
- Security Deposit Premises 8 8
- Advances paid to vendors towards lease facility - 37
- Balance receivable - 1
e) Liability :
- Balance payable 43 -
31 Tata Teleservices (Maharashtra) Limited a) Income :
- Lease Income 71 2
b) Expenses :
- Communication Expenses 277 101
c) Liability :
- Balance payable 10 -
32 MMP Mobi Wallet Payment Systems Limited a) Income :
- Lease Income 4 -
b) Asset :
- Balance receivable - -
33 Ardent Properties Private Limited a) Income :
- Commission received - 8
b) Asset :
- Balance receivable - 10
34 Inshaallah Investments Limited a) Income :
- Reimbursement of expenses* 0 -
b) Asset :
- Balance receivable* 0 -
35 Sector 113 Gatevida Developers Private Limited a) Income :
- Commission received 8 -
36 Key Management Personnel Expenses : Interest on Non – convertible debentures 2 2
Liability : Outstanding Debentures 20 20
119
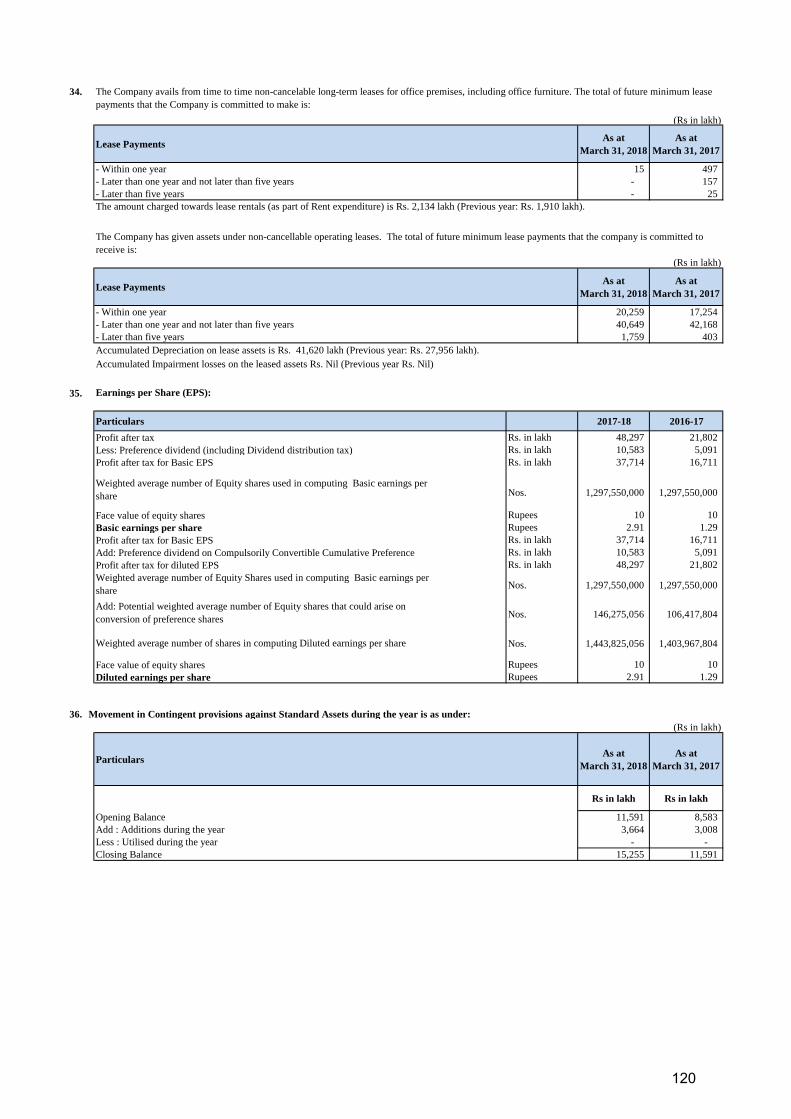
34.
(Rs in lakh)
Lease PaymentsAs at
March 31, 2018
As at
March 31, 2017
- Within one year 15 497
- Later than one year and not later than five years - 157
- Later than five years - 25
(Rs in lakh)
Lease PaymentsAs at
March 31, 2018
As at
March 31, 2017
- Within one year 20,259 17,254
- Later than one year and not later than five years 40,649 42,168
- Later than five years 1,759 403
35. Earnings per Share (EPS):
Particulars 2017-18 2016-17
Rs. in lakh 48,297 21,802
Rs. in lakh 10,583 5,091
Rs. in lakh 37,714 16,711
Nos. 1,297,550,000 1,297,550,000
Rupees 10 10
Rupees 2.91 1.29
Rs. in lakh 37,714 16,711
Rs. in lakh 10,583 5,091
Rs. in lakh 48,297 21,802
Nos. 1,297,550,000 1,297,550,000
Nos. 146,275,056 106,417,804
Nos. 1,443,825,056 1,403,967,804
Rupees 10 10
Rupees 2.91 1.29
36. Movement in Contingent provisions against Standard Assets during the year is as under:
(Rs in lakh)
ParticularsAs at
March 31, 2018
As at
March 31, 2017
Rs in lakh Rs in lakh
Opening Balance 11,591 8,583
Add : Additions during the year 3,664 3,008
Less : Utilised during the year - -
Closing Balance 15,255 11,591
Diluted earnings per share
Profit after tax for diluted EPS
Weighted average number of Equity Shares used in computing Basic earnings per
share
Add: Potential weighted average number of Equity shares that could arise on
conversion of preference shares
Weighted average number of shares in computing Diluted earnings per share
Face value of equity shares
The Company avails from time to time non-cancelable long-term leases for office premises, including office furniture. The total of future minimum lease
payments that the Company is committed to make is:
Profit after tax for Basic EPS
Weighted average number of Equity shares used in computing Basic earnings per
share
Face value of equity shares
Basic earnings per share
Add: Preference dividend on Compulsorily Convertible Cumulative Preference
The amount charged towards lease rentals (as part of Rent expenditure) is Rs. 2,134 lakh (Previous year: Rs. 1,910 lakh).
The Company has given assets under non-cancellable operating leases. The total of future minimum lease payments that the company is committed to
receive is:
Accumulated Depreciation on lease assets is Rs. 41,620 lakh (Previous year: Rs. 27,956 lakh).
Accumulated Impairment losses on the leased assets Rs. Nil (Previous year Rs. Nil)
Profit after tax
Less: Preference dividend (including Dividend distribution tax)
Profit after tax for Basic EPS
120

37. Segment Reporting
(Rs in lakh)
Particulars
For the Year
Ended March
31, 2018
For the Year
Ended March
31, 2017
I Segment Revenue
a) Financing Activity 420,730 384,660
b) Investment Activity 249 5,548
c) Others 34,251 28,996
Total 455,230 419,204
Less : Inter Segment Revenue - -
Add : Interest on Income Tax Refund 307 -
Total Income 455,537 419,204
II Segment Results
a) Financing Activity 82,436 36,167
b) Investment Activity 1,344 4,755
c) Others 4,253 5,084
Total 88,033 46,006
Less : Unallocated Corporate Expenses 13,853 12,759
Profit before taxation 74,180 33,247
Less : Provision for taxation 25,922 11,649
Profit after taxation 48,258 21,598
III Segment Assets
a) Financing Activity 3,745,609 3,267,819
b) Investment Activity 31,191 26,662
c) Others 88,782 84,118
d) Unallocated 63,110 71,954
Total 3,928,692 3,450,553
IV Segment Liabilities
a) Financing Activity 3,323,089 2,948,168
b) Investment Activity - -
c) Others 90,868 81,377
d) Unallocated 18,017 14,059
Total 3,431,974 3,043,604
V Capital Expenditure (Including Capital Work-In-Progress)
a) Financing Activity - -
b) Investment Activity - -
c) Others 27,391 28,479
d) Unallocated 3,444 3,977
Total 30,835 32,456
VI Depreciation and Amortisation
a) Financing Activity 647 560
b) Investment Activity - -
c) Others 21,292 12,523
d) Unallocated 1,698 1,190
Total 23,637 14,273
VII Significant Non-Cash Expenses Other than Depreciation and Amortisation
a) Financing Activity 33,079 61,177
b) Investment Activity (1,023) (455)
c) Others 230 -
Total 32,286 60,722
In accordance with Accounting Standard 17 on Segment Reporting, the Company has identified three business segments i.e. Financing Activity,
Investment Activity and Others, and one Geographical Segment viz. India, as secondary segment
121
38.
39.
40.
41.
42.
43.
In the previous year ended March 31,2017, the Company had provided/written off certain amounts comprising carrying value of investments acquired in
settlement of claim, Goodwill, loans and credit substitutes and investment in the Statement of Profit and Loss.
The Shareholders of the Company at its meeting held on June 24, 2016 approved a Reduction of Share Capital (Securities Premium Account) in
accordance with Section 52 of the Companies Act, 2013 read with Sections 100 to 103 of the Companies Act, 1956. The Hon’ble High Court of
Judicature at Bombay approved the said arrangement by way of order dated August 5, 2016 which was filed with the Registrar of Companies on August
26, 2016. Pursuant to the order, the Company had credited its Statement of Profit and Loss for the financial year ended March 31, 2017 by appropriating
an amount of Rs 40,558 lakh being the aggregate amount of (i) investments acquired in settlement of claim written off Rs. 14,318 lakh, (ii) goodwill
written off Rs. 7,804 lakh, (iii) loans and credit substitutes provided Rs. 31,789 lakh and (iv) mark to market loss on current investment provided Rs. 349
lakh (net of taxes as applicable) from the amount standing to the credit of Securities Premium Account.
The aforementioned disclosure is made by the Company pursuant to the Institute of Chartered Accountant of India's guidance on disclosures relating to
court order.
During the previous year, the Company changed its accounting policy with respect to amortisation of deferred revenue expenditure for share issue
expenses. The Company now charges off the share issue expenses against amount standing to the credit of the Securities Premium Account. Prior to this
change, the Company amortised the said share issue expenses over a period of 36 months from the month in which the expenses were incurred. The
change in accounting policy is in accordance with the provisions of Section 52 of the Companies Act 2013, and it would result in a more appropriate
presentation of financial statements of the Company.
On account of the change in the accounting policy, the profit before tax was higher by Rs. 76 lakh (net of taxes, as applicable) for the period year ended
March 31, 2017 and deferred revenue expenditure was lower by Rs. 77 lakh (net of taxes, as applicable) as on March 31, 2017.
To comply with the RBI Master Direction DNBR - PD 008/03.10.119/2016-17 - RBI/DNBR/2016-17/45 dated September 01, 2016, the company has
made an incremental standard asset provision of Rs. 1,531 lakh being 0.05% (CY 17-18 0.40%, PY 16-17 0.35%) of Standard Assets as of March 31,
2017.
Investments in bonds, debentures and other financial instruments which, in substance, form a part of the Company’s financing activities ("Credit
Substitutes") have been classified under Loans and Advances – Financing Activity (Note 15). In the past these were classified as a part of Investments
(Note 13). Management believes that the current period’s classification results in a better presentation of the substance of these receivables and is in
alignment with regulatory filings.
During the period ended March 31, 2018, the Company has changed its NPA provisioning policy based on the RBI Master Direction DNBR - PD
008/03.10.119/2016-17 - RBI/DNBR/2016-17/45 dated September 01, 2016 pursuant to which loans outstanding for a period exceeding 90 days are
classified as sub-standard assets and sub-standard assets for a period exceeding 12 months are classified as doubtful assets. The debit to the Statement of
Profit and Loss on account of the change is Rs. 1,358 lakh and Rs. 868 lakh respectively.
During the corresponding period ended March 31, 2017, the Company had changed its NPA provisioning policy based on the above circular, pursuant to
which loans outstanding for a period exceeding 120 days were classified as sub-standard assets and sub-standard assets for a period exceeding 14 months
were classified as doubtful assets. The debit to the Statement of Profit and Loss on account of the change was Rs. 2,801 lakh and Rs.2,312 lakh
respectively.
During the year ended March 31, 2018, the Company has re-assessed the useful life of its leased assets and has changed the life of the assets given on
operating lease. As a result of the change in the useful life of the asset, depreciation for year ended March 31, 2018 is higher by Rs. 8,145 lakh.
122

44.
45.
Schedule Schedule Schedule Schedule
Provision for
doubtful loans and
credit substitutes
Non-current
liabilities
Long-term
provisions
Non-Current
assets
Long-term
Loans and
advances -
financing
activity
30,361 Loans and advances and related
provisions are presented on Gross
basis in line with the requirements
of the Master Direction - Non
Banking Financial Company-
Systemically Important Non-
Deposit taking Company
Directions, 2016 ("the RBI
Directions")
Provision for
restructured standard
assets
Non-current
liabilities
Long-term
provisions
Non-Current
assets
Long-term
Loans and
advances -
financing
activity
70 Loans and advances and related
provisions are presented on Gross
basis in line with the requirements
of the Master Direction - Non
Banking Financial Company-
Systemically Important Non-
Deposit taking Company
Directions, 2016 ("the RBI
Directions")
Leave encashment
Current & Non-
Current
classification
Non-current
liabilities
Long-term
provisions
Current liabilities Short-term
provisions
733 Short-term and Long-term Leave
encashment has been presented in
accordance with the report of the
Actuary and as per requirements
of Schedule III of the Companies
Act, 2013.
Certain receivables
netted off in trade
payables reclassified
Other current
assets
Other current
assets
Current liabilities Trade
payables
174 Certain recievables is reclassified
to Other current assets instead of
netting off from trade payables for
better disclosure.
Accrued employee
benefit expense
Current
liabilities
Other current
liabilities
Current liabilities Trade
payables
4,321 Bonus accrual for employees has
been presented as a part of Other
Current Liabilities instead of
Trade payables in accordance with
the requirement of Schedule III of
the Companies Act, 2013.
Trade receivables
regrouped from
loans and advances
Current assets Trade
receivables
Current assets Short-term
Loans and
advances -
financing
activity
65 An item is shown as trade
receivables instead of loans and
advances.
Provision for
doubtful loans and
credit substitutes
Current
liabilities
Short-term
provisions
Current assets Short-term
Loans and
advances -
financing
activity
90,861 Loans and advances and related
provisions are presented on Gross
basis in line with the requirements
of the Master Direction - Non
Banking Financial Company-
Systemically Important Non-
Deposit taking Company
Directions, 2016 ("the RBI
Directions")
Provision for
restructured standard
assets
Current
liabilities
Short-term
provisions
Current assets Short-term
Loans and
advances -
financing
activity
41 Loans and advances and related
provisions are presented on Gross
basis in line with the requirements
of the Master Direction - Non
Banking Financial Company-
Systemically Important Non-
Deposit taking Company
Directions, 2016 ("the RBI
Directions")
Gratuity Asset
Reclass to Non-
current
Non-Current
assets
Other non-
current assets
Current assets Other
current
assets
239 Gratuity is shown as non-current
asset as per the acturial report and
is appropriately reclassed as per
Schedule III.
Previous year's figures have been regrouped / reclassified wherever necessary to correspond with the current year's classification / disclosure.
The figures for the year ended March 31, 2017 were audited by previous statutory auditors.
31-Mar-18 31-Mar-17 Amount
(Rs. in Lakh)Reason Description
123

Schedule Schedule Schedule Schedule
Receivable-
Assignment of Loan
Current assets Other current
assets
Current assets Short-term
Loans and
advances -
others
810 Reclassed to Assets held for sale
for better presentation
Provision-
Receivable-
Assignment of Loan
Current assets Other current
assets
Current assets Short-term
Loans and
advances -
others
263 Reclassed to Assets held for sale
for better presentation
Advertisement
income
Income Other income Income Revenue
from
operations
567 Income earned from
advertisements is shown as Other
income which helps in better
disclosure.
In terms of our report attached For and on behalf of the Board of Directors
For B S R & Co. LLP Mukund S. Dharmadhikari Anuradha E. Thakur F.N. Subedar
Chartered Accountants (Director) (Director) (Director)
Firms Registration No – (DIN No. : 05003224) (DIN No. : 06702919) (DIN No. : 00028428)
101248W/W-100022
Manoj Kumar Vijai M. D. Mallya Rajiv Sabharwal Kusal Roy
Partner (Director) (Director) (Managing Director)
Membership No: 046882 (DIN No. : 01804955) (DIN No. : 00057333) (DIN No. : 02268654)
Puneet Sharma Avan Doomasia
(Chief Financial Officer) (Company Secretary)
Mumbai
Date : April 30, 2018
Description31-Mar-18 31-Mar-17 Amount
(Rs. in Lakh)Reason
124

Standalone Financial
Statements
Independent Auditor’s Report
To the Members of
Tata Capital Financial Services Limited
Report on the Standalone Financial Statements
We have audited the accompanying standalone financial statements of Tata Capital Financial
Services Limited (the ‘Company’), which comprise the Balance Sheet as at 31 March 2018, the
Statement of Profit and Loss, the Cash Flow Statement for the year then ended, and a summary of
the significant accounting policies and other explanatory information.
Management’s Responsibility for the Standalone Financial Statements
The Company’s Board of Directors is responsible for the matters stated in Section 134 (5) of the
Companies Act, 2013 (the ‘Act’) with respect to the preparation of these standalone financial
statements that give a true and fair view of the financial position, financial performance and cash
flows of the Company in accordance with the accounting principles generally accepted in India,
including the Accounting Standards specified under Section 133 of the Act, read with Rule 7 of the
Companies (Accounts) Rules, 2014.
This responsibility also includes maintenance of adequate accounting records in accordance with the
provisions of the Act for safeguarding the assets of the Company and for preventing and detecting
frauds and other irregularities; selection and application of appropriate accounting policies; making
judgments and estimates that are reasonable and prudent; and design, implementation and
maintenance of adequate internal financial controls, that were operating effectively for ensuring the
accuracy and completeness of the accounting records, relevant to the preparation and presentation of
the standalone financial statements that give a true and fair view and are free from material
misstatement, whether due to fraud or error.
In preparing the standalone financial statements, management is responsible for assessing the
Company’s ability to continue as a going concern, disclosing, as applicable, matters related to going
concern and using the going concern basis of accounting unless management either intends to
liquidate the Company or to cease operations, or has no realistic alternative but to do so.
Auditor’s Responsibility
Our responsibility is to express an opinion on these standalone financial statements based on our
audit.
We have taken into account the provisions of the Act, the accounting and auditing standards and
matters which are required to be included in the audit report under the provisions of the Act and the
Rules made thereunder.
We conducted our audit of the standalone financial statements in accordance with the Standards on
Auditing specified under Section 143(10) of the Act. Those Standards require that we comply with
ethical requirements, and plan and perform the audit to obtain reasonable assurance about whether
the standalone financial statements are free from material misstatement.
125
Independent Auditor’s Report (Continued)
Tata Capital Financial Services Limited
Auditor’s Responsibility (Continued)
An audit involves performing procedures to obtain audit evidence about the amounts and the
disclosures in the standalone financial statements. The procedures selected depend on the auditor’s
judgment, including the assessment of the risks of material misstatement of the standalone financial
statements, whether due to fraud or error. In making those risk assessments, the auditor considers
internal financial control relevant to the Company’s preparation of the standalone financial
statements that give a true and fair view in order to design audit procedures that are appropriate in
the circumstances. An audit also includes evaluating the appropriateness of the accounting policies
used and the reasonableness of the accounting estimates made by the Company’s Directors, as well
as evaluating the overall presentation of the standalone financial statements.
We are also responsible to conclude on the appropriateness of management’s use of the going
concern basis of accounting and, based on the audit evidence obtained, whether a material
uncertainty exists related to events or conditions that may cast significant doubt on the entity’s ability
to continue as a going concern. If we conclude that a material uncertainty exists, we are required to
draw attention in the auditor’s report to the related disclosures in the standalone financial statements
or, if such disclosures are inadequate, to modify the opinion. Our conclusions are based on the audit
evidence obtained up to the date of the auditor’s report. However, future events or conditions may
cause an entity to cease to continue as a going concern.
We believe that the audit evidence we have obtained is sufficient and appropriate to provide a basis
for our audit opinion on the standalone financial statements.
Opinion
In our opinion and to the best of our information and according to the explanations given to us, the
aforesaid standalone financial statements give the information required by the Act in the manner so
required and give a true and fair view in conformity with the accounting principles generally accepted
in India, of the state of affairs of the Company as at 31 March 2018 and its profit and its cash flows
for the year ended on that date.
Other matter
The comparative financial information of the Company for the year ended 31 March 2017 as
included in these standalone financial statements have been audited by the predecessor auditor
who had audited the standalone financial statements for the year ended 31 March 2017. The report
of the predecessor auditor on the comparative standalone financial information dated 28 April
2017 expressed an unmodified opinion. Our opinion is not modified in respect of this matter.
Report on Other Legal and Regulatory Requirements
As required by the Companies (Auditor’s Report) Order, 2016 (the ‘Order’), issued by the Central
Government in terms of sub-section (11) of section 143 of the Act, we give in the ‘Annexure A’, a
statement on the matters specified in paragraphs 3 and 4 of the Order.
126
Independent Auditor’s Report (Continued)
Tata Capital Financial Services Limited
Report on Other Legal and Regulatory Requirements (Continued)
As required by Section 143 (3) of the Act, we report that:
(a) we have sought and obtained all the information and explanations which to the best of our
knowledge and belief were necessary for the purposes of our audit;
(b) in our opinion, proper books of account as required by law have been kept by the Company so
far as it appears from our examination of those books;
(c) the Balance Sheet, the Statement of Profit and Loss and the Cash Flow Statement dealt with
by this Report are in agreement with the books of account;
(d) in our opinion, the aforesaid standalone financial statements comply with the Accounting
Standards specified under Section 133 of the Act;
(e) on the basis of the written representations received from the directors as on 31 March 2018
taken on record by the Board of Directors, none of the directors is disqualified as on 31 March
2018 from being appointed as a director in terms of Section 164 (2) of the Act;
(f) with respect to the adequacy of the internal financial controls with reference to the standalone
financial statements of the Company and the operating effectiveness of such controls, refer to
our separate Report in ‘Annexure B’; and
(g) with respect to the other matters to be included in the Auditor’s Report in accordance with
Rule 11 of the Companies (Audit and Auditor) Rules, 2014, in our opinion and to the best of
our information and according to the explanations given to us:
i. The Company has no impact of pending litigations on its financial position in its
standalone financial statements;
ii. the Company has made provision, as required under the applicable law or accounting
standards, for material foreseeable losses, on long-term contracts including derivatives
contracts – Refer Note 50 (v) to the standalone financial statements;
iii. there were no amounts which were required to be transferred to the Investor Education
and Protection Fund by the Company; and
iv. The disclosures in the standalone financial statements regarding holdings as well as
dealings in specified bank notes during the period from 8 November 2016 to 30
December 2016 have not been made since they do not pertain to the financial year ended
31 March 2018. However, amounts as appearing in the audited standalone financial
statements for the year ended 31 March 2017 have been disclosed.
For B S R & Co. LLP
Chartered Accountants
Firm's Registration No: 101248W/W-100022
Manoj Kumar Vijai
Mumbai Partner
30 April 2018 Membership No: 046882
127

Tata Capital Financial Services Limited
Annexure A to the Independent Auditor’s Report of even date on the standalone financial statements
(i) a. The Company has maintained proper records showing full particulars, including
quantitative details and situation of fixed assets.
b. The Company has a program of verification to cover Fixed Assets given on
operating lease on an annual basis and all other items of fixed assets once in three
years which, in our opinion, is reasonable having regard to the size of the Company
and the nature of its assets. Pursuant to the program, all the fixed assets were
physically verified by management as at 31 March 2017. According to the
information and explanation given to us, no material discrepancies were noticed on
such verification.
c. According the information and explanations given to us and on the basis of our
examination of the records of the Company, the title deeds of the immovable
properties included in fixed assets are held in the name of the Company.
(ii) The Company is in the business of providing financial services and does not have any
inventories. Accordingly, the provision of clause 3(ii) of the Order is not applicable to the
Company.
(iii) According to the information and explanations given to us, the Company has not granted
any loans, secured or unsecured to companies, firms, Limited Liability Partnerships or other
parties covered in the register maintained under section 189 of the Companies Act, 2013 (the
‘Act’). Accordingly, the provision of clause 3(iii) of the Order is not applicable to the
Company.
(iv) According to the information and explanations given to us, the Company has not granted
any loans, made investments or provided guarantees under section 185 and 186 of the Act.
Accordingly, the provision of clause 3(iv) of the Order is not applicable to the Company.
(v) According to the information and explanations given to us, the Company has not accepted
any deposits from the public to which the directives issued by the Reserve Bank of India and
the provisions of Section 73 to 76 or any other relevant provisions of the Act and the rules
framed thereunder apply. Accordingly, the provision of clause 3(v) of the Order is not
applicable to the Company.
(vi) The Central Government has not prescribed the maintenance of cost records under sub
section (1) of section 148 of the Act for any of the services rendered by the Company.
Accordingly, the provision of clause 3(vi) of the Order is not applicable to the Company.
(vii) a) According to the information and explanations given to us and on the basis of our
examination of records of the Company, amounts deducted / accrued in the books of
account in respect of undisputed statutory dues including provident fund, employees’
state insurance, income-tax, service tax, cess, goods and service tax and other material
statutory dues have generally been regularly deposited by the Company with the
appropriate authorities, except for two months, where a delay of one to five days in the
deposit of provident fund with the relevant authority was noted. As explained to us the
Company did not have any dues on account of sales tax, duty of customs, value added
tax or duty of excise.
According to the information and explanations given to us, no undisputed amounts
payable in respect of provident fund, employees’ state insurance, income tax, service
tax, cess, goods and service tax and other material statutory dues were in arrears as at 31
March 2018 for a period of more than six months from the date they became payable.
128

Tata Capital Financial Services Limited
Annexure A to the Independent Auditor’s Report of even date on the
standalone financial statements (Continued)
b) According to the information and explanations given to us, the Company did not
have any dues on account of value added tax, income tax, sales tax, service tax, duty
of customs or duty of excise which have not been deposited on account of dispute.
Details of dues of Value Added Tax as on 31 March 2018 on account of disputes are
given below
Particulars Period to which the
amount relate (Financial
Year)
Forum where dispute is
pending
Amount in Rupees
Value Added Tax 2012-13 Deputy Commissioner
(Commercial Taxes)
63,127
Value Added Tax 2012-13 Assessment Officer
(Commercial Taxes)
3,072,876
(viii) In our opinion and according to the information and explanations given to us, the Company
has not defaulted in the repayment of loans or borrowing to financial institutions, banks, or
debenture holders during the year. During the year, the Company did not have any loans or
borrowing from the Government.
(ix) In our opinion and according to the information and explanations given to us, the term loans
taken by the Company have been applied for the purpose for which they were raised. The
Company has not raised any money by way of initial public offer or further public offer
during the year.
(x) During the course of our examination of the books and records of the Company, carried out
in accordance with the generally accepted auditing practices in India, and according to the
explanation and information given to us, frauds of Rs. 9,881,000 on the Company by its
officers or employees has been noticed or reported during the course of our audit.
(xi) According to the information and explanations give to us and based on our examination of
the records of the Company, the Company has paid / provided for managerial remuneration
in accordance with the requisite approvals mandated by the provisions of section 197 read
with Schedule V to the Act.
(xii) In our opinion and according to the information and explanations given to us, the Company
is not a Nidhi company. Accordingly, the provision of clause 3(xii) of the Order is not
applicable.
(xiii) According to the information and explanations given to us and on the basis of our
examination of the records of the Company, transactions with the related parties are in
compliance with section 177 and 188 of the Act where applicable and the details have been
disclosed in the standalone financial statements, as required by the applicable accounting
standards.
(xiv) According to the information and explanations given to us and based on our examination of
the records of the Company, the Company has not made any preferential allotment or private
placement of shares or fully or partly convertible debentures during the year. Accordingly,
the provision of clause 3(xiv) of the Order is not applicable.
(xv) According to the information and explanations given to us and based on our examination of
the records, during the year the Company has not entered into any non-cash transactions with
directors or persons connected with him. Accordingly, the provision of clause 3(ii) of the
Order is not applicable.
129

Tata Capital Financial Services Limited
Annexure A to the Independent Auditor’s Report of even date on the
standalone financial statements (Continued)
(xvi) The Company is required to be registered under section 45-IA of the Reserve Bank of India
Act, 1934 and it has obtained certificate of registration dated 4 November 2011.
For B S R & Co. LLP
Chartered Accountants
Firm's Registration No: 101248W/W-100022
Manoj Kumar Vijai
Mumbai Partner
30 April 2018 Membership No: 046882
130

Tata Capital Financial Services Limited
Annexure B to the Independent Auditor’s Report of even date on the
standalone financial statements
Report on the Internal Financial Controls under Clause (i) of Sub-section 3 of Section
143 of the Companies Act, 2013 (“the Act”)
We have audited the internal financial controls over financial reporting of the Company as of
31 March 2018 in conjunction with our audit of the standalone financial statements of the
Company for the year ended on that date.
Management’s Responsibility for Internal Financial Controls
The Company’s management is responsible for establishing and maintaining internal financial
controls based on “the internal control over financial reporting criteria established by the Company
considering the essential components of internal control stated in the Guidance Note on Audit of
Internal Financial Controls over Financial Reporting (the ‘Guidance Note’) issued by the Institute
of Chartered Accountants of India” (the ‘ICAI’). These responsibilities include the design,
implementation and maintenance of adequate internal financial controls that were operating
effectively for ensuring the orderly and efficient conduct of its business, including adherence to
company’s policies, the safeguarding of its assets, the prevention and detection of frauds and
errors, the accuracy and completeness of the accounting records, and the timely preparation of
reliable financial information, as required under the Act.
Auditors’ responsibility
Our responsibility is to express an opinion on the Company's internal financial controls over
financial reporting based on our audit. We conducted our audit in accordance with the Guidance
Note and the Standards on Auditing, issued by the ICAI and deemed to be prescribed under section
143(10) of the Act, to the extent applicable to an audit of internal financial controls, both
applicable to an audit of Internal Financial Controls and, both issued by the ICAI. Those Standards
and the Guidance Note require that we comply with ethical requirements and plan and perform the
audit to obtain reasonable assurance about whether adequate internal financial controls over
financial reporting was established and maintained and if such controls operated effectively in all
material respects.
Our audit involves performing procedures to obtain audit evidence about the adequacy of the
internal financial controls system over financial reporting and their operating effectiveness. Our
audit of internal financial controls over financial reporting included obtaining an understanding of
internal financial controls over financial reporting, assessing the risk that a material weakness
exists, and testing and evaluating the design and operating effectiveness of internal control based
on the assessed risk. The procedures selected depend on the auditor’s judgment, including the
assessment of the risks of material misstatement of the standalone financial statements, whether
due to fraud or error.
We believe that the audit evidence we have obtained is sufficient and appropriate to provide a basis
for our audit opinion on the Company’s internal financial controls system over financial reporting.
131

Annexure – B to the Independent Auditor’s Report of even date on the
standalone financial statements of Tata Capital Financial Services
Limited (Continued)
Meaning of Internal Financial Controls over Financial Reporting
A company's internal financial control over financial reporting is a process designed to provide
reasonable assurance regarding the reliability of financial reporting and the preparation of financial
statements for external purposes in accordance with generally accepted accounting principles. A
company's internal financial control over financial reporting includes those policies and procedures
that (1) pertain to the maintenance of records that, in reasonable detail, accurately and fairly reflect
the transactions and dispositions of the assets of the company; (2) provide reasonable assurance
that transactions are recorded as necessary to permit preparation of standalone financial statements
in accordance with generally accepted accounting principles, and that receipts and expenditures of
the company are being made only in accordance with authorizations of management and directors
of the company; and (3) provide reasonable assurance regarding prevention or timely detection of
unauthorized acquisition, use, or disposition of the company's assets that could have a material
effect on the standalone financial statements.
Inherent Limitations of Internal Financial Controls over Financial Reporting
Because of the inherent limitations of internal financial controls over financial reporting, including
the possibility of collusion or improper management override of controls, material misstatements
due to error or fraud may occur and not be detected. Also, projections of any evaluation of the
internal financial controls over financial reporting to future periods are subject to the risk that the
internal financial control over financial reporting may become inadequate because of changes in
conditions, or that the degree of compliance with the policies or procedures may deteriorate.
Opinion
In our opinion, the Company has, in all material respects, an adequate internal financial controls
system over financial reporting and such internal financial controls over financial reporting were
operating effectively as at 31 March 2018, based on the internal control over financial reporting
criteria established by the Company considering the essential components of internal control stated
in the Guidance Note issued by the ICAI.
For B S R & Co. LLP
Chartered Accountants
Firm’s Registration No: 101248W/W-100022
Manoj Kumar Vijai
Mumbai Partner
30 April 2018 Membership No: 046882
132

Note
No.
As at
March 31,
2018
As at
March 31,
2017
Rs in lakh Rs in lakh
I. EQUITY AND LIABILITIES
1. Shareholders' funds
(a) Share Capital 3 281,755 224,255
(b) Reserves and Surplus 4 214,383 182,153
496,138 406,408
2. Non-current liabilities
(a) Long-term borrowings 5 1,286,761 945,684
(b) Other long-term liabilities 6 841 7,019
(c) Long-term provisions 7 25,795 36,482
1,313,397 989,185
3. Current liabilities
(a) Short-term borrowings 8 1,293,081 1,006,630
(b) Trade payables 9
(i) Total outstanding dues of micro enterprises and small enterprises 9(a) - -
(ii) Total outstanding dues of creditors other than micro enterprises and small enterprises 52,497 44,538
(c) Other current liabilities 10 682,314 897,201
(d) Short-term provisions 11 90,685 106,050
2,118,577 2,054,419
3,928,112 3,450,012
II. ASSETS
1. Non-Current assets
(a) Property, plant and equipment 12
(i) Tangible assets 69,000 77,052
(ii) Intangible assets 2,314 1,109
(iii) Capital work-in-progress 101 518
(iv) Intangible assets under development 39 655
71,454 79,334
(b) Non-current investments 13 30,600 26,109
(c) Deferred tax assets (net) 14 37,568 43,483
(d) Long-term Loans and advances - financing activity 15 1,712,458 1,515,844
(e) Long-term Loans and advances - others 16 31,226 21,511
(f) Other non-current assets 17 7,436 7,078
1,819,288 1,614,025
2. Current assets
(a) Current investments 13 170 794
(b) Trade receivables 18 6,246 2,049
(c) Cash and bank balances 19 12,534 7,340
(d) Short-term Loans and advances - financing activity 15 1,978,866 1,704,903
(e) Short-term Loans and advances - others 20 23,953 26,603
(f) Other current assets 21 15,601 14,964
2,037,370 1,756,653
3,928,112 3,450,012
2
See accompanying notes forming part of the financial statements 1-52
In terms of our report of even date For and on behalf of the Board of Directors
For B S R & Co. LLP Mukund S. Dharmadhikari Anuradha E. Thakur F.N. Subedar
Chartered Accountants (Director) (Director) (Director)
Firms Registration No – 101248W/W-100022 (DIN No. : 05003224) (DIN No. : 06702919) (DIN No. : 00028428)
Manoj Kumar Vijai M. D. Mallya Rajiv Sabharwal Kusal Roy
Partner (Director) (Director) (Managing Director)
Membership No: 046882 (DIN No. : 01804955) (DIN No. : 00057333) (DIN No. : 02268654)
Place: Mumbai Puneet Sharma Avan Doomasia
(Chief Financial Officer) (Company Secretary)
Summary of significant accounting policies
Date : April 30, 2018
TATA CAPITAL FINANCIAL SERVICES LIMITED
BALANCE SHEET AS AT MARCH 31, 2018
Particulars
TOTAL
TOTAL
133

Note
No.
For the Year Ended
March 31, 2018
For the Year Ended
March 31, 2017
F
o
r
t
Rs in lakh Rs in lakh R
s
I Revenue from operations 22 420,701 384,660
II Investment income 23 249 5,548
III Other income 24 34,587 28,996
IV Total Revenue (I + II + III) 455,537 419,204
V Expenses :
Finance costs 25 223,074 221,162
Employee benefit expenses 26 39,721 35,258
Other operating expenses 27 94,327 114,715
Depreciation and amortisation 12 23,637 14,273
Amortisation of expenses 21(a) 598 549
Total expenses 381,357 385,957
VI Profit before tax (IV - V) 74,180 33,247
VII Tax expense
(1) Current tax 20,007 19,618
(2) Deferred tax 5,915 (7,969)
Net tax expense 25,922 11,649
VIII Profit for the year ( VI - VII) 48,258 21,598
IX Earnings per equity share:
(1) Basic (in Rupees) 2.90 1.27
(2) Diluted (in Rupees) 2.90 1.27
Face Value per share (in Rupees) 10 10
Summary of significant accounting policies 2
See accompanying notes forming part of the financial statements 1-52
In terms of our report of even date For and on behalf of the Board of Directors
For B S R & Co. LLP Mukund S. Dharmadhikari Anuradha E. Thakur F.N. Subedar
Chartered Accountants (Director) (Director) (Director)
Firms Registration No – 101248W/W-100022 (DIN No. : 05003224) (DIN No. : 06702919) (DIN No. : 00028428)
Manoj Kumar Vijai M. D. Mallya Rajiv Sabharwal Kusal Roy
Partner (Director) (Director) (Managing Director)
Membership No: 046882 (DIN No. : 01804955) (DIN No. : 00057333) (DIN No. : 02268654)
Place: Mumbai Puneet Sharma Avan Doomasia
Date : April 30, 2018 (Chief Financial Officer) (Company Secretary)
TATA CAPITAL FINANCIAL SERVICES LIMITED
STATEMENT OF PROFIT AND LOSS FOR THE YEAR ENDED MARCH 31, 2018
Particulars
134

Note
No.
For the Year Ended
March 31, 2018
For the Year Ended
March 31, 2017
Rs in lakh Rs in lakh
1 CASH FLOW USED IN OPERATING ACTIVITIES
Profit before tax 74,180 33,247
Adjustments for :
Amortisation of share/debenture issue expenses/loan processing expenses 598 549
Depreciation and amortisation 23,637 14,273
Loss/(profit) on sale of fixed assets (net) (1,059) 3,288
Interest expenses 180,425 172,902
Discounting charges on commercial paper 42,201 46,723
Discounting charges on Collateralised Borrowings and Lending Obligations (CBLO) - 1,130
Discounting charges on debentures 448 407
Interest income (383,858) (352,966)
Income from investments (249) (5,548)
Interest income on fixed deposits (30) -
Loss on sale of Non-current Investments - 1,248
Loss on sale of Current Investments (Net) 60 -
Amortisation of premium of forward foreign exchange cover 128 -
Provision for leave encashment 79 257
Reversal of provision for diminution in value of investments (net) 954 (72)
Provision against trade receivables 230 -
Contingent provision against standard assets 3,664 3,008
Reversal of contingent provision against restructured advances (net) (1,409) (827)
Provision against assets held for sale 1,405 1,378
Provision for doubtful loans (net) 26,844 56,686
(31,752) (24,317)
Adjustments for :
Increase in trade receivables (2,587) (578)
Increase in Loans and advances - financing activity (523,552) (388,089)
Increase in Loans and advances - others (8,775) (5,932)
Increase in other liabilities and provisions 18,443 20,065
(548,223) (398,851)
Interest paid (231,553) (210,790)
Interest received 384,342 351,686
Dividend received 249 137
Cash used in operations (395,185) (257,819)
Taxes paid (18,915) (17,868)
NET CASH USED IN OPERATING ACTIVITIES (414,100) (275,686)
2 CASH FLOW FROM INVESTING ACTIVITIES
(30,835) (32,456)
7,302 2,023
Purchase of long-term investments (4,334) (1,075)
Purchase of mutual fund units (389,500) (1,714,480)
Proceeds from redemption of mutual fund units 389,572 1,713,989
Proceeds from sale of long-term investments 404 57,115
Fixed deposits with banks having maturity over 3 months (4,404) -
NET CASH (USED IN) / FROM INVESTING ACTIVITIES (31,795) 25,116
3 CASH FLOW FROM FINANCING ACTIVITIES
Issue of Compulsory Convertible Cumulative Preference share capital 57,500 78,500
Share issue / debenture issue / loan processing expenses (539) (984)
Interim dividend paid on equity and preference shares (including dividend distribution tax) (15,968) (12,119)
Proceeds from short-term borrowings with maturity period greater than three months 1,049,412 596,289
Repayment of short-term borrowings with maturity period greater than three months (722,347) (567,611)
Net proceeds from short- term borrowings with maturity period less than or equal to three months (39,955) 3,265
Proceeds from long-term borrowings 1,044,462 763,200
Repayment of long-term borrowings (925,880) (607,130)
NET CASH FROM FINANCING ACTIVITIES 446,685 253,410
Proceeds from sale of fixed assets
TATA CAPITAL FINANCIAL SERVICES LIMITED
CASH FLOW STATEMENT FOR THE YEAR ENDED MARCH 31, 2018
Particulars
Operating Loss before working capital changes and adjustments for interest received, interest paid and
dividend received
Cash used in operations before adjustments for interest received, interest paid and dividend received
Purchase of fixed assets (including capital advances)
135
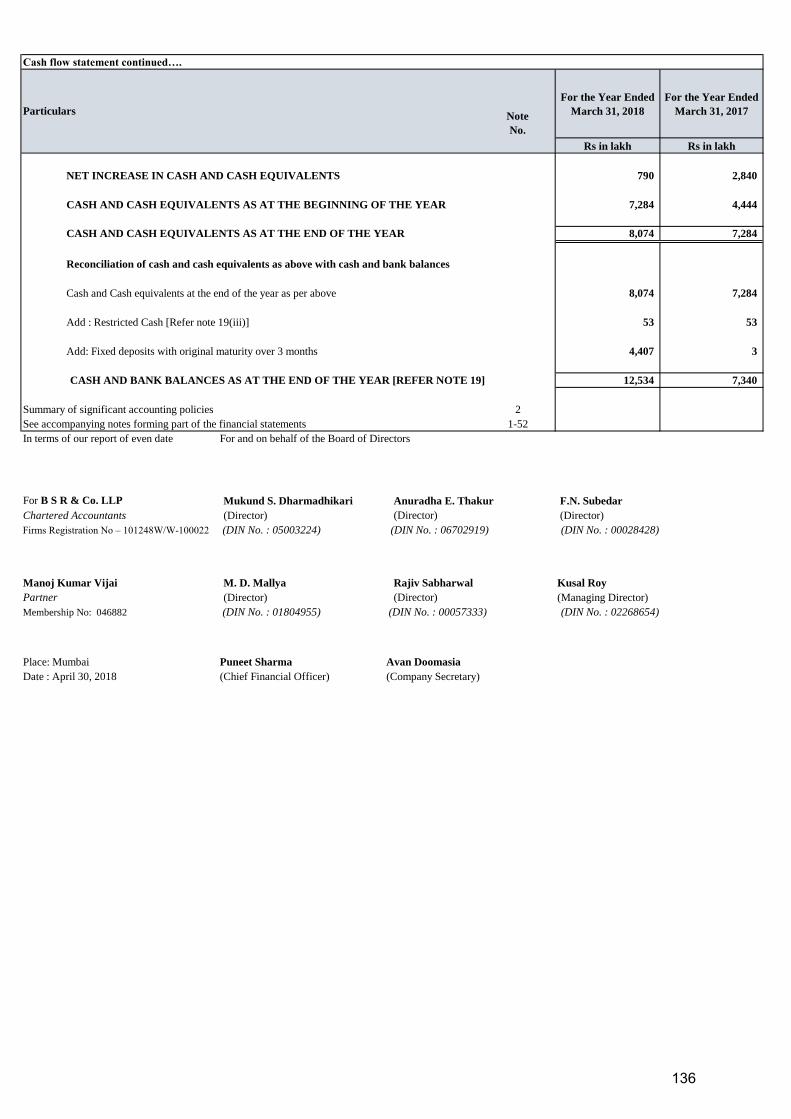
Cash flow statement continued….
Note
No.
For the Year Ended
March 31, 2018
For the Year Ended
March 31, 2017
Rs in lakh Rs in lakh
NET INCREASE IN CASH AND CASH EQUIVALENTS 790 2,840
CASH AND CASH EQUIVALENTS AS AT THE BEGINNING OF THE YEAR 7,284 4,444
CASH AND CASH EQUIVALENTS AS AT THE END OF THE YEAR 8,074 7,284
Reconciliation of cash and cash equivalents as above with cash and bank balances
Cash and Cash equivalents at the end of the year as per above 8,074 7,284
Add : Restricted Cash [Refer note 19(iii)] 53 53
Add: Fixed deposits with original maturity over 3 months 4,407 3
CASH AND BANK BALANCES AS AT THE END OF THE YEAR [REFER NOTE 19] 12,534 7,340
2
See accompanying notes forming part of the financial statements 1-52
In terms of our report of even date For and on behalf of the Board of Directors
For B S R & Co. LLP Mukund S. Dharmadhikari Anuradha E. Thakur F.N. Subedar
Chartered Accountants (Director) (Director) (Director)
Firms Registration No – 101248W/W-100022 (DIN No. : 05003224) (DIN No. : 06702919) (DIN No. : 00028428)
Manoj Kumar Vijai M. D. Mallya Rajiv Sabharwal Kusal Roy
Partner (Director) (Director) (Managing Director)
Membership No: 046882 (DIN No. : 01804955) (DIN No. : 00057333) (DIN No. : 02268654)
Puneet Sharma Avan Doomasia
Date : April 30, 2018 (Chief Financial Officer) (Company Secretary)
Particulars
Summary of significant accounting policies
Place: Mumbai
136

TATA CAPITAL FINANCIAL SERVICES LIMITED
NOTES FORMING PART OF THE FINANCIAL STATEMENTS
1. CORPORATE INFORMATION
2. SIGNIFICANT ACCOUNTING POLICIES
i. Basis for preparation of accounts
ii. Use of Estimates
iii. Revenue recognition
a. Income on Loan transactions
b. Income from Non-current and Current Investments
c. Income from Services
d. Income from distribution of financial products
Sourcing income is recognised on accrual basis when there is a reasonable certainty of its ultimate realisation.
Premium / Discount on investments, which is the difference between the acquisition cost and face value of debt instrument is
recognised as interest income over the tenor of the instruments.
Redemption premium on investments (except on preference shares) is recognised as income over the tenor of the investment.
Fees for financial advisory services are accounted based on stage of completion of assignments, when there is reasonable
certainty of its ultimate realisation.
Revenue from brokerage is recognised when the service is performed. Trail brokerage is recognised at the end of the
measurement period when the pre-defined thresholds are met. Revenue is net of taxes and sub-brokerage.
Upfront / processing fees collected from the customer for processing loans are primarily towards documentation charges. These
are accounted as income when the amount becomes due provided recovery thereof is reasonably certain.
Dealer subvention income and service charges are collected at the time of inception of the contract. These are accounted over
the tenure of the loan in the proportion of interest earned to total interest receivable during the tenure of loans.
Income from dividend on shares of corporate bodies and units of mutual funds is accounted on accrual basis when the
Company’s right to receive dividend is established.
Interest income on bonds and debentures is recognised on a time proportion basis taking into account the amount outstanding
and the rate applicable.
Tata Capital Financial Services Limited (the "Company") is a wholly owned subsidiary of Tata Capital Limited and a Systemically
Important Non Deposit Accepting Non-Banking Finance Company (“NBFC”), holding a Certificate of Registration from the Reserve
Bank of India (“RBI”) dated November 4, 2011.
The financial statements of the Company have been prepared in accordance with the Generally Accepted Accounting Principles in
India (“Indian GAAP”) to comply with the Accounting Standards specified under Section 133 of the Companies Act, 2013 and the
relevant provisions of the Companies Act 2013 (the "Act"), as applicable. Further, the Company follows the Reserve Bank of India
("RBI") Directions issued for Non-Banking Financial Companies ("NBFC"). The financial statements have been prepared on
accrual basis under the historical cost convention. The accounting policies adopted in the preparation of the financial statements are
consistent with those followed in the previous year.
Current assets do not include elements which are not expected to be realised within one year and current liabilities do not include
items which are due after one year.
The preparation of financial statements require the management of the Company to make estimates and assumptions that affect the
reported balances of assets and liabilities and disclosures relating to the contingent liabilities as at the date of the financial
statements and reported amounts of income and expenses for the reporting period. The management believes that the estimates used
in preparation of the financial statements are prudent and reasonable. Future results could differ from these estimates. Any revision
to accounting estimates is recognised prospectively in the current and future periods. Example of such estimates includes provision
for non - performing loans, provision for employee benefit plans and provision for income taxes.
Interest income is recognized on a time proportion basis taking into account the amount outstanding and the interest rate
applicable, except that no income is recognised on non-performing assets as per the prudential norms for income recognition
issued by the RBI for NBFCs. Interest income on such assets is recognised on receipt basis.
137

e. Lease income
iv. Provisions for Standard/Non-Performing Assets and Doubtful Debts
v. Investments
Investments are classified into non-current and current investments.
a. Non-current investments
b. Current investments
vi. Property, plant and equipment
a. Tangible:
b. Intangible:
Acquired intangible assets other than Goodwill are measured at cost less amortisation.
c. Capital work-in-progress:
d. Intangible assets under development:
The Company has adopted the provisions of para 46 / 46A of AS 11 (The Effects of Changes in Foreign Exchange Rates),
accordingly, exchange differences arising on restatement / settlement of long-term foreign currency borrowings relating to
acquisition of depreciable property, plant and equipment are adjusted to the cost of the respective assets and depreciated over
the remaining useful life of such assets
Goodwill is stated at cost. Goodwill comprises the portion of a purchase price for an acquisition that exceeds the market value
of the identifiable assets, with deductions for liabilities, calculated on the date of acquisition.
Expenses on software support and maintenance are charged to the Statement of Profit and Loss during the year in which such
costs are incurred.
Projects under which tangible fixed assets are not yet ready for their intended use are carried at cost, comprising direct cost,
related incidental expenses and attributable interest.
Expenditure on development eligible for capitalisation is carried as Intangible assets under development where such assets are
not yet ready for their intended use.
The Company provides an allowance for loan receivables and debentures/bonds in the nature of advance based on the prudential
norms issued by the Reserve Bank of India ('RBI') relating to income recognition, asset classification and provisioning for non-
performing assets. The provision for standard assets is made as per prudential norms prescribed by RBI, through master directions
or notifications as amended. In addition to the abovementioned provisioning norms as prescribed by RBI, the Company also fully
provides for/ writes off the entire receivables as per the Guidelines approved by the Board of Directors from time to time, where any
of the installments are overdue :
- for a period exceeding 27 months for loan against property
- for a period exceeding 11 months for construction equipments, auto and commercial vehicles
- for a period exceeding 10 months for two wheeler and personal loan and
- for a period exceeding 6 months for consumer durables
In addition, the Company provides for Restructured Assets (Standard Assets and Non-performing) as required by the directions
issued by the RBI from time to time.
Non-current investments are investments intended to be held for a period of more than a year. Non-current investments are
carried individually at cost less provision for diminution, other than temporary, in the value of such investments.
Current investments are investments intended to be held for a period of less than a year. Current investments are stated at the
lower of cost and market value, determined on an individual investment basis.
Tangible property, plant and equipment acquired by the Company are reported at acquisition cost, with deductions for
accumulated depreciation and impairment losses, if any.
The acquisition cost includes any cost attributable for bringing asset to its working condition, which comprises of purchase
consideration, other directly attributable costs of bringing the assets to their working condition for their intended use and
attributable interest.
Assets given on operating lease are capitalised at cost. Rentals received or receivable by the Company are recognised in the
Statement of Profit and Loss on a straight-line basis over the lease term, provided recovery is certain
Assets given under finance lease are recognised as a receivable at an amount equal to the net investment in the lease. Lease
rentals are apportioned between principal and interest on the internal rate of return. The principal amount received reduces the
net investment in the lease and interest is recognised as revenue.
138

vii. Depreciation and Amortisation
Estimated useful life considered by the Company are:
Asset Estimated Useful Life
Leasehold Improvements As per lease period As per lease period
Construction Equipment 2 to 13.5 years 15 years
Owned : 10 years
Leased : 3 to 7 years
Owned : 3 to 4 years
Leased: 2 to 4 years
Owned : 5 years
Leased : 3 to 5 years
Vehicles Owned : 4 years
Leased : 1 to 5 years
Owned : 1 to 10 years
Leased : 1 to 3 years
Buildings 25 years 60 years
Owned : 10 years
Leased : 2 to 15 years
Railway Wagons Leased : 6 years 15 years
Electrical Installation & Equipments Leased : 3 to 6 years 10 years
Networking Assets Leased : 2 to 4 years 6 years
viii. Leases
ix. Assets held for sale
x. Borrowing costs
xi. Loan sourcing costs
xii. Share issue expenses
Share issue expenses are adjusted against the Securities Premium Account as permissible under Section 52 of the Companies Act,
2013, to the extent any balance is available for utilisation in the Securities Premium Account. Share issue expenses in excess of the
balance in the Securities Premium Account are expensed in the Statement of Profit and Loss.
Sourcing costs are amortised over the average tenor of the loan which varies based on products financed.
Ancillary costs in the nature of loan processing charges and debenture issue expenses are amortised on straight line method over the
tenor of the loan/debenture from the month in which the Company has incurred the expenditure.
An asset is classified as held for sale if its carrying amount will be recovered or settled principally through a sale transaction rather
than through continuing use. Assets classified as held for sale are measured at the lower of carrying amount and fair value. In the
event an asset held for sale is acquired in settlement of an existing claim or existing asset, it is initially recorded in the books at its
fair value or value of the asset given up, whichever is better determined. Impairment losses on initial classification as held for sale
and losses on subsequent re-measurements are charged to the Statement of Profit and Loss. No depreciation is charged on assets
classified as held for sale.
Leases are classified as operating lease where significant portion of risks and reward of ownership of assets acquired under lease is
retained by the lessor. Leases of assets under which substantially all of the risks and rewards of ownership are effectively retained
by the lessee are classified as finance lease.
Plant & Machinery15 years
Computer Equipment3 years
Office Equipment5 years
6 years
Software Licenses10 Years
Depreciable amount for assets is the cost of an asset, or other amount substituted for cost, less its estimated residual value.
Depreciation on tangible fixed assets has been provided on the straight-line method as per the useful life prescribed in Schedule II to
the Companies Act, 2013 except in respect of Buildings, Computer Equipment networking assets, electrical installation and
equipments and Vehicles, in whose case the life of the assets has been assessed based on the nature of the asset, the estimated usage
of the asset, the operating conditions of the asset, past history of replacement, etc.
Purchased software / licenses are amortised over the period the benefits are expected to accrue, while Goodwill is tested for
impairment at each Balance Sheet date. An impairment loss is recognised if the carrying amount of Goodwill exceeds its
recoverable amount.
All capital assets with individual value less than Rs 5,000 are depreciated fully in the year in which they are purchased.
As per Schedule II
Furniture and Fixtures10 years
139

xiii. Employee Benefits
xiv. Provisions, Contingent Liabilities and Contingent Assets
xv. Impairment of Assets
At each Balance Sheet date, the Company reviews, whether there is any indication of impairment of an asset. If any such condition
exists, the recoverable amount of the asset is estimated in order to determine the extent of impairment loss (if any).
Recoverable amount of the asset is the higher of an asset’s net selling price and value in use. In assessing the value in use, the
estimated future cash flow expected from continuing use of the asset and from its disposal is discounted to their present value using
a pre-tax discount rate that reflects the current market assessments of time value of money and the risk specific to the asset. If the
recoverable amount of an asset is estimated to be less than the carrying amount, the carrying amount of the asset is reduced to its
recoverable amount. An impairment loss is recognised immediately in the Statement of Profit and Loss. After impairment,
depreciation is provided on the revised carrying amount of the assets over its remaining useful life. A previously recognised
impairment loss is increased or reversed depending on changes in circumstances. However, the carrying value after reversal is not
increased above the lower of recoverable amount and the carrying value that would have prevailed by charging usual depreciation if
there was no impairment.
Provisions are recognised when the Company has present obligations, as result of past events, for which it is probable that an
outflow of economic benefits will be required to settle the obligation and a reliable estimate can be made. Provisions (excluding
retirement benefits) are not discounted to their present value and are determined based on best estimate required to settle the
obligation at the Balance Sheet date. These are reviewed at each Balance Sheet date and adjusted to reflect the current best
estimates. Contingent liabilities are not recognised but disclosed in the financial statements. A Contingent asset is neither
recognised nor disclosed in the financial statements.
Defined benefit plans
For defined benefit plans in the form of gratuity, the cost of providing benefits is determined using the Projected Unit Credit
method, with actuarial valuations being carried out at each Balance Sheet date. Actuarial gains and losses are recognised in the
Statement of Profit and Loss in the year in which they occur. Past service cost is recognised immediately to the extent that the
benefits are already vested and otherwise is amortised on a straight-line basis over the average period until the benefits become
vested. The retirement benefit obligation recognised in the Balance Sheet represents the present value of the defined benefit
obligation as adjusted for unrecognised past service cost, as reduced by the fair value of scheme assets. Any asset resulting from
this calculation is limited to past service cost, plus the present value of available refunds and reductions in future contributions to
the schemes.
Short-term employee benefits
The undiscounted amount of short-term employee benefits expected to be paid in exchange for the services rendered by employees
are recognised during the year when the employees render the service. These benefits include performance incentive and
compensated absences which are expected to occur within twelve months after the end of the year in which the employee renders
the related service.
The cost of short-term compensated absences is accounted as under :
(a) in case of accumulated compensated absences, when employees render the services that increase their entitlement of future
compensated absences; and
(b) in case of non-accumulating compensated absences, when the absences occur.
Long-term employee benefits
Compensated absences which are not expected to occur within twelve months after the end of the year in which the employee
renders the related service are recognised as a liability at the present value of the defined benefit obligation as at the balance sheet
date less the fair value of the plan assets out of which the obligations are expected to be settled. Long term service awards are
recognised as a liability at the present value of the defined benefit obligation as at the balance sheet date.
Employee benefits include provident fund, superannuation fund, employee state insurance scheme, gratuity fund, compensated
absences, long service awards and post-employment medical benefits.
Defined contribution plans
The eligible employees of the Company are entitled to receive benefits under the provident fund, a defined contribution plan, in
which both employees and the Company make monthly contributions at a specified percentage of the covered employees’ salary
(currently 12% of employees’ salary), which is recognised as an expense in the Statement of Profit and Loss in the year in which
they occur. The contributions as specified under the law are paid to the provident fund set up as irrevocable trust by the Company.
The Company is generally liable for annual contributions and any deficiency in interest cost compared to interest computed based
on the rate of interest declared by the Central Government under the employee provident scheme, 1952 is recognised as an expense
in the year in which it is determined.
The Company's contribution to superannuation fund and employee state insurance scheme are considered as defined contribution
plans and are charged as an expense in the Statement of Profit and Loss based on the amount of contribution required to be made
and when services are rendered by the employees.
140

xvi. Foreign currency transactions and translations
Accounting of forward contracts :-
xvii. Taxation
xviii.
xix.
xx. Business segment
xxi. Cash Flow Statement
The Company’s reportable segments consist of "Financing Activity", " Investment Activity" and "Others". The "Financing Activity"
segment consists of asset financing, term loans (corporate and retail), channel financing, credit substitutes, investments linked
to/arising out of lending business and bill discounting. The "Investment Activity" segment includes corporate investments and
"Others" segment primarily includes advisory services, wealth management, distribution of financial products and leasing.
Revenue and expense directly attributable to segments are reported under each reportable segment. Expenses not directly
identifiable to each of the segments have been allocated to each segment on the basis of associated revenues of each segment. All
other expenses which are not attributable or allocable to segments have been disclosed as unallocable expenses.
Assets and liabilities that are directly attributable to segments are disclosed under each reportable segment. All other assets and
liabilities are disclosed as unallocable.
Cash flows are reported using the indirect method, whereby profit / (loss) before extraordinary items and tax is adjusted for the
effects of transactions of non-cash nature and any deferrals or accruals of past or future cash receipts or payments. The cash flows
from operating, investing and financing activities of the Company are segregated based on the available information.
Goods and Services tax input credit
Goods & Service tax input credit is accounted for in the books in the year in which the underlying goods or service are received and
paid and there is reasonable certainty in availing / utilizing the credits
Operating Cycle
Based on the nature of products/activities of the Company and the normal time between acquisition of assets and their realisation in
cash or cash equivalents, the Company has determined its operating cycle as 12 months for the purpose of classification of its assets
and liabilities as current and non current.
Current and Deferred tax relating to items directly recognised in reserves are recognised in reserves and not in the Statement of
Profit and Loss.
Deferred tax is recognised on the timing differences, being the differences between the taxable income and the accounting income
that originate in one period and are capable of reversal in one or more subsequent periods. Deferred tax is measured using the tax
rates and the tax laws enacted or substantively enacted as at the reporting date. Deferred tax liabilities are recognised for all timing
differences. Deferred tax assets are recognised for timing differences of items other than unabsorbed depreciation and carry
forward losses only to the extent that reasonable certainty exists that sufficient future taxable income will be available against which
these can be realised. However, if there are unabsorbed depreciation and carry forward losses and items relating to capital losses,
Deferred tax assets are recognised only if there is virtual certainty supported by convincing evidence that there will be sufficient
future taxable income available to realise assets. Deferred tax assets and liabilities are offset if such items relate to taxes on income
levied by the same governing tax laws and the Company has a legally enforceable right for such set off. Deferred tax assets are
reviewed at each balance sheet date for their realisability.
Deferred tax corresponds to the net effect of tax on all timing differences, which occur as a result of items being allowed for income
tax purposes during a year different from when they were recognised in the financial statements.
Income Tax
Current tax is the amount of tax payable on the taxable income for the year as determined in accordance with the applicable tax
rates and the provision of the Income Tax Act, 1961 and other applicable tax laws.
Transactions in foreign currencies entered into by the Company are accounted at the exchange rates prevailing on the date of the
transaction or at rates that closely approximate the rate at the date of the transaction.
Measurement at the Balance Sheet date :-
Foreign currency monetary items (other than derivative contracts) of the Company, outstanding at the Balance Sheet date are
restated at the year-end rates. Non-monetary items of the Company are carried at historical cost.
The exchange differences arising on settlement / restatement of long-term foreign currency monetary items are capitalised as part of
the depreciable fixed assets to which the monetary item relates and depreciated over the remaining useful life of such assets.
Premium/discount on forward exchange contracts, which are not intended for trading or speculation purposes, are amortised over
the period of the contracts if such contracts relate to monetary items as at the Balance Sheet date.
Initial recognition :-
141
xxii. Earnings Per Share
xxiii. Securitised/Assignment Loans and Securitisation/Assignment Liabilities
xxiv. Dividend (including dividend distribution tax)
Securitised/ Assigned assets are derecognised, if and only if, the Company looses control of the contractual rights that comprise the
corresponding pools or mortgages transferred. Transfers of pools of mortgages under the current programs involve transfer of
proportionate shares in the pools of mortgages. Such transfers result in de-recognition only of that proportion of the mortgages that
meet the de-recognition criteria. The portion retained by the Company continues to be accounted for as loans as described above. As
stated in the Guidance Note on Accounting for Securitisation issued by the Institute of Chartered Accountants of India, on de-
recognition, the difference between the book value of the securitised/ assigned asset and consideration received is recognised as
gain arising on securitization/ assignment in the Statement of Profit and Loss over the balance maturity period of the pool
transferred. Losses, if any, arising from such transactions, are recognised immediately in the Statement of Profit and Loss.
Interim dividend declared to equity and / or preference shareholders, if any, is recognised as liability in the period in which the said
dividend has been declared by the Directors. Final proposed dividend declared to equity and / or preference shareholders, if any, is
recognised in the period in which the said dividend has been approved by the Shareholders.
Basic earnings per share is computed by dividing the profit / (loss) after tax (including the post tax effect of extraordinary items, if
any) by the weighted average number of equity shares outstanding during the year. Diluted earnings per share is computed by
dividing the profit / (loss) after tax (including the post tax effect of extraordinary items, if any) as adjusted for dividend, interest
and other charges to expense or income (net of any attributable taxes) relating to the dilutive potential equity shares, by the weighted
average number of equity shares considered for deriving basic earnings per share and the weighted average number of equity shares
which could have been issued on the conversion of all dilutive potential equity shares. Potential equity shares are deemed to be
dilutive only if their conversion to equity shares would decrease the net profit per share from continuing ordinary operations.
Potential dilutive equity shares are deemed to be converted as at the beginning of the year, unless they have been issued at a later
date. The dilutive potential equity shares are adjusted for the proceeds receivable had the shares been actually issued at fair value
(i.e. average market value of the outstanding shares). Dilutive potential equity shares are determined independently for each period
presented. The number of equity shares and potentially dilutive equity shares are adjusted for share splits / reverse share splits and
bonus shares, as appropriate.
142

3. SHARE CAPITAL
As at
March 31,
2018
As at
March 31,
2017
Rs in lakh Rs in lakh
AUTHORISED
250,000 250,000
300,000 300,000
550,000 550,000
ISSUED, SUBSCRIBED & PAID UP
129,755 129,755
94,500 94,500
57,500 -
281,755 224,255
3. (a). Reconciliation of number of shares outstanding
No. of shares Rs in lakh
Equity Shares
Opening balance as on April 01, 2016 1,297,550,000 129,755
Additions during the year - -
Closing Balance as on March 31, 2017 1,297,550,000 129,755
Additions during the year - -
Closing Balance as on March 31, 2018 1,297,550,000 129,755
Preference Shares
Opening balance as on April 01, 2016 160,000,000 16,000
Additions during the year 785,000,000 78,500
Closing Balance as on March 31, 2017 945,000,000 94,500
Additions during the year 575,000,000 57,500
Closing Balance as on March 31, 2018 1,520,000,000 152,000
3. (b). Rights, preferences and restrictions attached to shares
Tranch-wise due date details for Compulsorily Convertible Cumulative Preference Shares ("CCCPS")
No. of Units Rs in lakh
31-Mar-18 31-Mar-27 150,000,000 15,000
21-Mar-18 21-Mar-27 250,000,000 25,000
8-Mar-18 8-Mar-27 100,000,000 10,000
29-Dec-17 29-Dec-26 75,000,000 7,500
31-Mar-17 31-Mar-26 100,000,000 10,000
28-Feb-17 28-Feb-26 200,000,000 20,000
29-Dec-16 29-Dec-25 100,000,000 10,000
28-Sep-16 28-Sep-25 100,000,000 10,000
28-Jun-16 28-Jun-25 285,000,000 28,500
23-Mar-16 23-Mar-25 125,000,000 12,500
29-Sep-15 29-Sep-24 35,000,000 3,500
1,520,000,000 152,000
3. (c).
No. of shares Rs in lakh
Equity Shares 1,297,550,000 129,755
1,297,550,000 129,755
1,297,550,000 129,755
Preference Shares 160,000,000 16,000
785,000,000 78,500
Closing Balance as on March 31, 2017 945,000,000 94,500
575,000,000 57,500
1,520,000,000 152,000 Closing Balance as on March 31, 2018
Opening Balance as on April 1, 2016
Closing Balance as on March 31, 2017
Closing Balance as on March 31, 2018
Opening Balance as on April 1, 2016
"Rights" issue during the FY 2016-17
"Rights" issue during the FY 2017-18
Total
The CCCPS holders may, at any time prior to the aforesaid period of conversion, requesting the conversion of all or any part of its holding into
Equity Shares.
Investment by Tata Capital Limited (Holding company). The entire share capital is held by Tata Capital Limited and its
nominees.
Name of company Particulars of issue
Tata Capital Limited (Holding Company)
Total
Particulars
Equity Shares : The Company has one class of equity shares having a face value of Rs.10 per share. Each shareholder is eligible for one vote
per share held. The dividend proposed by the Board of Directors, if any, is subject to the approval of the shareholders in the ensuing Annual
General Meeting, except in case of interim dividend. In the event of liquidation, the equity shareholders are eligible to receive the remaining
assets of the Company after distribution of all preferential amounts, in proportion to their shareholding. Tata Sons Limited is the ultimate
holding company.
During the year ended March 31, 2018, the Company has issued 57,50,00,000, 8.50% Compulsorily Convertible Cumulative Preference
Shares ("CCCPS") of face value Rs. 10/- each aggregating Rs. 575 crore, which are convertible into equity shares after the completion of 9
years from the date of allotment. However, CCCPS holders have an option to convert all or any part of the holding, into equity shares at any
time, prior to the completion of 9 years. Conversion of CCCPS into equity shares will be based on the fair value to be determined by an
independent valuer closer to the conversion date. The CCCPS holders have a right to receive dividend, prior to the Equity Shareholders. The
dividend proposed by the Board of Directors on the CCCPS is subject to the approval of the shareholders at an Annual General Meeting,
except in case of interim dividend. In the event of liquidation, the Preference Shareholders will carry a preferential right over the holder of
equity shares for payment of dividend and for payment of capital, in proportion to their shareholding.
Date of Allotment Date of Conversion
PARTICULARS
2,500,000,000 (as at March 31, 2017: 2,500,000,000 shares) Equity shares of Rs.10 each
3,000,000,000 (as at March 31, 2017: 3,000,000,000 shares) Preference shares of Rs.10 each
1,297,550,000 (as at March 31, 2017: 1,297,550,000 shares) Equity shares of Rs.10 each fully
paid up
945,000,000 (as at March 31, 2017: 945,000,000 shares) 9% Compulsorily Convertible
Cumulative Preference shares of Rs.10 each fully paid up
575,000,000 (as at March 31, 2017: NIL) 8.5% Compulsorily Convertible Cumulative Preference
shares of Rs.10 each fully paid up
143

4. RESERVES AND SURPLUS
(a) Securities Premium Account
Opening Balance 88,865 129,500
- (54,260)
- 13,702
(60) (60) (77) (40,635)
Closing Balance 88,805 88,865
(b) Debenture Redemption Reserve 30,000 30,000
(c) Special Reserve Account
Opening Balance 25,750 21,431
9,652 4,319
Closing Balance 35,402 25,750
(d) Surplus in Statement of Profit and Loss
Opening Balance 37,538 32,378
Add: Profit for the year 48,258 21,598
Amount available for Appropriations 85,796 53,976
Less : Appropriations
- Transfer to Special Reserve Account (9,652) (4,319)
- Interim Dividend on equity shares (Refer note (e) below) (4,541) (5,839)
- Dividend on preference shares (Refer notes (b), (c) and (d) below) (8,726) (4,230)
- Tax on Interim Dividend (2,701) (25,620) (2,050) (16,438)
Closing Balance 60,176 37,538
TOTAL - RESERVES AND SURPLUS (a + b + c + d) 214,383 182,153
Notes:
a)
b)
c)
d)
e)
During the year ended March 31, 2018, the Company has declared and paid on August 22, 2017, a final dividend for
financial year 2016-17 on Compulsorily Convertible Cumulative Preference Shares aggregating to Rs. 3 lakh and
dividend distribution tax thereon of Rs. 1 lakh.
During the year ended March 31, 2018, the Company has declared on March 20, 2018 and paid on March 21, 2018, an
interim dividend for financial year 2017-18 on Compulsorily Convertible Cumulative Preference Shares aggregating to
Rs. 6,603 lakh (Previous Year : 4,230 lakh) and dividend distribution tax thereon of Rs. 1,344 lakh (Previous Year :
861 lakh).
During the year ended March 31, 2018, the Company has declared on March 20, 2018 and paid on March 21, 2018, an
interim dividend on equity shares of Re. 0.35 per share (Previous Year : Re. 0.45 per share) aggregating to Rs. 4,541
lakh (Previous Year : Rs. 5,839 lakh) and dividend distribution tax thereon of Rs. 925 lakh (Previous Year : Rs. 1,189
lakh).
Add: Transfer from Surplus in the Statement of Profit and Loss
(Refer note (a) below)
The amounts appropriated out of the surplus in the Statement of Profit and Loss are as under:
Rs. 9,652 lakh (Previous Year: Rs. 4,319 lakh) to Special Reserve as prescribed by section 45-IC of the Reserve Bank
of India Act, 1934, being 20% of the profit after taxes for the year ended March 31, 2018.
During the year ended March 31, 2018, the Company has declared and paid on July 27, 2017, an interim dividend for
financial year 2017-18 on Compulsorily Convertible Cumulative Preference Shares aggregating to Rs. 2,120 lakh and
dividend distribution tax thereon of Rs. 431 lakh.
Less : Adjustment pursuant to Reduction of Share Capital
(Refer note 40)
Add : Adjustment of Tax pursuant to Reduction of Share Capital
(Refer note 40)
Less : Share issue expenses written-off (Refer note 41)
Rs in lakh Rs in lakh
As at
March 31,
2017
PARTICULARS
As at
March 31,
2018
144

5. LONG-TERM BORROWINGS
As at
March 31,
2018
As at
March 31,
2017
Rs in lakh Rs in lakh
(a) Debentures
Secured
684,267 446,120
Public issue of Non-Convertible Debentures (Refer notes 5.2 and 5.7 below) - 28,818
Unsecured
181,194 180,746
Non-Convertible Perpetual Debentures (Refer note 5.9 below) 91,800 60,000
Privately Placed Non-Convertible Debentures (Refer note 5.10 below) 80,000 70,000
(b) Term loans
Secured
From Banks (Refer notes 5.3 and 5.4 below) 104,500 30,000
Unsecured
From Banks (Refer note 5.4 below) 145,000 130,000
1,286,761 945,684
Notes
5.1.
5.2.
5.3.
5.4 As per terms of agreements loan from banks classified under long-term borrowing, short-term borrowing and current liabilities
aggregating Rs. 427,000 lakh (Previous Year: Rs. 216,000 lakh) are repayable at maturity ranging between 5 and 48 months from
the date of respective loan. Rate of interest payable on term loans varies between 7.45 % to 8.40% (Previous Year : 7.95 % to
9.15%.)
Loans and advances from banks are secured by pari passu charge on the receivables of the Company through Security Trustee.
Terms of repayment of term loans and rate of interest:
Total
Privately Placed Non-Convertible Debentures are secured by pari passu charge on the specific immovable property, specified
receivables arising out of loan, lease, hire purchase transactions and to the extent of shortfall in asset cover by a pari passu charge
on the current assets of the Company.
Public issue of Non-Convertible Debentures are secured by a pari passu charge on the specific immovable property, receivables
against unsecured loans, bills discounted and trade advances and other current assets of the Company.
PARTICULARS
Privately Placed Non-Convertible Debentures (Refer notes 5.1 and 5.5 below)
[Net of unamortised premium of Rs. 57 lakh (as at March 31, 2017 : Nil)]
Non-Convertible Subordinated Debentures (Refer note 5.8 and 5.11 below)
[Net of unamortised discount of Rs. 851 lakh (as at March 31, 2017 : Rs. 1,299 lakh)]
145
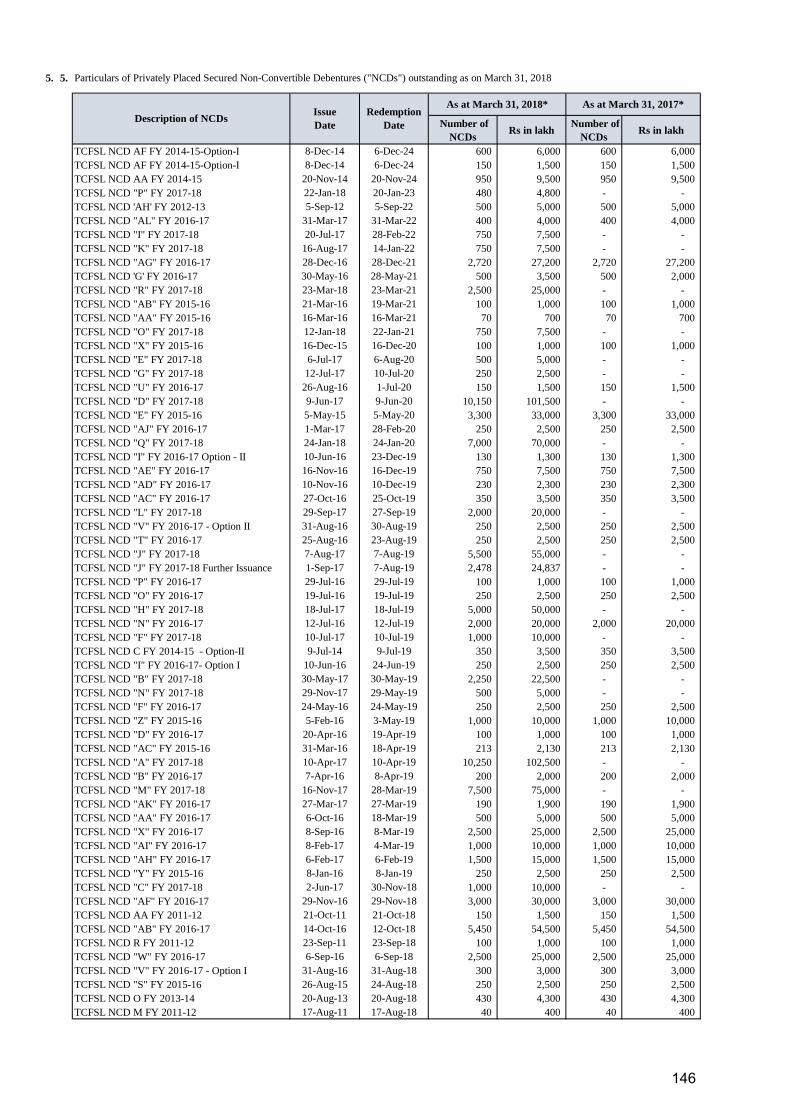
5. 5.
Number of
NCDs Rs in lakh
Number of
NCDs Rs in lakh
TCFSL NCD AF FY 2014-15-Option-I 8-Dec-14 6-Dec-24 600 6,000 600 6,000
TCFSL NCD AF FY 2014-15-Option-I 8-Dec-14 6-Dec-24 150 1,500 150 1,500
TCFSL NCD AA FY 2014-15 20-Nov-14 20-Nov-24 950 9,500 950 9,500
TCFSL NCD "P" FY 2017-18 22-Jan-18 20-Jan-23 480 4,800 - -
TCFSL NCD 'AH' FY 2012-13 5-Sep-12 5-Sep-22 500 5,000 500 5,000
TCFSL NCD "AL" FY 2016-17 31-Mar-17 31-Mar-22 400 4,000 400 4,000
TCFSL NCD "I" FY 2017-18 20-Jul-17 28-Feb-22 750 7,500 - -
TCFSL NCD "K" FY 2017-18 16-Aug-17 14-Jan-22 750 7,500 - -
TCFSL NCD "AG" FY 2016-17 28-Dec-16 28-Dec-21 2,720 27,200 2,720 27,200
TCFSL NCD 'G' FY 2016-17 30-May-16 28-May-21 500 3,500 500 2,000
TCFSL NCD "R" FY 2017-18 23-Mar-18 23-Mar-21 2,500 25,000 - -
TCFSL NCD "AB" FY 2015-16 21-Mar-16 19-Mar-21 100 1,000 100 1,000
TCFSL NCD "AA" FY 2015-16 16-Mar-16 16-Mar-21 70 700 70 700
TCFSL NCD "O" FY 2017-18 12-Jan-18 22-Jan-21 750 7,500 - -
TCFSL NCD "X" FY 2015-16 16-Dec-15 16-Dec-20 100 1,000 100 1,000
TCFSL NCD "E" FY 2017-18 6-Jul-17 6-Aug-20 500 5,000 - -
TCFSL NCD "G" FY 2017-18 12-Jul-17 10-Jul-20 250 2,500 - -
TCFSL NCD "U" FY 2016-17 26-Aug-16 1-Jul-20 150 1,500 150 1,500
TCFSL NCD "D" FY 2017-18 9-Jun-17 9-Jun-20 10,150 101,500 - -
TCFSL NCD "E" FY 2015-16 5-May-15 5-May-20 3,300 33,000 3,300 33,000
TCFSL NCD "AJ" FY 2016-17 1-Mar-17 28-Feb-20 250 2,500 250 2,500
TCFSL NCD "Q" FY 2017-18 24-Jan-18 24-Jan-20 7,000 70,000 - -
TCFSL NCD "I" FY 2016-17 Option - II 10-Jun-16 23-Dec-19 130 1,300 130 1,300
TCFSL NCD "AE" FY 2016-17 16-Nov-16 16-Dec-19 750 7,500 750 7,500
TCFSL NCD "AD" FY 2016-17 10-Nov-16 10-Dec-19 230 2,300 230 2,300
TCFSL NCD "AC" FY 2016-17 27-Oct-16 25-Oct-19 350 3,500 350 3,500
TCFSL NCD "L" FY 2017-18 29-Sep-17 27-Sep-19 2,000 20,000 - -
TCFSL NCD "V" FY 2016-17 - Option II 31-Aug-16 30-Aug-19 250 2,500 250 2,500
TCFSL NCD "T" FY 2016-17 25-Aug-16 23-Aug-19 250 2,500 250 2,500
TCFSL NCD "J" FY 2017-18 7-Aug-17 7-Aug-19 5,500 55,000 - -
TCFSL NCD "J" FY 2017-18 Further Issuance 1-Sep-17 7-Aug-19 2,478 24,837 - -
TCFSL NCD "P" FY 2016-17 29-Jul-16 29-Jul-19 100 1,000 100 1,000
TCFSL NCD "O" FY 2016-17 19-Jul-16 19-Jul-19 250 2,500 250 2,500
TCFSL NCD "H" FY 2017-18 18-Jul-17 18-Jul-19 5,000 50,000 - -
TCFSL NCD "N" FY 2016-17 12-Jul-16 12-Jul-19 2,000 20,000 2,000 20,000
TCFSL NCD "F" FY 2017-18 10-Jul-17 10-Jul-19 1,000 10,000 - -
TCFSL NCD C FY 2014-15 - Option-II 9-Jul-14 9-Jul-19 350 3,500 350 3,500
TCFSL NCD "I" FY 2016-17- Option I 10-Jun-16 24-Jun-19 250 2,500 250 2,500
TCFSL NCD "B" FY 2017-18 30-May-17 30-May-19 2,250 22,500 - -
TCFSL NCD "N" FY 2017-18 29-Nov-17 29-May-19 500 5,000 - -
TCFSL NCD "F" FY 2016-17 24-May-16 24-May-19 250 2,500 250 2,500
TCFSL NCD "Z" FY 2015-16 5-Feb-16 3-May-19 1,000 10,000 1,000 10,000
TCFSL NCD "D" FY 2016-17 20-Apr-16 19-Apr-19 100 1,000 100 1,000
TCFSL NCD "AC" FY 2015-16 31-Mar-16 18-Apr-19 213 2,130 213 2,130
TCFSL NCD "A" FY 2017-18 10-Apr-17 10-Apr-19 10,250 102,500 - -
TCFSL NCD "B" FY 2016-17 7-Apr-16 8-Apr-19 200 2,000 200 2,000
TCFSL NCD "M" FY 2017-18 16-Nov-17 28-Mar-19 7,500 75,000 - -
TCFSL NCD "AK" FY 2016-17 27-Mar-17 27-Mar-19 190 1,900 190 1,900
TCFSL NCD "AA" FY 2016-17 6-Oct-16 18-Mar-19 500 5,000 500 5,000
TCFSL NCD "X" FY 2016-17 8-Sep-16 8-Mar-19 2,500 25,000 2,500 25,000
TCFSL NCD "AI" FY 2016-17 8-Feb-17 4-Mar-19 1,000 10,000 1,000 10,000
TCFSL NCD "AH" FY 2016-17 6-Feb-17 6-Feb-19 1,500 15,000 1,500 15,000
TCFSL NCD "Y" FY 2015-16 8-Jan-16 8-Jan-19 250 2,500 250 2,500
TCFSL NCD "C" FY 2017-18 2-Jun-17 30-Nov-18 1,000 10,000 - -
TCFSL NCD "AF" FY 2016-17 29-Nov-16 29-Nov-18 3,000 30,000 3,000 30,000
TCFSL NCD AA FY 2011-12 21-Oct-11 21-Oct-18 150 1,500 150 1,500
TCFSL NCD "AB" FY 2016-17 14-Oct-16 12-Oct-18 5,450 54,500 5,450 54,500
TCFSL NCD R FY 2011-12 23-Sep-11 23-Sep-18 100 1,000 100 1,000
TCFSL NCD "W" FY 2016-17 6-Sep-16 6-Sep-18 2,500 25,000 2,500 25,000
TCFSL NCD "V" FY 2016-17 - Option I 31-Aug-16 31-Aug-18 300 3,000 300 3,000
TCFSL NCD "S" FY 2015-16 26-Aug-15 24-Aug-18 250 2,500 250 2,500
TCFSL NCD O FY 2013-14 20-Aug-13 20-Aug-18 430 4,300 430 4,300
TCFSL NCD M FY 2011-12 17-Aug-11 17-Aug-18 40 400 40 400
Particulars of Privately Placed Secured Non-Convertible Debentures ("NCDs") outstanding as on March 31, 2018
Description of NCDsIssue
Date
Redemption
Date
As at March 31, 2018* As at March 31, 2017*
146
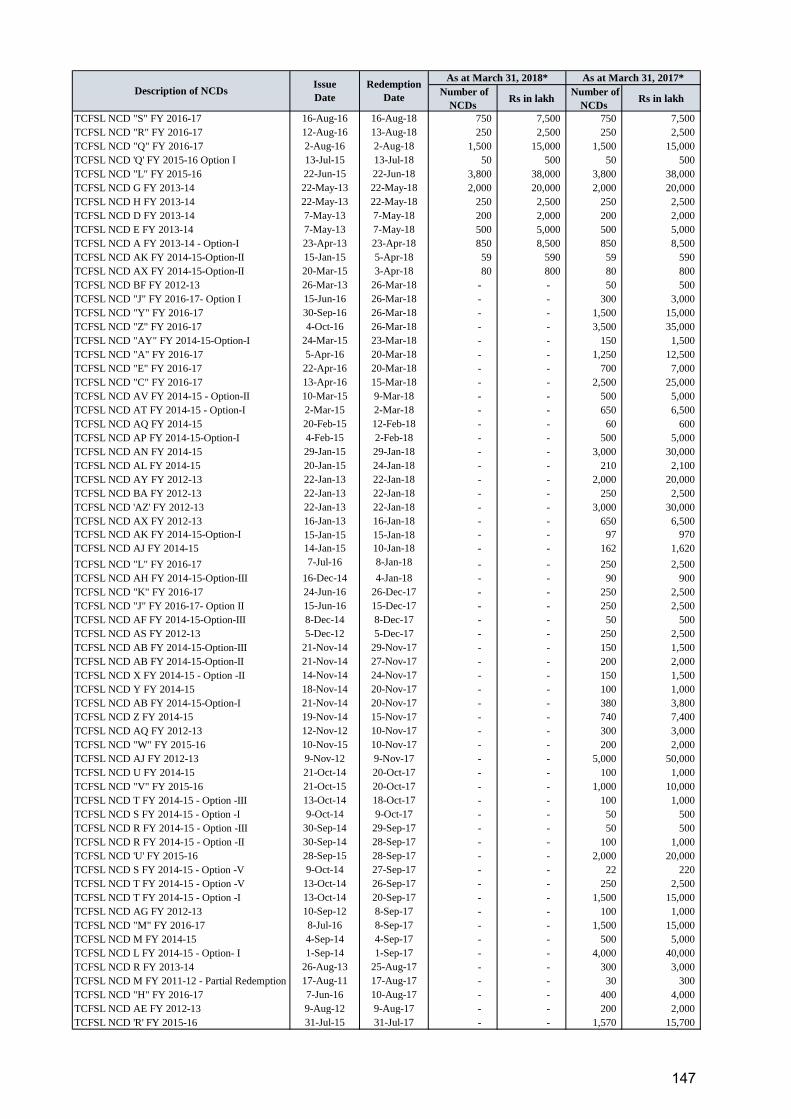
Number of
NCDs Rs in lakh
Number of
NCDs Rs in lakh
TCFSL NCD "S" FY 2016-17 16-Aug-16 16-Aug-18 750 7,500 750 7,500
TCFSL NCD "R" FY 2016-17 12-Aug-16 13-Aug-18 250 2,500 250 2,500
TCFSL NCD "Q" FY 2016-17 2-Aug-16 2-Aug-18 1,500 15,000 1,500 15,000
TCFSL NCD 'Q' FY 2015-16 Option I 13-Jul-15 13-Jul-18 50 500 50 500
TCFSL NCD "L" FY 2015-16 22-Jun-15 22-Jun-18 3,800 38,000 3,800 38,000
TCFSL NCD G FY 2013-14 22-May-13 22-May-18 2,000 20,000 2,000 20,000
TCFSL NCD H FY 2013-14 22-May-13 22-May-18 250 2,500 250 2,500
TCFSL NCD D FY 2013-14 7-May-13 7-May-18 200 2,000 200 2,000
TCFSL NCD E FY 2013-14 7-May-13 7-May-18 500 5,000 500 5,000
TCFSL NCD A FY 2013-14 - Option-I 23-Apr-13 23-Apr-18 850 8,500 850 8,500
TCFSL NCD AK FY 2014-15-Option-II 15-Jan-15 5-Apr-18 59 590 59 590
TCFSL NCD AX FY 2014-15-Option-II 20-Mar-15 3-Apr-18 80 800 80 800
TCFSL NCD BF FY 2012-13 26-Mar-13 26-Mar-18 - - 50 500
TCFSL NCD "J" FY 2016-17- Option I 15-Jun-16 26-Mar-18 - - 300 3,000
TCFSL NCD "Y" FY 2016-17 30-Sep-16 26-Mar-18 - - 1,500 15,000
TCFSL NCD "Z" FY 2016-17 4-Oct-16 26-Mar-18 - - 3,500 35,000
TCFSL NCD "AY" FY 2014-15-Option-I 24-Mar-15 23-Mar-18 - - 150 1,500
TCFSL NCD "A" FY 2016-17 5-Apr-16 20-Mar-18 - - 1,250 12,500
TCFSL NCD "E" FY 2016-17 22-Apr-16 20-Mar-18 - - 700 7,000
TCFSL NCD "C" FY 2016-17 13-Apr-16 15-Mar-18 - - 2,500 25,000
TCFSL NCD AV FY 2014-15 - Option-II 10-Mar-15 9-Mar-18 - - 500 5,000
TCFSL NCD AT FY 2014-15 - Option-I 2-Mar-15 2-Mar-18 - - 650 6,500
TCFSL NCD AQ FY 2014-15 20-Feb-15 12-Feb-18 - - 60 600
TCFSL NCD AP FY 2014-15-Option-I 4-Feb-15 2-Feb-18 - - 500 5,000
TCFSL NCD AN FY 2014-15 29-Jan-15 29-Jan-18 - - 3,000 30,000
TCFSL NCD AL FY 2014-15 20-Jan-15 24-Jan-18 - - 210 2,100
TCFSL NCD AY FY 2012-13 22-Jan-13 22-Jan-18 - - 2,000 20,000
TCFSL NCD BA FY 2012-13 22-Jan-13 22-Jan-18 - - 250 2,500
TCFSL NCD 'AZ' FY 2012-13 22-Jan-13 22-Jan-18 - - 3,000 30,000
TCFSL NCD AX FY 2012-13 16-Jan-13 16-Jan-18 - - 650 6,500
TCFSL NCD AK FY 2014-15-Option-I 15-Jan-15 15-Jan-18 - - 97 970
TCFSL NCD AJ FY 2014-15 14-Jan-15 10-Jan-18 - - 162 1,620
TCFSL NCD "L" FY 2016-17 7-Jul-16 8-Jan-18 - - 250 2,500
TCFSL NCD AH FY 2014-15-Option-III 16-Dec-14 4-Jan-18 - - 90 900
TCFSL NCD "K" FY 2016-17 24-Jun-16 26-Dec-17 - - 250 2,500
TCFSL NCD "J" FY 2016-17- Option II 15-Jun-16 15-Dec-17 - - 250 2,500
TCFSL NCD AF FY 2014-15-Option-III 8-Dec-14 8-Dec-17 - - 50 500
TCFSL NCD AS FY 2012-13 5-Dec-12 5-Dec-17 - - 250 2,500
TCFSL NCD AB FY 2014-15-Option-III 21-Nov-14 29-Nov-17 - - 150 1,500
TCFSL NCD AB FY 2014-15-Option-II 21-Nov-14 27-Nov-17 - - 200 2,000
TCFSL NCD X FY 2014-15 - Option -II 14-Nov-14 24-Nov-17 - - 150 1,500
TCFSL NCD Y FY 2014-15 18-Nov-14 20-Nov-17 - - 100 1,000
TCFSL NCD AB FY 2014-15-Option-I 21-Nov-14 20-Nov-17 - - 380 3,800
19-Nov-14 15-Nov-17 - - 740 7,400
TCFSL NCD AQ FY 2012-13 12-Nov-12 10-Nov-17 - - 300 3,000
TCFSL NCD "W" FY 2015-16 10-Nov-15 10-Nov-17 - - 200 2,000
TCFSL NCD AJ FY 2012-13 9-Nov-12 9-Nov-17 - - 5,000 50,000
TCFSL NCD U FY 2014-15 21-Oct-14 20-Oct-17 - - 100 1,000
TCFSL NCD "V" FY 2015-16 21-Oct-15 20-Oct-17 - - 1,000 10,000
TCFSL NCD T FY 2014-15 - Option -III 13-Oct-14 18-Oct-17 - - 100 1,000
TCFSL NCD S FY 2014-15 - Option -I 9-Oct-14 9-Oct-17 - - 50 500
TCFSL NCD R FY 2014-15 - Option -III 30-Sep-14 29-Sep-17 - - 50 500
TCFSL NCD R FY 2014-15 - Option -II 30-Sep-14 28-Sep-17 - - 100 1,000
TCFSL NCD 'U' FY 2015-16 28-Sep-15 28-Sep-17 - - 2,000 20,000
TCFSL NCD S FY 2014-15 - Option -V 9-Oct-14 27-Sep-17 - - 22 220
TCFSL NCD T FY 2014-15 - Option -V 13-Oct-14 26-Sep-17 - - 250 2,500
TCFSL NCD T FY 2014-15 - Option -I 13-Oct-14 20-Sep-17 - - 1,500 15,000
TCFSL NCD AG FY 2012-13 10-Sep-12 8-Sep-17 - - 100 1,000
TCFSL NCD "M" FY 2016-17 8-Jul-16 8-Sep-17 - - 1,500 15,000
TCFSL NCD M FY 2014-15 4-Sep-14 4-Sep-17 - - 500 5,000
TCFSL NCD L FY 2014-15 - Option- I 1-Sep-14 1-Sep-17 - - 4,000 40,000
TCFSL NCD R FY 2013-14 26-Aug-13 25-Aug-17 - - 300 3,000
TCFSL NCD M FY 2011-12 - Partial Redemption 17-Aug-11 17-Aug-17 - - 30 300
TCFSL NCD "H" FY 2016-17 7-Jun-16 10-Aug-17 - - 400 4,000
TCFSL NCD AE FY 2012-13 9-Aug-12 9-Aug-17 - - 200 2,000
TCFSL NCD 'R' FY 2015-16 31-Jul-15 31-Jul-17 - - 1,570 15,700
Description of NCDsIssue
Date
Redemption
Date
As at March 31, 2018* As at March 31, 2017*
TCFSL NCD Z FY 2014-15
147

Number of
NCDs Rs in lakh
Number of
NCDs Rs in lakh
TCFSL NCD "H" FY 2015-16 Option - I 15-May-15 17-Jul-17 - - 1,270 12,700
TCFSL NCD F FY 2014-15 14-Jul-14 14-Jul-17 - - 100 1,000
TCFSL NCD C FY 2014-15 - Option-I 9-Jul-14 10-Jul-17 - - 250 2,500
TCFSL NCD 'O' FY 2015-16 Option II 7-Jul-15 7-Jul-17 - - 250 2,500
TCFSL NCD 'P' FY 2015-16 9-Jul-15 7-Jul-17 - - 2,500 25,000
TCFSL NCD "M" FY 2015-16 - Option I 24-Jun-15 23-Jun-17 - - 1,000 10,000
TCFSL NCD "M" FY 2015-16 - Option II 24-Jun-15 23-Jun-17 - - 750 7,500
TCFSL NCD "M" FY 2015-16 - Option III 24-Jun-15 23-Jun-17 - - 750 7,500
TCFSL NCD 'O' FY 2015-16 Option I 7-Jul-15 23-Jun-17 - - 2,500 25,000
TCFSL NCD "H" FY 2015-16 Option - V 15-May-15 20-Jun-17 - - 187 1,870
TCFSL NCD "I" FY 2015-16 Option - V 22-May-15 20-Jun-17 - - 67 670
TCFSL NCD "K" FY 2015-16 9-Jun-15 9-Jun-17 - - 5,000 50,000
TCFSL NCD "C" FY 2015-16 OPTION-IV 22-Apr-15 1-Jun-17 - - 340 3,400
TCFSL NCD "H" FY 2015-16 Option - VI 15-May-15 1-Jun-17 - - 175 1,750
TCFSL NCD "I" FY 2015-16 Option - I 22-May-15 1-Jun-17 - - 1,273 12,730
TCFSL NCD "G" FY 2015-16 - Option I 13-May-15 24-May-17 - - 350 3,500
TCFSL NCD "J" FY 2015-16 - Option II 26-May-15 24-May-17 - - 5,250 52,500
TCFSL NCD "H" FY 2015-16 Option - IV 15-May-15 24-May-17 - - 220 2,200
TCFSL NCD "B" FY 2015-16 20-Apr-15 22-May-17 - - 1,026 10,260
TCFSL NCD "H" FY 2015-16 Option - II 15-May-15 22-May-17 - - 780 7,800
TCFSL NCD "I" FY 2015-16 Option - II 22-May-15 17-May-17 - - 200 2,000
TCFSL NCD "H" FY 2015-16 Option - VIII 15-May-15 15-May-17 - - 100 1,000
TCFSL NCD "H" FY 2015-16 Option - III 15-May-15 12-May-17 - - 250 2,500
TCFSL NCD AU FY 2014-15-Option-III 5-Mar-15 2-May-17 - - 110 1,100
TCFSL NCD "G" FY 2015-16 - Option II 13-May-15 27-Apr-17 - - 90 900
TCFSL NCD "C" FY 2015-16 OPTION-III 22-Apr-15 25-Apr-17 - - 850 8,500
TCFSL NCD "C" FY 2015-16 OPTION-II 22-Apr-15 20-Apr-17 - - 70 700
TCFSL NCD "C" FY 2015-16 OPTION-I 22-Apr-15 19-Apr-17 - - 326 3,260
TCFSL NCD "D" FY 2015-16 OPTION-II 24-Apr-15 18-Apr-17 - - 88 880
TCFSL NCD "A" FY 2015-16 15-Apr-15 11-Apr-17 - - 180 1,800
TCFSL NCD "H" FY 2015-16 Option - VII 15-May-15 11-Apr-17 - - 120 1,200
TCFSL NCD AU FY 2014-15-Option-I 5-Mar-15 10-Apr-17 - - 115 1,150
TCFSL NCD "D" FY 2015-16 OPTION-IV 24-Apr-15 5-Apr-17 - - 510 5,100
TCFSL NCD "D" FY 2015-16 OPTION-I 24-Apr-15 3-Apr-17 - - 640 6,400
TCFSL NCD "D" FY 2015-16 OPTION-III 24-Apr-15 3-Apr-17 - - 190 1,900
1,053,757 1,156,500
Of which current maturities classified under "Current liabilities" in note 10 (369,490) (710,380)
TOTAL 684,267 446,120
*Note : Coupon rate of "NCDs" outstanding as on March 31, 2018 varies from 7.50% to 10.40% (Previous Year : 7.58% to 10.75%)
Description of NCDsIssue
Date
Redemption
Date
As at March 31, 2018* As at March 31, 2017*
TOTAL
148
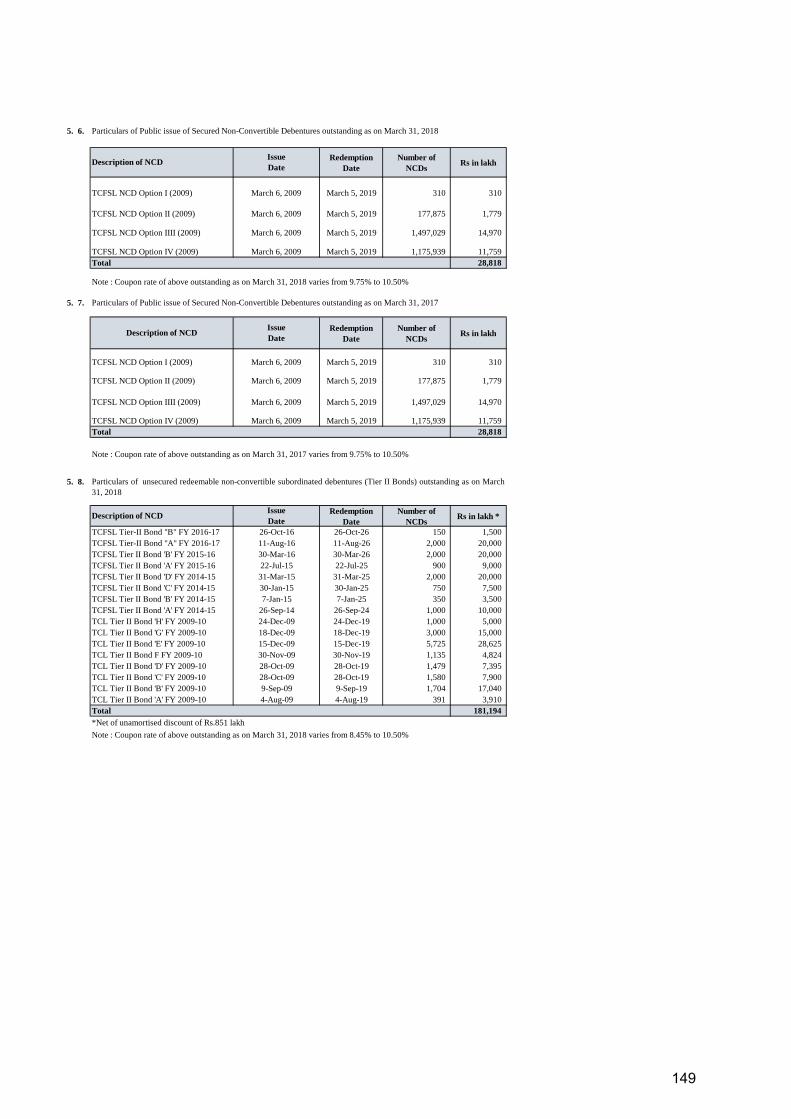
5. 6. Particulars of Public issue of Secured Non-Convertible Debentures outstanding as on March 31, 2018
Redemption
Date
Number of
NCDsRs in lakh
TCFSL NCD Option I (2009) March 5, 2019 310 310
TCFSL NCD Option II (2009) March 5, 2019 177,875 1,779
TCFSL NCD Option IIII (2009) March 5, 2019 1,497,029 14,970
TCFSL NCD Option IV (2009) March 5, 2019 1,175,939 11,759
28,818
Note : Coupon rate of above outstanding as on March 31, 2018 varies from 9.75% to 10.50%
5. 7. Particulars of Public issue of Secured Non-Convertible Debentures outstanding as on March 31, 2017
Redemption
Date
Number of
NCDsRs in lakh
TCFSL NCD Option I (2009) March 5, 2019 310 310
TCFSL NCD Option II (2009) March 5, 2019 177,875 1,779
TCFSL NCD Option IIII (2009) March 5, 2019 1,497,029 14,970
TCFSL NCD Option IV (2009) March 5, 2019 1,175,939 11,759
28,818
Note : Coupon rate of above outstanding as on March 31, 2017 varies from 9.75% to 10.50%
5. 8.
Redemption
Date
Number of
NCDsRs in lakh *
TCFSL Tier-II Bond "B" FY 2016-17 26-Oct-26 150 1,500
TCFSL Tier-II Bond "A" FY 2016-17 11-Aug-26 2,000 20,000
TCFSL Tier II Bond 'B' FY 2015-16 30-Mar-26 2,000 20,000
TCFSL Tier II Bond 'A' FY 2015-16 22-Jul-25 900 9,000
TCFSL Tier II Bond 'D' FY 2014-15 31-Mar-25 2,000 20,000
TCFSL Tier II Bond 'C' FY 2014-15 30-Jan-25 750 7,500
TCFSL Tier II Bond 'B' FY 2014-15 7-Jan-25 350 3,500
TCFSL Tier II Bond 'A' FY 2014-15 26-Sep-24 1,000 10,000
TCL Tier II Bond 'H' FY 2009-10 24-Dec-19 1,000 5,000
TCL Tier II Bond 'G' FY 2009-10 18-Dec-19 3,000 15,000
TCL Tier II Bond 'E' FY 2009-10 15-Dec-19 5,725 28,625
TCL Tier II Bond F FY 2009-10 30-Nov-19 1,135 4,824
TCL Tier II Bond 'D' FY 2009-10 28-Oct-19 1,479 7,395
TCL Tier II Bond 'C' FY 2009-10 28-Oct-19 1,580 7,900
TCL Tier II Bond 'B' FY 2009-10 9-Sep-19 1,704 17,040
TCL Tier II Bond 'A' FY 2009-10 4-Aug-19 391 3,910
181,194
*Net of unamortised discount of Rs.851 lakh
Note : Coupon rate of above outstanding as on March 31, 2018 varies from 8.45% to 10.50%
28-Oct-09
28-Oct-09
9-Sep-09
4-Aug-09
Total
7-Jan-15
26-Sep-14
24-Dec-09
18-Dec-09
15-Dec-09
30-Nov-09
26-Oct-16
11-Aug-16
30-Mar-16
22-Jul-15
31-Mar-15
30-Jan-15
March 6, 2009
Total
Particulars of unsecured redeemable non-convertible subordinated debentures (Tier II Bonds) outstanding as on March
31, 2018
Description of NCDIssue
Date
Total
Description of NCDIssue
Date
March 6, 2009
March 6, 2009
March 6, 2009
Description of NCDIssue
Date
March 6, 2009
March 6, 2009
March 6, 2009
March 6, 2009
149

Redemption
Date
Number of
NCDsRs in Lakh*
TCFSL Tier-II Bond "B" FY 2016-17 26-Oct-26 150 1,500
TCFSL Tier-II Bond "A" FY 2016-17 11-Aug-26 2,000 20,000
TCFSL Tier II Bond 'B' FY 2015-16 30-Mar-26 2,000 20,000
TCFSL Tier II Bond 'A' FY 2015-16 22-Jul-25 900 9,000
TCFSL Tier II Bond 'D' FY 2014-15 31-Mar-25 2,000 20,000
TCFSL Tier II Bond 'C' FY 2014-15 30-Jan-25 750 7,500
TCFSL Tier II Bond 'B' FY 2014-15 7-Jan-25 350 3,500
TCFSL Tier II Bond 'A' FY 2014-15 26-Sep-24 1,000 10,000
TCL Tier II Bond 'H' FY 2009-10 24-Dec-19 1,000 5,000
TCL Tier II Bond 'G' FY 2009-10 18-Dec-19 3,000 15,000
TCL Tier II Bond 'E' FY 2009-10 15-Dec-19 5,725 28,625
TCL Tier II Bond F FY 2009-10 30-Nov-19 1,135 4,376
TCL Tier II Bond 'D' FY 2009-10 28-Oct-19 1,479 7,395
TCL Tier II Bond 'C' FY 2009-10 28-Oct-19 1,580 7,900
TCL Tier II Bond 'B' FY 2009-10 9-Sep-19 1,704 17,040
TCL Tier II Bond 'A' FY 2009-10 4-Aug-19 391 3,910
180,746
*Net of unamortised discount of Rs.1,299 lakh
Note : Coupon rate of above outstanding as on March 31, 2017 varies from 8.45% to 10.50%
5. 9. Particulars of unsecured non-convertible perpetual debentures outstanding as on March 31, 2018
Issue
Date
Number of
NCDsRs in lakh
TCL Perpetual 'A' FY 2010-11 15-Nov-10 15 75
TCL Perpetual 'B' FY 2010-11 14-Jan-11 18 90
TCL Perpetual 'A' FY 2011-12 5-May-11 20 100
TCL Perpetual 'B' FY 2011-12 8-Aug-11 61 305
TCL Perpetual 'C' FY 2011-12 28-Sep-11 10 50
TCL Perpetual 'D' FY 2011-12 7-Nov-11 5 25
TCFSL Perpetual 'A' FY 2013-14 27-Mar-14 1871 9,355
TCFSL Perpetual 'A' FY 2015-16 16-Jul-15 1000 10,000
TCFSL Perpetual 'B' FY 2015-16 6-Jan-16 500 5,000
TCFSL Perpetual 'C' FY 2015-16 2-Feb-16 500 5,000
TCFSL Perpetual 'D' FY 2015-16 9-Feb-16 1000 10,000
TCFSL Perpetual 'E' FY 2015-16 23-Mar-16 1000 10,000
TCFSL Perpetual 'A' FY 2016-17 30-Jun-16 500 5,000
TCFSL Perpetual 'B' FY 2016-17 13-Jan-17 100 1,000
TCFSL Perpetual 'C' FY 2016-17 8-Mar-17 400 4,000
TCFSL Perpetual 'A' FY 2017-18 21-Jun-17 500 5,000
TCFSL Perpetual 'B' FY 2017-18 14-Jul-17 500 5,000
TCFSL Perpetual 'C' FY 2017-18 11-Sep-17 930 9,300
TCFSL Perpetual 'D' FY 2017-18 26-Mar-18 1000 10,000
TCFSL Perpetual 'D' FY 2017-18 26-Mar-18 250 2,500
91,800
Note : Coupon rate of above outstanding as on March 31, 2018 varies from 8.61% to 11.25%
Particulars of unsecured non-convertible perpetual debentures outstanding as on March 31, 2017
Issue
Date
Number of
NCDsRs in lakh
TCL Perpetual A FY 2010-11 15-Nov-10 15 75
TCL Perpetual B FY 2010-11 14-Jan-11 18 90
TCL Perpetual A FY 2011-12 5-May-11 20 100
TCL Perpetual B FY 2011-12 8-Aug-11 61 305
TCL Perpetual C FY 2011-12 28-Sep-11 10 50
TCL Perpetual D FY 2011-12 7-Nov-11 5 25
TCFSL Perpetual A FY 2013-14 27-Mar-14 1871 9,355
TCFSL Perpetual A FY 2015-16 16-Jul-15 1000 10,000
TCFSL Perpetual B FY 2015-16 6-Jan-16 500 5,000
TCFSL Perpetual C FY 2015-16 2-Feb-16 500 5,000
TCFSL Perpetual D FY 2015-16 9-Feb-16 1000 10,000
TCFSL Perpetual E FY 2015-16 23-Mar-16 1000 10,000
TCFSL Perpetual 'A' FY 2016-17 30-Jun-16 500 5,000
TCFSL Perpetual 'B' FY 2016-17 13-Jan-17 100 1,000
TCFSL Perpetual 'C' FY 2016-17 8-Mar-17 400 4,000
60,000
Note : Coupon rate of above outstanding as on March 31, 2017 varies from 9.00% to 11.25%
Total
Description of NCD
Total
Description of NCD
Total
15-Dec-09
30-Nov-09
28-Oct-09
28-Oct-09
9-Sep-09
4-Aug-09
31-Mar-15
30-Jan-15
7-Jan-15
26-Sep-14
24-Dec-09
18-Dec-09
Description of NCDIssue
Date
26-Oct-16
11-Aug-16
30-Mar-16
22-Jul-15
Particulars of unsecured redeemable non-convertible subordinated debentures (Tier II Bonds) outstanding as on March
31, 2017
150

Year Ended
March 31,
2018
Year Ended
March 31,
2017
Funds Raised through Perpetual Debt Instruments 31,800 10,000
Amount outstanding at the end of year 91,800 60,000
18.43% 15.07%
5. 10. Particulars of Privately Placed unsecured non-convertible debentures ("NCDs") outstanding as on March 31, 2018
Issue
Date
Redemption
Date
Number of
NCDsRs in lakh
TCFSL Unsecured NCD A FY 2017-18 27-Jun-17 27-Jun-19 8000 80,000
TCFSL UNSECURED NCD "A" FY 2015-16 12-Aug-15 10-Aug-18 2000 20,000
TCFSL Unsecured NCD B FY 2016-17 27-Apr-16 27-Apr-18 2000 20,000
TCFSL Unsecured NCD A FY 2016-17 25-Apr-16 25-Apr-18 3000 30,000
150,000
Of which current maturities classified under "Current liabilities" in note 10 (70,000)
80,000
Note : Coupon rate of above outstanding as on March 31, 2018 varies from 7.90% to 9.20%
Particulars of Privately Placed unsecured non-convertible debentures ("NCDs") outstanding as on March 31, 2017
Issue
Date
Redemption
Date
Number of
NCDsRs in lakh
TCFSL Unsecured NCD A FY 2015-16 12-Aug-15 10-Aug-18 2000 20,000
TCFSL Unsecured NCD A FY 2016-17 25-Apr-16 25-Apr-18 3000 30,000
TCFSL Unsecured NCD B FY 2016-17 27-Apr-16 27-Apr-18 2000 20,000
TCFSL Unsecured NCD B FY 2015-16 Option-I 1-Sep-15 1-Sep-17 1500 15,000
85,000
Of which current maturities classified under "Current liabilities" in note 10 (15,000)
70,000
Note : Coupon rate of above outstanding as on March 31, 2017 varies from 8.80% to 8.91%
5. 11.
Description of NCD
TOTAL
Total
Unsecured redeemable Non-convertible subordinated debentures includes the debentures issued to Key Management
Personnel of Rs. 20 lakh (Previous Year : Rs. 20 lakh).
Percentage of amount of Perpetual Debt Instruments of the amount of Tier I Capital
Financial year in which interest on Perpetual Debt Instruments is not paid on
account of ‘Lock-In Clause’.N.A.
Description of NCD
TOTAL
Total
Particulars
151

6. OTHER LONG-TERM LIABILITIES
As at
March 31,
2018
As at
March 31,
2017
Rs in lakh Rs in lakh
(a) Interest accrued but not due on borrowings 213 4,317
(b) Income received in advance 173 215
(c) Payable for capital expenditure 205 -
(d) Sundry liabilities account (interest capitalisation) 250 2,487
841 7,019
7. LONG-TERM PROVISIONS
As at
March 31,
2018
As at
March 31,
2017
Rs in lakh Rs in lakh
(a) Provision for employee benefits 962 891
(b) Contingent provision against Standard Assets (Refer note 34) 6,732 5,160
(c) Provision for doubtful loans and credit substitutes 17,993 30,361
(d) Provision for restructured standard assets 108 70
25,795 36,482
PARTICULARS
Total
PARTICULARS
Total
152

8. SHORT-TERM BORROWINGS
As at
March 31,
2018
As at
March 31,
2017
Rs in lakh Rs in lakh
(a) Loans repayable on demand
Secured
From Banks
(i) Working capital demand loan (Refer notes 5.3 above and 8.2 below) 268,000 75,000
(ii) Bank Overdraft (Refer note 5.3 above) 210,934 301,969
Unsecured
From Banks
(i) Working capital demand loan (Refer notes 5.3 above and 8.2 below) 40,000 11,200
(b) Term loans
Secured
From Banks (Refer notes 5.3 and 5.4 above) 10,000 6,000
Unsecured
From Banks (Refer note 5.4 above) 82,500 -
Unsecured
641,363 567,632
33,784 44,829
6,500 -
1,293,081 1,006,630
Notes
8.1. Discount on commercial paper varies between 7.32 % to 8.25% (Previous year : 6.66% to 8.61% )
8.2. Rate of interest payable on WCDL varies between 7.60 % to 8.10% (Previous Year : 7.95 % to 8.70%.)
8.3. Rate of interest payable on Inter-corporate deposits varies between 7.25 % to 8.87% (Previous Year : 8.61 % to 8.87%.)
9. TRADE PAYABLES
As at
March 31,
2018
As at
March 31,
2017
Rs in lakh Rs in lakh
(i) Accrued expenses 18,586 16,170
98 28
33,252 27,422
(iv) Others 561 918
52,497 44,538
9.
As at
March 31,
2018
As at
March 31,
2017
(a) Amounts outstanding but not due as at year end - -
(b) Amounts due but unpaid as at year end - -
(c) Amounts paid after appointed date during the year - -
(d) Amount of interest accrued and unpaid as at year end - -
(e) The amount of further interest due and payable even in the succeeding year - -
- - Total
(ii) Payable to Related Parties
(iii) Payable to Dealers/Vendors
Total
Note - The information as required to be disclosed under the Micro, Small and Medium Enterprises Development Act, 2006 has been determined
to the extent such parties have been identified on the basis of information available with the Company. The amount of principal and interest
outstanding during the year is given below :
(a) Total outstanding dues of micro enterprises and small enterprises
PARTICULARS
(iii) Inter Corporate Deposits from Others (Refer note 8.3 below)
Total
PARTICULARS
PARTICULARS
(c) Other loans and advances
(i) Commercial paper (Refer note 8.1 below)
[Net of unamortised discount of Rs. 12,637 lakh (as at March 31, 2017 : Rs. 9,868 lakh)]
(ii) Inter Corporate Deposits from Related Parties (Refer notes 8.3 below and 31)
153
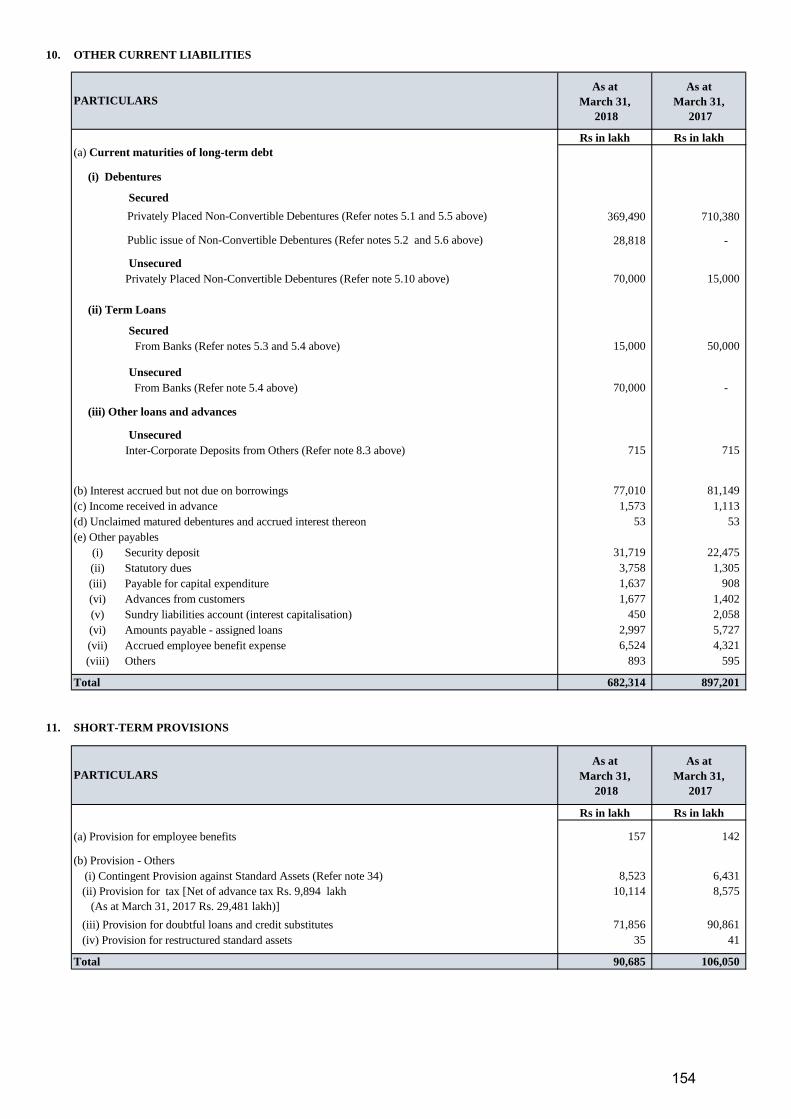
10. OTHER CURRENT LIABILITIES
As at
March 31,
2018
As at
March 31,
2017
Rs in lakh Rs in lakh
(a) Current maturities of long-term debt
(i) Debentures
Secured
369,490 710,380
28,818 -
Unsecured
Privately Placed Non-Convertible Debentures (Refer note 5.10 above) 70,000 15,000
(ii) Term Loans
Secured
From Banks (Refer notes 5.3 and 5.4 above) 15,000 50,000
Unsecured
From Banks (Refer note 5.4 above) 70,000 -
(iii) Other loans and advances
Unsecured
Inter-Corporate Deposits from Others (Refer note 8.3 above) 715 715
(b) Interest accrued but not due on borrowings 77,010 81,149
(c) Income received in advance 1,573 1,113
53 53
(e) Other payables
(i) Security deposit 31,719 22,475
(ii) Statutory dues 3,758 1,305
(iii) Payable for capital expenditure 1,637 908
(vi) Advances from customers 1,677 1,402
(v) Sundry liabilities account (interest capitalisation) 450 2,058
(vi) Amounts payable - assigned loans 2,997 5,727
(vii) Accrued employee benefit expense 6,524 4,321
(viii) Others 893 595
682,314 897,201
11. SHORT-TERM PROVISIONS
As at
March 31,
2018
As at
March 31,
2017
Rs in lakh Rs in lakh
(a) Provision for employee benefits 157 142
(b) Provision - Others
(i) Contingent Provision against Standard Assets (Refer note 34) 8,523 6,431
10,114 8,575
71,856 90,861
35 41
90,685 106,050
(ii) Provision for tax [Net of advance tax Rs. 9,894 lakh
(As at March 31, 2017 Rs. 29,481 lakh)]
(iii) Provision for doubtful loans and credit substitutes
(iv) Provision for restructured standard assets
Total
PARTICULARS
Privately Placed Non-Convertible Debentures (Refer notes 5.1 and 5.5 above)
Public issue of Non-Convertible Debentures (Refer notes 5.2 and 5.6 above)
(d) Unclaimed matured debentures and accrued interest thereon
Total
PARTICULARS
154

12. PROPERTY, PLANT AND EQUIPMENT
(Rs. in lakh)
Net Carrying
Value
Opening balance
as at April 1,
2017
Additions/
AdjustmentsDeletions
Written off
during the year*
Closing balance
as at March 31,
2018
Opening balance
as at April 1,
2017
Depreciation/
Amortisation for
the year
Deletions/
Adjustments
Closing balance
as at March 31,
2018
As at
March 31,
2018
TANGIBLE ASSETS
Buildings 4,975 - - - 4,975 1,298 200 - 1,498 3,477
4,975 - - - 4,975 1,098 200 - 1,298 3,677
Leasehold Improvements 3,554 365 56 - 3,863 1,853 547 46 2,354 1,509
4,191 338 975 - 3,554 2,343 424 914 1,853 1,701
Furniture & Fixtures 1,181 132 25 - 1,288 689 101 18 772 516
1,190 211 220 - 1,181 716 136 163 689 492
Computer Equipment 2,407 982 - - 3,389 789 604 - 1,393 1,996
945 1,579 117 - 2,407 614 292 117 789 1,618
Office Equipment 1,760 210 13 - 1,957 1,278 203 11 1,470 487
1,580 318 138 - 1,760 1,238 155 115 1,278 482
Plant & Machinery 520 4 21 - 503 263 52 16 299 204
668 - 148 - 520 319 64 120 263 257
Vehicles 934 83 128 - 889 482 181 90 573 316
1,000 266 332 - 934 575 209 302 482 452
ASSETS GIVEN UNDER OPERATING LEASE/RENTAL
Construction Equipment 24,047 1,787 7,602 - 18,232 9,748 2,827 3,919 8,656 9,576
22,843 1,435 231 - 24,047 6,905 2,894 51 9,748 14,299
Vehicles 3,497 1,913 2,210 - 3,200 1,916 897 1,266 1,547 1,653
4,769 793 2,065 - 3,497 2,797 798 1,679 1,916 1,581
Plant & Machinery 25,966 12,323 1,453 - 36,836 4,347 6,515 322 10,540 26,296
13,642 12,432 108 - 25,966 2,153 2,214 20 4,347 21,619
Computer Equipment 21,867 3,225 2,431 - 22,661 8,967 7,154 1,894 14,227 8,434
22,812 7,423 8,368 - 21,867 8,222 4,687 3,942 8,967 12,900
Furniture & Fixtures 1,046 123 - - 1,169 212 296 - 508 661
635 411 - - 1,046 126 86 - 212 834
Office Equipments 2,711 204 229 - 2,686 1,466 792 224 2,034 652
2,607 299 195 - 2,711 862 769 165 1,466 1,245
Railway Wagons 16,019 124 - - 16,143 1,186 2,580 - 3,766 12,377
8,265 7,754 - - 16,019 223 963 - 1,186 14,833
Electrical Installation & Equipments 1,176 12 - - 1,188 114 228 - 342 846
289 887 - - 1,176 2 112 - 114 1,062
111,660 21,487 14,168 - 118,979 34,608 23,177 7,806 49,979 69,000
90,411 34,146 12,897 - 111,660 28,193 14,003 7,588 34,608 77,052
Particulars
Gross Block Accumulated depreciation and amortisation
TANGIBLE ASSETS - TOTAL 155

Net Carrying
Value
Opening balance
as at April 1,
2017
Additions/
AdjustmentsDeletions
Written off
during the year*
Closing balance
as at March 31,
2018
Opening balance
as at April 1,
2017
Depreciation/
Amortisation for
the year
Deletions/
Adjustments
Closing balance
as at March 31,
2018
As at
March 31,
2018
Particulars
Gross Block Accumulated depreciation and amortisation
INTANGIBLE ASSETS
(other than internally generated)
Goodwill - - - - - - - - - -
7,804 - - 7,804 - - - - - -
Software 2,228 1,671 50 - 3,849 1,119 460 44 1,535 2,314
1,765 480 17 - 2,228 864 270 15 1,119 1,109
2,228 1,671 50 - 3,849 1,119 460 44 1,535 2,314
9,569 480 17 7,804 2,228 864 270 15 1,119 1,109
113,888 23,158 14,218 - 122,828 35,727 23,637 7,850 51,514 71,314
99,980 34,626 12,914 7,804 113,888 29,057 14,273 7,603 35,727 78,161
Capital work-in-progress 101
518
Intangible Assets under Development 39
655
71,454
79,334
Figures in italics relate to previous year
* Written off pursuant to Reduction of Share Capital (Refer note 40)
Total
INTANGIBLE ASSETS - TOTAL
Total
156

13. INVESTMENTS
Non- Current
Investment
Current portion
of Non-Current
Investment
Non- Current
Investment
Current portion
of Non-Current
Investment
Rs in lakh Rs in lakh Rs in lakh Rs in lakh
LONG-TERM INVESTMENTS (at cost)
Investment in Associates
Unquoted :
Investment in Equity Shares - - 3,313 -
Investment in Security Receipts - - 748 -
Investment in Others
Quoted :
Investment in Equity Shares 20,916 - 16,582 -
Investment in Mutual Fund 50 - 50 -
Unquoted :
Investment in Equity Shares 13,062 - 9,749 -
Investment in Mutual Fund 980 - 980 -
Investment in Security Receipts 395 -
Investment in Preference Shares - - - 90
Sub-total 35,403 - 31,422 90
(4,803) - (5,313) (90)
30,600 - 26,109 -
PARTICULARSAs at March 31,
2018
As at March 31,
2017
Quoted :
Investment in Equity Shares 170 794
Unquoted :
Investment in Equity Shares* 0 0
Total Current Investments 170 794
Non- Current
Investment
Current
Investment
Non- Current
Investment
Current
Investment
Rs in lakh Rs in lakh Rs in lakh Rs in lakh
Total Investments 30,600 170 26,109 794
Book value of Quoted investments (net) 17,776 170 11,833 794
Market value of Quoted investments 14,717 1,362 10,814 802
Book value of Unquoted investments (net) 12,824 - 14,276 -
* Amount less than Rs. 50,000.
As at March 31, 2017
Less: Provision for diminution in value of investments
Total Long-Term Investments
CURRENT INVESTMENTS (At lower of cost and fair value, unless otherwise stated)
TOTAL INVESTMENTS
As at March 31, 2018
As at March 31, 2017
PARTICULARS
As at March 31, 2018
157

Scrip-wise details of Investments:
No. of Units Non- Current
Investments
Current portion
of Non-Current
Investments
No. of Units Non- Current
Investments
Current portion
of Non-Current
Investments
Rs in lakh Rs in lakh Rs in lakh Rs in lakh
LONG-TERM INVESTMENTS
Investments in Associates
Unquoted
Investment in Equity Shares (Non-Trade)
10 - - - 13,946,295 3,313 -
- - 3,313 -
Investment in Security Receipts
1,000 - - - 104,135 748 -
- - 748 -
Investments in Others
Quoted :
Investment in Equity Shares (Non-Trade)
Hindustan Unilever Limited 1 2,000 5 - 2,000 5 -
Praj Industries Limited 2 13,422,400 16,577 - 13,422,400 16,577 -
The New India Assurance company Limited 5 541,688 4,334 - - - -
20,916 - 16,582 -
Investment in units of Mutual Funds
HDFC Debt Fund For Cancer Cure 10 500,000 50 - 500,000 50 -
50 - 50 -
Unquoted :
10 1,396,500 140 - 1,396,500 140 -
10 8 0 - 8 0 -
10 235,992 660 - 235,992 660 -
10 13,946,295 3,313 - - - -
10 2,223,569 3,935 - 2,223,569 3,935 -
TVS Logistics Services Limited 10 217,325 1,465 - 217,325 1,465 -
10 33,931,831 1,028 - 33,931,831 1,028 -
10 155,024 2,521 - 155,024 2,521 -
13,062 - 9,749 -
Investment in Security Receipts
1,000 104,135 395 - - - -
395 - - -
Investment in Preference Shares (Non-Trade)
10 - - - 900,000 - 90
- - - 90
Investment in units of Mutual Funds
Tata Money Market Fund 1,000 39,412 980 - 39,412 980 -
980 - 980 -
(4,803) - (5,313) (90)
Total Long Term Investments 30,600 - 26,109 -
0.001% Share Microfin Limited Optionally Cumulative
Convertible Redeemable Preference Shares
Less: Provision for diminution in value of investments
Varroc Engineering Private Limited
International Asset Reconstruction Company Private Limited
Shriram Properties Private Limited
SKS Ispat & Power Limited
Adithya Automotives Private Limited
Aricent Technologies Holdings Limited *
Fincare Business Services Limited
International Asset Reconstruction Company Private Limited
International Asset Reconstruction Company Private Limited
International Asset Reconstruction Company Private Limited
Investment in Equity Shares (Non-Trade unless otherwise
stated)
As at March 31, 2017
PARTICULARS
Face
value
Per Unit
(in Rs)
As at March 31, 2018
158

No. of Units Rs in lakh Rs in lakh No. of Units Rs in lakh Rs in lakh
CURRENT INVESTMENTS
Quoted :
Investment in Equity Shares (Non-Trade)
3i Infotech Limited 10 23,280,000 1,013 - -
Consolidated Construction Consortium Limited 2 416,472 8 - -
Diamond Power Infra Limited 10 1,631,881 674 1,631,881 674
Gol Offshore Limited 10 644,609 282 644,609 282
IVRCL Limited 2 1,594,857 246 2,223 2,776,522 428 1,384
Less: MTM Provision on Current Investments (2,053) (590)
170 794
Unquoted :
Investment in Equity Shares (Non-Trade)
Coastal Projects Limited 10 4,101,806 410 4,101,806 410
Tata Tele Services Limited * (Refer note 40) 10 62,250,000 0 410 62,250,000 0 410
Less: Provision for dimunition on Current Investment (410) (410)
0 0
Total Current Investments 170 794
PARTICULARS
Non- Current
Investment
Current
Investments
Non- Current
Investment
Current
Investments
Rs in lakh Rs in lakh Rs in lakh Rs in lakh
TOTAL INVESTMENTS 30,600 170 26,109 794
Book value of Quoted investments (net) 17,776 170 11,833 794
Market value of Quoted investments 14,717 1,362 10,814 802
Book value of Unquoted investments (net) 12,824 - 14,276 -
* Amount less than Rs. 50,000.
As at March 31, 2018 As at March 31, 2017
As at March 31, 2017
PARTICULARS
Face
value
Per Unit
(in Rs)
As at March 31, 2018
159

14. DEFERRED TAX ASSET
As at
March 31,
2018
As at
March 31,
2017
Rs in lakh Rs in Lakh
Deferred Tax Asset (net) 37,568 43,483
As at
March 31,
2018
As at
March 31,
2017
Rs in lakh Rs in Lakh
Deferred Tax Assets :-
30,035 41,006
(b) Provision for restructured advances 49 38
(c) Provision for standard assets 5,279 4,011
(d) Employee benefits 331 303
(e) Other deferred tax assets 2,123 1,061
(f) Depreciation on fixed assets 229 -
Deferred Tax Liabilities :-
(a) Debenture issue expenses (478) (518)
(b) Depreciation on fixed assets - (2,418)
37,568 43,483
Particulars
The major components of deferred tax assets and deferred tax liabilities arising out of timing
differences are as under:
Particulars
(a) Deferred tax assets on account of provisions for non-performing
assets
Net Deferred Tax Asset
160
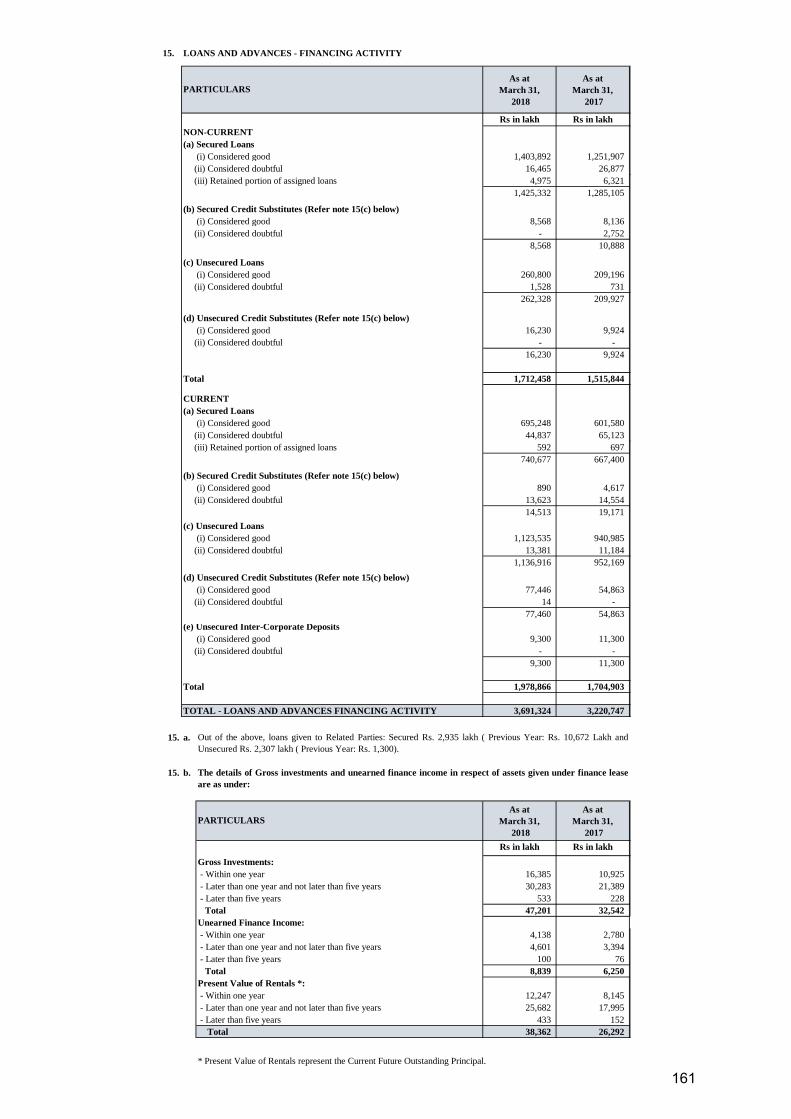
15. LOANS AND ADVANCES - FINANCING ACTIVITY
As at
March 31,
2018
As at
March 31,
2017
A
s
a
t
MRs in lakh Rs in lakh R
s NON-CURRENT
(a) Secured Loans
(i) Considered good 1,403,892 1,251,907
(ii) Considered doubtful 16,465 26,877
(iii) Retained portion of assigned loans 4,975 6,321
1,425,332 1,285,105
(b) Secured Credit Substitutes (Refer note 15(c) below)
(i) Considered good 8,568 8,136
(ii) Considered doubtful - 2,752
8,568 10,888
(c) Unsecured Loans
(i) Considered good 260,800 209,196
(ii) Considered doubtful 1,528 731
262,328 209,927
(d) Unsecured Credit Substitutes (Refer note 15(c) below)
(i) Considered good 16,230 9,924
(ii) Considered doubtful - -
16,230 9,924
Total 1,712,458 1,515,844
CURRENT
(a) Secured Loans
(i) Considered good 695,248 601,580
(ii) Considered doubtful 44,837 65,123
(iii) Retained portion of assigned loans 592 697
740,677 667,400
(b) Secured Credit Substitutes (Refer note 15(c) below)
(i) Considered good 890 4,617
(ii) Considered doubtful 13,623 14,554
14,513 19,171
(c) Unsecured Loans
(i) Considered good 1,123,535 940,985
(ii) Considered doubtful 13,381 11,184
1,136,916 952,169
(d) Unsecured Credit Substitutes (Refer note 15(c) below)
(i) Considered good 77,446 54,863
(ii) Considered doubtful 14 -
77,460 54,863
(e) Unsecured Inter-Corporate Deposits
(i) Considered good 9,300 11,300
(ii) Considered doubtful - -
9,300 11,300
Total 1,978,866 1,704,903
3,691,324 3,220,747
15. a.
15. b.
As at
March 31,
2018
As at
March 31,
2017
A
s
a
t Rs in lakh Rs in lakh R
s Gross Investments:
- Within one year 16,385 10,925
- Later than one year and not later than five years 30,283 21,389
- Later than five years 533 228
Total 47,201 32,542
Unearned Finance Income:
- Within one year 4,138 2,780
- Later than one year and not later than five years 4,601 3,394
- Later than five years 100 76
Total 8,839 6,250
Present Value of Rentals *:
- Within one year 12,247 8,145
- Later than one year and not later than five years 25,682 17,995
- Later than five years 433 152
Total 38,362 26,292
PARTICULARS
TOTAL - LOANS AND ADVANCES FINANCING ACTIVITY
Out of the above, loans given to Related Parties: Secured Rs. 2,935 lakh ( Previous Year: Rs. 10,672 Lakh and
Unsecured Rs. 2,307 lakh ( Previous Year: Rs. 1,300).
The details of Gross investments and unearned finance income in respect of assets given under finance lease
are as under:
PARTICULARS
* Present Value of Rentals represent the Current Future Outstanding Principal.
161

15.c. Scrip-wise details of Credit Substitutes:
No. of Units Non- Current Current No. of Units Non- Current Current
Rs in Lakh Rs in Lakh Rs in Lakh Rs in Lakh
Secured Quoted :
Investment in Bonds and Debentures (Trade)
100,000 - - - 1,700 1,027 -
500,000 1 5 - 1 - 5
1,000,000 1,623 - - 1,623 - -
12.65% Consolidated Construction Consortium Limited 1,000,000 - - - 200 1,840 139
12.90% Godawari Power and Ispat Limited 1,000,000 225 1,363 79 150 - 1,500
9.40% JM Financial Asset Reconstruction Company 1,000,000 - - - 400 4,000 -
9.36% JM Finance CSL NCD 1,000,000 400 4,000 - - - -
10.50% Sattva Realtors Limited 1,000,000 400 3,200 800 - - -
8,568 879 6,867 1,644
Secured Unquoted :
Investment in Debentures (Trade)
9% East Coast Constructions and Industries Limited 1,000 - - - - - 15
11.80% Elder Pharmaceuticals Limited 1,000,000 - - 878 - - 851
13.65% Metropolitan Infrahousing Private Limited - 75 - 7,651 75 - 7,577
5.64% Mandava Holding Private Limited - - - 1 - - 1
8% JL Power Ventures Private Limited 10,000,000 - - - 40 2,800 1,200
14.50% Arohi Infrastructure Private Limited 100 - - 5,092 - - 2,871
- 13,622 2,800 12,515
Investment in Pass Through Certificates
Jindal ITF Limited - Series A to E - - - - - 2,742
- - - 2,742
Add: Interest accrued but not due - 12 1,221 2,271
Total Secured 8,568 14,513 10,888 19,172
Unsecured Quoted : (7,914) (6,489) (8,346) (16,384)
Investment in Bonds and Debentures (Trade)
10.45% IDBI Bank Limited 1,000,000 - - - 50 507 -
10% Indian Overseas Bank Limited 1,000,000 400 4,000 - 400 4,000 -
11.50% TVS Credit Services Limited PDI 500,000 1,647 8,235 - - - -
12,235 - 4,507 -
Unsecured Unquoted :
Investment in Preference Shares (Non-Trade)
Kiri Industries Limited 10 4,333,500 - 433 4,333,500 - 433
100 311,743 1,995 - 533,898 3,417 9
1,995 433 3,417 442
Investment in Debentures (Trade)
10.90% Tata Motor Finance Limited 500,000 400 2,000 - 400 2,000 -
2,000 - 2,000 -
Investment in Pass Through Certificates
Capital DRL Trust NOV B - - - 1,048
Capital DRL Trust DEC B 2016 - - - 4,453
Capital DRL Trust DEC B 2016 - - - 197
Capital DRL Trust JAN B 2017 - - - 529
Capital DRL Trust JAN B 2017 - - - 5,729
Capital DRL Trust FEB B 2017 - - - 4,022
Capital DRL Trust FEB B 2017 - - - 6,811
Capital DRL Trust MARCH C 2017 - - - 434
Capital DRL Trust MARCH B 2017 - - - 2,206
Capital DRL Trust MARCH B 2017 - - - 4,832
Capital DRL Trust MARCH B 2017 TRANCH 2 - - - 1,108
Capital DRL Trust MARCH B 2017 TRANCH 2 - - - 7,147
Capital DRL Trust MARCH B 2017 TRANCH 2 - - - 13,894
Capital DRL Trust MARCH C 2017 TRANCHE 2 - - - 1,883
Capital DRL Trust 003 PTCD 30-03-2018 A - 69 - -
Capital DRL Trust 004 PTCD 30-03-2018 A - 583 - -
Capital DRL Trust 006 PTCD 29-04-2018 A - 818 - -
Capital DRL Trust 1C PTCD 29-04-2018 - 1,515 - -
- 146 - -
Capital DRL Trust JULY C 2017 PTCD 28-11-2017 A - 143 - -
Capital DRL Trust SEPTEMBER END 2017 B PTCD - 403 - -
Capital DRL Trust 007 PTCD 17-03-2018 B - 514 - -
Capital DRL Trust 007 PTCD 31-05-2018 A - 1,391 - -
Capital DRL Trust 2C PTCD 31-05-2018 A - 1,034 - -
Capital DRL Trust 008 PTCD 31-03-2018 A - 13,822 - -
Capital DRL Trust 010 PTCD 30-05-2018 A - 41,238 - -
Capital DRL Trust 009 PTCD 25-05-2018 A - 14,915 - -
- 76,591 - 54,293
Add: Interest accrued but not due - 436 - 127
Total Unsecured 16,230 77,460 9,924 54,862
Grand Total 24,798 91,973 20,812 74,034
(777) 43,894 (7,083) 21,296
McNally Bharath Engineering Co Limited
Capital DRL Trust JULY B TRANCH 2 2017
PTCD 27-01-2018 A
12.75% Diamond Power Infra limited
12.90% Cholamandalam Investment & Finance Company Limited
10.50% Tulip Telecom Limited
PARTICULARS
Face value
Per Unit
Rs
As at Mar 31, 2018 As at Mar 31, 2017
162

16. LONG-TERM LOANS AND ADVANCES - OTHERS (UNSECURED - CONSIDERED GOOD)
As at
March 31,
2018
As at
March 31,
2017
Rs in lakh Rs in lakh
(a) Capital advances 17,452 7,806
(b) Loans and advances to related parties - 249
(c) Security deposits 52 47
6,265 5,818
(e) Others
(i) Loan to TCL Employee Welfare Trust 7,302 7,302
(ii) Prepaid Expenses 155 289
31,226 21,511
17. OTHER NON-CURRENT ASSETS
As at
March 31,
2018
As at
March 31,
2017
Rs in lakh Rs in lakh
963 1,087
(b) Unamortised loan sourcing costs 6,399 5,752
(c) Gratuity Asset (Net) 49 239
(d) Fixed deposit with maturity more than 12 months 25 -
7,436 7,078 Total
PARTICULARS
(d) Advance payment of Income tax [Net of provision for tax Rs. 92,845 lakh
(As at March 31, 2017 Rs. 54,789 lakh)]
Total
PARTICULARS
(a) Deferred revenue expenditure (to the extent not written off or adjusted)
(Refer note 21(a))
163
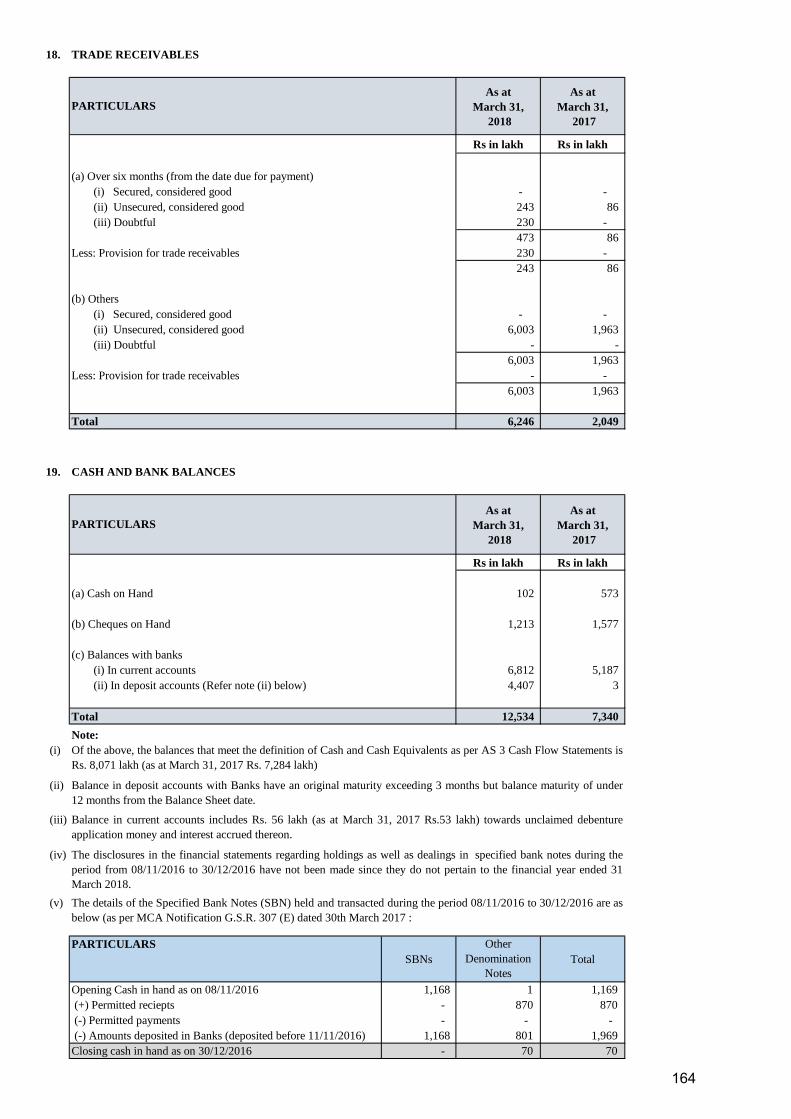
18. TRADE RECEIVABLES
As at
March 31,
2018
As at
March 31,
2017
Rs in lakh Rs in lakh
(a) Over six months (from the date due for payment)
(i) Secured, considered good - -
(ii) Unsecured, considered good 243 86
(iii) Doubtful 230 -
473 86
Less: Provision for trade receivables 230 -
243 86
(b) Others
(i) Secured, considered good - -
(ii) Unsecured, considered good 6,003 1,963
(iii) Doubtful - -
6,003 1,963
Less: Provision for trade receivables - -
6,003 1,963
6,246 2,049
19. CASH AND BANK BALANCES
As at
March 31,
2018
As at
March 31,
2017
Rs in lakh Rs in lakh
(a) Cash on Hand 102 573
(b) Cheques on Hand 1,213 1,577
(c) Balances with banks
(i) In current accounts 6,812 5,187
(ii) In deposit accounts (Refer note (ii) below) 4,407 3
12,534 7,340
Note:
(i)
(ii)
(iii)
(iv)
(v)
SBNs
Other
Denomination
Notes
Total
1,168 1 1,169
- 870 870
- - -
1,168 801 1,969
- 70 70
(+) Permitted reciepts
(-) Permitted payments
(-) Amounts deposited in Banks (deposited before 11/11/2016)
Closing cash in hand as on 30/12/2016
Balance in deposit accounts with Banks have an original maturity exceeding 3 months but balance maturity of under
12 months from the Balance Sheet date.
Balance in current accounts includes Rs. 56 lakh (as at March 31, 2017 Rs.53 lakh) towards unclaimed debenture
application money and interest accrued thereon.
The disclosures in the financial statements regarding holdings as well as dealings in specified bank notes during the
period from 08/11/2016 to 30/12/2016 have not been made since they do not pertain to the financial year ended 31
March 2018.
The details of the Specified Bank Notes (SBN) held and transacted during the period 08/11/2016 to 30/12/2016 are as
below (as per MCA Notification G.S.R. 307 (E) dated 30th March 2017 :
PARTICULARS
Opening Cash in hand as on 08/11/2016
PARTICULARS
Total
PARTICULARS
Total
Of the above, the balances that meet the definition of Cash and Cash Equivalents as per AS 3 Cash Flow Statements is
Rs. 8,071 lakh (as at March 31, 2017 Rs. 7,284 lakh)
164
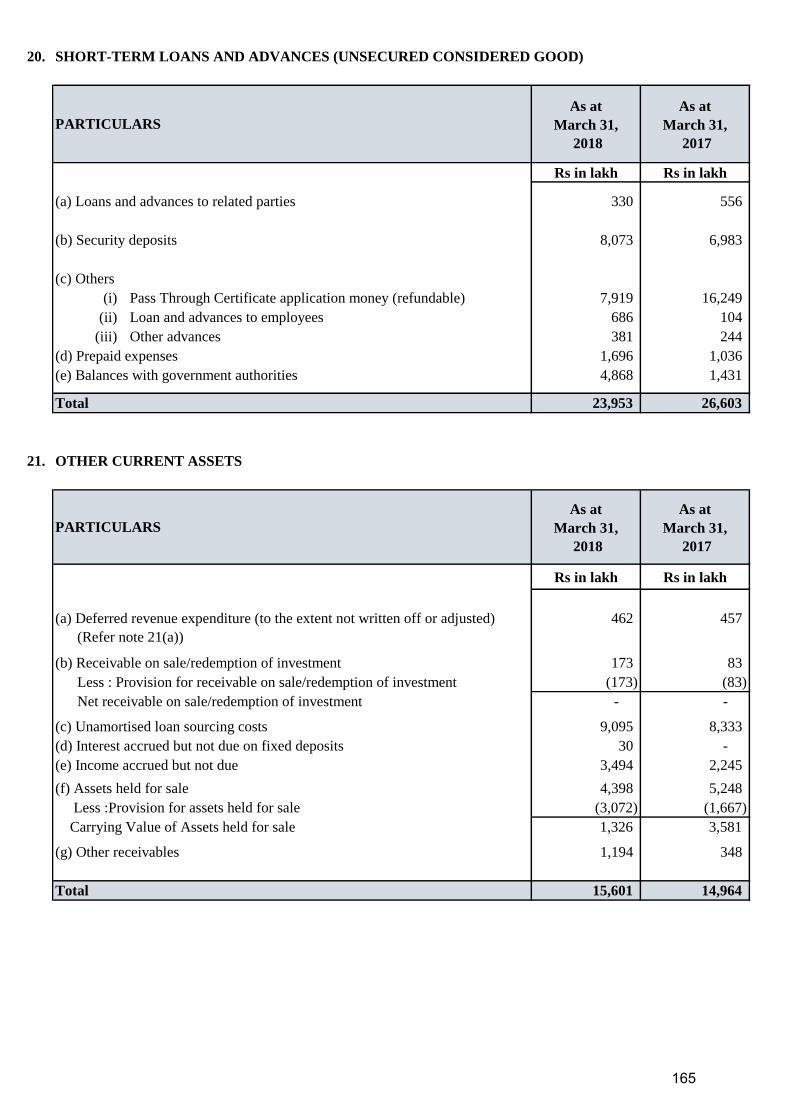
20. SHORT-TERM LOANS AND ADVANCES (UNSECURED CONSIDERED GOOD)
As at
March 31,
2018
As at
March 31,
2017
Rs in lakh Rs in lakh
(a) Loans and advances to related parties 330 556
(b) Security deposits 8,073 6,983
(c) Others
(i) Pass Through Certificate application money (refundable) 7,919 16,249
(ii) Loan and advances to employees 686 104
(iii) Other advances 381 244
(d) Prepaid expenses 1,696 1,036
(e) Balances with government authorities 4,868 1,431
23,953 26,603
21. OTHER CURRENT ASSETS
As at
March 31,
2018
As at
March 31,
2017
Rs in lakh Rs in lakh
462 457
(b) Receivable on sale/redemption of investment 173 83
Less : Provision for receivable on sale/redemption of investment (173) (83)
Net receivable on sale/redemption of investment - -
(c) Unamortised loan sourcing costs 9,095 8,333
(d) Interest accrued but not due on fixed deposits 30 -
(e) Income accrued but not due 3,494 2,245
(f) Assets held for sale 4,398 5,248
Less :Provision for assets held for sale (3,072) (1,667)
Carrying Value of Assets held for sale 1,326 3,581
(g) Other receivables 1,194 348
15,601 14,964
PARTICULARS
Total
PARTICULARS
(a) Deferred revenue expenditure (to the extent not written off or adjusted)
(Refer note 21(a))
Total
165
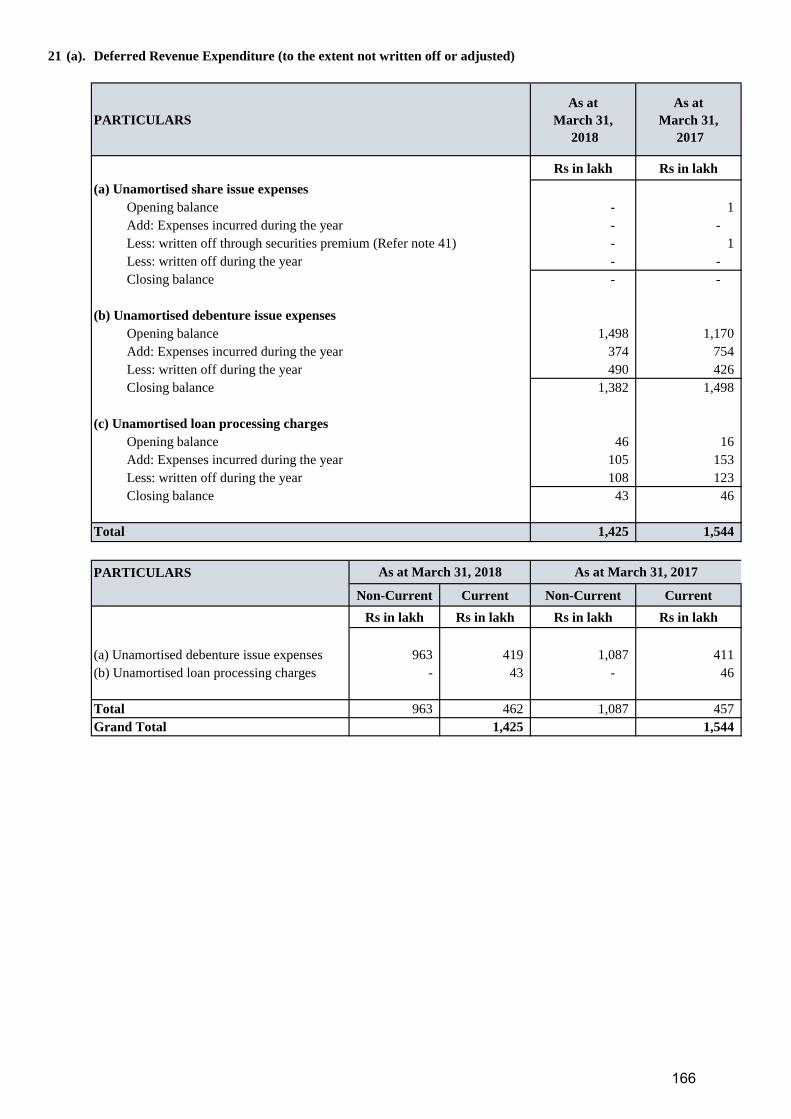
21 (a). Deferred Revenue Expenditure (to the extent not written off or adjusted)
PARTICULARS
As at
March 31,
2018
As at
March 31,
2017
Rs in lakh Rs in lakh
(a) Unamortised share issue expenses
Opening balance - 1
Add: Expenses incurred during the year - -
Less: written off through securities premium (Refer note 41) - 1
Less: written off during the year - -
Closing balance - -
(b) Unamortised debenture issue expenses
Opening balance 1,498 1,170
Add: Expenses incurred during the year 374 754
Less: written off during the year 490 426
Closing balance 1,382 1,498
(c) Unamortised loan processing charges
Opening balance 46 16
Add: Expenses incurred during the year 105 153
Less: written off during the year 108 123
Closing balance 43 46
1,425 1,544
PARTICULARS
Non-Current Current Non-Current Current
Rs in lakh Rs in lakh Rs in lakh Rs in lakh
(a) Unamortised debenture issue expenses 963 419 1,087 411
(b) Unamortised loan processing charges - 43 - 46
Total 963 462 1,087 457
Grand Total 1,425 1,544
Total
As at March 31, 2018 As at March 31, 2017
166

22. REVENUE FROM OPERATIONS
For the Year
Ended
March 31, 2018
For the Year
Ended
March 31, 2017
Rs in lakh Rs in lakh
(a) Interest Income
(i) From secured loans and credit substitutes 250,278 234,127
(ii) From unsecured loans and credit substitutes 129,748 113,911
(b) Income from Bill Discounting 3,832 4,928
(c) Others 36,843 31,694
420,701 384,660
23. INVESTMENT INCOME
For the Year
Ended
March 31, 2018
For the Year
Ended
March 31, 2017
Rs in lakh Rs in lakh
(a) Dividend from Non-current Investments 247 134
(b) Dividend from Current Investments 2 3
(c) Profit on sale of Non-current Investments - 3,278
(d) Profit on sale of Current Investments - 489
(e) Interest on Non-current Investments - 1,644
249 5,548
24. OTHER INCOME
For the Year
Ended
March 31, 2018
For the Year
Ended
March 31, 2017
Rs in lakh Rs in lakh
(a) Income from operating leases 25,555 24,165
(b) Interest Income on Fixed Deposits 30 -
(c) Advertisement income 1,787 555
(d) Income from distribution of financial products 3,745 3,930
(e) Profit on sale of Assets 2,222 68
(f) Interest on Income Tax Refund 307 -
(g) Miscellaneous Income 941 278
34,587 28,996
PARTICULARS
Total
PARTICULARS
Total
PARTICULARS
Total
167
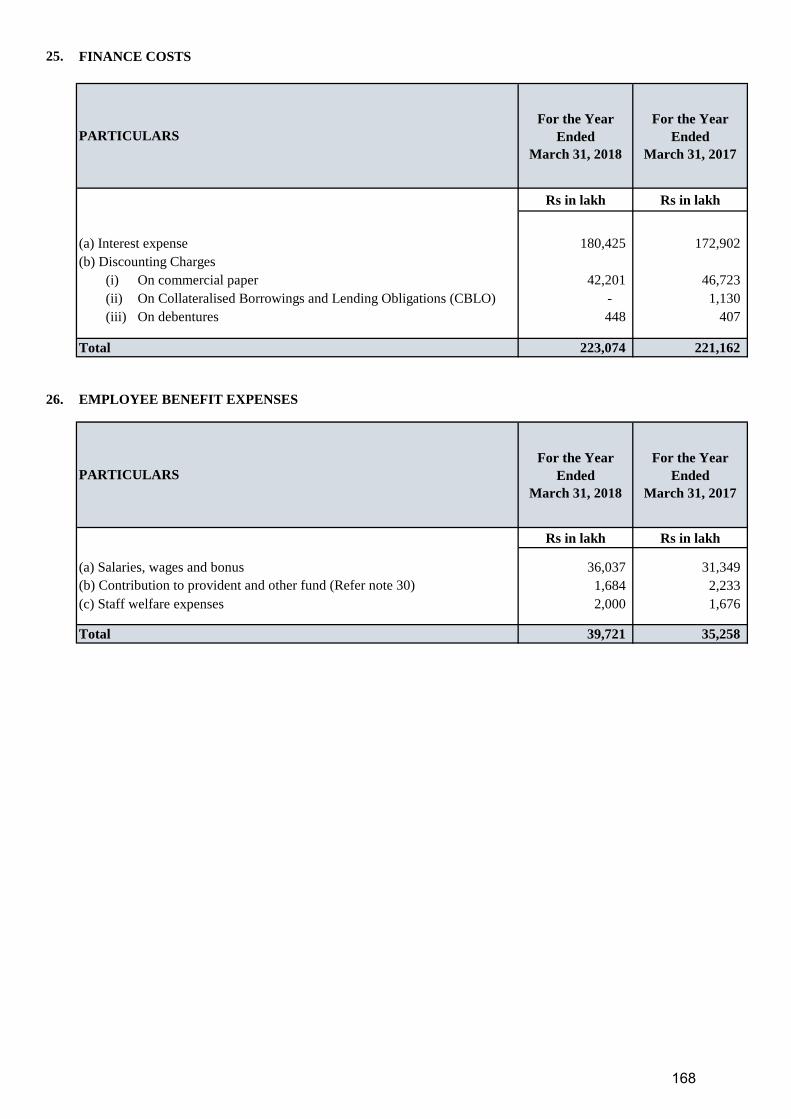
25. FINANCE COSTS
For the Year
Ended
March 31, 2018
For the Year
Ended
March 31, 2017
Rs in lakh Rs in lakh
(a) Interest expense 180,425 172,902
(b) Discounting Charges
(i) On commercial paper 42,201 46,723
(ii) On Collateralised Borrowings and Lending Obligations (CBLO) - 1,130
(iii) On debentures 448 407
223,074 221,162
26. EMPLOYEE BENEFIT EXPENSES
For the Year
Ended
March 31, 2018
For the Year
Ended
March 31, 2017
Rs in lakh Rs in lakh
(a) Salaries, wages and bonus 36,037 31,349
(b) Contribution to provident and other fund (Refer note 30) 1,684 2,233
(c) Staff welfare expenses 2,000 1,676
39,721 35,258
PARTICULARS
Total
PARTICULARS
Total
168

27. OTHER OPERATING EXPENSES
Rs in Lakh Rs in Lakh Rs in lakh Rs in lakh
(a) Advertisements and publicity 2,005 2,186
(b) Brand Equity and Business Promotion 1,243 1,171
(c) Corporate social responsibility cost [Refer note 27(c) below] 1,014 910
(d) Donations 4 3
(e) Equipment hire charges 348 316
(f) Incentive / commission/ brokerage 17,517 13,380
(g) Information technology expenses 8,045 6,544
(h) Insurance charges 744 616
(i) Legal and professional fees 3,867 3,312
(j) Loan processing fees 2,199 1,837
(k) Printing and stationery 783 615
32,575 88,475
- (31,789)
(5,731) 26,844 - 56,686
(m) Write off - Loans and advances 62,501 34,552
Less : Provision reversal on write off (62,501) - (34,552) -
(n) Provision against assets held for sale 1,405 1,378
3,664 3,008
(1,409) (827)
(509) (455)
1463 732
- 1,463 (349) 383
- 14,318
- - (14,318) -
- 7,804
- - (7,804) -
230 -
(v) Power and fuel 905 838
(w) Repairs and maintenance
(i) Buildings 129 66
(ii) Annual maintenance charges 99 239
(iii) Others 174 402 129 434
(x) Rent 2,134 1,910
(y) Rates and taxes 119 133
(z) Stamp charges 502 541
(aa) Service providers' charges 14,045 10,814
(ab) Training and recruitment 510 597
(ac) Telephone, telex and leased line 767 653
(ad) Travelling and conveyance 2,630 2,214
(ae) Loss on sale of Non-current Investments - 1,248
(af) Loss on sale of Current Investments (Net) 60 -
(ag) Amortisation of premium of forward foreign exchange cover 128 -
(ah) Directors remuneration 221 232
(ai) Loss on sale of assets 1,188 3,355
(aj) Other expenses [Refer note 27(a) below] 1,259 683
94,327 114,715 Total
Less : Adjustment pursuant to Reduction of Share
Capital (Refer note 40)
(s) Write-off - Investments
Less : Adjustment pursuant to Reduction of Share
Capital (Refer note 40)
(t) Write-off - Goodwill
Less : Adjustment pursuant to Reduction of Share
Capital (Refer note 40)
(u) Provision for Trade receivables
Less : Delinquency Support
(o) Contingent provision against Standard Assets
(Refer note 34)
(p) Provision against Restructured Advances
(q) Provision for diminution in value of investments
(net of reversals)
(r) Provision on Current Investment
(l) Provision for doubtful loans (net of recoveries)
Less : Adjustment pursuant to Reduction of Share
Capital (Refer note 40)
For the Year Ended
March 31, 2017
For the Year Ended
March 31, 2018PARTICULARS
169

27. (a) Auditors’ Remuneration (excluding taxes):
Particulars
For the Year
Ended
March 31, 2018
For the Year
Ended
March 31, 2017
Rs in lakh Rs in lakh
Audit Fees 106 110
Tax Audit Fees 4 5
Other Services 20 22
Out of Pocket Expenses 1 1
131 138
(Auditors' remuneration is included in Other expenses)
27. (b) Expenditure in Foreign Currency
Particulars
For the Year
Ended
March 31, 2018
For the Year
Ended
March 31, 2017
Rs in lakh Rs in lakh
Legal and professional fees 137 366
Commission paid 79 214
Information Technology Expenses 1,084 74
Training and recruitment 6 28
Other expenses 7 3
1,313 685
27. (c) Corporate social responsibility expenses
(ii) Amount spent during the year on:
Particulars Paid Yet to be paid Total
Rs in lakh Rs in lakh Rs in lakh
Construction/acquisition of any asset - - -
On purposes other than above 1,014 - 1,014
(i) Gross amount required to be spent by the company during the year was Rs. 1,014 lakh (PY. 910 lakh).
170

28. Contingent Liabilities and Commitments:
(i)
(Rs. in lakh)
As at
March 31, 2018
As at
March 31, 2017
1,916 1,786
71 420
(ii) Commitments :-
(a) Undrawn Commitment given to Borrowers
(b) Letter of Credit, Buyers Credit and Other Guarantees Rs. 44,200 lakh (Previous Year : Rs. 29,048 lakh)
(c) Leases entered but not executed Rs. 89,148 lakh (Previous Year : Rs. 66,473 lakh)
(d) Unamortised Forward Contract exposure Rs. 98 lakh (Previous Year : Rs. Nil lakh)
- Tangible: Rs. 1,111 lakh (Previous year : Rs. 817 lakh)
- Intangible: Rs. 199 lakh (Previous year : Rs. 1,459 lakh)
29.
30. Employee benefits
Reconciliation of Benefit Obligations and Plan Assets
(Rs in lakh)
Particulars 2017-18 2016-17
Change in Defined Benefit Obligation
Opening Defined Benefit Obligation 2,926 1,887
Current Service Cost 509 335
Interest Cost 211 148
Acquisitions Cost / (Credit) (25) (106)
Actuarial Losses / (Gain) (77) 816
Benefits Paid (219) (154)
Closing Defined Benefit Obligation 3,326 2,926
Change in the Fair Value of Assets
Opening Fair Value of Plan Assets 3,165 1,580
Transfer in (25) (106)
Expected Return on Plan Assets 253 184
Contributions by Employer - 1,433
Actuarial Gains / (Losses) (19) 74
Benefits paid - -
Closing Fair Value of Plan Assets 3,374 3,165
44% 33%
12% 16%
43% 41%
1% 10%
Total 100% 100%
Government Bonds
Equity of listed entities
Bonds / Debentures
Cash (including Special Deposits)
Defined Benefits Plans
The Company offers its employees defined-benefit plans in the form of a gratuity scheme (a lump sum amount) (included as part of Contribution to provident and other fund
in note 26 Employee Benefit Expenses). Benefits under the defined benefit plans are typically based on years of service and the employee’s compensation (generally
immediately before separation). The gratuity scheme covers all regular employees. Commitments are actuarially determined at year-end. These commitments are valued at
the present value of the expected future payments, with consideration for calculated future salary increases, using a discount rate corresponding to the interest rate estimated
by the actuary having regard to the interest rate on government bonds with a remaining term that is almost equivalent to the average balance working period of employees.
Actuarial valuation is done based on “Projected Unit Credit” method. Gains and losses of changed actuarial assumptions are charged to the Statement of Profit and Loss.
Insurer managed funds:
Employees of the Company may be entitled to Stock Purchase / Stock Options Scheme offered by Tata Capital Limited.
Defined Contribution Plans
The Company makes Provident Fund and Superannuation Fund contributions to defined contribution retirement benefit plans for eligible employees. Under the schemes, the
Company is required to contribute a specified percentage of payroll costs to fund the benefits. The contributions as specified under the law are paid to the provident fund set
up as a Trust by the Company. The Company is generally liable for annual contributions and any deficiency in interest cost compared to interest computed based on the rate
of interest declared by the Central Government under the Employee Provident Scheme, 1952 is recognised as an expense in the year in which it is determined.
The provident fund set up as a Trust by the Company manages the contributions from the Company and other participating subsidiaries. As of March 31, 2018, the
accumulated members' corpus of the Company is Rs. 13,085 lakh whereas the total fair value of the assets of the fund and the total accumulated members’ corpus is Rs.
21,026 lakh and Rs. 20,658 lakh respectively. In accordance with an actuarial valuation, there is no deficiency in the interest cost as the present value of the expected future
earnings on the fund is greater than the expected amount to be credited to the individual members based on the expected guaranteed rate of interest of 8.55%. The actuarial
assumptions include discount rate of 7.70%.
The Company recognised a charge of Rs. 1,189 lakh (Previous year Rs. 1,089 lakh) for provident fund and family pension fund contribution and Rs. 89 lakh (Previous year
Rs. 97 lakh) for contribution towards the superannuation fund in the Statement of Profit and Loss.
Employee Stock Purchase/Option Scheme
Less than 1 Year: Rs. 165,763 lakh (Previous Year: Rs. 178,908 lakh)
More than 1 Year: Rs. 47,101 lakh (Previous Year: Rs. 32,676 lakh)
(e) Estimated amount of contracts remaining to be executed on capital account and not provided for Rs.1,310 lakh
(as at March 31, 2017: Rs. 2,276 lakh).
Contingent Liabilities :-
Claims not acknowledged by the Company relating to cases contested by the Company and which are not likely to be devolved on the Company relating to the
following areas :
Particulars
Income Tax (Pending before Appellate authorities)
VAT (Pending before Appellate authorities)
As on March 31, 2018 Rs. 212,864 lakh (Previous Year: Rs. 211,584 lakh)
171

Particulars 2017-18 2016-17
Reconciliation of present value of the obligation and the fair value of the plan assets
Fair value of plan assets at the end of the year 3,374 3,165
Present value of the defined obligations at the end of the year 3,326 2,926
Funded status Surplus 49 239
Net Asset recognised in the Balance Sheet 49 239
Net Gratuity cost for the year ended March 31, 2018
Service Cost 509 335
Interest on Defined benefit Obligation 211 148
Expected return on plan assets (253) (184)
Net actuarial loss recognised in the year (58) 742
Net Gratuity Cost 409 1,041
Actual contribution and benefit payments for the year
Actual benefit payments (219) (154)
Actual contributions - 1,433
Categorization of plan assets is as follows
Investment Pattern 2017-18 2016-17
Assumptions
Discount Rate 7.70% 7.50%
Expected Rate of Return on Plan Assets 8.00% p.a 8.00% p.a
Salary Escalation Rate7.50% p.a for first 5
years and 6%
thereafter.
7.50% p.a for first 5
years and 6%
thereafter.
Mortality RateIndian Assured Lives
Mortality (2006-08)
(modified) Ult.
Indian Assured Lives
Mortality (2006-08)
(modified) Ult.
Withdrawal Rate 0-2 years - 10%
3-4 years - 5%
5-9 years - 2.5%
10 years & more -
1%
0-2 years - 10%
3-4 years - 5%
5-9 years - 2.5%
10 years & more - 1%
Experience History 2017-18 2016-17 2015-16 2014-15 2013-14
Present value of Defined Benefit Obligation (3,326) (2,926) (1,887) (1,571) (1,026)
Fair value of Plan Assets 3,374 3,165 1,580 1,506 946
Excess of (obligation over plan assets) 49 239 (307) (65) (80)
Experience Gain/ (Loss) Adjustment :
- On Plan Liabilities 34 (313) (228) (41) (96)
- On Plan Assets (19) 74 (90) 148 16
Acturial Gain / (Loss) due to change in assumptions 44 (503) 54 (279) 116
Long Term Service Award :
The estimate of future salary increase, considered in the actuarial valuation, takes into account inflation, seniority, promotion, and other relevant factors. The above
information is certified by the actuary.
The Company expects to contribute approximately Nil (Previous year Rs. 484 lakh) to the gratuity fund for the year 2018-19.
Long Term Service award is an employee benefit in recognition for their loyalty and continuity of service for five years and above, the same is actuarially valued (unfunded).
The Long Term Service awards expense for financial year 2017-18 is Rs. 6 lakh (Previous year Rs. 51 lakh) and the provision as at March 31, 2018 is Rs. 164 lakh (Previous
year Rs. 158 lakh).
172

31. Disclosure as required by Accounting Standard (AS) – 18 on “Related Party Disclosures”
i. List of related parties and relationship :-
Ultimate Holding Company Tata Sons Limited
Holding Company Tata Capital Limited
Fellow Subsidiaries Tata Securities Limited
(with which the company had transactions) Tata Capital Pte. Limited
Tata Capital Advisors Pte Limited
Tata Capital Markets Pte Limited
Tata Capital General Partners LLP
Tata Capital Healthcare General Partners LLP
Tata Opportunities General Partners LLP
Tata Capital Plc
Tata Capital Housing Finance Limited
TC Travel and Services Limited (ceased to be subsidiary w.e.f. October 30, 2017)
Tata Capital Forex Limited (ceased to be subsidiary w.e.f. October 30, 2017)
Tata Cleantech Capital Limited
Subsidiaries of ultimate holding company
(with which the company had transactions)
Tata Consultancy Services Limited
Tata AIG General Insurance Company Limited
Tata AIA Life Insurance Company Limited
Infiniti Retail Limited
Tata Consulting Engineers Limited
Tata Housing Development Company Limited
Tata Asset Management Limited
Calsea Footwear Private Limited
Automotive Stamping and Assemblies Limited
Taj Air Limited
Tata Advanced Systems Limited
Tata Industries Limited
Tata Lockheed Martin Aerostructures Limited
Tata Teleservices Limited
Tata Teleservices (Maharashtra) Limited
MMP Mobi Wallet Payment Systems Limited
Ardent Properties Private Limited
Inshaallah Investments Limited
Sector 113 Gatevida Developers Private Limited
Associates
Key Management Personnel Mr. Praveen P Kadle - Managing Director & CEO
Conneqt Business Solutions Limited (formerly known as Tata Business Support Services Limited) (ceased to be
subsidiary w.e.f. November 17, 2017)
International Asset Reconstruction Company Private Limited (ceased to be an associate with effect from 9th
March 2018)
173
ii. Transactions with related parties :
(Rs in lakh)
Sr.
No.
Party Name Nature of transaction 2017-18 2016-17
1 Tata Sons Limited a) Expenses :
- Brand Equity and Business Promotion 1,243 1,171
- Rent 29 26
- Other charges 51 47
b) Income :
- Lease Income 6 8
c) Finance Lease Facility :
- Facility given during the year - 65
- Repaid during year 8 7
- Outstanding facility 50 58
d) Asset :
- Security deposit receivable - 12
- Security deposit refund received 12 -
- Balance receivable 5 16
e) Liability :
- Balance Payable 1,243 1,171
2 Tata Capital Limited a) Expenses :
- Interest expenses on Inter-Corporate Deposit 6,747 4,622
- Interest expenses on debentures 89 1,124
- Rent 1,036 1,203
- Marketing & managerial service fee 2,657 1,445
- Other Expenses 111 -
b) Income :
- Preference share arranger fees 515 435
- Reimbursement of Rent & Guest house expenses 41 42
- Fixed Asset transfer* 0 -
c) Amount raised by issue of Perpetual Non-Convertible debentures 12,500 -
d) Amount raised by issue of Compulsory Convertible Cumulative Preference
Shares
57,500 78,500
e) Interim dividend paid
- Equity Shares 4,541 5,839
- Preference Shares 8,726 4,230
f) Inter-Corporate Deposit accepted / repaid during the year
- Inter-Corporate Deposit received during year 463,617 693,970
- Inter-Corporate Deposit repaid during year 474,662 699,693
g) Security Deposit accepted / repaid during the year
- Security deposit given 5,849 -
- Security deposit received 4,667 -
h) Asset :
- Security Deposit Receivable 5,847 4,665
- Balance Receivable - 61
i) Liability :
- Inter-Corporate Deposit Payable 33,784 44,829
- Borrowings - Perpetual Non-Convertible debentures 12,500 5,000
- Balance Payable 374 -
3 Tata Securities Limited a) Expenses :
- Reimbursement of expenses 1 -
- Services Received 20 7
b) Income :
- Reimbursement of expenses - Rent & Others 49 138
c) Transfer of Fixed Assets (Purchase) 1 1
d) Asset :
- Balance Receivable 1 28
4 Tata Capital Pte. Limited a) Income :
- Income- SLA fees 13 13
- Reimbursement of expenses 10 10
b) Asset :
Balance Receivable 13 13
5 Tata Capital Advisors Pte Limited a) Income :
- Income- SLA fees 7 7
- Reimbursement of expenses 3 3
b) Asset :
Balance Receivable 7 7
6 Tata Capital Markets Pte Limited a) Income :
- Income- SLA fees 7 7
- Reimbursement of expenses 3 3
b) Asset :
- Balance Receivable 7 7
174
Sr.
No.
Party Name Nature of transaction 2017-18 2016-17
7 Tata Capital General Partners LLP a) Income :
- Income- SLA fees * 0 0
- Reimbursement of expenses 1 1
b) Asset :
- Balance Receivable * 0 0
8 Tata Capital Healthcare General Partners LLP a) Income :
- Income- SLA fees * 0 0
- Reimbursement of expenses 1 1
b) Asset :
- Balance Receivable * 0 0
9 Tata Opportunities General Partners LLP a) Income :
- Income- SLA fees * 0 0
- Reimbursement of expenses 1 1
b) Asset :
- Balance Receivable * 0 0
10 Tata Capital Plc a) Income :
- SLA fees 7 7
- Reimbursement of expenses 3 8
b) Asset :
- Balance Receivable 7 7
11 Tata Capital Housing Finance Limited a) Expenses :
- Sourcing Fee 1 6
- Rent & others 31 42
b) Income :
- Loan Sourcing Fee - 43
- Reimbursement of Rent & Other expenses 988 1,113
- Interest income on Tier II investment * - 0
c) Fixed Asset :
- Fixed Asset Purchased * 0 14
- Fixed Asset Sold 25 -
d) Asset :
- Balance Receivable 121 235
12 TC Travel and Services Limited a) Expenses :
-Travel related services 492 715
-Others - 35
b) Income :
- Reimbursement of Rent & Other expenses 55 106
c) Asset :
- Balance Receivable - 264
13 Tata Capital Forex Limited a) Income :
- Reimbursement of Rent & Other expenses 63 124
b) Expenses :
- Travel related services 4 9
c) Asset :
- Balance Receivable - 38
14 Tata Cleantech Capital Limited a) Expenses :
- Advisory Fees - 5
- Guest house expenses 23 13
- Management Fee - -
b) Income :
- Reimbursement of Rent & Other expenses 136 238
c) Fixed Asset transfer 1 -
d) Asset :
- Balance Receivable 6 16
15 Conneqt Business Solutions Limited a) Expenses :
(formerly known as Tata Business Support Services
Limited)
- Service Provider Charges 4,374 6,770
b) Income :
- Lease Income 453 512
- Processing Fee - 2
- Syndication Fee - -
- Reimbursement of Expenses 96 173
- Interest Income on Loan 14 122
c) Finance Lease Facility :
- Facility given during the year - -
- Repaid during year - 85
- Outstanding facility - 924
d) Asset :
- Loan Outstanding - 322
- Loan repaid during the year - 997
- Lease Debtors - 2
e) Liability :
- Security Deposit - 37
- Balance Payable - 896
175
Sr.
No.
Party Name Nature of transaction 2017-18 2016-17
16 Tata Consultancy Services Limited a) Expenses :
- Information technology expenses 5,511 4,721
b) Income :
- Lease Income 16 -
- Reimbursement of expenses - 4
c) Finance Lease Facility :
- Facility given during the year 217 -
- Repaid during year 6 -
- Outstanding facility 211 -
d) Fixed Assets Purchased 8 385
e) Asset :
- Balance Receivable - 4
f) Liability :
- Balance Payable 1,620 1,330
17 Tata AIG General Insurance Company Limited a) Expenses :
- Insurance Expenses 6 12
b) Income :
- Insurance related revenue 541 445
c) Asset :
- Balance Receivable 511 70
18 Tata AIA Life Insurance Company Limited a) Expenses :
- Insurance Expense for Employees 36 33
b) Income :
- Insurance related revenue 52 36
c) Asset :
- Balance Receivable 36 35
19 Infiniti Retail Limited a) Expenses :
- Incentive & others 904 726
b) Fixed Assets purchased 1 4
c) Income :
- Lease Income 210 132
- Processing fees 2 2
d) Liability :
- Security deposit payable 75 74
- Balance payable 11 -
e) Asset :
- Balance Receivable - 1
20 Tata Consulting Engineers Limited a) Income :
- Interest Income - 93
b) Asset :
- Inter-Corporate Deposit given during the year - 1,000
- Inter-Corporate Deposit repaid during the year - 2,000
21 Tata Housing Development Company Limited a) Income :
- Referral Fee 5 25
b) Asset :
- Balance Receivable - 14
22 International Asset Reconstruction Company Private
Limited
a) Redemption of Security Receipts during the year 353 236
b) Asset :
- Balance of Security Receipts - 748
23 Tata Asset Management Limited a) Income :
- Portfolio Management Service 17 17
b) Asset :
Balance Receivable - 3
24 Calsea Footwear Private Limited a) Income :
- Interest income on Inter-Corporate Deposit 141 124
b) Asset :
- Inter-Corporate Deposit given during the year 1,500 1,300
- Inter-Corporate Deposit repaid during the year 1,300 1,100
- Interest Accrued 38 35
- Outstanding Inter-Corporate Deposit 1,500 1,300
25 Automotive Stamping And Assemblies Limited a) Income :
- Term Loan - Interest 242 188
- Lease Rental 62 62
- Processing Fees 6 -
b) Asset :
- Loan given during the year 4,900 -
- Loan repaid during the year 3,950 240
- Outstanding loan 2,584 1,634
- Interest receivable 16 2
c) Liability :
- Balance in escrow account 35 -
176
Sr.
No.
Party Name Nature of transaction 2017-18 2016-17
26 Taj Air Limited a) Income :
- Term Loan - Interest 29 517
b) Asset :
- Loan given during the year - 2,500
- Loan repaid during the year 6,000 -
- Outstanding loan - 6,000
- Interest receivable - 39
27 Tata Advanced Systems Limited a) Income :
- Interest Income 7 3
- Interim Rent * - 0
b) Finance Lease Facility :
- Facility given during the year 33 30
- Repaid during year 16 4
- Outstanding facility 52 35
c) Asset :
- Balance receivable* 2 0
28 Tata Industries Limited a) Income :
- Lease Income 1,118 1,234
- Sale of Assets 49 6
b) Expenses :
- Project Expenses 22 47
c) Finance Lease Facility :
- Facility given during the year 13 199
- Repaid during year 155 327
- Outstanding facility 216 358
d) Asset :
- Balance Receivable 119 7
e) Liability :
- Balance Payable - 248
29 Tata Lockheed Martin Aerostructures Limited a) Income :
- Lease Income 1 1
b) Finance Lease Facility :
- Facility given during the year - -
- Repaid during year 2 9
- Interest Receivable* 0 0
- Outstanding facility 4 6
30 Tata Teleservices Limited a) Income :
- Lease Income 748 277
b) Expenses :
- Communication Expenses 111 31
- Rent Expenses 25 4
c) Finance Lease Facility :
- Facility given during the year 145 1,235
- Repaid during year 854 555
- Outstanding facility 625 1,333
d) Asset :
- Security Deposit Premises 8 8
- Advances paid to vendors towards lease facility - 37
- Balance receivable - 1
e) Liability :
- Balance payable 43 -
31 Tata Teleservices (Maharashtra) Limited a) Income :
- Lease Income 71 2
b) Expenses :
- Communication Expenses 277 101
c) Liability :
- Balance payable 10 -
32 MMP Mobi Wallet Payment Systems Limited a) Income :
- Lease Income 4 -
b) Asset :
- Balance receivable - -
33 Ardent Properties Private Limited a) Income :
- Commission received - 8
b) Asset :
- Balance receivable - 10
34 Inshaallah Investments Limited a) Income :
- Reimbursement of expenses* 0 -
b) Asset :
- Balance receivable* 0 -
35 Sector 113 Gatevida Developers Private Limited a) Income :
- Commission received 8 -
36 Key Management Personnel Expenses : Interest on Non – convertible debentures 2 2
Liability : Outstanding Debentures 20 20
177
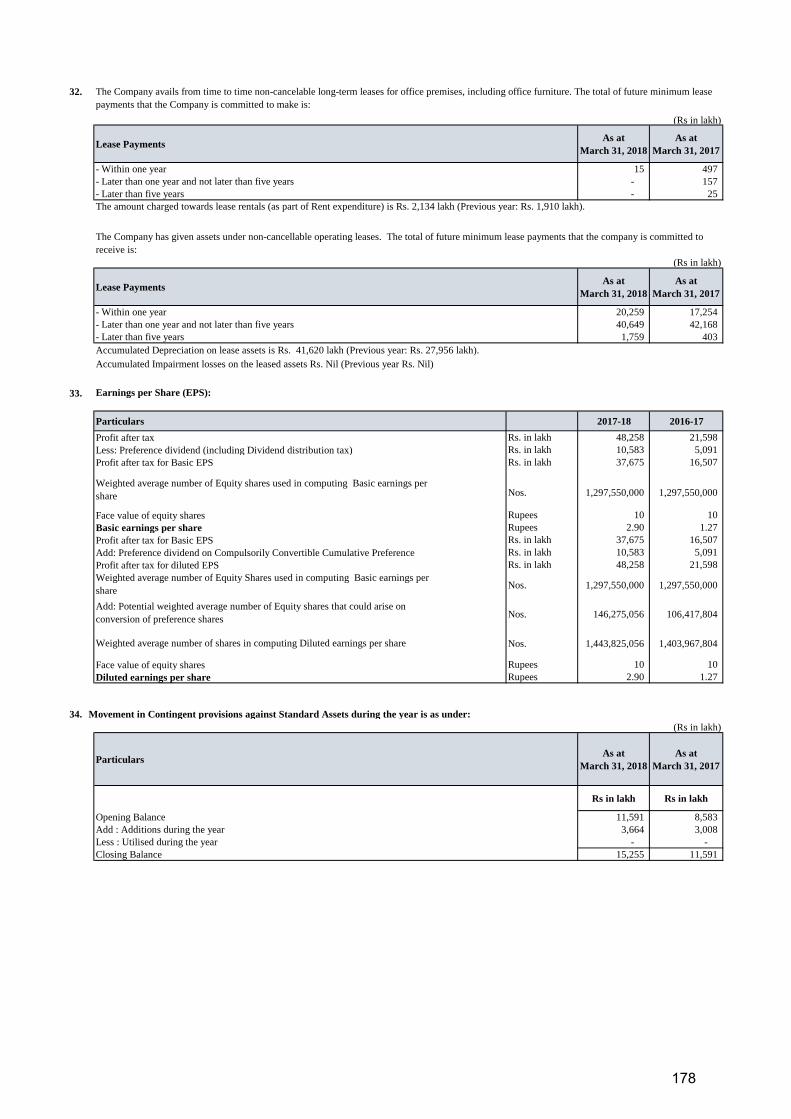
32.
(Rs in lakh)
Lease PaymentsAs at
March 31, 2018
As at
March 31, 2017
- Within one year 15 497
- Later than one year and not later than five years - 157
- Later than five years - 25
(Rs in lakh)
Lease PaymentsAs at
March 31, 2018
As at
March 31, 2017
- Within one year 20,259 17,254
- Later than one year and not later than five years 40,649 42,168
- Later than five years 1,759 403
33. Earnings per Share (EPS):
Particulars 2017-18 2016-17
Rs. in lakh 48,258 21,598
Rs. in lakh 10,583 5,091
Rs. in lakh 37,675 16,507
Nos. 1,297,550,000 1,297,550,000
Rupees 10 10
Rupees 2.90 1.27
Rs. in lakh 37,675 16,507
Rs. in lakh 10,583 5,091
Rs. in lakh 48,258 21,598
Nos. 1,297,550,000 1,297,550,000
Nos. 146,275,056 106,417,804
Nos. 1,443,825,056 1,403,967,804
Rupees 10 10
Rupees 2.90 1.27
34. Movement in Contingent provisions against Standard Assets during the year is as under:
(Rs in lakh)
ParticularsAs at
March 31, 2018
As at
March 31, 2017
Rs in lakh Rs in lakh
Opening Balance 11,591 8,583
Add : Additions during the year 3,664 3,008
Less : Utilised during the year - -
Closing Balance 15,255 11,591
Face value of equity shares
Diluted earnings per share
Add: Preference dividend on Compulsorily Convertible Cumulative Preference
Profit after tax for diluted EPS
Weighted average number of Equity Shares used in computing Basic earnings per
share
Add: Potential weighted average number of Equity shares that could arise on
conversion of preference shares
Weighted average number of shares in computing Diluted earnings per share
Less: Preference dividend (including Dividend distribution tax)
Profit after tax for Basic EPS
Weighted average number of Equity shares used in computing Basic earnings per
share
Face value of equity shares
Basic earnings per share
Profit after tax for Basic EPS
The Company avails from time to time non-cancelable long-term leases for office premises, including office furniture. The total of future minimum lease
payments that the Company is committed to make is:
The amount charged towards lease rentals (as part of Rent expenditure) is Rs. 2,134 lakh (Previous year: Rs. 1,910 lakh).
The Company has given assets under non-cancellable operating leases. The total of future minimum lease payments that the company is committed to
receive is:
Accumulated Depreciation on lease assets is Rs. 41,620 lakh (Previous year: Rs. 27,956 lakh).
Accumulated Impairment losses on the leased assets Rs. Nil (Previous year Rs. Nil)
Profit after tax
178
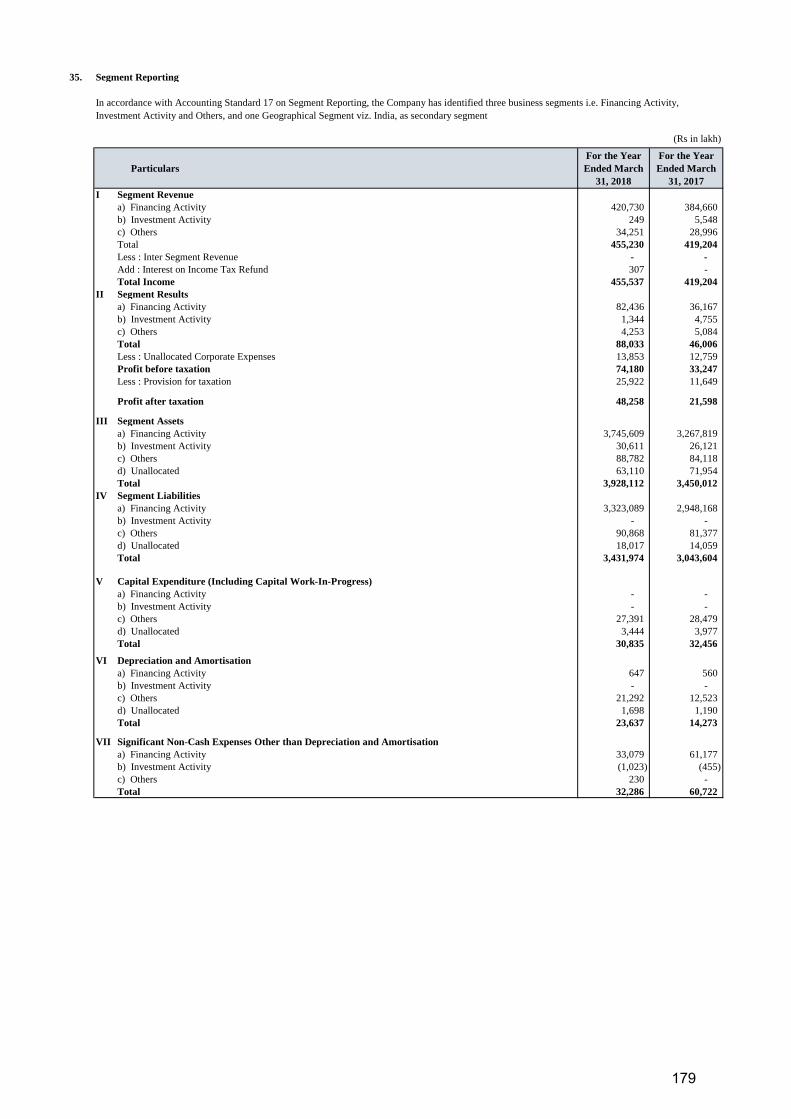
35. Segment Reporting
(Rs in lakh)
Particulars
For the Year
Ended March
31, 2018
For the Year
Ended March
31, 2017
I Segment Revenue
a) Financing Activity 420,730 384,660
b) Investment Activity 249 5,548
c) Others 34,251 28,996
Total 455,230 419,204
Less : Inter Segment Revenue - -
Add : Interest on Income Tax Refund 307 -
Total Income 455,537 419,204
II Segment Results
a) Financing Activity 82,436 36,167
b) Investment Activity 1,344 4,755
c) Others 4,253 5,084
Total 88,033 46,006
Less : Unallocated Corporate Expenses 13,853 12,759
Profit before taxation 74,180 33,247
Less : Provision for taxation 25,922 11,649
Profit after taxation 48,258 21,598
III Segment Assets
a) Financing Activity 3,745,609 3,267,819
b) Investment Activity 30,611 26,121
c) Others 88,782 84,118
d) Unallocated 63,110 71,954
Total 3,928,112 3,450,012
IV Segment Liabilities
a) Financing Activity 3,323,089 2,948,168
b) Investment Activity - -
c) Others 90,868 81,377
d) Unallocated 18,017 14,059
Total 3,431,974 3,043,604
V Capital Expenditure (Including Capital Work-In-Progress)
a) Financing Activity - -
b) Investment Activity - -
c) Others 27,391 28,479
d) Unallocated 3,444 3,977
Total 30,835 32,456
VI Depreciation and Amortisation
a) Financing Activity 647 560
b) Investment Activity - -
c) Others 21,292 12,523
d) Unallocated 1,698 1,190
Total 23,637 14,273
VII Significant Non-Cash Expenses Other than Depreciation and Amortisation
a) Financing Activity 33,079 61,177
b) Investment Activity (1,023) (455)
c) Others 230 -
Total 32,286 60,722
In accordance with Accounting Standard 17 on Segment Reporting, the Company has identified three business segments i.e. Financing Activity,
Investment Activity and Others, and one Geographical Segment viz. India, as secondary segment
179

36. Capital to Risk Assets Ratio (CRAR)
Particulars
As at
March 31,
2018
As at
March 31,
2017
CRAR (%) 16.68% 16.07%
CRAR – Tier I Capital (%) 12.68% 11.78%
CRAR – Tier II Capital (%) 4.00% 4.29%
Amount of subordinated debt raised as Tier-II Capital - 21,500
Amount rasied by issue of Perpetual Debt Instruments 31,800 10,000
37. Asset Liability Management
Maturity pattern of certain items of Assets and Liabilities.
For the Financial year 2017-18
(Rs in lakh)
ParticularsBorrowings
from Banks
Market
Borrowings
Foreign
Currency
Borrowings
Advances Investments
Foreign
Currency
Assets
1 day to 30/31 days (One month) 149,000 187,417 - 259,927 - -
Over One months to 2 months 109,000 287,325 - 393,888 - -
Over 2 months upto 3 months 90,000 204,425 - 379,495 - -
Over 3 months to 6 months 217,500 103,968 - 283,556 - -
Over 6 months to 1 year 270,917 392,552 - 498,225 170 -
Over 1 year to 3 years 109,500 752,626 - 961,149 - -
Over 3 years to 5 years - 59,980 - 286,410 - -
Over 5 years - 199,655 - 538,682 30,600 -
Total 945,917 2,187,948 - 3,601,332 30,769 -
Assets and liabilities bifurcation into various buckets is based on RBI guidelines.
For the Financial year 2016-17
(Rs in lakh)
ParticularsBorrowings
from Banks
Market
Borrowings
Foreign
Currency
Borrowings
Advances Investments
Foreign
Currency
Assets
1 day to 30/31 days (One month) 176,200 136,790 - 550,181 - -
Over One months to 2 months - 322,860 - 321,990 - -
Over 2 months upto 3 months 10,000 285,270 - 248,936 - -
Over 3 months to 6 months 46,000 158,402 - 281,963 - -
Over 6 months to 1 year 311,995 455,694 - 420,777 - -
Over 1 year to 3 years 60,000 520,583 - 741,676 17,168 -
Over 3 years to 5 years - 71,045 - 282,018 - -
Over 5 years - 173,570 - 251,875 9,735 -
Total 604,195 2,124,214 - 3,099,416 26,903 -
38.
Liabilities Side: (Rs in lakh)
As at
March 31,
2018
As at
March 31,
2017
As at
March 31,
2018
As at
March 31,
2017
a) Debentures:
(other than those falling within the meaning of Public deposit)
(i) Secured 1,136,968 1,255,995 - -
(ii) Unsecured 445,232 339,114 - -
b) Deferred Credits - - - -
c) Term Loans 427,008 216,070 - -
d) Inter-Corporate loans and borrowing 41,113 45,606 - -
e) Commercial Paper 641,363 567,632 - -
f) Other loans (Collateralised Borrowings and Lending Obligations (CBLO)) - -
g) Loan from Bank
- Working Capital Demand Loan 308,469 87,490 - -
- Overdraft 210,934 301,969 - -
1) Loans and advances availed by NBFC inclusive of interest accrued thereon
but not paid
Liabilities Assets
Liabilities Assets
Disclosure of details as required by Revised Para 18 of the Non Banking Financial Company - Systemically Important Non-Deposit taking Company and
Deposit taking Company (Reserve Bank) Directions, 2016, earlier Para 13 of Non Banking Financial Companies Prudential Norms (Reserve Bank)
Directions, 2007.
Particulars
Amount Outstanding Amount Overdue
180
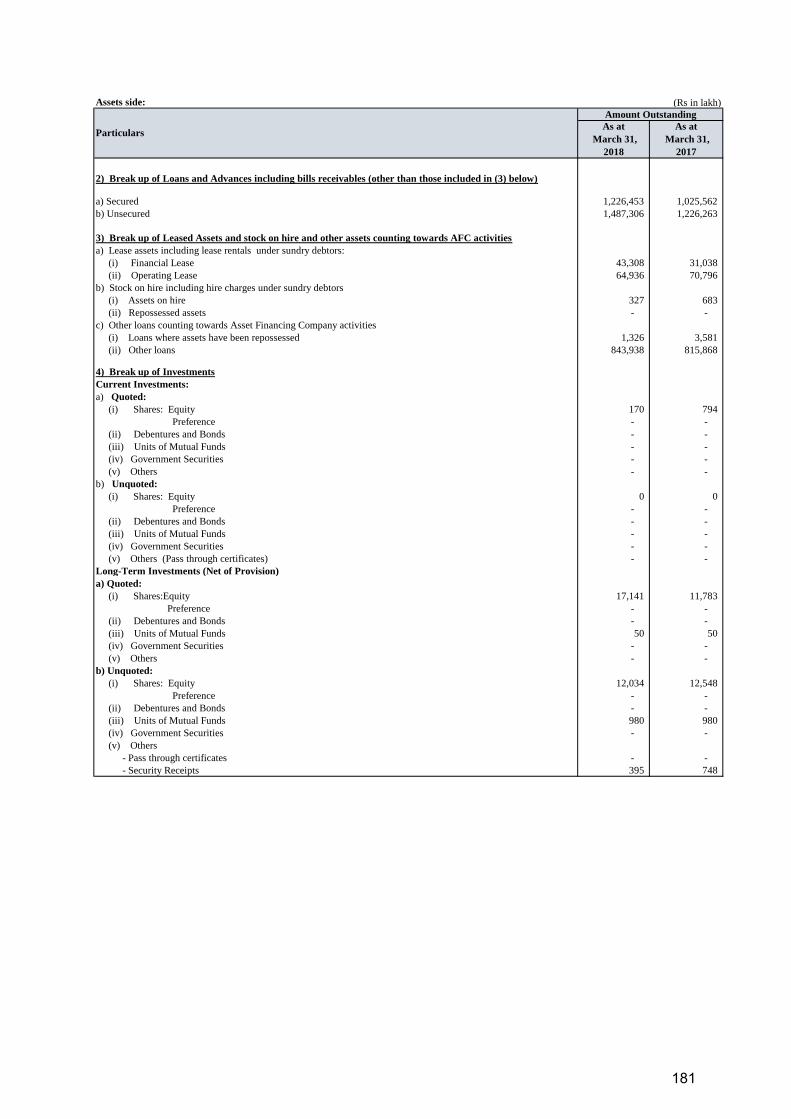
Assets side: (Rs in lakh)
As at
March 31,
2018
As at
March 31,
2017
a) Secured 1,226,453 1,025,562
b) Unsecured 1,487,306 1,226,263
3) Break up of Leased Assets and stock on hire and other assets counting towards AFC activities
a) Lease assets including lease rentals under sundry debtors:
(i) Financial Lease 43,308 31,038
(ii) Operating Lease 64,936 70,796
b) Stock on hire including hire charges under sundry debtors
(i) Assets on hire 327 683
(ii) Repossessed assets - -
c) Other loans counting towards Asset Financing Company activities
(i) Loans where assets have been repossessed 1,326 3,581
(ii) Other loans 843,938 815,868
4) Break up of Investments
Current Investments:
a) Quoted:
(i) Shares: Equity 170 794
Preference - -
(ii) Debentures and Bonds - -
(iii) Units of Mutual Funds - -
(iv) Government Securities - -
(v) Others - -
b) Unquoted:
(i) Shares: Equity 0 0
Preference - -
(ii) Debentures and Bonds - -
(iii) Units of Mutual Funds - -
(iv) Government Securities - -
(v) Others (Pass through certificates) - -
Long-Term Investments (Net of Provision)
a) Quoted:
(i) Shares:Equity 17,141 11,783
Preference - -
(ii) Debentures and Bonds - -
(iii) Units of Mutual Funds 50 50
(iv) Government Securities - -
(v) Others - -
b) Unquoted:
(i) Shares: Equity 12,034 12,548
Preference - -
(ii) Debentures and Bonds - -
(iii) Units of Mutual Funds 980 980
(iv) Government Securities - -
(v) Others
- Pass through certificates - -
- Security Receipts 395 748
Particulars
Amount Outstanding
2) Break up of Loans and Advances including bills receivables (other than those included in (3) below)
181

5) Borrower group-wise classification of assets financed as in (2) and (3) above
(Rs in lakh)
Particulars
2017-18 2017-18 2016-17 2017-18 2016-17
- - - - -
- - - - -
2,307 2,935 1,300 5,242 11,972
2,177,981 1,484,371 1,224,963 3,662,352 3,161,820
TOTAL 2,180,288 1,487,306 1,226,263 3,667,594 3,173,793
(Rs in lakh)
Particulars
2017-18 2016-17 2017-18 2016-17
a) Related Parties
(i) Subsidiaries - - - -
(ii) Companies in the same group - - - -
(iii) Other related Parties - 5,084 - 4,061
b) Other than related parties 27,632 24,600 30,769 22,842
TOTAL 27,632 29,684 30,769 26,903
Notes:
7) Other Information
2017-18 2016-17
a) Gross Non-Performing Assets
1) Related parties - -
2) Other than related parties 122,431 159,147
b) Net Non-Performing Assets
1) Related parties - -
2) Other than related parties 32,583 37,926
c) Assets acquired in satisfaction of debt 1,928 5,330
Market Value/Break up or fair
value or NAV
Book Value
(Net of Provisions)
a) Market Value/Break up Value or Fair Value or NAV is taken as same as book value in case of unquoted shares in absence of market value/break up
value or fair value or NAV.
b) Companies in the same group have been considered to mean companies under the same management as per Section 370(1B) of the Companies Act,
1956.
Particulars
(iii) Other related
Parties 10,672
b) Other than
related parties
1,936,857
1,947,530
6) Investor group-wise classification of all investments (current and long-term) in shares and securities (both quoted and unquoted)
2016-17
a) Related Parties
(i) Subsidiaries -
(ii) Companies in
the same
group -
Amount net of provisions
Secured Unsecured Total
182

39.
40.
41.
42.
43.
44.
45.
46.
47.
48.
The value of a unhedged foreign currency transaction for purchase of Operating Lease asset as on March 31, 2018 is Rs.37 lakh.
During the year ended March 31, 2018, the Company has re-assessed the useful life of its leased assets and has changed the life of the assets given on
operating lease. As a result of the change in the useful life of the asset, depreciation for year ended March 31, 2018 is higher by Rs. 8,145 lakh.
The company has reported frauds aggregating Rs. 340 lakh (Previous year : Rs. 954 lakh) based on management reporting to risk committee and to the
RBI through prescribed returns.
During the period ended March 31, 2018, the Company has changed its NPA provisioning policy based on the RBI Master Direction DNBR - PD
008/03.10.119/2016-17 - RBI/DNBR/2016-17/45 dated September 01, 2016 pursuant to which loans outstanding for a period exceeding 90 days are
classified as sub-standard assets and sub-standard assets for a period exceeding 12 months are classified as doubtful assets. The debit to the Statement of
Profit and Loss on account of the change is Rs. 1,358 lakh and Rs. 868 lakh respectively.
During the corresponding period ended March 31, 2017, the Company had changed its NPA provisioning policy based on the above circular, pursuant to
which loans outstanding for a period exceeding 120 days were classified as sub-standard assets and sub-standard assets for a period exceeding 14 months
were classified as doubtful assets. The debit to the Statement of Profit and Loss on account of the change was Rs. 2,801 lakh and Rs.2,312 lakh
respectively.
Investments in bonds, debentures and other financial instruments which, in substance, form a part of the Company’s financing activities ("Credit
Substitutes") have been classified under Loans and Advances – Financing Activity (Note 15). In the past these were classified as a part of Investments
(Note 13). Management believes that the current period’s classification results in a better presentation of the substance of these receivables and is in
alignment with regulatory filings.
The company has earned commission from insurance companies amounting to Rs. 593 lakh (Previous year : Rs. 481 lakh).
Loans and advances - Financing Activity (Secured) include Rs.433 lakh (Previous Year: Rs. 433 lakh) being the value of the unquoted preference shares
acquired in satisfaction of the respective loans under the Settlement Agreement. Other Current Assets include Rs. 1,326 lakh (Previous Year: Rs. 3,034
lakh) being the value of immovable property, necessary provision for which is made. Long term investments include Rs. Nil (Previous year: Rs. 514 lakh)
being the value of the unqouted equity shares acquired in satisfaction of the respective loans under the Settlement Agreement. Current investments
include Rs. 169 lakh (Previous year: Rs. 802 lakh) being the value of the unqouted equity shares acquired in satisfaction of the respective loans under the
Settlement Agreement. Other loans and advances include Rs. Nil (Previous Year: Rs. 547) being the assignment receivable, necessary provision for whcih
is made.
In the previous year ended March 31,2017, the Company had provided/written off certain amounts comprising carrying value of investments acquired in
settlement of claim, Goodwill, loans and credit substitutes and investment in the Statement of Profit and Loss.
The Shareholders of the Company at its meeting held on June 24, 2016 approved a Reduction of Share Capital (Securities Premium Account) in
accordance with Section 52 of the Companies Act, 2013 read with Sections 100 to 103 of the Companies Act, 1956. The Hon’ble High Court of
Judicature at Bombay approved the said arrangement by way of order dated August 5, 2016 which was filed with the Registrar of Companies on August
26, 2016. Pursuant to the order, the Company had credited its Statement of Profit and Loss for the financial year ended March 31, 2017 by appropriating
an amount of Rs 40,558 lakh being the aggregate amount of (i) investments acquired in settlement of claim written off Rs. 14,318 lakh, (ii) goodwill
written off Rs. 7,804 lakh, (iii) loans and credit substitutes provided Rs. 31,789 lakh and (iv) mark to market loss on current investment provided Rs. 349
lakh (net of taxes as applicable) from the amount standing to the credit of Securities Premium Account.
The aforementioned disclosure is made by the Company pursuant to the Institute of Chartered Accountant of India's guidance on disclosures relating to
court order.
During the previous year, the Company changed its accounting policy with respect to amortisation of deferred revenue expenditure for share issue
expenses. The Company now charges off the share issue expenses against amount standing to the credit of the Securities Premium Account. Prior to this
change, the Company amortised the said share issue expenses over a period of 36 months from the month in which the expenses were incurred. The
change in accounting policy is in accordance with the provisions of Section 52 of the Companies Act 2013, and it would result in a more appropriate
presentation of financial statements of the Company.
On account of the change in the accounting policy, the profit before tax was higher by Rs. 76 lakh (net of taxes, as applicable) for the period year ended
March 31, 2017 and deferred revenue expenditure was lower by Rs. 77 lakh (net of taxes, as applicable) as on March 31, 2017.
To comply with the RBI Master Direction DNBR - PD 008/03.10.119/2016-17 - RBI/DNBR/2016-17/45 dated September 01, 2016, the company has
made an incremental standard asset provision of Rs. 1,531 lakh being 0.05% (CY 17-18 0.40%, PY 16-17 0.35%) of Standard Assets as of March 31,
2017.
183

49. Disclosure of Restructured Accounts as on March 31, 2018
No. of borrowers - 2 6 - 8 - - - - - 30 33 58 - 121 30 35 64 - 129
Amt. outstanding 0 3,846 21,858 - 25,704 - - - - - 2,096 11,651 12,305 - 26,052 2,096 15,497 34,163 - 51,756
Provision thereon - 2,606 19,140 - 21,746 - - - - - 105 9,167 10,539 - 19,811 105 11,773 29,679 - 41,557
No. of borrowers - - - - - - - - - - - 77 - - 77 - 77 - - 77
Amt. outstanding - - 21 - 21 - - - - - - 3,567 233 - 3,800 - 3,567 254 - 3,821
Provision thereon - - 100 - 100 - - - - - - 1,246 167 - 1,413 - 1,246 267 - 1,513
No. of borrowers - - - - - - - - - - 8 (1) (7) - - 8 (1) (7) - -
Amt. outstanding - - - - - - - - - - 1,664 (1,591) (104) - (32) 1,664 (1,591) (104) - (32)
Provision thereon - - - - - - - - - - 83 (73) (93) - (83) 83 (73) (93) - (83)
5% new provision on
standard assets- - - - - - - -
No. of borrowers - - - - - - - - - - (1) - - - (1) (1) - - - (1)
Amt. outstanding - - - - - - - - - - (318) - - - (318) (318) - - - (318)
Provision thereon - - - - - - - - - - (16) - - - (16) (16) - - - (16)
No. of borrowers - (1) 1 - - - - - - - (7) (3) 10 - - (7) (4) 11 - -
Amt. outstanding - (1,481) 1,613 - 132 - - - - - (63) (7,944) 7,858 - (150) (63) (9,426) 9,471 - (18)
Provision thereon - (1,333) 1,334 - 1 - - - - - (3) (6,636) 7,216 - 577 (3) (7,970) 8,550 - 578
No. of borrowers - (1) (4) - (5) - - - - - (6) (12) (41) - (59) (6) (13) (45) - (64)
Amt. outstanding - (2,364) (21,342) - (23,706) - - - - - (515) (3,509) (9,430) - (13,454) (515) (5,874) (30,772) - (37,160)
Provision thereon - (1,273) (18,866) - (20,139) - - - - - (26) (2,509) (8,013) - (10,547) (26) (3,781) (26,879) - (30,686)
No. of borrowers - - 3 - 3 - - - - - 24 94 20 - 138 24 94 23 - 141
Amt. outstanding 0 (0) 2,150 - 2,150 - - - - - 2,863 2,173 10,861 - 15,898 2,863 2,173 13,011 - 18,048
Provision thereon - 0 1,708 - 1,708 - - - - - 143 1,196 9,816 - 11,155 143 1,196 11,524 - 12,863
* Excluding the figures of Standard Restructured Advances which do not attract higher provisioning or risk weight (if applicable)
# This also includes provision made on opening standard restructured assets
NOTES
2. Write offs includes Rs.(384.92) Lakhs ( 25 contracts, carrying provision of Rs. 45.03 Lakh) of reduction from existing restructured accounts on account of recovery from sale proceeds.
7 Restructured accounts as on
31st Mar, 2018 (Closing
figures)*
1. Fresh restucturing during the year includes Rs 261.42 lakh of fresh /additional Sanction (17 account ), Provision of Rs.359.69 lakh to the existing restructured accounts.
4 Restructured advances which
ceases to attract higher
provisioning and/ or additional
risk weight at the end of the
FY and hence need not be
shown as restructured standard
advances at the beginning of
the next FY
5 Downgradations of
restructured accounts during
the FY
6 Write offs of restructured
accounts during the FY
Details
1 Restructured accounts as on
1st April, 2017 (Opening
figures)*
2 Fresh restructuring during the
year
3 Upgradations of restructured
accounts to Standard category
Total Standard
Sub-
standard Doubtful Loss TotalLoss Total Standard
Sub-
standard Doubtful Loss Doubtful Loss Total Standard
Sub-
standard Doubtful
(Rs in lakh)
Sl No Type of Restructuring Under CDR Mechanism
Under SME Debt
Restructuring Mechanism Others Total
Asset Classification
Standard
Sub-
standard
184

50.
(i)
Registration
No., if any
Date of
registration
Valid upto Registered as
13.02005 4-Nov-11 - NBFC-ND-SI
- 15-Jan-17 14-Jan-19 Marketing and
distribution of Co-
branded Credit Card
ARN No. 84894 12-Mar-15 11-Mar-21 Distributor of MF
products (ARN)
INA000002215 17-Sep-14 16-Sep-19 Investment Advisor
CA 0076 1-Apr-16 31-Mar-19 Corporate Agent
(ii)
Note 1:
(iii)
(iv)
(a) Undrawn Commitment given to Borrowers
(b) Financial and Other Guarantees Rs. 44,200 lakh (Previous Year : Rs. 29,048 lakh)
(c) Leases entered but not executed Rs. 89,148 lakh (Previous Year : Rs. 66,473 lakh)
(d) Unamortised Forward Contract exposure Rs. 98 lakh (Previous Year : Rs. Nil lakh)
(e) Others (Tax Matters) Rs. 1,987 lakh (Previous Year : Rs. 2,206 lakh)
As on March 31, 2018 Rs. 212,864 lakh (Previous Year: Rs. 211,584 lakh)
Less than 1 Year: Rs. 165,763 lakh (Previous Year: Rs. Rs. 178,908 lakh)
More than 1 Year: Rs. 47,101 lakh (Previous Year: Rs. 32,676 lakh)
(c) Others Short Term Bank Loans : ICRA A1+
Long Term Bank Loans : ICRA AA+ and CARE AA+
There is no migration in the ratings during the year
RBI has not levied any penalties on the Company during the year.
Off Balance Sheet Exposure as on March 31, 2018 is as follows :-
(v) Rating of products ( refer Note 1)
(a) Commercial Paper ICRA A1+ , CRISIL A1+
(b ) Debentures Secured/Unsecured Non Convertible Debentures
ICRA AA+, CRISIL AA+ and CARE AA+.
Tier II Debentures
ICRA AA+, CRISIL AA+ and CARE AA+
Perpetual Debentures
ICRA AA, CRISIL AA and CARE AA
(ii) Date of Rating ICRA- March 27 2018, CARE- October 09, 2017, CRISIL- November 21,
2017
(iii) Rating Valid up to Till the Date of reaffiramation
(iv) Name of the Rating Agency ICRA Limited (ICRA), CRISIL Limited (CRISIL), Credit Analysis and
Research Limited (CARE)
Association of Mutual Fund of India
Securities and Exchange Board of India
Insurance Regulatory and Development
Authority of India
Ratings assigned by credit rating agencies and migration of ratings during the year
(i) Rating Assigned to Short Term Debt, Long Term Debt, Perpetual Debt, Tier II Debt
As per RBI Master Direction DNBR. PD. 008/03.10.119/2016-17 dated September 1, 2016, additional disclosures
are required in the Annual Financial Statements as follows:
The Company has following Registrations effective as on March 31, 2018:
Issuing Authority
Reserve Bank of India
Reserve Bank of India
185

(v)
FY 17-18 FY 16-17
(509) (455)
1,463 383
26,844 56,686
1,405 1,378
(1,409) (827)
230 -
25,922 11,649
86 237
3,664 3,008
Total 57,696 72,059
Note :
(vi)
FY 17-18 FY 16-17
297,779 262,420
8.07% 8.15%
FY 17-18 FY 16-17
309,904 271,290
7.61% 7.62%
(vii)
(viii)
Sr No FY 17-18 FY 16-17
(a) 51 25
(b) 6,458 1,864
(c) 6,500 1,838
(d) 9 51
* Complaints related to March 2018 outstanding as on the date of signing of Balance Sheet :- NIL
The status of the Customer Complaints during the year is as follows :
Particulars
No. of complaints pending at the beginning of the year
No. of complaints received during the year
No. of complaints redressed during the year
No. of complaints pending at the end of the year*
Particulars
Total Exposure to twenty largest borrowers
Percentage of Exposure to twenty largest borrowers to
Total Exposure of the NBFC **
* Includes Loans, Advances, Credit Substitutes & Investment in Equity Shares, Preference Shares,
Security Receipts & Mutual Funds (including sanctioned part disbursed)
** Total Exposure includes off balance sheet exposure (refer schedule 50(iv)(a,b and c)
The Company does not have any Joint Ventures and Subsidiaries abroad. Company has not sponsored any SPVs.
Accordingly there is no disclosure applicable
Particulars
Total Advances to twenty largest borrowers
Percentage of Advances to twenty largest borrowers to
Total Advances of the NBFC
# Includes Loans, Advances & Credit Substitutes
Exposure * (Rs in lakh)
1. The company has assessed its obligations arising in the normal course of business, including pending litigations,
proceedings pending with tax authorities and other contracts including derivative and long term contracts. In
accordance with the provisions of Accounting Standard - 29 on ‘Provisions, Contingent Liabilities and Contingent
Assets’, the company recognises a provision for material foreseeable losses when it has a present obligation as a
result of a past event and it is probable that an outflow of resources will be required to settle the obligation, in
respect of which a reliable estimate can be made. In cases where the available information indicates that the loss on
the contingency is reasonably possible but the amount of loss cannot be reasonably estimated, a disclosure to this
effect is made seperately as contingent liabilities in the notes to the accounts forming part of the financial statements
(refer Note no 28(i) ). The company does not expect the outcome of these proceedings to have a materially adverse
effect on its financial results.
2. The company has not availed relief in the classification and provision for non-performing assets against the
exposure to micro, small and medium borrowers registered under Goods and Service Tax as provided by RBI through
its circular no. RBI/2017-18/129 DBR.No.BP.BC.100/21.04.048/2017-18 dated February 7, 2018.
Concentration of Advances & Exposures as per Para 22 of the RBI Norms stood as follows:
Advances# (Rs in lakh)
Provision against other doubtful advances
Provision made towards Income tax
Other Provision and Contingencies (with details):
- Provision for Employee Benefits
- Provision for Standard Assets
Break up of 'Provisions and Contingencies' shown
under the head Expenditure in the Statement of Profit
and Loss ( refer Note 1)
Provision for depreciation on Investments
Provision for MTM Loss on Investments
Provision towards NPA ( refer Note 2)
Provision against assets held for sale
Provision towards Restructured Standard Assets
Provisions and Contingencies
(Rs in lakh)
186

(ix)
S No. FY 17-18 FY 16-17
1 559 980
2 37,299 63,149
3 37,299 63,149
4 Nil Nil
5 Nil Nil
(x)
S No. FY 17-18 FY 16-17
1 2 8,494
2 438 1,356
a) 977 8,454
b) 539 7,098
3 492 2,129
(xi)
(xii)
(xiii)
(xiv) Concentration of NPAs
March 31, 2018
(Rs in lakh)
March 31, 2017
(Rs in lakh)
Total Exposure to top four NPA accounts 22,538 32,893
(xv) Sector-wise NPAs
March 31, 2018 March 31, 2017
1 7.55% 6.03%
2 1.74% 2.18%
3 3.81% 12.26%
4 5.85% 7.46%
5 2.54% 2.56%
6 4.72% 3.50%
7 2.09% 1.62%Other personal loans (refer Note 4)
Note:
1. includes borrowers classifed as per the Master Direction FIDD.MSME & NFS.3/06.02.31/2016-17 dated July 21, 2016.
2. includes borrowers classified as Industry excluding the MSME.
3. includes borrowers classified as Services excluding the MSME.
4. Other Personal Loans include : Loan against Property, Loan against Shares and Consumer Durables.
Agriculture & allied activities
MSME (refer Note 1)
Corporate borrowers (refer Note 2)
Services (refer Note 3)
Unsecured personal loans
Auto loans
The Exposure to Unsecured Advances is Rs. 1,502,234 lakh (Previous Year Rs. 1,238,183 lakh) constituting 40.70% of the Total Loans
and Advances (Previous Year 38.44%). The Exposure to Secured Loans includes Rs. Nil (Previous year Rs. 1,120 lakh) towards a Loan
given against Copy Rights for motion films in the nature of intangible asset.
Particulars
Sl. No. Sector
Percentage of NPAs to Total
Advances in that sector
No Parent Company Products are financed during the year (Previous Year Nil).
The Exposure to a single borrower and group of borrower does not exceed the limit stipulated by the RBI Concentration norms
applicable to NBFCs.
Particulars
No. of accounts sold (Count)
Aggregate outstanding [net of provision] (Rs in lakh)*
Aggregate outstanding (Rs in lakh)
Provision held on date of sale
Aggregate consideration received (Rs in lakh)*
Aggregate consideration
Additional consideration realized in respect of accounts transferred in earlier years
Aggregate gain / loss over net book value
* Total value of the Loans sold under direct assignment route is Rs. 41,443 lakh (Previous Year : Rs. 70,166 lakh). Company has
retained 10% interest in the Loans sold
(a) Non Performing Assets purchased during the year - Nil (Previous Year : Nil).
(b) Details of Non Performing Assets sold :
Details of Assignment transactions undertaken by NBFCs:
(Rs in lakh)
Particulars
No. of accounts*
Aggregate value (net of provisions) of accounts sold
187
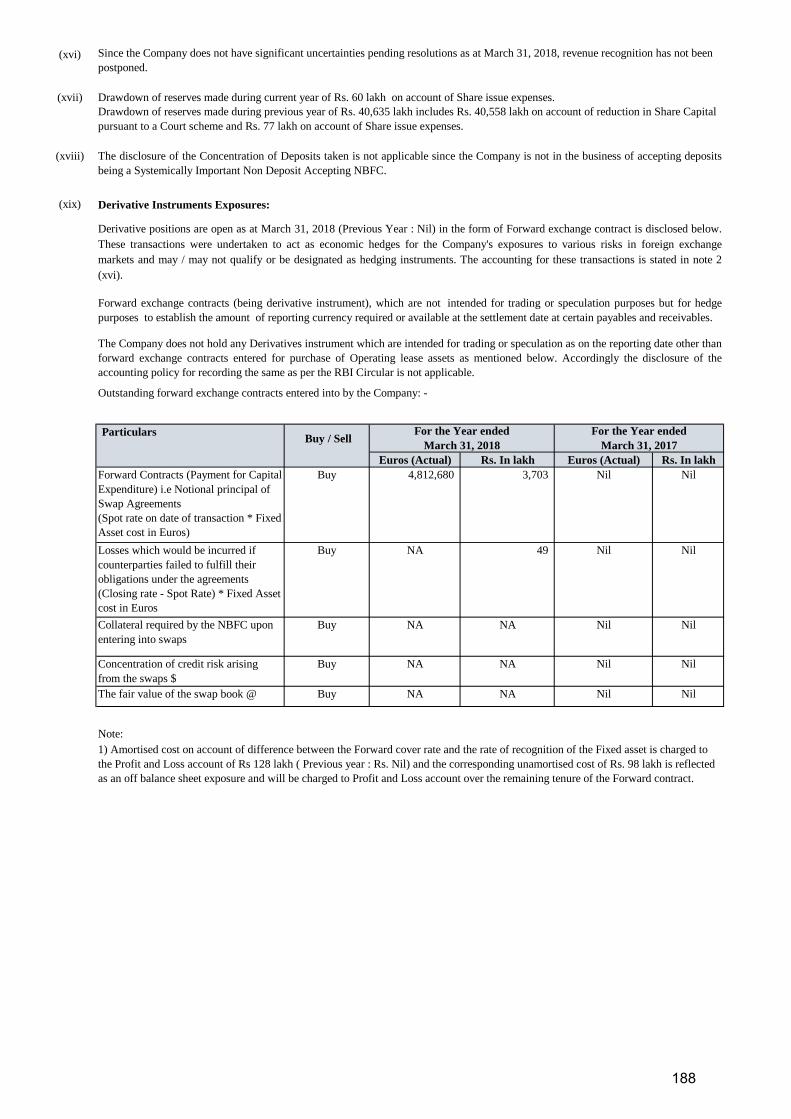
(xvi)
(xvii)
(xviii)
(xix) Derivative Instruments Exposures:
Outstanding forward exchange contracts entered into by the Company: -
Buy / Sell
Euros (Actual) Rs. In lakh Euros (Actual) Rs. In lakh
Buy
Buy
Buy
Buy
Buy NA NA Nil Nil
Note:
The fair value of the swap book @
1) Amortised cost on account of difference between the Forward cover rate and the rate of recognition of the Fixed asset is charged to
the Profit and Loss account of Rs 128 lakh ( Previous year : Rs. Nil) and the corresponding unamortised cost of Rs. 98 lakh is reflected
as an off balance sheet exposure and will be charged to Profit and Loss account over the remaining tenure of the Forward contract.
Collateral required by the NBFC upon
entering into swaps
NA NA Nil Nil
Concentration of credit risk arising
from the swaps $
NA NA Nil Nil
Forward Contracts (Payment for Capital
Expenditure) i.e Notional principal of
Swap Agreements
(Spot rate on date of transaction * Fixed
Asset cost in Euros)
4,812,680 3,703 Nil Nil
Losses which would be incurred if
counterparties failed to fulfill their
obligations under the agreements
(Closing rate - Spot Rate) * Fixed Asset
cost in Euros
NA 49 Nil Nil
Derivative positions are open as at March 31, 2018 (Previous Year : Nil) in the form of Forward exchange contract is disclosed below.
These transactions were undertaken to act as economic hedges for the Company's exposures to various risks in foreign exchange
markets and may / may not qualify or be designated as hedging instruments. The accounting for these transactions is stated in note 2
(xvi).
Forward exchange contracts (being derivative instrument), which are not intended for trading or speculation purposes but for hedge
purposes to establish the amount of reporting currency required or available at the settlement date at certain payables and receivables.
The Company does not hold any Derivatives instrument which are intended for trading or speculation as on the reporting date other than
forward exchange contracts entered for purchase of Operating lease assets as mentioned below. Accordingly the disclosure of the
accounting policy for recording the same as per the RBI Circular is not applicable.
Particulars For the Year ended
March 31, 2018
For the Year ended
March 31, 2017
Since the Company does not have significant uncertainties pending resolutions as at March 31, 2018, revenue recognition has not been
postponed.
Drawdown of reserves made during current year of Rs. 60 lakh on account of Share issue expenses.
Drawdown of reserves made during previous year of Rs. 40,635 lakh includes Rs. 40,558 lakh on account of reduction in Share Capital
pursuant to a Court scheme and Rs. 77 lakh on account of Share issue expenses.
The disclosure of the Concentration of Deposits taken is not applicable since the Company is not in the business of accepting deposits
being a Systemically Important Non Deposit Accepting NBFC.
188
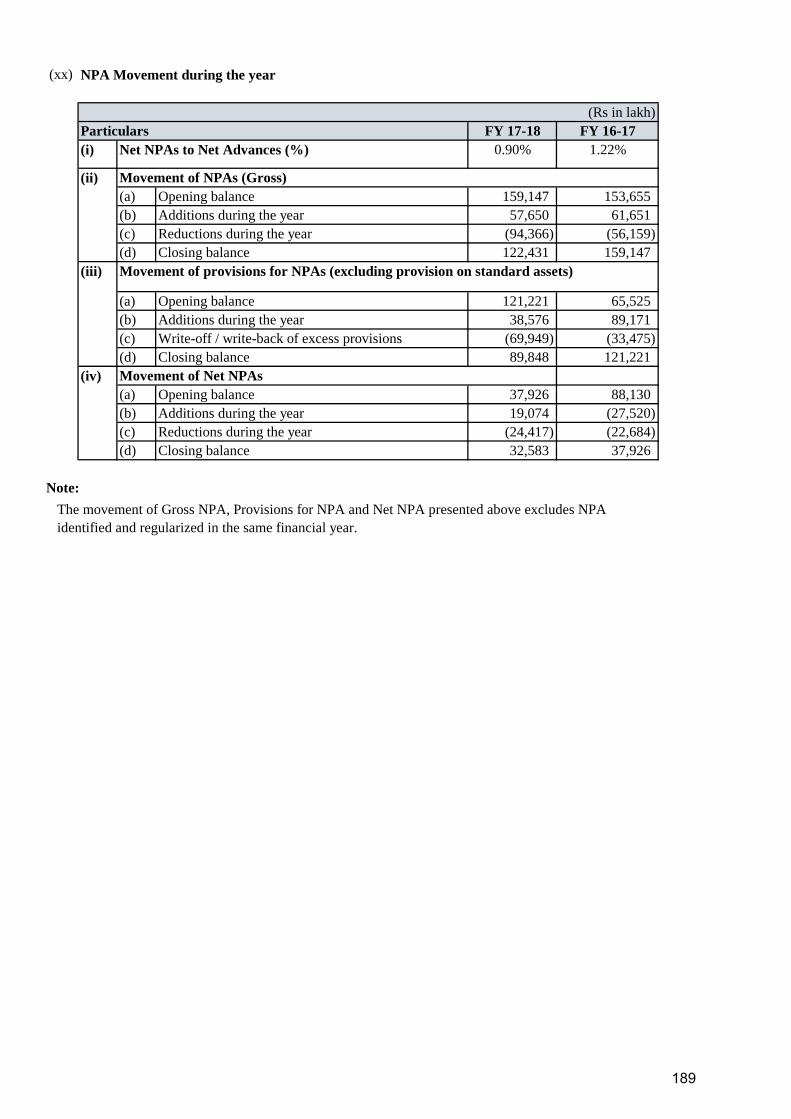
(xx)
FY 17-18 FY 16-17
(i) 0.90% 1.22%
(a) Opening balance 159,147 153,655
(b) Additions during the year 57,650 61,651
(c) Reductions during the year (94,366) (56,159)
(d) Closing balance 122,431 159,147
Movement of provisions for NPAs (excluding provision on standard assets)
(a) Opening balance 121,221 65,525
(b) Additions during the year 38,576 89,171
(c) Write-off / write-back of excess provisions (69,949) (33,475)
(d) Closing balance 89,848 121,221
(a) Opening balance 37,926 88,130
(b) Additions during the year 19,074 (27,520)
(c) Reductions during the year (24,417) (22,684)
(d) Closing balance 32,583 37,926
Note:
(iii)
(iv) Movement of Net NPAs
The movement of Gross NPA, Provisions for NPA and Net NPA presented above excludes NPA
identified and regularized in the same financial year.
NPA Movement during the year
(Rs in lakh)
Particulars
Net NPAs to Net Advances (%)
(ii) Movement of NPAs (Gross)
189

(xxi) Exposure to Capital Market :-
FY 17-18 FY 16-17
(i) Direct investment in equity shares, convertible bonds, convertible
debentures and units of equity-oriented mutual funds the corpus of which
is not exclusively invested in corporate debt; (Refer note (c) below)
40,465 37,156
(ii) Advances against shares / bonds / debentures or other securities or on
clean basis to individuals for investment in shares (including IPOs /
ESOPs), convertible bonds, convertible debentures, and units of equity-
oriented mutual funds; (Refer notes (a) and (b) below)
230,263 171,158
(iii) Advances for any other purposes where shares or convertible bonds or
convertible debentures or units of equity oriented mutual funds are taken
as primary security;
4,417 19,912
(iv) Advances for any other purposes to the extent secured by the collateral
security of shares or convertible bonds or convertible debentures or units
of equity oriented mutual funds i.e. where the primary security other than
shares / convertible bonds / convertible debentures / units of equity
oriented mutual funds 'does not fully cover the advances;
- -
(v) Secured and unsecured advances to stockbrokers and guarantees issued on
behalf of stockbrokers and market makers;
- -
(vi) Loans sanctioned to corporates against the security of shares / bonds /
debentures or other securities or on clean basis for meeting promoter's
contribution to the equity of new companies in anticipation of raising
resources;
- -
(vii) Bridge loans to companies against expected equity flows / issues; - -
(viii) All exposures to Venture Capital Funds (both registered and unregistered) - -
275,145 228,226
(Rs in lakh)
Particulars
Total Exposure to Capital Market
Note:
Exposure to Capital Market includes:
a) Rs.7,963 lakh ( of which loan sanctioned part disbursed is Rs. 3,200 lakh) on account of Loan give to a
customer in the business of Commercial Real estate ( Previous year : Rs. Nil).
b) Limits given to Borrowers but part un-utilised of Rs. 16,980 lakh (Previous year: Rs. 11,262 lakh) .
c) Investment in equity shares of Rs. 3,935 lakh in a Commercial Real Estate customer i.e. Shriram properties
private limited (Previous year : Rs. 3,935 lakh)
190
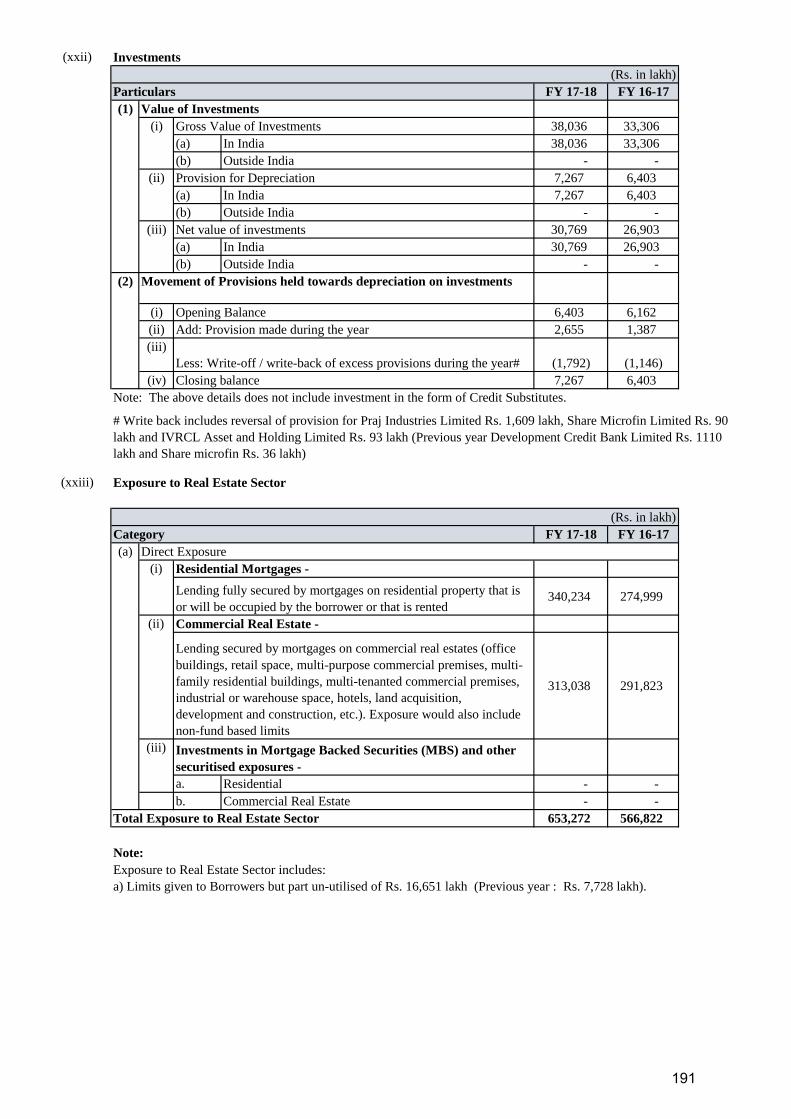
(xxii)
FY 17-18 FY 16-17
38,036 33,306
(a) In India 38,036 33,306
(b) Outside India - -
Provision for Depreciation 7,267 6,403
(a) In India 7,267 6,403
(b) Outside India - -
Net value of investments 30,769 26,903
(a) In India 30,769 26,903
(b) Outside India - -
6,403 6,162
2,655 1,387
(1,792) (1,146)
7,267 6,403
Note: The above details does not include investment in the form of Credit Substitutes.
(xxiii) Exposure to Real Estate Sector
FY 17-18 FY 16-17
340,234 274,999
313,038 291,823
a. Residential - -
b. Commercial Real Estate - -
653,272 566,822Total Exposure to Real Estate Sector
Note:
Exposure to Real Estate Sector includes:
a) Limits given to Borrowers but part un-utilised of Rs. 16,651 lakh (Previous year : Rs. 7,728 lakh).
Commercial Real Estate -
Lending secured by mortgages on commercial real estates (office
buildings, retail space, multi-purpose commercial premises, multi-
family residential buildings, multi-tenanted commercial premises,
industrial or warehouse space, hotels, land acquisition,
development and construction, etc.). Exposure would also include
non-fund based limits
(iii) Investments in Mortgage Backed Securities (MBS) and other
securitised exposures -
# Write back includes reversal of provision for Praj Industries Limited Rs. 1,609 lakh, Share Microfin Limited Rs. 90
lakh and IVRCL Asset and Holding Limited Rs. 93 lakh (Previous year Development Credit Bank Limited Rs. 1110
lakh and Share microfin Rs. 36 lakh)
(Rs. in lakh)
Category
(a) Direct Exposure
(i) Residential Mortgages -
Lending fully secured by mortgages on residential property that is
or will be occupied by the borrower or that is rented
(ii)
(2) Movement of Provisions held towards depreciation on investments
(i) Opening Balance
(ii) Add: Provision made during the year
(iii)
Less: Write-off / write-back of excess provisions during the year#
(iv) Closing balance
Investments
(Rs. in lakh)
Particulars
(1) Value of Investments
(i) Gross Value of Investments
(ii)
(iii)
191

51.
52.
Schedule Schedule Schedule Schedule
Provision for
doubtful loans and
credit substitutes
Non-current
liabilities
Long-term
provisions
Non-Current
assets
Long-term
Loans and
advances -
financing
activity
30,361 Loans and advances and related
provisions are presented on Gross
basis in line with the requirements
of the Master Direction - Non
Banking Financial Company-
Systemically Important Non-
Deposit taking Company
Directions, 2016 ("the RBI
Directions")
Provision for
restructured standard
assets
Non-current
liabilities
Long-term
provisions
Non-Current
assets
Long-term
Loans and
advances -
financing
activity
70 Loans and advances and related
provisions are presented on Gross
basis in line with the requirements
of the Master Direction - Non
Banking Financial Company-
Systemically Important Non-
Deposit taking Company
Directions, 2016 ("the RBI
Directions")
Leave encashment
Current & Non-
Current
classification
Non-current
liabilities
Long-term
provisions
Current liabilities Short-term
provisions
733 Short-term and Long-term Leave
encashment has been presented in
accordance with the report of the
Actuary and as per requirements
of Schedule III of the Companies
Act, 2013.
Certain receivables
netted off in trade
payables reclassified
Other current
assets
Other current
assets
Current liabilities Trade
payables
174 Certain recievables is reclassified
to Other current assets instead of
netting off from trade payables for
better disclosure.
Accrued employee
benefit expense
Current
liabilities
Other current
liabilities
Current liabilities Trade
payables
4,321 Bonus accrual for employees has
been presented as a part of Other
Current Liabilities instead of
Trade payables in accordance with
the requirement of Schedule III of
the Companies Act, 2013.
Trade receivables
regrouped from
loans and advances
Current assets Trade
receivables
Current assets Short-term
Loans and
advances -
financing
activity
65 An item is shown as trade
receivables instead of loans and
advances.
Provision for
doubtful loans and
credit substitutes
Current
liabilities
Short-term
provisions
Current assets Short-term
Loans and
advances -
financing
activity
90,861 Loans and advances and related
provisions are presented on Gross
basis in line with the requirements
of the Master Direction - Non
Banking Financial Company-
Systemically Important Non-
Deposit taking Company
Directions, 2016 ("the RBI
Directions")
Provision for
restructured standard
assets
Current
liabilities
Short-term
provisions
Current assets Short-term
Loans and
advances -
financing
activity
41 Loans and advances and related
provisions are presented on Gross
basis in line with the requirements
of the Master Direction - Non
Banking Financial Company-
Systemically Important Non-
Deposit taking Company
Directions, 2016 ("the RBI
Directions")
Gratuity Asset
Reclass to Non-
current
Non-Current
assets
Other non-
current assets
Current assets Other
current
assets
239 Gratuity is shown as non-current
asset as per the acturial report and
is appropriately reclassed as per
Schedule III.
The figures for the year ended March 31, 2017 were audited by previous statutory auditors.
Previous year's figures have been regrouped / reclassified wherever necessary to correspond with the current year's classification / disclosure.
Description
31-Mar-18 31-Mar-17Amount
(Rs. in Lakh)Reason
192
Receivable-
Assignment of Loan
Current assets Other current
assets
Current assets Short-term
Loans and
advances -
others
810 Reclassed to Assets held for sale
for better presentation
Provision-
Receivable-
Assignment of Loan
Current assets Other current
assets
Current assets Short-term
Loans and
advances -
others
263 Reclassed to Assets held for sale
for better presentation
Advertisement
income
Income Other income Income Revenue
from
operations
567 Income earned from
advertisements is shown as Other
income which helps in better
disclosure.
In terms of our report attached For and on behalf of the Board of Directors
For B S R & Co. LLP Mukund S. Dharmadhikari Anuradha E. Thakur F.N. Subedar
Chartered Accountants (Director) (Director) (Director)
Firms Registration No – (DIN No. : 05003224) (DIN No. : 06702919) (DIN No. : 00028428)
101248W/W-100022
Manoj Kumar Vijai M. D. Mallya Rajiv Sabharwal Kusal Roy
Partner (Director) (Director) (Managing Director)
Membership No: 046882 (DIN No. : 01804955) (DIN No. : 00057333) (DIN No. : 02268654)
Puneet Sharma Avan Doomasia
(Chief Financial Officer) (Company Secretary)
Mumbai
Date : April 30, 2018
193

Sr. NoName of
Subsidiary
The date since
when subsidiary
was acquired
Reporting period for
the subsidiary
concerned, if
different from the
holding company's
reporting period
Reserves
& Surplus
Total
Assets
Total
LiabilititesInvestments Turnover
Profit /
(Loss)
before
Taxation
Provision
for
taxation
Profit (Loss)
After
Taxation
Proposed
Dividend
% of
shareholding
Statement pursuant to Section 129 (3) of the Companies Act, 2013 related to Associates Companies and Joint Ventures Rs. In lakh
No. of Shares
Amount of
investment
in
Associate /
Joint
Extent of
Holding %
i. Considered
in
Consolidation
ii. Not
Considered in
Consolidation
Notes:
For For Tata Capital Financial Services Limited M. S. Dharmadhikari Anuradha Thakur F.N. Subedar M. D. Mallya Rajiv Sabharwal
(Director) (Director) (Director) (Director) (Director)
Mumbai Kusal Roy Puneet Sharma Avan Doomasia
April 30, 2018 (Managing Director) (Chief Financial Officer) (Company Secretary)
1. TCFSL’s shareholding in IARC upto March 8, 2018 was 25.37% which reduced to 16.57% with effect from March 9, 2018.
2. The Financials of the TCFSL and IARC has been consolidated upto March 8, 2018, since IARC ceased to be an associate w.e.f. March 9, 2018.
Name of Associate / Joint Venture
2. Date on
which the
Associate or
Joint
Venture was
associated
or acquired
Part "B": Associates and Joint Ventures
3. Shares of Associate/Joint Venture
held by the company on the year end4. Description of how
there is significant
influence
5. Reason why the
associate/joint
venture has not been
consolidated
6. Networth
attributable to
shareholding as per
latest audited Balance
Sheet
7. Profit/Loss for the year
1. Latest
audited
Balance
Sheet date
Sr. No
Part "A": Subsidiaries (Rs. In lakh)
Form AOC - 1
(Pursuant to the first proviso to Sub-section (3) of section 129 read with Rule 5 of Companies (Accounts) Rules, 2014)
Statement containing salient features of the financial statements of subsidiaries/associates/joint ventures
Reporting currency and
exchange rate as on the
last date of the relevant
Financial Year in the case
of foreign subsidiaries
Share Capital / Partner's
Capital / Unitholder's Capital
194