tata power - breport.myiris.combreport.myiris.com/sihl/tatpowco_20110427.pdf ·...
TRANSCRIPT

Tata Power 27th April 2011
1 | P a g e
Sector: Power & Utilities
0.00200.00400.00600.00800.00
1000.001200.001400.001600.001800.00
TPC SENSEX (Rebased)
Initiating Coverage
Tata Power Company’s (TPC) vast experience in the power business is reflected through its unique business model. The company has been able to maintain its flexibility and has outshined across various phases of the Indian power sector. TPC has a presence across the entire power value chain of generation (thermal, hydro, solar, wind and geothermal), transmission, trading and distribution.
Investment Rationale
• New capacities coming on-stream
In FY12, TPC is expected to benefit from an increased generation from 2800MW capacity coming on-stream during the year. This includes Maithon Power (1050MW), Mundra project (two units aggregating to 1600MW), and IEL Jojobera (120MW, that commissioned on 30th March, 2011).
• Secured fuel linkages for Maithon project
TPC has signed Fuel Supply Agreement (FSA) for 3.6 MTPA of coal with Coal India (with penalty being triggered at 65% cut off) and an off-take agreement signed with Tata Steel for 0.5–1MTPA of middling produced from coking coal mining operations of Tata Steel.
• Maithon short-term PPA signed
TPC has signed short term PPA for 320MW
430MW will be sold in open market till April 2012
300MW is already tied under long term PPA with DVC from the date of commissioning.
• Rebound in cash flows from coal SPV
Bumi has cleared its tax issues and cash flows from the coal SPV are expected to rebound.
• Increase in production & average coal realizations in CY11 Production from the Indonesian coal mines is expected to increase 10% YoY to ~66MTPA in CY11; and gradually scale up by CY14 with planned increase in the production capacity. Considering high coal demand globally, we expect coal prices to remain in the range of $77 -$72 per tonne between CY11 – CY13. Stable Coal Prices expectation will lead to escalated earnings from coal SPV in FY12 and FY13.
• Better visibility over projects in pipeline Increased clarity on the projects in pipeline (namely, Dehrand, Naraj Marthapur and Tiruldih projects) lead to a greater visibility on the execution of these projects
Source: Company, SIHL Research
Valuation At CMP of Rs. 1323, the stock is valued at 14.1x FY12 consolidated EPS of Rs. 93.7 and 13.3x FY13 consolidated EPS of Rs. 99.7. We value TPC’s stock on SOTP basis and arrive at a target price of Rs. 1630. We recommend BUY for TPC with an investment horizon of 12 months.
Kavita Jogani (Research Analyst) [email protected] Ameya Hardas (Head of Research) [email protected]
CMP: Rs.1323 Recommendation: Buy Target Price: 1630
Shareholding pattern as of Mar' 2011 Promoters 31.8% FII's 19.8% DII's 28.7% Others 19.7% Source: Company, SIHL Research
Key data Market Cap (Rs. Cr.) 31,398 Free Float Factor 7 52 Week H/L 1465/1142.20 Avg. 12M volumes ('000) 336.2 Face Value 10 Bloomberg TPWR.IN Reuters TTPW.BO NSE TATAPOWER BSE 500400 Source: Company, SIHL Research

Tata Power 27th April 2011
2 | P a g e
We arrive at the target price of Rs. 1630 based on Sum of The Parts (SOTP) valuation method which is explained in Exhibit 1. Business Segment
• Coal Mining
Indonesian Coal Mines
TPC (through its SPV Bhira Investments Ltd.) holds 30% equity stake in major Indonesian coal companies, PT Kaltim Prima Coal (KPC) and PT Arutmin Indonesia (Arutmin), owned by Jakarta-based PT Bumi Resources (Bumi). KPC & Arutmin have enjoyed a robust financial performance, especially with increase in coal prices and rising production volumes.
KPC and Arutmin are two of Indonesia's largest coal mines which together produced ~60MTPA in CY09.
Offtake pact
TPC has also signed an offtake agreement with KPC, which entitles it to purchase 10 million tonnes of coal per annum.
Bumi has guided an average coal realization of $77 per tonne and a 10% increase in its production for CY11. It plans to increase production from KPC and Arutmin coal mines to 100MTPA by CY12 end from an estimated production of 65-66 MTPA in CY11. Mining capacity at KPC would increase from 50MTPA to 70MTPA and at Arutmin from 20MTPA to ~30MTPA by the end of CY12 respectively. This would entail an expansion of coal crushing and handling system, upgradation of loading and reduction in cycle time of coal hauling trucks through adding conveyors at the facility. Total capex involvement guided by the company for the said growth plan is ~ $1.1bn.
The Indonesian coal mines will partly secure coal supply for the Mundra Ultra Mega Power Project (Mundra UMPP, Gujarat), Dehrand Thermal Power Project (Coastal Maharashtra) and Trombay (Maharashtra), and will also be a potential source of coal for TPC’s other thermal generation projects. Equity interest in the two Indonesian coal mines also provides a natural hedge against rising coal prices for TPC’s power generation projects that use imported coal.
Tax issues
Previously, Indonesian tax authorities claimed Bumi and its two coal mining companies, KPC and Arutmin, owed about Rp2.1 trillion ($232 million) in tax. In May 2010, Bumi won an Indonesian Supreme Court ruling that rejected appeal of Tax Authorities for a continued investigation. Post a favorable judgment, We expect cash flows from Bumi to revert to FY09 levels.
Exhibit 1: SOTP Business Unit Valuation Method Value Per Share Indonesian Coal SPV DCF Valuation Model 544.1 Standalone Operations DCF Valuation Model 516.0 Mundra (CGPL) DCF Valuation Model 84.0 PTL 2.7x FY12 Book Value 63.1 NDPL 1.5x FY12 Book Value 89.7 Jojobera Residual Income Valuation Model 25.7 IEL Residual Income Valuation Model 12.8 Maithon Project Residual Income Valuation Model 59.5 Telecom Investments Explained in Exhibit 3 230.4 TPTCL (Trading) 25% discount to 22x FY12 EPS 5.0 Target Price 1630.4

Tata Power 27th April 2011
3 | P a g e
In the first year of stake buyout, FY09, the Indonesian Coal business contributed $252mn to TPC; which reduced to $70mn in FY10; and $36mn in 1HFY11 as Bumi had hold up cash for its contingent taxation liabilities. In 3QFY11, contribution from Bumi bounced back to normal levels as evident from the amount of $56.2 mn received by TPC. In FY12, We expect continued momentum from Bumi’s contribution.
We have evaluated TPC’s Indonesian coal business on DCF valuation basis and arrived at a value of Rs. 544.1 per share (based on the assumption of COE at 13%).
TPC’s Captive Coal Blocks in India Overview on Coal Demand
Demand of thermal coal is expected to shoot up in FY12 due to increased consumption led by emerging economies of China and India, and rise in Japanese imports to make up for nuclear power shortfall, post Mar 2011 earthquake.
Indian imports of thermal coal rose by 33% YoY to 65.7MTPA in FY11 from 49.4MTPA in FY10. Indonesia alone made up for more than 65% of India’s coal imports, followed by 29% from South Africa. Based on data from India’s Planning Commission, demand for thermal coal may rise to 750MTPA in 2017.
Exhibit 2: Captive Coal Blocks Name Capacity Stake Details Mandakini Coal Block
7.5MTPA 33% • Jointly allotted to Jindal Photo Film and Monnet Ispat & Energy -each JV Partner having a share of 2.5 MTPA
• Location: Dist. Angul, Orissa
• Mining plan approved by Ministry of Coal
• Land acquisition for the coal block is expected by end 2011
• Project cost: Rs. 600 crores (approx.)
• Coal Block CoD: FY12
• Rated Capacity: FY15 Tubed Coal Block
6.0MTPA 40% • Jointly allocated to Hindalco (60%) 3.6MTPA & TPC (40%) 2.4MTPA
• Location: Latehar, Jharkhand
• Mining plan has been approved and submitted to the Govt. of Jharkhand
• Coal block expected CoD: FY13
• Rated Capacity: FY18

Tata Power 27th April 2011
4 | P a g e
• Power Generation
Maharashtra – 2027MW
TPC’s has a composite 2027MW of power generation capacity in Maharashtra; comprising 1580MW thermal capacity (in Trombay) and 447MW hydro-based capacity in rest of Maharashtra. Of the total 1580MW thermal capacity, 100MW is merchant, 150MW is on standby, 1319MW is supplied directly to retail and bulk consumers in Mumbai, 100MW to Brihanmumbai Electric Supply and Transport Undertaking (BEST), 200MW to Reliance Infrastructure Limited (R Infra) and 158MW is allocated to Tata Power Distribution (TPD). However, 1st April 2011 onwards, power supply agreement with R Infra has ended; and now the 200MW power will be diverted to TPC’s own customers in Mumbai. This would mean that a total of 358MW would be available for sale under either a new Power Purchase Agreement (PPA) or trading.
This business unit is included in TPC’s standalone operations. We have evaluated the standalone business on DCF valuation method and arrived at a value of Rs. 516.0 per share (based on the assumption of COE at 13%).
Mundra UMPP – 4000MW (Gujarat)
Mundra project, awarded to TPC through a competitive tariff based bidding process, is the largest power generation project of TPC. Once commissioned, the project will earn the dual distinction of being the first UMPP to be on stream as well as using the 800 MW supercritical units the first time in the country.
Mundra project has 5 units of 800MW each to be commissioned in stages by FY13. The first unit is expected to be commissioned by Sept 2011. Followed by one unit every four months, the 4000MW capacity is likely to be put on steam by Jan 2013. Of the total capacity of 4000MW, 1600MW is expected to be added by FY12 and the balance 2400MW by FY13.
TPC has planned a total capex of Rs. 17,000 crores for Mundra UMPP, with a debt equity ratio of 75:25. As of Apr 2011, the project is 77% complete.
Fuel supply arrangement
TPC has agreed to procure 10.2 ±20% MTPA coal (a maximum of 12.2MTPA) from KPC for various projects including Mundra project and Dehrand thermal power project (Dehrand). Since, Dehrand is scheduled to commission during FY16-FY17, fuel allocated to Dehrand will be used for Mundra. Fuel requirement for Mundra at its full capacity is estimated to be 12.6 MTPA. Under TPC’s agreement with Bumi, upto Sept 2017, 25% of coal will be priced at a fixed rate of (with minor escalations) and the balance will be linked to the CERC index prices. Post Sept 2017, 100% of this coal will be linked to the CERC index prices. For subsequent additional coal requirement, TPC is eying for small stake acquisitions in overseas coal mines of Australia and Africa.
Tariff
Power generated from Mundra will be supplied at a levelised tariff of Rs. 2.26 per unit for 25 years with first year tariff of Rs.1.91 per unit. We have assumed a minimal rate of inflation of 5% in FY13 and 4% thereafter till FY17.
PPAs
Power evacuation will be through six 400kV lines (to be installed by Power Grid), to ultimately benefit the States of Gujarat (1805MW), Maharashtra (760MW), Punjab (475MW), Haryana (380MW) and Rajasthan (380MW) as contracted under respective PPA agreements.
Valuation
We valued Mundra project on the basis of DCF valuation method (assumption of COE at 15%) and arrived @ Rs. 84.0 per share. We believe coal prices will gradually peak out by FY13, and expect the Mundra UMPP project to be EPS accretive only from FY15 onwards.

Tata Power 27th April 2011
5 | P a g e
Jojobera & Industrial Energy Limited (IEL) (Jharkhand) – 668 MW
These power projects are captive capacities that provide power to Tata Steel facilities. IEL is 74:26 JV with Tata Steel whereas Jojobera which was initially a captive power project of Tata Steel was subsequently taken over by TPC. IEL’s capacity as of FY11 is 240MW of which a unit of 120MW was commissioned on 30th Mar 2011. In FY12, TPC stands to benefit from this first full year generation of new capacity addition.
We evaluated Jojobera and IEL on the basis of Residual Income valuation method and arrived at values of Rs. 25.7 and Rs. 12.8 per share respectively (assumptions of COE at 12% and effective ROE at 18%).
Maithon Thermal Power Plant Project (Jharkhand) – 1050 MW
TPC, under a 74:26 joint venture with Damodar Valley Corporation (DVC), is setting up a 1050 MW (2 units of 525MW each) coal fired mega power plant at Maithon (Jharkhand). The project cost of Rs.4,834 crore is being funded in a debt equity ratio of 70:30. First unit is expected to commission by 1QFY12 and the second unit by 2QFY12. As of Apr 2011, the project is ~ 95% complete.
Fuel supply arrangement
The company has secured 100% fuel requirement (4.5MTPA annually) for Maithon by signing FSAs with Bharat Coking Coal Ltd. for 1.659MTPA, Central Coalfields Ltd for 1.975MTPA and Tata Steel for 0.5-1MTPA.
Tariff
Maithon is under the regulated return model which implies that power generated from this project will be supplied at a CERC regulated tariff (determined on cost plus 15.5% ROE) incentivised on the basis of operational efficiencies.
PPAs
TPC has secured the evacuation of power generated under Maithon project in a combination of Short-term and Long-term PPAs
Long-term
300MW with DVC from the commissioning date (CoD) of the power plant
Balance 750 MW agreements with NDPL (300MW), WBSEB (150MW), PSEB (300 MW), 1st April 2012 onwards
Short-term
From CoD until 1st April 2012, out of the 750 MW power generated, 320MW is secured under short-term PPA and the balance 430MW will be sold in open market. The company is eying for more short term PPAs for the merchant 430MW capacity.
Valuation
We evaluated Maithon project on the basis of Residual Income valuation method (assumption of COE at 12%, and effective ROE at 15.5% in FY12 and 16% in FY13 onwards) and arrived at Rs. 59.5 per share.

Tata Power 27th April 2011
6 | P a g e
• Transmission & Distribution
TPC’s presence in power transmission segment is via Powerlinks Transmission ltd. (PTL) and its Mumbai operations. PTL is a 51:49 JV with PowerGrid Corporation of India for the Tala Transmission Project. It transmits power from Tala Hydroelectric Generation Project in Bhutan to Delhi, a total distance of 1,200 km. We valued PTL by applying industry multiple of 2.7x to its FY12 book value (assuming nominal 5% yearly increase in book value from FY10), thus arriving at a value of Rs.63.1 per share.
TPC's transmission operations in the Mumbai Licensed Area (MLA) envelope 1,100km circuit km. It connects Trombay and the hydro generating stations to receiving stations spread across the MLA, with major ones being Carnac, Parel, Dharavi, Salsette and Borivali receiving stations. The transmission system is interconnected with Maharashtra State Electricity Transmission Company Limited (MSETCL) grid at Trombay, Salsette, Borivali and Kalyan receiving stations. The transmission lines are used by BEST, R Infra, and the company’s own distribution business (TPD).
The company’s distribution operations involve two business units namely, North Delhi Power Limited (NDPL, a 51:49 partnership for distribution with the State Government of Delhi, managing a peak load of 1259MW) and TPD (managing a peak load of 750MW in its Mumbai Licensed Area). TPC has shown excellence in its operations at NDPL, by reducing the major bottleneck of Aggregate Technical and Commercial (AT&C) losses from 53% in FY02 to 14.5% in FY10. NDPL is ahead of its AT&C loss reduction target that enables it to earn incentives resulting in a higher effective ROE. We have valued NDPL at 1.5x its FY12 book value (assuming nominal 5% yearly increase in book value from FY10), thus arriving at a value of Rs.89.7 per share.
The company’s business operations in the Mumbai Licensed Area are included in TPC’s standalone operations.
• Telecom Investment
TPC holds substantial investments in its group telecom businesses and valuations are explained in Exhibit 3.
Exhibit 3: Telecom Valuations
Telecom Investments (Rs. per share) 230.4
TTSL 30% discount to DoCoMo Valuations 112.2
TTML 30% discount to Market Cap as on 25.04.11 7.7
Tata Communications Ltd. 30% discount to Market Cap as on 25.04.11 82.1
Pantone Finvest 30% discount to Market Cap of Tata Communications 28.3

Tata Power 27th April 2011
7 | P a g e
• Power Trading
Tata Power Trading Company Ltd (TPTCL)
Tata Power Trading Company Ltd operates across the entire country including the North-Eastern states. TPTCL traded 2996 Million Units (MUs) in FY09 which grew by 36% (4075 MUs) during FY10. FY10 revenues were up by 9% and stood at Rs.2,358 crores, compared to Rs.2,172 crores in FY09. PAT also increased by 8% to Rs.8.24 crores as against Rs.7.63 crores in FY09. In 9M FY11, TPTCL traded 3144 MUs and reported revenue of Rs.1,388 crores. Average realizations fell from Rs.7.25 in FY09, Rs.5.28 in FY10 to Rs.4.42 in 9MFY11. We expect average realizations of Rs.4.44, Rs.4.50 and Rs.4.25 in FY11, FY12 and FY13 respectively.
We have evaluated TPTCL at 25% discount to industry multiple of 22x its FY12 EPS and arrived at a value of Rs.5.0 per share.
• Strategic Electronic Division (SED)
SED, established in 1967, has been pursuing development and production activities for the Indian defense sector. The Government of India and Ministry of Defence (MoD) awarded seven Defence Production Licenses to SED in 2006, and thereby empowering SED to design, develop, manufacture, assemble and upgrade mission critical systems in seven core areas of Defence Strategic Electronics. Over 90% of the company's strategic electronic efforts are executed for the defense sector. SED has developed specialised equipment for Air Defence and Naval Combat Systems. It has partnered with the MoD, the Armed Forces, DPSUs and DRDO for development & supply of state-of-the-art systems and has now emerged as a prime contractor to MoD for indigenous defense production.
On 11th April 2011, TPC announced its Rs.1,094 crore contract with The MoD for modernising 30 Indian Air Force (IAF) airbases across the country that will enable IAF to handle its modern combat air fleet being inducted. Under this agreement, SED needs to execute the plan within 42 months.
SED generated revenues of Rs.87.2 crores in 9MFY11 v/s Rs.122.9 crores in FY10.
• Logistics
Trust Energy Resources Pte Limited (Trust Energy) With this objective of a vertical integration, TPC incorporated Trust Energy (Singapore) as a wholly owned subsidiary in FY08. The primary aim of Trust Energy is to securitise coal supply and the shipping of coal for TPC's thermal power generation operations. It will also cater to third-party business needs.
The main business activities are • Ship owning, chartering and operating • Investment in coal mining assets, and • Trading in coal
Trust Energy has a portfolio of three long term chartered and two cape sized owned dry bulk carriers in its fleet for overseas transport of coal from sources such as Indonesia, Australia and South Africa.

Tata Power 27th April 2011
8 | P a g e
Financial Information
Consolidated Profit & Loss Statement
Particulars (Rs. Crores) FY10 FY11 FY12 FY13 Operating Income 18,996.8 20,270.3 23,283.2 28,563.0 Total Expenditure 15,132.8 16,049.0 18,079.4 21,707.9 EBITDA 3,853.0 4,221.3 5,203.8 6,855.1 EBITDA Margin 20.3% 20.8% 22.4% 24.0% Depreciation 893.0 890.7 1,191.9 2,184.8 Interest 781.8 1,203.9 1,481.2 1,887.6 Other Income 589.1 595.0 600.9 606.9 Recurring PBT 2,767.3 2,721.7 3,131.6 3,389.6 Provision for Tax 628.7 618.3 711.4 770.0 PAT 2,138.6 2,103.4 2,420.2 2,619.6 PAT Margin 10.9% 10.1% 10.1% 9.0%
Consolidated Balance Sheet Particulars (Rs. Crores) FY10 FY11 FY12 FY13 Share Capital 237.3 237.3 237.3 237.3 Total Reserves 12,070.6 14,025.3 16,265.1 18,684.4 Shareholder's Funds 12,307.9 14,262.6 16,502.4 18,921.7 Total Debts 18,545.7 21,585.2 27,786.8 35,133.8 Total Liabilities 32,063.3 37,057.5 45,498.9 55,265.2 Net Block 15,047.5 14,156.8 24,926.2 46,711.2 Capital Work in Progress 11,692.7 17,250.0 13,500.0 3,800.0 Pre-operative Expenses pending 0.0 0.0 0.0 0.0 Investments 3,082.3 3,582.3 4,582.3 4,582.3 Net Current Assets 2,671.6 2,499.1 2,921.1 602.4 Miscellaneous Expenses not written off 0.0 0.0 0.0 0.0 Deferred Tax Assets / Liabilities -430.8 -430.8 -430.8 -430.8 Total Assets 3,2063.3 37,057.5 4,5498.9 55,265.2
Consolidated Cash flow Statement Particulars (Rs. Crores) FY10 FY11 FY12 FY13 Operating Profit before W/cap Changes 4,392.6 4,049.3 4,912.9 6,491.7 Changes in Working Capital -10.0 24.1 431.2 720.4 Cash generated from Operations 4,382.6 4,073.4 5,344.1 7,212.1 Cash Used in Investing Activities -6,773.7 -6,057.3 -9,211.4 -14,269.8 Cash from Financing Activities 5,595.3 1,835.6 4,720.4 5,459.4 Net Changes in Cash 1,264.5 -148.4 853.2 -1,598.3 Opening Cash Balance 1,179.4 2,310.8 2,162.4 3,015.6 Closing Cash Balance 2,357.2 2,162.4 3,015.6 1,417.3
Source: Company, SIHL Research

Tata Power 27th April 2011
9 | P a g e
Key Ratios Particulars FY10 FY11 FY12 FY13
P/E 16.6 16.2 14.1 13.3 EV/EBITDA 10.1 10.1 9.2 7.0 P/BV 2.5 2.1 1.9 1.6 Dividend yield
0.9% 1.0% 1.1%
Dividend Payout Ratio 15% 15% 15% 15% Per Share Data (Rs)
EPS 82.9 82.3 93.7 99.7 CEPS 120.5 119.9 144.0 191.8 BVPS 518.7 601.0 694.8 794.5 DPS 12.0 11.9 13.6 14.5 Profitability/Solvency Ratios (%)
EBITDA margin 20.3% 20.8% 22.4% 24.0% PAT margin 10.9% 10.1% 10.1% 8.9% ROE 16.0% 13.7% 13.5% 12.6% ROCE 9.2% 9.0% 8.8% 8.3% Debt to equity 1.5 1.5 1.7 1.9
Tata Power 27th April 2011
10 | P a g e
Company Profile
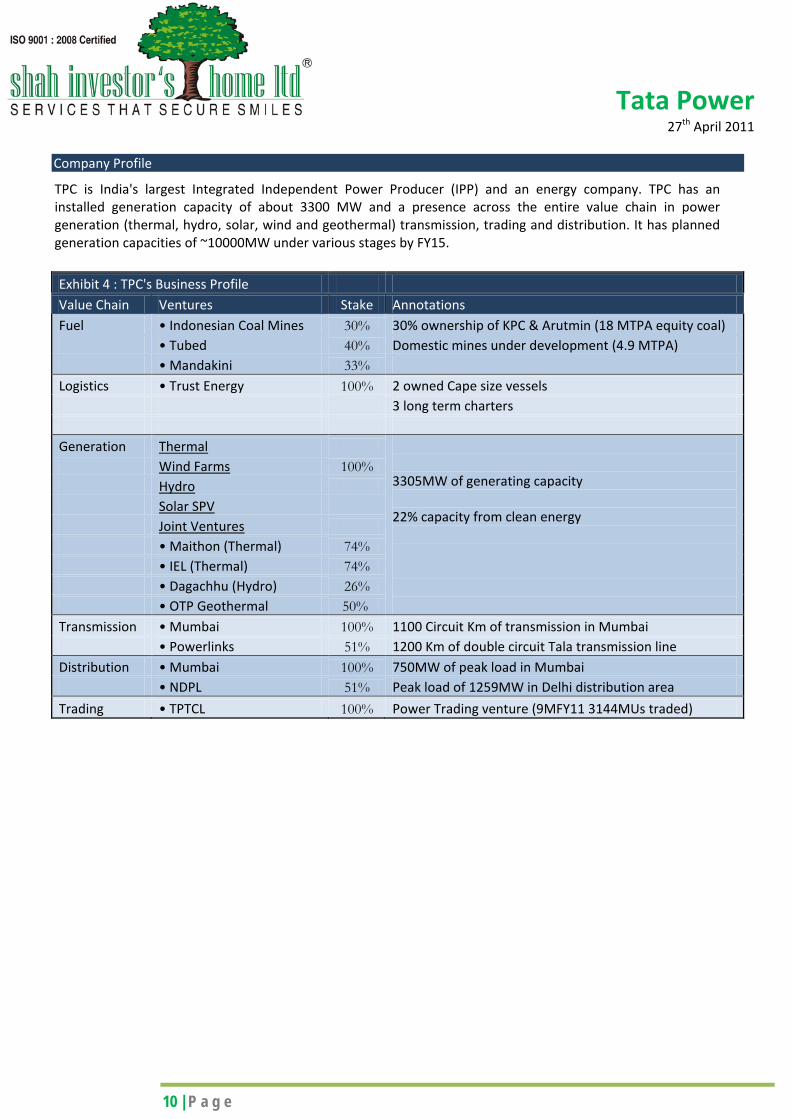
TPC is India's largest Integrated Independent Power Producer (IPP) and an energy company. TPC has an installed generation capacity of about 3300 MW and a presence across the entire value chain in power generation (thermal, hydro, solar, wind and geothermal) transmission, trading and distribution. It has planned generation capacities of ~10000MW under various stages by FY15.
Exhibit 4 : TPC's Business Profile Value Chain Ventures Stake Annotations Fuel • Indonesian Coal Mines 30% 30% ownership of KPC & Arutmin (18 MTPA equity coal) • Tubed 40% Domestic mines under development (4.9 MTPA) • Mandakini 33% Logistics • Trust Energy 100% 2 owned Cape size vessels 3 long term charters Generation Thermal
3305MW of generating capacity 22% capacity from clean energy
Wind Farms 100% Hydro Solar SPV
Joint Ventures • Maithon (Thermal) 74% • IEL (Thermal) 74% • Dagachhu (Hydro) 26% • OTP Geothermal 50% Transmission • Mumbai 100% 1100 Circuit Km of transmission in Mumbai • Powerlinks 51% 1200 Km of double circuit Tala transmission line Distribution • Mumbai 100% 750MW of peak load in Mumbai • NDPL 51% Peak load of 1259MW in Delhi distribution area
Trading • TPTCL 100% Power Trading venture (9MFY11 3144MUs traded)

Tata Power 27th April 2011
11 | P a g e
Exhibit 5: TPC's Power Generation Capacity FY11 FY12 FY13
Thermal Trombay 1580 1580 1580
Jojobera 428 428 428 Belgaum 81 81 81 Haldia 120 120 120 Lodhivali 40 40 40 Mundra
1600 4000
Hydro Khopoli 72 72 72
Bhira 300 300 300 Bhivpuri 75 75 75
Wind Maharashtra 121 121 121
Karnataka 50 50 50 Gujarat 50 50 50 Addition 145 263 263
Solar Mulshi 3 3 3
Mithapur
25 25
Joint ventures IEL 240 240 240
Maithon
1050 1050 DHPC
126
Total 3305 6098 8624
72.6
5%
16.5
8%
10.6
8%
0.09
%
82.6
3%
9.13
%
7.78
%
0.45
%
88.7
1%
5.26
%
5.70
%
0.33
%
0.00%
10.00%
20.00%
30.00%
40.00%
50.00%
60.00%
70.00%
80.00%
90.00%
100.00%
Thermal Hydro Wind Solar
FY11 FY12 FY13
Exhibit 6: Fuel wise break-up of TPC’s generation capacity

Tata Power 27th April 2011
12 | P a g e
Exhibit 7: Projects in Pipeline Project Capacity Fuel Source Stake Status Expected CoD Coastal Maharashtra Project (Dehrand)
2400 MW Imported Coal- 50% coal from KPC and Arutmin allocated
100% • Land Acquisition in progress - 463 out of 900 acres of private land acquired, 200 acres to get transferred on 70% acquisition of private land
Phase 1: 1600MW
Phase 2: 800MW
• BTG Tenders invited FY16 -FY17 • Environmental clearance granted for Phase 1
• Environmental clearance in process for Phase 2
Naraj Marthapur Thermal Project IPP
1320 MW Captive Coal -Mandakini Block
100% • Land Acquisition in progress- more than 50% complete, expected completion FY12 • Environmental Clearance Granted • PPA to be signed
• TPC's share in Mandakini coal - 2.5MTPA FY15 • Estimated Reserves: 291MTPA • Coal production CoD: 1QFY12
• Balance coal requirement for the project is proposed to be secured through linkage
coal
Tiruldih IPP / CPP
1980 MW Captive Coal –Tubed Coal Block (2.4MTPA) + balance coal requirement from Tata Steel
100% • Land Acquisition in progress, completion expected by FY12 end
• Tubed Coal Block has been jointly allotted to TPC
(40%) and Hindalco (60%) in Jharkhand.
• Mining plan approved for 6MTPA of which TPC's
share is 2.4MTPA FY15
• Coal block expected CoD: FY13 • Expected CoD: end
Sorik Merapi 240 MW Geothermal • Exploration under planning • It’s a consortium comprising of TPC (47.5%), Origin energy (47.5%) and PT Supreco
Indonesia (5%)
June 2015 • SPV: PT Sorik Marapi Geothermal Power

Tata Power 27th April 2011
13 | P a g e
Exhibit 7: Projects in Pipeline (continued) Project Capacity Fuel Source Stake Status Expected CoD Dagacchu Hydel Power Plant
126 MW Hydro 26%
• In partnership with The Royal Government of Bhutan (RGoB)
• All statutory clearances recieved • PPA with TPTCL First unit is CoD: FY14
Mithapur 25 MW Solar 100% • PPA for 25yrs with GUVNL
• Tariff: first 15 years at Rs. 15 per unit December 2011 Wind 200 MW Wind • Location (150MW): Maharshtra & Tamil Nadu 150MW unit : FY12
JV with SN Power
2000 MW Hydro • Partnership with SN Power, Norway • Joint hydroprojects in India & Nepal based on the vast reserves of renewable energy in
the Himalayan Region
• Current Status: Exploring possibility of over 500MW in HP 2015
• Eying for aqcuisitions in Sikkim
Corus 525 MW Gas • Under MoU with Tata Steel and Corus Steel B.V
(under re-consideration)
• TPC and Tata Steel will set up a JVto build, own and operate the power plant
• Power plant at Corus’ IJmuiden works in the Netherlands FY14 • Based on the excess production gases of the steel plant and will convert the same into
steam and power for the use of the steel plant

Tata Power 27th April 2011
14 | P a g e
Peer Comparison
Notes:
1) Execution capability is evaluated on the basis of actual lead time in commissioning of the power project vis-a-vis its targeted deadline 2) Operating track record is evaluated on the company’s ability to effectively execute operations, and years of experience in power generation projects
Exhibit 8: Business Performance Parameters Company
name Capacity
(MW) Execution
capabilities Aggression Coal
linkages PLF Long-
term PPAs
Operating track
record
Equipment quality
Total score
Remarks
Adani Power
1320 3 5 5 3 3 1 2 22 Shortest operating track record & high exposure to Chinese equipment
JSW Energy
1730 2 4 2 4 1 3 2 18 Medium term operating track record but high
exposure to Chinese equipment & greater dependency on merchant sales
NTPC 34194 2 3 5 4 5 5 5 29 Longer track record, secured fuel linkages &
strong operating profile, but gripped by execution delays
Reliance Power
1033 2 5 5 5 4 1 2 24 Shorter track record, highly aggressive
business strategy, very high exposure to Chinese equipment
TPC 3300 5 3 5 4 5 5 5 32 Longer track record, fuel linkages in place, strong operating history, timely execution,
conservative & stable business strategy

Tata Power 27th April 2011
15 | P a g e
Exhibit 9: Stock performance ratios Company
Name ROE (%)
ROCE (%)
Debt/ Equity
P/BV P/E Dividend yield (%)
Inclusive score
Remarks
Adani Power
1 0 1 0 0 0 2 Adani Power is in a high growth phase with high leverage, low ROE and high P/BV
JSW Energy
5 4 1 2 5 1 18 JSW Energy is already trading at a premium to the industry valuations
NTPC 2 4 4 3 4 5 22 NTPC is fairly valued, Debt/Equity is on the edge, P/BV is on the higher side. We believe is fully valued
Reliance Power
1 1 2 1 0 0 5 Very low debt, very low ROE, ROCE, close to industry P/BV and very high P/E as compared to industry P/E
TPC 4 5 3 3 4 4 23 TPC has a high ROE, low P/E ratio and stable growth. We believe TPC is undervalued.

Tata Power 27th April 2011
16 | P a g e
Contact Details Shah Investors Home Ltd. [email protected] +91-2204 0782/83 You can also access our reports on Bloomberg (ERH SIH<GO>) & Capital IQ
Disclaimer:
The Information provided by SMS or in newsletter or in any document has been prepared by Shah Investor’s Home Ltd (SIHL). The Information provided by SMS or in newsletter does not constitute an offer or solicitation for the purchase or sale of any financial instrument or as an official confirmation of any transaction. The information contained herein is from publicly available data or other sources believed to be reliable, but we do not represent that it is accurate or complete and it should not be relied on as such. SIHL or any of its affiliates/ group companies shall not be in any way responsible for any loss or damage that may arise to any person from any inadvertent error in the information contained in this report or SMS. This Information provided by SMS, reports or in newsletter is provided for assistance only and is not intended to be and must not alone be taken as the basis for an investment decision. The user assumes the entire risk of any use made of this information. Each recipient of this Information provided by SMS, report or in newsletter should make such investigation as it deems necessary to arrive at an independent evaluation of an investment in the securities of companies referred to in this information provided by SMS, report or in newsletter (including the merits and risks involved), and should consult his own advisors to determine the merits and risks of such investment. The investment discussed or views expressed may not be suitable for all investors. This information is strictly confidential and is being furnished toyou solely for your information.
The information should not be reproduced or redistributed or passed on directly or indirectly in any form to any other person
or published, copied, in whole or in part, for any purpose. The information provided by report or SMS is not directed or intended for distribution to, or use by, any person or entity who is a citizen or resident of or located in any locality, state, country or other jurisdiction, where such distribution, publication, availability or use would be contrary to law, regulation or which would subject SIHL and affiliates/ group companies to any registration or licensing requirements within such jurisdiction. The distribution of this Information provided by SMS or in newsletter in certain jurisdictions may be restricted by law, and persons in whose possession this Information provided by SMS or in newsletter comes, should inform themselves about and observe, any such restrictions. The information given or Information provided by SMS, report or in newsletter is as of the date of the issue date of report or the date on which SMS provided and there can be no assurance that future results or events will be consistent with this information. This information is subject to change without any prior notice. SIHL reserves the right to make modifications and alterations to this statement as may be required from time to time. However, SIHL is under no obligation to update or keep the information current.
Nevertheless, SIHL is committed to providing independent and transparent recommendation to its client and would be happy
to provide any information in response to specific client queries. Neither SIHL nor any of its affiliates, group companies, directors, employees, agents or representatives shall be liable for any damages whether direct, indirect, special or consequential including lost revenue or lost profits that may arise from or in connection with the use of the information. Past performance is not necessarily a guide to future performance. The disclosures of interest statements incorporated in the Information provided by SMS, report or in newsletter are provided solely to enhance the transparency and should not be treated as endorsement of the views expressed in the report. The analyst for this report certifies that all of the views expressed in this report accurately reflect his or her personal views about the subject company or companies and its or their securities, and no part of his or her compensation was, is or will be, directly or indirectly related to specific recommendations or views expressed in this report.