tata quick reference booklet - transformation leader
TRANSCRIPT


Front Matter

Foreword
Dear Friends,
As the Tata Group closes in upon the celebration of a century-and-a-half of growth and public service, I am reminded that this will be but a milestone on the road to the century-and-a-half to follow.
Even as we celebrate our continued success as a business group, we are reminded of our Founder’s statement that “… what advances a nation or a community is not so much to prop up its weakest and most helpless members, but to lift up the best and the most gifted, so as to make them of the greatest service to the country.”
In pursuit of carrying our already superior Group to new standards of excellence, we provide this booklet to set a common language of improvement. Through the few simple tools and philosophies included herein we aim to solidify a culture of continuous improvement and collaboration within and between every Tata company.
I am pleased with our many companies’ efforts in their journeys to advance Operational Excellence so far. To reach the aspirational goals we have for our Group, I ask each of you to apply these tools to carry us forward to an even brighter tomorrow.
With warm regards,
Sunil Sinha Chief – Tata Quality Management Services

© 2013 by Tata Sons
Any reproduction of any part of this publication
without the written consent of Tata Sons’ Tata
Quality Management Services division is
prohibited.
Tata Group
This Edition Updated: July 29, 2013
10 9 8 7 6 5 4 3 2 1
Tata Group Point of Contact
TQMS Operational Excellence
91-90290-11103 India
01-503-623-5361 USA
E-mail: [email protected]
Web: www.TataQuick.com/QR/TQMS
First Edition: July 29, 2013

Table of Contents Tata Culture .......................................................... 2
About the Company ......................................... 2
Key Approaches .............................................. 5
uestion Everything (Section 1) ...................... 10
The Three Questions ..................................... 12
The Learning Cycle ....................................... 13
Right Things Right ........................................ 14
Quick Start - Beginning a Project ................. 15
nderstand Today (Section 2) ......................... 16
Process Map .................................................. 18
Cause and Effect ........................................... 20
Data Analysis: Scatter; Histogram; Affinity; Run; Pareto ........................................ 22
magine Tomorrow (Section 3) ...................... 32
Jugaad, Brainstorming & Benchmarking ...... 34
The Seven Wastes: Motion; Rework; Waiting; Alignment; Storage; Travel; Excess ... 40
Prioritization/Decision Matrix ........................ 42
Force Field Analysis ...................................... 44
hange The World (Section 4) ........................ 46
Project Management: Charter; RACI; Work Breakdown Structure (WBS Tree); FMEA ........ 48
People and Teams: Team Stages; Science of Influence; Ladder of Inference ..................... 56
eep The Change (Section 5) .......................... 62
Operational Definition & Readiness ............. 64
Dharma & Karma ............................................ 66
Radar/Spider Chart; Control Chart ............... 68
Survey; Checksheet ...................................... 72
Key Terms & Key Resources ............................ 74

2 Tata & Quick Overview ©2013 Tata
About The Company
The Tata group comprises over 100 operating companies in seven business sectors: communications and information technology, engineering, materials, services, energy, consumer products and chemicals. The group has operations in more than 80 countries across six continents, and its companies export products and services to 85 countries.
The total revenue of Tata companies, taken together, was $100.09 billion (around ₹475,721 crore) in 2011-12, with 58 percent of this coming from business outside India. Tata companies employ over 450,000 people worldwide. The Tata name has been respected in India for more than 140 years for its adherence to strong values and business ethics.
Every Tata company or enterprise operates independently. Each of these companies has its own board of directors and shareholders, to whom it is answerable. There are 32 publicly listed Tata enterprises and they have a combined market capitalisation of about $89.40 billion (as on July 18, 2013), and a shareholder base of 3.8 million. The major Tata companies are Tata Steel, Tata Motors, Tata Consultancy Services (TCS), Tata Power, Tata Chemicals, Tata Global Beverages, Tata Teleservices, Titan, Tata Communications and Indian Hotels.
Tata Steel is among the top ten steelmakers, and Tata Motors is among the top five commercial vehicle manufacturers, in the world. TCS is a leading global software company, with delivery centres in the US, UK,

©2013 Tata Tata & Quick Overview 3
Hungary, Brazil, Uruguay and China, besides India. Tata Global Beverages is the second-largest player in tea in the world. Tata Chemicals is the world’s second-largest manufacturer of soda ash and Tata Communications is one of the world’s largest wholesale voice carriers.
In tandem with the increasing international footprint of Tata companies, the Tata brand is also gaining international recognition. Brand Finance, a UK-based consultancy firm, valued the Tata brand at $18.16 billion and ranked it 39th among the top 500 most valuable global brands in their BrandFinance® Global 500 2013 report. In 2010, BusinessWeek magazine ranked Tata 17th among the '50 Most Innovative Companies' list.
Founded by Jamsetji Tata in 1868, Tata’s early years were inspired by the spirit of nationalism. It pioneered several industries of national importance in India: steel, power, hospitality and airlines. In more recent times, its pioneering spirit has been showcased by companies such as TCS, India’s first software company, and Tata Motors, which made India’s first indigenously developed car, the Indica, in 1998 and recently unveiled the world’s most affordable car, the Tata Nano.
Tata companies have always believed in returning wealth to the society they serve. Two-thirds of the equity of Tata Sons, the Tata promoter holding company, is held by philanthropic trusts that have created national institutions for science and technology, medical research, social studies and the performing arts. The trusts also provide aid and assistance to non-government organisations working in the areas of education, healthcare and livelihoods. Tata companies also extend social welfare activities to communities around their industrial units. The combined development-related expenditure of the trusts and the companies amounts to around 3 percent of the group's net profits in 2011.

4 Tata & Quick Overview ©2013 Tata
Going forward, Tata is focusing on new technologies and innovation to drive its business in India and internationally. The Nano car is one example, as is the Eka supercomputer (developed by another Tata company), which in 2008 was ranked the world’s fourth fastest. Anchored in India and wedded to traditional values and strong ethics, Tata companies are building multinational businesses that will achieve growth through excellence and innovation, while balancing the interests of shareholders, employees and civil society.
Tata has always been values-driven. These values continue to direct the growth and business of Tata companies. The five core Tata values underpinning the way we do business are:
1. Integrity: We must conduct our business fairly, with honesty and transparency. Everything we do must stand the test of public scrutiny.
2. Understanding: We must be caring, show respect, compassion and humanity for our colleagues and customers around the world, and always work for the benefit of the communities we serve.
3. Excellence: We must constantly strive to achieve the highest possible standards in our day-to-day work and in the quality of the goods and services we provide.
4. Unity: We must work cohesively with our colleagues across the group and with our customers and partners around the world, building strong relationships based on tolerance, understanding and mutual cooperation.
5. Responsibility: We must continue to be responsible, sensitive to the countries, communities and environments in which we work, always ensuring that what comes from the people goes back to the people many times over.

©2013 Tata Tata & Quick Overview 5
Key Approach
Definition of the word "QUICK"
The Merriam-Webster Dictionary provides the following entry for the word QUICK:
Main Entry: quick - Pronunciation: \ˈkwik\
Function: adjective
1 : living, alive
2 : acting or capable of acting with speed: as
a (1) : fast in understanding, thinking, or learning : mentally agile <a quick wit> <quick thinking>
(2) : reacting to stimuli with speed and keen sensitivity
(3) : aroused immediately and intensely <quick tempers>
b (1) : fast in development or occurrence <a quick succession of events>
(2) : done or taking place with rapidity <gave them a quick look>
c : marked by speed, readiness, or promptness of physical movement <walked with quick steps>
d : capable of being easily and speedily prepared <a quick and tasty dinner>
Function: noun
a : the inmost sensibilities <hurt to the quick by the remark>
b : the very centre of something : heart
Function: adverb
1 : in a quick manner
Key Approaches

6 Tata & Quick Overview ©2013 Tata
Key Approach
Values of a Quick Organization
Embracing a culture of Continuous Improvement enables our organization to prosper in the future. We can assess our organizational culture by seeing how closely we align with these values of a Quick organization.

©2013 Tata Tata & Quick Overview 7
Key Approach
Multiplier Effect
The behaviours we display – especially as leaders – when interacting with others can have a tremendous effect on how productively things may go after the interaction. By
engaging the Multiplier Effect, we open the future for the greatest possibilities. In essence, when presented with an idea during a conversation, four responses are available. As much as possible, the Multiply option should be pursued:
Subtract from the conversation: Disagree with the idea in a way that takes away from it without making use of the core thinking behind the idea.
Divide the conversation: Disagree with
the idea in a way that not only takes away from the idea, but creates bad feelings in the other person, damaging relationships.
Add to the conversation: Agree with the idea to reinforce it, helping the idea to move forward, but without building upon it. The Add option is good, the Multiply option is better.
Multiply the conversation: Agree or disagree with the idea, but suggest potential new avenues of thinking that build on a good idea or help turn a bad idea into a good idea.

8 Tata & Quick Overview ©2013 Tata
Key Approach
The QUICK Cycle
A simple approach to learning and improvement: Continuously look for improvement opportunities by understanding how the world works presently. Then act upon those opportunities by finding and using new ways of doing things that get better results for the future.

©2013 Tata Tata & Quick Overview 9
How to use the Quick Reference guide
The Quick Reference guide is designed for you to use as a convenient and effective aide on the job. Refresh your knowledge of the tools as you put them to use!
Throughout the Quick Reference guide you will find informative icons. These icons indicate the following:
Purpose — What is the tool intended to
accomplish?
Process — Detailed description on how to apply
the tool.
Payoff — An explanation of how this tool can improve your results.
Insight — Key learnings on the best practices in applying this tool.
Application — An example to help reinforce the method and value of the tool.
Variants — Alternative ways in which this tool may be presented and used.
ASQ Resource — Look for more information on this tool on the ASQ web site.
Wikipedia — Look for details on Wikipedia.org.
10 Section 1 - Question Everything ©2013 Tata
Question Everything "…please question the unquestionable.
I tried to tell our younger managers just
don't accept something that was done in
the past, don't accept something as a
holy cow… go question it."
Ratan Tata
Tata Chairman 1991 - 2012

©2013 Tata Section 1 - Question Everything 11
Question Everything
A surprisingly large amount of what we think we know to be true is actually false. We make assumptions based upon our past experience, what we are told, or what we think makes sense. To be able to learn and grow we must continuously challenge our assumptions. We must question ourselves, our bosses, our peers, our whole world in order to learn the truth. Questioning is often difficult and sometimes in conflict with how we were taught to behave, but it is essential to learning and growth. We all must foster a culture of questioning.
In this section we cover four concepts related to Questioning:
The Three Questions - Simple Questions that can guide us to focus on what is truly important and to help us find the best ways to be more effective in those areas of value.
The Learning Cycle - The classic "scientific method" of Plan-Do-Study-Act (PDSA) that has fuelled value creation and progress for ages. This is the cycle that lets us test our theories to build our knowledge and wisdom.
Right Things Right - A simple tool to remind us that just
because we are busy working on something, it doesn't mean it is the right thing to work on. By questioning the work we do we can stop working on the wrong things and start working on the right things
Quick Start - Beginning a Project - Once you are
ready to go after improvement, use this handy guide on which tools to use first to get your improvement project going.

12 Section 1 - Question Everything ©2013 Tata
Key Concept
The Three Questions
The Three Questions are used to focus on what is important to you, how well you are doing in the areas of importance, and to help you think of ways to get better in these areas. The Three Questions lead naturally into using The Learning Cycle to test your plans to improve. Together, these two techniques form a Model For Improvement.
The Three Questions are:
1. What are you trying to Accomplish? It is amazing how often people in a group disagree about the answer to this questions, and how often their answer doesn't align with their customers' needs.
2. How would you know a Change was an Improvement? What symptoms tell you your process is healthy? If you can't answer this question, then you can't manage what you are doing. Trying to answer this question often gives insight into the actual answer to Question 1.
3. What Changes could you test that might result in an Improvement? Once you know your purpose (Question 1) and have a way of evaluating your effectiveness (Question 2) you can test ideas using Learning Cycles and see whether your effectiveness (Q2) improves, increasing your ability to meet your customers' needs (Q1).

©2013 Tata Section 1 - Question Everything 13
Key Concept
The Learning Cycle
The Learning Cycle is known by many names, including The Scientific Method, Plan-Do-Check-Act (PDCA), and Plan-Do-Study-Act (PDSA). It is the process of forming a hypothesis (a hypothesis is an untested theory) based upon available evidence, using that hypothesis to predict measurable responses to specific conditions (tests), then running tests to gain knowledge about the validity of the hypothesis. These tests provide additional evidence that may then be used to form new hypotheses. The PDCA-PDSA cycle is not intended to be a project framework but a process for rapid learning.
The nature of improvement work is to venture into unknown territory. By using learning cycles you can ensure you are making progress in the right direction.
Steps in The Learning Cycle:
1. Plan a change or a test, aimed at improvement. This is the foundation for the entire PDCA-PDSA cycle. The term “plan” may simply refer to a small process change one is interested in exploring.
2. Do. Carry out the change or the test (preferably on a small scale). It is important that the DO step carefully follow the plan, otherwise learning will not be possible.
3. Study the results. What was learned? What went
wrong?
4. Act. Adopt the change, or abandon it, or
run through the cycle again.

14 Section 1 - Question Everything ©2013 Tata
Key Concept
The Right Things, Done The Right Way
"Right Things Right" is a simple reminder that the things we work on are not always the most important (right things), and we do not always get the best results (done right) on the things we do work on. Tools drawn from Lean help us to focus on the right things by Driving Out Waste, and tools drawn from Six Sigma help us to ensure excellent results from our areas of endeavour by delivering First Time Right.
©2013 Tata Section 1 - Question Everything 15
Key Concept
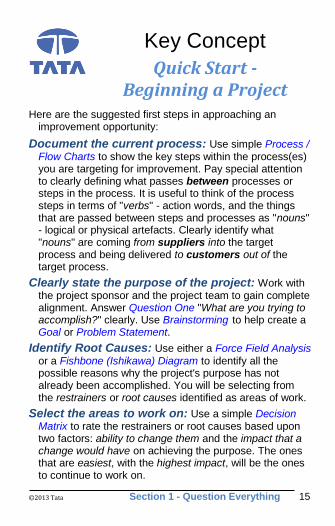
Quick Start - Beginning a Project
Here are the suggested first steps in approaching an improvement opportunity:
Document the current process: Use simple Process / Flow Charts to show the key steps within the process(es) you are targeting for improvement. Pay special attention to clearly defining what passes between processes or steps in the process. It is useful to think of the process steps in terms of "verbs" - action words, and the things that are passed between steps and processes as "nouns" - logical or physical artefacts. Clearly identify what "nouns" are coming from suppliers into the target process and being delivered to customers out of the target process.
Clearly state the purpose of the project: Work with the project sponsor and the project team to gain complete alignment. Answer Question One "What are you trying to accomplish?" clearly. Use Brainstorming to help create a Goal or Problem Statement.
Identify Root Causes: Use either a Force Field Analysis
or a Fishbone (Ishikawa) Diagram to identify all the possible reasons why the project's purpose has not already been accomplished. You will be selecting from the restrainers or root causes identified as areas of work.
Select the areas to work on: Use a simple Decision Matrix to rate the restrainers or root causes based upon two factors: ability to change them and the impact that a change would have on achieving the purpose. The ones that are easiest, with the highest impact, will be the ones to continue to work on.
16 Section 2 - Understand Today ©2013 Tata
Understand Today
"With honest and straightforward
business principles, close and careful
attention to details, and the ability to
take advantage of favorable
opportunities and circumstances, there
is a scope for success."
Jamsetji Tata
Tata Group Founder

©2013 Tata Section 2 - Understand Today 17
Understand Today
In order to identify big opportunities for improvement we must not only understand what we do, but how what we do impacts what others do.
In this section we cover three areas related closely to Understanding:
Process Mapping - A general class of tools that allow us
to represent how various parts of a system relate to each other. Process maps, in their various forms, help people to understand their role in the world, and to understand how their role affects the outcomes of the larger system. One well-known form of process map is the "SIPOC" - standing for Supplier, Input, Process, Output, and Customer. All Process Maps share the SIPOC philosophy of clearly identifying the linkages between steps and what is delivered across those linkages.
Cause-and-Effect - These tools help us to understand not just what is happening in the world today, but to understand why it is happening. When we understand why something is happening (the causes) we have an opportunity to change those causes, in turn changing the effects of those causes.
Data Analysis - A variety of data analysis tools that help us to identify patterns, which in turn can help us guide our efforts in understanding what these patterns might be revealing to us. The tools we explore here can be remembered by the acronym "SHARP" - standing for Scatter, Histogram, Affinity, Run, and Pareto.
18 Section 2 - Understand Today ©2013 Tata
Key Tool
Process Map
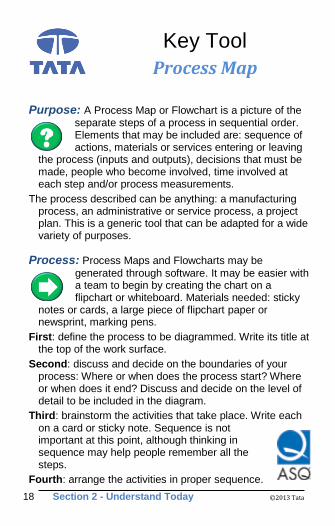
Purpose: A Process Map or Flowchart is a picture of the separate steps of a process in sequential order. Elements that may be included are: sequence of actions, materials or services entering or leaving
the process (inputs and outputs), decisions that must be made, people who become involved, time involved at each step and/or process measurements.
The process described can be anything: a manufacturing process, an administrative or service process, a project plan. This is a generic tool that can be adapted for a wide variety of purposes.
Process: Process Maps and Flowcharts may be
generated through software. It may be easier with a team to begin by creating the chart on a flipchart or whiteboard. Materials needed: sticky
notes or cards, a large piece of flipchart paper or newsprint, marking pens.
First: define the process to be diagrammed. Write its title at the top of the work surface.
Second: discuss and decide on the boundaries of your process: Where or when does the process start? Where or when does it end? Discuss and decide on the level of detail to be included in the diagram.
Third: brainstorm the activities that take place. Write each on a card or sticky note. Sequence is not important at this point, although thinking in sequence may help people remember all the steps.
Fourth: arrange the activities in proper sequence.

©2013 Tata Section 2 - Understand Today 19
Fifth: when all activities are included and everyone agrees that the sequence is correct, draw arrows to show the flow of the process.
Finally: review the flowchart with others involved in the process (workers, supervisors, suppliers, customers) to see if they agree that the process is drawn accurately.
Payoff: The Process Map drives shared understanding of
the responsibilities of each person in a complex system as well as clarity of what each person must deliver to make the whole system
successful.
Variant: A commonly used
version of the Process Map is the Value Stream Map
(VSM). The VSM highlights the time to do each step and whether each step adds value to the customer.
20 Section 2 - Understand Today ©2013 Tata
Key Tool
Cause and Effect
Purpose: The Cause-and-Effect or Fishbone Diagram - also called an Ishikawa Diagram - identifies many possible causes for an effect or problem. It can be used to structure a brainstorming session. It
immediately sorts ideas into useful categories.
Process: This diagram may be generated with software. To provide the information needed to generate the chart, do the following - either on a flipchart or whiteboard or on the computer:
First: agree on a problem statement (effect). Write it at the centre right of the flipchart or whiteboard. Draw a box around it and draw a horizontal arrow running to it.
Second: brainstorm the major categories of causes of the problem. If this is difficult use generic headings: Methods; Machines (equipment); People (manpower); Materials; Measurement; and Environment
Third: write the categories of causes as branches from the main arrow.
Fourth: brainstorm all the possible causes of the problem. Ask: “Why does this happen?” As each idea is given, the facilitator writes it as a branch from the appropriate category. Causes can be written in several places if they relate to several categories.
Fifth: again ask “why does this happen?” about each cause. Write sub-causes branching off the causes. Continue to ask “Why?” and generate deeper levels of causes. Layers of branches indicate causal relationships.

©2013 Tata Section 2 - Understand Today 21
Finally: Review the chart, highlighting causes that appear to be easiest to address with the greatest level of impact.
Payoff: The Fishbone Diagram allows teams to see the complexity of potential causes for problems in one view, rapidly gaining alignment on thinking across groups. Further, it helps groups quickly identify
the most fruitful areas for work, saving a significant amount of improvement effort time and money.
Insight: The thought process involved in the Fishbone
Diagram is essential to rapid learning: always ask "why" to find out the cause behind the effect. Note that most problems or opportunities relate to
multiple causes, so improvement work must address the "system of causes" rather than just one thing.
Variant: Another commonly used tool to uncover root
causes is the "five whys" technique, in which teams generate a first level list of causes, ask why those causes
exist to create another level, and so on.

22 Section 2 - Understand Today ©2013 Tata
Key Tool
Scatter Plot
Purpose: Scatter Plots or Scatter Charts are used to allow us to identify patterns and potential relationships that occur between two or more factors. When exploring ways to improve a result, it is desirable
to understand what potential causes might be leading to the targeted result. To gain insight, showing a metric for a potential cause taken at the same time as the metric for the targeted result can allow us to visually detect whether a relationship of some type exists between the result and the potential cause.
Process: This chart may be automatically generated with software. To provide the data needed to generate the chart, do the following:
First: identify the process or result of interest to us. The best candidates for scatter plots are those where we believe there may be some interaction between two aspects or factors of our process.
Second: identify measurable attributes (factors) of that process or result that are suitable for charting.
Third: measure these attributes at the same time. These measurements will result in "paired" data, which would be entered onto a two-column spreadsheet.
Fourth: plot the resulting measures with one factor on the horizontal axis and the other factor on the vertical axis.
Finally: look at the resulting chart to see and understand linear or non-linear patterns. Patterns between factors are also called relationships.

©2013 Tata Section 2 - Understand Today 23
Payoff: The patterns identified through the Scatter Plot will provide immediate insight into how the portions of your process or complex system may interact with and affect each other. These insights may lead
directly to root cause identification or suggest next steps.
Insight: The Scatter Plot simply shows the values of two
factors at given points in time. The patterns may or may not indicate that one of the factors affects the other. Beware of assuming a "causal"
relationship (one factor drives the other) as there may actually be other, unconsidered factors that are driving both the factors on our Scatter Plot.
Application: When seeking to understand a complex
system we may use software to generate many Scatter Plots, seeking patterns. Then we calculate a Correlation Coefficient
that shows the strength of each pattern. We then focus on areas of strong correlation.
24 Section 2 - Understand Today ©2013 Tata
Key Tool
Histogram
Purpose: A Histogram is a frequency distribution which shows how often each different value in a set of data occurs. A histogram is the most commonly used graph to show frequency distributions. It
looks very much like a bar chart. It is used to understand the amount of variation that exists in a process.
Process: This chart may be automatically generated with software. To provide the data needed to generate the chart, do the following:
First: identify the process or result of interest to us. The best candidates for histograms are those where variation is expected to exist, such as time between customer calls or time to complete a process.
Second: identify "buckets" related to measurable attributes (factors) of that process or result, such that we can count the number of instances that occur within each "bucket."
Third: collect or translate data to identify the number of instances that occurred within each "bucket" or category. Ideally, the number of categories chosen will be small enough to allow for a significant number of instances to occur within individual categories.
Fourth: plot the resulting frequencies as bars, with the categories shown on the horizontal axis and the number of instances in each category shown on the vertical axis.
Finally: look at the resulting chart - often bell shaped - to see and understand the amount of variation in the results.

©2013 Tata Section 2 - Understand Today 25
Payoff: The Histogram is particular useful in making
comparisons between a desired state and an actual state. By comparing the pattern against a customer's specification limits we can estimate the
likelihood we have of achieving the specification on an ongoing basis.
Insight: There are many different "probability distributions"
that are used to describe how variation affects the real world. Many of our analysis tools are based upon the assumption that our processes of
interest can be described by the "Normal distribution" - the classic bell-shaped curve. However, in many cases the Normal distribution does not apply. By looking at the Histogram we can quickly determine whether we have a "normal" process. Be alert for the "bell" leaning (skewed) to one side (as above) or for there being two or more high points (bi-modal or multi-modal) rather than one central peak.

26 Section 2 - Understand Today ©2013 Tata
Key Tool
Affinity Diagram
Purpose: The Affinity approach helps the group to understand common themes and to sort opportunities to make them easier to address.
Process: The key outcome of an Affinity Diagram, or any Affinity-based approach is to group things together. The most common use of an Affinity Diagram starts with existing information, such as
that collected during brainstorming, as shown here:
First: have the team look at the data to suggest common themes. Generally the number of themes (or categories) should be relatively small {Example: 30 items should lead to about 6 categories}.
Finally: move each item into the category for which it is best suited.

©2013 Tata Section 2 - Understand Today 27
It is possible that some items may fall into more than one category. If so, the team should feel free to create duplicate items, or to reword the items to become more specific such that they will fit the categories better.
Payoff: Information overload can cause people and teams to either freeze up or get lost on their journey towards improvement. This technique helps to simplify complex information, and can help
individuals and teams address and improve whole categories of opportunities rather than single opportunities alone.
Insight: Because categorization is so helpful in letting
individuals and teams understand and explore complex systems, many other tools have Affinity approaches integrated within them. These
approaches may use Affinity after the fact, such as is done with Multi-Voting, or they may select the Affinity categories before the fact, such as is done by pre-selecting the main "bones" in a Cause-and-Effect (Fishbone) Diagram.
28 Section 2 - Understand Today ©2013 Tata
Key Tool
Run Chart
Purpose: Run Charts are used to allow us to identify patterns over time.
Changes to a process often occur gradually, and may not be noticed from one day to the next. By keeping run charts visible we can detect gradual changes. We can also identify patterns related to time that may provide insight when trying to understand the causes of changes in our processes or results.
Process: This chart may be automatically generated with software. To provide the data needed to generate the chart, do the following:
First: identify the process or result of interest to us. The best candidates for run charts are processes that operate regularly where the cost of measurement is relatively low.
Second: identify measurable attributes of that process or result that are suitable for charting.
Third: measure these attributes on a regular basis. How often the attributes are measured may relate to how we wish to use our run charts. Run charts can range from data measured annually to data measured almost constantly.
Fourth: plot the resulting measures against the time at which the measurement occurred.
Finally: look at the resulting chart to see and understand trends or other patterns that are occurring over time.

©2013 Tata Section 2 - Understand Today 29
Payoff: The patterns identified through the Run Chart will
provide immediate insight into the health of our process. Adding control limits (see Control Chart) will give us signals on when to act.
Insight: The Run Chart can be seen as a specialized
version of the Scatter Plot using time as one of the two factors compared. If we collect many sets of data at the same time, or if our periods of data
collection are irregular, try using the Scatter Plot.
Application: The Run Chart is one of the most widely
used tools in business today. Perhaps the most visible use of Run Charts comes in tracking the health of the economy or, more specifically, the
health of individual businesses. By reviewing patterns revealed by stock price run charts, investors have discovered that stocks do better in the month of January (January effect) but worse on Mondays.

30 Section 2 - Understand Today ©2013 Tata
Key Tool
Pareto Chart
Purpose: A Pareto chart is a bar graph. The lengths of the bars represent frequency or cost (time or money), and are arranged with the longest bars to the left and the shortest to the right. In this way the chart
visually depicts which situations may be more significant.
While best known as the "80-20 rule" the actual ratios may differ from this guideline. In general, the Pareto Chart is used to help us focus our efforts on the areas with the greatest potential impact.
Process: This chart may be automatically generated with software. To provide the data needed to generate the chart, do the following:
First: identify the process or result of interest to us. The best candidates for Pareto analysis are categories (such as causes of failure) that have events (such as failures) that may be counted.
Second: identify categories in which counts will be made. The number of categories chosen should be small enough to allow a significant number of counted items in most categories.
Third: count the number of events or other countable data that occur within each category.
Fourth: arrange the categories in order based upon the number counted, with the categories with the highest count coming first.

©2013 Tata Section 2 - Understand Today 31
Finally: chart the data using columns (or bars) that represent the counted number in the categories chosen.
Payoff: The application of the Pareto Principle helps us to
separate the "significant few" from the "trivial many." This tool is used to prioritize work, avoid low-value activities, and to drive understanding.
Variant: The intent of Pareto Analysis is to draw attention
to the categories where most of the events or items are concentrated. While column and bar graphs are traditionally used, the same data is
also commonly presented using pie charts.

32 Section 3 - Imagine Tomorrow ©2013 Tata
Imagine Tomorrow
"There are solutions for most problems.
The barriers and roadblocks that we
face are usually of our own making and
these can only be demolished by having
the determination to find a solution,
even contrary to the conventional
wisdom that prevails around us, by
breaking tradition."
Ratan Tata

©2013 Tata Section 3 - Imagine Tomorrow 33
Imagine Tomorrow
Planning for the world of tomorrow requires that we take our scientific understanding of the world of today and apply our own creativity - art - to select and test the best possible changes for the future.
In this section we cover four areas related closely to how we can Imagine a better tomorrow:
Jugaad (Improvise & Innovate), Brainstorming & Benchmarking - Unleashing our own creative side through thinking differently, openly engaging the creativity of our teams, and getting ideas through looking at how others might address similar opportunities.
The Seven Wastes - A listing of waste areas that help us to discover things we shouldn't be doing - things that don't add value to our stakeholders. By focusing our creativity on the elimination of these wastes, we generate valuable plans to improve our future. The Seven Wastes we explore here can be remembered by the acronym: "MR WASTE" - standing for Motion, Rework, Waiting, Alignment, Storage, Travel, and Excess.
Prioritization/Decision Matrix - A comprehensive tool that helps us to compare the many creative ideas we have to choose from. This tool identifies the most valuable things to move forward. This tool helps us to ensure we always work on the most valuable things.
Force Field Analysis - This tool encourages open discussion about how the world of today is driving us towards - or keeping us away from - our desired world of tomorrow. Used this tool to find ways to increase the power of helpful things and decrease the power of harmful things.

34 Section 3 - Imagine Tomorrow ©2013 Tata
Key Concept
Jugaad (जुगाड़) - Improvise & Innovate
Purpose: "Jugaad" or "Jugaard" literally means an
arrangement or a work around, which has to be used because of lack of resources The Jugaad approach drives innovation across the society
because it starts with the assumptions that "there is a way" to make something work that is not obvious. Jugaad drives people to innovate even if a known (but expensive) solution already exists. This drives creation of new, low cost solutions that create new markets through "frugal engineering" and "reverse innovations."
Process: "Jugaad" is a colloquial Hindi word that can mean an innovative fix, sometimes pejoratively used for solutions that bend rules, or a resource that can be used as such or a person who can
solve a vexatious issue. It is a tribute to native genius and lateral thinking. The colloquial meaning of the word is abundantly used. It usually signifies the creativity of the native people to make existing things work or create new things with meagre resources.
First: define the problem. When approaching problems and opportunities care should be taken that the end result is sustainable, as often Jugaad is associated with short term fixes rather than robust solutions. While Jugaad harnesses tremendous amounts of creative energy to find a solution, it is important that there is great clarity about the problem which is to be solved.
Second: understand the situation. Apply root cause analysis tools to understand why the problem exists.

©2013 Tata Section 3 - Imagine Tomorrow 35
Third: assess the resources. Review the capabilities that can be applied to whatever solution is implemented.
Fourth: create potential solutions that use the available resources then try out and refine the created solutions.
Finally: implement and standardize the most successful and sustainable solutions.
Payoff: By using the Jugaad concept the team can channel their energies away from complaining about barriers and anticipating excuses for failure into finding effective solutions. Ideas will flow
faster, progress will accelerate, and solutions (even those using additional resources) will be more cost effective.
Insight: Innovation depends on creative thinking. Creative
thinking flows quicker when people are pushed "outside their comfort zone." Many creative thinking techniques ask people to start with what
may appear to be crazy assumptions (like a lack of resources) because this gets the mind to open up.

36 Section 3 - Imagine Tomorrow ©2013 Tata
Key Tool
Brainstorming
Purpose: Brainstorming is a method for generating a large number of creative ideas in a short period of time. There are many versions of brainstorming, including round-robin brainstorming, wildest-idea
brainstorming, double reversal, starbursting and the charette procedure. The basic version described below is sometimes called free-form, freewheeling or unstructured brainstorming.
Process: Brainstorming is a rapid, interactive process. It is generally best to do it in an open, on-person environment. However, it can also be done in a virtual environment with web collaboration tools.
First: review the rules of brainstorming with the entire group:
No criticism, no evaluation, no discussion of ideas.
There are no stupid ideas. The wilder the better.
All ideas are recorded.
Piggybacking is encouraged: combining, modifying, expanding others’ ideas.
Second: review the topic or problem to be discussed. Often it is best phrased as a “why,” “how,” or “what” question. Make sure everyone understands the subject of the brainstorm.
Third: allow a minute or two of silence for everyone to think about the question.

©2013 Tata Section 3 - Imagine Tomorrow 37
Fourth: invite people to call out their ideas. Record all ideas, in words as close as possible to those used by the contributor. No discussion or evaluation of any kind is permitted.
Finally: continue to generate and record ideas until several minutes’ silence produces no more.
Payoff: Brainstorming provides rapid gathering of ideas in the following situations: when a broad range of options is desired; when creative, original ideas are desired; and when participation of the entire group is desired.
Insight: Judgment and creativity are two functions that
cannot occur simultaneously. That’s the reason for the rules about no criticism and no evaluation; laughter and groans are criticism. When there is criticism, people begin to
evaluate their ideas before stating them. Fewer ideas are generated and creative ideas are lost.

38 Section 3 - Imagine Tomorrow ©2013 Tata
Key Tool
Benchmarking
Purpose: Benchmarking is the practice of actively learning from others. In its simplest form, it is merely reading about the experiences of others, collecting results from other companies, and
talking with people from other companies.
Process: While all forms of learning from others are to be encouraged, greater insight can be achieved through more formal benchmarking relationships. The benchmarking process consists of five
phases:
1. Planning. The essential steps are those of any plan development: what, who and how.
What is to be benchmarked?
To whom or what will we compare?
How will the data be collected?
2. Analysis. The analysis phase must involve a careful understanding of your current process and practices, as well as those of the organizations being benchmarked. What is desired is an understanding of internal performance on which to assess strengths and weaknesses. Ask:
Is this other organization better than we are?
Why are they better?
By how much?
What best practices are being used now or can be anticipated?
How can their practices be incorporated or adapted for use in our organization?

©2013 Tata Section 3 - Imagine Tomorrow 39
3. Integration. Integration is the process of using benchmark findings to set operational targets for change. It involves careful planning to incorporate new practices in the operation and to ensure benchmark findings are incorporated in all formal planning processes.
4. Action. Convert benchmark findings, and operational principles based on them, to specific actions to be taken. Put in place a periodic measurement and assessment of achievement. Use the creative talents of the people who actually perform work tasks to determine how the findings can be incorporated into the work processes.
5. Maturity. Maturity will be reached when best industry practices are incorporated in all business processes, thus ensuring superiority.
Payoff: Getting to, and staying at, the leadership position
in your field is achieved when benchmarking becomes an ongoing, essential and self-initiated facet of the management
process. Benchmarking becomes institutionalized and is done at all appropriate levels of the organization, not by specialists.

40 Section 3 - Imagine Tomorrow ©2013 Tata
Key Concept
The Seven Wastes
Purpose: Instil a culture of continuous improvement by ensuring everyone can identify opportunities to improve. Wherever resources are being spent that do not add value to the customer, waste is being
generated. This list of the Seven Wastes can help us to identify and address non-value-added opportunities.
Process: Review the list of Wastes, then work with the team to identify where these wastes show up in the processes or systems that are targeted for improvement, then act to eliminate the Wastes.
The acronym MR WASTE helps us recall the wastes.
Motion: human motion, even reaching for a pen, takes
time. Motion more than is needed is waste. Eliminate this waste by having the workplace arranged efficiently.
Rework: if the job isn't done right the first time, then it isn't
really done. Rework is the extra time it takes to complete a poorly-done job. Take the time to do things right.
Waiting: the vast majority of the time it takes to do a job is
spent in waiting - waiting for attention, for tools, for materials. Waiting ties up resources and wastes time!
Alignment: when we don't really understand our
customer, we often produce the wrong things. If we produce less than the customer needs, we are ineffective. If we produce more than the customer needs, we are inefficient (wasting money) - and often what we think are "extra benefits" may make what we produce unusable by our customers. Take the time to align with the customer!

©2013 Tata Section 3 - Imagine Tomorrow 41
Storage: unneeded materials or other things kept in
storage tie up financial and space resources and lose their own value at the same time. If in doubt, throw it out!
Travel: moving people and material around takes time,
consumes fuel, costs money, but doesn't add any value to the customer. Eliminate or reduce travel where possible.
Excess: producing or procuring more than is needed may
seem to be a good way to drive down unit costs, but the practice leads to generation of many other types of waste.
Payoff: Eliminating the Seven Wastes will rapidly drive down costs. In addition, since most wastes also consume time, the improved processes will also be faster and more responsive.
Insight: Use the Seven Wastes at work and at home.
Attention to these concepts make people more productive, more effective and, in general, happier. Look for clean and efficient work spaces
as evidence that we have driven out "MR. WASTE."

42 Section 3 - Imagine Tomorrow ©2013 Tata
Key Tool
Decision Matrix
Purpose: The Decision Matrix or Prioritization Matrix is used to consider several factors simultaneously when making decisions or setting priorities. This key decision-support tool drives better decisions
and lets leaders consider a wider array of choices.
Process: A decision matrix evaluates and prioritizes a list of options. The team first establishes a list of weighted criteria and then evaluates each option against those criteria. Use the following steps:
First: brainstorm the evaluation criteria appropriate to the situation. If possible, involve customers in this process.
Second: discuss and refine the list of criteria. Identify any criteria that must be included and any that must not be included. Reduce the list of criteria to those that the team believes are most important. Tools such as list reduction and multivoting may be useful here.
Third: assign a relative weight to each criterion, based on how important that criterion is to the situation. Do this by distributing 10 points among the criteria. The assignment can be done by discussion and consensus. Or each member can assign weights, then the numbers for each criterion are added for a composite team weighting.
Fourth: draw an L-shaped matrix. Write the criteria and their weights as labels along one edge and the list of options along the other edge. Usually, whichever group has fewer items occupies the vertical edge.
Fifth: evaluate each choice against the criteria using a consistent scale, such as 1 to 5.

©2013 Tata Section 3 - Imagine Tomorrow 43
Finally: multiply each option’s rating by the weight. Add the points for each option. The option with the highest score might be the one to choose. The relative scores can generate meaningful discussion leading to consensus
Payoff: The Decision Matrix not only drives better decisions, it helps decision-makers focus in on areas of importance and key areas of disagreement. The effectiveness of this tool
makes it ideal for Project Portfolio Management, helping to prioritize efforts on both new and current projects.
Insight: When only
considering two or three factors, it is common to
show results as a grid (for two factors) with different sized bubbles (for three factors). The "Bubble Chart" helps people understand the thought process as well as the results of the analysis.

44 Section 3 - Imagine Tomorrow ©2013 Tata
Key Tool
Force Field Analysis
Purpose: Force Field Analysis is a tool to assess the likelihood of accomplishing a change. The tool defines driving forces as any resources, attitudes, experience, and so on, that will support the
change, and restraining forces as any resources, attitudes, or experiences that will cause the change to be stopped or delayed.
Process: Force Field Analysis is an influential development in the field of social science. It provides a framework for looking at the factors (forces) that influence a situation, (originally social
situations). It looks at forces that are either driving movement toward a goal (helping forces) or blocking movement toward a goal (hindering forces). To use the tool, do the following:
First: define the desired change and list it at the top of the page.
Second: brainstorm the driving forces (resources, attitudes, experiences that will support the change). List them on the left-hand column.
Third: brainstorm the restraining forces (resources, attitudes, experiences that will resist the change). List them on the right-hand column.
Fourth: prioritize forces on both sides to determine what are the strongest drivers and restrainers.
Fifth: match and use drivers wherever possible to reduce and eliminate restrainers. Allow for conversation about how to approach the change.

©2013 Tata Section 3 - Imagine Tomorrow 45
Finally: write an Action Plan detailing how the team will go about reducing the restraining (or inhibiting) forces and strengthening the driving (or promoting) forces.
Payoff: Force Field Analysis is one of the quickest ways to
make the strengths and concerns associated with an improvement effort visible to all stakeholders. In many cases, teams make radical constructive
changes to how the efforts will be approached.
Insight: Force Field Analysis should be used whenever a
change needs to be initiated as part of our process improvement. It is useful in that it not only provides a complete picture of what will be
working for us and what will be working against us, but also because the group can move closer to consensus on the change by discussing the challenges and barriers in an open constructive format. Instead of negative conversation going underground, it is now legitimate to talk about it in the meeting.
46 Section 4 - Change The World ©2013 Tata
Change The World
"The effective execution of a Plan is
what counts and not mere planning on
paper; it is not what we put on our plate
or even what we eat that provides
nourishment and growth, but what we
digest."
J.R.D. (Jeh) Tata
Tata Chairman 1938 - 1991

©2013 Tata Section 4 - Change The World 47
Change The World
Implementing Change is one of the most challenging jobs in the world. It not only requires that we have a strong belief that the change we will be implementing is the right thing to do, it also requires that all the stakeholders in the change are also convinced and committed. Further, it requires that all the players in making the change happen are aligned and synchronized in not only what needs to be done, but when it needs to be done.
In this section we cover two major areas related to implementing Change:
Project Management - There are rigorous processes that can help us to align the work of many people and many teams towards accomplishing a shared goal. Tools in this area include Project Charters, the concept of RACI (Responsible, Accountable, Consulted and Informed), Work Breakdown Structure (WBS), and Failure Modes & Effects Analysis (FMEA).
People and Teams - "People Skills" are amongst the rarest - and most valued - areas of expertise. Tools to help in this area include Team Stages (Forming, Storming, Norming, and Performing), the Science of Influence (or the Principles of Persuasion), and the Ladder of Inference. These tools help us to understand and respond to how our team-mates and stakeholders are motivated to ensure the greatest level of support in both implementing and maintaining our changes.

48 Section 4 - Change The World ©2013 Tata
Key Tool
Project Charter
Purpose: The Project Charter is a written document that clarifies what the project is intended to accomplish, the scope in which the project will operate, and the stakeholders who will be
involved with, or affected by, the project.
The Project Charter serves as a contract between the Sponsor of the project, the Project Manager, and the Project Team. It is a "living document" that can be updated and improved as learning occurs and conditions change.
Process: The project charter may take the form of a physical document, a slide set, or some other form of electronic documentation. To prepare a Project Charter the following information must be
gathered, documented, and agreed upon:
First: identify a Project Manager and the Project Sponsor. The Sponsor is the one individual who will take the consequences if the project does not meet its objectives. It is best to have only one Sponsor - or one Lead Sponsor, as this person carries Accountability for the project and has the final say in project decisions.
Second: the Project Manager and the Project Sponsor should agree on what the project is to deliver - the statement of work. Sometimes this agreement is done with the participation of project team members and other stakeholders in a dedicated "project chartering session."
Third: agree on goals - how success or failure of the project will be measured. These goals should be achievable.

©2013 Tata Section 4 - Change The World 49
Fourth: agree on the limits of the project, who will be involved, what areas may be impacted, the resources available to the project, and the desired timing for delivery of the results.
Finally: review the contents of the Project Charter with the Project Sponsor, the Project Team, and the Project Stakeholders to ensure agreement with and commitment to the contents of the Charter. If disagreement exists, or if conditions change, the Charter should be updated to ensure ongoing agreement exists.
Payoff: An accurate and maintained Project Charter
serves as a compass unifying the efforts of all the project's stakeholders. A robust Project Charter will help the team avoid the many pitfalls that lead
to a large percentage of project failures.
Insight: Because learning occurs and
conditions change, no project will ever proceed as originally planned. It is best to establish
guidelines within the Charter on how the Team should respond to changes. In Project Management there is an ongoing tension between Quality, Time and Cost (or Scope, Schedule and Resources). Decide early on which of these factors is most (or least) flexible.
From the PMI Guide to the
Project Management Body of
Knowledge (PMBOK® Guide)

50 Section 4 - Change The World ©2013 Tata
Key Tool
RACI Matrix
Purpose: The RACI Matrix or RACI Chart is also known as a Responsibility Assignment Matrix. It is used to clarify the roles and responsibilities for key stakeholders in project teams as well as in many
other areas where clearly understood accountability or ownership is desirable.
Process: This simple matrix works with other listings of tasks, deliverables or team members. To provide the data needed to generate the matrix, you will need to decide which of the following roles each
stakeholder plays on each task or effort:
Responsible: Responsible stakeholders are those that do
the work. There may be several Responsible stakeholders on complex tasks.
Accountable: Accountable stakeholders are those who
suffer the consequences if a task does not produce the desired results. There should be only one Accountable stakeholder for each task, and that person should also have decision-making Authority related to that task.
Consulted: Consulted stakeholders are the focus of two-
way communication with the Responsible stakeholders. They are often subject matter experts whose opinions can affect the outcome of the task.
Informed: Informed stakeholders are the focus of one-way
communication, being kept apprised on the status of the task.

©2013 Tata Section 4 - Change The World 51
Payoff: The RACI matrix may be used to ensure commitment to needed actions and significantly improve the speed of decision-making in a project or process.
Variant: A form of Process
Map called a Swim Lane Diagram has "lanes" designated for
each stakeholder, then places the Tasks or Deliverables they are Accountable for into the appropriate lane.
Insight: RACI thinking helps to drive rapid, coordinated
action. Establishing clear accountability for each task or deliverable drives the rest of the process. Those Accountable ensure that needed
resources (those Responsible) are available and those stakeholders whom could help or hurt success (Consulted or Informed) are considered.

52 Section 4 - Change The World ©2013 Tata
Key Tool
WBS
Purpose: The Work Breakdown Structure (WBS) is a tool used to understand and organize the deliverables of a project. It serves as the foundation for building a comprehensive Project Plan that details
how and when these deliverables will be generated.
Process: Using the agreed-upon scope of the project, document the specific final deliverables. Break each of these top-level deliverables into its component parts. Break those components down
further until a level is reached showing deliverables that can reasonably be achieved by a small group of people in a relatively short period of time.
The work breakdown structure may be communicated as a Tree diagram or as an indented listing. An indented listing is preferred for use in project management software.
The steps to be followed after completing the Work Breakdown Structure are:
First: determine who is accountable for each WBS item.
Second: develop estimates of the duration needed to produce each WBS item.
Third: determine which other WBS items must be completed before work can begin on the target WBS item.
Finally: Input each WBS item, its owner, its duration, and which items (predecessors) must be completed before starting into software such as Microsoft Project. The software will use this information to produce an excellent estimate of the amount of time the project will take to complete. This is the starting Project Plan.

©2013 Tata Section 4 - Change The World 53
Payoff: The Work Breakdown Structure not only serves as the foundation for later project plan development, it also serves as a checklist to ensure that no significant deliverables or components are
overlooked during the delivery of the project.
Insight: Estimating how long things will take to deliver is
very difficult. It is human nature to "hedge" on estimates, to be conservative when estimating duration. When building out a Work Breakdown
Structure wise Project Managers will build in a "buffer" item - something to which duration may be assigned that commences after the main deliverables have been completed. Let the people who are estimating task duration know this buffer has already been build into the project plan. This will help people be comfortable
making more realistic estimates on individual tasks.

54 Section 4 - Change The World ©2013 Tata
Key Tool
FMEA
Purpose: Failure Modes and Effects Analysis (FMEA) is a step-by-step approach for identifying all possible failures in a project, a design, a manufacturing or assembly process, or a product or service.
“Failure modes” means the ways, or modes, in which something might fail. Failures are any errors or defects, especially ones that affect the customer, and can be potential or actual. “Effects analysis” refers to studying the consequences of those failures.
Process: The FMEA Risk Prioritization Numbers (RPNs)
may be generated with software. To provide the data needed to perform the analysis, do the following:
First: identify/detect potential failure modes. Hint: FMEA practitioners sometimes use a "reverse fishbone diagram" in which the product or process of interest is shown on the "head" of the fish and potential failure modes and sub-modes are populated on the "bones" of the fish.
Second: assign a Severity Number to each failure mode - on a ten point scale, how bad is it if the failure occurs?
Third: assign an Occurrence Number to each failure mode - on a ten point scale, how likely is it that it will occur?
Fourth: assign a Detection Number to each failure mode - on a ten point scale, how likely is it that the failure, if it occurs, will be detected quickly enough to allow us to minimize the damage done?

©2013 Tata Section 4 - Change The World 55
Finally: calculate the Risk Priority Number (RPN) by multiply the three factors together. The higher the RPN, the more important it is that this failure mode be addressed and, if possible, eliminated.
Payoff: "An ounce of prevention is worth a pound of cure." FMEA allows us to spend our prevention resources in the areas that will provide the greatest protection against failure.
Insight: FMEA uses a similar approach to the Prioritization
and Decision Matrix. Its purpose, essentially, is to prioritize failure modes for attention. If desired, you may add other factors to be considered in the
calculation of the RPN, or modify the formula used to calculate the RPN. As with all tools, FMEA is intended to aid our thought processes, not substitute for them. If the priority suggested by the RPN analysis does not seem to make sense, revisit the assumptions made during calculation.

56 Section 4 - Change The World ©2013 Tata
Key Concept
Team Stages
Purpose: The four stages of Team Development are used by team leaders to recognize, and act upon, the maturity levels of their teams and team members. While these stages relate to teams overall, they
can also be applied to new members entering a team.
Process: Team Stages can be assessed by watching the behaviours of the team and the individual members of the team. Different team tools may be used for teams at higher levels of maturity (later
stages). Teams in the early stages may respond best to more structured tools, while teams in later stages may respond well to more collaborative tools. The Team Stages are:
Forming: Individual behaviour is driven by a desire to be accepted by the others and to avoid controversy or conflict. Serious issues and feelings are avoided. This is a comfortable stage to be in, but the avoidance of conflict and threat means that not much actually gets done.
Storming: Different ideas compete for consideration. The team addresses issues such as what problems they are really supposed to solve, how they will function independently and together and what leadership model they will accept. Team members open up to each other and confront each other's ideas and perspectives. The maturity of some team members usually determines whether the team will ever move out of this stage.
Norming: The team manages to have one goal and come to a mutual plan for the team at this stage. Some may

©2013 Tata Section 4 - Change The World 57
have to give up their own ideas and agree with others in order to make the team function. In this stage, all team members take the responsibility and have the ambition to work for the success of the team's goals.
Performing: It is possible for some teams to reach the performing stage. These high-performing teams are able to function as a unit as they find ways to get the job done smoothly and effectively without inappropriate conflict or the need for external supervision. Team members have become interdependent. By this time, they are motivated and knowledgeable. The team members are now competent, autonomous and able to handle the decision-making process without supervision. Dissent is expected and allowed as long as it is channelled through means acceptable to the team.
Payoff: Recognizing what stage a team is in allows team leaders to choose the right tools for the team. It also lets the team leader apply tools, such as the RACI Matrix, that can help accelerate movement
of the team into the more productive stages.

58 Section 4 - Change The World ©2013 Tata
Key Concept
Cialdini's Principles of Persuasion
Harnessing the Science of Persuasion
Do you have it—that magical power to capture your
audience, sway undecideds, convert opponents? In an era of cross-functional teams and intercompany partnerships, masters of persuasion exert far greater influence than formal power structures.
But is persuasion really magic? Must we ordinary types struggling with leadership’s greatest challenge—getting things done through others—despair of ever mastering this art?
Good news—from behavioural science: Persuasion works by appealing predictably to deeply rooted human needs. The rest of us can learn to secure consensus, cut deals, and win concessions— by artfully applying the following six scientific principles of winning friends and influencing people:
LIKING: People like those like them, who like them. To influence people, win friends, through:
Similarity: Create early bonds with new peers, bosses, and direct reports by informally discovering common interests—you’ll establish goodwill and trustworthiness.
Praise: Charm and disarm. Make positive remarks about others—you’ll generate more willing compliance.

©2013 Tata Section 4 - Change The World 59
RECIPROCITY: People repay in kind. - Give what you want to receive. Lend a staff member to a colleague who needs help; you’ll get his help later.
SOCIAL PROOF: People follow the lead of similar others. Use peer power to influence horizontally, not vertically; e.g., ask an esteemed “old timer” to support your new initiative if other veterans resist.
CONSISTENCY: People fulfil written, public, and
voluntary commitments. Make others’ commitments active, public, and voluntary. If you supervise an employee who should submit reports on time, get that understanding in writing (a memo); make the commitment public (note colleagues’ agreement with the memo); and link the commitment to the employee’s values (the impact of timely reports on team spirit).
AUTHORITY: People defer to experts who provide
shortcuts to decisions requiring specialized information. Don’t assume your expertise is self-evident. Instead, establish your expertise before doing business with new colleagues or partners; e.g., in conversations before an important meeting, describe how you solved a problem similar to the one on the agenda.
SCARCITY: People value what’s scarce. Use exclusive information to persuade. Influence and rivet key players’ attention by saying, for example: “…Just got this information today. It won’t be distributed until next week.”
“Harnessing the Science of Persuasion" by Robert B. Cialdini
(Harvard Business Review, October 2001)

60 Section 4 - Change The World ©2013 Tata
Key Concept
The Ladder of Inference
Doff
From "The Fifth Discipline:
The Art and Practice of the
Learning Organization" by
Peter Senge

©2013 Tata Section 4 - Change The World 61
Purpose: In a fast business environment, we need to
make sure our actions and decisions are founded on reality. Similarly, when we accept or challenge other people's conclusions, we need be confident
that their reasoning, and ours, is firmly based on the true facts. The "Ladder of Inference" helps us achieve this. This tool helps us understand the thinking steps that can lead us to jump to wrong conclusions, and so helps us get back to hard reality and facts.
Process: The Ladder of Inference describes the thinking process that people go through, usually without realizing it, to get from a fact to a decision or action. The thinking stages can be seen as rungs
on a ladder. Starting at the bottom of the ladder, we have reality and facts. From there, we:
Experience these selectively based on our beliefs and prior experience.
Interpret what they mean.
Apply our existing assumptions, sometimes without considering them.
Draw conclusions based on the interpreted facts and our assumptions.
Develop beliefs based on these conclusions.
Take actions that seem "right" because they are based on what we believe.
Review our thinking - our beliefs have a big effect on how we select from reality, and can lead us to ignore the true facts. Soon we are jumping to conclusions – by missing facts and skipping steps in the reasoning process.
Payoff: By using the Ladder of Inference, we can learn to get back to the facts and use our beliefs and experiences to positive effect, rather than allowing them to narrow our field of judgment.
Following this step-by-step reasoning can lead us to better results, based on reality, avoiding unnecessary mistakes and conflict.

62 Section 5 - Keep The Change ©2013 Tata
Keep The Change
"We have to clamp down on deviations
from commitments. For ensuring
greater commitment to performance, we
also need to have a system which
rewards performers and punishes those
who don’t perform."
Ratan Tata

©2013 Tata Section 5 - Keep The Change 63
Keep The Change
Keeping the Improvements we make may not look simple. However, most failed improvement efforts are due to not making the right changes rather than failure to comply with the new procedures. As such, we must be sure to do our homework in the early parts of an improvement effort to ensure maintaining the results of the efforts is a simple task. Having said that, there are things we can do toward the end of an improvement project that will help us to ensure that things go as desired and that "slipping back" to old ways can be detected and addressed.
In this section we cover three classes of tools to help us in Keeping the benefits of the changes we make:
Operational Definition & Readiness - Simple philosophies to ensure that our new procedures are well-documented, well-trained, and that our workplace is properly arranged to ease execution of the new systems.
Dharma and Karma - Concepts that are foundational in how people around the world approach doing their work.
Control Charts and Radar/Spider Charts - These graphical tools allow us to easily compare our current conditions to our past or desired conditions. Deviations that these tools reveal are clear indications of whether or not it is time to intervene.
Surveys and Checksheets - during the early period of use of our new systems we can best use opinion-gathering tools (surveys) as well as compliance-ensuring tools (checksheets). Knowing what to ask and what to check is half the battle of maintaining a change.

64 Section 5 - Keep The Change ©2013 Tata
Key Concept
Operational Definition and Readiness
Purpose: In order to ensure effective execution of new or existing processes, there must be agreement upon how the processes are to be executed and how the results are to be measured. Operational
Definitions provide sufficient documentation to allow any competent worker to execute or measure the process in the same way as any other competent worker, getting the same results. Operational Readiness ensures that the workplace and work system is ready to allow a competent worker to perform or measure the process effectively.
Process: Producing effective process documentation (Operational Definitions) is an iterative process. Because the documentation must meet the needs of many stakeholders, a great deal of feedback is
needed from stakeholders to ensure the accuracy and adequacy of such documentation.
First: decide what types of documentation will be needed. Consider the stakeholders involved and decide which stakeholders need what type of documentation. Documentation types may include reference materials, training materials, even check sheets for use while executing the process or measurement.
Second: prepare draft documents for review by stakeholders. While preparing these documents consider what failure modes might occur linked to what was included in the documents and what failure modes might occur related to what was omitted from the documents. Revise the documents as needed to prevent failures.

©2013 Tata Section 5 - Keep The Change 65
Third: ask key stakeholders to review and revise the draft documents to ensure they meet the stakeholders' needs. Verify that this has been done by having stakeholders approve the acceptable version of the documents.
Fourth: ensure the approved documents will be subject to ongoing review and improvement to keep them current with the stakeholders' needs.
Finally: review the workplace and work system to ensure that all the resources called out for in the documents are available in an effective and efficient manner. Use consideration of the Seven Wastes in this review.
Payoff: Attention to detail in the preparation and use of documentation (including on-line documentation and multi-media) reduces errors and improves stakeholder satisfaction. Well documented
processes make it clear where responsibility lies for execution of process steps and provide unambiguous methods for evaluating the effectiveness of the process and the quality of the process outputs.

66 Section 5 - Keep The Change ©2013 Tata
Key Concept
Dharma (धर्म) and Karma (कर्म)
Purpose: The concepts of Dharma (roughly: "the rules") and Karma (roughly: "the consequences of how the rules are followed") are amongst the core teachings in many or the world's religions.
Understanding these concepts and relating them to the personal and professional lives of people helps us to both understand behavioural patterns and helps us to design our work systems to operate in harmony with people.
Process: Understand these key concepts and translate their basis into how we design and communicate our processes and business management systems. Through good understanding we can
establish business systems that are reinforced by cultural foundations around the world.
Dharma - literally "that which upholds or supports" - means Law or Natural Law (as in the natural order of things) and is a concept of central importance in Indian philosophy and religion. In the context of Hinduism, it refers to one's obligations, calling and duties.
The idea of dharma as duty or propriety derives from an idea found in India's ancient legal and religious texts that there is a divinely instituted natural order of things and justice, social harmony and human happiness require that human beings discern and live in a manner appropriate to the requirements of that order. Beings that live in accordance with dharma proceed more quickly toward dharma yukam, moksha or nirvana (personal liberation).

©2013 Tata Section 5 - Keep The Change 67
The antonym of dharma is adharma meaning unnatural or immoral.
Karma in Indian religions is the concept of "action" or "deed", understood as that which causes the entire cycle of cause and effect.
'Karma' is an Indian religious concept that notes that humans have free will to choose their own actions, which require only the will of God to implement karma's consequences. In Indian beliefs, the karmic effects of all deeds are viewed as actively shaping past, present, and future experiences. The results or 'fruits' of actions are called karma-phala.
Payoff: When deploying new systems or managing
existing systems it is important to establish rules - the dharma concept - for the systems. People should understand that they have the personal
choice to obey these rules (follow the process) or not, but that choosing to deviate from the declared process will have consequences - the karma concept. Better results are achieved when people choose - of their own free will - to support their processes. While in a religious context karmic consequences may span lifetimes, in the business context positive or negative consequences should be arranged to come quickly.

68 Section 5 - Keep The Change ©2013 Tata
Key Tool
Radar / Spider Chart
Purpose: The Radar Chart, also known as the Spider Chart, is used to assess several characteristics at one time. This assessment allows consideration of the big picture view and allows comparisons of
assessments taken at different points in time.
Process: This chart may be automatically generated with software. It uses nominal data (labels for the outward lines) and numeric data (values against the radial lines). To provide the data needed to
generate the chart, do the following:
First: determine the characteristics or categories to be assessed. In the example, the categories chosen were the main places where a person may focus attention - in this case: Wife, Children, Friends, Self, and Work.
Second: determine the number of views your assessment will take. Views may be of current state and desired state, or specific instances in time - either past or future - or under different conditions, such as behavioural modes under normal versus stressful conditions.
Third: perform an assessment for each category under each view. Usually the assessment will be on a standard scale, such as one-to-ten or zero-to-five. The chart is intended to show relative results across categories, so the assessment against each category may need to be "normalized" to allow useful display on the scale of the chart. In general, the value used for the assessment should be higher if the outcome would be considered beneficial.

©2013 Tata Section 5 - Keep The Change 69
Finally: plot the assessment points for each view on the radial lines designated for each category. Connect the points for each view to see the shapes that emerge.
Payoff: The Radar Chart provides a summarized view showing performance across many factors in a single chart. By overlaying assessments changes to the system or deviations from the plan are
plainly visible.
Variant: The Radar Chart is sometimes presented with the
numeric axis reversed.
In this case the intent is to reduce, rather than increase, the area covered by the data.

70 Section 5 - Keep The Change ©2013 Tata
Key Tool
Control Chart
Purpose: The control chart is a graph used to study how a process changes over time. Data are plotted in time order. A control chart always has a central line for the average, an upper line for the upper
control limit and a lower line for the lower control limit. These lines are determined from historical data. By comparing current data to these lines, you can draw conclusions about whether the process variation is consistent (in control) or is unpredictable (out of control, affected by special causes of variation).
Process: Use Control Charts in the following conditions: when controlling ongoing processes by finding and correcting problems as they occur; when predicting the expected range of outcomes from a
process; when determining whether a process is stable (in statistical control); or when analysing patterns of process variation from special causes (non-routine events) or common causes (built into the process).
First: choose the appropriate control chart for your data.
Second: determine the appropriate time period for collecting and plotting data.
Third: collect data, construct your chart and analyse the data. Use additional reference materials for details on how to select a control chart and calculate limits.
Fourth: look for “out-of-control signals” from the following list on the control chart. When one is identified, mark it on the chart and investigate the cause. Document how you investigated, what you learned, the cause and how it was corrected.
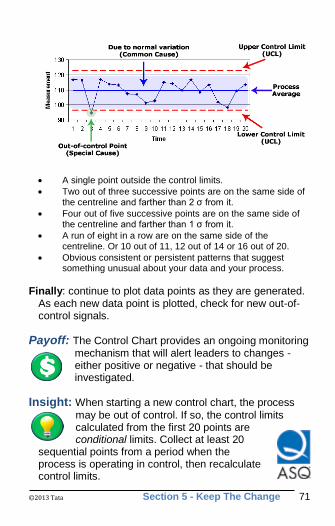
©2013 Tata Section 5 - Keep The Change 71
A single point outside the control limits.
Two out of three successive points are on the same side of the centreline and farther than 2 σ from it.
Four out of five successive points are on the same side of the centreline and farther than 1 σ from it.
A run of eight in a row are on the same side of the centreline. Or 10 out of 11, 12 out of 14 or 16 out of 20.
Obvious consistent or persistent patterns that suggest something unusual about your data and your process.
Finally: continue to plot data points as they are generated. As each new data point is plotted, check for new out-of-control signals.
Payoff: The Control Chart provides an ongoing monitoring mechanism that will alert leaders to changes - either positive or negative - that should be investigated.
Insight: When starting a new control chart, the process
may be out of control. If so, the control limits calculated from the first 20 points are conditional limits. Collect at least 20
sequential points from a period when the process is operating in control, then recalculate control limits.

72 Section 5 - Keep The Change ©2013 Tata
Key Tool
Survey / Checksheet
Purpose: Surveys and Checksheets collect data from a targeted group of people about their opinions, behaviour or knowledge. Common types of surveys are written questionnaires, face-to-face or
telephone interviews, focus groups and electronic (e-mail or Web site) surveys. Surveys are commonly used with key stakeholders, especially customers and employees, to discover needs or assess satisfaction.
Process: Use Surveys in the following conditions: when identifying customer requirements or preferences; when assessing customer or employee satisfaction, such as identifying or prioritizing
problems to address; when evaluating proposed changes; or when assessing whether a change was successful.
First: decide what you want to learn from the survey and how you will use the results.
Second: decide who should be surveyed. Identify population groups; if they are too large to permit surveying everyone, decide how to obtain a sample. Decide what demographic information is needed to analyse and understand the results.
Third: decide on the most appropriate type of survey.
Fourth: decide whether the survey’s answers will be numerical rating, numerical ranking, yes–no, multiple choice or open-ended—or a mixture.
Fifth: brainstorm questions and, for multiple choice, the list of possible answers. Keep in mind what you want to learn, and how you will use the results. Narrow down the

©2013 Tata Section 5 - Keep The Change 73
list of questions to the absolute minimum that you must have to learn what you need to learn.
Sixth: produce the questionnaire or interviewers’ question list.
Seventh: test the survey with a small group. Collect feedback.
Eighth: revise the survey based on test results.
Ninth: administer the survey.
Finally: tabulate and analyse the data. Decide how you will follow through. Report results and plans to everyone involved. If a sample was involved, also report and explain the margin of error and confidence level.
Payoff: Surveys are the best tool to turn opinions into
insight. They are a formal way to gather qualitative data from key stakeholder, such as customers, and may also be used to gather ideas
for improvement from the survey respondents.
Insight: Take care to not "over-survey" people.
Very simple surveys (checksheets) or smaller sample sizes can still provide a great deal of insight from respondents.

74 Key Resources and Key Terms ©2013 Tata
Key Resources and Key Terms
Key Resources
&
Key Terms
©2013 Tata Key Resources & Key Terms 75
Key Resource
The Tata Business Excellence Model
TBEM is a ‘customized-to-Tata’ adaptation of the globally renowned Malcolm Baldrige model. The TBEM philosophy has been moulded to deliver a combination of strategic direction and concerted effort to maximize business performance.
The model focuses on seven core aspects of business:
1. Leadership 2. Strategic Planning 3. Customer Focus 4. Measurement, Analysis and Knowledge
Management 5. Workforce Focus 6. Operations Focus 7. Business Results
Performance is measured in absolute points; companies have to achieve a minimum of 500 points (out of 1,000) within four years of signing the Brand Equity and Business Promotion (BEBP) agreement. Achievements are awarded by recognition across the Group.
Tata Quality Management Services (TQMS) helps Tata companies use the model to gain insights on their business strengths and opportunities for improvement. This is managed through an annual process of assessment and assurance. The model, through its regular and calibrated updates, is used by Tata companies to stay in step with the ever-changing business environment.

76 Key Resources and Key Terms ©2013 Tata
Key Terms
Work Processes and Work Systems
The following definitions from the Tata Business Excellence Model (TBEM) are useful when driving improvement:
Work Processes: The term “work processes” refers to your most important internal value creation processes. They might include product design and delivery, customer support, supply chain management, business, and support processes. They are the processes that involve the majority of your organization's workforce and produce customer, stakeholder, and stockholder value.
Your key work processes frequently relate to your core competencies, to the factors that determine your success relative to competitors, and to the factors considered important for business growth by your senior leaders.
Work Systems: The term “work systems” refers to how the work of your organisation is accomplished. Work systems involve your workforce, your key suppliers and partners, your contractors, your collaborators, and other components of the supply chain needed to produce and deliver your products and your business and support processes. Your work systems coordinate the internal work processes and the external resources necessary for you to develop, produce, and deliver your products to your customers and to succeed in your marketplace.
Decisions about work systems are strategic. These decisions involve protecting and capitalizing on core competencies and deciding what should be procured or produced outside your organisation in order to be efficient and sustainable in your marketplace.

©2013 Tata Key Resources & Key Terms 77
Key Terms
Terms of Process Assessment
The following definitions from the Tata Business Excellence Model (TBEM) are useful when assessing processes:
Approach: The term “approach” refers to the methods used by an organisation to address the TBEM Criteria Item requirements. Approach includes the appropriateness of the methods to the Item requirements and to the organization's operating environment, as well as how effectively the methods are used.
Deployment: The term “deployment” refers to the extent to which an approach is applied in addressing the requirements of a TBEM Criteria Item. Deployment is evaluated on the basis of the breadth and depth of application of the approach to relevant work units throughout the organisation.
Learning: The term “learning” refers to new knowledge or
skills acquired through evaluation, study, experience, and innovation. To be effective, learning should be embedded in the way an organisation operates. Learning contributes to a competitive advantage and sustainability for the organisation and its workforce.
Integration: The term “integration” refers to the harmonization of plans, processes, information, resource decisions, actions, results, and analyses to support key organisation-wide goals. Effective integration goes beyond alignment and is achieved when the individual components of a performance management system operate as a fully interconnected unit.

78 Key Resources and Key Terms ©2013 Tata
Key Terms
Leadership Terms
The following definitions from the Tata Business Excellence Model (TBEM) are useful when leading improvement:
Leadership System: The term “leadership system”
refers to how leadership is exercised, formally and informally, throughout the organisation; it is the basis for and the way key decisions are made, communicated, and carried out. It includes structures and mechanisms for decision making; two-way communication; selection and development of leaders and managers; and reinforcement of values, ethical behaviour, directions, and performance expectations.
An effective leadership system respects the capabilities and requirements of workforce members and other stakeholders, and it sets high expectations for performance and performance improvement. It builds loyalties and teamwork based on the organization's vision and values and the pursuit of shared goals. It encourages and supports initiative and appropriate risk taking, subordinates’ organisational structure to purpose and function, and avoids chains of command that require long decision paths. An effective leadership system includes mechanisms for the leaders to conduct self examination, receive feedback, and improve.
Workforce: The term “workforce” refers to all people actively involved in accomplishing the work of your organisation, including paid employees (e.g., permanent, part-time, temporary, and telecommuting employees, as well as contract employees supervised by the organisation) and volunteers. The workforce includes team leaders, supervisors, and managers at all levels.

©2013 Tata Key Resources & Key Terms 79
Key Resource
Maturity Assessment Grids
A variety of approaches exist to evaluating the maturity of processes and systems. Common approaches include CMMi (from Carnegie Mellon University) and the scoring guidelines for the Tata Business Excellence Model:
Assessment grids may be used to set improvement goals and to evaluate progress towards those goals.

80 Key Resources and Key Terms ©2013 Tata
Key Terms
Lean & Six Sigma
These definitions of Lean and Six Sigma come from the American Society for Quality (ASQ), the world’s leading certification body for Six Sigma Green Belts and Black Belts.
Lean is a system of techniques and activities for running a manufacturing or service operation. The techniques and activities differ according to the application at hand but they have the same underlying principle: the elimination of all non-value-adding activities and waste from the business.
Six Sigma is a fact-based, data-driven philosophy of
quality improvement that values defect prevention over defect detection. It drives customer satisfaction and bottom-line results by reducing variation and waste, thereby promoting a competitive advantage. It applies anywhere variation and waste exist, and every employee should be involved.
Several different definitions have been proposed for Six Sigma, but they all share some common themes:
• Use of teams that are assigned well-defined projects that have direct impact on the bottom line.
• Training in “statistical thinking” at all levels and providing key people with extensive training in advanced statistics and project management.
• Emphasis on the DMAIC approach (Define, Measure, Analyse, Improve and Control) to problem solving.
• A management environment that supports these initiatives as a business strategy.

©2013 Tata Key Resources & Key Terms 81
Key Resource
American Society for Quality (ASQ)
The Tata Group is an Enterprise Member of ASQ, entitling all Tata employees to free membership and access to all ASQ learning resources for themselves and their families.
ASQ is the world’s leading community of people passionate about quality. As a professional association, ASQ brings together individuals and companies in all fields, organizations, and industries who strive for continual improvement of the products and services the world relies upon. ASQ’s more than 80,000 members are building the future of quality, advancing the best insights, and investing in the ideas, tools, techniques, and systems that will help the world meet tomorrow’s critical challenges.
• ASQ was established in 1946 and has long been known as the American Society for Quality.
• It has been the sole administrator of the Malcolm Baldrige National Quality Program Award since 1991.
• ASQ’s Quality Body of Knowledge contains 30,000 articles and case studies selected by members and other leading quality experts.
ASQ supports membership services and business operations through ASQ Global, ASQ China, ASQ India, and ASQ Mexico, with ASQ WorldPartners® around the globe and through its work with ANAB and RABQSA.
• To access the electronic benefits of Tata Group's Enterprise membership, visit www.asq.org. Type in the Tata Group Member Number (Log-in ID: 64055873) and Tata Group Password (also 64055873) to create your own personal account to access learning materials.


For more information about
advancing
Operational Excellence in the Tata Group, please visit
www.TataQuality.com
or send email to