tax compliance behaviour of tax agents: a comparative
TRANSCRIPT

Tax Compliance Behaviour of Tax Agents: A
Comparative Study of Malaysia and New
Zealand
____________________________________
A thesis submitted in fulfilment of the requirements for
the Degree of Doctor of Philosophy in Taxation
in the University of Canterbury
by
Suhaila Abdul Hamid
____________________________________________
University of Canterbury
2013


i
Table of Contents
Table of Contents ....................................................................................................... i
List of Tables ......................................................................................................... viii
List of Figures .......................................................................................................... xi
Acknowledgments................................................................................................... xii
Conference paper presentation incorporated into this thesis .................................. xv
Abstract .................................................................................................................. xvi
CHAPTER 1 INTRODUCTION AND OVERVIEW .......................................... 1
1.0 Introduction ......................................................................................................... 1
1.1 Background ......................................................................................................... 1
1.1.1 The important roles of tax agents in tax compliance ................................ 5
1.1.2 The setting of the study: Malaysia and New Zealand ............................... 8
1.1.3 Some selected variables used in the study to understand tax
compliance behaviour of tax agents ................................................................. 12
1.2 An overview of the self-assessment taxation systems in Malaysia and
New Zealand.................................................................................................... 14
1.2.1 Malaysia .................................................................................................. 14
1.2.2 New Zealand ........................................................................................... 17
1.3 An overview of the accounting professions in Malaysia and New Zealand ..... 18
1.3.1 Malaysia .................................................................................................. 18
1.3.2 New Zealand ........................................................................................... 22
1.4 Research gap ..................................................................................................... 24
1.5 Objective of the study and the research questions .......................................... 27
1.6 Research methods ............................................................................................. 29
1.7 Significance of research .................................................................................... 30
1.8 Thesis organisation ........................................................................................... 34
1.9 Summary ........................................................................................................... 36
CHAPTER 2 LITERATURE REVIEW AND RELEVANT CONCEPTS ..... 37
2.0 Introduction ....................................................................................................... 37
2.1 An overview of economic and non-economic approaches in tax
compliance studies .......................................................................................... 37
2.2 Theories of human social behaviour ................................................................. 45
2.2.1 Theory of Reasoned Action .................................................................... 46
2.2.2 Theory of Planned Behaviour ................................................................. 48
2.3 Rest’s (1986) Ethical Decision Making Model ................................................ 53
2.3.1 Multidimensional Ethics Scale ............................................................... 58

ii
2.4 The concept of culture ....................................................................................... 65
2.4.1 Hofstede’s (1980) National Cultural Dimension ..................................... 68
2.4.2 Hofstede’s (1980) National Cultural Dimensions of Malaysia
and New Zealand .............................................................................................. 78
2.5 A review of relevant past studies ....................................................................... 84
2.5.1 The influence of attitude in tax compliance ............................................ 84
2.5.2 Subjective norms and tax compliance ..................................................... 87
2.5.3 Perceived behavioural control and tax compliance ................................. 91
2.5.4 The influence of ethics and ethical sensitivity in tax compliance ........... 92
2.5.5 Culture and tax compliance ................................................................... 100
2.6 Summary .......................................................................................................... 104
CHAPTER 3 RESEARCH FRAMEWORK AND HYPOTHESES
DEVELOPMENT ................................................................................................ 107
3.0 Introduction ..................................................................................................... 107
3.1 Conceptual Framework.................................................................................... 107
3.2 Hypotheses Development ................................................................................ 115
3.2.1 Attitude towards Tax Compliance ......................................................... 118
3.2.2 The Influence of Subjective Norms in Tax Compliance ....................... 119
3.2.3 Perceived Behavioural Control and Tax Compliance ........................... 120
3.2.4 Ethical Sensitivity and Tax Compliance Behaviour .............................. 121
3.2.5 The Influence of Culture in Tax Compliance ........................................ 122
3.3 Summary .......................................................................................................... 123
CHAPTER 4 RESEARCH METHODOLOGY ............................................... 127
4.0 Introduction ..................................................................................................... 127
4.1 Pragmatism – The Research Paradigm ............................................................ 127
4.2 The Emic and Etic Approaches in Cross-Cultural Research ........................... 131
4.3 The Motivation for the Use of a Mixed Methods Approach ........................... 133
4.4 The Mixed Method Research Design for the Study ........................................ 136
4.5 Ethical Clearance ............................................................................................. 143
4.6 Sample Selection in Mixed Method Study ...................................................... 143
4.7 Survey .............................................................................................................. 145
4.7.1 Sample selection for the survey ............................................................. 146
4.7.1.1 Malaysia .......................................................................................... 146
4.7.1.2 New Zealand .................................................................................... 147
4.7.2 Sample size for survey ........................................................................... 148
4.7.3 Pilot testing ............................................................................................ 150
4.7.4 Data collection procedure ...................................................................... 150

iii
4.7.4.1 Malaysia .......................................................................................... 151
4.7.4.2 New Zealand ................................................................................... 153
4.7.5 Questionnaire design ............................................................................. 155
4.7.6 Construct development and measurement ............................................ 156
4.7.6.1 Reflective and formative measures ................................................. 157
4.7.6.2 Second order factor ......................................................................... 160
4.7.6.3 Theory of Planned Behaviour ......................................................... 165
4.7.6.4 Ethical sensitivity ............................................................................ 169
4.7.6.5 Culture............................................................................................. 170
4.7.6.6 Demographic background information ........................................... 171
4.7.7 Data preparation and pre-analysis ......................................................... 172
4.7.7.1 Data screening process .................................................................... 172
4.7.7.2 Response representativeness ........................................................... 174
4.7.7.3 Nonresponse bias ............................................................................ 175
4.7.7.4 Common method bias ..................................................................... 176
4.7.7.5 Social desirability bias .................................................................... 177
4.7.7.6 Descriptive analysis ........................................................................ 178
4.7.7.7 t-test analysis ................................................................................... 178
4.7.8 Introduction to SEM ............................................................................. 179
4.7.8.1 Covariance-based SEM and Partial least squares ........................... 181
4.7.8.2 Justifications for using PLS in this study ........................................ 183
4.7.8.3 Model evaluation ............................................................................ 183
4.8 Interview ......................................................................................................... 192
4.8.1 Justifications for using semistructured telephone interview ................. 194
4.8.2 Development of interview guide ........................................................... 195
4.8.3 Sample selection for interview ............................................................. 196
4.8.4 Sample size for interview ..................................................................... 197
4.8.5 Data collection procedure ..................................................................... 199
4.8.6 Data analysis ......................................................................................... 201
4.8.6.1 Reliability and validity of interview findings ................................. 205
4.9 Summary ......................................................................................................... 206
CHAPTER 5 PRELIMINARY ANALYSIS AND RESULTS ........................ 209
5.0 Introduction ..................................................................................................... 209
5.1 Survey response analysis ................................................................................ 209
5.1.1 Response rate ........................................................................................ 209
5.1.1.1 Malaysia .......................................................................................... 210
5.1.1.2 New Zealand ................................................................................... 213
5.1.2 Demographic background ..................................................................... 216

iv
5.1.2.1 Gender ............................................................................................. 216
5.1.2.2 Age .................................................................................................. 217
5.1.2.3 Ethnicity .......................................................................................... 218
5.1.2.4 Working experience in tax practice ................................................. 218
5.1.2.5 Type of firms ................................................................................... 219
5.1.2.6 Position ............................................................................................ 221
5.1.3 Response representativeness ................................................................. 222
5.1.3.1 Malaysia .......................................................................................... 223
5.1.3.2 New Zealand .................................................................................... 225
5.1.4 Nonresponse bias ................................................................................... 228
5.1.4.1 Malaysia .......................................................................................... 228
5.1.4.2 New Zealand .................................................................................... 230
5.2 Preliminary analysis ........................................................................................ 232
5.2.1 Data screening process .......................................................................... 232
5.2.2 Common method bias analysis .............................................................. 234
5.2.3 Social desirability bias ........................................................................... 235
5.2.3.1 Malaysia .......................................................................................... 235
5.2.3.2 New Zealand .................................................................................... 236
5.2.4 Descriptive analysis ............................................................................... 238
5.2.4.1 Malaysia .......................................................................................... 238
5.2.4.2 New Zealand .................................................................................... 248
5.2.5 t-test analysis ......................................................................................... 259
5.2.5.1 Culture and tax compliance behaviour ............................................ 259
5.2.5.2 Theory of Planned Behaviour and tax compliance .......................... 260
5.2.5.3 Ethical Sensitivity ............................................................................ 262
5.2.5.4 Summary of the results from the preliminary hypotheses tests ....... 264
5.3 Summary .......................................................................................................... 266
CHAPTER 6 MODEL EVALUATION ............................................................ 269
6.0 Introduction ..................................................................................................... 269
6.1 Measurement model – First order factor model .............................................. 269
6.1.1 Reliability of reflective constructs ......................................................... 269
6.1.1.1 Indicators’ reliability ....................................................................... 270
6.1.1.2 Internal consistency (Composite reliability).................................... 277
6.1.2 Validity of constructs ............................................................................ 278
6.1.2.1 Convergent validity (AVE) ............................................................. 278
6.1.2.2 Discriminant validity ....................................................................... 279

v
6.2 Second order factor model .............................................................................. 287
6.3 Structural model .............................................................................................. 291
6.3.1 R-squares .............................................................................................. 295
6.3.2 Effect size ............................................................................................. 296
6.3.3 Path coefficient and hypotheses testing ................................................ 298
6.4 Summary ......................................................................................................... 304
CHAPTER 7 INTERVIEW FINDINGS ........................................................... 305
7.0 Introduction ..................................................................................................... 305
7.1 Malaysia .......................................................................................................... 305
7.1.1 Data analysis and interview findings .................................................... 309
7.1.1.1 Tax compliance behaviour .............................................................. 309
7.1.1.2 Ethical sensitivity and tax compliance ............................................ 317
7.1.1.3 Culture and tax compliance behaviour ........................................... 320
7.2 New Zealand ................................................................................................... 327
7.2.1 Data analysis and interview findings .................................................... 330
7.2.1.1 Tax compliance behaviour .............................................................. 330
7.2.1.2 Ethical sensitivity and tax compliance ............................................ 340
7.2.1.3 Culture in tax compliance behaviour .............................................. 344
7.3 Discussions of the interview findings: Malaysia and New Zealand ............... 350
7.4 Summary ......................................................................................................... 362
CHAPTER 8 DISCUSSIONS AND CONCLUDING STATEMENTS ......... 365
8.0 Introduction ..................................................................................................... 365
8.1 The study – A Synopsis .................................................................................. 365
8.2 Key findings of the study ................................................................................ 367
8.2.1 Culture and tax compliance .................................................................. 367
8.2.2 TPB items and tax compliance behaviour ............................................ 372
8.2.2.1 Attitudes and tax compliance behaviour ......................................... 372
8.2.2.2 Subjective norms and tax compliance behaviour ............................ 374
8.2.2.3 Perceived behavioural control and tax compliance behaviour ....... 376
8.2.3 Ethical sensitivity and tax compliance .................................................. 377
8.2.4 Tax compliance behaviour of tax agents – Some selected factors ....... 380
8.3 Contributions of the study ............................................................................... 382
8.3.1 Contribution to tax literature ................................................................. 383
8.3.2 Contribution to the accounting profession ............................................ 386
8.4 Limitations of the study .................................................................................. 388
8.5 Future research ................................................................................................ 389

vi
REFERENCES .................................................................................................... 393
Appendix A: Human Ethics approval letter ..................................................... 417
Appendix B: Letter of approval from Economic Planning Unit .................... 418
Appendix C: Sample of email invitation to CTIM members .......................... 420
Appendix D: Sample of survey questionnaire ................................................... 422
Appendix E: Sample of invitation email promoted by NZICA ....................... 430
Appendix F: Survey measures or indicators ..................................................... 432
Appendix G: Interview guide ............................................................................. 437
Appendix H: Interview consent form ................................................................ 439
Appendix I: Nonresponse bias test - Malaysia .................................................. 440
Appendix J: Nonresponse bias test - New Zealand .......................................... 443
Appendix K: Descriptive statistics - Malaysia .................................................. 446
Appendix L: Descriptive statistics – New Zealand ........................................... 448
Appendix M: Common method bias - Malaysia ............................................... 450
Appendix N: Common method bias – New Zealand ........................................ 452
Appendix O: Social desirability bias tests - Malaysia ...................................... 454
Appendix P: Social desirability bias tests – New Zealand ............................... 455
Appendix Q: Independent samples test for overall perceptions between
Malaysia and New Zealand tax agents .............................................................. 456
Appendix R: Extracts of SmartPLS results ...................................................... 459
PLS algorithm for overstating tax expense scenario (revised model) -
Malaysia ......................................................................................................... 460
Bootstrapping for overstating tax expense scenario (revised model) –
Malaysia ......................................................................................................... 467
PLS algorithm for overstating expense scenario (revised model) – New
Zealand ........................................................................................................... 469
Bootstrapping for overstating tax expense scenario (revised model) – New
Zealand ........................................................................................................... 476
PLS algorithm for understating income scenario (revised model) - Malaysia ...... 479
Bootstrapping for understating income scenario (revised model) - Malaysia ....... 489
PLS algorithm for understating income scenario (revised model) – New
Zealand ........................................................................................................... 492
Bootstrapping for understating income scenario (revised model) – New
Zealand ........................................................................................................... 502
PLS algorithm for second order factor and structural models for overstating
tax expense scenario – Malaysia .................................................................... 505
Bootstrapping for second order factor and structural models for overstating
tax expense scenario – Malaysia .................................................................... 507
PLS algorithm for second order factor and structural models for overstating
tax expense scenario – New Zealand ............................................................. 510

vii
Bootstrapping for second order factor and structural models for overstating
tax expense scenario – New Zealand ............................................................ 513
PLS algorithm for second order factor and structural models for understating
income scenario – Malaysia .......................................................................... 515
Bootstrapping for second order factor and structural models for understating
income scenario – Malaysia .......................................................................... 518
PLS algorithm for second order factor and structural models for understating
income scenario – New Zealand ................................................................... 520
Bootstrapping for second order factor and structural models for understating
income scenario – New Zealand ................................................................... 523

viii
List of Tables
Table 1.1 The use of tax agents in Malaysia in 2009 11
Table 1.2 Number of clients of tax agents from 2001 to 2011 in New
Zealand 11
Table 2.1 Economic verses Psychology Approaches in Tax Compliance
Studies 38
Table 2.2 Factors tested for association with tax accountants’ judgment or
decision making 44
Table 2.3 Hofstede’s (1980) National Cultural Dimensions for Malaysia
and New Zealand 79
Table 2.4 Standardized meta-analytic scores of Hofstede’s Value Survey
Module for Malaysia and New Zealand 84
Table 4.1 Recommended Minimum Sample Size for Most Quantitative
Research Design 148
Table 4.2 Table for Determining Sample Size from a Given Population 149
Table 4.3 Guidelines to Determine Reflective and Formative Models 159
Table 4.4 Attributes of CBSEM and PLS 182
Table 4.5 Recommended Minimum Sample Size for Most Common
Qualitative Research Design 199
Table 4.6 Phases in Thematic Analysis 203
Table 5.1 Mail survey response rate for Malaysia 210
Table 5.2 Online survey response rate for New Zealand 213
Table 5.3 Gender of survey respondents 217
Table 5.4 Age of survey respondents 217
Table 5.5 Ethnicity of survey respondents 218
Table 5.6 Working experience of survey respondents 219
Table 5.7 Type of firms of survey respondents 220
Table 5.8 Positions of survey respondents 222
Table 5.9 Comparison between survey response and population - Malaysia 225
Table 5.10 Comparison between survey response and population- New
Zealand 227
Table 5.11 Mean and Standard Deviation for Early and Late Responses –
Malaysia 229
Table 5.12 Mean and Standard Deviation for Early and Late Responses –
New Zealand 231
Table 5.13 Measures of social desirability bias - Malaysia 236
Table 5.14 Measures of social desirability bias – New Zealand 237
Table 5.15 Descriptive statistics on measures of culture - Malaysia 240
ix
Table 5.16 Descriptive statistics on measures of Theory of Planned
Behaviour items (Overstating tax expenses scenario) - Malaysia 242
Table 5.17 Descriptive statistics on measures of Theory of Planned
Behaviour items (Understating income scenario) - Malaysia 244
Table 5.18 Descriptive statistics on measures of ethical sensitivity
(Overstating tax expenses scenario) - Malaysia 246
Table 5.19 Descriptive statistics on measures of ethical sensitivity
(Understating income scenario) – Malaysia 248
Table 5.20 Descriptive statistics on measures of culture – New Zealand 250
Table 5.21 Descriptive statistics on measures of Theory of Planned
Behaviour items (Overstating tax expenses scenario) – New
Zealand 252
Table 5.22 Descriptive statistics on measures of Theory of Planned
Behaviour (Understating income scenario) – New Zealand 254
Table 5.23 Descriptive statistics on measures of ethical sensitivity
(Overstating tax expenses scenario) – New Zealand 256
Table 5.24 Descriptive statistics on measures of ethical sensitivity
(Understating income scenario) – New Zealand 258
Table 5.25 Comparison between tax agents in Malaysia and New Zealand
on Culture 260
Table 5.26 Comparison between tax agents in Malaysia and New Zealand
on Theory of Planned Behaviour Items (Overstating tax expenses
scenario) 261
Table 5.27 Comparison between Tax Agents in Malaysia and New
Zealand on Theory of Planned Behaviour Items (Understating
income scenario) 262
Table 5.28 Comparison between Tax Agents in Malaysia and New
Zealand on Ethical Sensitivity Overstating tax expenses scenario) 263
Table 5.29 Comparison between Tax Agents in Malaysia and New
Zealand on Ethical Sensitivity (Understating income scenario) 264
Table 5.30 Summary of Results for Preliminary Hypotheses Tests 265
Table 6.1 Reflective constructs, measures and loadings for overstating tax
expense scenario (original model) 271
Table 6.2 Reflective constructs, measures and loadings for overstating tax
expense scenario (revised model) 273
Table 6.3 Reflective construct, measures and loadings for understating
income scenario (original model) 274
Table 6.4 Reflective construct, measures and loadings for understating
income scenario (revised model) 276
Table 6.5 Composite reliability of the constructs 278
Table 6.6 Item cross-loadings for overstating tax expenses scenario -
Malaysia 281

x
Table 6.7 Item cross-loadings for overstating tax expenses scenario – New
Zealand 282
Table 6.8 Item cross-loadings for understating income scenario – Malaysia 283
Table 6.9 Item cross loadings for understating income scenario – New
Zealand 284
Table 6.10 Fornell- Lacker test for overstating tax expense scenario -
Malaysia 285
Table 6.11 Fornell-Larkcer test for overstating expense scenario – New
Zealand 286
Table 6.12 Fornell-Larcker test for understating income scenario -
Malaysia 286
Table 6.13 Fornell – Larcker test for understating income scenario – New
Zealand 287
Table 6.14 Second order factor model for overstating tax expense scenario 288
Table 6.15 Second order factor model for understating income scenario 289
Table 6.16 Multicollinearity for overstating tax expense scenario -
Malaysia 290
Table 6.17 Multicollinearity for overstating tax expense scenario – New
Zealand 290
Table 6.18 Multicollinearity for understating income scenario – Malaysia 291
Table 6.19 Multicollinearity for understating income scenario – New
Zealand 291
Table 6.20 R-squares for the study 296
Table 6.21 Effect size for overstating tax expense – Malaysia 297
Table 6.22 Effect size for overstating expenses - New Zealand 297
Table 6.23 Effect size for understating income - Malaysia 298
Table 6.24 Effect size for understating income - New Zealand 298
Table 6.25 Path coefficient for overstating tax expenses 300
Table 6.26 Path coefficient for under stating tax income 301
Table 6.27 Summary of hypotheses testing for overstating tax expenses
scenario in Malaysia and New Zealand 302
Table 6.28 Summary of hypotheses testing for understating income
scenario in Malaysia and New Zealand 303
Table 7.1 Demographic Profiles of Interview Participants – Malaysia 308
Table 7.2 Demographic Profiles of Interview Participants – New Zealand 329
Table 7.3 Summary of interview findings 360
xi
List of Figures
Figure 2.1 Theory of Reasoned Action 47
Figure 2.2 Theory of Planned Behaviour 49
Figure 2.3 Ethical Decision Making Model 55
Figure 2.4 Culture and behaviour 68
Figure 3.1 Conceptual framework of tax agents’ compliance behaviour
with tax law while performing their roles 110
Figure 4.1 Diagram of the research process to understand tax agents’ tax
compliance behaviour in Malaysia and New Zealand while
performing their engagement role 141
Figure 4.2 Reflective and formative measures 158
Figure 4.3 Types of second-order factor models 161
Figure 4.4 Mixed models of measures and constructs 163
Figure 4.5 Second-order Molar and Molecular Models 164
Figure 4.6 First and Second-Order Factor Model for ethical sensitivity 170
Figure 4.7 Structural Equation Modelling 180
Figure 6.1 Structural model for overstating tax expenses scenario -
Malaysia 292
Figure 6.2 Structural model for overstating tax expense scenario – New
Zealand 293
Figure 6.3 Structural model for understating income scenario – Malaysia 294
Figure 6.4 Structural model for understating income scenario – New
Zealand 295

xii
Acknowledgments
Alhamdullilah
Undertaking a PhD is a challenging process. It becomes more challenging
with the earthquakes which hit Christchurch in September 2010 and February
2011, followed by the many significant aftershocks thereafter. The challenges of
completing this thesis and at the same time encountering earthquakes are indeed
precious memories and an unforgettable experience.
Throughout completing this thesis, various persons have inspired me of
whom I would like to acknowledge and thank. I would like to thank my two
supervisors, Professor Adrian Sawyer and Associate Professor Andrew Maples, for
their supervision, support and insightful feedback. Both of them deserve the highest
credit for their professionalism, patience and giving me the freedom to seek
knowledge. I value their wisdom and I am indeed very fortunate to have them as
my supervisors. I would also like to acknowledge Associate Professor Annette
Mills for her help in Partial Least Squares (PLS) Modelling.
Thank you to my sponsor, the Ministry of Higher Learning, for the
scholarship to further my PhD study, and the management of Universiti Sains
Islam Malaysia (USIM) for supporting my study leave. I would also like to
acknowledge the assistance from the management of College of Business and Law
of the University of Canterbury, especially for the funding to present my PhD
studies in tax conferences, as well as the staff at the Department of Accounting and
Information Systems (ACIS) for their assistance.

xiii
My gratitude also goes to the tax agents who participated in my study as
well as those people who helped me with the pre-testing and pilot testing. My
warm thanks to all my friends, wherever they are, for their friendship and
encouragement. Thank you as well to members of the Malaysian Doctorate
Support Group (DSG) @ Facebook, especially to Professor Ramayah Thurasamy
of Universiti Sains Malaysia, (whom I attended his SmartPLS Workshop in Bandar
Baru Bangi, Malaysia on 14 January 2012), for sharing his knowledge, experience
and resources. My thanks also go to those people that may have directly and
indirectly contributed to the completion of this thesis.
My PhD journey would be much more difficult without the constant
support from my family. On a more personal note, I would like to thank and
dedicate this thesis to them. My special thanks to:
My husband, Mohd Ghazali Maarof, for his love, his continuous support,
sacrifices and believing in my capabilities.
My mother, Siti Sakdiah Abdul Rahman and my late father Abdul Hamid
Badol, who passed away six months before I pursued my PhD study, for
their love, endless support of my mother and my father when he was still
alive, and for inspiring me in so many ways.
My son, Abdul Rahman, who was 9 months old when I started this PhD
journey and from whom I learn to be a better person. This PhD could not
compensate the time and attention that I should give to him all these years
but I hope my PhD inspires him to love knowledge.

xiv
My step-sons, Muhammad Amirul Haziq and Muhammad Amirul Afiq,
thank you.
My step-mother in-law, Mariam Abdullah and my siblings: Mohammad
Azman, Suriani, Hamidah, Rafidah, Mohd Aqbal, Siti Aisah, Siti Fatimah
and Siti Nur Safiqah, my in-laws, nieces and nephews, thank you for your
support.

xv
Conference paper presentation incorporated into this thesis
Abdul Hamid, S. (2011, 19-21 January). Factors contributing to ethical
decision making by tax professionals in self-assessment systems. Paper presented at
the 23rd Australasian Tax Teachers Association Conference, Melbourne.
Abdul Hamid, S. (2012, 4-5 September). A qualitative approach in
understanding ethics and tax compliance in Malaysia and New Zealand from the
viewpoint of tax professionals. Paper presented at the 21st Annual Tax Research
Network Conference, London.
Abdul Hamid, S. (2013, 23-25 January). Understanding culture in tax
compliance: Applying Hofstede’s National Cultural Dimensions on tax
professionals in New Zealand. Paper presented at the 25th Australasian Tax
Teachers Association Conference, Auckland.

xvi
Abstract
Tax agents have important roles in tax systems as both advocates for their
clients and intermediaries for the tax authorities. The roles of tax agents are
becoming more challenging with the changes in the tax landscape, such as with the
implementation of the self-assessment systems (SAS) which transfers more
responsibility to taxpayers to comply with their tax obligations and who in turn,
rely on tax agents to comply with the tax laws. This study examined some selected
factors in understanding the tax agents’ tax compliance behaviour by extending the
Theory of Planned Behaviour, by including two additional factors namely, ethical
sensitivity and culture.
Conducted in the tax jurisdictions of Malaysia and New Zealand, this study
is comparative in nature. To understand the tax compliance behaviour of tax agents
in this study, a mixed-method approach, combining surveys and semi-structured
telephone interviews, was used. In Malaysia, the survey data were collected using a
mail survey from a sample of tax agents in public practice whose names were listed
on the website of the Malaysian Inland Revenue Board. Online surveys were used
to collect responses from a sample of members of the New Zealand Institute of
Chartered Accountants (NZICA) whose names were listed as public practitioners
on NZICA’s website. Descriptive statistics and Partial Least Squares (PLS), a
structural equation modeling (SEM) technique, were used to describe and analyze
the quantitative data. Transcribing, coding, finding the relevant themes and
member checking were used to analyze the qualitative data of the study.

xvii
Basically, the results indicate some similarities and some differences
between tax agents’ compliance behaviour in Malaysia and New Zealand.
Consistent with findings from prior studies, the results suggest that attitude towards
intention to comply with the tax law was the most influential factor in explaining
tax agents’ compliance behaviour to tax law in Malaysia and New Zealand in both
scenarios of overstating tax expenses and understating income examined in the
study. This was followed by ethical sensitivity, which was measured using Rest’s
(1986) Multidimensional Ethics Scale (MES), as the second influential factor in tax
agents’ compliance behaviour to tax law. Mixed findings were recorded for culture
which was measured using Hofstede’s (1980) National Cultural Dimensions and
perceived behavioural control. No support, however, was found for subjective
norms in the study.
The findings from the survey were elaborated further in the interviews. The
interviews with seventeen tax agents in Malaysia and fourteen tax agents from New
Zealand provide some interesting findings. While the results of the survey indicate
that attitude was found to be the most important factor in tax agents’ tax
compliance behaviour, the interview findings clarified how tax agents understand
attitude. For instance, attitude was interpreted as not only complying with the
professional code of ethics, but also, fear towards being penalized, audited and
interestingly, fear towards obtaining a bad reputation among the public and peers.
Overall, the findings suggest that noneconomic factors, such as attitudes
and ethical sensitivity, can explain the tax compliance behaviour of tax agents in
the study. Some economic factors identified for example, amount of risk involved,
the trade-off between costs and benefits, and the probability of being penalized,

xviii
from the interviews could also potentially explain the tax compliance behaviour of
the tax agents in Malaysia and New Zealand who participated in the study.
The findings contribute to the theoretical and practical aspects of
understanding the tax compliance behaviour of tax agents in two different
countries. In a response to the calls for more cross-cultural research, this study
reveals some similarities and differences in the tax compliance behaviour of tax
agents in Malaysia and New Zealand which may be helpful in improving our
understanding of the ethical decision making of tax agents. The findings from the
study also provide some insights into the ethical behaviour of tax agents in
Malaysia and New Zealand which may be useful for professional bodies and
regulators.

1
CHAPTER 1
INTRODUCTION AND OVERVIEW
1.0 Introduction
This chapter outlines the overall thesis. The first section of this chapter
presents the background of the study, including the roles of tax agents, the
justification for conducting the study in the context of Malaysia and New Zealand,
a brief discussion on some selected variables used in the study, an overview of the
taxation systems in Malaysia and New Zealand and an overview of accounting
professions in Malaysia and New Zealand. The remaining part of the chapter
explains the research gap, the objectives of the study, research questions, research
methods, significance of the research and the thesis organization. The chapter ends
with a summary.
1.1 Background
In a modern world, tax systems may perform various functions for a
government. The tax system may be used not only for collecting revenue but also
as a mechanism to enforce policies, such as encouraging certain activities and
discouraging others (Alley & James, 2006). As a result, non-compliance influences
not only the amount of revenue being collected, but also affects the implementation
of the government policies. Tax compliance issue becomes more critical when the
main source of government funding comes significantly from the tax system and
the amount of tax collected relies on a self-assessment system (SAS) which
requires voluntary compliance. Since non-compliance with the tax law has a

2
number of consequences, a way to combat the problem of non-compliance is by
understanding the factors concerning why people comply or do not comply with
the tax law. Tax compliance studies, therefore, provide a platform for
understanding tax compliance issues, which explains why research in tax
compliance (and non-compliance) has always been an area worthy of exploration.
The concept of what constitutes tax compliance itself needs to be clarified
before delving into the issues of tax compliance. A few definitions of tax
compliance have been suggested from previous studies, such as: voluntary
compliance with the letter and the spirit of the tax law (Alley & James, 2006);
timely voluntary payment of the difference between the actual tax due and the
amount reported to the tax authority (Andreoni et al., 1998); and the timely filing
of tax returns accurately according to the law and settling any tax owed without
further enforcement (Singh, 2003). While all these definitions have contributed to
understanding tax compliance, this thesis uses a more comprehensive definition
commonly accepted in explaining tax compliance (Richardson & Sawyer, 2001) as
provided by Roth et al. (1989, p.2) which is:
“The taxpayer files all required returns at the proper time and that
the returns accurately report all liability in accordance with the
Internal Revenue Code, regulations and court decisions applicable
at the time the return is filed”.
The above definition suggests that the central tenets in tax compliance are
voluntary compliance and timely payment according to the tax law. In reality,
however, it is challenging to apply the above definition of tax compliance, for what

3
is considered to be an acceptable level of complying with the tax law by the tax
authority is subjective and varies, as evidenced in the judgments of the Supreme
Court of New Zealand such as the cases of Penny & Hooper v CIR in New Zealand
tax practice (Elliffe, 2011; Sawyer, 2009). Elliffe (2011, p. 466) further argues that
the judgments of the Supreme Court and Court of Appeal in the above mentioned
case imply that “… an aggressive tax avoidance transaction may converge into
criminal tax evasion”. Kirchler (2007) argues that in most countries, tax avoidance
is considered legal because it is regarded as an attempt to take advantage of the
loopholes in the tax system. However, tax evasion, according to Kirchler (2007), is
illegal since it has the intention to breach the tax law. Hence, it is important for
taxpayers to understand the boundaries between tax avoidance and tax evasion to
prevent unnecessary tax litigation on that point or any other circumstances imposed
by the tax authority as a result of not complying with the tax law. In this case, the
role of tax agents is important to assist their clients in determining these
boundaries, despite a view by accountants that while tax evasion is illegal, tax
avoidance is not, and the latter is expected as a form of tax planning (Ayers &
Ghosh, 1999).
Tax compliance is also translated as taxpayers’ willingness to comply with
the tax laws and non-compliance is associated with violating the tax laws whether
or not it is intentional (Kirchler, 2007). Therefore, tax compliance (and non-
compliance) behaviour is the outcome of ethical and unethical decision making
process (Singh, 2003). While it is possible to differentiate between ethics and
morality in discussing ethical (and unethical) behaviour, the terms ethics and
morality are normally used interchangeably (Crane and Matten, 2007). The word

4
ethics comes from the word ethos in Greek which means “customary” or
“conventional” (Jardins, 2011). Ethics is defined as a set of moral conduct that
differentiates between what is right and what is wrong. It is normally referred as
normative ethics: what we ought to do or should do (Beauchamp, Bowie & Arnold,
2009). Morality has similar meanings which can be referred to how we should live
which involves looking into principles and rules that help us to decide what we
should do (Jardins, 2011).
With regard to the application of the word ‘ethics’ in taxation, Doyle,
Hughes and Glaister (2009) suggest that ‘ethics’ refer to what we ought to do or
should do (normative ethics). Doyle et al. (2009) further suggest that the concept of
ethics in taxation now goes beyond exercising normative ethics, whether or not
people in the tax system such as taxpayers and tax agents act as what they should
do, but also questioning themselves whether or not there is any possibility that the
tax authorities will challenge their tax decision. Consistent with the opinion of
Crane and Matten (2007), the words ‘ethics’ and ‘morality’ are used
interchangeably in this thesis. In addition, the use of the term ‘ethical decision
making’ throughout this thesis does not conclusively imply that all decisions being
made by tax agents are ethical.
Past studies indicate there is no one definition or terminology to refer to the
person who is hired to handle other people’s tax and, as a result, various
terminologies such as: ‘tax practitioner’ (Dubin et al., 1992; Tan, 1999); ‘tax
preparer’ (Klepper et al., 1991); ‘tax professionals’ (Kahle & White, 2004); and
‘tax agent’ (Mohd Isa, 2012), have been applied to suit the context of the respective
studies. Tan and Sawyer (2003), for instance, utilise multiple terms, such as ‘tax

5
professionals’, ‘tax preparer’, ‘tax agents’, ‘tax advisors’ and ‘tax practitioners’
interchangeably in their study, reflecting the variety of terminology in the
literature. In the context of this thesis, the term ‘tax agents’ is used throughout the
thesis to ensure consistency. Tax agents in this study also include tax staff
employed by the tax agents’ firms.
1.1.1 The important roles of tax agents in tax compliance
Notwithstanding the various special areas in accounting, such as audit, tax,
management and financial accounting, the moral reasoning of accountants is
significantly indifferent to their job tasks (Emerson et al., 2007). Nonetheless, the
roles of tax agents are perhaps different from other accounting professionals. For
instance, while auditors are expected to be independent and perceived to be
independent, tax agents, on the other hand, have to act as advocates for their clients
(Tomasic & Pentony, 1991; Tan & Sawyer, 2003) while at the same time remain
objective in their professional conduct. Concurrently, tax agents are also taxpayers
themselves and are expected to act as an intermediary in a tax system.
The Code of Ethics for Tax Agents published by the Malaysian Inland
Revenue Board (MIRB), for instance, states that since tax agents represent their
clients they have to provide the best possible services to their clients. Furthermore,
while safeguarding the interests of their clients, they also have to support the
interests of the government and the country (Malaysian Inland Revenue Board,
2012). In New Zealand, the Inland Revenue Department (NZIRD) perceives its
relationship with tax agents as being collaborative or even a partnership (Burton &
Dabner, 2009). In addition, there are Muslim tax agents in Malaysia, who also act

6
as amil1 (Malaysian Association of Tax Accountants, 2013). The various roles
could lead to a challenging situation for tax agents, due to the conflict of interests
that may arise from performing these roles.
Past studies in tax compliance suggest that due to the expertise held by tax
agents, taxpayers rely on tax agents to handle their tax matters. In New Zealand,
Tan (1999) provides evidence that small business owners are prone to agree more
rather than disagree with the advice given by their tax agents, which emphasizes
the importance of tax agents in a tax system. In her study, filing accurate tax
returns and avoiding serious penalties are the two most important reasons why tax
agents are engaged. A recent finding by Mohd Isa (2012), using corporate
taxpayers in Malaysia, indicates that many corporate taxpayers rely heavily on tax
agents who not only handle their tax compliance matters, but also tax planning as
well.
In Australia, Sakurai and Braithwaite (2003) demonstrate that the majority
of respondents in their studies engaged tax agents. Similar to Sakurai and
Braithwaite (2003), a recent finding by Devos (2012) in Australia indicates that
there is a significant relationship between individual taxpayers’ compliance with
the need to engage tax agents. Devos (2012) also found three main reasons tax
agents were hired which were due to the complexity of the Australian tax system,
1 Amil is the representative appointed by the Islamic authority to collect zakah; they can be
individuals or organizations. Zakah is the Islamic tithe which in Malaysia is managed by the Islamic
Council of the respective states. This is because, in Malaysia, religious matters are governed by the
State Governments. The conventional and the Islamic economic systems in certain sectors in the
Malaysian economy are run in parallel. For instance, the conventional banking and financial
systems operate side by side with the Islamic banking and financial systems. Similarly,
conventional insurance runs in parallel with the takaful (Islamic insurance), and the taxation system
with the zakah system.

7
legally reduce the amount of tax payable and fear of making mistakes. Dubin et al.
(1992) and Blumenthal and Christian (2004), for instance, suggest that the increase
in audit enforcement results in more taxpayers seeking the advice of tax agents.
Similar to the findings of Mohd Isa (2012) among corporate taxpayers in Malaysia
who engaged tax agents for the purpose of obtaining tax updates, Hasseldine et al.
(2012) also suggest an intermediary role of tax advisers in the United Kingdom as a
broker of knowledge between the taxpayers and the tax authority.
The roles of tax agents in a tax system, to a certain extent, exert an
influence on the compliance process (Andreoni et al., 1998). In a series of
interviews with tax agents in Australia, Tomasic and Pentony (1991) found that tax
agents act as intermediaries between the Australian Tax Office (ATO) and
taxpayers, and have an influence on the level of taxpayers’ compliance with the tax
laws. Erard (1993) suggests that the use of tax agents increases the level of
compliance. Doyle et al. (2009) argue that tax agents are influential in determining
the amount of tax that will be paid by their clients. Marshall et al. (1998) suggest
that the role of tax agents also includes representing their clients when negotiating
with the tax authority, and is not restricted to the preparation of income tax returns.
The reason for hiring tax agents, according to Kirchler (2007), is not
primarily motivated by the desire to avoid paying taxes, but more importantly the
intention to report correctly in a complex tax environment. Tax agents are engaged
to assist their clients in various tax matters, such as minimizing the problems of
being audited, tax savings, risk management, reducing tax compliance costs,
submitting accurate tax returns, and resolving uncertainties (Hite et al., 2003; Tan
& Sawyer, 2003; Tan, 2006). It is also suggested that depending on the complexity

8
of the tax law, tax agents play dual roles, known as the “enforcer/ambiguity-
exploiter effect” (Klepper et al., 1991, p. 228). As a result of their expert
knowledge, which may lead to strategies to reduce penalties, tax agents will favour
aggressive tax positions in ambiguous tax situations, and become the enforcer of
the tax law in situations when the tax law is unambiguous (Klepper & Nagin, 1989;
Spilker et al., 1999; Hite et al., 2003).
A brief review of the roles of tax agents in this section suggests that tax
agents have important roles in tax compliance, as advocates for their clients and
intermediaries to the government. Therefore, it is worthy to explore the factors that
influence them in their decision making.
1.1.2 The setting of the study: Malaysia and New Zealand
The increase in cross-border commerce suggests that there is a need for tax
researchers to undertake cross-cultural studies to enhance the knowledge and
understanding of tax compliance issues internationally (Attwell & Sawyer, 2001;
Richardson & Sawyer, 2001; Hite et al., 2003; Singh, 2003, Yong, 2011).. In a tax
context for instance, different cultures may allow for different incentives and
opportunities for tax compliance and non-compliance (Chau & Leung, 2009).
Responding to these recommendations, this study is cross-cultural in nature,
conducted in the tax settings of Malaysia and New Zealand.
It is always a concern for researchers conducting cross-cultural study that
the comparison between two cultures becomes a comparison of apples and oranges
(Hofstede, 1998). However, studies in cross-cultural context could be in the form
of finding similarities, differences or both (Hofstede, 2001; Matsumoto & Juang,

9
2008). This is then translated into the approach being used to understand the
influence of culture, either from inside perspective (emic) , or outside perspective
(etic) , or both, and also to be consistent with Hofstede (1980), matched samples
are used in both cultures. Notwithstanding that, in real life, finding matched
samples in every aspect is not realistic due to the time and cost constraints.
Therefore, matched samples in certain aspect such as using similar population of
samples, for instance in this study tax agents in public practice is considered as
acceptable. Malaysia and New Zealand were chosen for this study for the following
reasons.
First, both Malaysia and New Zealand are multi-ethnic countries. In
Malaysia, the latest population and housing Census in 2010 indicates that the
Bumiputera2 forms the majority of the population with 67 percent, followed by the
Chinese ethnics of 25 percent, Indian ethnics of 7 percent and others of 1 percent
(Department of Statistics of Malaysia, 2010). As for New Zealand, based on the
latest 2006 Census, European New Zealanders represents the majority of the
population with 62 percent. This is followed by Maori ethnics of 13 percent,
‘Others’ of 10 percent, Asian ethnics of 8 percent, Pacific ethnics of 6 percent and
Middle Eastern, Latin American and African ethnics (MELAA) of 1 percent
(Statistics New Zealand, 2012).
The differences of ethnicities between these two countries possibly reflect
the differences in their national cultures as postulated by Hofstede (1980). For
instance, despite Malaysia being a multi-ethnic country, in general the Malaysian
2 The natives Malay, Iban, Kadazan and Dusun.

10
societies practise Asian values which formed their culture (Mohd Iskandar &
Pourjalali, 2000; Kennedy, 2002). On the other hand, due to the dominance of
European descendants in New Zealand, the culture of New Zealand society in
general reflects more the cultures of the Anglo-Celtic (Brooking, 2004) or Anglo-
Saxon (Kennedy, 2012).3 Considering the differences in their cultures, it would be
worthwhile to examine the tax compliance behaviour of tax agents in Malaysia and
New Zealand since prior studies for instance, Richardson (2008) and Bame-Aldred
et al. (2013) suggest that culture has important influence in tax compliance
behaviour.
Secondly, Malaysia and New Zealand share a number of similar
characteristics. For instance, as former British colonies, both Malaysia and New
Zealand have experienced the British administration system and inherited British
accounting practices. Their accounting professions are also patterned after the
United Kingdom model (Gernon & Meek, 2001).4 In terms of tax systems, both
Malaysia and New Zealand utilise a self-assessment system (SAS), although New
Zealand is more advanced in its implementation compared to Malaysia.
Thirdly, in both countries, there is evidence that taxpayers rely on tax
agents to handle their tax matters. For instance, a recent study by Mohd Isa (2012)
in Malaysia found that around 80 percent of corporate taxpayers engaged tax
agents to handle their tax matters. Mohd Isa (2012) also reported that, in 2009,
3 However, this does not suggest that the influence of other cultures in New Zealand should be taken
for granted. Yong (2011) for instance, found that different ethnics in New Zealand have different
cultures of tax compliance behaviour.
4 The United Kingdom accounting model for instance adopts the fair presentation or full disclosure
model (Gernon & Meek, 2001).

11
around 91 percent of the corporate taxpayers in Malaysia engaged tax agents to
liaise with their tax matters. This is followed by around 19 percent of all
individuals without business income, and about 4 percent of all individuals with
business income, as illustrated in Table 1.1.
Table 1.1 The use of tax agents in Malaysia in 2009
Type of taxpayers Number of
taxpayers
Number of tax
agents
Percentage
Company 177,200 162,226 91.5
Individual without business
income
586,624 112,496 19.2
Individual with business income 1,957,245 83,267 4.3
Source: Adapted from Mohd Isa (2012, p. 100).
In New Zealand, statistics provided by the NZIRD indicates that, there is an
increasing number of tax agents engaged by taxpayers from 2001 to 2011, as
illustrated in Table 1.2.
Table 1.2 Number of clients of tax agents from 2001 to 2011 in New Zealand
Years Number of clients
engaged tax agents
(,000)
Years Number of clients
engaged tax agents
(,000)
2001 1,307.7 2007 1,732.4
2002 1,362.6 2008 1,814
2003 1,421.8 2009 2,145.6
2004 1,496.2 2010 2,270
2005 1,578.4 2011 2,320.8
2006 1,657.1
Source: New Zealand Inland Revenue Department (2012).
The aforesaid discussion suggests that Malaysia and New Zealand have
both similarities and differences. Since cross-cultural studies can be conducted to
12
find similarities, differences or both, using Malaysia and New Zealand as the
setting for the study may provide interesting insights into further understanding a
number of tax compliance issues.
1.1.3 Some selected variables used in the study to understand tax compliance
behaviour of tax agents
Tax compliance behaviour is a complex research area and is not possible to
be explained only by a single factor (McKerchar, 2010). However, incorporating
all possible factors in a single study would be very challenging due to the wide area
of research in tax compliance behaviour. Therefore, this study attempts to
understand the tax compliance behaviour of tax agents in Malaysia and New
Zealand using some selected factors by extending the Theory of Planned Behaviour
(TPB) by Ajzen (1991) with ethical sensitivity and culture. A brief discussion on
the TPB, ethical sensitivity and culture is provided here.
The TPB is a social psychology theory which is used to explain human
behaviour. The TPB posits that the intention to perform behaviour and the
perceived control that an individual has to perform that particular behaviour lead to
conducting the actual behaviour. The TPB also claims that attitude, subjective
norms and perceived behavioural control influence an individual’s intention to
perform behaviour. Attitude towards behaviour according to Ajzen (1991) refers to
an individual evaluation towards the outcome of performing a particular behaviour,
whether or not the outcome is favourable or unfavourable. Subjective norms refer
to the influence of important others on intention to perform behaviour since we
form our beliefs from people important to us (Ajzen, 1991). Perceived behavioural
13
control is described as the ability of an individual to have control in performing
behaviour consists of personal and environmental factors (Fishbein & Ajzen,
2010). A particular behaviour is also unlikely to be performed if there is no control
to perform the behaviour even in the existence of positive attitude and influence
from important others (Ajzen, 1991). The TPB has been widely used in various
fields of studies (Armitage and Conner, 2001; Ajzen, 2011). However, in tax
context, only a few studies have attempted to use the TPB such as Bobek and
Hatfield (2003), Saad (2010), Trivedi, Shehata and Mestelman (2005) and Buchan
(2005), all of which in general provide mixed support for the TPB and tax
compliance.
Rest (1986) suggests that ethical sensitivity is an important element in
ethical decision making process. Ethical sensitivity according to Rest (1986) is the
awareness that our action may impact others. Rest (1986) further argues that lack
of ethical sensitivity in determining ethical issues may lead to unethical behaviour.
Despite ethical sensitivity is an important element in ethical judgment, a review of
business ethics studies by O’Fallon and Butterfield (2003) suggests that it is less
explored in research. A similar view is shared by Tan (2006) on the lack of
research examining the influence of ethical sensitivity in tax compliance studies. A
few studies however, have attempted to investigate the influence of ethical
sensitivity and ethical judgment of accounting practitioners. For example, Collins
(2000) and Emerson, Conroy and Stanley (2007) found that ethical sensitivity is
important in the ethical decision making of accountants. In tax context, a few
studies such as Yetmar and Eastman (2000), Buchan (2005) and Doyle et al. (2009)

14
have raised the issue of ethical sensitivity in their studies and found mixed support
for ethical sensitivity and ethical judgment which suggest for further examination.
Tax compliance involves ethical considerations of what is ethical and what
is not which to a certain extent may involve the influence of culture since ethics is
related to customary (Jardins, 2011). Hofstede (1991) also suggests that ethical
values are part of a culture which may contribute to ethical decision making. The
importance of culture in ethical judgment is already acknowledged (see for
instance, Ferrell and Gresham (1985) and Hunt and Vitell (1986)). However, in a
synthesis of cultural studies in accounting by Chanchani and MacGregor (1999), an
area that requires further examination is the effect of culture on judgment. In tax
context, the influence of culture has been examined in studies such as Jakubowski
et al. (2002), Alm and Torgler (2006), Bobek, Roberts and Sweeney (2007),
Torgler and Schneider (2007), Lewis (2009) and Yong (2011) of which indicate
mixed findings.
1.2 An overview of the self-assessment taxation systems in Malaysia and New
Zealand
To better understand the tax backgrounds for this study, the following sub-
sections briefly explain the taxation systems in Malaysia and New Zealand. The
discussion concisely describes the historical background, types of income taxed,
and then proceeds with the implementation of the self-assessment systems.
1.2.1 Malaysia
Malaysia is a country located in South East Asia. Historically, Malaysia
was formed on 16 September 1963, consisting of the Peninsular Malaysia, Sabah,

15
Sarawak and Singapore.5 Prior to her independence on 31 August 1957 from the
British Administration, the Peninsular Malaysia was known as the Persekutuan
Tanah Melayu. In 1947, the British Administration introduced a modern taxation
system in the Persekutuan Tanah Melayu under the first Income Tax Ordinance. As
for Sabah, the first Income Tax Ordinance was introduced in 1957 and much later,
in 1961, in Sarawak. In 1968, the Malaysian Parliament enacted the Income Tax
Act 1967 (ITA) which took effect from 1 January 1968.
Essentially, the scope of income that is taxed in Malaysia is determined on
a territorial basis. However, the insurance services, banking and finance, and sea
and air transport services, are taxed based on a worldwide income basis. Direct and
indirect taxes are two main types of taxes collected by the Malaysian Government.
A direct tax is collected by the MIRB whereas indirect tax is collected by the Royal
Customs and Excise Department of Malaysia. Over the years, most of the
contribution from tax revenue has come from corporate taxes, followed by
petroleum resources and individuals (Malaysian Inland Revenue Board, 2012).
In 2000, the Malaysian Government introduced the current year basis for
assessing income for tax purposes as the first step to implement the self-assessment
system in Malaysia. Prior to that, previous year basis was used tax income in
Malaysia. Commencing in 2001, the SAS was introduced to replace the Official
Assessment System (OAS) for corporate taxpayers. The Malaysian Government
extended the implementation of SAS to businesses, co-operatives, partnerships and
5 Singapore later left Malaysia in 1965.

16
employees in 2004. Therefore, by 2005, the SAS was fully applied to all taxpayers
in Malaysia.
The SAS was introduced to encourage voluntary tax compliance, reduce the
cost of collecting taxes, and bring forward the amount of tax being collected since
current year basis is used to tax income under the SAS. It also enables the MIRB to
divert its resources, from its traditional task of determining or assessing the
taxpayers’ income, to focus more on tax audits, with the desire of increasing the
income tax collected (Kassipillai et al., 2000). The change of the tax landscape
under the SAS transfers more responsibility to comply with the tax laws to the
taxpayers, suggesting that they have to be more responsible in managing their
income tax.
The implementation of the SAS in Malaysia is not without its issues. For
example, Loo et al. (2010) conducted a study on the impact of the SAS on the tax
compliance behaviour of individual taxpayers in Malaysia using individual case
studies, and found that the complexity and the ambiguity of the tax laws under the
SAS could cause difficulties for taxpayers. Those difficulties result in taxpayers,
either unintentionally non-complying or over complying with their obligations
under the tax laws.
Commencing 1 April 2015, Malaysia will implement Goods and Service
Tax (GST) for a more effective tax system (Malaysian Inland Revenue Board,
2013). There is a possibility that the implementation of GST will bring a new set of
challenges to tax agents in Malaysia in assisting their clients to comply with the tax
law.

17
1.2.2 New Zealand
Geographically, New Zealand is located in the southwest of the Pacific
Ocean and is formed by two main islands, the North and the South Islands. The
implementation of the Land and Income Tax Act 1891 marked the commencement
of the taxation of income in New Zealand. Essentially, there are currently four
major statutes governing taxation in New Zealand. These statutes are the Income
Tax Act 2007 (ITA 2007), Goods and Services Tax Act 1985 (GST 1985), Tax
Administration Act 1994 (TAA 1994) and Taxation Review Authorities Act 1994
(TRAA 1994). The taxation system in New Zealand has undergone many reforms,
including the re-writing of the Income Tax Act 1976 which was undertaken in
stages and completed in November 2007 and became effective from 1 April 2008
(Sawyer, 2007).
In general, the scope of income taxed in New Zealand is determined on the
worldwide basis. In addition to the income tax, the Goods and Service Tax (GST)
is also applied in New Zealand. The tax revenue in New Zealand comes mainly
from individual taxpayers and GST, followed by companies and other duties (New
Zealand Inland Revenue Department, 2012).
New Zealand has operated a full self-assessment system for income tax
since 2002. Taxpayers are responsible for calculating their own tax liabilities and
for paying the amount owing to the NZIRD or claiming a refund. The SAS in New
Zealand does not require individuals who only receive salaries or wages, interest or
dividends (which are taxed at source), to file a tax return with the NZIRD. Instead,
to ensure the correct amount of tax is remitted to the NZIRD, the NZIRD relies on

18
the withholding tax system for taxing this income, and the NZIRD may also
determine their income by issuing an income statement.
Notwithstanding the various efforts of the NZIRD to encourage
compliance, which cater for different types of taxpayers, non-compliance is still an
issue in New Zealand. For instance, Gupta (2006) found that tax evasion is
perceived as a less serious crime in New Zealand, compared to other white collar
frauds such as accounting fraud.
1.3 An overview of the accounting professions in Malaysia and New Zealand
Notwithstanding that both Malaysia and New Zealand inherited British
accounting practices and patterned their accounting professions after the British
model (Gernon & Meek, 2001), there is the possibility that the requirements to
appoint tax agents in Malaysia and New Zealand are different due to the
differences in the tax laws in both countries. For instance, section 153 of the
Income Tax Act 1967, together with the Accountants Act 1967, statutorily regulate
tax agents in Malaysia. New Zealand, on the other hand, does not statutorily
regulate the profession but implements a voluntary registration system via s 34B of
the TAA 1994 (Thiagarajah, 2012). To understand how tax agents in Malaysia and
New Zealand are appointed, this sub-section provides a brief explanation of the
accounting profession in both countries.
1.3.1 Malaysia
Based on a study by Gray (1988), the accounting profession in Malaysia is
suggested to be statutorily controlled, displaying uniformity rather than flexibility,
operating in secrecy rather than transparency, and conservative. Gray (1988)

19
further argues that the accounting profession in Malaysia is regulated mostly by the
Malaysian Government rather than self-regulated, favours enforcement of uniform
legislation for all companies, encourages high confidentiality and restricts the
disclosure of information and finally, is cautious in taking risk of future events.
Historically, the accounting profession in Malaysia has been influenced by
two accounting bodies, the Malaysian Institute of Accountants (MIA) and the
Malaysian Institute of Certified Public Accountants (MICPA), (the latter was
previously known as the Malaysian Association of Certified Public Accountant
(MACPA)). The MIA was set up under the Accountant Act 1967 as a statutory
body, whereas the MICPA was established as a private association in 1958
(Selvaraj, 1999). Prior to 1967, there was no regulation of the accounting
profession in Malaysia.
Since its inception, the MICPA has been active in providing assistance to
its members through technical guidance and training, as well as conducting its own
professional examinations. The MICPA was also active in issuing accounting
standards in the early 1970s. During its early years, members of MICPA were
mostly chartered accountants trained in the United Kingdom and Australia. The
membership of the MICPA increased with support from the then Big Six Chartered
Accounting firms. At the same time, graduates of the Association of Chartered
Certified Accountants (ACCA) experienced difficulties in becoming MICPA
members. This led to the suggestion of establishing a local organization to regulate
the accounting profession in Malaysia, resulting in the establishment of MIA. Both
bodies merged in 1987, and since then the MIA has not restricted its function to
being a statutory body but has been active in issuing standards, providing technical

20
support and training (Selvaraj, 1999). The members of the MIA are required to
follow the bylaws of MIA in conducting their professional duties. The bylaws of
MIA are based mainly on the Code of Professional Accountants issued by the
International Federation of Accountants (Malaysian Institute of Accountants,
2010).
In addition to the above mentioned bodies, there are two further
professional bodies which specifically cater for tax agents in Malaysia. The
Chartered Tax Institute of Malaysia (CTIM), formerly known as the Malaysian
Institute of Taxation (MIT), was established in 1991 under the patronage of MIA,
before re-branding and becoming a separate entity. Its main objectives are to
develop awareness of tax issues and protecting the tax profession to ensure
qualified tax agents are produced in the country (Chartered Tax Institute of
Malaysia, 2010). The other body is the Malaysian Association of Tax Accountants
(MATA) which was established in 1988 to assist the Malay tax agents and
company secretaries to develop their professionalism (Malaysian Association of
Tax Accountants, 2013). Since MIA is the body governing the accounting
profession in Malaysia, the members of CTIM and MATA are bound by the bylaws
of the MIA.
Eligibility to become a tax agent in Malaysia is determined under three
conditions pursuant to section 153(3) of the ITA 1967. A person can become a tax
agent if:
(1) She or he is a professional accountant authorized by, or under, any written law
to be an auditor of companies, or

21
(2) Any other professional accountants approved by the Minister of Finance or,
(3) Any other professional accountants approved by the Minister of Finance on the
recommendation of the Director General of the MIRB.
According to section 153(3) of the ITA 1967, which was amended with
effect from 1 January 2006, the term “tax agents” refers to any professional
accountants or person, approved by the Minister of Finance (Thiagarajah, 2012).
The definition of “professional accountants” is not provided by the ITA 1967;
however, section 23 of the Accountants Act 1967 exclusively restricts any person
from using the title “accountant” unless that person is a registered member of the
MIA.
The roles of a tax agent in Malaysia are also stipulated in the ITA 1967
which suggest an important aspect of tax agents’ responsibility as advocates for
their clients in the Malaysian tax system. The tax agents’ roles under the ITA 1967
are as follows:
(1) Advising their clients on records to be maintained,
(2) Assisting in completing clients’ tax returns,
(3) Advising their clients on their obligations to pay their dues as required by the
law,
(4) Attending the audit at clients’ premises if they are being audited,
(5) Attending an investigation,
(6) Participating in tax audit interviews,
(7) Negotiations and proceedings on behalf of their clients, and

22
(8) Filing appeals as well as attending court hearings and any further appeals.
1.3.2 New Zealand
A study by Gray (1988) suggests that accounting practices in New Zealand
favour professional individual judgment and self-regulated legislation, flexible in
their accounting approach, transparent in disseminating information and lastly,
favour a risk taking approach in uncertain future events. The history of the
accounting profession in New Zealand can be traced back to the establishment of
the Incorporated Institute of Accountants of New Zealand (IIANZ) in May 1894.
Due to disputes over the enrolment of membership, in 1898, the Accountants and
Auditors Association (AAA) was formed in Auckland. Both bodies, the IIANZ and
AAA, were later merged and became the New Zealand Society of Accountants
(NZSA) in 1908. In 1996, NZSA changed its name to the Institute of Chartered
Accountants of New Zealand (ICANZ) (Emery et al., 2002) which later became
NZICA. Since then many reforms had taken place, and currently NZICA operates
under the Institute of Chartered Accountants of New Zealand Act 1996.
The objectives of NZICA are to ensure the integrity of the accounting
profession and regulate the accounting industry in New Zealand through providing
assistance, training and education. NZICA was also the instigator, as well as one of
the 11 members of the Global Accounting Alliance (GAA) which represents many
of the leading professional accountancy bodies in the world (New Zealand Institute
of Chartered Accountants, 2013). The NZICA Code of Ethics, which is mandatory
for all its members, serves as a guide for members in performing their professional
duties. For tax practice, a sub-section of the NZICA Code of Ethics, the Tax

23
Guideline 1 (TG-1) 2004 provides a comprehensive ethical guideline (New
Zealand Institute of Chartered Accountants, 2010).
There is also the Accountants and Tax Agents Institute of New Zealand
(ATAINZ), formerly known as Tax Agents Institute of New Zealand (TINZ),
which was established in 1976 as an incorporated society, and serves as a platform
to support the tax profession in New Zealand. ATAINZ supports tax agents
through conferences, courses, discussions and specialist advice service. In addition
to NZICA, ATAINZ has also been granted ‘approved advisor group’ status by the
NZIRD (Accountants and Tax Agents Institute of New Zealand, 2013).
Furthermore, CPA Australia is another professional accounting body which has
been in active presence in New Zealand accounting profession. Similar to NZICA
and ATAINZ, CPA Australia has also been granted an ‘approved advisor group’
status by the NZIRD (CPA Australia, 2013).
New Zealand relies on a voluntary system, using a self-regulatory approach
for tax agents to provide their services (Thiagarajah, 2012). In New Zealand, a tax
agent is determined according to section 34B of the TAA 1994; however, it is the
Commissioner of Inland Revenue who has the discretion whether or not to list a tax
agent (Fisher, 2010). Pursuant to section 34B of the TAA 1994, to qualify as a tax
agent, a person has to be a preparer of income tax returns for ten or more taxpayers
and fall under any of the following categories:
(1) A practitioner carrying on a professional public practice,
(2) A person carrying on a business or occupation in which returns of income are
prepared, or

24
(3) The Maori Trustee.
1.4 Research gap
The earlier discussion of this chapter suggests that tax agents are engaged to
undertake various tasks by their clients with the ultimate concern being how much
tax their clients could save or minimising the amount of tax that their clients must
pay to the tax authority. Meanwhile, tax agents must also consider their obligations
to other parties, such as the tax authority, their firm, the accounting profession and
the public (Yetmar & Eastman, 2000). Due to their unique position, it is
challenging for tax agents to determine the boundaries as advocates and maintain
their professionalism at all times (Bobek & Hatfield, 2003). Furthermore, with
changes in the tax landscape, such as the implementation of SAS, their roles are
becoming more challenging since as a result of their expertise, taxpayers rely more
on tax agents (Lai & Choong, 2009). The experience of other countries which have
implemented the SAS, such as Australia and the United Kingdom, indicates that
many taxpayers seek the assistance of tax agents in complying with their tax
obligations after the implementation of SAS (Marshall et al., 1998).
Notwithstanding the importance of tax agents in a tax system, studies on tax
agents’ tax compliance behaviour, especially the ethical sensitivity of tax agents,
remain scarce compared to research on other factors in tax compliance studies
(Tan, 2006). While there is a possibility that the number has changed over the
years, a review by Tan and Sawyer (2003) on tax compliance studies in New
Zealand found that only two published studies examined the tax agents’ ethical
decision making and their tax compliance behaviour for the period between 1990
and 2003. In a recent study by Gupta and McGee (2010), they compared the

25
perceptions of students with accounting practitioners regarding ethics in tax
compliance in New Zealand. The study, however, did not specifically use tax
agents as samples. A recent unpublished study which uses tax agents as sample is
provided by Smart (2012). The study examines the tax reporting behaviour of tax
agents and individual taxpayers in New Zealand using the Theory of Planned
Behaviour as framework.
While there are a few studies in Malaysia between the period 1994 and
2008 that involved tax agents as respondents, only Singh (2003) specifically
examined the moral decision making of tax agents (Abdul-Jabbar & Pope, 2009).
Similar to New Zealand, the number of studies using tax agents as samples in
Malaysia may have changed over the years. For instance, Lai and Choong (2009)
examined the perceptions of tax agents towards tax compliance in SAS
environment. Lai and Choong (2010) and Abdul Aziz and Md. Idris (2012),
investigated the use of the electronic tax filing system in Malaysia among tax
agents. Nonetheless, the ethical decision making of tax agents in complying with
the tax law while performing their professional roles is still not widely explored in
Malaysia.
Even though the importance of ethics in previous taxation studies has
received considerable support (Jackson and Milliron, 1986; Richardson and
Sawyer, 2001), the issue of how to measure ethics remains a concern (Richardson
and Sawyer, 2001). While the use of single item to measure ethics in prior studies
is acknowledged in improving our understanding on the importance of ethics in tax
compliance, arguably, individuals rely on more than one ethical dimension in their
decision making (Reidenbach and Robin, 1988; 1990). Thus, ethical sensitivity in

26
this study is measured using the Multidimensional Ethics Scale (MES) adapted
from Cruz et al. (2000) which could possibly explain better the ethical decision
making of tax agents in the study.
Previous studies on tax compliance have almost always centred on Western
countries, especially the United States (US), which suggests that tax authorities
outside the US have to be cautious in interpreting the findings of the studies
(Richardson & Sawyer, 2001). Globalisation, however, requires a move away from
a single location study to comparative studies (McDonald, 2000), which also
implies that cross-cultural ethics research is becoming more important (Brand,
2009). However, the synthesis of the literature in tax compliance studies
undertaken by Richardson and Sawyer (2001) found that cross-cultural tax research
is still in its infancy and should be promoted to reduce the tax knowledge gap. The
discussion in section 1.1.3 also gives some indication of the importance of culture
in tax studies.
While the use of Hofstede’s (1980) National Cultural Dimensions to
measure culture has been widely used in other areas of business, such as marketing
(De Mooij, 2004), the use of Hofstede’s (1980) National Cultural Dimensions in
the tax context is still limited (Tsakumis et al., 2007). This study attempts to reduce
this gap by operationalizing Hofstede’s (1980) National Cultural Dimensions to
measure culture in complying with the tax laws. This is also a response to Yong
(2011), to use Hofstede’s (1980) cultural typology in the tax context
internationally.

27
1.5 Objective of the study and the research questions
Basically, the main purpose of this research is to understand the tax
compliance behaviour of tax agents in Malaysia and New Zealand by examining
some selected factors that contribute to their ethical decision making while
performing their professional roles. This is performed mainly by extending the
Theory of Planned Behaviour (TPB) of Ajzen (1991) with another two factors,
culture and ethical sensitivity. Within the framework of the TPB itself, specifically,
the study aims to understand the influence of attitudes, subjective norms and
perceived behavioural control in the decision making of tax agents in Malaysia and
New Zealand.
Since this study is comparative in nature, it is essential to compare the
perceptions of tax agents in Malaysia and New Zealand with regard to the TPB
elements, ethical sensitivity and culture. This comparison is essential given that tax
agents in Malaysia and New Zealand are different in the way the accounting
profession is being regulated in both countries and the possibility of different
cultures between Malaysia and New Zealand as discussed in sections 1.1.2 and 1.3.
In addition, this study also examines whether or not the tax agents in Malaysia and
New Zealand in this study perceive culture and ethical sensitivity as
multidimensional constructs in complying with the tax laws. The objectives of the
study lead to the following specific research questions:
(1) Do tax agents in Malaysia and New Zealand indicate the same level of
perceptions with regard to Hofstede’s (1980) National Cultural Dimensions in
complying with the tax laws?

28
(2) Do tax agents in Malaysia and New Zealand have the same level of
perceptions in relation to the TPB elements in complying with the tax law
while performing their roles?
(3) Do tax agents in Malaysia and New Zealand have the same level of
perceptions in relation to the dimensions in the Multidimensional Ethics
Scales?
(4) Does the attitude towards tax compliance significantly influence the tax agents
in Malaysia and New Zealand in complying with the tax laws while
performing their professional roles?
(5) Do subjective norms significantly influence the tax agents in Malaysia and
New Zealand in complying with the tax laws while performing their
professional roles?
(6) Does perceived behavioural control significantly influence the tax agents in
Malaysia and New Zealand in complying with the tax laws while performing
their professional roles?
(7) Do tax agents in Malaysia and New Zealand perceive ethical sensitivity as a
multidimensional concept?
(8) Does ethical sensitivity significantly influence tax agent in Malaysia and New
Zealand in complying with the tax laws while performing their professional
roles?
(9) Do tax agents in Malaysia and New Zealand perceive culture as a
multidimensional concept?

29
(10) Does culture significantly influence tax agents in Malaysia and New Zealand
in complying with the tax laws while performing their professional roles?
1.6 Research methods
Traditionally, researchers employ either the qualitative or quantitative
approaches in conducting a research. Richardson and Sawyer (2001) for instance,
found that survey and experimental designs are the common methods used by tax
researchers. However, over the years, mixed method research has gained
considerable attention in social science research (Bryman & Bell, 2011). Johnson
and Onwuegbuzie (2004, p. 15) for instance, suggest that mixed method research
has become the “third research paradigm”. Most likely this is because mixed
method research is appropriate for various research disciplines in the social
sciences (Creswell & Plano Clark, 2011). In taxation studies, the use of mixed
method has also been supported. For instance, McKerchar (2010) suggests that in
mixed methods studies, the findings from using an approach can be used to inform,
validate or compensate the weaknesses of using the other approach.
Based on the foregoing advantages of using a mixed method approach in
tax studies, and using pragmatism as the research lens, this study employs a mixed
method strategy to meet the objectives of the study. The fundamental idea of mixed
method research is to combine both quantitative and qualitative approaches in a
single study. This study incorporates a quantitative method (survey) and qualitative
method (telephone interview) to obtain responses from tax agents in Malaysia and
New Zealand. Apart from performing the preliminary and descriptive analyses
using Statistical Package for the Social Sciences (SPSS) software version 18,
Partial Least Squares (PLS), a composite based structural equation modelling

30
(SEM) approach, is used to test the hypotheses based on research questions set out
in Chapter 3.
Essentially, SEM is a multivariate technique which combines factor
analysis and multiple regressions in a single analysis which allows for a set of
interrelated dependent and independent variables with their measures to be
examined simultaneously (Hair et al., 2010). There are two commonly used SEM-
based approaches in social science studies, the covariance-based SEM (CBSEM)
and PLS (Gefen et al., 2000). The latter is used since this study is prediction
oriented and PLS is based on soft data distribution assumption which does not
require parametric assumption. Therefore, the assumption of normality of data
could be relaxed and PLS has the ability to work well even with small sample size.
In addition, CBSEM only works with measures which are developed reflectively.
Since measures in this study were developed in formative (second order) and
reflective mode (first order), PLS is the appropriate choice for testing the
hypotheses. The researcher performed the PLS using SmartPLS program developed
by Ringle et al. (2005). As for the interview data, it was analysed thematically
using the approach recommended by Lincoln and Guba (1985) and Braun and
Clarke (2006). Further discussion of the research methods employed in this study is
presented in Chapter 4 of this thesis.
1.7 Significance of research
The findings from this study contribute to the existing literature in tax
compliance in a number of ways. As a result of globalisation, cross-cultural
research has become more important (Ayres & Ghosh, 1999). Broadening the
database of taxation empirical work outside the US, in this case within the Asia

31
Pacific region, could improve the understanding of tax compliance (and non-
compliance) issues and assist with identifying the differences in tax compliance
behaviour so that appropriate strategies can be implemented to improve compliance
(Andreoni et al., 1998). In addition, the findings from this study could provide
some further understanding as to whether the decision making of tax agents in
Malaysia and New Zealand is explained to an extent by the differences in their
cultural background. In this study, the influence of culture is measured using
Hofstede’s (1980) National Cultural Dimensions, which is limited in its application
in a tax context (Tsakumis et al., 2007).
The importance of ethics in tax compliance studies has been supported in
previous research; however, the approach for measuring ethics is still an area of
concern (Jackson & Milliron, 1986; Richardson & Sawyer, 2001). A tool that could
be used to measure ethics in business research is the Multidimensional Ethics Scale
(MES) developed by Reidenbach and Robin (1988; 1990) which was initially used
to measure ethics in marketing. Cohen et al. (1993) later replicated and extended
MES in an accounting context in the US. More recent studies, such as Cruz et al.
(2000) and Buchan (2005), who tested the MES in tax and accounting contexts
respectively, were also conducted in the US. This study contributes to the body of
knowledge by testing the MES to measure ethical sensitivity on tax agents in
Malaysia and New Zealand using specific tax scenarios. These scenarios involved
the over claiming of expenses and under declaring of income which according to
Elliffe (2011), are two situations representing the core aspect of the tax gap in a tax
system. To the researcher’s knowledge the use of MES in the tax context has not
been tested on tax agents in Malaysia and New Zealand. To examine the tax

32
compliance behaviour of tax agents in Malaysia, Singh (2003) for instance used
three tax scenarios with attitudinal statements indicating whether or not the tax
agents agreed with the tax treatment in the scenarios and measured using a 7-point
Likert scale ranging from “very high likelihood” to “very low likelihood”. Singh
(2003) also used the Defining Issues Test (DIT) by Rest (1986) to examine the tax
compliance behaviour of tax agents in Malaysia. Attwell and Sawyer (2001) for
instance, used a similar questionnaire to Tooley (1992) in examining the ethical
attitudes of tax agents in New Zealand. The respondents in their study were asked
to indicate their agreement or disagreement with the statements provided using a 5-
point scale with a higher score indicating a more favourable opinion. In addition to
that, Cohen et al. (1993) commented that considering MES was developed in the
cultural context of the US, it may not be suitable for Asian culture and thus
suggested for more testing on MES in the international studies setting. The findings
from this study could contribute to understanding whether or not MES could be
applied universally in the tax context.
Oats (2012) argues that taxation studies have been dominated by the
positivist paradigm, which leads to the use of quantitative approaches per se and
thus suggests future research in tax to consider other alternatives. In a similar vein,
McKerchar (2010) supports the use of mixed-method research in tax studies. The
use of mixed-method involving tax agents in tax studies, however, has not been
widely documented. An example of a published mixed-method study is provided
by Hasseldine et al. (2012), which involved tax agents as their sample which
combined the survey and interview methods to understand the role of tax
knowledge. The pragmatism paradigm applied in this study enables the researcher

33
to apply a mixed-method approach, combining a survey and interview, to provide a
better understanding of the factors that contribute to the ethical decision making of
tax agents in Malaysia and New Zealand while performing their professional roles.
The interview findings are predicted to explain further the responses in the survey.
Furthermore, the use of SEM, which is a second generation data analysis
technique (Hair et al., 2010) particularly the PLS in this study, provides an
alternative to analyse tax compliance data and predict tax compliance behaviour
using small sample sizes with non-parametric assumption in a complex model.
While “SEM has become de rigueur in validating instruments and testing linkages
between constructs” (Gefen et al., 2000, p. 6) and has been supported in social
science research such as in the areas of marketing and information systems (Urbach
& Ahlemann, 2010; Hair et al., 2012; Ringle et al., 2012), the use of SEM
particularly PLS, is still not widely explored in taxation studies. To the researcher’s
knowledge, there are not many published tax studies which have applied SEM in
their data analyses, except for a few such as Cox and Eger (2006), and Saad (2010).
Compared to the first generation of statistical analysis such as regression which is
only capable of testing one layer relationship between independent and dependent
variables, the use of SEM is predicted to provide better understanding since it
allows a set of interrelated questions to be tested in a single, systematic and
comprehensive analysis (Gefen et al., 2000). Therefore, it is worthwhile to explore
the use of SEM in tax context.
The accounting scandals throughout the world have harmed the reputation
of the accounting profession and increased the sensitivity of the public to the
wrongdoings of accountants in business (Emerson et al., 2007; Doyle et al., 2009;

34
Uysal, 2009). While much attention has been directed to the ethical standards of the
auditors, tax agents have received attention as well since taxation services are a
component of accounting services provided by public accounting firms. Therefore,
as suggested by Singh (2003), the empirical evidence from tax research could be
used as a platform to either confirm or refute the argument of deteriorating
professionalism in the accounting industry.
Since ethics of the accounting profession “… is a profession-wide issue
with far-reaching consequences” (Smith & Hume, 2005, p. 213), the findings could
also benefit the accounting profession by indirectly providing some insights into
the factors that motivate tax agents in Malaysia and New Zealand to act ethically
while performing their roles. Once the factors that motivate tax agents are known,
appropriate resources and mechanism could be channelled to assist tax agents in
their ethical conduct. This could be helpful, for instance, in creating more
awareness through training syllabus of tax agents by incorporating some elements
of factors that motivate tax agents to ethical decision making.
1.8 Thesis organisation
This thesis is organised in chapters as follows. Chapter One presented the
background information for the study, highlighted the importance of tax agents in a
tax system and justifies Malaysia and New Zealand as settings for the study. To
provide a better understanding of the study, this chapter also explained briefly the
taxation systems in Malaysia and New Zealand, as well as the accounting
profession in both countries. In addition, the chapter also presented the research
gap, objectives of the study, research questions, summary of the research methods,

35
the significance of the research, organization of the thesis and concluded with a
summary.
Chapter Two reviews the past literature and concepts relevant to the study.
In this chapter the discussions are focused on the approaches (economic and
behavioural) in tax compliance studies, relevant theories and key variables used in
the study. Following the literature review, Chapter Three develops the research
framework and hypotheses. The detailed research questions are presented together
with the hypotheses to ensure better understanding of the research content.
Chapter Four describes the research methodology used in the study. The
chapter explains the research paradigm, the methodology used (including the
mixed-method approach), the research design, sampling, data collection
techniques, instrument development and preliminary analysis used. This chapter
also describes the structural equation modelling (SEM) approach performed in the
study.
Chapter Five presents the preliminary quantitative data analysis for the
study for Malaysia and New Zealand. The chapter discusses the findings from the
preliminary analyses and descriptive analyses of the survey. Chapter Six offers the
findings from the PLS analysis for both Malaysia and New Zealand. The findings
from the qualitative approach (the interview) are explained in Chapter Seven.
The final chapter, Chapter Eight concludes the study with a discussion of
factors that contribute to the ethical decision making of tax agents in Malaysia and
New Zealand and outline the limitations of the study. It also offers some
recommendations for future research.

36
The University of Canterbury, Christchurch, New Zealand provides some
options on the type of referencing to be used in thesis writing, as long as it is
consistent. This thesis used APA style of referencing which is acceptable and has
been used in previous taxation theses in this university.
1.9 Summary
This chapter provides an overview of the thesis by introducing some
background information and highlighting the main ideas discussed in the thesis.
The discussion commenced with some background information about tax
compliance studies, including the importance of tax agents in a tax system, the
justification for choosing Malaysia and New Zealand as the settings for the study
and a brief description on some selected variables used in the study. The taxation
systems in Malaysia and New Zealand are briefly considered along with the
accounting profession in both countries. In addition, the research gap, the
objectives of the research, research questions, summary of the methods being used,
and the significance of the research, are also provided. As the introductory guide
for the thesis, this chapter also provides some brief explanation to the content of the
remaining chapters.

37
CHAPTER 2
LITERATURE REVIEW AND RELEVANT CONCEPTS
2.0 Introduction
This chapter presents the theories and prior literature which are relevant to
this study. The discussion begins with a brief overview of the economic and non-
economic approaches taken in tax compliance studies, followed by a discussion on
two theories for predicting human behaviour, namely the Theory of Reasoned
Action (TRA), and the Theory of Planned Behaviour (TPB). Next, Rest’s (1986)
Moral Decision Making Model, the Multidimensional Ethics Scale (MES) used to
measure ethical sensitivity in this study, culture as measured by Hofstede’s (1980)
National Cultural Dimensions, are presented. The discussion of past studies on
attitudes, subjective norms, perceived behavioural control, ethics and culture also
form part of this chapter. The chapter ends with a brief summary.
2.1 An overview of economic and non-economic approaches in tax compliance
studies
The study of tax can be approached from multidisciplinary areas
(McKerchar, 2010) such as law, economy, accounting, psychology and public
finance. Essentially, previous tax compliance studies explain the issues of tax
compliance (or non-compliance) by using either economic-based theories or
psychology-based theories (Alm et al., 1995; Andreoni et al., 1988; Alley & James,
2006). The differences in both approaches are related to the concept of the tax gap
in the economic approach and voluntary compliance in the psychology-based
approach or also known as the behavioural approach (Alley & James, 2006). As a

38
result of the different approaches, researchers in tax compliance studies explain tax
compliance as either a problem of economic rationality or behavioural cooperation.
The characteristics between the two approaches are illustrated in the following
Table 2.1.
Table 2.1 Economic verses Psychology Approaches in Tax Compliance Studies
Tax compliance Economic approach Psychology approach
Concept Tax gap (100%
compliance less actual
revenue)
Voluntary, willingness to
act in accordance with the
spirit as well as the letter
of the law
Definition Narrower Wider
Tax compliance Economic rationality Behavioural co-operation
Exemplified by Trade off:
1. Expected benefits of
evading
2. Risk of detection and
application of penalties
3. Maximise personal
wealth
Individuals are not
simply dependent, selfish
utility maximisers. They
interact according to
differing attitudes,
beliefs, norms and roles.
Success depends on co-
operation
Issues of Efficiency in resource
allocation
Equity, fairness and
incidence
Taxpayer seen as Selfish calculator of
pecuniary gains and
losses
Good citizen
Can be termed Economic approach Behavioural approach
Source: James and Alley (2002, p. 33).
In studies utilising the economic-based theories, taxpayers are assumed to
be rational in their decision making and therefore choose the options which
maximize their expected after-tax return. The economic-based theories in tax

39
compliance studies promote economic benefits or costs as motivations to increase
compliance. Thus, economic (tax) parameters, such as probability of being audited,
penalties and tax rate(s), are commonly used in this economic approach to measure
the level of compliance.
Becker (1968) was the first to introduce the concept of crime and
punishment from an economic approach (Kirchler, 2007). In his model, Becker
(1968) argues that individuals make rational decision before committing a crime by
choosing among the different types of risky or safe options. This concept of
understanding crime and punishment from an economic approach was then applied
into taxation in a formal model by Allingham and Sandmo (1972). Since then, the
seminal work of Allingham and Sandmo (1972) has become a benchmark in
economic-based tax compliance studies (Andreoni et al., 1998). Their economic
deterrence model was the first formal tax evasion model to explain tax compliance
behaviour using Expected Utility Theory. Expected Utility Theory assumes that
individuals are rational in their decision making despite the uncertainties and risks.
In line with Expected Utility Theory, the Allingham-Sandmo Model assumes that
taxpayers are rational, risk averse or risk neutral, and maximise utility in their
decision making.
The Allingham-Sandmo Model specifically examines the income of
individuals in two situations, the first being income after paying for taxes and
penalties in cases when evasion is discovered and punished, while the second
situation examines income when evasion is not discovered. The Allingham-
Sandmo Model suggests that taxpayers would only report their income after

40
considering the tax rates, the probability of being detected and the level of
punishment.
Despite being replicated and extended in many studies, the economic
deterrence model is criticised essentially because of its narrow scope such as by
assuming the probability of audit is constant and a high penalty rate, both being
inconsistent with reality (Andreoni et al., 1998). To a certain extent punishment
and enforcement could encourage compliance, yet they cannot explain all
compliance behaviour (Alm, 1991), since other subjective factors may also
contribute to decision making in complying with the tax law (Alm et al., 1995).
Notwithstanding that economic-based theory studies can explain tax compliance to
a certain extent, the weaknesses in economic-based theories, in their attempt to
fully explain tax compliance, offer opportunities to explore the issue of tax
compliance from a non-economic perspective. The synthesis of the literature by
Jackson and Milliron (1986), for instance, indicates that compliance with tax law is
determined by numerous factors and is not limited to economic factors.
While the economic-based theories offer economic benefits or costs to
increase tax compliance, psychological theories, on the other hand are more
focused on using psychological factors to motivate tax compliance. Thus, factors
such as attitude, moral judgment, social norms, fairness and ethical concerns, are
used to explain compliance with the tax laws (Tan & Sawyer, 2003; Alley &
James, 2006). The psychological school of thought, for instance, argues that
taxpayers comply with their tax obligations regardless of the level of penalties, the
probability of being audited or any other economic-based enforcement. Findings
from recent studies, such as Trivedi et al. (2005) and Bobek et al. (2007b), support

41
the argument that psychological factors are better in explaining tax compliance
compared to economic factors. However, there is also a possibility that some
taxpayers may operate with a mixture of both economic and psychological factors
in fulfilling their tax obligations. Recent studies, such as Blanthorne and Kaplan
(2008), provide an example in which both economic and psychological factors
influence the decision of taxpayers in complying with the tax law. This is because,
to a certain extent, taxpayers are influenced by the economic benefits or costs in
their decision making (Alley & James, 2006).
The different theoretical approaches in explaining tax compliance
contribute to identifying the different type of factors in tax compliance research.
Based on a synthesis of prior studies in tax compliance, Jackson and Milliron
(1986) suggest fourteen main variables in tax compliance studies. The factors
identified are age, gender, education, income level, source of income, occupation,
peer influence, ethics, fairness, complexity, contact with revenue authority,
sanctions, probability of detection and tax rates. In addition, in their synthesis,
Jackson and Milliron (1986) also group cost of compliance, tax agents, framing
decision and positive inducements, as other variables. In an update of Jackson and
Milliron’s (1986) study, Richardson and Sawyer (2001) suggest similar
categorizations in identifying the key factors discussed in tax compliance studies
from the period 1986 to 1997.
The extended model of tax compliance by Fischer et al. (1992), known as
the Fischer Model, which is based on Jackson and Milliron’s (1986) study, broadly
classified those fourteen factors into four groups. These four groups are:

42
(1) Demographic (for example, age and gender),
(2) Proxy for non-compliance opportunity (such as education, income level,
income source and occupation),
(3) Attitudes and perceptions (for instance ethics, perceived fairness of the tax
system and peer influence), and
(4) Structural (such as complexity of the tax system, contact with the tax authority,
sanctions, probability of detection and tax rates).
Singh (2003) suggests three categories of factors in voluntary tax
compliance namely:
(1) Willingness to comply,
(2) Ability to comply, and
(3) Opportunity to evade tax.
Willingness to comply comprises tax ethics, peer influence, perceived
fairness, individual psyche and the real cost of compliance. Ability to comply
incorporates the levels and type of education, experience, complexity of tax laws
and quality of assistance. Severity of penalties, probability of detection, sources of
income, and tax status, are all considered as opportunity to evade tax. Despite tax
agents being considered as one of the important factors in tax compliance (Jackson
& Milliron, 1986; Richardson and Sawyer, 2001), studies on tax agents are still
considered to be relatively scant compared to other factors in tax compliance
studies (Tan, 2006).

43
With regard to factors that contribute to the ethical decision making of tax
agents in complying with tax laws, Roberts (1998) reviewed 52 published tax
studies, across 50 separate factors which were later classified into 5 groups. The
five groups of factors which form the “Economic Psychology-Processing (EPP)
Model” (Roberts, 1998, p. 82) are:
(1) Individual psychological factors,
(2) Environmental factors, in terms of risks and rewards,
(3) Input task factors,
(4) Processing factors, and
(5) Output task factors.
The findings from the review by Roberts (1998), for instance, suggest that
the ethical attitude of tax agents is an affective psychological factor which
influences their ethical decision making. In brief, Roberts (1998) proposes that both
individual and economic factors influence the ethical judgment of tax agents. Table
2.2 presents the summary of Robert’s (1998) review.

44
Table 2.2 Factors tested for association with tax accountants’ judgment or
decision making
1. Individual Psychological Factors
Cognitive
Years of experience
Task experience
Knowledge
Knowledge of transactions
Formal education
Job title/position in the firm
Age
Problem-solving ability
Affective
Advocacy
Tax accountant’s risk preference
Ethical attitude
Attitudes related to professional status
Attitudes related to firm size
Attitudes associated with gender
2. Environmental Factors: Risks and Rewards
IRS Position
Audit probability
Audit success prediction
Penalties
IRS position on the issue
Probability of issue being
examined on audit
Applicable regulatory standard for
reporting
Tax rate structure
Firms Expectation
Economic benefit to firm
Client Characteristics
Dollar amount of savings at stake
Client payment status
Client risk preference
Client importance
Client tenure
Client preference for tax-reporting position
Client sophistication
Amount of income/operating performance
Client dependability
Client records
Conformity of item with client’s financial
reporting
3. Task Factors: Inputs
Ambiguity
Structural similarity of
authoritative sources
Outcome of authoritative sources
Amount of legal authority
Complexity of law
Staff recommendation
4. Processing Factors
Information order
Structured problem-solving
approach
Decision aid availability
Framing of issue as gain/loss
Certainty of outcome
Confirmation bias
Hindsight bias
Accountability
Time pressure
Group discussion
5. Task Factors: Output
Planning v compliance context
Source: Adapted from Roberts (1998, p. 82).
Past studies which adopted the economic deterrence approach suggest that
tax compliance is driven by the trade-off between costs and benefits of non-
compliance. On the other hand, the psychology model attempts to understand tax

45
compliance as a behavioural problem. Since this study is interested in
understanding the behavioural aspect of tax agents in their decision making, the
behavioural approach is considered more appropriate. Thus a number of
behavioural factors will be examined to understand the ethical decision making of
tax agents. For that purpose, this study extends the TPB by incorporating ethical
sensitivity and the influence of culture.
Ajzen (1991) proposes that an individual’s behaviour can be explained by
his/her intention and perceived behavioural control. Ajzen (1991) further postulates
that the intention of an individual to perform a behaviour in return is determined by
an individual’s attitude, subjective norms and also perceived behavioural control
that an individual has. Collins (2000) found that ethical sensitivity influences the
ethical judgment of accountants and in a similar vein, Tan (2006) proposes that
future studies in tax agents should explore more the influence of ethical sensitivity
in the ethical decision making of tax agents. Another important aspect in the ethical
decision making is the influence of culture. For instance, in reviewing the Fischer
Model, Chau and Leung (2009) suggest including culture to explain tax compliance
behaviour. To provide some understanding of tax agents’ ethical decision making
while performing their roles, the remaining discussion in this chapter focuses on
the theories and selected factors that are relevant for the study.
2.2 Theories of human social behaviour
The Theory of Reasoned Action (TRA) and the TPB are commonly used to
predict human behaviour (Sheppard et al., 1988; Armitage & Conner, 2001).
According to Nosek et al. (2010), Ajzen’s (1991) work has the greatest influence
among the US and Canadian social psychologists. This implies the significant

46
contribution that both the TRA and the TPB have made in understanding human
behaviour. These two psychology theories are discussed in the following sub-
section.
2.2.1 Theory of Reasoned Action
The Theory of Reasoned Action (TRA) is a social psychology theory which
attempts to explain human behaviour postulated by Ajzen and Fishbein (1980).
Based on the cognitive self-regulation theory, the central idea in this theory
assumes that the behaviour of an individual is determined by the intention to
perform the behaviour. The intention is considered as the subjective probability
that motivates and captures the determination that one has to perform the behaviour
(Ajzen, 1991). Therefore, the stronger the intention towards the behaviour, the
more likely the behaviour will be performed. Ajzen and Fishbein (1980) also
postulate that the intention to perform behaviour is in return influenced by
underlying beliefs, which are the attitude towards the behaviour and subjective
norms.
The attitude towards the behaviour refers to whether an individual perceives
the consequences of a particular behaviour as favourable or unfavourable. The
behavioural beliefs which are formed as a result of the positive and negative
consequences an individual might experience influence the attitude of a person.
The behavioural beliefs are salient beliefs which are obtained through experience
and learning. Thus, an attitude towards a behaviour is considered to be favourable
if the person perceives a positive outcome from performing the behaviour. On the
other hand, the attitude towards behaviour is deemed to be unfavourable if the
person perceives a negative outcome.
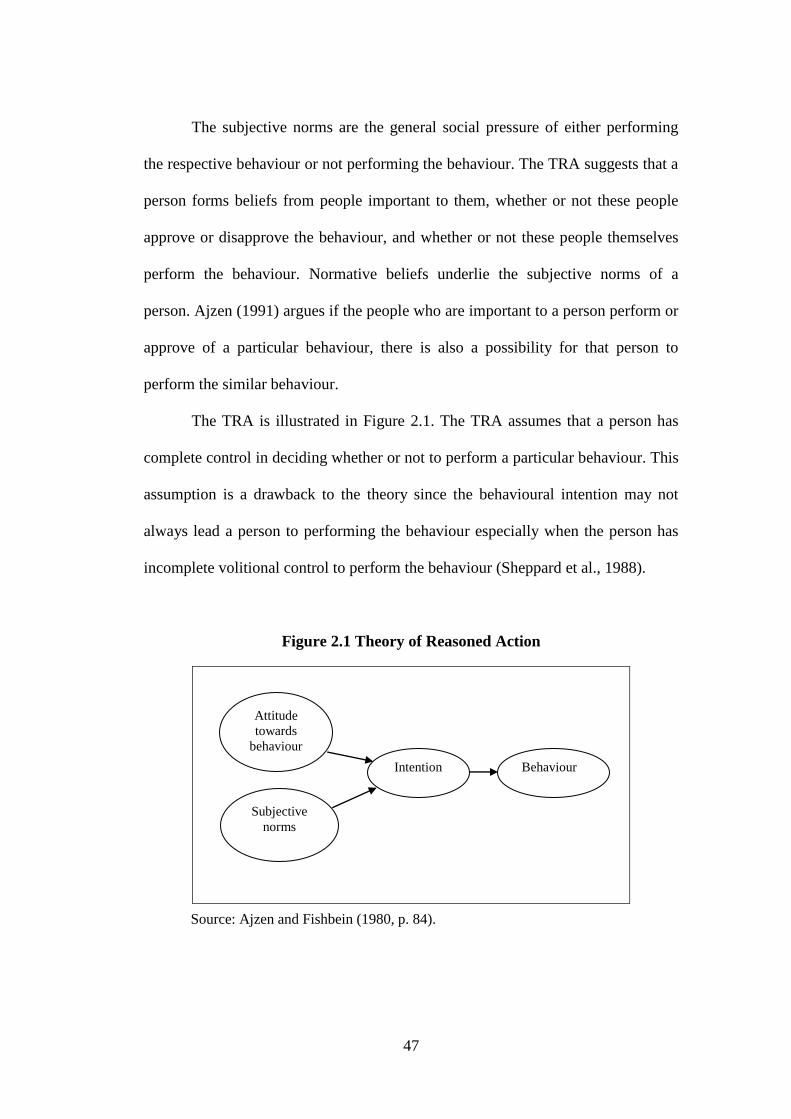
47
The subjective norms are the general social pressure of either performing
the respective behaviour or not performing the behaviour. The TRA suggests that a
person forms beliefs from people important to them, whether or not these people
approve or disapprove the behaviour, and whether or not these people themselves
perform the behaviour. Normative beliefs underlie the subjective norms of a
person. Ajzen (1991) argues if the people who are important to a person perform or
approve of a particular behaviour, there is also a possibility for that person to
perform the similar behaviour.
The TRA is illustrated in Figure 2.1. The TRA assumes that a person has
complete control in deciding whether or not to perform a particular behaviour. This
assumption is a drawback to the theory since the behavioural intention may not
always lead a person to performing the behaviour especially when the person has
incomplete volitional control to perform the behaviour (Sheppard et al., 1988).
Figure 2.1 Theory of Reasoned Action
Source: Ajzen and Fishbein (1980, p. 84).
Attitude
towards
behaviour
Subjective
norms
Intention Behaviour

48
2.2.2 Theory of Planned Behaviour
To overcome the limitation of the TRA, Ajzen (1991) introduced another
construct to the TRA, perceived behavioural control, to comprehensively predict
human behaviour. The extended theory is known as the Theory of Planned
Behaviour (TPB). In the original TRA, the behaviour of a person is influenced only
by the intention to perform the behaviour. In the TPB, it is assumed that the
behaviour of a person is determined not only by the intention, but also the ability of
that person to have control in performing the behaviour.
Ajzen (1991) argues that a particular behaviour may not likely to occur if
that person does not have control over performing the behaviour, even in the
existence of positive attitude and positive influence from important others towards
the behaviour. Since measures for actual behaviour are not available, perceived
behavioural control becomes a proxy for actual behaviour (Fishbein & Ajzen,
2010), and the prediction of actual behaviour can be improved if perceived
behavioural control precisely reflects actual control. The perceived behavioural
control also influences the intention to perform the behaviour. It also explains the
reason intention does not always predict behaviour, since there are potential
constraints that may prevent a person from performing behaviour (Armitage &
Conner, 2001). The perceived behavioural control considers personal and
environmental factors, such as the availability of information, skills and
opportunities for a person to engage in a particular behaviour (Fishbein & Ajzen,
2010).
In summary, the TPB suggests that the intention to perform behaviour, and
the perceived control that a person has to perform the behaviour, lead to conducting

49
the behaviour. The intention or readiness to perform a behaviour depends on the
attitude that a person has towards performing the behaviour, the acceptance of
people important to that person towards the behaviour, and the perceived control
that a person has to perform the behaviour which vary from one behaviour to
behaviour. The TPB is presented in Figure 2.2.
Figure 2.2 Theory of Planned Behaviour
Source: Ajzen (1991, p. 182).
To test the reliability and validity of his theory, Ajzen (1991) performs a
meta-analysis of 16 studies in various areas such as drinking problems, weight loss,
voting elections, cheating in an examination, all of which support his theory.
Madden et al. (1992) compared the TRA and the TPB on ten different behaviours.
Their study found that the TRA is more relevant when the behaviour being
examined is under volitional control. In contrast, the TPB is more applicable and
superior in explaining behaviour if the assumption of volitional control is violated.
Attitude
towards
behaviour
Subjective
norms
Intention
Behaviour
Perceived
behavioural
control

50
The result of Ajzen’s (1991) meta-analysis is further supported by Armitage
and Conner (2001). In their meta-analysis study, Armitage and Conner (2001)
examined the competency of the TPB in understanding intentions and behaviour in
people from a database of 185 independent studies published up to the end of 1997.
The authors suggest that the TPB could explain around 27 percent and 39 percent
variance in behaviour and intention, respectively. Indeed, perceived behavioural
control contributes an average of 6 percent more to the prediction on intention
compared to attitude and subjective norms. In contrast, subjective norms are found
to be the weakest predictor of intention. It is argued that the measurement of
subjective norms contributes to an unconvincing result since the majority of the
TPB studies used single-item measurement for subjective norms. The meta-
analysis by Armitage and Conner (2001) also reveals that one of the strengths of
the TPB is its broad ability to predict behaviour across various fields of studies.
The findings from a more recent meta-analysis study by McEachan et al.
(2011) from 206 articles across a range of health behaviour-based studies also
support the use of TPB to explain behaviour towards for instance dieting, physical
activity, abstinence from drugs and safer sex. Despite the intention-behaviour
correlation indicating a weaker relationship compared to the findings from
Armitage and Conner (2001), the correlations between attitude-intention,
subjective norms-intention and perceived behavioural control-intention are
reportedly stronger, ranging from 0.4 to 0.57, compared to the previous meta-
analysis of Armitage and Conner (2001). The weaker correlation for intention-
behaviour relationship is possibly due to the fact that in McEachan et al. (2011),
the meta-analytic studies, examine behaviour only sometime after participants

51
completed the TPB survey. The time gap within the period of completing the TPB
survey and observing the actual behaviour may have influenced the participants’
intention-behaviour relationship (McEachan et al., 2011). Interestingly, attitude
towards behaviour remain the strongest predictor of intention.
Despite the support shown for using the TPB in understanding human
behaviour, it has also been criticized for several reasons. For instance, even though
the theory records a link between intention and behaviour, the link is nevertheless
weak or moderate and too ‘rational’, ignoring the bias that human has in making
judgments (O’Fallon & Butterfield, 2005; Shawver & Sennetti, 2009). Similar to
other behavioural-decision making models, the TPB depends on self-reports and
thus the data can have biases which reduce the reliability and validity of the theory.
In addition, although Ajzen (1991) claims self-efficacy and perceived behavioural
control are identical, many studies indicate that self-efficacy and perceived
behavioural control are not alike (e.g. Armitage & Conner, 2001).
In his reply to the criticisms against the TPB, Ajzen (2011) clarifies that the
theory never assumes rationality in predicting reality. He argues that the
misunderstanding occurs among researchers because the TPB is concerned with
goal-directed behaviour guided by self-regulatory processes which is
misinterpreted as acting in rationality. According to Ajzen (2011) the low
correlation between the intention and actual behaviour could differ considerably
because other mediating factors could exist between the period the intention is
assessed and the time the actual behaviour is examined. These mediating factors
may reduce the effect of the predictive validity of intention which is taken before
the actual behaviour is examined. With regard to the use of self-report, the

52
findings of Armitage and Conner (2001) suggest that TPB could better explain the
variance in behaviour when self-reports are used compared to when behaviour is
observed. While self-efficacy was found to be more capable in explaining
behaviour compared to perceived control in the meta-analysis by Armitage and
Conner (2001), they caution that the results are not conclusive since there is a
possibility that the different effect of self-efficacy and perceived control of
behaviour may vary depending on the type of behaviour.
Ajzen (2011) argues that the central idea of the TPB is to predict intention
for behaviour which is goal-directed and driven by conscious self-regulatory
processes. The act of complying with the tax laws could be considered to be a
behaviour which is goal-directed (the aim is to comply with the tax laws),
specifically “behaviour which is said to be reasoned or planned” (Ajzen, 2011, p.
1116). Due to the nature of their roles in the tax system as advocates for their
clients and as an intermediary, there is a possibility that tax agents put themselves
in a conflicting position. A study by Marshall et al. (1998) for instance, suggests
that continuing to act for clients in an unethical situation is among the most
common ethical dilemma faced by tax agents under SAS in Western Australia.
While tax agents may want to comply with the tax law, there are other factors that
may influence them on not being objective in their decision making. As an
example, the mixed findings in the debate on who is instigating aggressive tax
reporting, whether the clients or the tax agents (Tan & Sawyer, 2003), imply the
possibility that the client may influence tax agents in tax reporting.
Based on the foregoing discussion, the application of the TPB in this
research which considers the existence of incomplete volitional control to predict

53
intention is considered more appropriate compared to the TRA which assumes
volitional control in predicting intention to perform the behaviour. Since tax
compliance and behaviour is influenced by various factors (Jackson & Milliron,
1986; Richardson & Sawyer, 2001) the flexibility of the TPB, which allows for the
addition of other predictors to improve or explain the variance in intention and
behaviour (Ajzen, 1991) in this regard, provides another reason for choosing the
TPB for this research. Furthermore, while the TPB has been used extensively in
other areas of studies such as the meta-analysis studies of Ajzen (1991), Armitage
and Conner (2001) and McEachan et al. (2011), and is arguably the most dominant
model to capture the relationship between attitude and behaviour (Armitage &
Christian, 2003), the use of the TPB in tax research is limited. This is evidenced
from a number of studies, such Bobek and Hatfield (2003), Trivedi et al. (2005),
Saad (2010; 2011), Langham et al. (2012) and Smart (2012). Despite its limited
application in tax context, the use of the TPB in previous taxation studies supports
the TPB in explaining tax compliance behaviour.
2.3 Rest’s (1986) Ethical Decision Making Model
Tax compliance refers to the willingness of taxpayers to comply with the
tax laws and non-compliance is associated with violating the tax laws whether or
not it is intentional (Kirchler, 2007). This is consistent with Kinsey (1985) who
defined non-compliance with the tax laws as the failure, intentional or
unintentional of taxpayers to meet their tax obligations. James and Alley (2002)
argued that while tax evasion is clearly illegal and a form of non-compliance,
excessive tax avoidance such as searching for every possible legitimate deduction
to reduce tax liability cannot be considered as compliance as well because even if

54
the transaction is within the letter of the law, it is not within the spirit of the law.
This is also supported by Elliffe (2001) who argued that an aggressive tax
avoidance approach can lead to tax evasion. Consequently, tax compliance (and
non-compliance) behaviour is a result of ethical or unethical decision making
process (Singh, 2003).
Previous research in ethical decision making is dominated by two
approaches, namely: normative ethics and descriptive ethics (Alzola, 2011).
Normative ethics are derived from moral philosophy and theology, and focus on
how decisions should ideally be made (Whittier et al., 2006). The normative
ethical approach relies on the concept of ought to be, such as how people should
act in situations that need an ethical consideration. Distributive Justice Theory
(DJT) is an example of a normative ethical theory used to understand tax
compliance behaviour in tax compliance studies. The application of DJT in tax
compliance studies addresses issues associated with fairness and justice, such as
how much taxpayers have to pay or are entitled to receive, and whether they get
what they deserve. Thus, DJT argues that perceptions of justice in the tax system
could motivate taxpayers in complying with the tax law (Frecknall-Hughes &
Moizer, 2005).
In contrast, descriptive ethics or behavioural ethics depend on empirical
evidence in solving ethical issues. The descriptive ethics approach is concerned
with understanding the actual behaviour of people when solving an ethical dilemma
(Crane & Matten, 2007). The practical aspect of this descriptive approach perhaps
explains the reason for descriptive ethics being widely used in ethical decision
making research. A review by O’Fallon and Butterfield (2005), from research

55
published in leading ethics business journals, indicates that descriptive ethics have
become an important area of research based on the number of studies undertaken,
with 110 studies before 1993, and the number increasing to 174 for the period
between 1994 and 2003. An example of a descriptive ethics-based decision making
model that has become the focus of many empirical studies is the Rest’s (1986)
Model (O’Fallon & Butterfield, 2005) which is illustrated in Figure 2.3.
Figure 2.3 Ethical Decision Making Model
Source: Crane and Matten (2007, p. 131).
According to Rest (1986), moral behaviour is determined by four
independent elements which do not occur in sequence. They are moral sensitivity,
moral judgment, moral motivation and moral character or ego strength. Moral
sensitivity refers to the awareness that our action may impact others. By having
moral sensitivity, a person imagines the various possible actions and their effects
on others. Rest (1986) argues that lack of ethical or moral sensitivity in recognizing
ethical issues in the first instance may lead to unethical behaviour. Another
consideration in Rest’s (1986) ethical decision making model is a person’s moral
judgment which evaluates whether an action is morally right or otherwise. In
contrast to the Cognitive Moral Development Theory (CMDT) proposed by
Kohlberg (1969), Rest (1986) postulates that despite the moral judgment is
significant, it is not the only determinant of behaviour. The priority that a person
Moral
Sensitivity
Moral
Judgment Moral
Motivation
Moral
Character

56
chooses in performing behaviour underlies the moral motivation concept in Rest’s
(1986) Model.
According to Rest (1986), a person may act unethically, not because that
person does not have the awareness to recognize a moral issue (moral sensitivity)
or does not have the ability to assess the right action (moral judgment), but because
that person does not put moral values as a priority (moral motivation). For instance,
a person’s self-interest may set aside his or her moral consideration. In addition to
the three elements, Rest (1986) also argues that a person’s moral character or their
personality attributes, such as ego strength, determination and courage, are also
possible to exert influence in ethical decision making. Thus, a person may have a
strong awareness in recognizing moral issue, good moral judgment, put high
priority to moral values but may act unethically if that person has weak moral
character.
In summary, Rest (1986) proposes that success in one component of his
model does not ensure success in the other components. This maybe because, the
four components in Rest’s (1986) Model are conceptually distinct and do not occur
in stages. Indeed, to explain moral behaviour, each element in the model could be
examined separately. For instance, O’Fallon and Butterfield (2005) suggest that
future studies applying Rest’s (1986) Model should examine in more detail the
moral sensitivity component since little research has been conducted to explore the
moral sensitivity component compared to the other three components in Rest’s
(1986) Model. The significance of Rest’s (1986) Model could be implied by it
being the most cited model in accounting ethics-related studies for the period
between 1988 and 2007 (Uysal, 2009). Rest’s (1986) Model is a general ethics

57
model that could easily be used to understand individual decision making in
organizational settings (Jones, 1991). This perhaps explains the considerable
support for Rest’s (1986) Model in the ethics literature.
Notwithstanding considerable support for Rest’s (1986) Model, similar to
other descriptive ethical decision making models which have largely originated in
the United States (US), the model may contain cultural bias (Crane & Matten,
2007). This is due to Rest’s (1986) Model being based on the US culture which
may contain different values from other Western and non-Western cultures. For
instance, according to Crane and Matten (2007), in the US, the interest in ethics
studies is more on the individual actors or behaviour, whereas in the European
countries, the focus is more on the design of the economic institutions and their
functions. The different emphasis of ethics studies between the US and the
European countries results in a strong US bias when examining the influence of
individual factors such as age, gender, level of education in ethical decision making
whereas, a strong European bias exists when discussing situational factors such as
organizational culture, work roles and rewards in ethical decision making.
Crane and Matten (2007) further argue that, since the components in Rest’s
(1986) Model can be examined individually, it could possibly mislead us in our
understanding because to differing degrees, the components in Rest’s (1986) Model
may be related or interdependent. Rest’s (1986) Model is also criticised for
assuming that people behave in the same manner irrespective of the moral issues
involved. Jones (1991), whose proposition, has gained considerable support in
ethics-based studies (eg. O’Fallon & Butterfield, 2005; Waldron, 2009), in contrast,

58
suggests that individual judgment differs according to the moral intensity of the
ethical issues.
Despite the criticisms, Crane and Matten (2007) agree that Rest’s (1986)
Model is appropriate to be used as a tool to understand the complex way of making
ethical decision but not as an ultimate representation of understanding ethical
decision making. Based on the foregoing discussion, and since ethical sensitivity is
important in the ethical decision making of accountants (Collins, 2000), this study
has selected the moral sensing element from Rest’s (1986) Model to understand the
ethical decision making of tax agents in Malaysia and New Zealand while
performing their engagement roles. This approach also seeks to respond to the
concern addressed by Tan (2006) on the scarcity of studies on ethical sensitivity in
understanding tax compliance behaviour of tax agents. The ethical sensitivity in
this study is operationalized using the Multidimensional Ethics Scale (MES) which
is explained in the following sub-section.
2.3.1 Multidimensional Ethics Scale
Notwithstanding ethics is important in explaining tax compliance
behaviour (Jackson & Milliron, 1986; Richardson & Sawyer, 2001; Alm &
Torgler, 2011), the issue of how to measure ethics in tax compliance is still
debatable (Richardson & Sawyer, 2001). In the ethics literature, a review by Kujala
et al. (2011), found that a tool to measure ethics which has been commonly used by
researchers is the Multidimensional Ethics Scale (MES) developed by Reidenbach
and Robin (1988; 1990). Arguably, humans rely on more than one ethical
dimension in making ethical decisions, and because a single measurement scale of
ethics cannot capture the various ethical perspectives in making an evaluation, the

59
single measurement scale has reliability problems (Reidenbach & Robin, 1988;
1990). As an improvement to the single scale measurement of ethics, using a factor
analysis, Reidenbach and Robin (1988) developed a multidimensional ethics scale
in marketing ethics consisting of 33 items which reflect five normative moral
philosophies.
According to Reidenbach and Robin (1990), the five normative moral
philosophies which formed the foundation of MES are not merely moral
philosophies but encompass religious values which cover most of the distinguished
concepts for social survival. They suggest “ideas of fairness, justice, contract, duty,
consequence, greatest good and many others that come from the five philosophies
can also be found in the Bible, the Koran, the writings of Buddha and in other
religions” (Reidenbach & Robin, 1990, p. 640). They argued that, as a result, the
MES offers a pivotal point for ethical decision making.
The first ethical dimension is justice which comes from the Theory of
Justice (Reidenbach and Robin, 1990). The Theory of Justice perceives fairness in
two dimensions: fair procedures and fair outcomes (Crane and Matten, 2007).
Consequently, the concepts of distributive and procedural justice, such as fairness
and equity, are highlighted in this theory.
The second ethical dimension is relativism, which refers to the belief that
there is no universal ethical rule for everyone since ethical rules are relative to a
specific culture. Therefore, according to relativism, what is considered as right or
wrong is only applicable to that particular culture. For instance, the imposition of

60
Western culture on other cultures, such as Asian culture, is considered to violate
the concept of relativism in ethics (Beauchamp et al., 2009).
The third ethical dimension is egoism, an aspect of Teleological Ethics
Theory (TET),6 which measures morality based on the consequences of an action in
the long term. Egoism Theory promotes the well-being of one individual over
everyone else which reflects that individuals should act on the basis of one’s self
interest. Thus an individual should only act for others if it brings benefit to one’s
own interest and does not care of the welfare of others unless it affects the welfare
of oneself (Beauchamp et al., 2009).
The fourth ethical dimension in MES is utilitarian, another concept in TET.
It emphasizes the concept of efficiency in ethical decision making by considering
the greatest possible ratio of good to evil for all in the society. According to
Utilitarian Theory, the consequences of an action determine whether or not an act
is ethical. It also focuses on the maximisation of benefits and minimisation of
harm. Thus, from the utilitarian perspective, it is acceptable to break a law if
breaking the rule brings the greatest benefits over bad consequences to greatest of
people (Beauchamp et al., 2009). The concept of cost and benefit analysis in
accounting, for instance, implies the utilitarian dimension in ethical decision
making (Cohen et al., 1993).
6 The traditional ethical theories could be divided into consequentialist and non-consequentialist.
The consequentialist ethics is also referred as teleological ethics. The term teleological is originated
from the Greek word for ‘goal’. On the other hand, non-consequentialist ethics is based on their
individual’s right and duty. It is based on the deontological concept. The word deontological is a
Greek word for ‘duty’ (Crane & Matten, 2007).

61
The fifth and final moral philosophy in MES is deontology, represented by
the contractualism dimension. The deontology philosophy emphasizes the belief
that individuals have a duty to fulfil the claims of others by applying logic to an
ethical rule through a social contract. It is based on the decision maker underlying
principles of being ethical. An action is deemed as ethical if the decision maker’s
underlying principle perceives the action as morally right (Crane & Matten, 2007).
The individual’s duty is translated in an unwritten contract or unwritten obligations
(Cruz et al., 2000).
Reidenbach and Robin (1990) later reduced the original MES from 33 items
to 8 items, representing three groups of ethical dimensions which are: moral equity,
relativism and contractualism. Similar to the original MES, the moral equity
dimension reflects an individual perception of fairness and justice, expectation of
family and what is morally right or not in ethical decision making. Relativism
concerns the importance of culture and tradition in determining what is right or
wrong in the decision making which results in the importance of culture or social
system overtakes individual considerations. Finally, contractualism represents the
social construct in the form of duties, rules, obligations between businesses and
society in ethical decision making.
The main advantage of MES is its ability to capture the beliefs of a person
in ethical decision making while at the same time it reveals the reasons for
believing that a particular action is ethical or unethical by using different ethical
philosophies. This is important since not all people fit into one category
(Reidenbach & Robin, 1988; 1990). In addition, MES also allows people to use
only one ethical framework to make ethical decisions in all situations (Shawver &

62
Sennetti, 2009; Casali, 2011). As a result, MES is argued to better capture the
complexity in ethical decision making (Cohen, et al., 1993). Moreover, compared
to other ethics measurement scales which focus on the psychological aspects of
individuals, such as the Defining Issues Test (DIT) or Managerial Judgment Test
(MJT), MES is considered more appropriate to measure ethics since it is based on
moral theories (Casali, 2011).
Furthermore, the five ethical theories in MES provide more explanation of
the ethical choices rather than just measuring the cognitive development of an
individual. The different ethics effects could be measured by using MES, since
different but correlated dilemmas could be used in an MES questionnaire, unlike
the DIT which only allows for fixed original dilemmas in its questionnaire
(Shawver & Sennetti, 2009). The use of multiple items in the MES could also
enhance the reliability of the scale instrument (Cohen et al., 1993).
The use of MES in measuring ethics, however, is criticized for a number of
reasons. The validity of MES in ethics studies can be challenged due to the
ambiguous scale items, faulty scale development procedure, lack of ethical
rationales, and mixed findings from replicated studies which indicate the instability
of the scales (Hyman, 1996). Other studies, such as Kujala and Pietilaihen (2007)
and Casali (2011), argue that the MES should not be considered as a
multidimensional since it was developed from a single group of ethical theories,
namely the traditional ethical theories. The MES, for example, does not consider
contemporary ethical theories such as virtue ethics, which is capable of influencing
ethical decision making (Casali, 2011) or female ethics (Kujala & Pietilaihen,
2007; Kujala et al., 2011), which reveal other attributes of an individual such as

63
caring. Indeed, the MES is claimed to be biased since it embraces the masculine
culture by only accentuating masculine attributes, such as justice, fairness,
independence and rationality (Kujala & Pietilaihen, 2007; Kujala et al., 2011).
Consequently, the MES should not be considered to be multidimensional; rather it
only provides a general pattern of ethical decision making (McMahon & Harvey,
2007).
Furthermore, Shawver and Sennetti (2009) question the ability of the MES
to reveal the fundamental justifications of being ethical and unethical since the
scales in the MES do not correspond to any objective, unlike the DIT scores, which
are correlated with the stages in Kohlberg’s (1969) moral development. Therefore,
higher scores in the MES do not imply better moral cognition; instead the scores
only offer an explanation to the respondents’ choices. Notwithstanding that the
MES is designed to measure ethical judgment across a range of scenarios, as
argued by Reidenbach and Robin (1988; 1990), findings from prior studies that
used the MES, (for instance, Cohen et al., 1993; McMahon and Harvey, 2007;
Kujala and Pietilaihen, 2007; and Nguyen and Biderman, 2008), found that the
MES is situation specific. Indeed, to validate the MES, Reidenbach and Robin
(1988; 1990) used a within-scenario approach. Therefore, the MES should not be
considered as multidimensional since it is scenario dependent. This perhaps
explains the mixed support of MES in ethics studies (Nguyen & Biderman, 2008).
As an improvement to the original MES, different forms of the MES scales
have been used in ethics research, such as by Cohen et al. (1993), who refined the
MES to a 15-item scale representing all the five moral philosophies in an
accounting context. Using similar approach to Reidenbach and Robin (1988; 1990),

64
six scenarios, of which two were related to retail scenarios and the remaining four
were accounting-based scenarios, were used to test the refined version of the MES.
The study involved a sample of accounting academics and members of the
international section of the American Accounting Association who came from
various cultural backgrounds across the United States. Principal component factor
analysis was then applied to generate the factors and the Cronbach’s Alpha for each
factor ranging from 0.86 to 0.96 indicating high reliability. The finalised 15-item
scales consist of four items representing moral equity, two items to measure
relativism, and three items each for contractualism dimension, egoism and
utilitarianism.
A recent example of using MES in measuring ethical sensitivity in an
accounting context is provided by Buchan (2005) who extended TPB with ethical
sensitivity and instrumental ethical climate among public accountants in the US.
Two scenarios, which are developing a bid for a new client and charging personal
expenses to the firm, were used to test the relationship between ethical sensitivity
and intention of public accountants from five public accounting firms in the
Northeast US. No support, however, was recorded for the relationship between
ethical sensitivity and intention which is most likely because the scenarios being
used to examine ethical sensitivity were different from the scenarios used to
measure intention in the TPB. Based on the findings, Buchan (2005) also concludes
that MES is situation specific.
With regard to applying MES in tax context, Cruz et al. (2000) have tested
the refined version of MES by Cohen et al. (1993) and incorporated gender as
another dimension in the MES. The study of Cruz et al. (2000) examined the

65
ethical judgment of tax agents when they are pressured for providing aggressive
reporting. The findings suggest that all of the five moral philosophies in the MES
influence the ethical decision making of tax agents. The influence primarily comes
from moral equity and contractualism. Indeed, moral equity has the highest
influence on self-reported intentions in all three cases presented in the study. The
study also found that relativism and utilitarianism had the largest effect on peer
behaviour.
As tax compliance and non-compliance behaviour is associated with ethical
or unethical decision making, therefore, after considering the advantages and the
disadvantages of using the MES, this study will use the MES as proposed by Cruz
et al. (2000) to capture the moral sensitivity in ethical decision making of tax
agents in Malaysia and New Zealand, except for the exclusion of a gender scale.
The gender scale is excluded from the MES since this study uses the TPB which
assumes that the influence of demographic variables is already captured in the
attitudes toward behaviour. Cruz et al.’s, (2000) version of MES, overall, indicates
high reliability ranging from 0.73 to 0.94 for the moral equity, contractualism,
relativism and utilitarianism dimensions in all three cases presented in the study.
The only dimension rejected is egoism which indicates an average of 0.49 level of
reliability in all three cases. Furthermore, as Cruz et al.’s (2000) MES version has
been tested in a tax context, it is deemed appropriate for this study.
2.4 The concept of culture
The classic work of Kroeber and Kluckhohn (1952) synthesizes 164
definitions of culture from various subject areas to understand the meaning of
culture. In their study, the authors divide the definitions of culture into six groups,

66
namely descriptive, historical, normative, psychological, structure of patterns, and
genetics. Based on their review, Kroeber and Kluckhohn (1952) argue that culture
can be characterized by symbols, is shared, learned, a way of behaving, a feeling
and reaction, and this includes the ‘implicit culture’ which differs between
societies. The authors also argued that ‘whole’ culture consists of many
overlapping sub-cultures which could be regional, economic, status, occupation,
cliques or the combinations of all the aforementioned characteristics. Based on this
synthesis, Kroeber and Kluckhohn (1952, p. 181) define culture as:
“Consist[ing] of patterns, explicit or implicit, of and for behaviour
acquired and transmitted by symbols, constituting the distinctive
achievements of human groups, including their embodiments in
artifacts; the essential of culture consists of traditional (historically
derived and selected) ideas and especially their attached values;
cultural systems may on the one hand be considered as products of
action, on the other as conditioning elements of further action.”
Kroeber and Kluckhohn (1952) and Matsumoto (2007) agree that cultural
differences could be observed from either the explicit elements (objective aspect)
or implicit elements (subjective aspect). The explicit elements refer to the symbols
which could represent a particular culture, for instance the physical objects of
culture, such as clothing, food and architecture. Conversely, the implicit elements
are concerned with the psychological aspect of culture, such as the underlying
values which are ‘invisible’. The debate on cultural convergence for instance, is
often centred on the explicit elements of culture (De Mooij, 2004). In terms of
subjective elements, Matsumoto (2007) argues that Hofstede’s (1980) seminal
67
work is the first to identify the cultural variability. This perhaps explains the reason
for Hofstede’ (1980) National Cultural Dimensions being widely used in social
science studies.
Ethical decision making is a social process which is transferred within a
culture from generation to generation (Crane & Matten, 2007; Beauchamp et al.,
2009). Indeed, ethical decision making models, such as Ferrell and Gresham (1985)
and Hunt and Vitell (1986), acknowledge the importance of culture in the ethical
decision making process. De Mooij (2004) suggests that individuals are the
outcome of their culture and social groupings, who share similar beliefs, attitudes,
norms and values. Individual behaviour is the result of interaction between
“culturally dependent social roles and individually different roles identities”
(Matsumoto, 2007, p. 1286).
Matsumoto (2007) further reiterates that in some situations, people are
likely to provide similar responses irrespective of personality or culture, and in
other cases, people give different responses due to cultural or personality diversity.
Therefore, “behaviour [can] be determined by universal psychological processes; in
others, mainly by personality; and yet in others, mainly by culture” (Matsumoto,
2007, p. 1305). The influence of culture in individual behaviour and mental
processes is further elaborated by Matsumoto and Juang (2008) as presented in
Figure 2.4.

68
Figure 2.4 Culture and behaviour
Source: Matsumoto and Juang (2008, p. 23).
At the macro level, cultures are derived from the combination of ecological
factors, social factors and biological factors. The enculturation process, according
to Matsumoto and Juang (2008), is through family, community and institutions,
and later forms the psychological characteristics of individuals, such as their
attitude, beliefs, norms and behaviour. Matsumoto and Juang (2008), however,
argue that while culture is an important factor in influencing individuals’
behaviour, there are also other factors such as individuals’ personalities and context
which may affect behaviour. Consequently, the influence of culture on behaviour
varies according to context.
2.4.1 Hofstede’s (1980) National Cultural Dimension
Culture, as defined by Hofstede (2001, p. 9) is:
Culture
Ecological
factors
Social
factors
Biological
factors
Enculturation via
Family
Community
Institutions
Psychological
processes:
Attitudes
Values
Beliefs
Opinions
Worldviews
Norms
Behaviours

69
“The collective programming of the mind that distinguishes the
members of one group or category of people from another”.
According to Hofstede (1980; 1991), a culture which guides our daily
practices, starts to be developed within the family, from society, at school, and
later influences behaviour in the workplace. In his earlier seminal work, Hofstede
(1980) used more than 117,000 questionnaires across 50 countries to IBM
employees with four cultural dimensions to explain the differences of culture in
work related values. These dimensions, as suggested by Hofstede (1980), are
‘Power distance’, ‘Uncertainty avoidance’, ‘Individualism-collectivism’ and
‘Masculinity-femininity’. Later, Hofstede (1991) added another dimension, ‘Long
term orientation’ or ‘Confucian dynamism’ based on surveys from Chinese values.
‘Power distance’ is defined as “the extent to which less powerful members
of institutions and organizations within a country expect and accept that power is
distributed unequally” (Hofstede, 2001, p. 98). It outlines how a society can accept
the inequality in power distribution and status among members of that society and
is measured with a power-distance index (PDI). In high Power Distance societies,
respect for elders is a basic norm since elders are perceived to have more authority
in decision making and this respect lasts throughout life. In contrast, in low Power
Distance societies every member in the society is treated equally regardless of age.
In terms of education, high Power Distance societies prone to have teacher-centred
education rather than student-centred education applied in low Power Distance
societies.

70
The influence from the society and education is then translated in the
workplace. Hofstede (1991, p. 4) suggests that “behaviour at work is a continuation
of behaviour learned earlier”; thus, in low PDI countries, decision making in an
organization is less concentrated and staff are treated equally irrespective of their
status. In contrast, in high PDI countries, decision making is more concentrated,
based on the level of authority and status is more likely to be used as the basis to
treat staff (Hofstede, 2001). With regard to taxation, Tsakumis et al. (2007) argue
that high Power Distance countries have higher levels of tax evasion compared to
low Power Distance countries. This is due to among others the high disparity in
income earned by the upper level and lower level classes in society and this income
disparity is further increased by the tax system.
‘Uncertainty avoidance’ is described as the degree to which a society
tolerates ambiguity and uncertainty situations, and is measured using the
uncertainty avoidance index (UAI). Hofstede (1980) argues that societies in low
UAI countries have lower stress, are happier people, more optimistic with regard to
their careers, more trusting and more willing to take unknown risk. In contrast,
societies in high UAI countries are more stressed, less optimistic, more
conservative and feel powerless toward external forces. Societies with a high UAI
index prefer clarity, structure, law and order, and are prone to take only known
risks while low UAI societies are comfortable with ambiguity, more innovative and
more tolerant towards diversity (Hofstede, 2001). Translating these attributes of
UAI into a tax context, Tsakumis et al. (2007) suggest that higher level of tax
evasion is more prevalent in high UAI countries given that people in low UAI
countries trust their government more than people in high UAI countries (Hofstede,

71
2001), thus increases the belief by taxpayers that the government misuses their
tax funds.
‘Individualism-collectivism’ explains the degree of preference for closely-
knit or loosely-knit relationship societies. Hofstede (2001, p. 209) describes
individualism as “a society in which the ties between individuals are loose” and
collectivism as “people from birth onwards are integrated into strong, cohesive in-
groups, which throughout people’s lifetime continue to protect them in exchange
for unquestioning loyalty”. It is about the “I” or “We” consciousness (Hofstede,
2001, p. 227), and therefore the decision making in high individualistic society
reflects an individual decision compared to collective decisions in low
individualistic (collective) society.
Another attribute of members of high individualistic society is that they
pursue their own and their immediate family members’ interests only. Conversely,
members in a high collectivist society will pursue the well-being of the society
more than individual interests, and are more likely to work for the success of the
group rather than their own personal success. Hosftede (2001) argues that a
government in a weak or low individualist country (Collectivist culture) has a
greater possibility of dominating with its role in the economic system of the
country, compared to a high individualist country, which is prone to having market
capitalism dominate in its economic system.
Hofstede (2001) also argues that in a high individualist society, law and
rights are perceived to be equal for everyone in the country, but on the contrary, a
collectivist society views that law and rights differ by groups. As a result,

72
members of high individualist society are less inclined to evade tax since the law is
universally imposed on everyone without any favouritism to any groups which
result into the lower level of tax evasion (Tsakumis et al., 2007). Apart from
uncertainty avoidance, individualism is another cultural dimension which
significantly explains tax evasion (Richardson, 2008).
‘Masculinity-femininity’ addresses the issue of the dominant gender role
pattern in society. Hofstede (2001, p. 297) defines masculinity as “a society in
which gender roles are clearly distinct” and femininity as “a society in which social
gender overlaps”. Arguably, in a high masculine society, males are seen as superior
to females, have high egoism and there is the practise of gender orientation in their
work and personal lives. Members in a masculine society also regard highly
material achievement, performance and competition. In contrast, in a highly
feminine society, it is expected that people are treated almost equally irrespective
of gender, there is low egoism and priority is placed on the quality of life and
relationship with people. In tax context, a feminine society believes in providing a
minimum quality of life for everyone and tax fund is used to subsidize lower class
people (Hofstede, 2001). Therefore, it is postulated that tax evasion is less apparent
in feminine society compared to masculine society (Tsakumis et al., 2007).
The ‘long term versus short term orientation’ is described as “fostering of
virtues oriented towards future rewards, in particular perseverance and thrift”, and
“fostering of virtues related to the past and present, in particular respect for
tradition, preservation of ‘face’ and fulfilling social obligations” (Hofstede, 2001,
p. 359). In a high long term orientation society, their members emphasize
persistence and personal adaptability. In contrast, in a short term orientation society

73
members are eager for quick results and personal stability. In a tax context, Yong
(2011) found that long term orientation societies in New Zealand tend to update
their record keeping regularly and thus have lower tax payment problems to avoid
tax penalties compared to short term orientation society.
Hofstede’s (1980; 1991) National Cultural Dimensions have been widely
used in social science studies and have contributed to explain the cross-cultural
differences in business practices probably due to a number of reasons. First,
Hofstede’s (1980; 1991) dimensions are independent except for Power Distance
and Individualism-Collectivism dimensions, which are interdependent (De Mooij,
2004). Secondly, applications and replications of Hofstede (1980; 1991) studies on
matched and non-matched samples with different samples and at different period of
time have confirmed that Hofstede’s dimensions are still valid (Hofstede, 2001; De
Mooij, 2004). A recent meta-analysis study by Taras et al. (2012), on 451 empirical
studies which used Hofstede’s Values Survey Module (VSM) for three different
period of time (1980s, 1990s and 2000s), found that despite Hofstede’s (1980;
1991) National Cultural Dimension scores decreasing since the 1980s, the
dimensions are still relevant in explaining culture. Indeed, more recent accounting
studies such as Patel (2003) and Tsakumis (2007) suggest that even a sub-group of
the society (the accountants), such as in the US, Australia, India and Malaysia, all
represent their respective national culture.
Thirdly, Hofstede’s (1980; 1991) National Cultural Dimensions are the
most influential work of classifying cultures, and reviews have found that in
general Hofstede’s (1980; 1991) framework is relevant for cross-cultural research
(Kirkman et al., 2006). Fourthly, Hofstede’s (1980; 1991) National Cultural

74
Dimensions were empirically developed based on a survey using IBM employees,
capturing a number of countries, while other cultural constructs remain in the
conceptualization phase (Yoo et al., 2011). Finally, Hofstede’s cultural dimensions
have been widely applied to explain the effect of culture in various areas of social
science studies (Taras et al., 2010). This is also supported by the number of citation
index in refereed journal articles, of which 2700 articles cited Hofstede’s work
(Hofstede, 2001).
Despite being applied and replicated in many studies, Hofstede’s (1980;
1991) National Cultural Dimensions are not free from criticism. Roxas and
Stoneback (1997) commented that national boundaries do not necessarily coincide
with culture, Hofstede’s (1980; 1991) measurements are out of date, and many
developments have occurred since his seminal work in 1980. Therefore, the authors
argue that the rankings are no longer relevant and the results may not be accurate
since they do not consider sub-cultures, industry differences, and organisational
culture. McSweeney (2002) critically argues that the methodology and assumptions
used by Hofstede (1980) are flawed. Specifically, Hofstede’s (1980) survey ignores
the differences in organisational culture across IBM, his questionnaire is almost
restricted to workplace issues, the response from one organisation cannot be used
for generalizing to the whole nation, and the assumption that national culture is
homogenous is invalid.
Hofstede (2002) responded to the foregoing criticisms by stressing that the
dimensions in his work do not measure causality, the studies are carried out to find
differences between national cultures, and thus “any set of functionally equivalent
samples from national populations can supply information about such differences”

75
(Hofstede, 2002, p. 2). Furthermore, Hofstede (2002) argues that the matched data
of IBM branches can provide support for his claims since IBM operates in many
countries and thus the difference is only with respect to nationality. Hofstede
(2002) further reiterates that even though the data is considered as old and
outdated, the cultural dimensions have centuries-old roots and many studies from
different areas subsequent to his initial work have provided consistent validity.
Moreover, while there is possibility that the cultural dimensions scores of
the countries have changed over time, past studies such as De Mooij (1998) and
Merritt (2000), support the stability of Hofstede’s (1980) cultural dimensions. In
his attempt to validate his earlier findings, Hofstede (2001) also compares rankings
and indexes of other studies which apply his cultural dimensions and found support
for his cultural dimensions. In addition, other cross-cultural studies, such as
Trompenaars (1993), Schwartz (1994) and House et al. (2004) also used a survey
instrument to understand the culture. The use of a survey to understand culture is
considered as acceptable since culture could be examined from the emic (inside
perspective) and etic (outside perspective) (Hofstede, 1998).
Baskerville (2005) summarizes five common critiques of Hofstede (1980;
1991) National Cultural Dimensions. First, it is not appropriate to use a survey in
examining cultural differences; secondly, nations are not the best variable to study
culture; thirdly, a study on a subsidiary of a company cannot represent a whole
nation; fourthly, the IBM data is obsolete and old; and finally, four or five cultural
dimensions are not sufficient to measure culture. Matsumoto and Juang (2008),
however argue that since countries are determined by specific boundaries which are
represented by their respective ecology, history, economy and government, all of

76
which are related to culture, therefore using national boundaries to explain culture
is acceptable.
A number of accounting based studies have attempted to examine culture
from the perspectives of Hofstede’s (1980; 1991) National Cultural Dimensions.
Gray (1988) for example, suggests that the degree of professionalism is more
prevalent in high Individualism, low Uncertainty Avoidance and low Power
Distance. In another study, Roxas and Stoneback (1997) covers nine countries that
come from different groupings in Hofstede’s (1980) rankings, and suggest that
Power Distance has the most significant effect compared to the other dimensions.
The study also concludes that irrespective of whether the classification of culture is
made based on the accounting system or cultural dimensions, culture has an
influence on the ethical decision making.
In management accounting studies, Williams and Seaman (2001) support
the claim of Hofstede (1980) on the existence of Power Distance by examining
manufacturing firms in Singapore. Their findings demonstrate that within firms in
high power distance nations there is likely to be a greater concentration of authority
at higher levels. A recent study by Mir et al. (2009) comparing the voluntary
disclosure in financial reporting between New Zealand and Indian companies
indicates that Indian companies disclosed more compared to New Zealand
companies. The authors conclude that the findings do not support Hofstede’s
(1980) National Cultural Dimensions to explain the influence of culture in the
voluntary disclosure of New Zealand and Indian companies.

77
In tax studies, the use of Hofstede’s (1980; 1991) cultural dimensions in
explaining the influence of culture in complying with the tax law is limited.
Tsakumis et al. (2007) for instance, used secondary data to examine the association
between cultural dimensions and tax evasion in 50 countries. Richardson (2008)
operationalized Hofstede’s (1980) cultural dimensions to examine the relationship
between culture together with legal, political and religious factors with the level of
tax evasion. Using interviews, a recent study by Yong (2011), for example, looked
into the influence of intra-cultural ethnicities with tax compliance by small-
medium business operators in New Zealand. All of these studies provide some
support to Hofstede’s (1980; 1991) cultural dimensions to represent the culture in
tax compliance studies.
The limitations in Hofstede’s (1980) National Cultural Dimensions suggest
that Hofstede’s (1980) ranks and scores for countries cannot be perceived as
absolute standards. However, based on the support for Hofstede’s (1980) National
Cultural Dimensions in prior studies suggests that a comparison between two
countries on any dimensions is possible provided that the two countries are totally
different on any one dimension (Hofstede, 2001). Regardless of the various
criticisms, to date there is no other study that has attempted to examine culture in
so much detail and that covers so many countries which suggests that, Hofstede’s
(1980) cultural dimensions remain applicable in many cross-cultural setting studies
(Roxas & Stoneback, 1997).
In addition to that, other cultural framework such as Trompenaars (1993)
and House et al. (2004), were essentially built up from Hofstede’s (1980; 1991)
cultural framework. This suggests that Hofstede’s (1980; 1991) cultural framework

78
has more credibility, compared to the other two cultural frameworks. Furthermore,
the discussions also indicate that the credibility of Hofstede’s (1980; 1991) to
explain culture has been tested and proven in many areas of studies.
This study employs Hofstede (1980) National Cultural Dimensions to
explain the influence of culture in the tax compliance behaviour of tax agents in
Malaysia and New Zealand after considering its limitations and potential scope
from the earlier discussions. The discussions of Hofstede’s (1980) National
Cultural Dimensions in this section also suggests that due to the differences in the
attributes of national culture, there is a possibility that members of different
national culture have a distinct concept of what comprises ethical and unethical
behaviour.
2.4.2 Hofstede’s (1980) National Cultural Dimensions of Malaysia and New
Zealand
In 1980, both Malaysia and New Zealand were included in Hofstede’s
(1980) index scores and rankings of cultural values. The index scores and rankings
were determined from surveys with IBM employees conducted in 50 countries. As
Malaysia is not included in the study pertaining to ‘long term versus short term
orientation’ by Hofstede (1991), the comparison for this dimension between
Malaysia and New Zealand is unlikely and therefore, this study would only focus
on the four cultural dimensions provided by Hofstede (1980). Table 2.3
summarizes the index scores and rankings for each four cultural dimensions for
both countries.

79
Table 2.3 Hofstede’s (1980) National Cultural Dimensions for Malaysia and
New Zealand
Cultural
dimensions
Malaysia New Zealand
Score Rank Score Rank
Power Distance 104
(High)
1 22
(Low)
49
Uncertainty
Avoidance
36
(Low)
46 49
(High)
39
Individualism-
Collectivisim
26
(Collectivist)
36 79
(Individualist)
6
Masculinity-
Femininity
50
(Masculine)
25 58 (Masculine) 17
Source: Adapted from Goodwin and Goodwin (1999, p. 270).
The above index scores and rankings suggest that Malaysia and New
Zealand are different in three cultural dimensions and fairly similar in one cultural
dimension. Hofstede (2007) argues that the most obvious differences between the
Asian and Anglo-Saxon cultures are the Individualism-Collectivism and Power
Distance dimension. As presented in the summary in Table 2.3 above, Hofstede
(1980) proposes that Malaysia is high in Power Distance, low in Uncertainty
Avoidance, a Collectivist and Masculine society. New Zealand, however, is
classified as low in Power Distance, high in Uncertainty Avoidance, an
Individualist and also a Masculine society. Nonetheless, New Zealand society is
considered to be more masculine compared to Malaysia based on the index scores
and ranking.
Malaysia, which is located in South East Asia practices Asian values
(Kennedy, 2002). The Asian values which, for instance, involve respecting elders

80
and those higher in the hierarchy in society or an organization, is reflected in the
way people are addressed at home, society and the workplace. To address an uncle
for instance, the titles of ‘Pakcik’ (in Malay), ‘Shushu’ (in Chinese) and ‘Anne’’ (in
Indian) have to be used before addressing their names (Abdullah, 1996). The
emphasis on status and hierarchy indicates the practice of a high Power Distance
society which results in centralized power in decision making and subordinates are
expected to accept direction from superiors (Lim, 2001). It is also rude for instance,
for subordinates to openly disagree with superiors especially in public (Abdullah,
1996).
Notwithstanding that Malaysia is a multi-ethnic country, all ethnics in
Malaysia believe in a closely-knit, strong family relationship, which reflects a
Collectivist society (Mohd Iskandar and Pourjalali, 2000). Since Power Distance is
more apparent in Malaysia based on Hofstede’s (1980) study, the decision making,
is thus influenced more by the Power Distance rather than Collectivism which is
translated into autocratic decision making. Therefore, while group decision making
is important it is possible to be over-ridden by the decision made by the leader
(Lim, 2001).
In a low Uncertainty Avoidance society, the members are more willing to
take risks (Hofstede, 1980) and thus more acceptable to mistakes since priority is
on maintaining harmony, ensuring good relationship and saving face. Kennedy
(2002), for instance, found that Malaysian managers avoid giving negative remarks
to their subordinates to maintain harmony and Lim (2001) argues that any
disagreement will be communicated indirectly as a way to save face. In terms of
Masculinity, Malaysia is considered as a moderate Masculine society by Hofstede

81
(1980). A Masculine society emphasizes on the gender role pattern in society, has
the attribute of assertiveness, focus on material success rather than quality of life.
Lim (2001), for instance, found that regardless of ethnicities, the level of
masculinity among Malays and Chinese managers is identical which suggests the
convergence of values between ethnics due to the government policies.
Brooking (2004) suggests that New Zealand is a multi-ethnic, multi-cultural
society which the population is dominated by the European descendants. There is
also a suggestion that New Zealand is a bi-cultural country, comprising two
distinct cultures of the indigenous Maori and Pakeha, the European settlers (Mir,
Chatterjee, and Rahaman, 2009). As a result of the dominant European descendants
in New Zealand, New Zealand society in general is influenced more by the Anglo-
Celtic culture (Brooking, 2004) or Anglo-Saxon culture (Kennedy, 2012).
Therefore, it is not surprising that the Hofstede’s (1980; 1991) cultural dimensions
for New Zealand reflect the culture of Pakeha.
The findings by Kennedy (2000; 2012), for example, indicate that New
Zealand is low in Power Distance which is consistent with Hofstede’s (1980)
proposition. The egalitarian characteristics are visible in the New Zealand culture
which proposes that people should be treated equally in all aspects of life. For
instance, the use of first names is common in all levels of age from home, at
school, and the workplace (Kennedy, 2000). Hofstede (1980) also suggests that
New Zealand is an Individualist society. The existence of an Individualist culture is
also reported in a study by Goodwin and Goodwin (1999), which found that New
Zealand students are less willing to include their team members in a study project
compared to Malaysian students if they thought that their contribution is greater

82
than other team members. The findings from a study with business managers in
New Zealand by Kennedy (2000) also supported the argument that New Zealand
culture reflects an Individualist culture. In New Zealand, it is common for young
people to be independent leaving their family to stay on their own and it is
uncommon to see adults staying with the older generation (Kennedy, 2012).
New Zealand is classified as a Masculine society by Hofstede (1980). This
is perhaps further supported by Kennedy (2000), who found that New Zealand is a
male oriented society, which encourages high performance orientation, such as
taking pride as the first to climb Mount Everest and the first to fly directly from
England to New Zealand. New Zealand is also considered to be a high Uncertainty
Avoidance society in Hofstede’s (1980) study. The study by Kennedy (2000) found
that the desire for security and stability in daily life is prevalent among business
managers in New Zealand, which is translated into a high score for Uncertainty
Avoidance.
More than 30 years have passed since Hofstede’s (1980) study of cultural
values and there are possibilities that over the years, the cultural values of Malaysia
and New Zealand have changed. For instance, based on a review of cultural
changes in Malaysia between the period of 1987 to 1997 by Mohd Iskandar and
Pourjalali (2000), the magnitude of the index scores has changed due to a fairer
distribution of national wealth, urban migration, improved quality of life, and equal
education and career opportunities. In a similar vein, the findings from Lim (2001)
also indicate that Malaysians are moving towards a more egalitarian, stressful and
individualistic society. A study by Yeoh (1999) also found contradictory results
between Hofstede’s (1980) original scores and Hofstede’s (1980) National Cultural

83
Dimension scores in her study among Malaysian and New Zealand accounting
students. Using the Values Survey Module 1994 (VSM 94) by Hofstede (1994),
Masculinity was the only dimension that was supported to have the same direction
as proposed by Hofstede (1980) for both Malaysia and New Zealand.
Recently, more comprehensive evidence is provided from the meta-analysis
findings of Taras et al. (2012). The meta-analysis of studies using Hofstede’s
Values Survey Module (VSM) by Taras et al. (2012) indicates that Malaysia is still
higher in Power Distance compared to New Zealand. However, the level of Power
Distance has been decreasing in both countries. Notwithstanding that Malaysia
remains a Collectivist society, based on the meta-analytic scores, Malaysia is
moving towards being an Individualist society. New Zealand is still considered as
Individualist even though there is a slight decrease between the periods of the
1990s to 2000s.
Over the period of the 2000s both Malaysia and New Zealand are
considered as low Uncertainty Avoidance societies. The meta-analysis also shows
that both Malaysia and New Zealand are moving towards becoming a more
Feminine society. Overall, Taras et al. (2012) argue that the precision of
Hofstede’s (1980) scores is decreasing over time much faster than projected by
Hofstede (2001). The scores from the meta-analysis for each cultural dimension
from 1980s to 2000s with respect to Malaysia and New Zealand are presented in
Table 2.4.

84
Table 2.4 Standardized meta-analytic scores of Hofstede’s Value Survey
Module for Malaysia and New Zealand
Cultural
Dimensions /
Period
Malaysia New Zealand
1980s 1990s 2000s 1980s 1990s 2000s
Power
Distance
2.13 1.47 0.21 -0.90 -0.68 -1.04
Uncertainty
Avoidance
-0.69 0.34 -0.64 -0.15 -0.22 -1.13
Individualism-
Collectivism
-1.29 -0.95 -0.93 0.69 1.37 1.03
Masculinity-
Femininity
0.31 0.17 -0.11 0.59 -0.09 N/A
Note: The 1980s’ scores refer to Hofstede’s original scores after being standardized to
ensure comparability with the meta-analysis score. Standardized meta-analytic scores
should be between -2 to 2, while 0 means neutral. Source: Taras et al. (2012, p. 334-337).
2.5 A review of relevant past studies
2.5.1 The influence of attitude in tax compliance
An important element in the TPB, as discussed in Section 2.2.2 above, is
the attitude towards the intention to perform the behaviour. Attitude is directly
related to behaviour to the degree it is influenced by the intention (Armitage &
Christian, 2003). Eriksen and Fallan (1996) argue that the definition of attitude in
tax compliance is not clear since attitude towards tax compliance is an ambiguous
construct. Kirchler (2007) concurs that attitude in tax compliance is a complex
construct which represents the social construct of taxes that influences tax
compliance behaviour. Since tax compliance is viewed as a sensitive issue, many
studies in tax compliance use attitude towards the behaviour as a proxy rather than

85
examining actual tax compliance behaviour itself (Kirchler, 2007). In many tax
compliance studies, Kirchler (2007) found, that while the relationships between
attitude towards tax compliance and behaviour indicate weak relationships, these
are significant.
In understanding the influence of attitude and tax compliance, Eriksen and
Fallan (1996) examine two different groups of students from marketing and law.
They suggest that tax attitude is important in determining tax compliance behaviour
and this tax attitude is influenced by the specific tax knowledge that the students
possess. Their findings are aligned with Roberts et al. (1994) who suggest that
attitudes to tax compliance become better with the increase in tax knowledge. To
identify the beliefs and norms underlying taxpayers in complying with the tax law,
Hanno and Violette (1996) applied the Theory of Reasoned Action (TRA) in an
experimental study in the US. The findings suggest that attitude towards intention
to comply with the federal tax law significantly influences reported tax compliance
behaviour. The effect of attitude towards intention to comply with the tax law was
also found to be more significant compared to subjective norms in this
experimental study.
The attitude of taxpayers is also examined by Chan et al. (2000), comparing
US and Hong Kong taxpayers. Their findings suggest that the attitude of taxpayers
is dependent on the degree of moral reasoning that the taxpayers have. For
instance, US taxpayers who have higher moral reasoning indicate a more
favourable attitude towards tax compliance, compared to a less favourable attitude
of Hong Kong taxpayers who indicate lower moral reasoning.

86
Murphy (2004) examines the attitude of aggressive Australian taxpayers
using a national tax survey including 2040 Australian taxpayers. The findings
suggest that those taxpayers who prefer and seek an aggressive tax positions have a
different attitude compared to other taxpayers. Their results also suggest that it is
the taxpayers and not the tax agents who instigate the aggressive tax reporting. In
their “slippery slope framework” Kirchler et al. (2008, p. 220) suggest that attitude
toward taxes is an important factor that motivates taxpayers to comply with the tax
law. They argue that a favourable attitude towards compliance will develop trust in
the revenue authorities which will encourage voluntary tax compliance.
With regard to accountants, a study by Buchan (2005) in five public
accounting firms in the US, suggests that accountants’ attitude has a strong direct
relationship with ethical intention in evaluating ethical issues presented in the
study. Attitude also indicates a significant relationship with subjective norms
which reflects the indirect influence of subjective norms with intention. Pinsker et
al. (2009) found that attitudes of accounting professionals in the tax environment
are reflected in the judgments that they make, but the same results are not found
among auditors.
In the US, Bobek and Hatfield (2003) conducted an experimental study
with three scenarios: a home office scenario; a tip scenario; and a charitable
contribution scenario, using students, a group of parents from an elementary
school, and random mail-out respondents in Florida and Georgia, respectively as
samples. The study found that attitude has a strong positive effect in explaining the
tax compliance behaviour of the respondents in all three cases. In a study in Canada
by Trivedi et al. (2005), which measured tax compliance in two different ways; a

87
hypothetical-situation and experimentally-measured compliance; the findings
support attitude in explaining the tax compliance behaviour of the participants.
Bobek et al. (2007a) examine the underlying reasons why taxpayers prefer refunds
using two phases of study. The findings suggest that taxpayers’ attitude towards
uncertainty influences their withholding tax positions.
In a study by Saad (2011) using individual taxpayers in Malaysia and New
Zealand, her findings suggest that taxpayers in both countries considered attitude as
an important factor in complying with the tax law. Similar findings are provided by
Smart (2012) in examining the tax compliance behaviour of individual taxpayers
and tax agents in New Zealand. This study found that attitudes towards informal
sanctions such as tax morale are influential in motivating individual taxpayers and
tax agents to comply or not comply with the tax law. Another recent study by
Langham et al. (2012) among small and medium entrepreneurs in Australia found
that attitude towards correctly reporting and maintaining tax records influences the
intention to comply with tax obligations.
2.5.2 Subjective norms and tax compliance
The concept of norms in tax compliance, according to Kirchler (2007), is
difficult to conceptualize since norms could emanate from individual standards
(internally from the taxpayer), socially approved standards (from those who close
to the taxpayers), or the societal norms which are from the collective or at the
national level and translated into the tax law. Subjective norms or important
referent others, as defined by Ajzen (1991), are global social pressure from those
who close to a person such as family and friends, who could exert influence on a
person’s ethical decision making because what is considered as ethical is not

88
universally consistent (Westerman et al., 2007). This is supported by Kirchler
(2007) in a tax context, who argues that the tax compliance behaviour of taxpayers
is influenced by the group they are associated with.
A review of ethics studies by O’Fallon and Butterfield (2005), which
regards subjective norm as an organizational factor, suggests that subjective norm
is a new area of study in ethics literature and requires further examination. In their
synthesis of past studies in tax compliance by Jackson and Milliron (1986), and
later in an updated work by Richardson and Sawyer (2001), subjective norms in the
form of peer influence are regarded as an important tax compliance factor.
Similarly, the Fischer Model used by Fischer et al. (1992) also acknowledges the
importance of subjective norms (peer influence) in explaining the tax compliance
behaviour of taxpayers. The importance of subjective norms which is measured
using peer influence is further supported by Westerman et al. (2007). In their study
on respondents from Germany, Italy and Japan, Westerman et al. (2007) suggest
that peers indicate stronger influence in a person’s ethical decision making
compared to national culture. However, the influence of peers is stronger in the
higher power distance and higher individualism societies.
With respect to the ethical decision making of tax agents, Milliron (1988),
for instance, has proposed a model examining the aggressiveness of tax agents in
the ambiguous tax environment. Based on interviews with 12 tax agents from
public accounting firms, Milliron (1988) suggests that peers’ opinion is an aspect
that forms the “Preparer vulnerability” factor in offering aggressive advice to
client.

89
The importance of subjective norms in tax compliance behaviour is also
reported in Hanno and Violette’s (1996) study. The subjective norms/referents
comprise ‘members of the family’, ‘current or future employer’, ‘close friends’ and
‘spouse/significant other’, and were tested on both compliers and non-compliers
groups. Generally, the compliers and non-compliers have the opinion that the
referent groups expected tax compliance from them. Of all the referent groups, the
only significant difference is the influence of family members on compliers and
non-compliers, where the strongest effect was found on compliers compared to
non-compliers.
In examining the role of subjective norms in tax compliance in the US,
Bobek and Hatfield (2003) found that subjective norms have a positive influence
and highly significant in all three scenarios used in the study. Bobek et al. (2007a)
applied the TPB among students in the US to understand the reasons why taxpayers
prefer a refund. Their study indicates that subjective norms influence the
withholding tax position of the taxpayers. The more the taxpayers are advised by
people around them to lower their withholding tax position, the more likely they
will perform the behaviour. The study by Trivedi et al. (2005) in Canada reports
that subjective norms are only significant in the case of intent to comply but not in
the case of intent to overstate the deductions. This suggests that participants in the
study are inclined to evade tax only if there is a genuine reason.
In a study by Saad (2011) in Malaysia and New Zealand, the findings of the
study support the importance of subjective norms in influencing the compliance
behaviour of individual taxpayers in an overstating business income scenario and
an understating other income scenario. Langham et al. (2012) reported that in a

90
survey with small medium business owners in Australia, the influence of subjective
norms such as from bookkeepers, accountants and tax agents are effective in
motivating taxpayer’s intention to comply with tax obligations. In a way, the
findings also indicate the importance of tax agents in assisting taxpayers to comply
with the tax law.
A review of past studies by Hite et al. (2003) on the factors that affect tax
agents’ compliance decision, indicates that tax agents’ aggressive behaviour is
influenced by the opinions of others. In addition, their motivation to provide
aggressive advice is also demand-driven by the aggressiveness of the clients in tax
position. The findings imply the influence of peers and clients in their ethical
decision making. In a recent study, Tan (2011) also found that the type of advice
given to tax agents’ clients, to a certain extent depends on the risk profiles of their
clients, indicating the influence of clients in the ethical decision making of tax
agents.
In another study, Kahle and White (2004) examine the influence of
subjective norms using an experimental study in the US involving tax agents from
various types of accounting firms. The results of the study suggest that tax agents
are influenced by their clients in their decision making. Tax agents are more
influenced by their client preferences rather than the direction of the evidence when
making decisions. The importance of subjective norms in the compliance behaviour
of tax agents is further supported by Smart (2012). The study which used members
of the New Zealand Institute of Accountants (NZICA), found that subjective norms
have a positive and significant influence on tax agents’ compliance behaviour to
tax law. The findings suggest that subjective norms in the form of important

91
referent’s expectations, threat of losing respect from important referents and the tax
compliance behaviour of important referents influenced the intention of tax agents
to act ethically.
2.5.3 Perceived behavioural control and tax compliance
Perceived behavioural control is another element in the TPB which is
discussed earlier in Section 2.2.2. Ajzen (1991) posits that apart from the attitude
towards behaviour and subjective norms, intention to perform behaviour is also
determined by the perceived behavioural control that an individual has. Perceived
behavioural control also directly influences the performance of behaviour. Ajzen
(1991) also proposes that the TPB has to be utilized with specific targets, goal and
context. With regard to tax compliance, Bobek and Hatfield (2003) suggest that
perceived behavioural control does not refer to the degree of easiness or difficulty
to cheat in general, but it is concerned with the level of control a taxpayer believes
he or she has in conducting specific action related to complying with the tax laws,
such as underreporting income and overstating expenses. Kirchler (2007) describes
perceived behavioural control as the self-confidence that a taxpayer possesses in
filing a tax return in a self-advantageous way.
Perceived behavioural control is still less explored in tax compliance
studies, and in general, findings from past studies on the influence of perceived
behavioural control in tax compliance are not favourable. For instance, the results
from the logistic regression by Bobek and Hatfield (2003), do not support
perceived behavioural control in explaining the cheating cases in tax compliance.
In a similar vein, the findings from the studies by Trivedi et al. (2005) and Saad
(2011) also indicate that perceived behavioural control is not strong enough to

92
influence tax compliance behaviour. Further, Bobek et al. (2007a) reported a
similar finding when examining the motivation to be in a tax refund position in the
US. The findings do not support perceived behavioural control in explaining the
taxpayers’ preference to be in a refund position.
A recent study by Smart (2012), which used individual taxpayers and tax
agents as samples in New Zealand, also supports the non-significant effect of
perceived behavioural control on the intention to comply with the tax law for
samples in the study. Perceived behavioural control was also found to have no
effect on the behaviour of tax agents to comply with the tax law. Similar findings
of a non-significant effect of perceived behavioural control is also provided by
Langham et al. (2012). The study found that based on three tax scenarios provided
in the study, perceived behavioural control of small and medium entrepreneurs in
Australia does not influence the intention to comply with tax obligations as the
level of tax complexity increases.
2.5.4 The influence of ethics and ethical sensitivity in tax compliance
While this study examines the influence of ethical sensitivity with the tax
compliance behaviour of tax agents, it is worthwhile to understand the general
concept of ethics before delving into ethical sensitivity. The term ethics and
morality are commonly used interchangeably (Crane & Matten, 2007). Ethics is
normally described as the moral principles or values that an individual has which
influence him or her in making the right or wrong decision in a given situation
(Crane & Matten, 2007). Being ethical, as argued by Jones (1991), is situation-
specific depending on the moral intensity of the issue.

93
In the case of complying with tax laws, this has an ethical element since it
involves the judgment of right and wrong with respect to tax compliance. It is
argued that having good tax ethics can increase the level of tax compliance (Singh,
2003). Alm and Torgler (2011) suggest that the level of ethics differs across
taxpayers, and therefore, the level of compliance among taxpayers also varies. Due
to this, the tax compliance behaviour of a taxpayer can partly be explained by the
role of ethics of that particular taxpayer, since taxpayers do not always behave in a
profit-seeking condition as implied by the economic deterrence model (Alm &
Torgler, 2011).
The importance of ethics in tax compliance behaviour is supported by
Jackson and Milliron (1986) in their synthesis of prior tax compliance studies, and
later in an updated work by Richardson and Sawyer (2001). The findings from
these studies suggest that ethics is a significant variable in explaining tax
compliance behaviour. However, Richardson and Sawyer (2001) argue that the
results tend to vary according to the definition of ethics adopted in each particular
study.
Due to the significance of ethics in tax compliance behaviour, a
considerable number of studies have attempted to examine the issue of ethics in tax
compliance. An example is the study of Song and Yarbrough (1978) who examine
the ethical level of taxpayers in eastern North Carolina in the US. The findings
from their survey demonstrate that the overall levels of ethics among those
taxpayers are only “barely passing”, at only 60.3 percent on a scale of 1 to 100.
94
Reckers et al. (1994) investigate the ethical beliefs of taxpayers in the US
state of Arkansas, and find that the ethical beliefs of the respondents are highly
significant in the decision to evade tax. Henderson and Kaplan (2005) examine
how ethical beliefs influence tax compliance by differentiating between general
ethical beliefs and specific ethical beliefs. General ethical beliefs are collective
beliefs of what is right or wrong such as an individual who did not cheat in the
exam did not litter while specific ethical beliefs represent ethics in tax context.
They propose that general ethical beliefs influence the specific ethical beliefs and
the latter affects the tax compliance behaviour. Ho and Wong (2008) examine the
ethical beliefs of taxpayers in Hong Kong, and suggest that ethical beliefs can be
used to improve the tax compliance rate, especially when taxpayers have low levels
of moral reasoning.
In Canada, Trivedi et al. (2005) conducted an experimental study, and their
findings demonstrate that ethics significantly influence the intention and behaviour
in complying with tax. Indeed their study suggests that ethics is the most important
variable which determines compliance with tax laws. The identity of taxpayers and
their association with tax ethics is also examined in a recent study by Wenzel
(2007) through a survey conducted in Australia. It is suggested that there is a
positive relationship between tax ethics, and the identity of the taxpayers as an
individual or a member of a nation.
The tax ethics of tax agents are examined by Attwell and Sawyer (2001) in
New Zealand. Based on the scale suggested by Song and Yarbrough (1978), their
study demonstrates that tax agents in New Zealand have only a “barely passing”
score, and a majority of the tax agents encountered ethical problems while

95
performing their duties. Notwithstanding the “barely passing” score, the findings
suggest that overall, tax agents have a better understanding of tax evasion, tax
avoidance, and tax minimization, compared to the results of an earlier study by
Tooley (1992). Attwell and Sawyer (2001) also demonstrate that Chartered
Accountants are more ethical compared to lawyers or other tax agents with respect
to tax compliance issues. In a similar vein, Doyle et al. (2009), in a study involving
tax agents in the United Kingdom (UK) and Ireland, suggest that ethical dilemmas
exist in tax practice, and argue that acting ethically is not merely complying with
the tax laws.
The ethical values of Chartered Public Accountants (CPAs), including tax
agents prior to self-regulation and post self-regulation by the accounting profession
in the US, are examined by Waldron and Doty (2010). Five hundred CPAs from an
American Institute of Certified Public Accountant (AICPA) listing were selected
through a random sampling. The results demonstrate that the ethical values of
CPAs are indifferent subsequent to the self-regulatory environment. However, the
self-regulation results in an increase in the intention of CPAs to behave ethically.
Notwithstanding the various specialty areas in accounting, a survey by
Emerson et al. (2007) found that the moral or ethical reasoning of accountants is
significantly indifferent to their job tasks, whether or not they are doing audits, tax
or accounting jobs. Early evidence on the ethical reasoning of CPAs is
demonstrated by Ponemon (1992) in understanding the influence of accounting
firm socialization with the level of ethical reasoning. The author argues that higher
level CPAs, those progressing from manager to partner, had a lower and more
homogenous level of ethical reasoning. Despite the claim that accounting

96
practitioners have low ethical reasoning, Wasieleski and Weber (2009) provide a
contradictory result. In a study involving business practitioners from various job
functions such as accounting, finance, information technology, supply chain,
marketing and human resources, the findings suggest that business practitioners
with an accounting background have high ethical reasoning and are placed second
after the human resources practitioner.
In Malaysia, Singh (2003) finds that the level of moral reasoning of the
Malaysian tax agents are lower compared to that of US auditors. In this study,
Singh (2003) examines the ethical decision making of tax agents by incorporating
individual differences, cognitive process and contextual variables in explaining the
ethical decision making of tax agents in public accounting firms. Having the
appropriate dimensions in ethical judgment is important to ensure correct decisions
are made. Frecknall-Hughes and Moizer (2005) discuss two contradicting ethical
dimensions in ethical judgment. They argue that tax agents should apply the
domain of consequentialism or deontology in making choices. Consequentialism
emphasizes the final outcome without any concern on the method to obtain the
outcomes (that is the end justified the means), provided that the good of the
outcome could compensate for the bad of the means. Therefore, if tax agents favour
the consequentialism domain then they have to consider the effects of the parties
involved and the level of importance to each group based on the decision that they
select. In contrast, the deontological approach to decision making suggests that
some acts are morally obligatory and thus tax agents within this approach will
disclose relevant information about their clients without considering the effect.

97
The effect of tax agent penalties on the ethical decision making of tax
agents is examined by Anderson and Cuccia (2000). By using students as
surrogates for tax agents in an experimental study, it is suggested that tax agents’
behaviour is in accordance with the changes in the tax agent penalties in the US.
For instance, the respondents in the study recommended fewer aggressive tax
positions with the increase in tax agent penalties.
Burns and Kiecker (1995) provide an example on the ethical judgment of
tax CPAs at supervisory level. Their findings indicate that deontological (essential
characteristics of the behaviour) and teleological (consequences of the behaviour)
considerations both influence the ethical judgment of CPAs at the supervisory
level. Interestingly, the CPAs in the study generally supported the staff under their
supervision to make ethical decisions and disapproved of unethical decisions.
Nevertheless, their support is influenced by the economic benefits that the ethical
or unethical behaviour contributes to the firm. These results are in line with the
findings from the extensive review of tax accountants’ ethical judgments by
Roberts (1998).
Tax agents’ ethical judgments and behavioural intentions, in cases when
clients demand aggressive tax reporting, are examined by Cruz et al. (2000). By
using the Multidimensional Ethics Scale (MES) on 67 tax agents, their study
indicates that the moral equity dimension has the greatest influence in all three
hypothetical tax scenarios provided in the questionnaire. The ethical concerns and
ethical environment of tax agents in the self-assessment system are examined by
Marshall et al. (1998) in understanding the ethical judgments of these tax agents. In
their study in Western Australia, their findings demonstrate that the most common

98
ethical problem is the failure to make reasonable inquiries if there is a lack of
documentation. Another aspect which concerned these tax agents is continuing to
act for clients in an unethical situation. Despite the participants in the study
demonstrating that they are operating in an ethical environment, almost half of
them also concurred that there are many opportunities for them to act unethically.
In a similar study, Bobek and Robin (2007) also examine the ethical
environment in which tax agents operate, particularly the common ethical
dilemmas faced by tax agents and the nature of the ethical environments. Their
study surveyed tax agents in public accounting firms who are also members of
professional bodies, and indicates that on average, respondents feel that they are
working in a strong ethical environment. The procedures, rules, and code of ethics
have contributed to the strong ethical environment. Effective in-house training also
helps them to improve their ethical decision making.
In another study, Bobek et al. (2010) applied the same experiential
questionnaire (EQ) by Bobek and Robin (2007) to examine the experience of
partners and non-partners with ethical tax dilemmas. The study found that partners
experienced an ethical tax dilemma more than non-partners. Non-partners also
reported certain types of ethical tax dilemmas which were related to lack of
experience. The findings suggest the possible existence of information asymmetry
in resolving ethical dilemmas between partners and non-partners. In a recent study,
Doyle et al. (2012a) looked into the ethical reasoning of tax agents in the UK in
solving ethical dilemmas in tax and social contexts. Based on the ‘P’ scores of the
DIT, the study found that tax agents used a lower level of ethical reasoning in tax
context dilemmas compared to social context dilemmas.

99
Hume et al. (1999) demonstrate that a majority of CPAs in California
conform to the Statements on Responsibilities in Tax Practice (SRTP) when
making decisions involving ethical considerations. Results from the survey find
that the CPAs follow the SRTP more often than the unlicensed tax agents. Despite
the favourable findings, there is still a concern, since a significant number of CPAs
indicate they do not adhere to the SRTP. It is suggested that some CPAs may
choose to protect their personal benefits, such as profit-seeking, rather than
following a code of ethics when faced with ethical decision making.
The influence of group discussion on tax agents’ ethical decision making is
examined by Carnes et al. (1996). By using an experimental study involving tax
partners and managers of the then Big Six firms, the study finds that group
discussions will lead to decisions that favour the client in cases with high
probability of being audited and favour the Internal Revenue Service (IRS) in cases
with low probability of being audited. The process of generating advice from group
discussion will lead to extreme decisions, and the ultimate decision making is
actually made by the individual rather than the group.
Rest (1986) argues that an important element which motivates ethical
decision making is the existence of ethical sensitivity which enables an individual
to recognize moral issues. With regard to accounting practitioners, based on a
review of the first 1500 articles published in the first eighteen volume of Journal of
Business Ethics, Collins (2000) suggests that ethical sensitivity influences
accountants in situations involving violations of the law. Despite being important,
there is still a lack of studies investigating the influence of ethical sensitivity in
complying with the tax law which requires further examination (Tan, 2006).

100
Notwithstanding that, a few studies have attempted to address the issue of ethical
sensitivity and tax compliance behaviour. A study by Emerson, et al. (2007) for
instance, provides a general understanding on the level of ethical sensitivity among
accounting practitioners. A survey among accounting practitioners (including tax
agents), suggests they are more sensitive to consequences due to physical harm
rather than violation of the laws.
In another study, Yetmar and Eastman (2000) examined the ethical
sensitivity of tax agents registered with the American Institute of Certified Public
Accountants’ (AICPA’s) Tax Division in the US. The study argues that if tax
agents can recognize ethical issues, they are more likely to make ethical decisions.
Ironically, tax agents who are familiar with the Code of Ethics of AIPCA do not
significantly recognise ethical issues more often than tax agents who are unfamiliar
with the AICPA’s Code of Ethics.
The issue of ethical sensitivity of tax agents is also raised by Doyle et al.
(2009). Based on interviews with tax agents in Ireland and the United Kingdom
(UK), Doyle et al. (2009) find that respondents are clearly confused with the role of
ethics and argue that the ethical sensitivity of tax agents may have already
deteriorated. For instance, respondents can only illustrate examples of ethical
dilemmas in tax practice after being provided with specific examples by the
interviewer.
2.5.5 Culture and tax compliance
It is argued that culture influences both values and ethics. It is also
contended that different cultures embrace different values and behaviour (Axinn et

101
al., 2004). Therefore, it is important to understand the influence of culture since
cross-border trades are common scenarios in modern business. A number of studies
have attempted to examine the influence of culture in the accounting field. For
instance, in a study by Gendron et al. (2006), it is suggested that professional
Chartered Accountants in the French-speaking province of Quebec in Canada,
display a higher professional commitment compared to Chartered Accountants in
English-speaking provinces in Canada (Alberta, British Columbia, and Nova
Scotia). The finding supports the proposition that culture influences the ethical
behaviour of professional accountants.
In another study, Jakubowski et al. (2002) investigate the differences and
similarities in the Code of Professional Conduct of Certified or Chartered
Accountants in the US, Taiwan, South Korea, Malaysia, Canada (Ontario),
Australia, India and Hong Kong. The study finds that there are commonalities in
some rules which suggest that some rules are culture-free. It is also suggested that
the existence of cross- country variations in the Code of Professional Conduct
demonstrates the influence of culture and different legal systems. Arguably the
legal system is often a reflection of the culture (Gendron et al., 2006).
In a more recent study, Bobek et al. (2007b) examine the relationship
between the social norms and tax compliance intention in three countries:
Singapore, Australia, and the US. The study argues that the country effect (culture)
will be outweighed by the social norms. The study finds that, while social norms
are strongly related to intention to comply with tax and explain the inter-country
differences, the strength among the three countries is different. It is found that the

102
combination between personal norms and subjective norms is the highest in
Singapore, followed by Australia, and the lowest is the US.
The evidence that culture influences tax compliance is also put forward by
Torgler and Schneider (2007). Their study examines the effect of culture on tax
morale to comply with the tax law in Switzerland, Belgium, and Spain which have
some similarities and differences in their cultures. Switzerland has strong
democratic rights and has the influence of German, French, and Italian cultures.
Belgium’s community is strongly influenced by the Dutch and French. Spain is
considered to be a country with many historical Spanish nationalities, such as the
Basque country, Catalonia, Galicia and Navarre. The study indicates that there is a
possibility for culture and national pride to influence tax morale in complying with
tax laws.
In a similar study, Alm and Torgler (2006) examine the tax morale and tax
compliance between the US and 15 European countries. Essentially, US taxpayers
have higher tax morale compared to Spanish, and tax morale is also higher in the
Northern European countries compared to the Romanic countries. They suggest
that tax culture of each country in their studies influences the differences of tax
compliance behaviour. Interestingly, Saad (2011) found that generally, individual
taxpayers in Malaysia and New Zealand have similar perceptions towards tax
compliance regardless the differences in culture between the two countries.
Using Hofstede’s (1980) National Cultural Dimensions, Tsakumis et al.
(2007) investigate the influence of national culture and tax evasion in 50 countries.
The results of their study suggest that countries which practise high uncertainty

103
avoidance, low individualism, low masculinity and are high in power distance, are
more likely to engage in tax evasion. Extending the work of Tsakumis et al. (2007),
Richardson (2008) includes 47 countries in a study to examine the impact of
culture together with legal, political and religious variables on tax evasion. The
findings from their study suggest that tax evasion is higher when there is a higher
level of uncertainty avoidance and lower level of individualism.
Lewis et al. (2009) compare the influence of culture in tax compliance
between respondents in the UK and Italy. The study demonstrates that Italian
respondents declare more as the probability of detection increases and when tax is
framed as a gain. Italians students are also reported to declare less compared to UK
students. In another recent study, Bame-Aldred et al. (2013) examine the influence
of national culture on firm-level tax evasion of 3000 companies in 31 countries.
Their findings suggest that a collectivist culture is less likely to evade tax while an
individualistic culture indicates more possibility to perform such an action for
personal benefit.
In a series of intra-cultural interviews, based on Hofstede’s (1980; 2001)
cultural dimensions by Yong (2011) in New Zealand, the author found that a
Collectivist culture tends to use their network to reduce compliance costs and
because a Collectivist society is committed to their group, their obligations towards
the financial needs of the group result into delayed tax payments. In addition to
that, a high Power Distance society has greater respect and showed greater fear
towards the tax authority. The study also discovered that high Uncertainty
Avoidance and Masculine societies have better record keeping which results in less
tax compliance problems.

104
2.6 Summary
In this chapter, relevant theories, concepts and past studies are discussed to
provide some understanding of the factors that contribute to the ethical decision
making of tax agents while performing their roles. The discussion in Chapter 2
forms the framework of the study, which will be discussed in the Chapter 3 of this
thesis.
Based on the discussion, it is understood that tax compliance is a complex
issue which is normally explained using either an economic or non-economic
approach. While both approaches have contributed to explain tax compliance
issues, this study uses the behavioural approach to examine the factors that
contribute to the ethical decision making of tax professionals, since it is considered
more appropriate and relevant to the context of the study.
The review on the TRA and TPB also suggests the relevance of these
theories in explaining behaviour. The central idea of both theories, which is to
predict intention for behaviours which are goal-directed, is considered appropriate
in examining the tax compliance behaviour of taxpayers since the act of complying
with the tax law is goal-directed. However, this study will apply the TPB, since the
various roles of tax agents may put them in conflicting positions and thus there is a
possibility that they are in incomplete volitional control in making decisions. In
addition to that, tax compliance is a complex issue, and since the flexibility of the
TPB allows for the addition of other factors to explain behaviour, this suggests the
relevance of using TPB in this study. Despite the TPB has been widely used in
other areas of research and capable of explaining behaviour, the review of past
105
studies indicates that its application in tax studies is still limited, which suggests
that it could be worthwhile to explore TPB in the tax context.
This chapter also reviews relevant past studies on attitudes, subjective
norms and perceived behavioural control in a tax context, and in ethical decision
making. The discussion suggests that attitude and subjective norms are relevant in
determining the tax compliance behaviour of taxpayers. However, the perceived
behavioural control has mixed support in explaining the compliance behaviour of
taxpayers towards tax.
The importance of ethics in tax compliance studies is also highlighted in
this chapter which reveals that studies on ethics in a tax context have been
conducted on various aspects. The discussions in this chapter also show that studies
examining the ethical sensitivity of tax agents are still scarce, despite its
importance. Hence, after considering the advantages and weakness of using Rest’s
(1986) Model, this study uses the ethical sensitivity as postulated by Rest’s (1986)
Model, to examine the decision making of tax agents while performing their roles.
The ethical sensitivity in this study is measured using the Multidimensional Ethics
Scale (MES) originally proposed by Reidenbach and Robin (198; 1990) in
marketing and later refined by Cruz et al. (2000) in the tax context. The MES
elements will be discussed further in Chapter 4, Research Methodology of this
thesis.
Another factor which is found to be relevant in explaining the tax
compliance behaviour of tax agents is the influence of culture. Since the concept of
culture is itself complex, this study proposes the use of Hofstede’s framework to

106
capture the influence of culture in the ethical decision making of tax agents after
accounting for its advantages and weaknesses. The discussion on culture starts with
the broad concept of culture before delving into Hofstede’s (1980) National
Cultural Dimensions. The review of the influence of culture in tax compliance and
decision making in this chapter indicates mixed findings.
Notwithstanding all the reviewed studies contribute to understanding the
influence of culture in tax compliance, little is known about the influence of
Hofstede’s (1980) cultural dimensions with respect to ethical decision making of
tax agents or taxpayers in complying with the tax law which provides an interesting
avenue for further research. The discussions in this chapter lead to the development
of the research framework and hypotheses which are presented in Chapter 3.

107
CHAPTER 3
RESEARCH FRAMEWORK AND HYPOTHESES
DEVELOPMENT
3.0 Introduction
This chapter presents the conceptual research framework and the
hypotheses development for the study. The chapter begins by presenting the
proposed conceptual framework of the study by extending the Theory of Planned
Behaviour (TPB) with ethical sensitivity and culture. This is followed by the
discussion on the development of the hypotheses. The last section summarizes the
chapter.
3.1 Conceptual Framework
The main objective of this study is to examine some selected factors that
influence the ethical decision making of tax agents in Malaysia and New Zealand
while performing their engagement roles. To meet this objective, the researcher
developed a formal conceptual framework so that the relationship between the
selected factors with compliance behaviour of tax agents while performing their
roles could be empirically examined.
Past studies suggest that the Theory of Planned Behaviour (TPB) postulated
by Ajzen (1991), an established behavioural model, has been successful in
explaining human behaviour in various fields (Madden et al., 1992; Armitage &
Conner, 2001; McEachan et al., 2011). A review of past studies in Chapter 2 also
suggests that the TPB has gained support in explaining the compliance behaviour

108
of taxpayers. As a result, the conceptual framework of this study draws mainly
from the TPB to examine the compliance behaviour of tax agents in Malaysia and
New Zealand.
The TPB proposes that the behaviour of a person is directly influenced by
the intention and the perceived behavioural control that a person possess. In
addition, the intention to perform behaviour is motivated by a person’s attitude,
subjective norms and the perceived behavioural control of that person. Behavioural
intention also functions as a proxy for actual behaviour in situations when it is
difficult to measure actual behaviour (Ajzen, 1991; O’Connor and Armitage,
2004). Since gaining access to tax agents is difficult for the researcher to measure
the actual behaviour of tax agents while performing their engagement roles, the
intention to comply with the tax laws is regarded as a substitute for actual
compliance. Previous studies in accounting and taxation, such as Bobek and
Hatfield (2003), Buchan (2005) and Saad (2011), used a similar approach to treat
intention as a proxy for actual behaviour in explaining the influence of the elements
in TPB in complying with the tax laws.
Despite there is considerable support for the use of the TPB in explaining
human behaviour, the theory allows for the addition of other factors into the model
to increase the power of the TPB in predicting human behaviour (Ajzen, 1991).
One of the important factors in tax compliance studies as suggested by prior studies
in Chapter 2 is ethics. An aspect of ethics among tax agents that is suggested to be
explored further is the ethical sensitivity (Tan, 2006) which past studies have
suggested to influence the intention of accountants to act ethically (Collins, 2000).
This study proposes to include ethical or moral sensitivity as postulated by Rest

109
(1986), due to the flexibility of Rest’s (1986) Model, which allows its components
to be examined separately. A review of the Rest’s (1986) Model also suggests that
moral or ethical sensitivity is postulated to contribute to ethical behaviour. This
study adapts the Multidimensional Ethics Scales (MES) refined and applied by
Cruz et al. (2000), which has been tested in tax context, to measure the ethical
sensitivity of tax agents in complying with the tax laws.
Since ethical values are part of the culture (Ferrell & Gresham, 1985;
Hofstede, 1991) and tax compliance studies always involve an ethical
consideration, namely whether or not to comply with the tax laws, the study also
proposed to include culture as another factor to better explain the tax compliance
behaviour of tax agents in Malaysia and New Zealand. The importance of culture
in tax context has been recommended and supported in previous studies (see for
instance Kirchler, 2007; Torgler and Schneider, 2007; Chau and Leung, 2009).
However, the lack of uniformity in measuring culture, has led to mixed findings on
the importance of culture in the tax context (Kirchler, 2007). The review of past
studies in Chapter 2 suggests that while Hofstede’s (1980; 1991) cultural
dimensions have weaknesses in explaining culture, based on the considerable
support, they also have the potential to describe culture in business practices. After
considering the criticisms and the potential for Hofstede’s (1980; 1991) cultural
dimension to explain the culture, this study proposes to operationalize the National
Cultural Dimensions posited by Hofstede (1980) to measure the influence of
culture in the ethical decision making of tax agents while performing their roles.
The review of past studies in Chapter 2 leads to the proposed conceptual
framework as depicted in Figure 3.1. The conceptual framework in Figure 3.1

110
proposes that the tax agents’ intention to comply is influenced by their attitudes
towards complying with the tax laws, the influence of subjective norms (important
others), the perceived behavioural control of tax agents, their ethical sensitivity and
finally, their culture. The proposed model is already complex and considered
sufficient to examine the tax compliance behaviour of tax agents since ethical
sensitivity and culture are assumed to be multidimensional which require first and
second order factor analyses. The proposed model is then tested on two tax
scenarios: overstating tax expense and understating income.
Figure 3.1 Conceptual framework of tax agents’ compliance behaviour with
tax law while performing their roles
Key: -------- indicates that the path is not tested in the study.
Attitudes
towards
behaviour
Subjective
norms
Perceived
behavioural
control
Ethical
sensitivity
Intention to
comply with
tax laws
Culture
Compliance
behaviour to
tax

111
The review of past studies in Chapter 2 of this thesis suggests that other
researchers have examined the above mentioned factors in understanding tax
compliance behaviour of either taxpayers or tax agents. However, the current study
is different in several ways. First, the review in Chapter 2 indicates that many
studies on tax agents were conducted in a single country (see for instance Attwell
and Sawyer, 2001; Singh, 2003; Buchan, 2005; Bobek and Robin, 2007;
Hasseldine et al., 2012). A recent interview study comparing the accountants in the
United Kingdom and Ireland by Doyle et al. (2009) suggests that comparative
studies involving tax agents could provide interesting insights into understanding
the wider context of tax compliance behaviour.
This study, which uses tax agents as a sample, is comparative in nature,
comparing two different cultures, Malaysia and New Zealand. While there are
studies in accounting and tax context which have compared Malaysia and New
Zealand (for instance Yeoh (1999) who examined the accounting education,
Goodwin and Goodwin (1999) on ethical judgment among business students and
Saad (2011) who looked into the tax compliance behaviour of individual
taxpayers), to the researcher’s knowledge this is the first study to compare the
compliance behaviour of tax agents in Malaysia and New Zealand. Not only the
findings of this study could contribute to the scarcity of literature in the tax
compliance behaviour of tax agents especially in the Asia-Pacific region, the study
is also aligned with the call for more research in cross-cultural context.
Second, in a broader context, the synthesis of previous studies in tax
compliance, such as Richardson and Sawyer (2001), found that past studies in
taxation have mainly used a single approach of inquiry, for instance the use of

112
quantitative method (either survey or experimental design) to understand a
phenomena under study. While the positivist mode of enquiry (the quantitative
method) has dominated and contributed to understanding tax issues, Oats (2012)
recently suggests the use of interpretivist modes of inquiry (which could be
translated into using qualitative approach) for research in taxation to continue to
evolve.
Over the years, research in other fields progressively applies the mixed
method approach in understanding knowledge (Creswell & Plano Clark, 2011).
Given the multidisciplinary nature of tax studies, McKerchar (2010) argues that the
use of mixed method approach could become an alternative to understand
knowledge in the tax context. Since there is no single best approach in tax studies,
the use of a mixed method approach in tax, according to McKerchar (2010), could
address different objectives, complement one method with the others and
strengthen the findings. A recent example of a published study using tax agents as
samples in a mixed method approach study is provided by Hasseldine et al. (2012),
for understanding the importance of tax knowledge in the UK.
Due to the potential of the mixed methodical approach in providing richer
information to understand the ethical decision making of tax agents in Malaysia
and New Zealand while performing their engagement roles, this study uses a mixed
method approach in its design which is explained more in the next chapter. The
‘mixed’ is implied first, by using two different streams of inquiries in a single
study. In this case the survey responses are further explained in the interview.
Secondly, it is implied at the sampling stage when respondents from the survey
self-determined themselves to participate in the interviews.

113
Third, Jackson and Milliron (1986) and Richardson and Sawyer (2001)
agreed that the issue of measuring ethics in tax compliance remains unresolved
which contributed to the mixed findings on the influence of ethics in tax
compliance behaviour. A review of past ethics studies by Kujala et al. (2011)
suggest that the Multidimensional Ethics Scale (MES) developed by Reidenbach
and Robin (1988; 1990) is commonly used to measure ethics. While there are
studies in New Zealand such as Tooley (1992), Attwell and Sawyer (2001), and in
Malaysia, for instance Singh (2003), which examined the influence of ethics in
ethical decision making or moral reasoning of tax agents, none of these studies
used MES to measure ethics in tax compliance. The contribution of previous
studies using ethics as a single dimensional concept is acknowledged in explaining
the influence of ethics in tax compliance behaviour. However, testing the MES in
the context of tax compliance as proposed in this study provides an opportunity to
understand the influence of ethical sensitivity in the tax compliance behaviour of
tax agents from a different perspective, as a multidimensional concept.
Fourth, the review in Chapter 2 suggests that the application of Hofstede’s
(1980) cultural dimensions in tax studies is still limited which provides an
opportunity for further examination. The review of Hofstede’s (1980) cultural
dimensions in Chapter 2 also implied that culture could be perceived as a
multidimensional concept which consists of Power Distance, Individualism-
Collectivism, Masculinity–Femininity and Uncertainty Avoidance. In this current
study, it is proposed that ethical sensitivity and culture are initially subject to first
order factor model to confirm that tax agents form their perceptions on the
respective ethical sensitivity (MES) and cultural (Hofstede’s 1980) dimensions.

114
Two second order factor models are later developed to combine the overall
perceptions of ethical sensitivity and culture respectively. Thereafter, the influence
of ethical sensitivity and culture is examined on the tax agents’ compliance
behaviour.
Fifth, in addition, this study uses the structural equation modelling (SEM)
approach to simultaneously examine a set of interrelated dependent and
independent variables in understanding the tax compliance behaviour of tax agents
in Malaysia and New Zealand. Notwithstanding that SEM has been widely applied
in other area of social science research such as marketing and information systems
(Urbach & Ahlemann, 2010; Hair et al., 2012; Ringle et al., 2012), the use of SEM
in tax studies especially in Malaysia and New Zealand is still limited which
provides opportunities for further exploration of SEM in tax studies.7
Finally, it is acknowledged that other prior studies in accounting,
particularly in tax, may have examined the factors independently, used the TPB or
combined similar factors in a single model (see for instance Bobek and Hatfield,
2003; Trivedi et al., 2005; Bobek et al., 2007b; Blanthorne and Kaplan, 2008;
Saad, 2011). Buchan (2005), for example, used the TPB, moral sensitivity and
instrumental ethical climate to explain the behaviour of public accountants in five
firms located in a state in the Northeast of the US. Buchan’s (2005) study also used
MES to measure moral sensitivity but the scenarios were in accounting context and
not specifically in tax contexts. Furthermore, Buchan’s (2005) study also used
different scenarios to test the TPB, moral sensitivity and instrumental climate.
7 Recent studies in Malaysia and New Zealand which have applied SEM in the context of taxation
are provided by Saad (2010; 2011) and Smart (2012).

115
In this current study, the proposed model consists of the TPB, ethical
sensitivity and culture. While the measurement scales for the TPB were adapted
from Buchan’s (2005) study and MES is used to measure ethical sensitivity, the
researcher developed two tax scenarios based on prior tax studies and used the
same tax scenarios to measure the influence of ethical sensitivity and culture.
Furthermore, culture in this study is measured using Hofstede’s (1980) cultural
dimensions and the model is tested on tax agents in two different countries. Based
on the foregoing discussions, it could be suggested that this study is different from
previous tax compliance behavioural studies and has the potential to contribute to
tax literature and the accounting profession.
3.2 Hypotheses Development
The key objective of this study is to examine some selected factors that may
influence the ethical decision making of tax agents in Malaysia and New Zealand
in complying with the tax law while performing their roles. For that purpose, the
study uses the TPB which consists of attitudes toward behaviour, subjective norms
and perceived behavioural control as the foundation to explain tax agents’
compliance behaviour with the tax laws while performing their roles. To further
understand the tax agent’s compliance behaviour with the tax laws, the original
TPB is extended with another two variables, namely ethical sensitivity and culture.
To answer the research questions through empirically testing the proposed tax
compliance model demonstrated in Figure 3.1, hypotheses were developed based
on the review of past studies set out in Chapter 2. In brief, the objectives of the
study, the research questions and the hypotheses, are mutually interrelated to

116
explain the tax compliance behaviour of tax agents in Malaysia and New Zealand
while performing their engagement roles.
As this study is comparative in nature, before examining the relationship of
the variables in the conceptual framework, it is necessary to compare the overall
perceptions of tax agents in Malaysia and New Zealand with regard to the TPB
elements, the MES and the Hofstede’s (1980) National Cultural Dimensions in the
context of tax compliance. The following three research questions and the
respective hypotheses focused on the overall perceptions by tax agents in this study
with regard to the Hofstede’s National Cultural Dimensions, TPB and MES with
tax compliance:
1. Do tax agents in Malaysia and New Zealand indicate the same level of
perceptions with regard to Hofstede’s (1980) National Cultural
Dimensions in complying with the tax laws?
H1: There is no significant difference between tax agents in Malaysia and
New Zealand with regard to the Hofstede’s (1980) National Cultural
Dimensions in complying with the tax laws.
2. Do tax agents in Malaysia and New Zealand have the same level of
perceptions in relation to the TPB elements in complying with the tax
law while performing their roles?
H2a: There is no significant difference in the level of perceptions in relation
to the intention to comply, attitudes towards behaviour, subjective norms
and perceived behavioural control between tax agents in Malaysia and
New Zealand in the overstating tax expense scenario.

117
H2b: There is no significant difference in the level of perceptions in relation
to the intention to comply, attitudes towards behaviour, subjective norms
and perceived behavioural control between tax agents in Malaysia and
New Zealand in the understating income scenario.
3. Do tax agents in Malaysia and New Zealand have the same level of
perceptions in relation to the dimensions in Multidimensional Ethics
Scales (MES)?
H3a: There is no significant difference in the level of perceptions between
tax agents in Malaysia and New Zealand with regard to the dimensions
of MES in overstating tax expense scenario.
H3b: There is no significant difference in the level of perceptions between
tax agents in Malaysia and New Zealand with regard to the dimensions
of MES in understating income scenario.
The review in Chapter 2 suggests that there are previous studies which have
compared Malaysia and New Zealand in an accounting or tax context. There are
also studies which have used the TPB or Hofstede’s (1980) National Cultural
Dimensions, either independently in Malaysia and New Zealand, or comparing the
influence of these variables with respondents in Malaysia and New Zealand in
business studies. However, the absence of literature involving tax agents in
Malaysia and New Zealand which has operationalized the TPB elements, MES and
Hofstede’s (1980) National Cultural Dimensions, suggest that prior evidence is not
sufficient to conclude the direction of any relationship between the TPB, ethical
sensitivity and culture with tax compliance to guide this current study. Due to this,

118
the current study presents the hypotheses in their null form. It is also noteworthy to
recognize that accounting profession is subject to the influence of professional
bodies existed in a particular country. The close monitoring through codes of ethics
for instance implies that professional bodies could have a powerful influence on the
accounting profession which could diminish for instance the impact of national
culture in the ethical decision making of professional accountants (Cohen et al.,
1996).
Once the abovementioned hypotheses are tested, the study continues with
testing the relationships outlined in the proposed conceptual framework. The
following hypotheses are developed with respect to the relationship of the TPB
items, ethical sensitivity and culture in explaining the tax compliance behaviour of
tax agents in Malaysia and New Zealand while performing their roles in two tax
scenarios, overstating tax expense and understating income. To ensure consistency,
the numbering of the subsequent hypotheses follows the preceding hypotheses.
3.2.1 Attitude towards Tax Compliance
Ajzen (1991) contends that attitude towards a behaviour is the evaluation of
an individual whether a particular behaviour leads to favourable or unfavourable
outcomes. An individual is likely to perform a particular behaviour if the outcome
from performing the behaviour is perceived as positive rather than negative. In the
context of tax compliance, an individual is likely to comply with the tax law if the
outcomes from complying with the tax law are perceived as positive rather than
negative. Consistent with the arguments postulated in the TPB, that favourable
attitude perception towards a behaviour leads to performing the respective
behaviour, previous studies in tax compliance as discussed in Chapter 2 have

119
documented positive influence between the attitude and intention to comply with
the tax law.
The discussion in Chapter 2 also reveals the scant literature in Malaysia and
New Zealand with respect to applying the TPB in tax context especially on tax
agents. For instance, a recent study by Saad (2011) in Malaysia on salaried
taxpayers found a positive relationship between attitude and intention to comply
with the tax law. However, the findings could not be conclusively applied on the
current study considering that tax agents whose profession is guided by
professional conduct may have different ethical considerations in their decision
making compared to the public (salaried) taxpayers. The current study proposes the
following hypotheses:
4. Does attitude towards tax compliance significantly influence the tax
agents in Malaysia and New Zealand in complying with the tax laws?
H4: Attitude towards tax compliance significantly influences the tax agents
in Malaysia and New Zealand in complying with the tax laws.
3.2.2 The Influence of Subjective Norms in Tax Compliance
Subjective norms refer to the social pressure that an individual faces
whether or not to perform a specific behaviour. According to Ajzen (1991), human
beings form their beliefs from people important to them, whether these people
approve or disapprove their behaviour, and whether these important other
themselves perform the behaviour. The TPB postulates that if important others
approve or perform the behaviour, there is a high possibility that an individual
might also perform the behaviour. In tax compliance, the discussion in Chapter 2

120
suggests that previous studies have documented mixed findings on the influence of
subjective norms. This is possibly because the concept of ‘norm’ itself is difficult
to operationalize (Kirchler, 2007). While there is considerable evidence from other
tax jurisdictions on the influence of subjective norm in tax compliance, little is
known about this relationship in the context of tax agents in Malaysia and New
Zealand. Hence, this study proposes the following hypotheses:
5. Does subjective norm significantly influence the tax agents in Malaysia
and New Zealand in complying with the tax laws?
H5: Subjective norm significantly influences tax agents in Malaysia and
New Zealand in complying with the tax laws.
3.2.3 Perceived Behavioural Control and Tax Compliance
Perceived behavioural control describes the ability of an individual to have
control and the perceived ease or difficulty in performing the behaviour. The TPB
suggests that a positive attitude and strong subjective norms towards intention does
not guarantee an individual to perform a particular behaviour in the absence of
control to perform the behaviour. Perceived behavioural control exists from
personal and environmental factors such as having the skills and opportunities to
engage in a particular behaviour (Fishbein & Ajzen, 2010). An individual is likely
to perform a particular behaviour if the perceived behavioural control is high
(Ajzen, 1991).
Past studies, as presented in Chapter 2, suggest that the relationship
between perceived behavioural control and tax compliance behaviour is not well
supported which suggests for more exploration on this factor. Since tax agents have

121
the expertise in interpreting the tax law, there is a possibility that tax agents
indicate high perceived behavioural control which leads to performing the specific
behaviour, in this study, overstating the expenses and understating the income for
tax purposes. However, due to the lack of literature to support the relationship
between perceived behavioural control and tax compliance behaviour in the context
of tax agents in Malaysia and New Zealand, this study proposes the following non-
directional hypotheses:
6. Does perceived behavioural control significantly influence the tax agents
in Malaysia and New Zealand in complying with the tax laws?
H6: Perceived behavioural control significantly influences tax agents in
Malaysia and New Zealand in complying with the tax laws.
3.2.4 Ethical Sensitivity and Tax Compliance Behaviour
The ability to recognize the moral issue is considered as an important factor
which could lead to ethical decision making (Rest, 1986). Jones (1991) argues that
an individual who fails to recognize a moral issue is unable to make an ethical
decision and based the decision only on economic rationality. The ability to
recognize moral issues according to Jones (1991) will result into two conditions:
the impact to others, and the choice that has to be made. The review of past studies
in Chapter 2 suggests that in general there are mixed findings on the importance of
ethics in tax compliance behaviour. The review also suggests that the effect of
ethical sensitivity in tax compliance is less explored.
In the context of tax agents and tax compliance, past studies in Chapter 2
suggest that if tax agents could recognize moral issues, there is greater possibility

122
for tax agents to comply with the tax law. However, findings from prior studies
indicate that this proposition is not well supported and requires further
examination. Past studies in tax compliance in Chapter 2 also suggest that the
absence of standard measures for ethics contribute to the mixed findings on the
influence of ethics in tax compliance, and there is a possibility to perceive ethics as
a multidimensional concept. Since there is no prior documented study on the
relationship between ethical sensitivity and tax compliance in Malaysia and New
Zealand applied to tax agents, the following hypotheses are proposed for the
current study:
7. Do tax agents in Malaysia and New Zealand perceive ethical sensitivity
as a multidimensional concept?
H7: Tax agents in Malaysia and New Zealand perceive ethical sensitivity as
a multidimensional concept.
8. Does ethical sensitivity significantly influence tax agents in Malaysia and
New Zealand in complying with the tax laws?
H8: Ethical sensitivity significantly influences tax agents in Malaysia and
New Zealand in complying with the tax laws.
3.2.5 The Influence of Culture in Tax Compliance
Complying with the tax laws involves ethical consideration and culture
influences both ethics and values as evidenced in past accounting research
reviewed in Chapter 2 of this thesis. The review of prior studies in Chapter 2 also
suggests that culture is an important element which needs to be considered in
understanding the tax compliance behaviour. However, the review of past studies

123
also indicates that culture is a complex concept to operationalize in tax context, and
as a result there are studies which have highlighted culture as a multidimensional
concept by using Hofstede’s (1980) National Cultural Dimensions to measure
culture in tax compliance.
Similar to the findings on the importance of culture in general, the
operationalization of Hofstede’s (1980) cultural dimensions to measure culture also
produced mixed results. Despite Hofstede’s (1980) cultural dimensions having
been widely tested in other areas of research, the use of Hofstede’s (1980) cultural
dimension to measure culture in tax context is still limited and requires further
exploration. The lack of evidence to support the link between culture which is
measured using Hofstede’s (1980) National Cultural Dimensions and tax
compliance in the context of tax agents lead to the following hypotheses:
9. Do tax agents in Malaysia and New Zealand perceive culture as a
multidimensional concept?
H9: Tax agents in Malaysia and New Zealand perceive culture as a
multidimensional concept.
10. Does culture significantly influence tax agents in Malaysia and New
Zealand in complying with the tax laws?
H10: Culture significantly influences tax agents in Malaysia and New
Zealand in complying with the tax laws.
3.3 Summary
This chapter presents the proposed conceptual framework as a guide to test
the variables under study. The proposed conceptual framework is later translated

124
into formal hypotheses to be tested in the current study. Therefore, the discussions
in this study are centralized on the operationalization of the underlying theory, the
Theory of Planned Behaviour (TPB), ethical sensitivity and culture with tax
compliance behaviour. In addition, this chapter also discusses the relevance of this
study to tax compliance behaviour by examining the similarities and differences
with other prior studies.
Prior to testing the relationship of the proposed links in the conceptual
framework, given that the current study is a comparative in nature between tax
agents in Malaysia and New Zealand, there is a need to test the overall perceptions
of tax agents with respect to the elements of the Hofstede’s (1980) National
Cultural Dimensions, the TPB items and MES. The Hofstede’s (1980) National
Cultural Dimensions are used to measure culture, and the MES items are used to
measure ethical sensitivity in this study. Three preliminary hypotheses, Hypotheses
1, 2 and 3, were developed to examine the overall perceptions of tax agents with
regard to the Hofstede (1980) National Cultural Dimensions, TPB items and MES.
The relationships of the variables proposed in the conceptual framework
with tax compliance behaviour were then translated into seven hypotheses. The
first three main hypotheses are related to the TPB. Hypothesis 4 related to the
influence of attitude towards tax compliance behaviour of tax agents. Hypothesis 5
to the influence of subjective norms and compliance behaviour of tax agents and
Hypothesis 6 presents the proposed relationship between perceived behavioural
control and tax agents. Hypothesis 7 examines whether tax agents in Malaysia and
New Zealand perceive ethical sensitivity as a multidimensional construct,
Hypothesis 8 proposes the relationship between ethical sensitivity and tax

125
compliance of tax agents. Hypothesis 9 tests whether culture is formed by a
multidimensional concept and finally, Hypothesis 10 proposes the link between
culture and tax compliance behaviour of tax agents in the study. The next chapter
addresses the research methods, explaining the data collection and analysis to test
the relationships postulated in the conceptual framework.


127
CHAPTER 4
RESEARCH METHODOLOGY
4.0 Introduction
This chapter presents the research methodology for the study. In this
chapter, the researcher discusses the research paradigm, the methodology being
used which incorporates the emic and etic approaches in cross-cultural research,
and the mixed method research design. The discussions also involved the sampling,
data collection, and analysis procedures for both quantitative and qualitative
approaches.
4.1 Pragmatism – The Research Paradigm
Many factors may be involved in the decision to conduct research. The
personal values, interest, experience of the researcher (Bryman & Bell, 2011), and
the availability of the funding (Feilzer, 2010) may shape the research. A study also
implies what knowledge and how the researcher discovers the knowledge of the
world (McKerchar, 2008). In doing so, this study applied the pragmatism
paradigm. The remaining of this subsection outlines the pragmatism as understood
by the researcher in this study.
The word ‘paradigm’ was first introduced by Kuhn (1970), which he refers
to as the “accepted model or pattern”. Paradigm or worldview is the shared beliefs
and values of researchers (Creswell & Plano Clark, 2011) in which researchers who
believe in a shared paradigm would use the same rules and standards in conducting
their research. Generally, there are two main opposing paradigms, namely positivist

128
and naturalist (Lincoln & Guba, 1985); positivism and interpretivism (McKerchar,
2008; Bryman & Bell, 2011) or positivism and non-positivism (Brand, 2009;
McKerchar, 2010), which influence researchers in their study approach.8
The positivism paradigm suggests that the concept, principles, and
procedure of understanding the natural science could be imitated to solve the
problem in the social world. The positivist believes there is a single reality in social
phenomena and this reality could be discovered through objective enquiry (Feilzer,
2010; Bryman & Bell, 2011) resulting in accurate knowledge (Brand, 2009). To a
positivist, the object being studied is independent of the researcher and knowledge
is derived from the direct measurement of phenomena (Krauss, 2005) which
underlies the quantitative approach in data collection and measurement.
On the contrary, there is the argument that human behaviour in the social
world is different from the object in natural science and therefore a different
approach is required to understand the social world. Interpretivism is the paradigm
that recognizes the existence of subjective meanings in understanding phenomena
(Brand, 2009) by acknowledging the differences between humans. Unlike the
positivist, the proponents of interpretivism suggest that meaning is derived from
the experience of the social actor, and therefore there is no pre-given concept in
understanding social phenomena (Bryman & Bell, 2011). To fulfil this central idea,
interpretivism is normally associated with qualitative approach (Brand, 2009) and
allows the influence, interaction between the researcher, and the subject being
examined in the meaning making of social phenomena (Bryman & Bell, 2011).
8 Different terminologies have been used such as “naturalist”, “interpretivism” and “non-
positivism”. However, they refer to the same paradigm.

129
Applying the concepts of positivism and non-positivism to studies in taxation,
McKerchar (2012b) suggests that the use of deductive reasoning and quantitative
approach reflect the positivism paradigm. In contrast, inductive reasoning and
qualitative approach imply the non-positivism research paradigm in understanding
tax issues (McKerchar, 2012b).
As a result of the paradigm ‘wars’ and the ‘incompatible thesis’ debates
(Johnson & Onwuegbuzie, 2004, p. 14) between the positivist who favours the
quantitative method at one end and the interpretivist who believes in using
qualitative method for knowledge enquiry at the other end, a middle ground
paradigm, the pragmatism, provides another alternative to understand social
phenomena. Pragmatism is not the only one paradigm, as critical realism also lies
between the positivism and non-positivism (McKerchar, 2010). However,
pragmatism is more commonly used and favoured in research enquiry using mixed
method approach (Johnson & Onwuegbuzie, 2004; Johnson et al., 2007; Creswell,
2009; Feilzer, 2010; Creswell & Plano Clark, 2011).
The pragmatism paradigm is less concerned with the philosophical
discussions on the existence of single reality or multiple realities (Creswell, 2009;
Feilzer, 2010; McKerchar, 2010) or whether knowledge could be discovered only
by subjective perceptions (Wheeldon, 2010). Instead, pragmatism as a research
paradigm is concerned more about the appropriate approach to solving the research
problems. It is also about finding the appropriate methods to answer what the
researcher wants to know (Feilzer, 2010) by using both the quantitative and
qualitative approaches (Creswell, 2009), since a pragmatist believes that multiple
paradigms can be used to address a research problem (Creswell & Plano Clark,

130
2011).9 After all, “the research method(s) chosen should be those that provide the
best opportunities for answering research questions” (Malina et al., 2011, p. 68)
reflects the possible use of pragmatism in a mixed method research. Positioning
oneself as a pragmatist in conducting research suggests that the researcher needs to
be flexible, because the researcher has to accept that human characters are
unpredictable, which may result in unexpected emergence of data (Feilzer, 2010).
To a pragmatist, truth, meaning, and knowledge could change over time and
what is currently obtained is regarded as provisional truth (Johnson &
Onwuegbuzie, 2004).10 This argument is consistent with McKerchar (2010, p. 11)
in tax studies, who commented that “research is about discovery; it is rarely about
truth, because realistically there is no single absolute truth”. With respect to tax
studies, McKerchar (2008; 2010) also suggests that it is appropriate to use
pragmatism research paradigm in tax studies since pragmatism permits tax
researchers to use mixed method approach in understanding tax issues.
The aforesaid discussions imply that the pragmatism paradigm is suitable to
be used in understanding some selected factors that influence tax agents in
Malaysia and New Zealand in their decision-making while performing their
engagement roles. Applying the pragmatism paradigm for this study allows the
researcher to use a quantitative method (survey) and a qualitative method
(interview), which could provide a more comprehensive understanding of the issue
9 However, as commented by Creswell and Plano Clark (2011), this does not imply that researchers
adopting pragmatism do not have to follow the correct procedures in conducting quantitative or
qualitative studies.
10 See Johnson and Onwuegbuzie (2004, p.18) for comprehensive attributes of pragmatism as a
research paradigm.
131
under study. Furthermore, given the sensitive nature of the issue under study and
tax agents are busy people, the use of pragmatism provides some flexibility for the
researcher in conducting the whole research.
4.2 The Emic and Etic Approaches in Cross-Cultural Research
A common feature of cross-cultural research is its comparative nature
which involves at least two different cultural populations from two different
nations, such as in this study, or two different ethnics in a single country (Vijver &
Leung, 1997). In cross-cultural research there are two approaches to understanding
the role of culture; from the inside perspective known also as emic, (which explains
culture from the particular society itself), or from the outside perspective also
known as etic, (which describes the differences across culture using constructs
applied equally in other culture), (see Morris et al., 1999; Hunter, 2006; Matsumoto
& Juang, 2008). Fontaine and Richardson (2003) argue that to find the similarities
in two or more different cultures, an etic approach has to be used since it assumes
that in all cultures there are universal constructs which can be recognized and
scientifically measured.
On the other hand, to find differences in cultures, an emic approach has to
be applied because in most cultures there are unique attributes associated only with
that particular culture. Indeed, Malhotra et al. (1996) in discussing the
methodological issues in cross-cultural studies, argue that to be deemed as a
“cultural-based study” demands the emic perspective whilst to fulfil the “cross”
requires the etic perspective. Thus, research instruments in cross-cultural studies
have to reflect both the emic and etic considerations. The emic and etic approaches
are now briefly discussed.

132
In an emic approach, researchers use a specific culture to understand the
problem being studied. Researchers normally used ethnography, interview, and
observation to collect data because the nature of emic dimensions are cultural-
specific. Thus, the emic approach is considered as understanding the role of culture
from the ‘inside’ perspective which is to explain a particular culture using its own
terminology. Conversely, the etic approach uses universal concepts to understand
the problem being studied due to the nature of etic dimensions which are based on
universally acceptable construct. The etic approach is synonymous with the
‘outside’ perspective in identifying culture from a broad, general, and standard
approach (Berry, 1999). Consequently, the etic approach is synonymous with the
use of a survey for collecting data, such as the study by Hofstede (1980) in
understanding the role of different cultures (Morris et al., 1999).
Instead of understanding emic and etic as conflicting approaches in cross-
cultural research, Hofstede (1998), Berry (1999), Helfrich (1999), and Morris et
al. (1999) argue that the fundamental concepts of emic and etic are interdependent
and complementary. Hofstede (1998, p. 19) suggests that:
“The first [emic] without the second [etic] gets stuck in case studies
that cannot be generalized, the second [etic] without the first [emic]
in abstractions that cannot be related to real life. It is almost a
platitude that one needs to find a wise combination of emic and etic
elements”.
Therefore, the data collected using an emic and etic approaches do not
result into a separation but rather as understanding the same issue from two

133
different perspectives. On that basis it is also possible to combine the emic and etic
approaches in a single cross-cultural study.
Culture itself is a complex concept (Hofstede, 2001) which has been
regarded to influence an individual’s ethical reasoning (Brand, 2009) and human
psychological processes such as attitudes, norms, and behaviour (Matsumoto &
Juang, 2008). Consistent with the paradigm, the mixed method approach applied in
this study and the nature of a cross-cultural research, the integration of the emic
and etic approaches as reflected in the use of the survey (etic) and semi-structured
interview (emic) in the data collection process of this study is considered as
appropriate to understand the tax compliance behaviour of tax agents in Malaysia
and New Zealand.
4.3 The Motivation for the Use of a Mixed Methods Approach
In general, quantitative research focuses on the collective viewpoints of
respondents in interpreting the findings and thus diminishes the opinions of a single
respondent. In contrast, qualitative research emphasizes the perceptions of a few
participants and therefore it lacks the ability to be generalized (Creswell & Plano
Clark, 2011). A quantitative research is also more concerned with finding the
relationship between variables while a qualitative research is more interested to
understand the subjective meaning of social phenomena (Harrison, 2013). In a
mixed methods study, both the quantitative and qualitative approaches are
combined to explain the issue being studied using different types of data, methods
of collection, types of analyses, and reporting. Given this flexibility, researchers
could apply the mixed method approach at various phases of the study, namely in
developing the research questions and hypotheses, sampling, data collection,
134
analyses, and in reporting the findings (Creswell, 2009; Creswell & Plano Clark,
2011).
Based on an analysis of 19 definitions of mixed methods research, Johnson et
al. (2007, p. 123) offer the following definition of mixed method research:
“Mixed methods research is the type of research in which a
researcher or team of researchers combines elements of qualitative
and quantitative research approaches (e.g., use of qualitative and
quantitative viewpoints, data collection, analysis, inference
techniques) for the purposes of breadth and depth of understanding
and corroboration.”
Two main features of mixed method studies are: (1) to combine both the
quantitative and qualitative approach; and (2) this combination has to be performed
in a single study (Grafton & Lillis, 2011; Harrison, 2013).11 While mixed method
research does not provide a resolution for all research problems, however,
combining the quantitative and qualitative approaches in a single study could
provide a more comprehensive understanding of the research problem based on
findings from diverse data (Creswell, 2009). Thus, the central idea of conducting a
mixed method research is to increase the credibility and validity of the findings
from different instruments (Wheeldon, 2010), since in mixed methods study the
weaknesses in one method are outweighed by the other method (Patton, 1999;
11 McKerchar (2010), however, suggests that a mixed method research is not necessarily combining
quantitative and qualitative approaches in a single study. Two different methods of enquiry which
come from the same methodological approach, such as using experimental design and a survey
(quantitative approach) in a single study, could also reflect a mixed method study.

135
McKerchar, 2010; Creswell & Plano Clark, 2011).12 The mixed methods approach
also reduce the possibility that the findings from the research are due to the unique
features of the method employed (Patton, 1999; Grafton & Lillis, 2011), and thus
reduces the biases inherent in a mono-method approach (Feilzer, 2010).
Despite the incompatible thesis debate suggesting that the quantitative and
qualitative approaches can never be combined in a single study due to the
differences in their underlying paradigms (Bryman & Bell, 2011; Grafton & Lillis,
2011), over the years mixed methods approach has gained a considerable support in
research (Creswell & Plano Clark, 2011). The mixed methods approach is
considered as “a research paradigm whose time has come” (Johnson &
Onweugbuzie, 2004, p. 14) and “the third major research approach” (Johnson et al.,
2007, p. 112). In the tax context, McKerchar (2010) suggests that the use of mixed
methods in tax studies could address different objectives of the study, inform one
approach from the other at the design or data interpretation stage, and compare
findings from multiple approaches.
Tax compliance behaviour is a complex and sensitive topic because it
involves ethical consideration of whether or not to comply with the tax law. By
incorporating quantitative and qualitative elements in this study, it provides an
opportunity for the researcher to include divergent views which could lead to
deeper and comprehensive understanding of the tax compliance behaviour of tax
agents in Malaysia and New Zealand. The use of a quantitative approach (survey)
in this study allows the researcher to generalize the findings to a population of tax
12 See for instance, Creswell and Plano Clark (2011, pp. 8-11) for comprehensive justifications on
using mixed method approach in research.

136
agents in public practice in Malaysia and New Zealand, and later the issue is
explained further by using qualitative approach, namely the interview which
collected deeper views from interview participants.
4.4 The Mixed Method Research Design for the Study
In conducting a mixed methods study, researchers have suggested a number
of mixed method designs, taking into account whether both quantitative and
qualitative approaches have equal strength or one approach dominates the other.
The order of performing the quantitative and qualitative approaches, either
sequentially or concurrently is also considered. Teddlie and Tashakkori (2006), for
example developed four types of multistrand mixed design based on two
dimensions:
(1) Types of approach or methods employed, and
(2) Number of strands or phases in the study.
Onweugbuzie and Collins (2007) suggested eight mixed method research
designs incorporating the time orientation (concurrent or sequential) and the
relationship of the samples. Creswell (2009) and Creswell and Plano Clark (2011),
on the other hand, suggested six common mixed method research designs
comprising the: convergent parallel, sequential explanatory, sequential exploratory,
embedded, transformative, and multiphase designs.
While there are differences in terms of the number of major research
designs being suggested for mixed method studies, Johnson and Onweugbuzie
(2004), Onweugbuzie and Collins (2007), Creswell (2009), and Creswell and Plano
Clark (2011) agree, that the choice of the appropriate mixed methods research
design has to incorporate several factors. These include the timing of conducting

137
the study, the weightage to be given to each quantitative and qualitative strand, the
choice of subjects as samples for the study, and the interpretation of the findings.
In discussing the mixed method designs, some scholars, such as
Onweugbuzie and Collins (2007), Creswell (2009), Creswell and Plano Clark
(2011), also agree that the mixed methods design may not be restricted to those
being mentioned earlier, and it is also possible that the design emerges during the
progress of the study. Bryman and Bell (2011) also commented that in reality it is
not easy to classify mixed methods studies based on priority (quantitative,
qualitative or equal weight) and sequence of conducting the study, since a
“methodologist cannot create a complete taxonomy of MM designs, due to their
(the designs’) capacity to mutate into other diverse forms” (Teddlie & Tashakkori,
2006, p. 13). This argument is reiterated by Onweugbuzie and Collins (2007,
p.297), for instance, in determining the sample in mixed method study:
“The exciting aspect of mixed methods sampling model is that a
researcher can create more tailored and/or more complex sampling
designs than the ones outlined here to fit a specific research context,
as well as the research goal, research objective(s), research
purpose, and research question(s). Also it is possible for a sampling
design to emerge during a study in new ways, depending on how the
research evolves”.
Based on the above discussion the researcher concludes that the research
design in mixed method studies do not necessarily fall strictly into any type of the
commonly used mixed method designs, as suggested in mixed method literature,
since the design has to report the actual mixed methods process in the study which

138
could evolve once the study progresses. In this study the researcher employs a
cross between sequential explanatory and concurrent mixed method designs with
an identical sample to examine some selected factors that influence tax agents in
their decision-making while performing their engagement roles. For that reason,
only these two relevant designs, the sequential explanatory, and concurrent mixed
method, are further discussed in this section. An identical sample refers to the same
sample members participating in both the quantitative and qualitative phases of the
study (Collins et al., 2007; Onweugbuzie & Collins, 2007).
A sequential explanatory design performs two different phases: the
quantitative phase precedes the qualitative phase (Creswell, 2009). At the first
phase of a sequential explanatory design, quantitative data collection and analysis
are performed by the researcher, and in the second phase the researcher collects
and analyses qualitative data using the same or different samples based on findings
from the first phase (Creswell & Plano Clark, 2011). With respect to sampling, one
method is used to assist the other method. The quantitative data and analysis offer a
general view of the issue being examined, while the qualitative data and analysis
refine and provide further insights into the quantitative phase (Harrison, 2013). In a
typical sequential explanatory design, the qualitative findings complement the
quantitative findings (Creswell, 2009). The quantitative findings and qualitative
results could also be interpreted as overall mixed methods results (Creswell &
Plano Clark, 2011).

139
A concurrent mixed method design,13 on the other hand, is reflected when
quantitative and qualitative data collection and analysis are performed concurrently
in a single study (Creswell, 2009). In a concurrent mixed methods design, both
quantitative and qualitative strands are given equal emphasis since they are being
implemented in the same phase, and data from both strands are also analysed
independently. The findings from both strands are later mixed or compared before
providing overall conclusions (Creswell & Plano Clark, 2011).
The purpose of this study is to understand the factors that influence tax
agents’ compliance behaviour while performing their engagement roles by
extending the Theory of Planned Behaviour (TPB) with cultural and ethical
sensitivity. In this study, the researcher performed both the quantitative and
qualitative methods to understand the issue being examined. The quantitative data
from the survey is used to obtain a general idea or understanding on some selected
factors that influence tax agents in their tax compliance behaviour while
performing their engagement roles by predetermining the variables that the
researcher would like to examine based on the review of past studies. The survey,
however, could only provide a snapshot of the tax compliance behaviour of tax
agents which could explain only the broad concept of the phenomena. This is the
situation since while surveys have been widely used in tax studies (Jackson &
Milliron, 1986; Richardson & Sawyer, 2001), the nature of survey as a method of
enquiry may restrict the type of questions that could be asked (McKerchar, 2012a).
13 Concurrent mixed method design or research is the terminology being used by Johnson and
Onweugbuzie (2004) and Bryman and Bell (2011). Creswell (2009) uses the term ‘concurrent
triangulation strategy’ and Creswell and Plano Clark (2011) use the term ‘convergent parallel
design’.

140
In tax studies, a survey could also be used to obtain interview participants
(McKerchar, 2012b). Therefore, apart from providing general understanding of tax
agents’ compliance behaviour, the survey in this study was also used as a platform
for survey respondents to self-identify their interest to participate in the interview.
To compensate the limitation of survey as a method of enquiry, as well as to
obtain in-depth insights into the factors that influence tax agents in their decision-
making while performing their engagement roles in Malaysia and New Zealand,
the researcher conducted semi-structured interviews about the same time the survey
was disseminated. This was undertaken since a situated, contextual method of
enquiry which is normally associated with qualitative approach, such as interview,
could offer many potential insights (Brand, 2009). Furthermore, in the tax context,
McKerchar (2012b) suggests that the qualitative approach could be used to gain
deeper understanding rather than finding the absolute truth, which is aligned with
the pragmatism paradigm being applied in this study and the emic perspective of a
cross-cultural research. The interview in this study also provides opportunities for
survey respondents to explain further their responses in the survey. The design for
the study is illustrated in Figure 4.1.

141
Quantitative Data Analysis
Descriptive analysis
Structural Equation
Modelling (Partial Least
Squares)
Quantitative Survey Findings
Scores
Factors
Modelling
Discussion of quantitative
survey findings
Quantitative Data Collection
Survey instrument
- Self-reported
questionnaire
Malaysia
- A cross between
systematic random and
snowballing samplings
- Mail Survey
New Zealand
- Systematic random
sampling - Web-based survey
Qualitative Data Collection
Sequential identical sampling
- Self-selection sampling
Interview guide based on
variables asked in the survey
Semi-structured telephone
interview
Qualitative Data
Analysis
Deductive, inductive,
thematic analyses
Reliability and validity
check
Literature Review,
Research Questions
Discussions on findings
from the quantitative
and qualitative methods,
conclusion, limitations,
future recommendations
and implications
Qualitative Interview
Findings
Themes
Discussions of qualitative
interview findings
Figure 4.1 Diagram of the research process to understand tax agents’ tax
compliance behaviour in Malaysia and New Zealand while performing their
engagement role

142
As a result of time constraint in conducting the study and the availability of
interview participants, the above diagram reflects a partially sequential explanatory
and partially concurrent mixed methods design. In a typical sequential explanatory
design, as discussed earlier in this section, the quantitative data gathering and
analysis are performed in the first phase of the study. The qualitative strand is only
performed once the quantitative strand has been completed. In this study, however,
the data collection for the qualitative phase was carried out about the same time as
the survey. This is because in the invitation to participate in the interview, the tax
agents were permitted to choose their own time for the interview. This approach is
considered to be appropriate considering that tax agents are busy people, and
assists with motivating the interview participants to provide answers comfortably,
avoid any bias in the answers as a consequence of the different duration of time
spent in the interview. Furthermore, if the interviews are conducted only after the
quantitative phase is fully completed, as suggested by the typical sequential
explanatory approach, as a result of the time gap there is a possibility that the
interview participants may find it challenging to recall the issues during the later
interview.
The sequential explanatory design in this study is reflected based on the
following features present in this study: (1) qualitative phase, which is used to
facilitate the quantitative findings by providing in-depth insights into the issue
being examined, and (2) the quantitative phase which is used as a platform to
obtain participants in the qualitative phase. The concurrent mixed methods design
in this study is reflected in: (1) the timing of conducting the qualitative phase was
before completion of the quantitative phase (the first phase), (2) the quantitative

143
and qualitative strands which were analysed independently. The design for this
study is consistent with the suggestion by Creswell and Plano Clark (2011) that the
classifications of mixed methods design, only provide a guideline to mixed
methods design and researchers should not “try to ‘type’ their design but to reflect
on the actual practice of mixed method research” (Creswell & Plano Clark, 2011,
p. 281).
4.5 Ethical Clearance
Considering that this study involves human participation and sensitive
issues on tax compliance behaviour of tax agents in Malaysia and New Zealand
while performing their engagement roles, the researcher applied for ethical
clearance from the Human Ethics Committee (HEC), University of Canterbury,
before collecting data for the study. This is to ensure that the content of the study
follows the ethical standards of the HEC. The ethical clearance received from the
HEC was stated in the invitation to participate in the study. In addition, the
researcher also obtained approval from the Economic Planning Unit (EPU) of the
Prime Minister’s Department of Malaysia to collect the data in Malaysia. The
approval from the EPU was also stated in invitation to participate in the study for
Malaysian respondents. The respective approval ethical clearance letters from the
HEC and EPU are attached as Appendices A and B of this thesis.
4.6 Sample Selection in Mixed Method Study
Sampling in mixed methods design is more challenging since the researcher
has to consider both the quantitative and qualitative phases in a single study
(Onweugbuzie & Collins, 2007). Creswell and Plano Clark (2011), for instance,
provide some recommendations to select samples for each commonly mixed

144
method research design. According to Creswell and Plano Clark (2011), in a
typical sequential explanatory design, the participants in the qualitative phase
should come from those who participated in the quantitative phase, since the
qualitative findings are intended to provide in-depth understanding of the responses
from the quantitative phase. Likewise, Creswell and Plano Clark (2011) also
recommend using the same sample population in a concurrent mixed methods
study if the purpose of the findings is to confirm, directly compare, or associate
two different sets of findings in understanding a research issue.
In addition to that, since this study is a cross-cultural study comparing
Malaysia and New Zealand, the choice of samples being studied is another issue
that has to be considered. This is important since in a cross-cultural study, a match
sample has to be used to allow for comparison (Hofstede, 1980; Malhotra et al.,
1996). However, to find a matched sample in every aspect is not practical due to
the constraints on time and resources. Hofstede (1980), for instance, used
respondents working in IBM in a particular country irrespective of their nationality
to be sufficient representativeness of national culture.
In trying to understand the factors that influence tax agents in their
decision-making, this study uses identical samples for both the quantitative and
qualitative phases. This study uses tax agents in public practice as samples to
reflect the reality of tax compliance behaviour of tax agents while performing their
engagement roles. This is also aligned with the suggestion by Loe et al. (2000, p.
200) in a review of empirical studies in ethical decision-making in business where
they state that the use of samples who are practising in the real business world
should be encouraged to “gain face validity in providing research results that will

145
be given serious consideration by practitioners”. The sample selection for both
quantitative (survey) and qualitative (interview) strands is further discussed in the
respective sections.
4.7 Survey
The syntheses by Jackson and Milliron (1986) and Richardson and Sawyer
(2001) suggest that questionnaire survey is commonly used to collect data in tax
studies. This is because a questionnaire survey is effective in collecting responses
for the same set of questions from the samples of the study (Saunders et al., 2003).
In this study, the survey was used to discover general understanding on the
predetermined factors, as discussed in Chapter Two, which may influence tax
agents while performing their roles. The survey was also used to provide an etic
approach, as mentioned in Section 4.2, in understanding the factors that influence
tax agents in their decision-making.
According to Saunders et al. (2003), a questionnaire could be broadly
divided into self-administered and interviewer administered. The self-administered
questionnaire can be further grouped into online questionnaires, postal or mail
questionnaires, and delivery and collection questionnaires. The interviewer-
administered questionnaire consists of telephone questionnaires and structured
interviews. In this study, a self-administered questionnaire survey was used to
obtain the responses of tax agents in examining the factors that influence them in
their decision-making. The following subsections explain further the data
collection for the quantitative phase of the study.

146
4.7.1 Sample selection for the survey
As mentioned in Section 4.6 of this chapter, the samples used in this study
are tax agents in public practice. Due to the availability of the data, the researcher
used different methods to choose the sample for the study in Malaysia and New
Zealand. Malhotra et al. (1996) suggest that in cross-cultural research, different
techniques could be used in choosing samples in different cultures as long as
comparison between cultures is still possible. In this study using tax agents in
public practice in Malaysia and New Zealand is considered to be comparable since
they represent a subsample of the tax agents’ population. The sample selection for
Malaysia and New Zealand is further discussed in the following subsections.
4.7.1.1 Malaysia
Sample selection could be broadly grouped into probability and non-
probability sampling (Bryman & Bell, 2011). The sample in Malaysia was selected
using a cross between systematic random sampling (probability sampling) and
snowballing (non-probability sampling). Systematic random sampling chooses the
kth number of sample from a sampling frame (Sekaran & Bougie, 2010). The
advantage of using systematic random sampling approach is it is easy to use
(Sekaran, 2002). However, the use of systematic random sampling in sample
selection could result in the existence of systematic bias which may lead to the
possibility of drawing inaccurate conclusions from the data and affect the
generalizability of the findings (Saunders et al., 2003; Sekaran & Bougie, 2010). In
snowball sampling, the initial samples in the study are used to identify further
samples (Bryman & Bell, 2011). Snowball sampling is helpful especially when
there is a difficulty to identify samples for the population. However, in snowball

147
sampling, the samples obtained may not represent the population since the earlier
samples may identify further samples which are similar to themselves (Saunders et
al., 2003).
An initial attempt to collect data was made with the assistance of the
Chartered Tax Institute of Malaysia (CTIM) and as a result the sample was
randomly selected by the CTIM. Since this approach did not result in any fruitful
response, the researcher then developed a list of 500 tax agents from the website of
the Malaysian Inland Revenue Board (MIRB) using a systematic random sampling
approach. The tax agents who are listed on the MIRB website are normally those at
high positions, such as director and partner of taxation firms. Therefore, to obtain a
more robust sample, the researcher used a snowballing approach by requesting
those tax agents who were selected from the website to distribute another two sets
of the questionnaire survey packs to their staff. A similar approach has been used
by Singh (2003) in selecting public accountants for samples in his study in
Malaysia. Due to the snowballing approach, there is a possibility that the samples
also consisted of employees of tax agents. However, they are also subject to the
same professional ethical code of conduct since the accounting profession in
Malaysia is governed by the MIA.
4.7.1.2 New Zealand
Similar to Malaysia, the New Zealand data was initially collected with the
assistance of the New Zealand Institute of Chartered Accountants (NZICA), and
thus the sample was randomly selected by the NZICA. Due to the small number of
responses of the survey (n = 6), the researcher decided to ignore the data collected
from this approach. To select the potential respondents for the study, the researcher
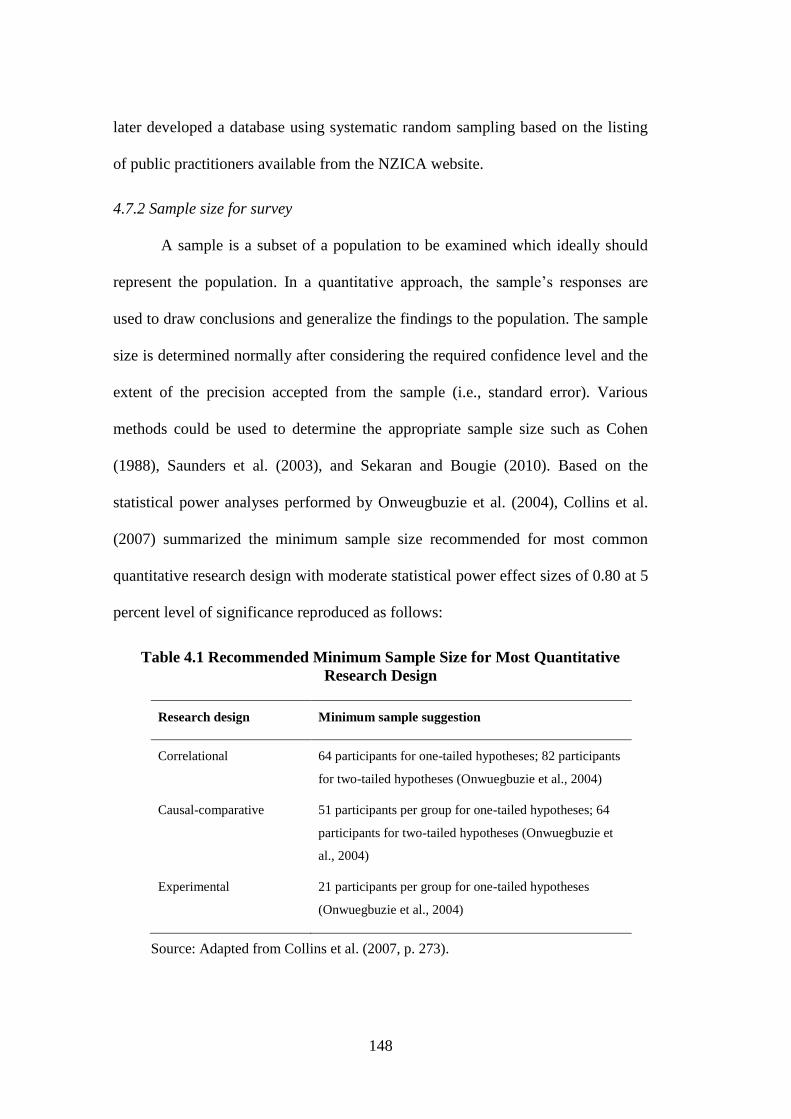
148
later developed a database using systematic random sampling based on the listing
of public practitioners available from the NZICA website.
4.7.2 Sample size for survey
A sample is a subset of a population to be examined which ideally should
represent the population. In a quantitative approach, the sample’s responses are
used to draw conclusions and generalize the findings to the population. The sample
size is determined normally after considering the required confidence level and the
extent of the precision accepted from the sample (i.e., standard error). Various
methods could be used to determine the appropriate sample size such as Cohen
(1988), Saunders et al. (2003), and Sekaran and Bougie (2010). Based on the
statistical power analyses performed by Onweugbuzie et al. (2004), Collins et al.
(2007) summarized the minimum sample size recommended for most common
quantitative research design with moderate statistical power effect sizes of 0.80 at 5
percent level of significance reproduced as follows:
Table 4.1 Recommended Minimum Sample Size for Most Quantitative
Research Design
Research design Minimum sample suggestion
Correlational 64 participants for one-tailed hypotheses; 82 participants
for two-tailed hypotheses (Onwuegbuzie et al., 2004)
Causal-comparative 51 participants per group for one-tailed hypotheses; 64
participants for two-tailed hypotheses (Onwuegbuzie et
al., 2004)
Experimental 21 participants per group for one-tailed hypotheses
(Onwuegbuzie et al., 2004)
Source: Adapted from Collins et al. (2007, p. 273).

149
To determine the appropriate sample size for the study, the researcher relied
on the guideline provided by Krejcie and Morgan (1970) which has simplified the
sample size decision based on the population (N) and sample size (S) depicted as
follows in Table 4.2:
Table 4.2 Table for Determining Sample Size from a Given Population
N S N S N S N S N S N S
10 10 85 70 220 140 440 205 1200 291 4000 351
15 14 90 73 230 144 460 210 1300 297 4500 354
20 19 95 76 240 148 480 214 1400 302 5000 357
25 24 100 80 250 152 500 217 1500 306 6000 361
30 28 110 86 260 155 550 226 1600 310 7000 364
35 32 120 92 270 159 600 234 1700 313 8000 367
40 36 130 97 280 162 650 242 1800 317 9000 368
45 40 140 103 290 162 700 248 1900 320 10000 370
50 44 150 108 300 169 750 254 2000 322 15000 375
55 48 160 113 320 175 800 260 2200 327 20000 377
60 52 170 118 340 181 850 265 2400 331 30000 379
65 56 180 123 360 186 900 269 2600 335 40000 380
70 59 190 127 380 191 950 274 2800 338 50000 381
75 63 200 132 400 196 1000 278 3000 341 75000 382
80 66 210 136 420 201 1100 285 3500 346 1000000 384
Source: Krejcie and Morgan (1970, p. 608).
Based on Table 4.2, the recommended sample size for Malaysia is 322
while for New Zealand it is 341. Prior tax compliance studies involving surveys,
however, indicate the possibilities of obtaining a low response rate (see for instance
Tran-Nam & Karlinsky, 2008; Mohd Isa, 2012). As a result, the researcher decided
to consider a larger sample size of 1,500 for each country.

150
4.7.3 Pilot testing
Pilot testing is normally conducted before disseminating the survey to
potential respondents of the study. The purpose of pilot testing is to refine the
questionnaire so that respondents do not have any difficulties in understanding the
content of the survey. This process is helpful in increasing the reliability and
validity of the survey instrument (Saunders et al., 2003). The researcher conducted
three stages of pilot testing for this study. In the first stage, the researcher requested
opinions from tax academics, tax agents,14 postgraduate accounting students in the
researcher’s department and two Malaysian postgraduates in business studies
regarding the content of the survey. The researcher improved the questionnaire
after considering the recommendations provided and then pilot tested the survey
with members of Accountants and Tax Agents of New Zealand (ATAINZ),
previously known as Tax Agents of New Zealand (TINZ). Based on the feedback
from members of TINZ who participated in the pilot study, the researcher refined
the questionnaire and finally, translated the survey from English into Bahasa
Malaysia.15
4.7.4 Data collection procedure
The method of disseminating the self-administered questionnaire survey in
this study is partly related to the availability of the potential respondents for the
study. In Malaysia, postal mail was used to distribute the questionnaire, while a
14 The tax agents consisted of a tax staff from a Big Four public accounting firm, a tax staff member
in a medium-sized public accounting firm, an in-house tax staff in an oil and gas company who
previously worked in a Big Four public accounting firm, and a tax sole practitioner.
15 The researcher holds a certificate from the Malaysian National Institute of Translation. The
researcher also requested assistance from a tax lecturer to review the translated version to ensure the
original concepts are maintained and equivalent to the English version.

151
web-based online survey was used in New Zealand. The use of different modes in
collecting survey data in two different populations has been acknowledged by
Dillman et al. (2009). However, a mixed-mode approach used for administering a
survey has to be performed with caution since there is a possibility for
measurement difference to occur. This only occurs when the mode of
administrating the survey influences the response of the participants, such as when
one mode involves face-to-face survey and the other involves mail or online survey
(Dillman et al., 2009; Bryman & Bell, 2011).
Since in this study the researcher did not have any face-to-face meetings
with the respondents in Malaysia and New Zealand, the measurement difference is
not a concern. Furthermore, Bryman and Bell (2011) suggest that the use of paper-
based self-completion questionnaire and web-based survey in a single study
basically does not influence the respondents’ answers to the survey. In view of the
foregoing, the surveys in Malaysia and New Zealand are considered to be similar
despite the different modes used. The survey modes for Malaysia and New Zealand
are explained further in the following subsections.
4.7.4.1 Malaysia
The questionnaire survey was initially disseminated with the assistance of
CTIM through advertising the link for an online survey in its bulletin (see
Appendix C for the invitation email). However, since the approach did not provide
any fruitful results, the researcher then used a mail survey to disseminate the
questionnaire in Malaysia. The use of mail survey has some advantages and
disadvantages. For instance, a mail survey is an advantage if the respondents are
geographically widely dispersed (Bryman & Bell, 2011) and could increase the
152
possibility of getting an honest response in studies involving sensitive issues
(McKerchar, 2012a). However, it has the disadvantages of low response rate and
the possibility that the questionnaire is completed by someone else not in the
position to answer the survey (Bryman & Bell, 2011). After considering the
advantages and disadvantages, as well as the available correspondence details
displayed on the list of tax agents on the MIRB website,16 the researcher decided to
send the questionnaire via mail.
The questionnaire survey package contained a cover letter, an interview
consent form and two self-addressed stamped envelopes, one each for the
questionnaire and interview consent form were sent to five hundred tax agents,
resulting in 1,500 questionnaires being sent out to potential respondents. The cover
letter explained the purpose of the study, confirmation on the anonymity response
for the survey, an invitation to participate in the interview, ensured confidentiality
of the interview data and confirmed that the relevant ethics clearance was attached
with the questionnaire. The use of two different envelopes for the questionnaire and
interview consent form was to ensure that there was no possible association
between the respondents in the survey and the interview participants. The potential
respondents were given four weeks to return their responses from the date they
received their questionnaire. Two weeks after sending out the survey packages,
the researcher made telephone calls to follow up with the potential respondents.
Despite Bahasa Malaysia being the national language of Malaysia, the
English language is widely used in commerce in Malaysia (Foo & Richards, 2004).
Recent surveys conducted in Malaysia, for instance, Lim (2001), in investigating
16 The list provides the names of tax agents, their postal addresses, and their contact numbers.

153
the Malaysian business manager work values, and Singh (2003) in examining the
ethical decision-making of public accountants in Malaysia, indicate that it is an
acceptable practice to use English as a medium of surveys in Malaysia. The reason
being business managers and public accountants, are expected to have undergone
certain levels of education and the mastery of English in Malaysia is encouraged at
all levels from primary to tertiary education (Foo & Richards, 2004). Considering
that tax agents in Malaysia have undergone certain levels of education and are
familiar with English as a medium of communication, the researcher sent the
English version of the questionnaire to the Malaysian tax agents in this study. The
researcher, however, provided a link17 for the softcopy of the Bahasa Malaysia
version of the questionnaire on the cover page of the mail survey so that the tax
agents in this study have the options to respond either in English or Bahasa
Malaysia. A sample of the questionnaire is available in Appendix D.
4.7.4.2 New Zealand
The first attempt to collect data in New Zealand was made with the
assistance of NZICA by advertising the link to participate in the study in its
Newsletter (a sample of the invitation email is provided in Appendix E). As
mentioned in subsection 4.7.2.2, due to the discouraging response, the researcher
later developed a database from the list of public accountants available on the
NZICA website, and sent the questionnaire survey as well as the invitation to
participate in interviews through online.
17 The link would direct potential respondents to a web-based questionnaire survey in Bahasa
Malaysia. The web-based survey was designed similar to the process explained for the New Zealand
web-based survey in subsection 4.7.4.2. No response, however, was recorded for the Bahasa
Malaysia version of the survey.

154
Bryman and Bell (2011) suggest that basically there are two types of online
surveys, namely electronic mail (email) and web-based surveys. In an email
survey, the questionnaire is sent to the respondents via email, either as an
attachment or embedded in the email itself. In the case of the former, respondents
state their responses in the attachment file and return it to the sender as an
attachment. In the embedded email survey, the questionnaire is located in the email
itself and respondents have to state their answer in that email. Once completed, the
respondents just need to choose the ‘reply’ button to the sender.
A web-based survey, according to Bryman and Bell (2011), refers to
inviting potential respondents to access a website where the questionnaire is
located and if agreed, complete the questionnaire. Compared to email survey, the
use of a web-based survey allows respondents’ responses to be automatically
recorded, which could ease the workload of the researchers in managing the data
and there is more flexibility in designing the questionnaire (Bryman & Bell, 2011).
Furthermore, similar to a mail survey, the use of web-based survey could increase
the possibility of obtaining honest responses from respondents in sensitive issues
(McKerchar, 2012a) such as this study.
The researcher developed the questionnaire survey using the Qualtrics
Survey Software (QSS) subscribed by the University of Canterbury. The QSS
allows the researcher to design the questionnaire so that respondents could only
answer the questionnaire once and no internet links from respondents were
recorded to ensure anonymity. Two separate links, each for the survey and the

155
invitation to participate in interview,18 were also created. The responses from the
survey links and invitation for the interviews were automatically recorded in two
separate accounts. The different links were created for the survey and the interview
to ensure the survey answers and the participant profiles could not be associated in
any manner.
An introduction email was sent to 1,500 potential respondents explaining
the purpose of the study, confirming the anonymity of the survey answers, ensuring
confidentiality of the interview information, and confirming the relevant ethical
clearance. In the introduction email, the aforementioned two separate links were
also included to direct respondents to the survey and the invitation to participate in
the interview. The respondents were given four weeks to provide their responses
and as an effort to increase the response rates two reminder emails were sent to all
potential respondents after a month.
4.7.5 Questionnaire design
The questionnaire survey contains three parts; and the first part consists of
questions related to national culture and tax compliance. In the second part, the
researcher developed two hypothetical tax scenarios or vignettes. Part three
presents the questions related to respondents’ demographic background, namely
gender, age, ethnicity, experience in tax practice, type of firm and position.
The content of the questionnaire survey is further discussed in the construct
development and measurement section of this chapter. The survey was initially
18 The details of the interview link are explained in subsection 4.8.5 of this chapter.

156
developed in English and later translated into Bahasa Malaysia as an option for
Malaysian respondents to answer in Bahasa Malaysia.
4.7.6 Construct development and measurement
As explained earlier in Chapter 3 Research Framework , to understand the
tax compliance behaviour of tax agents in Malaysia and New Zealand while
performing their engagement roles, this study proposes to extend the Theory of
Planned Behaviour (TPB) by including ethical sensitivity and culture in the model.
Therefore, the proposed model consists of six constructs, with four constructs
derived from the TPB elements, namely intention, attitudes, subjective norms and
perceived behavioural control, with the two other constructs being ethical
sensitivity and culture. These theoretical constructs are latent or unobservable
constructs, and to test these constructs, the researcher developed and adopted
measure or indicators as presented in Appendix F, from prior studies in taxation,
accounting, and human behaviour.
Sekaran and Bougie (2010) suggest that measures of a construct could be
reflective or formative. This is because a construct is not inherently reflective or
formative, and depending on the theoretical concept, some constructs could be
modelled either as reflective or formative (MacKenzie et al., 2011). Therefore, one
of the important issues in designing a study is to determine whether the constructs
to be examined are reflective or formative (Jarvis et al., 2003). Before explaining
further the measures applied in this study, the differences between reflective and
formative constructs are discussed in the following Section 4.7.6.1. In addition, the
discussion on second order factors is also presented, which is important to
understand that the construct development is at a more abstract level. In this study,

157
the constructs for ethical sensitivity and culture are perceived to be
multidimensional, and defined using second order factor.
4.7.6.1 Reflective and formative measures
Measures or indicators could be distinguished as either influenced by the
latent construct (reflective) or formed the latent construct (formative) which could
be determined in a way by examining the direction between the latent construct and
the measures. In reflective constructs as depicted in Figure 4.2, the measures or
indicators are influenced by the latent construct, and thus the direction of causality
is from the latent construct to the measures (Jarvis et al., 2003).
Since reflective measures are influenced by the latent construct, they are
supposed to measure the same underlying concept of the latent construct.
Reflective measures are also expected to be highly correlated and interchangeable
(Haenlein & Kaplan, 2004). In view of the foregoing, eliminating a measure will
not cause any changes to the meaning of the latent construct since the remaining
measures could adequately present the latent construct (Jarvis et al., 2003).
However, if the latent construct changes, then all reflective measures should
change accordingly (Urbach & Ahlemann, 2010). Given the nature of reflective
measures, statistically, reflective measures also incorporate measurement error at
the item level (Haenlein & Kaplan, 2009).
Formative measures as illustrated in Figure 4.2, on the other hand
represents different dimensions of the latent construct and thus form the latent
construct (Gefen et al., 2000). Formative measures are suitable when a latent
construct is defined based on the combination of its measures (Henseler et al.,

158
2009), which suggest that they influenced the latent construct. Since they formed
the latent construct, the direction of causality is from the measure to the latent
construct (Jarvis et al., 2003). Furthermore, unlike reflective measures, which are
supposed to be highly correlated, formative measures could have positive, no
correlation or negative relationships (Haenlein & Kaplan, 2004). Due to this,
dropping off a formative measure could possibly change the meaning of the latent
construct (Jarvis et al., 2003), since each measure represents the different
dimensions of the latent construct. The attributes of formative measures also
suggest that the measurement error of the measures will only be accounted for at
the latent construct level (Haenlein & Kaplan, 2004).
Figure 4.2 Reflective and formative measures
Reflective measures
Formative measures
Source: Adapted from Haenlein and Kaplan (2004, p. 289).
To differentiate between reflective and formative measures, Jarvis et al.
(2003) provide a set of guidelines which is reproduced in Table 4.3. Essentially,
the guidelines focused on four main aspects in distinguishing the reflective and
formative measures, which are:
(1) The direction of causality between the latent construct and the measures,
Latent
Construct
Y1
Y2
Y3
Latent
Construct
X1
X2
X3

159
(2) Whether or not the measures are interchangeable,
(3) Covariance among the measures, and
(4) Whether or not the measures have similarity of antecedents and consequences.
Table 4.3 Guidelines to Determine Reflective and Formative Models
Attributes Reflective model Formative model
Direction of causality between
measures and construct
Direction of causality
is from construct to
measures
Direction of causality
is from measures to
construct
Interchangeability of measures Measures should be
interchangeable
Measures need not be
interchangeable
Covariance among measures Measures are expected
to covary with each
other
Not necessarily for
measures to covary
with each other
Nomological net of construct
indicators
Measures are required
to have same
antecedents and
consequences
Measures are not
required to have same
antecedents and
consequences
Source: Adapted from Jarvis et al. (2003, p. 203).
To illustrate reflective and formative measures, Henseler et al. (2009), for
instance, provide an example of examining cycling fitness. In a reflective model of
cycling fitness, the measures are based on a single underlying concept which is
concerned with the heart rate, lactate level, and muscle proportion. A change in the
heart rate, for instance, is correlated with the lactate level and muscle proportion.
Likewise, the changes in the lactate level influence the heart rate and muscle
proportion. On the other hand, if cycling fitness is developed as a formative model,
then cycling fitness could be measured using different dimensions attributing to
fitness such as the hours of training, nutrition intake, and drug abuse.

160
4.7.6.2 Second order factor
The discussion in Section 4.7.6.1 only focused on the first-order latent
constructs. However, a latent construct could be conceptualized at a more abstract
level especially when it requires multidimensional measures to explain its
underlying concept. Jarvis et al. (2003) suggest four different types of second-order
factor models comprising reflective or formative measures in a single construct or a
combination of both in a construct. The four options of second-order factor models
are illustrated as follows:

161
Figure 4.3 Types of second-order factor models
Type I: Reflective First-Order, Reflective
Second-Order
Type II: Reflective First-Order, Formative
Second-Order
Type III: Formative First-Order, Reflective
Second-Order
Type IV: Formative First-Order, Formative
Second-Order
Source: Adapted from Jarvis et al. (2003, p. 205).
In the first model, Type I, both the first-order factor and second-order factor
are conceptualized using reflective measures. In Type II model, the first-order
factor is developed based on reflective measures and the second-order factor is
Second
order
construct
First Order
Construct 1
Y1
Y2
Y3
First Order
Construct 2
First Order
Construct 3
Y1
Y2
Y3
Y1
Y2
Y3
Second
order construct
First Order
Construct 1
Y2
Y3
First Order
Construct 2
First Order
Construct 3
Y1
Y2
Y3
Y1
Y2
Y1
First Order
Construct 1
Y2
Y3
First Order
Construct 2
First Order
Construct 3
Y1
Y2
Y3
Y1
Y2
Y1
Second
order construct
First Order
Construct 1
Y2
Y3
First Order
Construct 2
First Order
Construct 3
Y1
Y2
Y3
Y1
Y2
Y1
Y3
Y3 Y3
Second
order construct

162
conceptualized using formative constructs. In Type III, the first-order factor model
is explained using formative measures and reflective constructs are used to describe
the underlying concept at the second level. Finally, in Type IV model both the first-
order and the second-order factor models are conceptualized using formative
measures and constructs. In addition to the above four second-order factor models,
a model could also possibly contain a mixture of reflective and formative measures
and constructs in either the first or second-order factor models (Jarvis et al., 2003).
Examples of mixed models are presented in Figure 4.4.

163
Figure 4.4 Mixed models of measures and constructs
Type V: Reflective First-Order, Mixed
Second-Order
Type VI: Formative First-Order, Mixed
Second-Order
Type VII: Mixed First-Order, Reflective
Second-Order
Type VIII: Mixed First-Order, Formative
Second-Order
Source: Illustrated based on Jarvis et al. (2003, p. 204).
Apart from the above mixed models, Chin (2010) for instance, recognizes
two types of higher order construct models known as molar and molecular higher
order constructs in explaining the conceptualization of model at higher levels.
Second
order
construct
First Order
Construct 1
Y1
Y2
Y3
First Order
Construct 2
First Order
Construct 3
Y1
Y2
Y3
Y1
Y2
Y3
Second
order
construct
First Order
Construct 1
Y2
Y3
First Order
Construct 2
First Order
Construct 3
Y1
Y2
Y3
Y1
Y2
Y1
Y3
Second
order
construct
First Order
Construct 1
Y1
Y2
Y3
First Order
Construct 2
First Order
Construct 3
Y1
Y2
Y3
Y1
Y2
Y3
Second
order
construct
First Order
Construct 1 Y2
Y3
First Order
Construct 2
First Order
Construct 3
Y1
Y2
Y3
Y1
Y2
Y1
Y3

164
Based on the work of Chin and Gopal (1995), a second-order molar model is
described as a model which has arrows from the first order constructs pointing
towards the second-order construct. In this case, the first-order constructs are
conceptualized as formative measures to the second-order construct. On the other
hand, the molecular second-order model has arrows from the second-order
construct pointing towards the first-order constructs, which implies that the first-
order constructs are reflective measures to the second-order construct. The same
procedures in determining the validity of the first-order factor model are used to
determine the validity of the second-order factor model (Chin, 2010). In this study,
the analysis on the second-order factor model is performed using a repeated
indicator approach suggested by Chin (2010), Becker et al. (2012) and Hair et al.
(2013). Both models are depicted in Figure 4.5.
Figure 4.5 Second-order Molar and Molecular Models
Molar Model
Molecular Model
Source: Adapted from Chin (2010, p. 666).
Second order
construct
First Order
Construct 1
Y2
Y3
First Order
Construct 2
First Order
Construct 3
Y1
Y2
Y3
Y1
Y2
Y1
Y3
Second
order
construct
First Order
Construct 1 Y2
Y3
First Order
Construct 2
First Order
Construct 3
Y1
Y2
Y3
Y1
Y2
Y1
Y3

165
Drawing from the literature review, theoretical concepts and conceptual
framework of the study, the constructs and measures in this study applied the Type
II which is the Reflective First-Order, Formative Second-Order Model suggested
by Jarvis et al. (2003), or Molar Second-Order Model suggested by Chin and Gopal
(1995) in explaining the tax compliance behaviour of tax agents while performing
their engagement roles. At the first-order level, the reflective measures are used to
explain the underlying concepts of the constructs while formative constructs are
developed at the second-order factor model. For instance, culture is measured as a
second-order factor model using Hofstede’s (1980) National Cultural Dimension.
At the first-order level, reflective measures are used to explain the attributes of
culture. At the second-order level, the four constructs of Hofstede’s (1980)
National Cultural Dimensions are developed as formative constructs, since these
four constructs formed the overall meaning of culture as proposed by Hofstede
(1980).
4.7.6.3 Theory of Planned Behaviour
A review by O’Fallon and Butterfield (2005) indicates that scenarios or
vignettes are widely used in ethics-based studies. The use of scenarios allows for
decision-making to be made in a more real situation, as well as to standardise the
social motivation for all respondents. It provides the opportunities “to manipulate
the variable of interest while controlling for environmental factors” (O’Fallon &
Butterfield, 2005, p. 403). For this study, two hypothetical tax scenarios on
overstating business expenses and understating income, respectively, were
developed based on the literature from prior studies and used to measure the
Theory of Planned Behaviour (TPB) items, namely attitudes, subjective norms, and

166
perceived behavioural control. The scenarios on overstating expenses and
understating income are considered as appropriate since, as suggested by Elliffe
(2011), they imply the second type of tax gap component in a tax system.
Notwithstanding the advantages of using scenarios, they are criticised
because normally researchers would assume they present the actual dilemma and
the situation is the same for all respondents. In real life, however, this may not be
the case (O’Fallon & Butterfield, 2005). To increase the validity and reliability of
the scenarios, as well as seeking to overcome the criticisms of using tax scenarios
in this study, as mentioned in subsection 4.7.4, the researcher had requested
opinions from tax agents, amongst others. The tax agents were asked whether or
not the scenarios reflect the reality, the most frequent tax scenarios that they faced,
and the level of ease and difficulty to understand the scenarios.
Following the scenarios, a few statements to capture the TPB items were
offered and respondents were required to provide their opinions using a seven-point
fully anchored scale. All statements related to the TPB items were developed as
direct measures following the guidelines suggested by Ajzen (2006), which
measure the overall attitude, subjective norms, and perceived behavioural control
of respondents with respect to the tax scenarios provided in the study. The scales to
measure the TPB items were adapted from Buchan (2005), who had used the TPB
in tax context and tested it on public accountants in the US, an approach which was
also aligned with the guidelines suggested by Ajzen (2006). To enhance the ethical
dilemma issues in both scenarios, the author mentioned about where the money
from overstating the expenses or understating the income would be used. It is also
assumed that since tax agents are taxpayers themselves, therefore what is ethical to

167
them is supposed to be ethical for their clients and vice versa. An example on the
understating income scenario used in the study is depicted as follows:
Adam is a sole proprietor who receives cheques and cash for his
business. In the current year, he received a cash sale of $2,000 from
one of his friends. He is certain that the tax authority will not know
if the income is not reported and will not detect the income since
there is no record about the cash sale. He notices that he will fall
under a higher tax bracket if he declares the $2,000 cash sale. At
the same time, he wants to renovate his shop and intends to use the
$2,000 cash sale for that purpose. For that year, Adam omitted the
$2,000 cash sale from his current year tax computation. If you are
in a similar situation, what would you do?
(a) Intention to comply with the tax law
The intention to comply with the tax law is operationalized as the
dependent variable of this study. The intention to comply with the tax law in this
study is captured related to the scenarios presented in this study and therefore are
assumed to measure the same concept. As a result, the measures are expected to
covary with one another and developed as reflective measures. For instance, in the
above example, the measures for intention were used to capture whether or not the
respondents would omit or include the cash sale in the tax computation. Three
measures were developed to measure intention to comply in each scenario (see
Appendix F).

168
(b) Attitudes
Attitudes are considered as the motivation to perform behaviour based on
how respondents evaluate the favourableness and unfavourableness of performing
behaviour. Three reflective measures were developed to examine the attitude of
respondents with regard to the scenarios in the study. For instance, in the under
declared income scenario, respondents were asked whether or not they feel good or
bad if they omit the cash sale from the tax computation. The measures are
presented in Appendix F.
(c) Subjective norms
Ajzen (1991) suggests that subjective norms account for the general
perceptions of social pressure, whether or not to comply with the wishes of
important others. In the case of tax compliance, prior studies suggest that there are
possibilities for respondents to comply with the tax law based on the social
pressure from people who are considered as important to them (Bobek & Hatfield,
2003; Buchan, 2005). To measure the latent construct, three reflective items were
developed for each scenario, and these measures are expected to covary with one
another, since they are measuring the same underlying concept. For instance, in the
scenario above, respondents were requested to indicate their opinion on whether or
not most people who are important to them agree or disagree if they omit the cash
sale from the tax computation (see Appendix F).
(d) Perceived behavioural control
Perceived behavioural control in this study refers to the ability of
respondents to have control in performing behaviour related to the scenarios. Three

169
reflective items were developed to measure perceived behavioural control of
respondents in this study, which are expected to covary since they are measuring
the same underlying concept. For instance, as presented in Appendix F, to
determine the perceived behavioural control in the above scenario, respondents
were asked to indicate their belief using a seven-point fully anchored scale on
whether or not they have complete control to omit the $2,000 cash sale from the tax
computation.
4.7.6.4 Ethical sensitivity
Ethical sensitivity refers to the ability to recognize moral issues before
making any decision. Since in this study it is postulated that the respondents would
rely on more than one dimension to make decision, the construct for ethical
sensitivity in this study is operationalized as a second-order factor measured with
twelve first-order items. The items were grouped into moral equity, relativism,
contractualism, egoism, and utilitarianism. For each group, two items were
developed to measure ethical sensitivity except for four items for moral equity
dimension. In total, twelve items were developed to measure ethical sensitivity of
respondents in the study which were adopted from Cruz et al (2000). All these
measures were used to capture the ethical sensitivity of respondents related to the
two tax scenarios, which were also used to capture the TPB elements.
All the measures for ethical sensitivity were defined using reflective
measures. At the second-order level, the multidimensional of ethical sensitivity is
measured using formative constructs since these constructs tap different underlying
concepts. Respondents in the study were required to indicate their opinions on a
seven-point fully anchored scale. For instance, relativism is measured on a seven-
Second
order
construc
t

170
point fully anchored scale of “traditionally acceptable or traditionally
unacceptable” and “culturally acceptable or culturally unacceptable” (see Appendix
F). The following Figure 4.6 depicts an example of the conceptualization of ethical
sensitivity in this study at the first-order and second-order levels.
Figure 4.6 First and Second-Order Factor Model for ethical sensitivity
Key: RE1 and RE2 represent measures for relativism.
4.7.6.5 Culture
Another construct which is regarded as a second-order factor is culture.
This is because culture in this study is measured using Hofstede’s (1980) National
Cultural Dimensions, which for each dimension has different underlying concepts
for explaining culture. Therefore, Power Distance, Individualism-Collectivism,
Masculinity-Femininity and Uncertainty Avoidance are conceptualized with
Ethical
Sensitivity
Moral
equity
Relativism
Contractualism
Egoism
Utilitarianism
1st Order 2nd Order
RE1
RE2

171
reflective measures. At the second level, all constructs are regarded as formative
constructs in explaining culture.
Each construct is measured using four items related to Hofstede’s (1980)
National Cultural Dimensions. In total, sixteen items were developed to explain
culture in complying with the tax law. All these measures were self-developed
based on the attributes of National Cultural Dimensions posited by Hofstede (1980;
2001). Respondents were asked to indicate their level of agreement with the
statement provided in the questionnaire on a seven-point scale of “strongly
disagree” and “strongly agree”. All items to measure culture are reproduced in
Appendix F.
4.7.6.6 Demographic background information
Respondents were also asked to provide their demographic background
information such as gender, age, ethnicity of respondents, respondents’ experience
as tax agent, type of firms, and positions. Respondents were requested to tick the
appropriate box either as “male” or “female” to indicate their gender.
The age of respondents was divided into nine groupings: 25 years or below,
26 to 30 years old, 31 to 35 years old, 36 to 40 years old, 41 to 45 years old, 46 to
50 years old, 51 to 55 years old, 56 to 60 years old, and finally, over 60 years old.
Ethnicity consists of three main ethnics in Malaysia, “Malay”, “Chinese”, “Indian”,
and “Others”. If “Others” was selected then the respondents were asked to indicate
further their ethnicity. In New Zealand, ethnicity consists of “New Zealand
European”, “Maori”, “Pacific”, “Asian” and “Others”. Similar to Malaysian

172
respondents, if “Others” was selected then respondents were required to state
further their ethnicity.
The years of experience as tax agents were grouped into “less than 5 years”,
“5 to 10 years”, “11 to 20 years”, and “more than 20 years”. They were also
requested to determine the type of firms they are currently working either in “Big
Four public accounting firm”, “Medium size public accounting firm”, “Small size
public accounting firm” and “Others”. If “Others” was chosen, then the
respondents were requested to state their type of firm. Another question was on the
position of the respondents in which they were required to state their position.
4.7.7 Data preparation and pre-analysis
This subsection discusses the pre-analysis performed for the quantitative
part of the study. The discussions focused on data screening, response
representativeness, nonresponse bias, common method bias, social desirability bias,
descriptive analysis, and t-test analysis.
4.7.7.1 Data screening process
Before any further analyses could be performed, data from the
questionnaire survey has to be coded, keyed in, examined for any missing data and
outliers, as well as tested whether or not the data fulfil the statistical assumptions of
the statistical test being used to analyse the data (Hair et al., 2010; Sekaran &
Bougie, 2010).
The data from the mail survey was coded and keyed into the Statistical
Package for the Social Sciences (SPSS) software manually. Thorough checking
against the hardcopy of the survey was performed to ensure that no error occurred
173
during the data entry process. As for New Zealand, the Qualtrics Survey Software
provides the option of retrieving the responses collected from the survey using
SPSS format file. Therefore, the data was automatically entered into the system and
coded accordingly. The existence of outliers in the data could be determined by
examining the minimum and maximum values (Sekaran & Bougie, 2010) or
scatterplot the data (Moore & McCabe, 2006).
Considering that self-reports are being used in this study and the issue of
tax compliance could be deemed as a sensitive issue, there is a possibility that some
responses are missing. Notwithstanding this situation, missing data is a common
problem in undertaking research (Sekaran & Bougie, 2010), and there are some
forms of remedies to solve the missing data problem discussed by Hair et al.
(2010). Following the suggestion by Hair et al (2010), a case or a variable would be
eliminated if the missing data accounted for more than 10 percent of that particular
cases or variables. As a result, the remaining cases are considered to have less than
10 percent of missing data, and thus the missing data can be either ignored or any
imputation methods to solve the missing data problem could be applied (Hair et al.,
2010). A visual check on the data from Malaysia and New Zealand suggests that
the missing data level is low and occurred in a random manner. The extent of
missing data could also be examined using Missing Value Analysis test in SPSS.
The remedies for missing data vary from a conservative approach, such as
accepting only complete datasets, to those which attempt to replicate the missing
data using regression analysis. One method which is highly recommended by Hair
et al. (2010) is a model-based method approach using Expectation Maximisation
(EM), which is available in SPSS. The EM method is a two stage-iterative method,

174
which is suitable to be applied in random and non-random missing data and has the
least bias. It will make the best estimate of the missing data and also estimate the
parameter of the missing data (such as mean, standard deviation) assuming that the
missing data is being replaced. Furthermore, the EM method could also handle
small sample size of data (Hair et al., 2010).
4.7.7.2 Response representativeness
One method to test the representativeness of the sample is by comparing the
respondents’ profiles with certain types of demographic information of the
population (Saunders et al., 2003). As for Malaysia, notwithstanding that the list of
tax agents was developed from the Malaysian Inland Revenue Board (MIRB)
website, there is no information available from the MIRB website or MIRB annual
report on the demographic profiles of tax agents. Therefore, to test the
representativeness of the sample in Malaysia, the researcher compared the gender
and age of the respondents in the study with the demographic profiles of members
of Malaysian Institute of Accountants (MIA) available in its 2012 Annual Report
(Malaysian Institute of Accountants, 2012).19 In New Zealand, to examine the
representativeness of the sample, the researcher compared the gender, age, and
ethnicity distribution of the survey respondents in this study with the demographic
profiles of NZICA members (New Zealand Institute of Chartered Accountants,
2012).
19 Despite the comparison made on a more general population of accountants in Malaysia, this
practice is considered to be appropriate since, as explained earlier in subsection 1.3.1 of the
Introduction Chapter, MIA is the body which governs the accounting profession in Malaysia.
Therefore, its members may in a way represent the accounting professionals in Malaysia. The only
demographic profiles available from the MIA’s 2012 Annual Report are gender, age, and
employment type. Due to this, comparisons could be made only on gender and age of the
respondents.
175
4.7.7.3 Nonresponse bias
Nonresponse is a challenging issue in using survey as a data collection
instrument since a high nonresponse rate could possibly result in bias in responses.
Nonresponse bias occurs when there are members of the sample refuse to
participate in the study, which could be due to a failure for them to be contacted,
they are not in the position to answer the questionnaire, time constraints or for
some other unknown reasons they refuse to cooperate (Bryman & Bell, 2011). Due
to this nonresponse, there is a possibility that the opinions of those who respond to
the survey are different from those who do not respond. With the existence of
nonresponse bias, Sekaran and Bougie (2010) suggest that the findings should be
generalized only to the respondents who participated in the study.
To examine the existence of nonresponse bias in this study, the researcher
followed the approach by Armstrong and Overton (1977), using late respondents,
those who participated after the reminders being sent, as substitutes for
nonrespondents. The responses were later divided into “early respondents” and
“late respondents”, and the means of the responses were compared to check
whether the means between the two is significant at p ≤ 0.05 using independent t-
test in SPSS. The independent t-test in SPSS provides two results, the Levene’s test
for equality of variance, and the t-test for equality of means. The Levene’s test is
used to determine whether or not there is equal variance between the two groups
before deciding the appropriate t values in independent t-test. This can be done by
checking the significance of F value at p ≤ 0.05 in the Levene’s test. The t value is
then determined depending on whether there is equal variance between the two

176
groups or when the variance is not equal. Based on the t value, the significance of
the means is determined at p ≤ 0.05 (Gaur & Gaur, 2006; Field, 2009).
4.7.7.4 Common method bias
There are many reasons why common method bias could occur in
behavioural type of research, as suggested by Podsakoff et al. (2003), who have
provided an extensive summary of potential sources of common method bias. In
general, the common method bias problem could arise as a result of using the same
source to obtain responses and effect caused by the measurement itself such as
ambiguity, repeated scale format, intermixing items or constructs in the
questionnaire, and effect in the measurement as a result from where the context
measures are obtained (Podsakoff et al., 2003). Since the data was obtained through
self-reported survey, there is also a possibility for common method bias to exist in
the responses (Podsakoff & Organ, 1986). This is despite the proactive steps taken
by the author by following the suggestions from Podsakoff et al. (2003) and
Conway and Lance (2010), such as assuring anonymity, emphasizing there are no
right or wrong answers, counterbalancing the order of the questions, keeping the
questions simple and precise, and also using different scale endpoints in the
questionnaire.
Chin et al. (2012) outlined a list of post hoc statistical methods to detect
common method bias, with one of the most commonly applied method being the
Harmon’s single factor test. Therefore, to assess the extent of common method bias
in this study, the Harmon’s single factor test was performed by forcing all
indicators to load in a single factor (Podsakoff et al., 2003). The test is performed
using principal component factor analysis in SPSS. There is a problem of common

177
method bias in the data if a single factor accounts for the majority of the variance
or one factor accounts for the majority of the covariance in the independent and
dependent variable (Podsakoff et al., 2003). The number of factors from the
principal component factor analysis is determined based on factors with
eigenvalues more than 1.0.
4.7.7.5 Social desirability bias
A common bias that exists in ethics-based studies and survey research is
social desirability bias, which occurs when respondents have the tendency to
portray favourable image by choosing answers in the questionnaire which
perceived to be more socially desirable (Krosnick, 1999; McDonald, 2000; Bryman
& Bell, 2011). For instance, people tend to respond that they voted in the most
recent election even though they did not because voting is more socially admirable
(Krosnick, 1999). Findings by Cohen et al. (1993) in an accounting context and
Cruz et al. (2000) in taxation, which both applied MES to measure ethical
behaviour, suggest the need to control for social desirability bias in ethics-based
accounting studies. One way to test the existence of social desirability bias is to use
the Marlowe-Crowne Social Desirability Scale (MCSD) developed by Crowne and
Marlowe (1960), which has 33 questions using a True/False format.
Considering that tax agents are busy people and the researcher at the same
time has to take into account the length of the questionnaire, instead of using the
MCSD Scale, the researcher asked two questions adopted from Cohen et al. (1993),
which were also replicated by Cruz et al. (2000), in a study involving tax agents’
ethical judgment, to examine the existence of social desirability bias. In both
hypothetical tax scenarios, respondents were asked to indicate the possibility that

178
their peers will perform the same action as described in the tax scenarios and the
probability that they will take the same action as mentioned in the tax scenarios
(see Appendix O). The responses to both questions were recorded using seven-
point scales, fully anchored with a High/Low, with the higher score indicating low
probability to perform the described behaviour. The mean responses in both
questions were then compared using Paired t-test in SPSS to determine whether
there is any significant difference at a p value of 0.05 between these two variables,
‘Peero/Peeru’ and ‘Selfo/Selfu’.
4.7.7.6 Descriptive analysis
Descriptive analysis provides basic features on how tax agents in Malaysia
and New Zealand understand culture, ethical sensitivity, and the TPB elements in
tax compliance behaviour. In addition, the descriptive analysis also describes the
demographic details of respondents in this study. In this descriptive analysis, the
basic features are described using mean, standard deviation, minimum and
maximum values for each item in the questionnaire survey. The frequency
distribution is also provided where appropriate. All these analyses were performed
using SPSS software version 18.
4.7.7.7 t-test analysis
The independent t-test analysis is performed to examine whether or not
there is any significant difference in the overall perceptions of the Malaysian and
New Zealand respondents in this study with regard to the TPB elements, ethical
sensitivity, and culture items. The null hypothesis for this test suggests that both
the Malaysian and New Zealand tax agents have similar perceptions on the TPB
elements, ethical sensitivity items, and culture items, respectively. An independent

179
t-test is performed using SPSS software version 18 to generate p values similar to
the test performed to examine nonresponse bias. Based on the Levene’s test, the
variance between the two means for the groups will determine whether or not there
is equal variance before the appropriate p values are chosen. Based on the p values,
the level of significance is determined whether or not there is any significant
different between the two groups of respondents at p ≤ 0.05. Using these p values,
decision will be made whether to accept or reject the null hypothesis.
4.7.8 Introduction to SEM
The use of Structural Equation Modelling (SEM) has gained considerable
support over the past decades in social science studies, for instance, in the areas of
marketing and information systems (Urbach & Ahlemann, 2010; Hair et al., 2012;
Ringle et al., 2012). This perhaps is due to the ability of SEM to test latent
constructs or variables using a two-step approach simultaneously (Hair et al.,
2012). The SEM is a second generation multivariate data analysis technique which
permits measurement errors of the constructs to be analysed as part of the model
and factor analysis to be combined with the hypotheses testing. Thus, unlike the
first generation of statistical analysis, such as regression, which could only examine
one layer of relationship between independent and dependent variables, SEM
allows a set of interrelated questions to be examined in a single, systematic, and
comprehensive analysis (Gefen et al., 2000). Furthermore, Hankins et al. (2000)
suggest that SEM is a useful technique in studies incorporating TPB (such as this
study), due to its ability to make explicit the implicit assumptions of
unidimensionality constructs in TPB.

180
A SEM model consists of two interrelated models, the measurement or
outer model, and structural or inner model (Urbach & Ahlemann, 2010). The
testing of these two models involves a two-step approach as suggested by
Anderson and Gerbing (1988). The structural model examines the relationship
between independent latent variables, also known as exogenous variables in SEM,
and dependent latent variables, also referred to as endogenous variables. For each
latent variable, it has its own measurement model which examines the validity and
reliability of the measures or indicators of that particular latent variable. A
complete SEM model is depicted in Figure 4.7 below.
Figure 4.7 Structural Equation Modelling
Source: Adapted from Henseler (2010, p. 109).
There are two types of SEM analysis commonly used in social science
research; the Covariance-based SEM (CBSEM), and Partial least squares (PLS),
which have different underlying concepts (Gefen et al., 2011; Hair et al., 2012).
Both SEM-based analyses are explained in the following subsections.
Construct
Construct
Construct
Y1
Y2
Y3
Y4
Y5
Y6
Structural Model
Measurement Model: Reflective
Mode
Measurement Model: Formative
Mode
X1
X2
X3
Construct
X4
X5
X6

181
4.7.8.1 Covariance-based SEM and Partial least squares
(a) Covariance-based SEM
Covariance-based SEM (CBSEM), which is normally associated with the
software employed to perform the analysis such as LISREL and AMOS, has the
objective of proving that the operationalization of the theory being examined is
corroborated and supported by the data which is parameter-oriented (Hair et al.,
2010). Therefore, CBSEM aims to show that the null hypothesis is insignificant
(Gefen et al., 2000). It requires a sound theory base and supports confirmatory
research. In addition, CBSEM also requires normal distribution of data and only
works with parametric assumption. There is also a strict requirement of the
appropriate sample size in order to employ CBSEM and inadequate sample size
may result in over rejecting models (Gefen et al., 2000). In addition to that,
CBSEM only caters for reflective measures and does not allow measures to be
developed formatively (Gefen et al., 2011).
(b) Partial least squares (PLS)
Partial least square (PLS) is the second major technique in SEM introduced
by Wold (1985), which is designed to explain variance in data. It extends the
principal component and canonical correlation analysis (Henseler et al., 2009) and
has fewer requirements to be fulfilled compared to CBSEM. The PLS is considered
to be “silver bullet” (Hair et al., 2011, p. 148) given its potential to explain causal
relationship in theoretical models. The objective of PLS is to examine the
significance of relationships indicated with high R2 and has a similar concept
underlying the linear regression analysis which is prediction-oriented. Unlike
CBSEM, PLS does not require a sound theory base, and supports both exploratory

182
and confirmatory based research (Gefen et al., 2000; Gotz et al., 2010; Urbach &
Ahlemann, 2010). PLS, which is considered as working on a soft data assumption,
also allows relatively robust deviations from parametric assumptions which
perform well with non-normal data distribution (Chin, 2010; Henseler, 2010). In
addition, there is no strict requirement on the appropriate number of samples in
PLS analysis and it works well even with a small number of samples (Hair et al.,
2012) with several indicators (Henseler, 2010). Unlike CBSEM, PLS analysis
could cater for both reflective and formative measures in the same model (Gefen et
al., 2000, Gefen et al., 2011). The discussion on CBSEM and PLS are summarized
in Table 4.4.
Table 4.4 Attributes of CBSEM and PLS
Criteria CBSEM PLS
Objective Parameter-oriented Prediction-oriented
Approach Covariance-based Variance-based
Assumption Multivariate normal
distribution (parametric)
Predictor specification
(nonparametric)
Parameter estimates Consistent Consistency at large as
indicators and sample size
increases
Latent variable scores Indeterminate Explicitly estimated
Epistemic relationship
between a latent variable
and its measures
Typically only with
reflective measures
Work with either formative
or reflective mode
Implications Optimal for parameter
accuracy
Optimal for prediction
accuracy
Model complexity Small to moderate
complexity (e.g., less than
100 indicators)
Large complexity (e.g., 100
constructs and 1,000
indicators)
Sample size Minimal
recommendations range
from 200 to 800
Minimal recommendations
range from 30 to 100 cases
Source: Chin and Newsted (1999, pp. 307-341).

183
4.7.8.2 Justifications for using PLS in this study
The above discussions provide some basis to justify the use of PLS in this
study. First, PLS is more appropriate considering this study is prediction-oriented,
which is to predict the tax compliance behaviour of tax agents by extending the
Theory of Planned Behaviour (TPB) with two other additional factors, ethical
sensitivity and culture. Second, PLS has soft data distribution assumption which
does not restrict on parametric assumption, thus provides more option for data
analysis. Third, prior studies indicate the small number of sample size in tax studies
involving tax agents. Since PLS could allow for a small to moderate number of
samples, thus it is more suitable considering that PLS enables analysis to be
performed irrespective of the number of samples available. Finally, measures and
constructs in this study were developed in both formative and reflective way. In the
case of PLS, it could cater for both while CBSEM only works with reflective
measures. Consequently, it is more appropriate to use PLS compared to CBSEM.
The study used SmartPLS 2.0 (M3) Beta software developed by Ringle et al.
(2005) to perform the PLS analysis.
4.7.8.3 Model evaluation
A SEM model comprises measurement and structural models which are
interrelated. A confirmatory technique is used to validate the measures for each
individual latent construct at the measurement model level while the structural
model evaluates the relationships among the latent constructs at the theoretical
level. The model evaluation for both measurement model and structural model is
further discussed as follows.
184
(a) Evaluation of the measurement model
The measurement model evaluates the association between measures and
latent constructs. In the measurement model the validity and reliability of measures
in each construct are determined before testing the relationships of constructs at the
structural level. A measurement model could consist of reflective measures,
formative measures or a combination of both reflective and formative measures
(Gotz et al., 2010). Depending on the mode of the measures being used in the
measurement model, either as reflective or formative, the validity and reliability of
the measurement model is determined differently. A reflective construct, for
instance, inherits the classical test theory which incorporates measurement error in
each measure or indicator of the measurement model (Henseler et al., 2009). On
the other hand, a formative construct consists of independent measures which form
the construct, and thus measurement error is only included at the construct level
(Howell & Breivik, 2007).
(i) Construct reliability
Construct reliability tests the consistency of the measures which directly
assess the level of measurement error (Noar, 2003). A reflective measure is tested
using the classical test theory20 and factor analysis, which expect a high degree of
internal reliability (Jarvis et al., 2003). In a reflective construct, two techniques are
used to determine reliability at the individual measure level and construct level.
The individual measure is assessed based on its factor loading to determine its
reliability, and the overall internal consistency of the construct can be observed
20 A classical test theory is concerned with examining the observed variances or covariances of
measures (Jarvis et al., 2003).

185
using composite reliability which estimates the inter-correlations among measures
(Henseler et al., 2009; Gotz et al., 2010; Hair et al., 2012).
Since the reliability of each measure varies, the factor loading of a
reflective measure indicates the level of variance explained by the construct. There
is no absolute threshold for factor loadings in a PLS model. Hair et al. (2010), for
instance, suggests a cut-off loading of 0.50 while the common acceptable threshold
is 0.70, which suggests that more than 50 percent of the variance (based on the
squared standardized outer loadings) in a measure is explained by the construct
(Gotz et al., 2010; Hair et al., 2012). In research involving newly developed
measures such as in this study, loadings of 0.40 are acceptable and a measure
which has factor loading smaller than 0.40 should be eliminated (Hair et al., 2012).
Henseler et al. (2009), however, provide a different point of view in eliminating a
reflective measure in a PLS model. In their view, a reflective measure should only
be discarded from the model if the loading is low and eliminating the reflective
measure increases the overall internal consistency of the construct. This is because
while a single-item measure is allowed in PLS, it is performed with caution since
the use of a single indicator may have the tendency to overestimate the
measurement model and underestimate the structural model (Diamantopoulos et al.,
2012; Ringle et al., 2012).
The composite reliability which evaluates the overall internal consistency of
a construct and interpreted similar to Cronbach’s alpha, is used to assess the
construct reliability in a PLS model (Gotz et al., 2010; Hair et al, 2012). Compared
to Cronbach’s alpha which uses equal weighting for all measures, the composite
reliability is favoured in explaining the construct reliability in a PLS model, since

186
composite reliability does not assume equivalence across measures (Chin, 2010),
and thus considers the possibility that factor loadings for measures are varied
(Henseler et al., 2009). The composite reliability which is available from the PLS
analysis is defined using the following formula:
The represents the loading of measure i while F indicates the factor
variance and refers to measurement error of measure i.
The value of composite reliability varies between 0 to 1 and a value larger
than 0.60 is considered as acceptable (Gotz et al., 2010). Fornell and Larcker
(1981), for instance, suggest a higher composite value which is above 0.70 for a
construct to be included in the model. Henseler et al. (2009) and Hair et al. (2012)
both argue that a composite value below 0.60 portrays lack of reliability but
acceptable in exploratory research.
Unlike reflective measures, which are concerned with the level of
unidimensionality, formative measures are considered to be multidimensional and
each measure represents a different underlying concept to the construct (Chin,
2010). Therefore, the reliability of formative measure is considered not important
but a more appropriate technique is to ensure the formative measures meet the
validity assumptions.

187
(ii) Construct validity
Construct validity evaluates whether or not a measure represents the
concept that it is supposed to measure (Noar, 2003). To test the validity of the
reflective constructs, PLS applies the confirmatory factor analysis (CFA) technique
which could confirm the strength of the measures by observing the convergent
validity and discriminant validity of the constructs. The convergent validity test
examines whether or not a set of indicators measures the same concept
(unidimensionality) and can be observed using the average variance extracted
(AVE) of the construct (Henseler et al., 2009). Statistically, the AVE is defined
using the following formula:
where represents the loading of measure i while F indicates the factor
variance and refers to measurement error of measure i.
The value of AVE should be at least 0.50 to be considered as sufficient in
explaining more than half of the variance of a construct’s measures (Fornell &
Larcker, 1981; Henseler et al., 2009; Hair et al., 2012), whereas a value less than
0.50 indicates that the variance is related more with error variance rather than
variance of the measures (Gotz et al., 2010).
The discriminant validity test examines whether or not items differentiate
among constructs or measure different concepts. There are two ways to determine
discriminant validity in PLS, based on items cross-loadings and Fornell-Larcker

188
criterion (Henseler et al., 2009). The item cross-loadings approach tests the
existence of discriminant validity at the item level, suggesting that the loading for
each measure should be higher compared to all its cross-loadings (Gotz, et al.,
2010). While the commonly accepted threshold for items loadings is 0.70 (Gotz et
al., 2010), Hair et al. (2010) accept a cut-off value of 0.50 and Chin (2010) also
acknowledges that in exploratory studies, a factor loading of 0.50 is acceptable. In
a more recent study, Hair et al. (2012) suggest that loadings of 0.40 are acceptable
in studies involving newly developed measures such as in this study.
Unlike the item cross-loadings test which is more liberal, the Fornell-
Larcker criterion test developed by Fornell and Larcker (1981) is regarded more
systematic (Henseler et al., 2009; Chin, 2010). The Fornell-Larcker test proposes
that the square root of the AVE for each construct should be greater than its
correlations with other construct to achieve discriminant validity. This is to indicate
that a construct shares more variance with its measures rather than with other
constructs.
To test the validity of formative construct in PLS analysis, the weights and
the significance of the formative indicators are observed. Based on t-statistics and
level of significance (p values) from the bootstrapping procedure as well as the
PLS weights (Henseler et al., 2009), decisions will be made whether to retain or
drop a measure from the model. This procedure enables the relevance of each
measure in forming the construct to be assessed (Hair et al., 2012).
Formative measures could contain positive, negative or no correlations, and
normally is smaller than factor loadings (Gotz et al., 2010). For formative
189
measures, Diamantopoulos and Winklhofer (2001) suggest that any non-significant
indicator should be eliminated to obtain a better significance path. Bollen and
Lennox (1991) and Henseler et al. (2009), however, suggest retaining both
significant and non-significant indicator to maintain the content validity of the
formative constructs as long as its existence is conceptually justified. This means
that formative indicators with small weights and non-significant paths should not
simply be eliminated. The decision to eliminate a formative measure has to take
into account its contribution to the construct since eliminating a measure could
possibly change the meaning of the construct (Cenfetelli & Bassellier, 2009).
Unless multicollinearity apparently exists, then the measure is recommended to be
eliminated from the model (Gotz et al., 2010). This is because a high level of
multicollinearity suggests redundancy (Henseler et al., 2009).
The level of multicollinearity among the formative indicators could be
examined by calculating the variance inflation factor (VIF), the condition index for
each indicator (Hair et al., 2012) and the tolerance value (Hair et al., 2013). The
lower VIF values suggest less multicollinearity among the indicators. Prior studies
suggest cut-off values for VIF should not exceed 3.3 (Diamantopoulos & Siguaw,
2006), 5.0 (Hair et al., 2012) and 10 (Hair et al., 2010; Gefen et al., 2011).
However, any VIF value more than 1 indicates the existence of multicollinearity
even though it is not substantial (Henseler et al., 2009). The value for condition
index, as suggested by Diamantopoulos and Siguaw (2006) and Hair et al. (2012),
should not exceed 30 to ensure there is no multicollinearity in the model. A
tolerance value of 0.20 and lower indicate the possibility of multicollinearity (Hair
et al., 2013).

190
(b) Evaluation of the structural model
Once the measurement model has been successfully evaluated, the
evaluations of structural model in PLS could be performed based on R-squares and
path coefficient. In addition, to determine the statistical significance of the path
coefficient in the structural model, a resampling technique needs to be used. The
analyses are further discussed below.
(i) R-squares
The primary analysis to test the structural model is by observing the value
of R-squares, which indicate the coefficient of determination. The R-squares
measure the relationship of the construct’s variance with its total variance and are
interpreted similar to ordinary least squares regression (Chin, 2010). There is no
threshold level for an acceptable R-square since it depends on the research context
(Hair et al., 2012). However, the higher R-squares are the better since they explain
a higher percentage of variance (Gotz et al., 2010). It is also commonly accepted
that the value of 0.60 is considered as substantial while 0.30 is regarded as
moderate and value around 0.19 indicates weak relationship (Henseler et al., 2009;
Urbach & Ahlemann, 2010).
(ii) Effect size
Additionally, the R-squares are also useful in examining the impact of an
independent latent variable on a dependent latent variable, known as the effect size,
signified by . The effect size is determined by performing the calculation of the
dependent variable’s coefficient in the structural model twice, first with the
respective independent latent variable, and second without that particular

191
independent latent variable. Similar to the interpretation of multiple regressions
promoted by Cohen (1988), of 0.02, 0.15 and 0.35 suggests weak, moderate,
and strong effects (Henseler et al., 2009; Chin, 2010; Gotz et al., 2010; Hair et al.,
2012). The effect size formula is defined as follows:
(iii) Path coefficient
The next step is to examine the path coefficient of the relationship between
constructs. In this case, the algebraic signs, magnitude, and significance of the path
coefficient are observed. Paths which signs are contrary to the theoretical
assumptions are considered as not supporting the postulated hypotheses and should
be rejected. To assess the significance of the path coefficient, Henseler et al. (2009)
and Hair et al. (2012) suggest using the bootstrapping technique which provides t
values and p values. The magnitude of the path coefficient indicates the strength of
the relationship which should be at least 0.10 and the level of significance should
be at least 0.50 (Urbach & Ahlemann, 2010).
(iv) Bootstrapping
Since PLS does not assume normality data distribution, it relies on
nonparametric resampling technique in its evaluations. There are two methods to
conduct this resampling in PLS, bootstrapping and jack-knifing (Hair et al., 2012).
The jack-knife procedure which is perceived as an approximation to bootstrapping,
however, has been applied less in recent years most likely because it is viewed as
less competent compared to bootstrapping (Chin, 2010). To examine the

192
significance level in PLS, the study performed the bootstrapping technique which
generates the t values and confidence intervals. The bootstrapping technique
assumes that the observed sample represents the population and creates bootstrap
samples by randomly replacing the cases from the original dataset. Each bootstrap
samples contains the same number of cases as in the original sample (Henseler et
al., 2009). In this study, a resampling with 5000 samples is used consistent with the
suggestions by Henseler et al. (2009) and Hair et al. (2011; 2012).
4.8 Interview
A qualitative enquiry such as interview could be used to understand patterns
of experience in lives (Dilley, 2000) since the perspective of others could be
meaningful and able to be made explicit (Patton, 1990). Due to this, researchers
conduct interview to understand “what is in and on someone else’s mind” (Patton,
1990, p. 278). The interviews in this study are conducted to provide more
information on the factors that influence tax agents in their decision-making while
performing their engagement roles. Furthermore, as mentioned in Section 4.2, the
use of interviews in this study for data collection reflects the emic (inside
perspective) approach in understanding the tax compliance behaviour of tax agents
in Malaysia and New Zealand. In the emic approach, researchers use a specific
culture to understand the issue being examined and researchers normally used
ethnography, interview, and observation to collect data because the nature of emic
dimensions is cultural specific (Malhotra et al., 1996).
One of the criticisms of using Hofstede’s (1980) National Cultural
Dimensions is that survey is not appropriate to be used in examining culture
(Baskerville, 2005). In view of the foregoing, the use of interviews in this study
193
could complement the weaknesses of using a survey in understanding the influence
of culture in tax compliance behaviour of tax agents since the survey itself, as
suggested by Feilzer (2010), may only provide a glimpse of the social phenomena
without providing in-depth understanding of which the interview could offer.
Lincoln and Guba (1985) differentiate interviews into two types: structured
interviews and unstructured or specialized interviews. In a structured interview,
researchers prepare the questions prior to the interview and participants are
expected to provide answers according to the framework prepared by the
researcher. On the other hand, an unstructured interview depends on the
participants’ responses during the interview to guide the direction of the interview.
Saunders et al. (2003) suggest three different categories: structured, semi-structured
and unstructured or in-depth interviews, while Bryman and Bell (2011) broadly
grouped interviews into two types: structured interviews and qualitative interviews,
(with the latter is formed from semi-structured and unstructured interviews).
Structured interviews use a questionnaire with questions and standard answers
determined a priori (Saunders et al., 2003; Bryman & Bell, 2011). Similar to
Saunders et al. (2003) explanation of the features of semi-structured and
unstructured interviews, a qualitative interview is considered to be nonstandardized
(Bryman & Bell, 2011).
The different types of interview serve different purposes of studies.
According to Saunders et al. (2003), a structured interview is more appropriate for
a descriptive or explanatory based study while a semi-structured interview is more
suitable for exploratory and explanatory based studies. The unstructured or in-
depth interview is more useful for studies which are exploratory in nature

194
(Saunders et al., 2003). In this study, the researcher used the semi-structured
interview and the justifications for using semi-structured interview are further
discussed in Section 4.8.1.
4.8.1 Justifications for using semistructured telephone interview
A semi-structured interview is the most common approach of all qualitative
methods (Alvesson & Deetz, 2000). This is probably due to its flexibility (Bryman
& Bell, 2011), since although the researcher has a list of questions and themes to be
covered, these may vary from one interview to the other (Saunders et al., 2003). A
semi-structured interview also has the ability to disclose important aspects of
human behaviour (Qu & Dumay, 2011) because a semi-structured interview could
reveal not only the ‘what’ and ‘how’ but also the ‘why’ (Saunders et al., 2003).
Consequently, the researcher chose the semi-structured interview to explain further
the factors that have been examined in the questionnaire survey. At the same time,
the semi-structured interview was also used to discover if there were any other
factors that may influence tax agents in their decision-making while performing
their engagement roles.
Interviews could be conducted in the form of a focus group or one to one,
which for the latter, researchers could either perform this as a face-to-face
interview or by telephone (Saunders et al., 2003). Despite some drawbacks of using
telephone interviews, such as missing the opportunity to witness the nonverbal
reactions (body language) of the interview participants which could be important in
interpreting the findings (Bryman & Bell, 2011), and the limited time to conduct
the telephone interview resulting in less participation and lack of an opportunity to

195
ask complex questions (Saunders et al., 2003), the use of telephone interview in
this study is considered to be appropriate.
This study examines the ethical decision-making of tax agents in complying
with the tax laws while performing their engagement roles, which could be
considered to be sensitive and involves tax agents who are located in different parts
of Malaysia and New Zealand. Therefore, it is impractical to conduct face-to-face
interviews due to the scattered distance, time involved and cost constraints. It is
also cost and time effective to use the telephone in conducting the interview since
tax agents are normally busy people. Furthermore, Bryman and Bell (2011) suggest
that a telephone interview is more effective in encouraging participation during
interviews especially if the interviews involve sensitive issues. Qu and Dumay
(2011) also recommend that it is not appropriate to use, for instance, a focus group
to study sensitive issues.
4.8.2 Development of interview guide
To assist the researcher during the interview process, the researcher
prepared an interview guide, consisting of a list of questions based on several
themes relevant to the study. Even though the themes are determined a priori based
on the literature review, the nature of a semi-structured interview which is flexible
(Bryman & Bell, 2011) allows some freedom for other themes to emerge during the
interview. This helps to understand further the tax compliance behaviour of tax
agents in the study.
Compared to structured interview, the lack of standardization in semi-
structured interviews could become a disadvantage as well since it could result into
lack of reliability in its findings (Saunders et al., 2003). The use of an interview

196
guide could be helpful in reducing the reliability issues since the interview guide
helps the researcher to ensure that the interviews are more systematic and focused
on within a subject area (Patton, 1990). In this study, the use of the interview guide
as the “guide to the journey” (Dilley, 2000, p. 133) also helps the researcher to
carefully manage the limited time and resources (Patton, 1990).
The interview guide used in this study covers the importance of the Theory
of Planned Behaviour (TPB) items, ethics, and culture in complying with the tax
law from the viewpoints of tax agents. While these factors have been examined in
the survey, the viewpoints of tax agents participated in the interview provide
further understanding on the influence of these factors in their decision-making
while performing their roles. In developing the interview guide, the researcher also
obtained suggestions from accounting academics who are expert in qualitative
research, and as a result some changes have been made to the wording of the
questions.21 The interview guide for the study is presented in Appendix G of this
thesis.
4.8.3 Sample selection for interview
Sampling in qualitative inquiry is different from the quantitative approach
since qualitative inquiry emphasizes on obtaining rich information, while
quantitative approach concerns more with generalization in understanding social
phenomena. While Patton (1990) suggests 16 strategies in selecting samples for
qualitative inquiry, sampling in qualitative studies could be broadly regarded as
purposeful sampling (Patton, 1990; Coyne, 1997). This is because a researcher
21 The initial draft of the interview guide was presented during the proposal defence at the
Department of Accounting and Information Systems, University of Canterbury.

197
purposely selects information-rich cases which could fit into the study (Coyne,
1997).
As discussed in Section 4.6, in selecting the sample for the qualitative phase
in this study, the researcher also has to take into account that the findings from the
qualitative phase are used to provide in-depth understanding of the factors that
influence tax agents in their decision-making while performing their engagement
roles. For that reason, the interview participants in this study were identified from
the survey conducted by the researcher in the quantitative phase of this study. The
interview participants came from those survey respondents who agreed to be
involved in the interview. This type of sampling could be considered as self-
selection sampling as explained by Saunders et al. (2003, p. 177) since the
researcher allows individual “to identify their desire to take part in the research”.
Invitations to participate in the interview were sent together with the survey to
potential survey respondents in Malaysia and New Zealand.
4.8.4 Sample size for interview
The process to understand social phenomena in quantitative and qualitative
methods have different approaches. While a quantitative method focuses on
numbers to derive meanings, a qualitative method on the other hand emphasizes the
richness of information or words to develop meanings in understanding social
phenomena (Saunders et al., 2003). This is because under the qualitative method,
the purpose is to obtain contextual understanding of a particular situation which
requires rich data and depth understanding, and as a result the issue of
representativeness in qualitative methods is less important compared to quantitative

198
methods (Bryman & Bell, 2011).The concept of emphasizing words rather than
numbers guides the researcher in this study to determine the appropriate sample
size for the qualitative approach performed in this study.
In determining the appropriate sample size in qualitative inquiry, Patton
(1990, p.184) argues that:
“There are no rules for sample size in qualitative inquiry. Sample
size depends on what you want to know, the purpose of the inquiry,
what’s at stake, what will be useful, what will have credibility, and
what can be done with available time and resources.”
Patton’s (1990) argument implies that there is no specific guideline to
determine sample size in qualitative studies and several factors such as richness of
information, available time and resources, guide researchers in deciding the
appropriate sample size. One approach suggested by Lincoln and Guba (1985, p.
202), in determining the appropriate sample size in a qualitative study, is to rely on
the concept of redundancy or data saturation effect as a rule: “Finally, the criterion
invoked to determine when to stop sampling is informational redundancy…”
However, Guest et al. (2006) argue that the concept of the data saturation
effect is difficult to be applied prior to data collection, and instead suggest that for
an interview, the minimum sample is 12 participants. If the sample is highly
homogenous, a sample of 6 interviews would be sufficient to enable a meaningful
theme to appear (Guest et al., 2006). While Collins et al. (2007) suggest that the
appropriate number of participants in qualitative-based studies depends on expert

199
opinion they also provide a summary on the recommended minimum number of
sample size for most common qualitative studies reproduced as follows:
Table 4.5 Recommended Minimum Sample Size for Most Common
Qualitative Research Design
Research design Minimum sample size suggestion
Case study 3-5 participants (Creswell, 2002)
Phenomenological 10 interviews (Creswell, 1998), 6 interviews
(Morse, 1994)
Grounded theory 15-20 participants (Creswell, 2002), 20-30
participants (Creswell, 1998)
Source: Adapted from Collins et al. (2007, p. 273).
In this study, the sampling procedure for the interview is based on self-
identified sampling. Therefore, the sample size relies heavily on the willingness of
survey respondents to participate in subsequent interviews while at the same time
considering the time and resources available.
4.8.5 Data collection procedure
Following the different modes of collecting survey data in Malaysia and
New Zealand, as discussed in Section 4.7.4, this study used two different methods
of sending invitation to participate in the semi-structured telephone interview. The
researcher sent the invitation to participate in interviews with the mail survey
questionnaire in Malaysia and online web-based survey in New Zealand.
In Malaysia, the researcher mailed the invitation to participate in the
interview and the consent form, together with the questionnaire survey and two
self-addressed stamped envelopes to ensure that there was no association between
the respondents in the survey and the interview participants. As mentioned in

200
Section 4.7.4.1, the researcher also attached a cover letter explaining the purpose of
the study, confirming the anonymity of the responses of the survey, ensuring the
confidentiality of the interview data and confirming that the relevant ethics
clearance has been obtained, with the survey package. In the consent form
(available in Appendix H), the author also requested the interested participants to
provide their correspondence details.
As discussed in Section 4.7.4.2, an online web-based survey was used to
collect quantitative data in New Zealand. In the introduction email to potential
survey respondents, apart from the survey link, another link inviting participation
in interviews was also included. The separate link was to ensure that the
information provided in the interview link could not be associated in any manner
with the responses in the earlier survey. The author briefly explained the procedure
for the interview, confidentiality of the interview information, confirmed the
relevant ethical clearance, requested their consent to perform the interview, and
required interested participants to provide their contact details.
As stated earlier, the potential interview participants in Malaysia and New
Zealand were required to provide their correspondence details, such as name,
contact number, email address, date, and time they would be available for the
interview. A few days before the interviews, the researcher made follow-up
telephone calls requesting the tax agents to confirm their participation. Since tax
agents are busy people, this approach allows the interview participants to determine
their own availability, and could avoid bias in responses between those who are
busy and less busy, since participating in an interview is time consuming (Saunders
et al., 2003).

201
The interviews were conducted between November 2011 and January 2012
in Malaysia. Since the researcher felt that the initial interview participants in New
Zealand (n = 6) were not sufficient to provide in-depth understanding of tax
agents’ compliance behaviour in New Zealand, the telephone interviews in New
Zealand were extended to February 2012 after sending the survey reminder for the
second time. On average each participant in this study was interviewed for
approximately 30 to 45 minutes. In Malaysia, the interview was conducted using a
mix of Bahasa Malaysia and English. This was because, as mentioned in Section
4.7.4.1, while Bahasa Malaysia is the official language in Malaysia, English is
commonly used in commerce (Foo & Richards, 2004).
Before the start of the interview, the researcher briefly explained to the
interview participants about the objective of the study, interview process, and asked
for their consent to record the interview. The interview was recorded using an
audiotape and this allowed the researcher to concentrate on the questioning and
listening during the interview (Saunders et al., 2003). The recordings of the
interviews also provide opportunities for a more thorough examination on the
information which could lead to more accurate findings (Bryman & Bell, 2011).
4.8.6 Data analysis
A few approaches have been suggested by researchers to analyse qualitative
data. Lincoln and Guba (1985), for instance, propose the concepts of unitizing,
categorizing, finding patterns, and member checking. Unitizing refers to finding
units of information that can be used to form categories. A unit of information has
two features: it could provide some understanding to what the researcher wants to

202
know and is interpretable on its own. The second step, categorizing, involves
reviewing all the units and put them into the appropriate categories. It is in this
second step that new themes or categories emerge. In this second step, researchers
name the categories which form the content of the category. The next step is
finding the patterns of the categories by ensuring that the categories are not
overlapping, checking if there is any association between the categories, and
review the entire category to ensure nothing has been omitted. Finally, the member
checking procedure requires interview participants to check the construction of the
interview information and agree that the analysis reflects their actual interview
answers.
Saunders et al. (2003) suggest that data analysis in qualitative methods
could broadly follow the deductive or inductive approaches. However, they also
argue that it is possible to combine both methods in analysing qualitative data. The
deductive approach starts with designing the questions according to a
predetermined theory and thus the theme for the interview emerges from the
interview questions. On the other hand, in an inductive approach, the researcher
collects the data, analyses it and at the same time examines which themes will be
focused on further. In the inductive approach there is no theory developed prior to
the data collection; instead, the theory emerges from the data collection process
(Saunders et al., 2003).
Another approach to analyse qualitative data is by using thematic analysis.
According to Braun and Clarke (2006), thematic analysis is the foundation method
for qualitative analysis which involves finding repeated patterns of meaning from
data. It is a method to identify, analyse, and report the patterns in data. Despite the

203
argument that thematic analysis is perceived as accepting any themes emerge from
the data, thematic analysis is still considered to be essential due to its flexibility,
ease to apply, ability to capture similarities and differences across the data set, and
ability to generate unanticipated insights (Braun & Clarke, 2006). The six phases of
thematic analysis as suggested by Braun and Clarke (2006) are summarized in
Table 4.6.
Table 4.6 Phases in Thematic Analysis
Phases Process
1 Familiarizing with the
data
Transcribing the data (if necessary)
2 Generating initial codes Coding systematically interesting features of the data
3 Searching for themes Collating codes into potential themes
4 Reviewing themes Checking if the themes represent the data at level 1 and
level 2
5 Defining and naming
themes
Refine the specific themes, the overall account of the
data, generating clear definitions and names for each
theme
6 Producing the report Relating back the analysis with the research questions
and the literature, producing report
Source: Adapted from Braun and Clarke (2006, p.87).
The discussion on qualitative data analysis suggests that there are similar
steps which have to be performed in analysing qualitative data. In this study, the
researcher used a combination of deductive and inductive approaches in analysing
the data to provide better understanding on the factors that influence tax agents in
their decision-making. While in the deductive approach the themes are determined
based on the questions asked, the inductive approach, on the other hand, allows
themes to emerge from the data itself. The use of deductive and inductive approach

204
as the foundation is aligned with the purpose of conducting semi-structured
interviews, which was discussed earlier. In addition, the researcher also referred to
the steps suggested by Lincoln and Guba (1985) and Braun and Clarke (2006) in
analysing the data which, in the opinion of the researcher have some similarities.
Essentially, there were three main steps involved in analysing the interview
data for the study. Firstly, the researcher transcribed the recording into written text.
The process of transcribing interview recordings is the first step in data analysis
and it is important because it reflects how the researcher interprets the data (Bailey,
2008). On average it took approximately 4 hours for the researcher to transcribe the
recording of each interview. This amount of time was required, since as suggested
by Bailey (2008), transcription involves close observation of the data by repeated
careful listening to the audiotape. As the interview in Malaysia was conducted in a
mixed language of Bahasa Malaysia and English, after transcribing the recording
for the Malaysian sample, the researcher translated the raw transcript into a full
English text before further analysis.
The second phase was the process of coding the data (Braun & Clarke,
2006) or ‘unitizing’ as suggested by Lincoln and Guba (1985). Once the coding
process has been completed, the researcher put the codes into the respective
themes. Some of the themes were determined a priori based on questions asked
during the interviews; however, some new themes also emerge from the interview
responses. The themes of the interview will be discussed further in Chapter 7
containing Interview Findings Apart from finding the themes, in this second step
the researcher also assigns names to the themes and checks for theme consistency
so that the names of the themes reflect their content and there is no overlapping of

205
codes in the themes. Finally, to increase the validity of the findings, the final stage
involved the member checking procedure as suggested by Lincoln and Guba
(1985), Creswell and Miller (2000), and Creswell (2009).
4.8.6.1 Reliability and validity of interview findings
In qualitative methods, reliability and validity have different concepts
compared to reliability and validity in quantitative methods. Reliability in
qualitative methods does not suggest findings will be repeatable since the findings
reflect the reality at the time when the interviews are performed (Saunders et al.,
2003). Following the suggestions by Saunders et al. (2003), Braun and Clarke
(2006), and Creswell (2009), to increase the reliability of the interview findings,
the researcher transcribed the recording, repeatedly checked the transcript, and
compared the transcript against the recording to ensure there was no obvious
mistake.
Validity in qualitative research is defined as how accurate and reliable the
data represent the realities of the interview participants in understanding the social
phenomena (Creswell & Miller, 2000; Le Compte, 2000). One common method to
determine the validity in a qualitative study is to use the member checking
procedure (Lincoln & Guba, 1985; Creswell & Miller, 2000; Creswell, 2009). The
member checking procedure is considered to establish the validity of qualitative
findings using the lens of the participants (Creswell & Miller, 2000). It is among
the eight primary procedures frequently used to determine validity in a qualitative
study (Creswell, 2009). The member checking procedure involves requesting
interview participants to confirm the credibility of the information by asking the
participants to check whether the themes are correct and the overall information is
206
accurate (Creswell & Miller, 2000).22 In this study, five interview participants
checked the refined interview transcripts and the themes identified in determining
the validity of the findings. All of them agreed with the themes proposed in the
study.
4.9 Summary
The discussions in this chapter started with the research paradigm used in
this study, followed by the emic and etic approaches in cross-cultural research,
motivation for using mixed-methods approach, design of the study, and ethical
clearance. The sample selection in mixed-method study was also highlighted before
moving to the discussions on the quantitative and qualitative methods used in the
study.
The discussions on quantitative methods initially were centred on the
justification of using survey. Sample selection and sample size for the survey, pilot
testing, procedure to collect data, the design of the questionnaire were also
highlighted for both Malaysia and New Zealand. The discussions proceeded with
construct development and measurement (reflective, formative, second order
factor, measures for variables tested in the study) for both countries. The researcher
also explained the procedures for data preparation and pre-analysis, namely the
data screening process, tests for response representativeness, nonresponse bias,
common method bias, social desirability bias, and descriptive analysis. The
discussions were then concentrated on structural equation modelling (SEM) applied
in the study, explaining the types of SEM modelling and model evaluations, both at
22 According to Creswell (2009), it is sufficient to provide the participants with the preliminary
analysis consisting of themes of interview findings in member checking procedure.

207
the measurement of the first-order factor and second-order factor, and structural
models.
In this chapter, discussions on the qualitative approach (interview) were
also presented by first explaining the types of interviews and followed by
justifications for using semi-structured telephone interview. The development of
interview guide, sampling and sample size for interviews, and procedures to collect
interview data for both Malaysia and New Zealand were also discussed. In
addition, the researcher also highlighted the data analysis process for the interview
data, namely transcribing, coding, finding themes and checking for reliability and
validity of the findings. The next chapter, Preliminary Analysis and Results
presents the preliminary findings from the survey for both Malaysia and New
Zealand.


209
CHAPTER 5
PRELIMINARY ANALYSIS AND RESULTS
5.0 Introduction
This chapter presents the preliminary results from the survey analysis
before performing the model assessment analyses as set out in Chapter 6. The
chapter is divided into two main parts: the survey response analysis, and
preliminary analysis. The discussions in the survey analysis part focus on the
response rate, demographic background of survey respondents, response
representativeness and nonresponse bias for both Malaysia and New Zealand. In
the preliminary analysis, the explanations centre on the data screening process,
common method bias results, findings from the social desirability bias analysis,
descriptive analysis and finally, the results from the t-test analysis. The chapter
ends with a summary.
5.1 Survey response analysis
The survey response analysis discusses the response rate for both Malaysia
and New Zealand, demographic profiles of survey respondents in Malaysia and
New Zealand, response representativeness in both countries and non-response bias
analysis.
5.1.1 Response rate
In any survey studies, the survey response rate is important for the
generalisation of the findings to the whole population (Sekaran and Bougie, 2010).
Ideally, a high response rate is required to generalise the findings since a low

210
response rate suggests that the findings need to be generalized with great caution
(Saunders et al., 2003). In the case of a low response rate, another approach is to
generalise the findings to the observed samples participated in the study rather than
generalise the findings to the whole population (Sekaran, 2002). The survey
response rates for Malaysia and New Zealand are explained in the following
subsections.
5.1.1.1 Malaysia
In Malaysia, the data collection was made between October 2011 and
December 2011. Out of 1,500 survey questionnaires mailed to tax agents, 3 blank
survey questionnaires were returned to the researcher with a note informing the
agents are no longer in tax practice and provide only management accounting
services. During the follow-up, the researcher was also informed that 3 addressees
have moved to other business premises and a further 9 survey questionnaires were
unable to be delivered to the potential respondents. Eventually only 92 responses
were completed and returned to the researcher for analysis. The survey response
rate for Malaysia is summarized as follows:
Table 5.1 Mail survey response rate for Malaysia
Particulars Quantity
Number of questionnaires mailed 1,500
No longer in tax practice (3)
Delivered but addressee has moved (9)
Total available questionnaires 1,488
Number of responses received 92
Response rate (%) 6.2

211
The response rate for Malaysia was ascertained by calculating the number
of responses received with total available questionnaires, resulting in a 6.2 percent
of response rate. It is disappointing to note that the response rate obtained from
Malaysia is low and lower than the average of 30 percent response rate for postal
mail survey as suggested by Evans (2003) in tax compliance cost studies. Low
response rates in tax studies have been experienced by other tax studies as well. A
study on tax compliance cost of personal taxpayers in India by Chattopadhyay and
Das-Gupta (2002) for instance, only managed to obtain a response rate of 2 percent
from the postal survey, and out of 120 questionnaires sent to tax agents only 1
questionnaire was completed and returned. A recent study by Mohd Isa (2012)
among corporate taxpayers in Malaysia for instance, indicates an overall mixed-
mode survey response rate of 5 percent. If analysed independently, the postal
survey in Mohd Isa (2012) study only generated 59 useable responses with 2.5
percent response rate.
There are several possible reasons contributing to the low response rate
obtained for Malaysian survey. In Malaysia, a cross between systematic random
sampling and snowballing sampling was used to select samples for the study. The
snowballing sampling required tax agents who were initially identified from the
systematic random sampling to disseminate the questionnaires to their colleagues.
However, the researcher could not determine if the tax agents either refused to
distribute the other two survey packages to their colleagues or even if they
disseminated them, they could not enforce their colleagues to participate since this
survey is voluntary. For instance, during the follow-up, some tax agents mentioned
that they had passed the other two survey packs to their subordinates but they could

212
not force them to participate. As a result, the actual number of surveys distributed
and received by potential respondents in Malaysia is not known which may lead to
the low response rate for Malaysia.
In addition, some tax agents mentioned that they are busy and do not have
the time to fill in the questionnaire survey despite being informed by the researcher
during the follow-up calls that late responses are still acceptable. The busy
schedule of tax agents even during the off peak period is understood since they
may be involved in other tax work, such as tax planning, and to a certain extent
could contribute to their reluctance to participate in the study. Given the sensitive
issues explored in the survey, there is also the possibility that some tax agents do
not feel comfortable to answer questions about themselves despite participation
being anonymous. Another potential factor is that there are some tax agents who
simply do not have the interest to participate without giving further explanation for
their refusal. During the follow-up calls some tax agents mentioned that they have
received the questionnaire but did not guarantee that they would participate in the
study.
Nonetheless, the number of useable responses in this study is adequate for
further analysis. The number of responses exceeds the requirement for PLS
analysis based on the ten times rules of thumb as suggested by Hair et al. (2012).
The ten times rule of thumb suggests that the minimum number sample size should
be ten times the number of path relationships directed to a particular construct in
the structural model (Hair et al., 2012). The number of responses also fell between
the minimum sample requirement suggested by Chin and Newsted (1999) for PLS

213
analysis, and exceeds the recommended minimum sample size for quantitative
studies by Collins et al. (2007).
5.1.1.2 New Zealand
In New Zealand, the data collection was made between October 2011 and
January 2012. The questionnaire was developed using Qualtrics Survey Software
(QSS) subscribed by the University of Canterbury, and disseminated to 1,500
members of NZICA listed as public practitioners in New Zealand, (details are
available from NZICA’s website). An introductory email explaining the
background of the study, containing the links for the survey and interview, was sent
to these 1,500 potential participants. Out of these 1,500 initial invitations, 16 tax
agents sent emails to the researcher, notifying their refusal to participate in the
study. A further 185 emails were opened by potential respondents and 135
participants provided their responses. The survey response rate is provided in Table
5.2.
Table 5.2 Online survey response rate for New Zealand
Particulars Quantity
Number of invitations 1,500
Not able / not willing to answer (16)
Total available 1,484
Emails opened 185
Number of responses received 135
Response rate (%) 9.1

214
The response rate for the study was determined by calculating the ratio of
number of responses received to total surveys available, yielding a 9.1 percent
response rate.23 Similar to Malaysia, the total responses are somewhat
disappointing, but the sample size is sufficient for statistical analysis. Other tax
studies using online surveys also obtained low response rates. Tran-Nam and
Karlinsky (2008), for instance, recorded a survey response rate of 8.6 percent in an
online survey among tax agents in Australia. In recent online surveys among small
business taxpayers in Australia, Lignier and Evans (2012) only obtained a response
rate of around 4.5 percent. Another recent online surveys among small business
taxpayers in Canada, South Africa and United Kingdom by Hasseldine et al.
(2012), also recorded low response rates of 1.35 percent, 6.7 percent and 0.9
percent respectively. Furthermore, the completed useable responses of 119 for
New Zealand, as explained in sub-section 5.2.1, meets the requirement of the “ten
times rule of thumb” in determining the minimum sample size in PLS (Hair et al.,
2012, p. 144), and exceeds the minimum requirement for a sample size suggested
by Chin and Newsted (1999) and Collins et al. (2007).
Some feedback provided by the Chartered Accountants invited to
participate in the survey suggest several reasons for not participating. First, not all
Chartered Accountants listed as “Public Practitioner” in the NZICA’s website are
in tax practice. There are members who are involved only in other accounting
practices such as auditing, management accounting and financial accounting. The
database available from the NZICA’s website, however, does not differentiate 23 Tran-Nam and Karlinsky (2008) calculated the response rate in their study, which also used an
online questionnaire, by dividing the actual number of responses with the total number of emails
opened. If the same method is applied in this study, it generates a response rate of 72.97 percent.

215
members according to their expertise in sub-areas of accounting namely audit, tax,
management and financial accounting. Therefore, it is unlikely to prepare a list
containing only tax agents from the database. Consequently, there is a possibility
that the sample frame may have not captured the actual number of NZICA
members who practised as tax agents, resulting into an understated response rate.
Some of the comments indicate this situation:
“We only do audit, no taxation”
“We only do management systems and financial systems”
Another potential reason is tax agents are over-committed and have time
constraints with their tax work, as suggested by the following electronic mails sent
to the researcher:
“I am over-committed this time”
“Sorry, do not have the time”
In addition to that, there are also Chartered Accountants who indicated their
reluctance to participate without giving any further reasons as commented below:
“Not able to participate”
“Unable to do the survey”
As a result of higher internet security practised by organizations, there is
also a possibility that the emails sent to the potential survey respondents are not
delivered into their mailbox and considered as unsolicited or spam emails (Bryman
and Bell, 2011). Thus, the actual number of surveys received by tax agents is
unknown, and this could be another possible reason contributing to the low
216
response rate obtained in this study. Similar to Malaysia, it is also likely that some
tax agents refused to participate in the survey due to the sensitive nature of the
survey. As professionals, they may feel uncomfortable to answer questions about
their own tax compliance behaviour.
5.1.2 Demographic background
The demographic background of survey respondents for Malaysia and New
Zealand are tabulated in Tables 5.3 to 5.8. The survey respondent profiles consist
of information on gender, age, ethnicity, working experience, type of firms
currently working, and position in the firm. While there are differences in
demographics between the Malaysian and New Zealand samples, no further test
was conducted since this study used the TPB which assumes that the influence of
demographic background is already captured in the attitude of the respondents.
5.1.2.1 Gender
With reference to the gender of survey respondents, it could be suggested
that for Malaysian respondents, female tax agents dominated the survey
participation compared to male tax agents. More than half of the survey
respondents in Malaysia are female (53), compared to 39 males who participated in
the study. In New Zealand, males dominated the survey participation with 83
participants, with 35 only from females.

217
Table 5.3 Gender of survey respondents
Malaysia New Zealand
Gender Frequency Percent Frequency Percent
Male 39 42.4 83 69.8
Female 53 57.6 35 29.4
Missing 0 0 1 0.8
Total 92 100 119 100
5.1.2.2 Age
In Malaysia, the majority of the respondents were below the age of 30 (45.6
percent). In contrast, only nine New Zealand respondents fell below this age level.
The data also indicates that a significant number of the New Zealand respondents
were between the ages of 41 to 55 years old (61.4 percent) as illustrated below.
Overall, it could be suggested that respondents from Malaysia are younger
compared to the New Zealand respondents.
Table 5.4 Age of survey respondents
Malaysia New Zealand
Age (years) Frequency Percent Frequency Percent
25 or below 22 23.9 6 5.0
26-30 20 21.7 3 2.5
31-35 11 12.0 8 6.7
36-40 13 14.1 8 6.7
41-45 9 9.8 25 21.0
46-50 5 5.4 21 17.7
51-55 4 4.3 27 22.7
56-60 3 3.3 8 6.7
Over 60 5 5.4 13 10.9
Missing 0 0 0 0
Total 92 100* 119 100*
*Note: Rounded-up to the nearest whole number.

218
5.1.2.3 Ethnicity
With regard to ethnicity, majority of the respondents were Malays with 74
respondents (80.4 percent), followed by 15 Chinese and 2 Indian respondents.
Likewise, in New Zealand, the survey participation is also dominated by those with
European ethnicity with 104 respondents (87.4 percent). Other ethnics such as
Maori, Pacific and Asian, are represented by 6 respondents (5 percent) from the
total survey participation. Seven respondents fell under the category of “Others”,
but did not elaborate further their ethnicity.
Table 5.5 Ethnicity of survey respondents
Malaysia New Zealand
Ethnicity Frequency Percent Ethnicity Frequency Percent
Malay 74 80.4 NZ
European
104 87.4
Chinese 15 16.3 Maori 1 0.8
Indian 2 2.2 Pacific 1 0.8
Asian 4 3.4
Others 7 5.9
Missing 1 1.1 Missing 2 1.7
Total 92 100 119 100
5.1.2.4 Working experience in tax practice
A significant number of survey respondents in Malaysia have less than 5
years of experience in tax practice (41 respondents) contributing to 44.6 percent of
the total survey participation. Twenty one respondents, equivalent to 22.8 percent,
have around 11 to 20 years of tax working experience, followed by 17 respondents

219
who have between 5 to 10 years tax working experience. In this study, 13
respondents from Malaysia had more than 20 years of tax working experience.
A different pattern of tax working experience is recorded for New Zealand.
The majority of the New Zealand respondents, 62 tax agents, stated that they have
more than 20 years of tax working experience which is equivalent to 52.1 percent.
This is followed by 33 respondents (27.7 percent) who indicated that they have
around 11 to 20 years of experience in tax practice. Thirteen respondents (10.9
percent) have between 5 to 10 years of tax working experience and 11 of the
respondents mentioned that they have less than 5 years of experience.
Table 5.6 Working experience of survey respondents
Malaysia New Zealand
Experience
(years)
Frequency Percent Frequency Percent
Less than 5 41 44.6 11 9.2
5-10 17 18.5 13 10.9
11-20 21 22.8 33 27.7
More than 20 13 14.1 62 52.1
Missing 0 0 0 0
Total 92 100 119 100*
Note: Rounded-up to the nearest “0”.
5.1.2.5 Type of firms
The data in Table 5.7 below indicates that majority of the survey
respondents from Malaysia came from small size public accounting firms with 39
participants. They contributed 42.4 percent from the total survey participation

220
from Malaysia. The second largest group of respondents came from medium size
public accounting firms with 30 participations (32.6 percent). There were 8
representatives from “Big Four” public accounting firms, 5 respondents were from
tax consulting firms and 3 sole practitioners. Seven respondents, however, did not
indicate the type of firms they are currently working. Similarly, in New Zealand, a
significant number of participants came from small size public accounting firms
with 73 respondents, who contributed 61.3 percent from the total survey
participation from New Zealand in this study. This is followed by 23 respondents
from medium size public accounting firms, 9 participations each from tax
consulting firms and sole practitioners. The smallest number of participants in New
Zealand came from “Big Four” public accounting firms with only 5 respondents.
Table 5.7 Type of firms of survey respondents
Malaysia New Zealand
Types of firm Frequency Percent Frequency Percent
‘Big Four” public
accounting firms
8 8.7 5 4.2
Medium size public
accounting firms
30 32.6 23 19.3
Small size public
accounting firms
39 42.4 73 61.3
Tax consulting firms 5 5.4 9 7.6
Sole Practitioner 3 3.3 9 7.6
Missing 7 7.6 0 0
Total 92 100 119 100

221
5.1.2.6 Position
The survey respondents were also required to state their current position in
their firm. In Malaysia, for instance, the terms ‘tax assistant’, ‘tax executive’, and
‘tax associate’, basically refer to the most junior level of tax staff in a firm. In this
study, a majority of the respondents from Malaysia, (22 participations), are at the
level of tax assistant/tax executive/tax associate, which constitutes 23.9 percent
from the total survey participation. This is followed by the position of ‘manager’ at
a slightly lower number of participations of 21 respondents (22.8 percent). The
third largest group of respondents from Malaysia are at the level of senior tax
assistant/senior tax executive/senior tax associate, with 17 respondents, and
contribute to 18.5 percent of the total survey participation. Eleven of the
respondents are at the level of Partner, while the positions of senior manager,
principal, director, sole-practitioner and tax consultants, are minimally represented
in this study. Six of the survey respondents declined to state their position in the
firm. In comparison with New Zealand, a majority of the respondents are partners
of the firms. A sizeable number of 36.9 percent, of the total survey participation for
New Zealand in this study were partners. The second position was director, which
is represented by 25 participations or 21 percent. This is followed by respondents
who are at the level of manager with 12 respondents or 10.1 percent. The positions
of principal, sole practitioner and tax consultant were moderately represented with
9 participants for each category. The remaining positions are intermediate
accountant (5 participations), senior accountant (1 respondent), senior manager (2
respondents) and associate partner (3 respondents).

222
Table 5.8 Positions of survey respondents
Malaysia New Zealand
Positions Frequency Percent Positions Frequency Percent
Tax assistant /
executive /associate
22 23.9 Intermediate
Accountant
5 4.2
Senior tax assistant /
executive /associate
17 18.5 Senior
Accountant
1 0.8
Manager 21 22.8 Manager 12 10.1
Senior Manager 3 3.3 Senior
Manager
2 1.7
Principal 1 1.1 Principal 9 7.6
Director 4 4.3 Director 25 21
Partner 11 12 Associate
Partner
3 2.5
Sole Practitioner 3 3.3 Partner 44 36.9
Tax Consultant 4 4.3 Sole
Practitioner
9 7.6
Missing 6 6.5 Tax
Consultant
9 7.6
Missing 0 0
Total 92 100 119 100
5.1.3 Response representativeness
One method to determine the representativeness of the samples is by
comparing the demographic background of respondents with the whole population
(Saunders et al., 2003). Due to the unavailability of information from MIA’s 2012
Annual Report, the representativeness of the samples from Malaysia was
established by comparing only the gender and age of survey respondents with the
MIA membership population. In New Zealand, based on information obtained from

223
the NZCIA‘s 2012 Annual Report, comparisons on gender, age and ethnicity were
made between the survey respondents and NZICA membership population to
determine representativeness.
5.1.3.1 Malaysia
According to the statistics provided in MIA’s 2012 Annual Report, males
and females are equally represented in MIA membership for the year ended June
2012. Looking at both datasets, there is a marginal difference between the ratio of
males and females in the current study with the gender ratio in the total MIA
membership. Based on this, it could be suggested that the gender ratio of males and
females in the current study ‘moderately’ reflects the gender mix of the population.
Originally, the age brackets established for the study were different from
the age bands of the population. To make it more comparable, the age brackets of
the original study were transformed to the same age brackets of the population.
Based on the age tabulation sets out in Table 5.9, in comparison with the MIA
population, it could be suggested that respondents below the age of 30 are over-
represented in the current study.24 The comparison also indicates that the age
pattern of the observed sample differs from the population. While the age of the
population concentrates at the middle age level, the age of observed samples
generally centred on the young and middle age levels. Arguably, the age of the
respondents does not sufficiently resemble the age of the total population.
24 This study did not use MIA members as samples but tax agents in public practice as well as tax
staff employed by the tax agents as explained earlier in sub-section 4.7.1.1. A person is not required
to be a member of MIA to become a tax agent in Malaysia. Even if the employees of the tax agents
are not MIA members, they are still obliged to the same professional ethics as MIA members since
MIA governs the accounting profession in Malaysia.

224
Unfortunately, the breakdown of membership ethnicity is not available
from the MIA’s 2012 Annual Report.25 However, it was reported by the then
MIA’s President in the media that for the year 2012, the representation of Malay
accountants in MIA membership was around 28 percent (Unknown, 2012). Based
on this information, it could be suggested that Malays were over represented in the
study. It also implies that there is little evidence to conclude that the ethnicity of
the observed sample mirrored the ethnicity of the population. Despite this, as
mentioned in sub-section 2.4.2, prior studies in Malaysia such as Lim (2001) found
that, regardless of their ethnicities, managers in Malaysia are similar in their
decision making.26
In general, after reviewing both datasets from three selected criteria, namely
gender, age and ethnicity, there is a concern that the observed sample does not truly
represent the population except for gender which approximately reflects the total
population. One possible reason could be due to the existence of selection bias as a
result from employing a cross between systematic random sampling and
snowballing in data collection. Arguably, there is also the possibility that different
ethnics have different level of survey response rate (Lyness and Kropf, 2007).
25 Personal communication with the officer-in-charge confirmed that MIA does not reveal their
membership demographic background except as disclosed in its annual report to oblige with its
Database Information Privacy Policy.
26 This thesis examines the influence of culture at the national level by using Hofstede’s (1980)
National Cultural Dimensions to measure culture. Therefore the issue of ethnicity is not considered
to be relevant in the context of this thesis. Consistent with other tax compliance studies such as Saad
(2011) and Mohd Ali (2013) ethnicity is only used to determine representativeness of the samples in
the study. It is also consistent with the suggestion by Sekaran (2002) in determining the
representativeness of the sample over the population.

225
Table 5.9 Comparison between survey response and population - Malaysia
Survey response MIA population
Items Frequency Percentage Frequency Percentage
Gender
Male 39 42.4 Male 14,245 50
Female 53 57.6 Female 14,245 50
Age a
Below 30 42 45.7 Below 30 2,207 8
31-40 24 26.1 31-40 12,401 43
41-50 14 15.2 41-50 8,804 31
51-60 7 7.6 51-60 3,877 14
Above 60 5 5.4 Above 60 1,200 4
Ethnicity
Malay 74 80.4 Data was not disclosed in MIA’s Annual
Report b Chinese 15 16.3
Indian 2 2.2
Note: (a) The original age bands for the study were re-grouped to be consistent with
MIA’s data.
(b) Nonetheless, it was reported in the media that the Malays formed 28
percent of MIA membership in 2012 (Unknown, 2012).
(c) All figures exclude respondents with missing data.
5.1.3.2 New Zealand
While equal numbers of males and females have been entering the New
Zealand accounting profession (Whiting & Wright, 2001) and female membership
of NZICA has increased over the years (Hopman & Lord, 2009), the statistics
provided by the NZICA suggests that males still dominate the accounting

226
profession. For the year ended June 2012, NZICA had 33,297 members of which
58 percent were males and the remaining 42 percent females (NZICA Annual
Report, 2012). Therefore, it is not surprising that males are represented more than
females in this study. While there is a slight difference with regard to the ratio of
males and females in the study, with the ratio of males and females in the total
population of NZICA membership as tabulated in Table 5.10, it can be concluded
that the observed samples in the study approximately reflect the gender of the
population. Due to the differences in the age brackets employed in the study with
the NZICA membership population, it is inappropriate to make any comparison
between the two datasets. However, it could be suggested that majority of the
respondents are ‘middle aged’ which approximately resembles the NZICA
membership population.
The statistics of NZICA membership indicates that majority of the members
are of New Zealand and European ethnicity with 60.2 percent. The second largest
group was formed by “Other ethnics” with 24 percent, followed by Asian with 15
percent and the least members, Maori, formed only 0.8 percent of the total
membership population. An identical pattern of ethnicity was evidenced in the
observed samples. The largest group of respondents came from the New Zealand
European, followed by “Others” ethnicity, Asian, and the least respondents were of
Maori ethnicity. Based on the pattern, it is argued that the ethnicity of the observed
samples mirrored the ethnicity of the membership population.
In summary, the observed samples approximately represented the
population of NZICA’s membership based on some selected criteria. Except for
unavailable information, comparisons between the observed samples and total

227
population suggest that the samples in the study somewhat reflect the total
population.
Table 5.10 Comparison between survey response and population- New
Zealand
Survey response NZICA population
Items Frequency Percentage Frequency Percentage
Gender
Male 83 69.7 Male 19,312 58
Female 35 29.4 Female 13,985 42
Age
25 or below 6 5 Under 30 4,662 14
26-30 3 2.5 30-39 7,991 24
31-35 8 6.7 40-49 9,656 29
36-40 8 6.7 50-59 6,326 19
41-45 25 21 60 or over 4,329 13
46-50 21 17.6
51-55 27 22.7
56-60 8 6.7
Over 60 13 10.9
Ethnicity
New Zealand
European
104 87.4 New
Zealander
and
European
20,644 60.2
Maori 1 0.8 Maori 2,664 0.8
Pacific 1 0.8 Asian 4,995 15
Asian 4 3.4 Othersa 7,991 24
Others 7 5.9
Note: (a) This category consists of Middle Eastern, African, Pacific and not disclosed
category
(b) All figures exclude missing data

228
5.1.4 Nonresponse bias
To examine the existence of non-response bias between those who
participated in the study and those who refused to participate, the responses were
divided into early and late responses, as explained in sub-section 4.7.7.3. The late
respondents were used as substitutes of non-respondents (Armstrong and Overton,
1977). For this purpose, the difference of means of the early and late responses on
sixteen cultural items was then compared to determine whether or not it was
significant at p ≤ 0.05 using independent t-test analyses.
5.1.4.1 Malaysia
The results from the independent t-test analysis between early and late
responses for Malaysian survey are illustrated in Table 5.11 below, consisting of
the mean, standard deviation and the respective two-tailed p-values. The results
from the analysis suggest that nonresponse bias is not a serious threat to the study
since both early and late respondents responded similarly to the survey. A majority
of the items have p-values of more than 0.05 except for item MAS4 which has a p-
value of less than 0.05 but more than 0.01. Notwithstanding that, it is not
completely guaranteed that there is no response bias in the study considering the
small number of samples from Malaysia. The full results from the analysis are
available in Appendix I.

229
Table 5.11 Mean and Standard Deviation for Early and Late Responses –
Malaysia
Response N Mean Std. Dev.
p-value (two
tailed)
PD1 Early 47 4.79 1.781 0.488
Late 45 5.04 1.713
PD2 Early 47 3.34 2.042 0.119
Late 45 3.95 1.620
PD3 Early 47 3.91 1.653 0.201
Late 45 4.39 1.853
PD4R Early 47 2.89 1.323 0.646
Late 45 3.02 1.302
IND1R Early 47 2.28 1.425 0.217
Late 45 2.67 1.581
IND2 Early 47 4.38 1.609 0.231
Late 45 4.00 1.430
IND3 Early 47 3.38 2.049 0.237
Late 45 2.96 1.348
IND4R Early 47 3.23 1.371 0.386
Late 45 3.00 1.206
MAS1 Early 47 3.90 1.772 0.585
Late 45 4.09 1.490
MAS2 Early 47 5.04 1.351 0.365
Late 45 5.29 1.236
MAS3 Early 47 3.30 1.502 0.263
Late 45 3.67 1.638
MAS4 Early 47 5.17 1.324 0.048*
Late 45 4.62 1.302
UAV1 Early 47 5.98 0.921 0.090
Late 45 5.35 1.265
UAV2R Early 47 3.55 1.780 0.330
Late 45 3.89 1.496
UAV3 Early 47 4.98 1.294 0.177
Late 45 4.58 1.530
UAV4R Early 47 3.79 1.587 0.648
Late 45 3.93 1.468
*Significant at p≤ 0.05

230
5.1.4.2 New Zealand
The results for the nonresponse bias test for New Zealand are presented in
Table 5.12 below, which state the mean, standard deviation and p-values for two-
tailed test between the early and late respondents. The results indicate that majority
of the items have p-values of more than 0.05 indicating that early and late
respondents responded similarly to the survey. As for two items, PD2 and MAS4,
they have p-values of less than 0.05 but both are more than 0.01. Based on these
findings, similar to Malaysia, it could be suggested that non-response bias is not a
serious concern in the survey responses from New Zealand. Nonetheless, this does
not fully assure the non-existence of response bias considering that the study only
recorded a small number of samples from New Zealand. The detailed results for the
analysis are available in Appendix J.

231
Table 5.12 Mean and Standard Deviation for Early and Late Responses – New
Zealand
Response N Mean
Std.
Deviation
p-value
(two tailed)
PD1 Early 73 4.85 1.515 0.339
Late 46 5.13 1.614
PD2 Early 73 2.55 1.202 0.025*
Late 46 3.13 1.439
PD3 Early 73 3.97 1.481 0.648
Late 46 4.11 1.729
PD4R Early 73 3.77 1.370 0.456
Late 46 3.57 1.530
IND1R early 73 2.26 1.080 0.562
late 46 2.15 .816
IND2 early 73 4.12 1.649 0.966
late 46 4.11 1.935
IND3 early 73 2.54 1.403 0.610
late 46 2.67 1.461
IND4R early 73 4.47 1.500 0.758
late 46 4.57 1.734
MAS1 early 73 3.48 1.690 0.790
late 46 3.39 1.782
MAS2 early 73 5.33 1.001 0.097
late 46 4.92 1.458
MAS3 early 73 2.57 1.022 0.784
late 46 2.63 1.271
MAS4 early 73 4.73 1.326 0.034*
late 46 4.72 1.393
UAV1 early 73 5.81 1.174 0.394
late 46 6.00 1.174
UAV2R early 73 4.15 1.793 0.287
late 46 3.80 1.600
UAV3 early 73 4.23 1.559 0.306
late 46 3.93 1.511
UAV4R early 73 4.64 1.284 0.692
late 46 4.74 1.405
*Significant at p < 0.05.

232
5.2 Preliminary analysis
The preliminary analysis involved several analyses namely a data screening
process, common method bias analysis, social desirability analysis, descriptive
analysis and t-test analysis.
5.2.1 Data screening process
The data screening process involved treatment of missing values,
determining outliers and normality of the data, to ensure the data fulfil the
assumptions of the statistical test (Sekaran and Bougie, 2010). Missing data is
considered as a common problem in research (Sekaran and Bougie, 2010). A check
on the Malaysian data revealed that all 92 responses received have less than 10
percent missing data. Hair et al. (2010) suggest that any remedies of missing data
could be applied if the missing data is less than 10 percent. Following the
recommendation of Hair et al. (2010), the Expectation Maximisation (EM) method
was used to treat the missing data problem for Malaysia.
Similar to Malaysia, an initial check on the New Zealand data indicated that
out of 135 responses received, 16 have missing data have more than 10 percent.
Following the suggestion by Hair et al. (2010), these 16 cases were removed from
the dataset leaving 119 useable cases for further analysis. Since any imputation
methods could be used for cases with less than 10 percent missing data (Hair et al.,
2010), similar to Malaysia, the EM method was used to replace the missing values.
Once the missing data was determined, the existence of outliers was tested in both
datasets from Malaysia and New Zealand by examining the minimum and
maximum values from the frequencies analysis (Sekaran and Bougie, 2010).

233
The normality of the data was checked by examining the skewness and
kurtosis of the data distribution. The results from Malaysia indicate that the
majority of the data fell within the acceptable range of +/- 3 for skewness (Lind et
al., 2008) and +/- 3 for kurtosis (Gaur and Gaur, 2006), with very few data
deviating slightly from the acceptable values. A check on the skewness and
kurtosis of New Zealand data also revealed that majority of the data fell within the
acceptable range of +/-3 for skewness and kurtosis values (Gaur and Gaur, 2006;
Lind et al., 2008) with some data falling outside the acceptable normality values.
Considering that this study involves sensitive issues, it is expected that some
responses may skew positively or negatively.
Despite some of the data for both Malaysia and New Zealand falling
beyond the accepted normality range, as displayed in Appendix K and Appendix
L, it could still be suggested that the data is approximately normal. Hair et al.
(2010) suggest that non-normality will have unfavourable impact to the findings if
the samples are less than 50, which in this case, is not relevant for the study since
the number of samples for both countries are more than 50. In addition to that,
according to the central limit theorem, the mean sample from a sample size
increases with the number of sample and if the number of the sample is more than
30 (such as in this study), the mean of the samples would be approximately
normally distributed even when the original population is not normal (Field, 2009;
Lind et al., 2008). In a Monte Carlo analysis performed by Moore and McCabe
(2006), they found that for a sample of at least 40 in each group, a t-test analysis
could be used, without any consideration for skewness or outliers, which could be
due to the central limit theorem (Lind et al., 2008). Furthermore, the Partial Least

234
Squares (PLS) applied in this study is not restricted to any distribution assumption
of the data. The minimum, maximum, skewness and kurtosis are presented in
Appendices K and L.
5.2.2 Common method bias analysis
As mentioned earlier in sub-section 4.7.7.4, apart from following the
suggestions by Podsakoff et al. (2003) and Conway and Lance (2010) to reduce
common method bias in the study, Harmon’s single factor test was also performed
to assess the extent of common method bias in the study by forcing all indicators to
load in a single factor (Podsakoff et al., 2003). There is a problem of common
method bias if a single factor accounts for the majority of the variance.
The results from the principal factor analysis for Malaysian data suggest
that there are eighteen factors extracted with eigenvalues more than 1 with a
cumulative value of 80.53 percent of the total variance. Since factor one only
accounted for 26.74 percent of the variance, it could be suggested that in this study
the impact of common method bias is minimal and is not a serious issue in the
survey findings from Malaysia. Similar to Malaysia, a test to assess the extent of
common method bias in survey data from New Zealand was also performed using
the Harmon’s single factor test. The test on New Zealand survey data also revealed
the marginal existence of common method bias indicating that common method
bias is not a serious threat in this study. There are twenty factors with eigenvalue
more than 1 which cumulatively accounted for 78.04 percent of the total variance
generated by this analysis from New Zealand survey data. However, factor one
accounted for only 20.47 percent of the variance. Notwithstanding that, it is not
fully guaranteed that the survey findings for the study are fully free from any bias.

235
The detailed analyses for examining common method bias for both countries are
presented in Appendices M and N.
5.2.3 Social desirability bias
Social desirability bias may exist in self-reports study especially if the study
involves sensitive issues (Bryman and Bell, 2011), such as in this study. In self-
report studies, respondents have the tendency to depict themselves with a
favourable image by choosing answers which interpreted as more socially desirable
which could introduce bias to the findings of the study (Krosnick, 1999). To
determine the existence of social desirability bias in the study, the respondents
were asked the possibility that they and their peers will perform the action as
described in the overstating tax expenses scenario and understating income
scenario. All responses were recorded using seven-point scales, fully anchored with
a High/Low, with higher scales indicating lower probability to perform the
described behaviour in the scenarios. The findings from the paired t-test for both
Malaysia and New Zealand are presented in the following sub-sections.
5.2.3.1 Malaysia
The results from the paired t-test suggest that social desirability bias exist in
the study for both over-reporting tax expenses scenario (t = -5.162, p < 0.01) and
under-reporting income tax scenario (t = -4.707, p < 0.01). The findings indicate
that survey respondents from Malaysia perceived themselves as more ethical
compared to their peers. The findings are summarized in Table 5.13.

236
Table 5.13 Measures of social desirability bias - Malaysia
Peero/Peerua Selfo/Selfub
Scenarios N Mean
Std.
Dev. Mean
Std.
Dev. t -value
p–value
(two
tailed)
Overstating
expenses 92 4.03 1.700 4.83 1.56 -5.162 .000
Understating
income 92 4.13 1.762 4.89 1.687 -4.707 .000
Notes: a “The probability that my peers will take the same action is …”
b “The probability that I will take the same action is….”
All responses were rated with seven-point scales, fully anchored with High/Low
with higher scores indicating low probability to perform the described behaviour
5.2.3.2 New Zealand
Similar to the Malaysian survey respondents in the study, the findings
indicate that social desirability bias exists in the responses of New Zealand survey
respondents. In both scenarios, the overstating tax expenses (t = -6.513, p < 0.01)
and understating income (t = -6.103, p < 0.01), there are statistically significant
differences between the perception of how likely tax agents in the study perform
the described behaviour in the scenario (Selfo/Selfu), with the possibility that their
peers will perform similar behaviour (Peero/Peeru). The results indicate that New
Zealand tax agents in the study are likely to perceive themselves as more ethical
compared to their peers.

237
Table 5.14 Measures of social desirability bias – New Zealand
Peero/Peerua Selfo/Selfub
Scenarios N Mean Std.
Dev.
Mean Std.
Dev.
t-value p–value
(two
tailed)
Overstating
expenses
119 4.40 1.986 5.39 2.022 -6.513 .000
Understating
income
119 4.95 1.991 5.85 1.885 -6.103 .000
Notes: a “The probability that my peers will take the same action is …”
b “The probability that I will take the same action is….”
All responses were rated with seven-point scales, fully anchored with High/Low
with higher scores indicating low probability to perform the described behaviour
In sum, social desirability bias exists in the responses of survey respondents
from Malaysia and New Zealand in both tax scenarios presented in the study. The
survey respondents in this study from both countries have the tendency to perceive
themselves as more ethical compared to their peers in overstating tax expenses and
understating tax income. The findings are consistent with other ethics-based studies
on accountants, such as Cohen et al. (1993) and Cruz et al. (2000). While the
existence of social desirability bias suggests that the findings from this study have
to be interpreted with caution, it also supports the suggestion by Cruz et al. (2000)
on the importance of testing for social desirability bias in tax compliance studies.
The findings also indicate that survey respondents in both countries perceive
themselves and their peers as less likely to involve in understating tax income
compared to overstating tax expenses, which supports the argument by Jones
(1991) that being ethical is situation specific.

238
5.2.4 Descriptive analysis
Descriptive analysis is frequently used to interpret basic features of the
data. In this descriptive analysis, the minimum, maximum, mean and standard
deviation are presented for each item measuring culture, Theory of Planned
Behaviour (TPB) and ethical sensitivity. The measures for each item are also
provided as per outlined in the questionnaire with the respective codes.
5.2.4.1 Malaysia
This section explains findings from the perceptions of survey respondents
from Malaysia on culture, TPB items and ethical sensitivity, in complying with the
tax law while performing their roles as tax agents. The descriptive statistics results
are outlined in Table 5.15 to Table 5.19.
(a). Measures of culture
The Descriptive results for culture are presented in Table 5.15 below
displaying four of Hofstede’s (1980) National Cultural Dimensions operationalized
in tax compliance context. To interpret the results, the lower the mean values,
indicates higher disagreement on the influence of culture in complying with the tax
law. The overall results suggest that respondents have mixed opinions on the
influence of Power Distance, Individualism, Masculinity and Uncertainty
Avoidance in complying with the tax law. The overall mean of Power Distance of
3.92 indicates that there is low gap of Power Distance between the junior and their
superior in the study when complying with the tax law. There were mixed of
opinions on individualism and tax compliance behaviour with the means ranging
from 2.47 to 4.20, resulting in an overall mean of 3.24, leaning towards low

239
individualism. While the means for Masculinity measures were mixed, they were
moving towards higher Masculinity culture in complying with the tax law with an
overall mean of 4.38. The Uncertainty Avoidance measures also generated mixed
means, ranging from 3.72 to 5.67 resulting in an overall mean of 4.51. This
suggests that respondents in the study had the tendency to practise high Uncertainty
Avoidance culture in complying with the tax law while performing their roles as
tax agents.
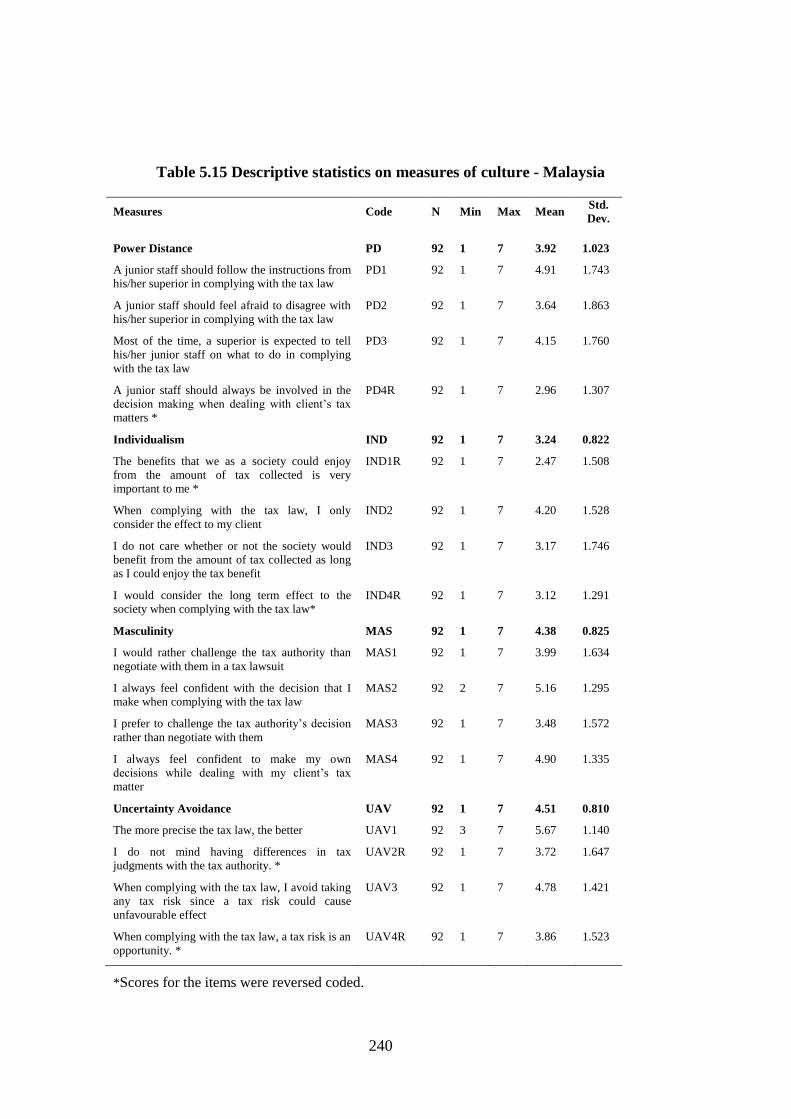
240
Table 5.15 Descriptive statistics on measures of culture - Malaysia
Measures Code N Min Max Mean Std.
Dev.
Power Distance PD 92 1 7 3.92 1.023
A junior staff should follow the instructions from
his/her superior in complying with the tax law
PD1 92 1 7 4.91 1.743
A junior staff should feel afraid to disagree with
his/her superior in complying with the tax law
PD2 92 1 7 3.64 1.863
Most of the time, a superior is expected to tell
his/her junior staff on what to do in complying
with the tax law
PD3 92 1 7 4.15 1.760
A junior staff should always be involved in the
decision making when dealing with client’s tax
matters *
PD4R 92 1 7 2.96 1.307
Individualism IND 92 1 7 3.24 0.822
The benefits that we as a society could enjoy
from the amount of tax collected is very
important to me *
IND1R 92 1 7 2.47 1.508
When complying with the tax law, I only
consider the effect to my client
IND2 92 1 7 4.20 1.528
I do not care whether or not the society would
benefit from the amount of tax collected as long
as I could enjoy the tax benefit
IND3 92 1 7 3.17 1.746
I would consider the long term effect to the
society when complying with the tax law*
IND4R 92 1 7 3.12 1.291
Masculinity MAS 92 1 7 4.38 0.825
I would rather challenge the tax authority than
negotiate with them in a tax lawsuit
MAS1 92 1 7 3.99 1.634
I always feel confident with the decision that I
make when complying with the tax law
MAS2 92 2 7 5.16 1.295
I prefer to challenge the tax authority’s decision
rather than negotiate with them
MAS3 92 1 7 3.48 1.572
I always feel confident to make my own
decisions while dealing with my client’s tax
matter
MAS4 92 1 7 4.90 1.335
Uncertainty Avoidance UAV 92 1 7 4.51 0.810
The more precise the tax law, the better UAV1 92 3 7 5.67 1.140
I do not mind having differences in tax
judgments with the tax authority. *
UAV2R 92 1 7 3.72 1.647
When complying with the tax law, I avoid taking
any tax risk since a tax risk could cause
unfavourable effect
UAV3 92 1 7 4.78 1.421
When complying with the tax law, a tax risk is an
opportunity. *
UAV4R 92 1 7 3.86 1.523
*Scores for the items were reversed coded.

241
(b). Measures of Theory of Planned Behaviour items
Table 5.16 outlines the results from the descriptive statistics analysis for
TPB items with respect to overstating tax expenses scenario. To interpret the
results, the lower the means of Intention, Attitude and Subjective Norms, imply the
less possibility to overstate tax expenses resulting in complying with the tax law.
On the other hand, the lower the mean of Perceived Behavioural Control, this
indicates greater control to overstate tax expenses resulting in noncompliance.
Except for Perceived Behavioural Control, the overall results suggest that
respondents in the study were less likely to overstate tax expenses in complying
with the tax law. Intention to overstate tax expenses recorded an overall mean of
3.03, indicating the tendency of respondents not to overstate the tax expenses. The
overall mean of attitude of 3.16 also implies that respondents in the study have
unfavourable perceptions towards overstating tax expenses. With regard to
Subjective Norms, respondents had the opinion that people who are important to
them were not supportive of overstating tax expenses. The overall mean of
Perceived Behavioural Control of 3.76, however, suggests that respondents
believed they have the control to overstate the tax expenses.

242
Table 5.16 Descriptive statistics on measures of Theory of Planned Behaviour
items (Overstating tax expenses scenario) - Malaysia
Measures Code N Min Max Mean Std.
Dev.
Intention INO 92 1 7 3.03 1.585
If I had the opportunity, I would overstate the
business travelling expenses in the tax return*
(Likely…Unlikely)
INO1R 92 1 7 3.20 1.841
I would never overstate the business travelling
expenses claimed in the tax return (True…False)
INO2 92 1 7 2.97 1.687
In the future, I may overstate the business travelling
expenses in the tax return (True…False)
INO3R 92 1 7 2.91 1.739
Attitude ATO 92 1 7 3.16 1.511
For me to overstate the business travelling expenses
claimed in the tax return is* (Good…Bad)
ATO1R 92 1 7 2.91 1.587
For me to overstate the business travelling expenses
in the tax return is (Worthless…Useful)
ATO2 92 1 7 3.46 1.667
For me to overstate the business travelling expenses
in the tax return is (Harmful…Beneficial)
ATO3 92 1 7 3.12 1.715
Subjective norms SNO 92 1 7 3.74 1.144
Most of people important to me think that I should
overstate the business travelling expenses*
(Agree…Disagree)
SNO1R 92 1 7 3.24 1.640
Most of people important to me will look down at me
if I overstate the business travelling expenses in the
tax return (Likely…Unlikely)
SNO2 92 1 7 4.06 1.708
No one who is important to me thinks it is OK to
overstate the business travelling expenses in the tax
return (Agree…Disagree)
SNO3 92 1 7 3.91 1.675
Perceived Behavioural Control PBO 92 1 7 3.76 1.142
For me to overstate the business travelling expenses
in the tax return is (Easy…Difficult)
PBO1 92 1 7 4.15 1.875
With my expertise, I could easily overstate the
business travelling expenses in the tax return if I
wanted to (Agree…Disagree)
PBO2 92 2 7 3.75 1.936
How much control do you have over overstating the
business travelling expenses in the tax return
(Complete control…Absolutely no control)
PBO3 92 1 7 3.37 1.608
* Scores for the items were reverse coded.
Table 5.17 illustrates the opinions of respondents in the study with regard to
complying with the tax law in the understating income scenario. Similar to the first

243
scenario, the lower the means of Intention, Attitude and Subjective Norms reflect
greater possibility to comply with the tax law by not underreporting income of
$2,000. In contrast, the lower the mean of Perceived Behavioural Control, this
suggests respondents have higher control to understate the income, consequently
promoting noncompliance.
Similar to the first scenario on overstating tax expenses, overall,
respondents in the study were less likely to involve in noncompliance behaviour, in
this case understating income. The overall mean of Intention of 3.20 implies that if
respondents were in the same situation as described in the scenario, they would
have less intention to understate income in the tax computation. Likewise, the
results reveal that respondents had favourable attitude towards tax compliance
based on the overall mean of Attitude of 3.14. In a similar vein, based on the
overall mean of Subjective Norms of 3.74, it could be suggested that respondents in
the study believe their important others disapproved understating income
behaviour. Comparable to the first scenario, tax agents in the study indicated that
they had control to understate income for tax purposes based on the overall mean
of 3.21 resulting into the tendency to noncompliance.

244
Table 5.17 Descriptive statistics on measures of Theory of Planned Behaviour
items (Understating income scenario) - Malaysia
Measures Code N Min Max Mean Std.
Dev.
Intention INU 92 1 7 3.20 1.477
If I had the opportunity I would omit the $2,000 cash
sale from the tax computation.* (Likely…Unlikely)
INU1R 92 1 7 3.28 1.842
I would never omit the $2,000 cash sale from the tax
computation (True…False)
INU2 92 1 7 3.29 1.694
In the future, I may omit the $2,000 cash sale from
the tax computation* (True…False)
INU3R 92 1 7 3.03 1.679
Attitude ATU 92 1 7 3.14 1.264
For me to omit the $2,000 cash sale from the tax
computation is (Good…Bad)
ATU1R 92 1 6 2.66 1.345
For me to omit the $2,000 cash sale from the tax
computation is (Worthless…Useful)
ATU2 92 1 7 3.54 1.536
For me to omit the $2,000 cash sale from the tax
computation is (Harmful…Beneficial)
ATU3 92 1 7 3.23 1.534
Subjective norms SNU 92 1 7 3.74 1.164
Most of people important to me think I should omit
the $2,000 cash sale from the tax computation*
(Agree….Disagree)
SNU1R 92 1 7 3.43 1.775
Most people who are important to me will look down
at me if I omit the $2,000 cash sale from the tax
computation (Likely…Unlikely)
SNU2 92 1 7 3.87 1.787
No one who is important to me thinks it is OK to
omit the $2,000 cash sale from the tax computation
(Agree…Disagree)
SNU3 92 1 7 3.93 1.653
Perceived Behavioural Control PBU 92 1 7 3.21 1.468
For me to omit the $2,000 cash sale from the tax
computation is (Easy…Difficult)
PBU1 92 1 7 3.48 1.854
With my expertise, I could easily omit the $2,000
cash sale from the tax computation if I wanted to
(Agree…Disagree)
PBU2 92 2 7 2.86 1.701
How much control do you have over omitting the
$2,000 cash sale from the tax computation?
(Complete control…Absolutely no control)
PBU3 92 1 7 3.28 1.666
* Scores for the items were reverse coded.
c. Measures of ethical sensitivity
The similar scenarios of overstating tax expenses and understating income
used to measure TPB were applied to measure the ethical sensitivity of tax agents

245
in the study. Table 5.18 demonstrates the descriptive statistics on measures of
ethical sensitivity for over claiming tax expense scenario. The results indicate that
respondents evaluated moderately each moral dimension in the case of overstating
business travelling expenses for tax purposes. This could be evidenced from the
overall mean values of each moral philosophy in the MES which centred near to
the middle point of the scale.
The overall mean of Moral Equity of 4.87 suggests that respondents regard
overstating tax expenses as leaning more towards injustice, unfairness, not morally
right and not acceptable to their family. With respect to Relativism, respondents
indicate that the act of overstating tax expense inclined more towards traditionally
and culturally unacceptable, with an overall mean value of 4.44. The overall mean
value of Egoism of 3.78 implies that respondents perceived overstating tax expense
as unethical since it promoted the well-being of oneself over the others.
The act of overstating business travelling expenses for tax purposes was
also perceived as not ethical since it did not produce the greatest utility for greatest
number of people or maximize benefits over harm to all parties involved. This
could be seen from the overall mean value of Utilitarianism dimension of 4.18.
Finally, with an overall mean value of 4.67, respondents also had the opinion that
overstating tax expense had violated the unwritten contract and violated unwritten
promise. The violations imply an unethical behaviour according to Contractualism
moral philosophy.

246
Table 5.18 Descriptive statistics on measures of ethical sensitivity (Overstating
tax expenses scenario) - Malaysia
Measures Code N Min Max Mean Std.
Dev.
In your opinion, Rose’s decision to overstate the business travelling expenses is:
Moral Equity MEO 92 1 7 4.87 1.416
Just…….Unjust MEO1 92 1 7 4.64 1.661
Fair…….Unfair MEO2 92 1 7 4.91 1.601
Morally right …….Not morally right MEO3 92 2 7 5.22 1.389
Acceptable to my family…….Not acceptable
to my family
MEO4 92 1 7 4.71 1.741
Relativism REO 92 1 7 4.44 1.603
Traditionally acceptable…….Traditionally
unacceptable
REO1 92 1 7 4.41 1.665
Culturally acceptable…….Culturally
unacceptable
REO2 92 1 7 4.47 1.713
Egoism EGO 92 1 7 3.78 1.225
Not self-promoting for Rose…….Self-
promoting for Rose*
EGO1R 92 1 7 3.83 1.681
Personally satisfying for Rose…….Not
personally satisfying for Rose
EGO2 92 1 7 3.74 1.722
Utilitarianism UTO 92 1 7 4.18 1.277
Produces greatest utility……..Produces the
least utility
UTO1 92 1 7 4.23 1.563
Minimizing benefits while maximizing
harm……Maximizing benefits while
minimizing harm*
UTO2R 92 2 7 4.14 1.688
Contractualism COO 92 1 7 4.67 1.467
Violating an unwritten contract…….Not
violating an unwritten contract*
COO1R 92 1 7 4.68 1.482
Violating an unspoken promise…….Not
violating an unspoken promise
COO2R 92 1 7 4.66 1.485
*Scores for the items were reverse coded.
Table 5.19 summarizes the perceptions of respondents on their ethical
sensitivity based on five moral philosophies of MES with regard to the understating
income scenario. Overall, comparable to the scenario of over claiming a tax
expense, respondents evaluated moderately each of the moral dimensions since

247
most of the means were near to the mid-point scales. The overall mean of Moral
Equity dimension of 5.13 demonstrates that respondents perceived the act of
omitting income of $2,000 for tax purposes was highly unjust, unfair, not morally
right and not acceptable to their family. Respondents also believed that the act of
understating income was traditionally and culturally unacceptable based on the
overall mean of Relativism of 4.57.
Based on the overall mean of Egoism of 3.99, respondents in the study also
indicated that understating income for tax purpose was unethical since it supported
self-interest. Respondents in the study were also of the view that understating
income of $2,000 for tax purposes was not providing the greatest benefits for the
greatest number of people and thus did not maximize benefits over harm. This was
demonstrated by the overall mean of Utilitarianism of 4.17. The overall mean of
4.76 of Contractualism dimension also suggests that respondents regard the
understating income for tax purpose described in the scenario as violating the
social contract and therefore, deemed unethical.

248
Table 5.19 Descriptive statistics on measures of ethical sensitivity
(Understating income scenario) – Malaysia
Measures Code N Min Max Mean Std.
Dev.
In your opinion, Adam’s decision to omit the $2,000 cash sale is:
Moral Equity MEU 92 1 7 5.13 1.340
Just…….Unjust MEU1 92 1 7 5.09 1.559
Fair…….Unfair MEU2 92 1 7 5.13 1.499
Morally right …….Not morally right MEU3 92 2 7 5.46 1.370
Acceptable to my family…….Not acceptable to
my family
MEU4 92 1 7 4.85 1.564
Relativism REU 92 1 7 4.57 1.516
Traditionally acceptable…….Traditionally
unacceptable
REU1 92 1 7 4.51 1.593
Culturally acceptable…….Culturally
unacceptable
REU2 92 1 7 4.62 1.616
Egoism EGU 92 1 7 3.99 1.063
Not self-promoting for Adam…….Self-
promoting for Adam*
EGU1R 92 1 7 4.00 1.534
Personally satisfying for Adam…….Not
personally satisfying for Adam
EGU2 92 1 7 3.99 1.674
Utilitarianism UTU 92 1 7 4.17 1.221
Produces greatest utility……..Produces the least
utility
UTU1 92 1 7 4.23 1.563
Minimizing benefits while maximizing
harm……Maximizing benefits while minimizing
harm*
UTU2R 92 2 7 4.11 1.627
Contractualism COU 92 1 7 4.76 1.472
Violating an unwritten contract…….Not
violating an unwritten contract*
COU1R 92 1 7 4.78 1.496
Violating an unspoken promise…….Not
violating an unspoken promise
COU2R 92 1 7 4.73 1.505
*Scores for the items were reverse coded.
5.2.4.2 New Zealand
In this section, the New Zealand respondents’ opinions on culture, the TPB
items and ethical sensitivity in tax compliance are presented using descriptive
statistics. The descriptive statistics are set out in Table 5.20 to Table 5.24.

249
(a). Measures of culture
Table 5.20 presents the perceptions of respondents from New Zealand on
culture and tax compliance behaviour using Hofstede’s (1980) National Cultural
Dimensions. Similar to Malaysia, to interpret the results, the lower are the mean
values, indicates higher disagreement on the influence of culture in complying with
the tax law. Comparable to Malaysia, the overall results suggest that respondents
have mixed opinions on the influence of Power Distance, Individualism,
Masculinity and Uncertainty Avoidance in complying with the tax law.
The overall mean of Power Distance of 3.86 reveals that there was a low
gap of Power Distance between the junior and their superior in the study when
complying with the tax law. With regard to the Individualistic attribute, the
responses were mixed with the means ranging from 2.22 to 4.51. The overall mean
of 3.36, however, suggests that respondents were more inclined towards collectivist
characteristic in their tax compliance behaviour while performing their roles as tax
agents. Likewise, the means for Masculinity measures were mixed, but they were
moving towards a higher Femininity culture in complying with the tax law. With
an overall mean of 4.67, this suggests that respondents in the study prone to regard
high Uncertainty Avoidance culture in complying with the tax law while
performing their engagement roles as tax agents.

250
Table 5.20 Descriptive statistics on measures of culture – New Zealand
Measures Code N Min Max Mean Std.
Dev.
Power Distance PD 119 1 7 3.86 0.982
A junior staff should follow the instructions from his/her
superior in complying with the tax law
PD1 119 1 7 4.96 1.554
A junior staff should feel afraid to disagree with his/her
superior in complying with the tax law
PD2 119 1 6 2.77 1.324
Most of the time, a superior is expected to tell his/her
junior staff on what to do in complying with the tax law
PD3 119 1 7 4.03 1.576
A junior staff should always be involved in the decision
making when dealing with client’s tax matters *
PD4R 119 1 7 3.69 1.431
Individualism IND 119 1 7 3.36 0.953
The benefits that we as a society could enjoy from the
amount of tax collected is very important to me *
IND1R 119 1 6 2.22 0.984
When complying with the tax law, I only consider the
effect to my client
IND2 119 1 7 4.12 1.757
I do not care whether or not the society would benefit
from the amount of tax collected as long as I could enjoy
the tax benefit
IND3 119 1 7 2.59 1.421
I would consider the long term effect to the society when
complying with the tax law*
IND4R 119 1 7 4.51 1.588
Masculinity MAS 119 1 7 3.98 0.811
I would rather challenge the tax authority than negotiate
with them in a tax lawsuit
MAS1 119 1 7 3.44 1.720
I always feel confident with the decision that I make when
complying with the tax law
MAS2 119 1 7 5.17 1.209
I prefer to challenge the tax authority’s decision rather
than negotiate with them
MAS3 119 1 5 2.59 1.120
I always feel confident to make my own decisions while
dealing with my client’s tax matter
MAS4 119 2 7 4.72 1.346
Uncertainty Avoidance UAV 119 1 7 4.67 0.910
The more precise the tax law, the better UAV1 119 2 7 5.88 1.173
I do not mind having differences in tax judgments with the
tax authority. *
UAV2R 119 1 7 4.02 1.722
When complying with the tax law, I avoid taking any tax
risk since a tax risk could cause unfavourable effect
UAV3 119 1 7 4.12 1.541
When complying with the tax law, a tax risk is an
opportunity. *
UAV4R 119 2 7 4.68 1.327
* Scores for the items were reverse coded

251
(b). Measures of Theory of Planned Behaviour items
Table 5.21 outlines the results from the descriptive statistics analysis for
TPB items with respect to overstating tax expenses scenario. Similar to the
Malaysian respondents, to interpret the results, the lower are the means of
Intention, Attitude and Subjective Norms, suggests the less possibility to over
claim tax expenses resulting in complying with the tax law. On the other hand, the
lower the mean of Perceived Behavioural Control indicates greater control to over
claim tax expenses resulting in noncompliance.
The overall results suggest that respondents in the study were less likely to
overstate tax expenses in complying with the tax law. Intention to overstate tax
expenses recorded an overall mean of 2.10, suggesting a low possibility of
respondents to overstate tax expenses. Respondents also indicated their
unfavourable perceptions towards overstating tax expenses with an overall mean of
attitude of 2.25. Respondents in the study were also of the view that people who are
important to them disapproved the act of overstating tax expenses. This could be
evidenced from the overall mean of Subjective Norms of 2.67. With regard to
Perceived Behavioural Control, the overall mean of 2.97 suggests that respondents
believed they have high control to overstate tax expenses indicating the tendency to
noncompliance.

252
Table 5.21 Descriptive statistics on measures of Theory of Planned Behaviour
items (Overstating tax expenses scenario) – New Zealand
Measures Code N Min Max Mean Std.
Dev.
Intention INO 119 1 7 2.10 1.353
If I had the opportunity, I would overstate the
business travelling expenses in the tax
return* (Likely…Unlikely)
INO1R 119 1 7 2.06 1.714
I would never overstate the business
travelling expenses claimed in the tax return
(True…False)
INO2 119 1 7 2.39 1.708
In the future, I may overstate the business
travelling expenses in the tax return
(True…False)
INO3R 119 1 7 1.86 1.355
Attitude ATO 119 1 7 2.25 1.230
For me to overstate the business travelling
expenses claimed in the tax return is*
(Good…Bad)
ATO1R 119 1 7 1.72 1.157
For me to overstate the business travelling
expenses in the tax return is
(Worthless…Useful)
ATO2 119 1 7 2.61 1.642
For me to overstate the business travelling
expenses in the tax return is
(Harmful…Beneficial)
ATO3 119 1 7 2.43 1.619
Subjective norms SNO 119 1 7 2.67 1.399
Most of people important to me think that I
should overstate the business travelling
expenses* (Agree…Disagree)
SNO1R 119 1 6 2.04 1.399
Most of people important to me will look
down at me if I overstate the business
travelling expenses in the tax return
(Likely…Unlikely)
SNO2 119 1 7 3.04 1.955
No one who is important to me thinks it is
OK to overstate the business travelling
expenses in the tax return (Agree…Disagree)
SNO3 119 1 7 2.93 1.943
Perceived Behavioural Control PBO 119 1 7 2.97 1.290
For me to overstate the business travelling
expenses in the tax return is
(Easy…Difficult)
PBO1 119 1 7 4.45 2.396
With my expertise, I could easily overstate
the business travelling expenses in the tax
return if I wanted to (Agree…Disagree)
PBO2 119 1 7 2.32 1.850
How much control do you have over
overstating the business travelling expenses
in the tax return (Complete
control…Absolutely no control)
PBO3 119 1 7 2.14 1.367
*Scores for the items were reverse coded.

253
Similar to the Malaysian respondents, the New Zealand respondents were
also provided with an understating income scenario to examine their tax
compliance behaviour. Table 5.22 exhibits the descriptive statistics of TPB items in
the case of understating income for tax purposes. Comparable to the first scenario,
the lower are the means of Intention, Attitude and Subjective Norms, suggests a
less possibility to understate income and thus promotes tax compliance. On the
contrary, the lower is the mean of Perceived Behavioural Control indicates greater
control to understate income leading to noncompliance.
Overall, the results suggest that respondents in the study were less likely to
understate income of $2,000 in their tax computation. For instance, intention to
understating income documented an overall mean of 1.77, suggesting low
possibility of respondents to understate income. The overall mean of attitude of
2.24 indicates the respondents’ unfavourable perceptions towards understating
income. Respondents in the study also had the opinion that people who are
important to them did not favour understating income behaviour which could be
seen from the overall mean of Subjective Norms of 2.42. Notwithstanding that,
respondents believed they had the control to understate income based on the overall
mean of Perceived Behavioural Control of 2.82 which could result in
noncompliance.

254
Table 5.22 Descriptive statistics on measures of Theory of Planned Behaviour
(Understating income scenario) – New Zealand
Measures Code N Min Max Mean Std.
Dev.
Intention INU 119 1 7 1.77 1.146
If I had the opportunity I would omit the
$2,000 cash sale from the tax
computation.* (Likely…Unlikely)
INU1R 119 1 7 1.55 1.212
I would never omit the $2,000 cash sale
from the tax computation (True…False)
INU2 119 1 7 2.04 1.709
In the future, I may omit the $2,000 cash
sale from the tax computation*
(True…False)
INU3R 119 1 7 1.71 1.271
Attitude ATU 119 1 7 2.24 1.214
For me to omit the $2,000 cash sale from
the tax computation is (Good…Bad)
ATU1R 119 1 5 1.36 0.686
For me to omit the $2,000 cash sale from
the tax computation is (Worthless…Useful)
ATU2 119 1 7 2.98 2.095
For me to omit the $2,000 cash sale from
the tax computation is
(Harmful…Beneficial)
ATU3 119 1 7 2.37 1.808
Subjective norms SNU 119 1 7 2.42 1.421
Most of people important to me think I
should omit the $2,000 cash sale from the
tax computation* (Agree….Disagree)
SNU1R 119 1 7 2.15 1.629
Most people who are important to me will
look down at me if I omit the $2,000 cash
sale from the tax computation
(Likely…Unlikely)
SNU2 119 1 7 2.66 1.866
No one who is important to me thinks it is
OK to omit the $2,000 cash sale from the
tax computation (Agree…Disagree)
SNU3 119 1 7 2.45 1.817
Perceived Behavioural Control PBO 119 1 7 2.82 1.341
For me to omit the $2,000 cash sale from
the tax computation is (Easy…Difficult)
PBU1 119 1 7 4.27 2.603
With my expertise, I could easily omit the
$2,000 cash sale from the tax computation
if I wanted to (Agree…Disagree)
PBU2 119 2 7 2.04 1.564
How much control do you have over
omitting the $2,000 cash sale from the tax
computation? (Complete
control…Absolutely no control)
PBU3 119 1 7 2.13 1.507
*Scores for the items were reverse coded.

255
c. Measures of ethical sensitivity
Table 5.23 summarizes the perceptions of respondents from New Zealand
on ethical sensitivity and tax compliance behaviour. The similar scenario of
overstating tax expenses used to measure TPB was tested on ethical sensitivity of
tax agents in the study. The overall results indicate that respondents evaluated
positively their ethical sensitivity with regard to overstating tax expense based on
the overall means of each moral dimension. The overall mean of Moral Equity of
6.00 suggests that respondents regard overstating tax expenses as highly unjust,
unfair, not morally right and not acceptable to their family. With regard to
Relativism, the overall mean of 5.04 suggests that respondents viewed overstating
tax expenses as traditionally and culturally unacceptable. The overall mean value
of Egoism of 2.95 reflects respondents’ perception towards overstating tax expense
as unethical since it only benefitted one own self-interest.
Respondents also perceived overstating a tax expense as unethical since it
breached the Utilitarian moral philosophy. The overall mean value of Utilitarianism
of 4.50 indicates that the act of overstating a tax expense did not produce the
greatest utility for the greatest number of people or maximize benefits over harm to
all parties involved. With an overall mean value of 5.03 for the Contractualism
dimension, respondents were of the view that overstating tax expense was unethical
since it had dishonoured the unwritten contract and violated unwritten promise.

256
Table 5.23 Descriptive statistics on measures of ethical sensitivity (Overstating
tax expenses scenario) – New Zealand
Measures Code N Min Max Mean Std.
Dev.
In your opinion, Rose’s decision to overstate the business travelling expenses is:
Moral Equity MEO 119 1 7 6.00 1.114
Just…….Unjust MEO1 119 1 7 5.87 1.443
Fair…….Unfair MEO2 119
1 7 5.92 1.348
Morally right …….Not morally right MEO3 119
1 7 6.22 1.151
Acceptable to my family…….Not acceptable to my
family MEO4
119 2 7 5.97 1.311
Relativism REO 119 1 7 5.04 1.682
Traditionally acceptable…….Traditionally
unacceptable REO1
119 1 7 5.08 1.778
Culturally acceptable…….Culturally unacceptable REO2 119
1 7 5.00 1.707
Egoism EGO 119 1 7 2.95 1.335
Not self-promoting for Rose…….Self-promoting for
Rose* EGO1R
119 1 7 2.66 1.856
Personally satisfying for Rose…….Not personally
satisfying for Rose EGO2
119 1 7 3.24 1.982
Utilitarianism UTO 119 1 7 4.50 1.363
Produces greatest utility……..Produces the least utility UTO1 119
1 7 4.47 1.716
Minimizing benefits while maximizing
harm……Maximizing benefits while minimizing
harm*
UTO2R 119
1 7 4.54 1.706
Contractualism COO 119 1 7 5.03 1.768
Violating an unwritten contract…….Not violating an
unwritten contract* COO1R
119 1 7 5.08 1.867
Violating an unspoken promise…….Not violating an
unspoken promise COO2R 119 1 7 4.98 1.761
*Scores for the items were reverse coded.
Table 5.24 presents the descriptive statistics for the second scenario,
understating income and ethical sensitivity of New Zealand respondents. Similar to

257
the first scenario, respondents assessed the morality of understating income with
high ethical sensitivity based on the overall mean values of each ethical dimension.
Referring to the overall mean of Moral Equity of 6.66, it could be suggested that
respondents in the study perceived understating income for tax purposes, in this
case of $2,000, as unethical since it violated the principles of moral equity.
Respondents also had the view that understating income for tax purposes
was traditionally and culturally unacceptable. This was confirmed by the overall
mean of Relativisim of 5.67. Understating income for tax purposes was also
regarded as unethical based on the overall mean value of Egoism of 2.67,
indicating that understating income would only fulfil one’s self-interest. Equally,
respondents were of the opinion that understating income would not result into
having the greatest utility for the greatest number of people or maximizing benefits
over minimizing harm for all parties involved. This could be evidenced from the
overall mean of Utilitarianism of 4.72. With the overall mean value of 5.42,
respondents perceived understating income as violating the social contract under
the Utilitarian ethical dimension, resulting into unethical conduct.

258
Table 5.24 Descriptive statistics on measures of ethical sensitivity
(Understating income scenario) – New Zealand
Measures Code N Min Max Mean Std.
Dev.
In your opinion, Adam’s decision to omit the $2,000 cash sale is:
Moral Equity MEU 119 1 7 6.66 0.754
Just…….Unjust MEU1 119 1 7 6.60 1.137
Fair…….Unfair MEU2 119 1 7 6.66 0.932
Morally right …….Not morally right MEU3 119 4 7 6.79 0.662
Acceptable to my family…….Not
acceptable to my family
MEU4 119 2 7 6.57 0.962
Relativism REU 119 1 7 5.67 1.567
Traditionally acceptable…….Traditionally
unacceptable
REU1 119 2 7 5.72 1.746
Culturally acceptable…….Culturally
unacceptable
REU2 119 2 7 5.62 1.589
Egoism EGU 119 1 7 2.67 1.457
Not self-promoting for Adam…….Self-
promoting for Adam*
EGU1R 119 1 7 2.19 1.395
Personally satisfying for Adam…….Not
personally satisfying for Adam
EGU2 119 1 7 3.14 .630
Utilitarianism UTU 119 1 7 4.72 1.383
Produces greatest utility……..Produces the
least utility
UTU1 119 1 7 4.86 1.628
Minimizing benefits while maximizing
harm……Maximizing benefits while
minimizing harm*
UTU2R 119 2 7 4.58 1.902
Contractualism COU 119 1 7 5.42 1.747
Violating an unwritten contract…….Not
violating an unwritten contract*
COU1R 119 1 7 5.45 1.807
Violating an unspoken promise…….Not
violating an unspoken promise
COU2R 119 1 7 5.39 1.738
*Scores for the items were reverse coded.
259
5.2.5 t-test analysis
The t-test analysis performed in the study allows the researcher to examine
whether or not there is any significant difference of the overall perceptions of tax
agents in the study from Malaysia and New Zealand on culture, TPB items, and
ethical sensitivity in complying with the tax laws. The t-test analysis was used to
test Hypotheses 1 to 3 set out in Section 3.2 in Chapter 3, Research Framework and
Hypotheses Development of this thesis, and thus, answer the first three research
questions of this study. For the TPB items and ethical sensitivity, the t-test was also
performed on both overstating tax expense and understating tax income scenarios.
The detailed results are provided in Appendix Q.
5.2.5.1 Culture and tax compliance behaviour
Table 5.25 set outs the results from the t-test analysis comparing Malaysian
and New Zealand respondents on culture and tax compliance behaviour, indicating
the means with the respective p-values. The p-values determine whether or not the
perceptions of respondents from Malaysia and New Zealand differ significantly.
The results indicate that the p-values for Power Distance, Individualism and
Uncertainty Avoidance in complying with the tax laws are more than 0.05
indicating that the perceptions of Malaysian and New Zealand respondents with
regards to these three items do not differ significantly. However, the p-value for
Masculinity which is significant at p ≤ 0.01 implies that tax agents from Malaysia
and New Zealand differ in their perceptions on Masculinity and tax compliance.
Therefore, the null hypothesis stating that ‘There is no significant difference
between tax agents from Malaysia and New Zealand with regard to Hofstede’s

260
(1980) National Cultural Dimensions in complying with the tax law’ is partially
supported.
The means also suggest there is a higher tendency for tax agents in
Malaysia to practise Power Distance and Masculinity in their ethical decision
making approach while complying with the tax laws compared to tax agents in
New Zealand. On the other hand, tax agents in New Zealand were prone to be more
Individualistic and high in Uncertainty Avoidance in their approaches while
complying with the tax laws compared to tax agents in Malaysia.
Table 5.25 Comparison between tax agents in Malaysia and New Zealand on
Culture
Malaysia New Zealand
Measures N Mean N Mean p-value
(two-tailed)
Power Distance 92 3.92 119 3.86 .697
Individualism 92 3.24 119 3.36 .333
Masculinity 92 4.38 119 3.98 .000
Uncertainty Avoidance 92 4.51 119 4.67 .171
5.2.5.2 Theory of Planned Behaviour and tax compliance
Table 5.26 presents the results from comparing the perceptions of tax
agents in Malaysia and New Zealand with respect to TPB items and over claiming
tax expenses. The results indicate that all p-values for the TPB items are
significantly different at p ≤ 0.01. The results suggest that tax agents in Malaysia
and New Zealand had different perceptions on intention, attitude, subjective norms
and perceived behavioural control in overstating tax expense scenario.

261
Consequently, the null hypothesis stating ‘There is no significant difference
in the level of perceptions in relation to the intention to comply, attitudes towards
behaviour, subjective norms and perceived behavioural control between tax agents
in Malaysia and New Zealand in overstating tax expense scenario’ is completely
rejected.
The mean values also indicate that tax agents in New Zealand were less
likely to over claim tax expense compared to tax agents in Malaysia.
Table 5.26 Comparison between tax agents in Malaysia and New Zealand on
Theory of Planned Behaviour Items (Overstating tax expenses scenario)
Malaysia New Zealand
Measures N Mean N Mean p-value (two-
tailed)
Intention 92 3.03 119 2.10 .000
Attitude 92 3.16 119 2.25 .000
Subjective Norms 92 3.74 119 2.67 .000
Perceived Behavioural
Control
92 3.76 119 2.97 .000
Table 5.27 exhibits the results from comparing the means of perceptions on
TPB items in understating income scenario between tax agents in Malaysia and
New Zealand. The p-values for intention, attitude and subjective norms indicate
that they are significant at p ≤ 0.01 and p ≤ 0.05 for perceived behavioural control.
This indicates that the perceptions of tax agents in Malaysia and New Zealand with
regard to intention, attitude, subjective norms and perceived behavioural control,
were different.

262
Therefore, the null hypothesis stating that ‘There is no significant difference
in the level of perceptions in relation to the intention to comply, attitudes towards
behaviour, subjective norms and perceived behavioural control between tax agents
in Malaysia and New Zealand in understating income scenario’ can be rejected.
The mean values in Table 5.27 suggest that tax agents in New Zealand were
more inclined to comply with the tax laws compared to tax agents in Malaysia.
Table 5.27 Comparison between Tax Agents in Malaysia and New Zealand on
Theory of Planned Behaviour Items (Understating income scenario)
Malaysia New Zealand
Measures N Mean N Mean p-value (two-
tailed)
Intention 92 3.20 119 1.77 .000
Attitude 92 3.14 119 2.24 .000
Subjective Norms 92 3.74 119 2.42 .000
Perceived Behavioural
Control
92 3.21 119 2.82 .045
5.2.5.3 Ethical Sensitivity
The results from the t-test analysis on the means of responses of tax agents
in Malaysia and New Zealand, with regard to ethical sensitivity and overstating tax
expenses, are displayed in Table 5.28 below. The results suggest that there is
significant difference between tax agents in Malaysia and New Zealand in their
perceptions of Moral Equity, Relativism and Egoism in overstating tax expenses.
This is evidenced from the p-values of these three MES dimensions which are less
than 0.05. As for Utilitarianism and Contractualism, the p-values of the means are
more than 0.05, suggesting that tax agents in Malaysia and New Zealand had

263
similar perceptions on Utilitarianism and Contractualism dimensions in the
overstating tax expenses scenario.
Based on the results, it could be suggested that the null hypothesis stating
‘There is no significant difference in the level of perceptions between tax agents in
Malaysia and New Zealand with regard to the dimensions of MES in overstating
tax expenses scenario’ is not fully supported.
The null hypothesis is rejected for Moral Equity, Relativism and Egoism
dimensions, and accepted for Utilitarianism and Contractualism dimensions. The
means also suggest that tax agents in New Zealand have greater ethical sensitivity
in complying with the tax law compared to tax agents in Malaysia.
Table 5.28 Comparison between Tax Agents in Malaysia and New Zealand on
Ethical Sensitivity Overstating tax expenses scenario)
Malaysia New Zealand
Measures N Mean N Mean p-value (two-
tailed)
Moral Equity 92 4.87 119 6.00 .000
Relativism 92 4.44 119 5.04 .009
Egoism 92 3.78 119 2.95 .000
Utilitarianism 92 4.18 119 4.50 .084
Contractualism 92 4.67 119 5.03 .108
Table 5.29 outlines the results on the t-test analysis, comparing the means
of perceptions on ethical sensitivity in understating income scenario between tax
agents in Malaysia and New Zealand. The results indicate that all p-values are less
than 0.05 implying that tax agents in Malaysia and New Zealand had different
perceptions on the MES dimensions in under reporting income tax scenario. The

264
results also revealed that Moral Equity, Relativism and Egoism dimensions were
significant at p ≤ 0.01.
Consequently, there is sufficient support to reject the null hypothesis that
‘There is no significant difference in the level of perceptions between tax agents in
Malaysia and New Zealand with regard to the dimensions of MES in understating
income scenario’.
Similar to the overstating income tax scenario, the means of the ethical
dimensions suggest that tax agents in New Zealand have higher ethical sensitivity
in complying with the tax laws compared to tax agents in Malaysia.
Table 5.29 Comparison between Tax Agents in Malaysia and New Zealand on
Ethical Sensitivity (Understating income scenario)
Malaysia New Zealand
Measures N Mean N Mean p-value (two-
tailed)
Moral Equity 92 5.13 119 6.66 .000
Relativism 92 4.57 119 5.67 .000
Egoism 92 3.99 119 2.67 .000
Utilitarianism 92 4.17 119 4.72 .002
Contractualism 92 4.76 119 5.42 .004
5.2.5.4 Summary of the results from the preliminary hypotheses tests
The preliminary hypotheses tests were performed to answer the first three
research questions on whether or not tax agents in Malaysia and New Zealand have
similar perceptions on culture, TPB items and ethical sensitivity in their tax
compliance behaviour. It is interesting to note that the results from the t-test
analyses revealed a number of similarities and differences of their perceptions
towards culture, TPB items and ethical sensitivity in complying with the tax laws.

265
Table 5.30 Summary of Results for Preliminary Hypotheses Tests
Research Questions Hypotheses Findings
1. Do tax agents in Malaysia
and New Zealand indicate the
same level of perceptions with
regard to Hofstede’s (1980)
National Cultural Dimensions in
complying with the tax law?
There is no significant difference
between tax agents in Malaysia and
New Zealand with regard to
Hofstede’s (1980) National
Cultural Dimensions in complying
with the tax law
Partially supported.
Accept for Power
Distance, Individualism
and Uncertainty
Avoidance. Reject for
Masculinity.
2. Do tax agents in Malaysia
and New Zealand have the same
level of perceptions in relation
to the TPB elements in
complying with the tax law
while performing their roles?
2a : There is no significant
difference in the level of
perceptions in relation to the
intention to comply, attitudes
towards behaviour, subjective
norms and perceived behavioural
control between tax agents in
Malaysia and New Zealand in
overstating tax expense scenario
Rejected
2b: There is no significant
difference in the level of
perceptions in relation to the
intention to comply, attitudes
towards behaviour, subjective
norms and perceived behavioural
control between tax agents in
Malaysia and New Zealand in
understating income scenario
Rejected
3. Do tax agents in Malaysia
and New Zealand have the same
level of perceptions in relation
to the dimensions in
Multidimensional Ethics Scale
(MES)?
3a: There is no significant
difference in the level of
perceptions between tax agents in
Malaysia and New Zealand with
regard to the dimensions of MES in
overstating tax expense scenario
Partially supported.
Accept for Utilitarianism
and Contractualism
dimensions. Reject for
Moral Equity, Relativism
and Egoism dimensions.
3b: There is no significant
difference in the level of
perceptions between tax agents in
Malaysia and New Zealand with
regard to the dimensions of MES in
understating income scenario
Rejected
266
5.3 Summary
In this chapter, the results from the preliminary analysis were discussed
involving two main parts, which were survey response analysis and preliminary
analysis. The survey response analysis covered findings on response rate,
demographic background, response representativeness and nonresponse bias. The
preliminary analysis part focused on data screening, common method bias, social
desirability bias, descriptive statistics and t-test analysis.
It is important to note that the current study only obtained low response
rates for Malaysia and New Zealand. Despite the low response rate, this did not
hinder further statistical analysis to be performed given that the number of samples
for each country fulfilled the requirement of the relevant statistical tests employed
in the study. In addition, the sample was not truly representive of the population,
especially in the case of Malaysia.
As a result of the low response rates and lack of representativeness of the
observed sample, compared to total population, generalization of the findings from
this study need to be treated with caution. Notwithstanding that, given the limited
study on tax agents’ ethical decision making in Malaysia and New Zealand, the
findings from this study are still beneficial in understanding the compliance
behaviour of tax agents while performing their engagement roles.
A test on nonresponse bias was also conducted between early and late
respondents. The results indicate that nonresponse bias was not a serious threat in
this study. However, given the number of the sample was considered as small to

267
moderate,27 the absence of nonresponse bias could not be fully guaranteed. The
treatment for missing data using EM method, checking for outliers and testing for
normality were discussed in the screening data section.
The results from the common method bias test conducted in the study
suggest that common method bias was not a serious issue. Notwithstanding that, it
was not fully confirmed that the study is free from any bias. The results from the
social desirability bias test, for instance, indicate that social desirability bias exists
in the survey responses.
The descriptive statistics provide some overview of the perceptions of
respondents on the selected factors examined in this study. Comparisons on the
responses between respondents from Malaysia and New Zealand were tested using
t-test analysis. It is interesting that there were some similarities and differences
between respondents from Malaysia and New Zealand in their perceptions towards
culture, the TPB items and ethical sensitivity in complying with the tax laws.
The results suggest that Malaysian respondents favour to be in Power
Distance and Masculinity positions in complying with the tax law while
performing their engagement roles. New Zealand respondents were more prone to
be individualistic and favour uncertainty avoidance cultural attributes in complying
with the tax law.
It is also noted that New Zealand respondents were less likely to overstate
tax expenses and understate income tax compared to Malaysian respondents. New
27 In general any sample of at least 30 is normally acceptable for statistical analysis due to the
central limit theorem (Moore & McCabe, 2006; Lind et al., 2008).

268
Zealand respondents also had higher ethical sensitivity in both tax scenarios
compared to Malaysian respondents. The next chapter explains the model
assessment results using the PLS analysis.

269
CHAPTER 6
MODEL EVALUATION
6.0 Introduction
This chapter presents the results from the model evaluation conducted as
part of this study. Specifically, the discussions of the chapter focus on the
measurement model at the first order factor by examining the reliability and
validity of the indicators and constructs. The discussion also covers the second
order factor model and structural model. Finally, the results from the hypotheses
testing are presented. The chapter ends with a summary.
6.1 Measurement model – First order factor model
In the measurement model, the reliability and validity of the measures in
each construct are determined to evaluate whether or not the measures represent the
constructs. In this study, six constructs of: intention, attitudes, subjective norms,
perceived behavioural control, ethical sensitivity and culture, are developed. Since
this study is comparative in nature, the reliability and validity tests have to be
performed simultaneously to ensure they are acceptable in both tax environments.
6.1.1 Reliability of reflective constructs
The reliability of reflective construct as discussed in Chapter 4, Research
Methodology could be determined at two stages, at the individual level and
construct level. At the individual level, the measure is tested on its factor loadings
and overall consistency of the construct (composite reliability) is used at the
construct level (Henseler et al., 2009; Hair et al., 2012; Hair et al., 2013).

270
6.1.1.1 Indicators’ reliability
Table 6.1 to Table 6.4 present the loadings, t-values and level of
significance of each measure used in the study. This step is important to determine
which measures are considered as significant for the study. For instance, based on
the reliability test, not all measures for culture are included in the revised model
later on. Similar approaches were taken by prior studies using PLS in tax context
such as Saad (2011) and Smart (2012) in determining which measures should be
retained in the model.
As discussed earlier in Chapter 4, section 4.7.8.3, there is no absolute
threshold for factor loadings in PLS. While the common acceptable loading is 0.70,
a factor loading of 0.50 is also acceptable (Hair et al., 2012). In studies involving
newly developed measures, such as this study, a loading of 0.4 is still acceptable
(Henseler et al., 2009; Hair et al., 2012). In fact, Hair et al. (2011) argue that,
sometimes a weak indicator has to be retained to ensure content validity. The
results in Table 6.1 indicate that the factor loadings vary from 0.989 to -0.381. In a
reflective construct, a measure is a candidate for deletion if its deletion contributes
to a better value of average variance extracted (AVE). However, deletion of a
measure needs to be done with caution because while a single-item measure is
allowed in PLS, it may prone to bias in estimating the measurement and structural
models. In Table 6.1, several items in italics are candidates for deletion at the next
level.

271
Table 6.1 Reflective constructs, measures and loadings for overstating tax
expense scenario (original model)
Constructs
Malaysia New Zealand
PLS
loadings t-values
Level
of sig.
PLS
loadings t-values
Level
of sig.
Power Distance (PD) AVE =0.418 AVE =0.450
PD1 0.535 1.681 0.10 0.715 3.007 0.001
PD2 0.790 3.829 0.001 0.702 3.360 0.001
PD3 0.866 4.448 0.001 0.788 3.796 0.001
PD4R -0.102 0.301 Not sig. 0.418 1.922 0.1
Individualism (IND) AVE =0.231 AVE =0.442
IND1R 0.606 1.578 Not sig. 0.730 4.839 0.001
IND2 0.108 0.267 Not sig. 0.328 1.435 Not sig.
IND3 0.706 1.945 0.10 0.865 9.905 0.001
IND4R 0.220 0.526 Not sig. 0.618 4.453 0.001
Masculinity (MAS) AVE =0.278 AVE =0.316
MAS1 -0.305 0.678 Not sig. -0.232 0.771 Not sig.
MAS2 0.677 1.907 0.10 0.553 2.336 0.05
MAS3 -0.200 0.322 Not sig. -0.052 0.184 Not sig.
MAS4 0.739 1.930 0.10 0.949 3.336 0.001
Uncertainty
Avoidance (UAV)
AVE = 0.271 AVE = 0.383
UAV1 0.610 1.435 Not sig. 0.634 2.433 0.05
UAV2R -0.368 0.761 Not sig. 0.769 3.396 0.001
UAV3 0.668 1.848 0.10 0.652 2.960 0.005
UAV4R 0.359 1.047 Not sig. 0.336 1.153 Not sig.
Intention (INO) AVE =0.814 AVE =0.722
INO1R 0.909 35.348 0.001 0.907 43.574 0.001
INO2 0.897 37.937 0.001 0.758 12.196 0.001
INO3R 0.900 39.762 0.001 0.879 26.884 0.001
Attitude (ATO) AVE =0.832 AVE =0.687
ATO1R 0.913 46.995 0.001 0.835 32.298 0.001
ATO2 0.907 34.817 0.001 0.790 14.375 0.001
ATO3 0.916 32.708 0.001 0.860 30.074 0.001
Subjective norms
(SNO)
AVE =0.431 AVE = 0.623
SNO1R 0.924 23.075 0.001 0.836 24.128 0.001
SNO2 0.639 4.351 0.001 0.756 11.828 0.001
SNO3 0.174 0.733 Not sig. 0.772 13.524 0.001
Perceived
behavioural control
(PBO)
AVE = 0.326 AVE = 0.318
PBO1 0.841 1.716 0.10 -0.393 0.847 Not sig.
PBO2 0.358 1.095 Not sig. 0.147 0.611 Not sig.
PBO3 -0.381 0.755 Not sig. 0.882 1.730 0.10
Moral Equity (MEO) AVE =0.789 AVE = 0.719
MEO1 0.925 42.687 0.001 0.900 26.054 0.001
MEO2 0.910 26.282 0.001 0.941 70.980 0.001
MEO3 0.906 40.363 0.001 0.798 8.837 0.001
MEO4 0.806 12.677 0.001 0.737 10.262 0.001
Relativism (REO) AVE = 0.901 AVE = 0.931
REO1 0.951 48.852 0.001 0.985 102.304 0.001
REO2 0.948 58.992 0.001 0.965 89.410 0.001
Egoism (EGO) AVE =0.518 AVE =0.485

272
EGO1R 0.639 1.814 0.10 0.487 1.314 Not sig.
EGO2 0.792 2.639 0.01 0.856 2.721 0.01
Utilitarianism (UTO) AVE =0.616 AVE =0.634
UTO1 0.805 7.088 0.001 0.808 7.241 0.001
UTO2R 0.764 5.167 0.001 0.785 5.869 0.001
Contractualism
(COO)
AVE =0.978 AVE =0.950
COO1R 0.989 260.835 0.001 0.978 18.425 0.001
COO2R 0.988 221.215 0.001 0.972 15.951 0.001
Note: Items in italics are candidates for deletion.
The deletion of some measures in Table 6.1 have resulted in better AVEs
for majority of the constructs in which they exceeded the threshold for AVE of
0.50 as indicated in Table 6.2. However, there are constructs (IND, PBO and EGO)
which are marginally below 0.50. Similar findings have been documented by
Duarte and Raposo (2010) and Smart (2012) in evaluating the loadings of the
constructs in their studies. Duarte and Raposo (2010), for instance, retained a
construct with an AVE of 0.361 in their measurement model. Thus, after
considering the contribution to content validity, all other measures were retained as
presented in Table 6.2.

273
Table 6.2 Reflective constructs, measures and loadings for overstating tax
expense scenario (revised model)
Constructs
Malaysia New Zealand
PLS
loadings t-values
Level of
sig.
PLS
loadings t-values
Level of
sig.
Power Distance (PD) AVE = 0.554 AVE = 0.600
PD1 0.540 2.457 0.05 0.762 3.346 0.001
PD2 0.788 4.706 0.001 0.738 3.201 0.005
PD3 0.868 6.797 0.001 0.821 4.158 0.001
Individualism (IND) AVE = 0.470 AVE = 0.714
IND1R 0.659 2.346 0.05 0.753 4.668 0.001
IND3 0.711 2.598 0.05 0.927 15.046 0.001
Masculinity (MAS) AVE = 0.608 AVE = 0.641
MAS2 0.727 3.723 0.001 0.966 17.509 0.001
MAS4 0.829 4.262 0.001 0.811 2.825 0.01
Uncertainty
Avoidance (UAV)
AVE = 0.528 AVE = 0.560
UAV1 0.681 2.396 0.05 0.811 2.825 0.01
UAV3 0.770 2.768 0.01 0.729 2.535 0.05
Intention (INO) AVE = 0.814 AVE = 0.722
INO1R 0.909 35.795 0.001 0.908 45.414 0.001
INO2 0.896 36.767 0.001 0.756 12.108 0.001
INO3R 0.901 40.712 0.001 0.878 26.640 0.001
Attitude (ATO) AVE = 0.832 AVE = 0.687
ATO1R 0.913 46.463 0.001 0.835 32.254 0.001
ATO2 0.907 34.413 0.001 0.789 14.536 0.001
ATO3 0.916 32.541 0.001 0.860 30.081 0.001
Subjective norms
(SNO)
AVE = 0.631 AVE = 0.689
SNO1R 0.934 28.668 0.001 0.860 22.455 0.001
SNO2 0.624 4.276 0.001 0.799 13.244 0.001
Perceived
behavioural control
(PBO)
AVE = 0.540 AVE = 0.476
PBO1 0.945 5.288 0.001 0.974 3.949 0.001
PBO2 0.433 1.666 0.100 0.056 0.240 Not sig.
Moral Equity (MEO) AVE = 0.790 AVE = 0.719
MEO1 0.925 42.901 0.001 0.900 26.594 0.001
MEO2 0.910 26.051 0.001 0.941 70.899 0.001
MEO3 0.906 39.985 0.001 0.798 8.754 0.001
MEO4 0.806 12.872 0.001 0.737 10.099 0.001
Relativism (REO) AVE = 0.901 AVE = 0.931
REO1 0.951 46.538 0.001 0.965 104.287 0.001
REO2 0.948 59.329 0.001 0.965 89.637 0.001
Egoism (EGO) AVE = 0.518 AVE = 0.485
EGO1R 0.640 2.371 0.05 0.486 1.710 0.10
EGO2 0.792 3.350 0.01 0.857 3.518 0.001
Utilitarian (UTO) AVE = 0.616 AVE = 0.634
UTO1 0.805 6.875 0.001 0.808 7.223 0.001
UTO2R 0.764 5.164 0.001 0.785 5.915 0.001
Contractualism
(COO)
AVE = 0.978 AVE = 0.950
COO1R 0.989 211.155 0.001 0.978 19.572 0.001
COO2R 0.988 222.292 0.001 0.972 15.270 0.001

274
Similar approaches have been applied to assess the reliability of measures
for the understating income scenario. The results in Table 6.3 suggest that some
measures did not meet the required threshold and became candidates for deletion in
the next process. Overall, the factor loadings for the measures in understating
income scenario vary from 0.999 to - 0.527.
Table 6.3 Reflective construct, measures and loadings for understating income
scenario (original model)
Constructs
Malaysia New Zealand
PLS
loadings t-values
Level of
sig.
PLS
loadings t-values
Level
of sig.
Power Distance (PD) AVE = 0.347 AVE = 0.358
PD1 0.338 1.528 Not sig. 0.503 1.955 0.10
PD2 0.658 3.157 0.005 0.801 3.375 0.001
PD3 0.878 4.946 0.001 0.468 1.869 0.10
PD4R 0.261 1.095 Not sig. 0.563 2.452 0.05
Individualism (IND) AVE = 0.276 AVE = 0.408
IND1R 0.680 2.605 0.01 0.674 3.821 0.001
IND2 -0.239 0.982 Not sig. 0.146 0.919 Not sig.
IND3 0.668 2.549 0.05 0.922 14.702 0.001
IND4R 0.370 1.553 Not sig. 0.553 3.383 0.001
Masculinity (MAS) AVE = 0.316 AVE = 0.300
MAS1 0.194 0.790 Not sig. -0.527 2.506 0.05
MAS2 0.762 3.322 0.005 0.450 1.867 0.10
MAS3 -0.167 0.722 Not sig. -0.097 0.515 Not sig.
MAS4 0.785 3.220 0.005 0.843 6.089 0.001
Uncertainty
Avoidance (UAV)
AVE = 0.245 AVE = 0.378
UAV1 0.835 3.684 0.001 0.727 4.955 0.001
UAV2R -0.407 1.621 Not sig. 0.669 5.143 0.001
UAV3 -0.004 0.020 Not sig. 0.666 4.186 0.001
UAV4R 0.343 1.345 Not sig. 0.303 1.619 Not sig.
Intention (INU) AVE = 0.721 AVE = 0.667
INU1R 0.902 51.765 0.001 0.841 16.244 0.001
INU2 0.788 10.359 0.001 0.777 12.298 0.001
INU3R 0.853 16.208 0.001 0.830 17.166 0.001
Attitude AVE = 0.730 AVE = 0.545
ATU1R 0.827 26.530 0.001 0.791 14.070 0.001
ATU2 0.877 23.853 0.001 0.631 6.888 0.001
ATU3 0.856 18.255 0.001 0.781 12.999 0.001
Subjective norms
(SNU)
AVE = 0.420 AVE = 0.634
SNU1R 0.825 8.685 0.001 0.657 4.898 0.001
SNU2 0.757 6.353 0.001 0.818 12.023 0.001
SNU3 0.085 0.505 Not sig. 0.895 26.192 0.001
Perceived
Behavioural Control
(PBU)
AVE = 0.476 AVE = 0.376

275
PBU1 0.999 3.420 0.001 0.177 0.976 Not sig.
PBU2 0.429 1.672 0.10 0.381 1.814 0.10
PBU3 0.496 1.901 0.10 0.975 8.380 0.001
Moral Equity (MEU) AVE = 0.801 AVE = 0.670
MEU1 0.927 36.668 0.001 0.858 16.426 0.001
MEU2 0.954 81.190 0.001 0.820 6.725 0.001
MEU3 0.877 19.743 0.001 0.903 18.201 0.001
MEU4 0.815 13.623 0.001 0.675 4.663 0.001
Relativism (REU) AVE = 0.892 AVE = 0.880
REU1 0.942 22.074 0.001 0.958 18.800 0.001
REU2 0.948 44.555 0.001 0.917 11.183 0.001
Egoism (EGU) AVE = 0.484 AVE = 0.539
EGU1R 0.981 4.792 0.001 0.522 1.894 0.10
EGU2 0.068 0.252 Not sig. 0.897 3.868 0.001
Utilitarian (UTU) AVE = 0.586 AVE = 0.610
UTU1 0.767 6.223 0.001 0.722 5.294 0.001
UTU2R 0.764 5.237 0.001 0.836 10.257 0.001
Contractualism
(COU)
AVE = 0.981 AVE = 0.971
COU1R 0.981 109.508 0.001 0.988 180.621 0.001
COU2R 0.981 141.726 0.001 0.983 85.931 0.001
Note: Items in italics are candidates for deletion.
The same rules were applied to measures in the understating income
scenario in retaining or deleting a particular measure. A majority of the items met
the threshold value of at least 0.50. There are, however, items with low loadings,
(PD3, UAV4R, PBU1, EGU2), yet these are retained to avoid the use of single-
item measure in the measurement model. Furthermore, the values of AVEs for the
respective constructs are still considered to be acceptable. Therefore, the items in
Table 6.4 were all retained for further analysis.

276
Table 6.4 Reflective construct, measures and loadings for understating income
scenario (revised model)
Constructs
Malaysia New Zealand
PLS
loadings t-values
Level
of sig.
PLS
loadings t-values
Level
of sig.
Power Distance
(PD)
AVE =0.683 AVE = 0.509
PD2 0.662 3.496 0.001 0.990 4.048 0.001
PD3 0.964 11.222 0.001 0.196 0.688 Not
sig.
Individualism
(IND)
AVE = 0.470 AVE = 0.694
IND1R 0.688 2.410 0.05 0.683 3.926 0.001
IND3 0.683 2.399 0.05 0.960 24.225 0.001
Masculinity
(MAS)
AVE = 0.610 AVE = 0.642
MAS2 0.776 3.416 0.001 0.592 2.335 0.05
MAS4 0.785 3.196 0.005 0.966 9.285 0.001
Uncertainty
Avoidance
(UAV)
AVE = 0.485 AVE = 0.503
UAV1 0.845 3.450 0.001 0.976 6.805 0.001
UAV4R 0.506 1.748 0.10 0.231 0.967 Not
sig.
Intention (INU) AVE = 0.721 AVE = 0.666
INU1R 0.903 53.300 0.001 0.843 17.580 0.001
INU2 0.788 10.442 0.001 0.778 12.270 0.001
INU3R 0.852 15.670 0.001 0.827 15.843 0.001
Attitude AVE = 0.730 AVE = 0.545
ATU1R 0.827 26.538 0.001 0.791 13.765 0.001
ATU2 0.879 23.993 0.001 0.630 6.726 0.001
ATU3 0.856 18.386 0.001 0.782 12.741 0.001
Subjective norms
(SNU)
AVE = 0.630 AVE = 0.691
SNU1R 0.822 8.789 0.001 0.747 4.792 0.001
SNU2 0.764 7.100 0.001 0.908 12.983 0.001
Perceived
Behavioural
Control (PBU)
AVE = 0.632 AVE = 0.505
PBU1 0.999 3.886 0.001 0.105 0.547 Not
sig.
PBU3 0.514 1.907 0.10 0.999 9.159 0.001
Moral Equity
(MEU)
AVE = 0.801 AVE = 0.670
MEU1 0.927 36.576 0.001 0.858 16.585 0.001
MEU2 0.954 82.517 0.001 0.820 6.718 0.001
MEU3 0.877 19.869 0.001 0.903 18.368 0.001
MEU4 0.815 13.911 0.001 0.674 4.624 0.001
Relativism (REU) AVE = 0.892 AVE = 0.880
REU1 0.942 21.657 0.001 0.958 18.394 0.001
REU2 0.948 56.029 0.001 0.917 10.892 0.001

277
Egoism (EGU) AVE = 0.484 AVE = 0.538
EGU1R 0.982 4.687 0.001 0.520 1.886 0.10
EGU2 0.068 0.253 Not sig. 0.898 3.931 0.001
Utilitarian (UTU) AVE = 0.586 AVE = 0.610
UTU1 0.767 6.089 0.001 0.720 5.050 0.001
UTU2R 0.764 5.239 0.001 0.838 10.320 0.001
Contractualism
(COU)
AVE = 0.963 AVE = 0.971
COU1R 0.981 113.185 0.001 0.988 199.130 0.001
COU2R 0.981 140.636 0.001 0.983 91.144 0.001
6.1.1.2 Internal consistency (Composite reliability)
As mentioned in section 4.7.8.3 of Chapter 4, once the indicators’ reliability
are satisfied, the next step is to test the overall internal consistency of the constructs
by examining the composite reliability of the constructs. Fornell and Larcker
(1981) suggest a threshold value of 0.70 for a construct to be included in the model.
However, a value of 0.60 is considered as acceptable if the study involves newly
developed measure, such as this study (Henseler et al., 2009; Hair et al., 2012). The
results in Table 6.5 present the composite reliability for all constructs in both
scenarios in Malaysia and New Zealand. The results indicate that majority of the
constructs have high composite reliability, except for PD, UAV, PBO, PBU, which
have marginally lower composite reliability than 0.60. However, to preserve the
content validity, all constructs are retained.

278
Table 6.5 Composite reliability of the constructs
Construct
Overstating tax expense
scenario
Understating income
scenario
Malaysia
New
Zealand Malaysia New Zealand
Power Distance (PD) 0.782 0.818 0.807 0.589
Individualism (IND) 0.639 0.831 0.639 0.815
Masculinity (MAS) 0.755 0.772 0.757 0.772
Uncertainty Avoidance (UAV) 0.690 0.746 0.639 0.594
Intention (INO/INU) 0.929 0.866 0.885 0.857
Attitudes (ATO/ATU) 0.936 0.868 0.890 0.780
Subjective norms (SNO/SNU) 0.766 0.816 0.773 0.816
Perceived Behavioural Control
(PBO/PBU)
0.673 0.503 0.757 0.552
Moral Equity (MEO/MEU) 0.937 0.910 0.941 0.889
Relativism (REO/REU) 0.948 0.964 0.943 0.936
Egoism (EGO/EGU) 0.680 0.637 0.516 0.685
Utilitarian (UTO/UTU) 0.762 0.776 0.739 0.757
Contractualism (COO/COU) 0.988 0.974 0.981 0.985
6.1.2 Validity of constructs
As discussed in section 4.7.8.3 of Chapter 4, PLS applies a confirmatory
factor analysis technique to confirm the strength of the measures by examining the
convergent validity and discriminant validity.
6.1.2.1 Convergent validity (AVE)
The convergent validity is examined by observing the AVE values of all
constructs. The convergent validity examines whether or not a set of measures

279
represent the same concept (unidimensionality). The AVEs for the study are
presented in Table 6.2 for the overstating tax expenses and Table 6.4 for
understating income. A majority of the AVEs met the threshold values of 0.50
except for a few constructs. While the acceptable value for AVE is 0.50, however,
for studies which involved newly developed measures, a value of around 0.50 is
still acceptable, as indicated in Duarte and Raposo (2010) and Smart (2012).
Therefore, after considering the theoretical aspect of the study, all constructs are
retained in the model.
6.1.2.2 Discriminant validity
The discriminant validity differentiates whether or not items are different
among constructs. Two tests were used, the cross-loading and Fornell-Larcker
(1981) criterion.
(a) Item cross-loadings
The cross-loadings approach test the existence of discriminant validity at
the item level and in this test, all loadings for each measure should be higher than
their cross-loadings. Table 6.6 to Table 6.9 present the loadings and cross-loadings
of all measures in the overstating tax expense scenario and understating income
scenario in Malaysia and New Zealand. The results indicate that all items loaded
higher in their own measures compared to all their cross-loadings, except item
perceived behavioural control (PBO) in overstating tax expense and items egoism
(EGU2) and perceived behavioural control (PBU1) in understating income
expense. However, since cross-loading is not the only test to examine discriminant

280
validity and is considered to be more liberal than the Fornell-Larcker (1981) test,
all measures are retained.

281
Table 6.6 Item cross-loadings for overstating tax expenses scenario - Malaysia
ATO COO EGO IND INO MAS MEO PBO PD REO SNO UAV UTO
ATO1R 0.91 -0.26 -0.22 0.36 0.85 -0.17 -0.77 -0.26 0.25 -0.45 0.60 -0.34 -0.47
ATO2 0.90 -0.17 -0.21 0.21 0.75 -0.18 -0.69 -0.23 0.27 -0.40 0.63 -0.01 -0.51
ATO3 0.91 -0.31 -0.27 0.23 0.75 -0.13 -0.73 -0.33 0.28 -0.47 0.59 -0.07 -0.57
COO1R -0.27 0.98 0.17 -0.08 -0.32 0.15 0.40 0.14 -0.16 0.10 -0.30 0.17 0.39
COO2R -0.27 0.98 0.15 -0.10 -0.31 0.20 0.41 0.16 -0.16 0.10 -0.30 0.17 0.43
EGO1R -0.15 0.24 0.63 -0.00 -0.17 -0.11 0.13 -0.07 -0.25 -0.02 -0.13 -0.06 0.15
EGO2 -0.18 0.02 0.79 0.18 -0.21 0.00 0.24 0.20 -0.05 0.28 -0.15 0.10 0.31
IND1R 0.20 0.01 -0.02 0.65 0.17 -0.08 -0.06 0.08 -0.07 0.12 -0.00 -0.33 -0.02
IND3 0.20 -0.14 0.21 0.71 0.18 -0.31 -0.23 0.03 0.12 -0.14 0.22 -0.14 0.01
INO1R 0.79 -0.29 -0.31 0.27 0.90 -0.23 -0.67 -0.16 0.23 -0.40 0.57 -0.16 -0.43
INO2 0.77 -0.24 -0.18 0.13 0.89 -0.19 -0.70 -0.25 0.22 -0.46 0.65 -0.04 -0.39
INO3R 0.77 -0.32 -0.24 0.29 0.90 -0.23 -0.72 -0.25 0.28 -0.48 0.59 -0.29 -0.43
MAS2 -0.13 0.17 -0.16 -0.40 -0.17 0.72 0.14 0.01 0.00 0.17 -0.27 0.13 0.03
MAS4 -0.14 0.10 0.04 -0.10 -0.21 0.82 0.19 -0.13 0.11 0.14 -0.18 0.21 0.01
MEO1 -0.76 0.38 0.26 -0.19 -0.72 0.16 0.92 0.37 -0.36 0.54 -0.57 0.14 0.53
MEO2 -0.74 0.39 0.30 -0.18 -0.72 0.22 0.91 0.38 -0.30 0.53 -0.61 0.17 0.54
MEO3 -0.71 0.41 0.15 -0.22 -0.67 0.25 0.90 0.31 -0.35 0.47 -0.56 0.14 0.54
MEO4 -0.62 0.26 0.23 -0.20 -0.62 0.14 0.80 0.20 -0.21 0.66 -0.55 0.09 0.50
PBO1 -0.30 0.14 0.13 0.05 -0.24 -0.08 0.29 0.94 -0.16 0.26 -0.25 -0.00 0.23
PBO2 -0.09 0.09 -0.04 0.10 -0.08 -0.01 0.30 0.43 -0.18 0.38 -0.25 0.09 0.17
PD1 0.11 -0.16 -0.02 -0.12 0.09 -0.11 -0.14 0.10 0.54 -0.06 0.27 -0.05 -0.11
PD2 0.14 -0.21 -0.05 -0.00 0.17 0.07 -0.17 -0.13 0.78 -0.07 0.24 -0.03 -0.16
PD3 0.32 -0.06 -0.26 0.12 0.27 0.12 -0.38 -0.27 0.86 -0.11 0.29 -0.04 -0.23
REO1 -0.46 0.09 0.21 -0.03 -0.47 0.26 0.60 0.34 -0.04 0.95 -0.52 0.02 0.44
REO2 -0.45 0.10 0.16 -0.00 -0.46 0.12 0.57 0.35 -0.19 0.94 -0.54 -0.09 0.46
SNO1R 0.68 -0.19 -0.18 0.21 0.67 -0.31 -0.61 -0.31 0.38 -0.58 0.93 -0.05 -0.41
SNO2 0.28 -0.38 -0.12 -0.02 0.30 -0.08 -0.39 -0.14 0.08 -0.23 0.62 0.04 -0.29
UAV1 -0.11 0.12 -0.02 -0.23 -0.12 0.31 0.11 -0.08 0.01 0.07 -0.06 0.68 0.10
UAV3 -0.12 0.13 0.07 -0.26 -0.14 0.03 0.11 0.11 -0.08 -0.11 0.01 0.76 -0.07
UTO1 -0.45 0.13 0.35 0.09 -0.38 0.08 0.45 0.21 -0.09 0.53 -0.36 0.07 0.80
UTO2R -0.44 0.53 0.15 -0.10 -0.35 -0.04 0.49 0.20 -0.29 0.20 -0.34 -0.06 0.76

282
Table 6.7 Item cross-loadings for overstating tax expenses scenario – New
Zealand
ATO COO EGO IND INO MAS MEO PBO PD REO SNO UAV UTO
ATO1R 0.84 -0.29 0.12 0.29 0.75 -0.21 -0.74 -0.26 0.24 - 0.47 0.60 0.02 -0.28
ATO2 0.79 -0.12 0.01 0.14 0.52 -0.19 -0.49 -0.30 -0.02 -0.45 0.49 -0.04 -0.32
ATO3 0.86 -0.21 0.11 0.36 0.73 -0.37 -0.68 -0.17 0.19 -0.42 0.49 -0.24 -0.41
COO1R -0.27 0.97 -0.07 -0.15 -0.25 0.11 0.31 0.17 -0.12 0.21 -0.27 0.02 0.16
COO2R -0.23 0.97 -0.05 -0.15 -0.22 0.13 0.25 0.13 -0.02 0.25 -0.21 0.13 0.16
EGO1R 0.09 -0.04 0.48 0.11 0.09 0.01 -0.14 0.00 -0.07 -0.30 0.17 -0.21 -0.02
EGO2 0.06 -0.05 0.85 0.09 0.16 -0.16 -0.09 0.16 0.15 0.11 0.04 -0.12 0.23
IND1R 0.22 -0.17 0.00 0.75 0.19 -0.10 -0.18 -0.20 -0.00 -0.21 0.33 -0.05 -0.25
IND3 0.31 -0.11 0.18 0.92 0.34 -0.34 -0.27 -0.07 0.06 -0.20 0.18 -0.27 -0.22
INO1R 0.75 -0.21 0.21 0.35 0.90 -0.35 -0.72 -0.16 0.27 -0.36 0.50 -0.21 -0.27
INO2 0.56 -0.27 0.12 0.17 0.75 -0.30 -0.48 -0.12 0.10 -0.39 0.52 0.00 -0.24
INO3R 0.74 -0.15 0.14 0.30 0.87 -0.23 -0.72 -0.17 0.13 -0.43 0.53 -0.26 -0.31
MAS2 -0.06 0.15 -0.11 -0.23 -0.11 0.59 0.05 -0.01 -0.09 0.04 -0.02 0.01 0.03
MAS4 -0.34 0.09 -0.11 -0.27 -0.36 0.96 0.26 0.07 -0.07 0.18 -0.16 0.07 0.25
MEO1 -0.73 0.26 -0.18 -0.31 -0.75 0.30 0.89 0.11 -0.26 0.36 -0.51 0.27 0.33
MEO2 -0.79 0.28 -0.12 -0.20 -0.75 0.24 0.94 0.18 -0.26 0.50 -0.60 0.13 0.37
MEO3 -0.52 0.25 -0.21 -0.28 -0.52 0.16 0.79 0.14 -0.08 0.30 -0.43 0.24 0.29
MEO4 -0.56 0.19 -0.02 -0.15 -0.54 0.05 0.74 0.13 -0.11 0.46 -0.57 0.01 0.25
PBO1 -0.28 0.14 0.16 -0.10 -0.16 0.03 0.14 0.97 0.13 0.23 -0.26 0.02 0.19
PBO2 -0.02 -0.04 0.26 0.10 0.03 -0.08 -0.06 0.06 0.02 0.05 -0.05 -0.02 0.16
PD1 0.10 0.01 0.06 -0.07 0.14 -0.06 -0.17 0.21 0.76 0.18 -0.01 0.10 -0.18
PD2 0.19 -0.14 0.05 0.12 0.19 -0.14 -0.17 0.00 0.73 -0.11 0.18 0.07 -0.11
PD3 0.12 -0.00 0.11 0.00 0.13 0.02 -0.17 0.13 0.82 0.05 0.08 0.18 -0.20
REO1 -0.54 0.24 -0.05 -0.28 -0.44 0.18 0.47 0.19 0.01 0.96 -0.51 0.15 0.31
REO2 -0.49 0.21 -0.05 -0.17 -0.44 0.15 0.46 0.24 0.04 0.96 -0.53 0.10 0.27
SNO1R 0.58 -0.18 0.10 0.30 0.54 -0.18 -0.49 -0.29 0.11 -0.51 0.86 0.00 -0.30
SNO2 0.47 -0.22 0.10 0.14 0.46 -0.04 -0.55 -0.13 0.09 -0.37 0.79 0.06 -0.12
UAV1 -0.09 -0.02 -0.16 -0.21 -0.16 0.05 0.15 -0.03 0.03 0.11 0.08 0.81 0.06
UAV3 -0.08 0.16 -0.16 -0.12 -0.14 0.056 0.15 0.10 0.21 0.09 -0.02 0.72 0.07
UTO1 -0.31 0.05 0.33 -0.11 -0.26 0.11 0.26 0.12 -0.20 0.31 -0.20 -0.00 0.80
UTO2R -0.34 0.22 -0.03 -0.32 -0.25 0.25 0.33 0.14 -0.13 0.17 -0.23 0.14 0.78
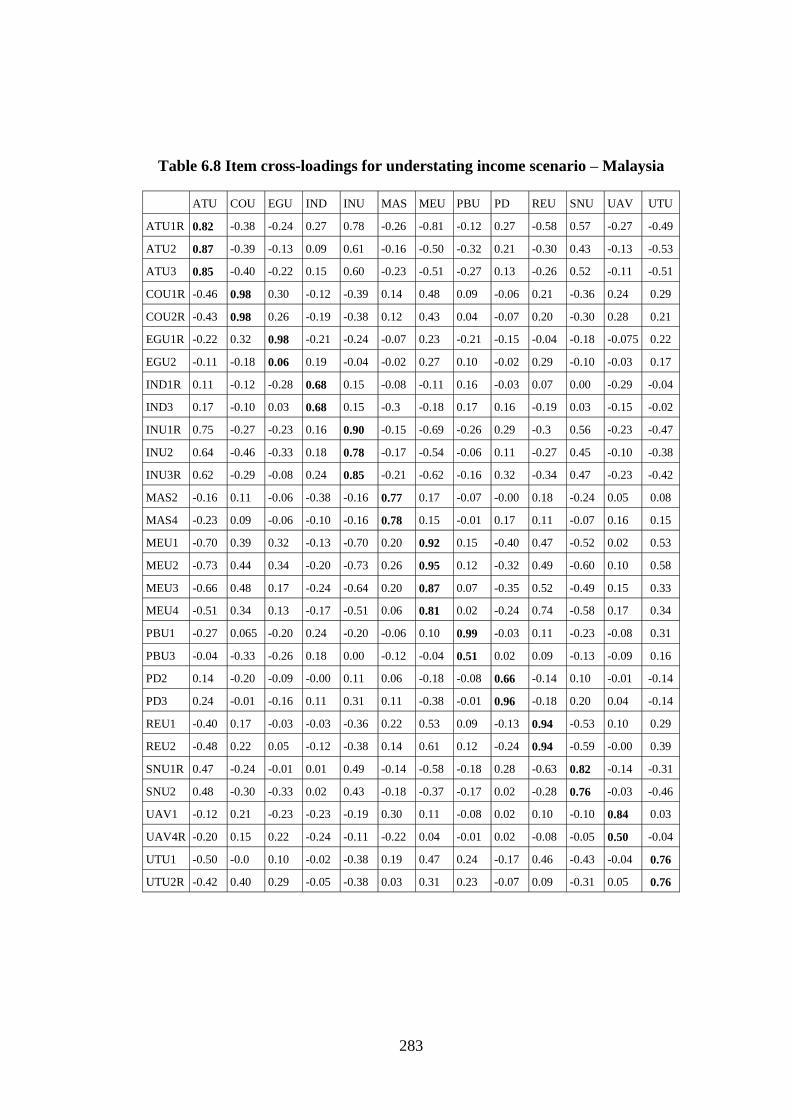
283
Table 6.8 Item cross-loadings for understating income scenario – Malaysia
ATU COU EGU IND INU MAS MEU PBU PD REU SNU UAV UTU
ATU1R 0.82 -0.38 -0.24 0.27 0.78 -0.26 -0.81 -0.12 0.27 -0.58 0.57 -0.27 -0.49
ATU2 0.87 -0.39 -0.13 0.09 0.61 -0.16 -0.50 -0.32 0.21 -0.30 0.43 -0.13 -0.53
ATU3 0.85 -0.40 -0.22 0.15 0.60 -0.23 -0.51 -0.27 0.13 -0.26 0.52 -0.11 -0.51
COU1R -0.46 0.98 0.30 -0.12 -0.39 0.14 0.48 0.09 -0.06 0.21 -0.36 0.24 0.29
COU2R -0.43 0.98 0.26 -0.19 -0.38 0.12 0.43 0.04 -0.07 0.20 -0.30 0.28 0.21
EGU1R -0.22 0.32 0.98 -0.21 -0.24 -0.07 0.23 -0.21 -0.15 -0.04 -0.18 -0.075 0.22
EGU2 -0.11 -0.18 0.06 0.19 -0.04 -0.02 0.27 0.10 -0.02 0.29 -0.10 -0.03 0.17
IND1R 0.11 -0.12 -0.28 0.68 0.15 -0.08 -0.11 0.16 -0.03 0.07 0.00 -0.29 -0.04
IND3 0.17 -0.10 0.03 0.68 0.15 -0.3 -0.18 0.17 0.16 -0.19 0.03 -0.15 -0.02
INU1R 0.75 -0.27 -0.23 0.16 0.90 -0.15 -0.69 -0.26 0.29 -0.3 0.56 -0.23 -0.47
INU2 0.64 -0.46 -0.33 0.18 0.78 -0.17 -0.54 -0.06 0.11 -0.27 0.45 -0.10 -0.38
INU3R 0.62 -0.29 -0.08 0.24 0.85 -0.21 -0.62 -0.16 0.32 -0.34 0.47 -0.23 -0.42
MAS2 -0.16 0.11 -0.06 -0.38 -0.16 0.77 0.17 -0.07 -0.00 0.18 -0.24 0.05 0.08
MAS4 -0.23 0.09 -0.06 -0.10 -0.16 0.78 0.15 -0.01 0.17 0.11 -0.07 0.16 0.15
MEU1 -0.70 0.39 0.32 -0.13 -0.70 0.20 0.92 0.15 -0.40 0.47 -0.52 0.02 0.53
MEU2 -0.73 0.44 0.34 -0.20 -0.73 0.26 0.95 0.12 -0.32 0.49 -0.60 0.10 0.58
MEU3 -0.66 0.48 0.17 -0.24 -0.64 0.20 0.87 0.07 -0.35 0.52 -0.49 0.15 0.33
MEU4 -0.51 0.34 0.13 -0.17 -0.51 0.06 0.81 0.02 -0.24 0.74 -0.58 0.17 0.34
PBU1 -0.27 0.065 -0.20 0.24 -0.20 -0.06 0.10 0.99 -0.03 0.11 -0.23 -0.08 0.31
PBU3 -0.04 -0.33 -0.26 0.18 0.00 -0.12 -0.04 0.51 0.02 0.09 -0.13 -0.09 0.16
PD2 0.14 -0.20 -0.09 -0.00 0.11 0.06 -0.18 -0.08 0.66 -0.14 0.10 -0.01 -0.14
PD3 0.24 -0.01 -0.16 0.11 0.31 0.11 -0.38 -0.01 0.96 -0.18 0.20 0.04 -0.14
REU1 -0.40 0.17 -0.03 -0.03 -0.36 0.22 0.53 0.09 -0.13 0.94 -0.53 0.10 0.29
REU2 -0.48 0.22 0.05 -0.12 -0.38 0.14 0.61 0.12 -0.24 0.94 -0.59 -0.00 0.39
SNU1R 0.47 -0.24 -0.01 0.01 0.49 -0.14 -0.58 -0.18 0.28 -0.63 0.82 -0.14 -0.31
SNU2 0.48 -0.30 -0.33 0.02 0.43 -0.18 -0.37 -0.17 0.02 -0.28 0.76 -0.03 -0.46
UAV1 -0.12 0.21 -0.23 -0.23 -0.19 0.30 0.11 -0.08 0.02 0.10 -0.10 0.84 0.03
UAV4R -0.20 0.15 0.22 -0.24 -0.11 -0.22 0.04 -0.01 0.02 -0.08 -0.05 0.50 -0.04
UTU1 -0.50 -0.0 0.10 -0.02 -0.38 0.19 0.47 0.24 -0.17 0.46 -0.43 -0.04 0.76
UTU2R -0.42 0.40 0.29 -0.05 -0.38 0.03 0.31 0.23 -0.07 0.09 -0.31 0.05 0.76

284
Table 6.9 Item cross loadings for understating income scenario – New Zealand
ATU COU EGU IND INU MAS MEU PBU PD REU SNU UAV UTU
ATU1R 0.79 -0.32 -0.01 0.23 0.59 -0.08 -0.53 0.18 0.05 -0.29 0.32 -0.04 -0.23
ATU2 0.63 -0.05 -0.19 0.03 0.20 -0.11 -0.04 -0.01 0.12 -0.25 0.38 0.13 -0.33
ATU3 0.78 -0.06 0.02 0.18 0.53 -0.26 -0.32 0.13 0.06 -0.18 0.23 -0.15 -0.48
COU1R -0.25 0.98 0.04 -0.14 -0.32 0.00 0.33 -0.27 -0.18 0.24 -0.23 -0.02 0.13
COU2R -0.20 0.98 0.04 -0.12 -0.27 -0.00 0.29 -0.26 -0.19 0.23 -0.23 0.00 0.11
EGU1R 0.01 0.06 0.51 0.07 0.07 -0.05 -0.19 -0.00 0.13 -0.15 0.13 0.00 0.09
EGU2 -0.05 0.02 0.89 0.10 0.15 -0.20 -0.13 0.00 0.04 0.12 -0.03 -0.13 0.15
IND1R 0.05 -0.13 0.04 0.68 0.13 -0.10 -0.13 0.05 0.15 -0.26 0.23 -0.08 -0.21
IND3 0.27 -0.11 0.12 0.96 0.35 -0.34 -0.31 0.15 0.08 -0.21 0.24 -0.25 -0.19
INU1R 0.57 -0.18 0.25 0.36 0.84 -0.32 -0.58 0.30 0.09 -0.13 0.12 -0.37 -0.26
INU2 0.49 -0.37 0.09 0.17 0.77 -0.19 -0.40 0.20 0.16 -0.17 0.24 -0.10 -0.36
INU3R 0.56 -0.21 0.02 0.25 0.82 -0.15 -0.49 0.24 0.12 -0.28 0.25 -0.12 -0.27
MAS2 0.01 0.06 -0.25 -0.24 -0.09 0.59 0.12 0.12 -0.17 0.01 -0.02 0.05 0.11
MAS4 -0.25 -0.02 -0.14 -0.28 -0.29 0.96 0.19 -0.16 -0.12 0.25 -0.25 -0.00 0.32
MEU1 -0.40 0.23 -0.29 -0.34 -0.65 0.24 0.85 -0.16 -0.21 0.23 -0.12 0.28 0.20
MEU2 -0.33 0.26 -0.04 -0.15 -0.37 0.05 0.81 -0.03 -0.25 0.32 -0.16 0.04 0.11
MEU3 -0.51 0.31 -0.19 -0.25 -0.57 0.22 0.90 -0.08 -0.32 0.36 -0.25 0.09 0.18
MEU4 -0.33 0.25 0.01 -0.12 -0.27 0.02 0.67 -0.03 -0.19 0.34 -0.30 -0.12 0.16
PBU1 -0.22 0.02 0.065 0.09 -0.01 -0.03 0.04 0.10 0.08 0.133 -0.14 -0.11 0.05
PBU3 0.16 -0.27 0.00 0.14 0.31 -0.10 -0.11 0.99 0.05 -0.06 0.05 -0.21 -0.05
PD2 0.10 -0.17 0.08 0.12 0.14 -0.14 -0.29 0.03 0.99 -0.12 0.12 -0.03 -0.17
PD3 0.06 0.07 -0.02 0.02 -0.02 0.027 -0.02 -0.09 0.19 0.05 0.03 0.08 -0.09
REU1 -0.35 0.23 0.04 -0.27 -0.25 0.22 0.35 -0.08 -0.13 0.95 -0.28 0.07 0.23
REU2 -0.24 0.22 0.02 -0.21 -0.18 0.19 0.33 -0.04 -0.12 0.91 -0.32 0.06 0.19
SNU1R 0.23 -0.11 0.00 0.19 0.15 -0.20 -0.14 0.02 0.01 -0.24 0.74 0.14 -0.31
SNU2 0.38 -0.25 0.03 0.25 0.24 -0.17 -0.23 0.07 0.15 -0.29 0.90 0.09 -0.28
UAV1 -0.07 -0.02 -0.11 -0.22 -0.26 0.05 0.12 -0.19 -0.01 0.09 0.14 0.97 0.08
UAV4R -0.06 0.07 0.02 -0.05 -0.05 -0.18 0.06 -0.09 -0.15 -0.09 -0.01 0.23 -0.04
UTU1 -0.37 -0.04 0.32 -0.02 -0.24 0.13 0.10 -0.05 -0.16 0.14 -0.20 -0.00 0.71
UTU2R -0.35 0.20 0.00 -0.29 -0.31 0.33 0.20 -0.03 -0.10 0.21 -0.33 0.10 0.83

285
(b) Fornell-Larcker Criterion (Square root of AVE)
The Fornell-Larcker criterion is another test for discriminant validity which
is considered as more systematic and reliable (Chin, 2010). In this test, the square
root of the AVE for each construct should be higher than its correlations with other
construct to achieve discriminant validity. Table 6.10 to Table 6.13 present the
results from the Fornell-Larcker criterion tests for both scenarios of overstating tax
expenses and understating tax income for Malaysia and New Zealand. The results
indicate that the square roots for each construct are greater than their correlations
with other construct suggesting discriminant validity have been achieved.
Table 6.10 Fornell- Lacker test for overstating tax expense scenario - Malaysia
ATO COO EGO IND INO MAS MEO PBO PD REO SNO UAV UTO
ATO 0.91
COO -0.27 0.98
EGO -0.23 0.16 0.71
IND 0.30 -0.09 0.13 0.68
INO 0.86 -0.32 -0.27 0.25 0.90
MAS -0.18 0.17 -0.06 -0.30 -0.24 0.77
MEO -0.80 0.41 0.27 -0.22 -0.77 0.22 0.88
PBO -0.30 0.15 0.10 0.08 -0.25 -0.08 0.36 0.73
PD 0.29 -0.16 -0.20 0.04 0.27 0.08 -0.35 -0.20 0.74
REO -0.48 0.10 0.20 -0.02 -0.49 0.20 0.62 0.36 -0.12 0.94
SNO 0.66 -0.30 -0.20 0.16 0.67 -0.28 -0.64 -0.31 0.34 -0.56 0.74
UAV -0.16 0.17 0.04 -0.34 -0.18 0.23 0.15 0.02 -0.05 -0.03 -0.02 0.72
UTO -0.57 0.41 0.33 -0.01 -0.46 0.02 0.60 0.26 -0.23 0.48 -0.45 0.01 0.78

286
Table 6.11 Fornell-Larkcer test for overstating expense scenario – New
Zealand
ATO COO EGO IND INO MAS MEO PBO PD REO SNO UAV UTO
ATO 0.82
COO -0.26 0.97
EGO 0.10 -0.07 0.69
IND 0.33 -0.15 0.13 0.84
INO 0.82 -0.24 0.19 0.33 0.85
MAS -0.31 0.12 -0.13 -0.30 -0.35 0.80
MEO -0.78 0.29 -0.16 -0.28 -0.77 0.24 0.84
PBO -0.28 0.15 0.10 -0.13 -0.18 0.05 0.16 0.68
PD 0.18 -0.07 0.09 0.04 0.20 -0.09 -0.22 0.13 0.77
REO -0.53 0.24 -0.05 -0.23 -0.46 0.17 0.48 0.22 0.03 0.96
SNO 0.64 -0.24 0.12 0.27 0.61 -0.14 -0.62 -0.26 0.12 -0.54 0.83
UAV -0.11 0.07 -0.21 -0.23 -0.19 0.07 0.20 0.03 0.15 0.13 0.03 0.77
UTO -0.41 0.17 0.19 -0.26 -0.32 0.22 0.37 0.16 -0.21 0.30 -0.27 0.08 0.79
Table 6.12 Fornell-Larcker test for understating income scenario - Malaysia
ATU COU EGU IND INU MAS MEU PBU PD REU SNU UAV UTU
ATU 0.85
COU -0.46 0.98
EGU -0.24 0.28 0.69
IND 0.21 -0.16 -0.18 0.68
INU 0.79 -0.39 -0.25 0.23 0.84
MAS -0.26 0.13 -0.07 -0.31 -0.20 0.78
MEU -0.74 0.46 0.28 -0.21 -0.73 0.21 0.89
PBU -0.27 0.07 -0.19 0.24 -0.20 -0.05 0.11 0.79
PD 0.25 -0.06 -0.16 0.09 0.29 0.11 -0.37 -0.03 0.82
REU -0.47 0.21 0.01 -0.08 -0.39 0.19 0.60 0.11 -0.20 0.94
SNU 0.60 -0.34 -0.20 0.02 0.59 -0.20 -0.61 -0.23 0.20 -0.59 0.79
UAV -0.21 0.27 -0.08 -0.33 -0.23 0.14 0.12 -0.08 0.03 0.05 -0.11 0.69
UTU -0.60 0.26 0.26 -0.05 -0.50 0.15 0.51 0.31 -0.16 0.36 -0.48 0.00 0.76

287
Table 6.13 Fornell–Larcker test for understating income scenario – New
Zealand
ATU COU EGU IND INU MAS MEU PBU PD REU SNU UAV UTU
ATU 0.73
COU -0.23 0.98
EGU -0.03 0.05 0.73
IND 0.24 -0.13 0.11 0.83
INU 0.66 -0.30 0.16 0.33 0.81
MAS -0.21 -0.00 -0.19 -0.31 -0.28 0.80
MEU -0.49 0.32 -0.20 -0.29 -0.61 0.20 0.81
PBU 0.17 -0.27 0.00 0.14 0.31 -0.10 -0.11 0.71
PD 0.09 -0.19 0.09 0.12 0.15 -0.15 -0.30 0.05 0.71
REU -0.32 0.24 0.03 -0.26 -0.23 0.22 0.36 -0.07 -0.13 0.93
SNU 0.39 -0.23 0.03 0.27 0.24 -0.22 -0.23 0.06 0.12 -0.32 0.83
UAV -0.08 -0.00 -0.11 -0.23 -0.26 0.01 0.13 -0.20 -0.04 0.07 0.13 0.71
UTU -0.46 0.12 0.17 -0.22 -0.36 0.30 0.20 -0.05 -0.16 0.23 -0.35 0.07 0.78
6.2 Second order factor model
At this stage, the reliability and validity of measures in the measurement
first order model have been adequately satisfied. Since two constructs, namely
ethical sensitivity and culture, are developed as a second order factor model, there
is a need to test the second order factor model. In this study, the repeated indicator
approach, suggested by Chin (2010) and Hair et al. (2013), was used to perform the
second order factor test. As indicated in Table 6.14, all constructs for culture are
significant for both Malaysia and New Zealand in the overstating tax expense
scenario with individualism (IND) indicating the most significant construct.
Likewise, all constructs in ethical sensitivity are significant in the overstating tax
expense scenario for both Malaysia and New Zealand.

288
Table 6.14 Second order factor model for overstating tax expense scenario
Malaysia New Zealand
Construct Path
estimate t-values
Level
of sig. Construct
Path
estimate t-values
Level
of sig.
Culture (CUL) : R2 = 0.99 Culture (CUL): R2 = 0.99
PD 0.638 2.711 0.01 PD 0.388 1.818 0.10
IND -0.328 3.417 0.001 IND 0.548 3.790 0.001
MAS 0.392 2.863 0.005 MAS 0.490 4.245 0.001
UAV 0.302 3.221 0.005 UAV 0.186 1.854 0.10
Ethical sensitivity (ES) : R2 = 0.99 Ethical sensitivity (ES) : R2= 0.99
MEO 0.596 11.538 0.001 MEO 0.654 14.350 0.001
REO 0.245 8.075 0.001 REO 0.300 9.615 0.001
EGO 0.075 2.785 0.01 EGO 0.050 2.016 0.05
UTO 0.167 7.379 0.001 UTO 0.142 5.005 0.001
COO 0.190 4.063 0.001 COO 0.194 4.188 0.001
In the case of understating income scenario, the findings in Table 6.15
indicate that Power Distance, PD, is not a significant construct for culture in
Malaysia and Egoism, EGU, is not significant in forming ethical sensitivity
construct in New Zealand. However, since formative constructs are not determined
only based on their significance level, all constructs are retained to ensure content
validity.

289
Table 6.15 Second order factor model for understating income scenario
Malaysia New Zealand
Construct Path
estimate t-values
Level
of sig. Construct
Path
estimate t-values
Level
of sig.
Culture (CUL) : R2 = 0.99 Culture (CUL): R2 = 0.99
PD -0.286 1.440 Not
sig.
PD 0.192 2.030 0.05
IND 0.408 4.375 0.001 IND 0.599 6.205 0.001
MAS 0.546 4.541 0.001 MAS -0.503 5.814 0.001
UAV 0.329 3.476 0.001 UAV -0.212 2.456 0.05
Ethical sensitivity (ES) : R2 = 1.00 Ethical sensitivity (ES) : R2= 0.99
MEU 0.609 15.578 0.001 MEU 0.663 12.290 0.001
REU 0.221 6.351 0.001 REU 0.281 7.614 0.001
EGU 0.065 2.369 0.05 EGU 0.054 1.454 Not sig.
UTU 0.151 5.269 0.001 UTU 0.141 4.086 0.001
COU 0.227 5.430 0.001 COU 0.295 6.240 0.001
To test multicollinearity for formative constructs, the variance inflation
factor (VIF), condition index and tolerance values, which were generated from
SPSS, are observed. From Table 6.16 and Table 6.17, it can be concluded that
multicollinearity is not a threat to the model for the overstating tax expense
scenario for both Malaysia and New Zealand. This is based on the values of
variance inflation factor which are less than 10 (Gefen et al, 2010; Hair et al.,

290
2010), condition index of less than 30 (Diamantopoulos and Siguaw, 2006; Hair et
al., 2012), and tolerance value of higher than 0.20 (Hair et al., 2013).
Table 6.16 Multicollinearity for overstating tax expense scenario - Malaysia
Item
Unstandardized
Coefficients
Standardized
Coefficients
t Sig.
Collinearity
Statistics
B
Std.
Error Beta Tolerance VIF
Condition
Index
Constant .050 .411 .122 .914 1.000
CUL 1.853 1.336 .856 1.387 .300 .586 1.707 3.788
ES -.487 1.521 -.198 -.320 .779 .586 1.707 5.094
Table 6.17 Multicollinearity for overstating tax expense scenario – New
Zealand
Item
Unstandardized
Coefficients
Standardized
Coefficients
t Sig.
Collinearity
Statistics
B
Std.
Error Beta Tolerance VIF
Condition
Index
Constant -.198 .230 -.862 .480 1.000
CUL 1.741 .538 .845 3.236 .084 .970 1.031 3.012
ES .543 .522 .272 1.040 .407 .970 1.031 4.247
Similar to the first model for the overstating tax expense scenario, the VIF,
condition index and tolerance values are checked to ensure there is no
multicollinearity among the constructs in the second scenario. The findings from
Table 6.18 and Table 6.19 for Malaysia and New Zealand suggest that
multicollinearity is not a serious issue in this model. This is based on the VIF
values of less than 10, condition index of less than 30, and tolerance values of
higher than 0.20. At this stage it can be concluded that culture and ethical
sensitivity are perceived as multidimensional constructs by tax agents in Malaysia
and New Zealand.

291
Therefore, Hypothesis 7 which states “Tax agents in Malaysia and New
Zealand perceive ethical sensitivity as a multidimensional concept” is accepted.
Likewise, Hypothesis 9 which states “Tax agents in Malaysia and New
Zealand perceive culture as a multidimensional concept” is also accepted.
Table 6.18 Multicollinearity for understating income scenario – Malaysia
Item
Unstandardized
Coefficients
Standardized
Coefficients
t Sig.
Collinearity
Statistics
B
Std.
Error Beta Tolerance VIF
Condition
Index
Constant -.441 .389 -1.133 .375 1.000
CUL 1.846 .797 .799 2.317 .146 .945 1.058 2.707
ES 1.336 .764 .602 1.748 .228 .945 1.058 5.584
Table 6.19 Multicollinearity for understating income scenario – New Zealand
Item
Unstandardized
Coefficients
Standardized
Coefficients
t Sig.
Collinearity
Statistics
B
Std.
Error Beta Tolerance VIF
Condition
Index
Constant -.359 .347 -1.036 .409 1.000
CUL 1.692 .648 .890 2.612 .121 .879 1.137 2.290
ES 1.248 .681 .624 1.832 .208 .879 1.137 5.140
6.3 Structural model
Since the measurement models at the first and second order have been
successfully evaluated, the evaluation of the structural models can now be proceed.
As discussed earlier in section 4.7.8.3 of Chapter 4, the evaluation of structural
models for the study are based on the R2, effect size and path coefficient. Figure 6.1
to Figure 6.4 illustrates the structural models for overstating tax expenses and
understating income expenses for Malaysia and New Zealand.

292
Figure 6.1 Structural model for overstating tax expenses scenario - Malaysia
Note:
1. INO – Intention
2. ATO – Attitude
3. SNO – Subjective norms
4. PBO – Perceived behavioural control
5. CUL – Culture
6. ES – Ethical sensitivity a Significant at 0.10 level b Significant at 0.001 level
INO
R2 = 0.78
ES
CUL
ATO
SNO
PBO
-0.164a
0.024
0.664b
0.125
0.056
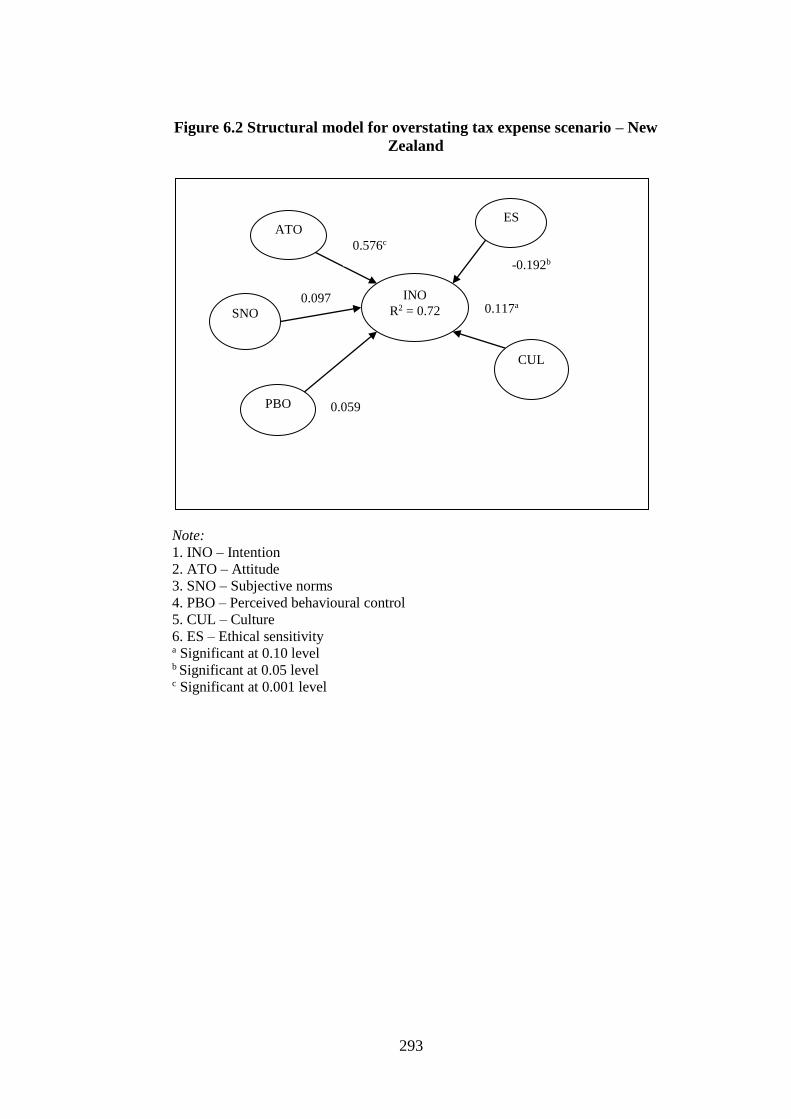
293
Figure 6.2 Structural model for overstating tax expense scenario – New
Zealand
Note:
1. INO – Intention
2. ATO – Attitude
3. SNO – Subjective norms
4. PBO – Perceived behavioural control
5. CUL – Culture
6. ES – Ethical sensitivity a Significant at 0.10 level b Significant at 0.05 level c Significant at 0.001 level
INO
R2 = 0.72
ES
CUL
ATO
SNO
PBO
-0.192b
0.117a
0.576c
0.097
0.059

294
Figure 6.3 Structural model for understating income scenario – Malaysia
Note:
1. INU – Intention
2. ATU – Attitude
3. SNU – Subjective norms
4. PBU – Perceived behavioural control
5. CUL – Culture
6. ES – Ethical sensitivity a Significant at 0.001 level
INU
R2 =0.67
ATU
SNU
PBU
ES
CUL
0.054
-0.189
0.573a
-0.004
0.102

295
Figure 6.4 Structural model for understating income scenario – New Zealand
Note:
1. INU – Intention
2. ATU – Attitude
3. SNU – Subjective norms
4. PBU – Perceived behavioural control
5. CUL – Culture
6. ES – Ethical sensitivity a Significant at 0.01 level b Significant at 0.001 level c Significant at 0.001 level d Significant at 0.10 level
6.3.1 R-squares
R-squares are considered as the primary analysis to test the structural model
which indicates the degree of coefficient determination. There is no threshold of R-
squares (Hair et al., 2012) but higher is better (Gotz et al., 2010). In this study the
R-squares of overstating scenarios and understating income for both Malaysia and
New Zealand indicate substantial values, since they are around 0.60 (Urbach and
Ahlemann, 2010). The findings indicate that the model can explain around 58
INU
R2 =0.58
ATU
SNU
PBU
ES
CUL
0.161a
-0.283b
0.485c
0.162d
-0.095
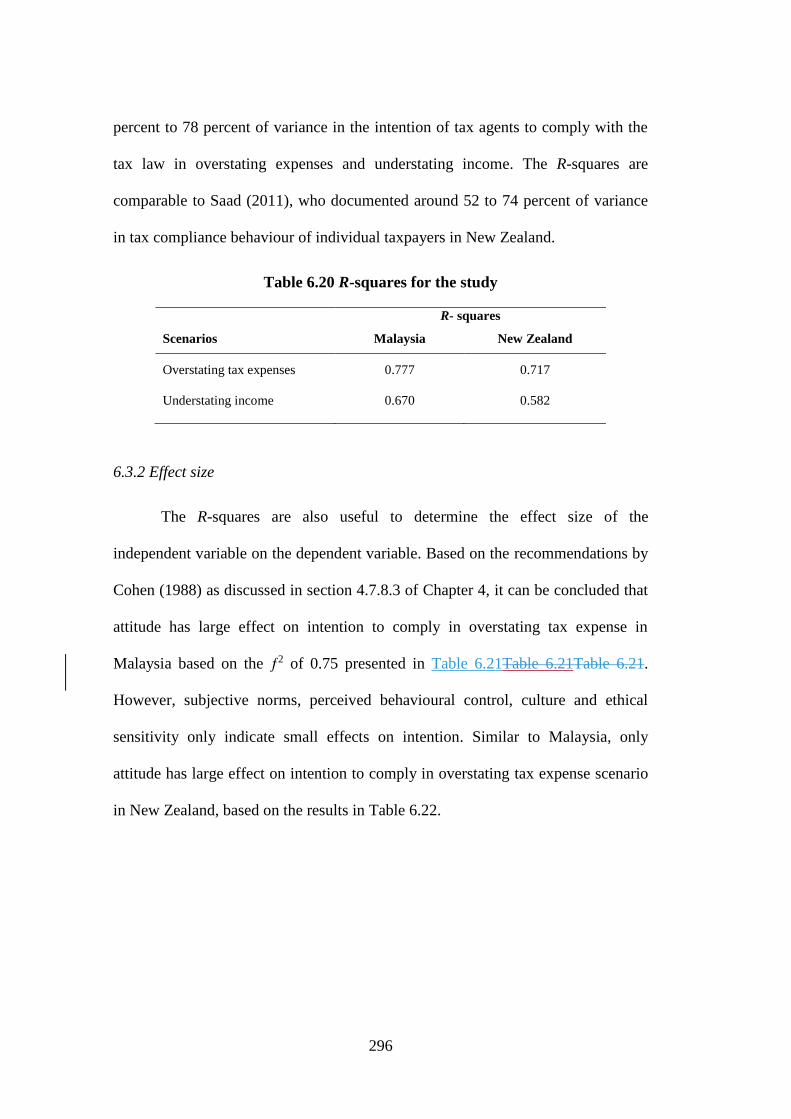
296
percent to 78 percent of variance in the intention of tax agents to comply with the
tax law in overstating expenses and understating income. The R-squares are
comparable to Saad (2011), who documented around 52 to 74 percent of variance
in tax compliance behaviour of individual taxpayers in New Zealand.
Table 6.20 R-squares for the study
R- squares
Scenarios Malaysia New Zealand
Overstating tax expenses 0.777 0.717
Understating income 0.670 0.582
6.3.2 Effect size
The R-squares are also useful to determine the effect size of the
independent variable on the dependent variable. Based on the recommendations by
Cohen (1988) as discussed in section 4.7.8.3 of Chapter 4, it can be concluded that
attitude has large effect on intention to comply in overstating tax expense in
Malaysia based on the ƒ2 of 0.75 presented in Table 6.21Table 6.21Table 6.21.
However, subjective norms, perceived behavioural control, culture and ethical
sensitivity only indicate small effects on intention. Similar to Malaysia, only
attitude has large effect on intention to comply in overstating tax expense scenario
in New Zealand, based on the results in Table 6.22.

297
Table 6.21 Effect size for overstating tax expense – Malaysia
Construct excluded R2 excluded ƒ2 Level of effect
Attitude 0.615 0.75 Large
Subjective norms 0.769 0.05 Small
Perceived behavioural control 0.774 0.03 Small
Culture 0.776 0.05 Small
Ethical sensitivity 0.767 0.06 Small
Table 6.22 Effect size for overstating expenses - New Zealand
Construct excluded R2 excluded ƒ2 Level of effect
Attitude 0.605 0.41 Large
Subjective norms 0.713 0.03 Small
Perceived behavioural control 0.714 0.02 Small
Culture 0.706 0.05 Small
Ethical sensitivity 0.705 0.05 Small
Similar to the overstating expense scenario, the effect size for understating
income scenario is also examined for Malaysia and New Zealand. The findings
from Malaysia indicate that only attitude has a large effect on intention, while
subjective norms and ethical sensitivity, only indicate small effects on intention.
Interestingly, perceived behavioural control, and culture have no effect on intention
in understating income in Malaysia. In New Zealand, only attitude has a large
effect on intention in understating income scenario with small effect from other
independent variables.

298
Table 6.23 Effect size for understating income - Malaysia
Construct excluded R2 excluded ƒ2 Level of effect
Attitude 0.550 0.36 Large
Subjective norms 0.665 0.02 Small
Perceived behavioural control 0.670 0.00 No effect
Culture 0.668 0.00 No effect
Ethical sensitivity 0.659 0.03 Small
Table 6.24 Effect size for understating income - New Zealand
Construct excluded R2 excluded ƒ2 Level of effect
Attitude 0.425 0.38 Large
Subjective norms 0.573 0.02 Small
Perceived behavioural control 0.556 0.06 Small
Culture 0.557 0.06 Small
Ethical sensitivity 0.535 0.11 Small
6.3.3 Path coefficient and hypotheses testing
Path coefficient in PLS is used to examine the relationship between
construct and the strength of the relationship is assessed using bootstrapping as
discussed in section 4.7.8.3 of Chapter 4. The strength of the relationship,
according to Urbach and Ahlemann (2010), should be at least 0.10. Table 6.25
presents the results for overstating tax expense in Malaysia and New Zealand. For
Malaysia, only attitude is highly significant at p < 0.001 with path coefficient of
0.664 followed by Ethical sensitivity which is only significant at p < 0.10. For New
Zealand, attitude is significant at p < 0.001, ethical sensitivity at p < 0.05 and
culture at p < 0.10.

299
Based on the findings, Hypothesis H4 stating “Attitude towards behaviour
significantly influences tax agents in Malaysia and New Zealand in complying with
the tax law” was accepted for both Malaysia and New Zealand in overstating tax
expenses scenario.
Likewise, the Hypothesis H8 on ethical sensitivity, stating “Ethical
sensitivity significantly influences tax agents in Malaysia and New Zealand in
complying with the tax law” was accepted for both Malaysia and New Zealand in
overstating tax expense scenario.
Hypothesis H5 which states “Subjective norms significantly influence tax
agents in Malaysia and New Zealand in complying with the tax law” was rejected
for both countries in overstating tax expense scenario.
Equally, Hypothesis H6 suggesting that “Perceived behavioural control
significantly influences tax agents in Malaysia and New Zealand in complying with
the tax law” was also rejected for Malaysia and New Zealand in the scenario of
overstating tax expense.
Hypothesis H10 which proposes “Culture significantly influences tax
agents in Malaysia and New Zealand in complying with the tax law” in overstating
tax expense scenario, was rejected for Malaysia but accepted in New Zealand with
a weak relationship between culture and intention.
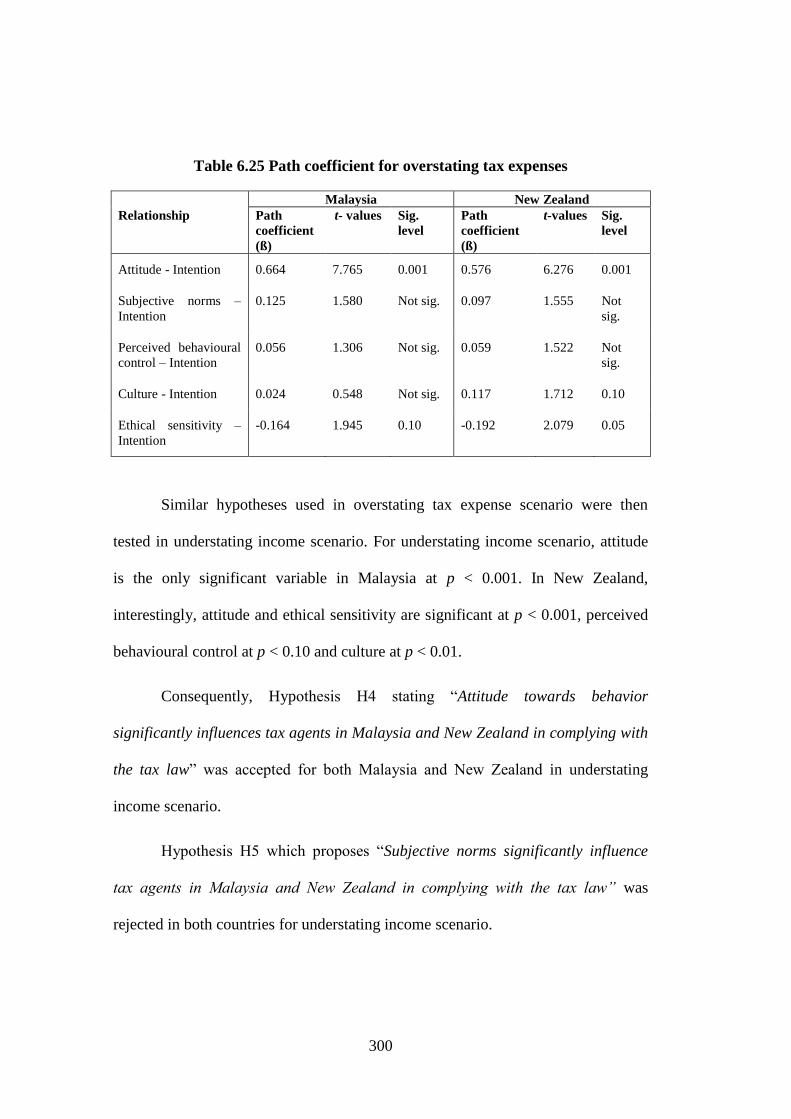
300
Table 6.25 Path coefficient for overstating tax expenses
Malaysia New Zealand
Relationship Path
coefficient
(ß)
t- values Sig.
level
Path
coefficient
(ß)
t-values Sig.
level
Attitude - Intention 0.664 7.765 0.001 0.576 6.276 0.001
Subjective norms –
Intention
0.125 1.580 Not sig. 0.097 1.555 Not
sig.
Perceived behavioural
control – Intention
0.056 1.306 Not sig. 0.059 1.522 Not
sig.
Culture - Intention 0.024 0.548 Not sig. 0.117 1.712 0.10
Ethical sensitivity –
Intention
-0.164 1.945 0.10 -0.192 2.079 0.05
Similar hypotheses used in overstating tax expense scenario were then
tested in understating income scenario. For understating income scenario, attitude
is the only significant variable in Malaysia at p < 0.001. In New Zealand,
interestingly, attitude and ethical sensitivity are significant at p < 0.001, perceived
behavioural control at p < 0.10 and culture at p < 0.01.
Consequently, Hypothesis H4 stating “Attitude towards behavior
significantly influences tax agents in Malaysia and New Zealand in complying with
the tax law” was accepted for both Malaysia and New Zealand in understating
income scenario.
Hypothesis H5 which proposes “Subjective norms significantly influence
tax agents in Malaysia and New Zealand in complying with the tax law” was
rejected in both countries for understating income scenario.

301
Hypothesis H6 on “Perceived behavioural control significantly influences
tax agents in Malaysia and New Zealand in complying with the tax law” was
rejected in Malaysia but accepted with weak influence in New Zealand in
understating income scenario.
A similar finding is documented for Hypothesis H10 which sates “Culture
significantly influences tax agents in Malaysia and New Zealand in complying with
the tax law” in understating income scenario, was rejected in Malaysia but
accepted with moderate influence in New Zealand.
The influence of ethical sensitivity on intention was tested based on
Hypothesis H8 “Ethical sensitivity significantly influences tax agents in Malaysia
and New Zealand in complying with the tax law” was rejected in Malaysia but
accepted with a strong influence in New Zealand in understating income scenario.
Table 6.26 Path coefficient for under stating tax income
Malaysia New Zealand
Relationship Path
coefficient
(ß)
t- values Sig.
level
Path
coefficient
(ß)
t-
values
Sig.
level
Attitude - Intention 0.573 4.704 0.001 0.485 5.906 0.001
Subjective norms -
Intention
0.102 1.264 Not sig. -0.095 1.620 Not
sig.
Perceived behavioural
control - Intention
-0.004 0.105 Not sig. 0.162 1.863 0.10
Culture - Intention -0.054 0.891 Not sig. 0.161 2.748 0.01
Ethical sensitivity -
Intention
-0.189 1.657 Not sig. -0.283 3.581 0.001
The following Table 6.27Table 6.27Table 6.27 summarizes the results from
the hypotheses testing for overstating tax expense scenario in Malaysia and New

302
Zealand. The results from the hypotheses testing for understating income scenario
are also summarized in Table 6.28.
Table 6.27 Summary of hypotheses testing for overstating tax expenses
scenario in Malaysia and New Zealand
Research Questions Hypotheses
Findings
Malaysia New
Zealand
4. Does attitude towards tax
compliance significantly
influence the tax agents in
Malaysia and New Zealand in
complying with the tax law?
H4: Attitude towards tax
compliance significantly
influences the tax agents in
Malaysia and New Zealand in
complying with the tax law.
Accepted Accepted
5. Does subjective norm
significantly influence tax
agents in Malaysia and New
Zealand in complying with the
tax law?
H5: Subjective norm
significantly influences tax
agents in Malaysia and New
Zealand in complying with the
tax law.
Rejected Rejected
6. Does perceived behavioural
control significantly influence
the tax agents in Malaysia and
New Zealand in complying
with the tax law?
H6: Perceived behavioural
control significantly influences
tax agents in Malaysia and
New Zealand in complying
with the tax law.
Rejected Rejected
7. Do tax agents in Malaysia
and New Zealand perceive
ethical sensitivity as a
multidimensional concept?
H7. Tax agents in Malaysia and
New Zealand perceive ethical
sensitivity as a
multidimensional concept.
Accepted Accepted
8. Does ethical sensitivity
significantly influence tax agent
in Malaysia and New Zealand
in complying with the tax law?
H8: Ethical sensitivity
significantly influences tax
agents in Malaysia and New
Zealand in complying with the
tax law.
Accepted Accepted
9. Do tax agents in Malaysia
and New Zealand perceive
culture as a multidimensional
concept?
H9: Tax agents in Malaysia and
New Zealand perceive culture
as a multidimensional concept.
Accepted Accepted
10. Does culture significantly
influence tax agents in
Malaysia and New Zealand in
complying with the tax law?
Culture significantly influences
tax agents in Malaysia and
New Zealand in complying
with the tax law.
Rejected Accepted
Note: Summary of results for research questions 1 to 3 are presented in Table 5.30 of
Chapter 5.

303
Table 6.28 Summary of hypotheses testing for understating income scenario in
Malaysia and New Zealand
Research Questions Hypotheses
Findings
Malaysia New
Zealand
4. Does attitude towards tax
compliance significantly
influence the tax agents in
Malaysia and New Zealand in
complying with the tax law?
H4: Attitude towards tax
compliance significantly
influences the tax agents in
Malaysia and New Zealand in
complying with the tax law.
Accepted Accepted
5. Does subjective norm
significantly influence tax
agents in Malaysia and New
Zealand in complying with the
tax law?
H5: Subjective norm
significantly influences tax
agents in Malaysia and New
Zealand in complying with the
tax law.
Rejected Rejected
6. Does perceived behavioural
control significantly influence
the tax agents in Malaysia and
New Zealand in complying
with the tax law?
H6: Perceived behavioural
control significantly influences
tax agents in Malaysia and
New Zealand in complying
with the tax law.
Rejected Accepted
7. Do tax agents in Malaysia
and New Zealand perceive
ethical sensitivity as a
multidimensional concept?
H7. Tax agents in Malaysia and
New Zealand perceive ethical
sensitivity as a
multidimensional concept.
Accepted Accepted
8. Does ethical sensitivity
significantly influence tax agent
in Malaysia and New Zealand
in complying with the tax law?
H8: Ethical sensitivity
significantly influences tax
agents in Malaysia and New
Zealand in complying with the
tax law.
Rejected Accepted
9. Do tax agents in Malaysia
and New Zealand perceive
culture as a multidimensional
concept?
H9: Tax agents in Malaysia and
New Zealand perceive culture
as a multidimensional concept.
Accepted Accepted
10. Does culture significantly
influence tax agents in
Malaysia and New Zealand in
complying with the tax law?
Culture significantly influences
tax agents in Malaysia and
New Zealand in complying
with the tax law.
Rejected Accepted
Note: Summary of results for research questions 1 to 3 are presented in Table 5.30 of
Chapter 5.

304
6.4 Summary
In this chapter the evaluation of the measurement model at the first order,
second order and structural model, was performed using PLS-SEM technique by
applying the SmartPLS software (Ringle et al., 2005) before the hypotheses testing
was done. The measures and constructs have been validated accordingly following
suggestions from previous literature on PLS-SEM. The findings indicate that tax
agents in Malaysia and New Zealand perceive ethical sensitivity and culture as
multidimensional items based on the results from the second order factor model.
The values of R-squares are within the range of 58 percent to 77 percent in
the overstating expenses scenario and understating income scenario in Malaysia
and New Zealand, suggesting that the model can explain 58 percent to 77 percent
variance in intention to comply with the tax law by tax agents in the study. Overall,
attitudes indicate a consistent result with large effect on intention in both scenarios
in Malaysia and New Zealand. This is then translated with strong relationship
between attitudes on intention in both scenarios in Malaysia and New Zealand from
the path coefficient and significant level of p-value at 0.001.
The findings also indicate inconsistencies between two tax environments of
Malaysia and New Zealand. For instance, ethical sensitivity is highly and
moderately significant in New Zealand for the overstating tax expenses scenario
and understating income scenario, but only indicated a weak relationship for
overstating tax expenses and is not significant in the understating income scenario
in Malaysia. In summary, the findings contribute to the scarce literature in tax
compliance behaviour of tax agents.

305
CHAPTER 7
INTERVIEW FINDINGS
7.0 Introduction
This chapter presents the interview findings with some tax agents in
Malaysia and New Zealand. The findings are presented in two main parts: the first
part consists of interviews with tax agents in Malaysia, followed by the second part
on the findings from interviews with tax agents in New Zealand. Briefly, the
discussions focused on the perceptions of tax agents with regard to tax compliance
behaviour, the influence of ethical sensitivity, and culture in their decision making
while performing their engagement roles. The chapter ends with a brief summary.
7.1 Malaysia
As explained earlier in section 4.7.4.1 of Chapter 4, the author sent 1,500
invitations to participate in interviews to potential survey respondents. Initially 21
survey respondents indicated their interest to participate in the interview; however,
4 of them were not available despite two attempts of calling to confirm their
participation. Ultimately, 17 interview participants from various positions, type of
firms and years of experience, voluntarily took part in the interview. The telephone
interviews were conducted between November 2011 and January 2012.
The demographic profiles for all participants are illustrated in Table 7.1,
comprising 6 males and 11 females. With regard to position in the firm, the
interview participants came from various positions as follows:

306
(1) Three tax consultants
(2) One principal
(3) Two managers
(4) Two senior tax executives
(5) Three tax directors
(6) One partner
(7) Five tax executives
In terms of working experience in tax practice, the interview participants
ranged from those with less than five years of tax experience to those who have
more than twenty one years of tax experience, as indicated below:
(1) Less than five years of tax experience – 5 participants
(2) Between five to ten years of tax experience – 2 participants
(3) Between eleven to fifteen years of tax experience – 2 participants
(4) Between sixteen to twenty years of tax experience – 6 participants
(5) Twenty one years of tax experience and more – 2 participants
The interview participants also came from different types and sizes of firms
in public practice, ranging from sole practitioners, tax consulting firms and public
accounting firms. Their background firms are as follows:
(1) Sole practitioner – 2 participants
(2) Small tax consulting firms – 3 participants
(3) Medium sized public accounting firm – 6 participants

307
(4) Small size public accounting firm – 6 participants
The demographic profiles for interview participants from Malaysia suggest
that those tax agents who participated in this interview study came from a mixed
background of positions, gender, years of working experience in tax practice and
types of firm. The differences in their social and professional background are
expected to provide rich information and views from diverse perspectives which
could be helpful to further understand the factors that influence tax agents in their
ethical decision making while performing their roles.

308
Table 7.1 Demographic Profiles of Interview Participants – Malaysia
Position Gender
Years of
experience
in tax
practice
Type of firms Reference in
the thesis
Tax Consultant Male 16 Sole practitioner Participant 1
Principal Female 16 Medium size public
accounting firm
Participant 2
Manager Male 16 Medium size public
accounting firm
Participant 3
Senior Tax
Executive
Male 6 Medium size public
accounting firm
Participant 4
Senior Tax
Executive
Female 7 Medium size public
accounting firm
Participant 5
Tax Director Female 22 Small tax
consulting firm
Participant 6
Tax Consultant Male 21 Sole practitioner Participant 7
Tax Consultant Male 13 Small tax
consulting firm
Participant 8
Tax Director Female 16 Medium size public
accounting firm
Participant 9
Tax Director Female 12 Small size public
accounting firm
Participant 10
Tax Executive Female 4 Small size public
accounting firm
Participant 11
Partner Male 20 Small tax
consulting firm
Participant 12
Tax Executive Female 4 Small size public
accounting firm
Participant 13
Tax Executive Female 4 Small size public
accounting firm
Participant 14
Tax Executive Female 4 Small size public
accounting firm
Participant 15
Tax Executive Female 3 Small size public
accounting firm
Participant 16
Manager Female 16 Medium size public
accounting firm
Participant 17

309
7.1.1 Data analysis and interview findings
7.1.1.1 Tax compliance behaviour
In explaining their understanding about tax compliance behaviour,
generally all interview participants associated tax compliance with complying with
the Income Tax Act, standards, rules and regulations by the MIRB. Their
understanding is translated by meeting the deadlines for filing of tax returns, and
payment owed to the MIRB, having proper documentation, possessing knowledge,
and declaring the income that taxpayers earned. The following comments are some
examples of how tax agents in this interview understand tax compliance:
“Tax compliance means…tax agent has to comply with all standards
and public rulings, rule and regulations set by the Income Tax Act…”
(Participant 2, principal, medium size public accounting firm)
“Basically if you say about tax compliance, it can be from two
areas…one is the computation [and] the other is from the timing…for
example [the] submission deadline, payment deadline, filing deadline.
At the end of the day, it is the question of effectiveness…if you do not
meet the deadlines, then you are not efficient”.
(Participant 3, manager, medium size public accounting firm)
“In my opinion, tax compliance is following the rule, it means we follow
what is required by the Income Tax Act or [any] regulations,
legislations determined by the IRB”.
(Participant 4, senior tax executive, medium size public accounting firm)

310
“For tax compliance, we have to ensure that our client follow the
IRB’s document, ensure that the record is correct, advise them with
their responsibility and follow the IRB’s requirement. Clients do not
have the knowledge. We have to make sure that under the SAS client is
more aware of the requirements by the IRB”.
(Participant 12, partner, small tax consulting firm)
“We have to be detailed in analysing the information, understand the
clients’ business, [so] we have to be well versed with the tax laws, we
have to equip ourselves with sound technical knowledge. The tax laws
and case laws are important sources in making decisions”.
(Participant 17, tax manager, medium size public accounting firm)
There is also a suggestion that tax compliance means exercising justice, on
the side of taxpayers and tax authority. This could be achieved by ensuring that
taxpayers do not overpay or underpay the amount of tax.
“It is wrong to under declared the income…it should be a win-win
situation. Taxpayers will not pay more or less even by a cent, we just
pay what we are supposed to pay”.
(Participant 8, tax consultant, small tax consulting firm)
Interestingly, as commented by an interview participant, complying with
the tax law to a certain extent is situation specific. In the cases of natural disaster
for instance, it becomes very challenging and requires tax agent to be more flexible

311
with their clients in their approach to obtain the appropriate documents for tax
filing purposes:
“The taxpayers know the things that they can claim and those that they
cannot claim…it depends on situation. Let’s say…in 2006, we had
severe flooding in our town. The bills were drifted away…so how are
we going to prepare the computation? I think in this case we have to
tolerate. We had to collect as much evidence as we could, found
whatever documents which were still available…and referred to
previous records as well. I think we have to consider our client situation
as well in this kind of circumstances”.
(Participant 6, tax director, small tax consulting firm)
When probed further, the interview participants also explained that their
attitudes to a certain extent guide them to comply with the tax law. For instance, in
addition to their awareness on the importance of complying with the tax laws, as
professionals, there is a concern that their attitude has to be aligned with the
professional ethics while performing their roles:
“As a tax agent, we are given the trust, and I am afraid of the tax law.
We should not go against the law. As an accountant we have to follow
the ethical conduct”
(Participant 7, tax consultant, sole practitioner)
“As tax professionals we have to follow our [tax professional] ethics”
(Participant 8, tax consultant, small tax consulting firm)

312
“Because we have the [tax] laws, then we have to follow. I will try to
comply whatever is required by the Act”
(Participant 12, partner, small tax consulting firm)
“For me it is our attitude. In the context of complying with the tax law,
it starts from before we do the tax…becoming a tax professional is a
professional responsibility”
(Participant 13, tax executive, small size public accounting firm)
“It is our own self…have to follow the tax regulation. My intention also
influences me but I also want to help my client, so it’s combination”
(Participant 16, tax executive, small size public accounting firm)
There are also suggestions that their attitudes towards the possibility of
being penalised for non-compliance, the risk of losing credibility as a tax agent and
the feeling of guilt for non-compliance, influence them to comply with the tax law.
Some tax agents commented, for instance:
“Personally I think the factors that can influence…is the individual
himself/herself, mainly…the people that I met, is all depends on that
individual person. It is one’s upbringing. I don’t want any problem, for
example I prepare a client’s tax, there is something that I do not
properly check, the client relies on me, I do the work for the sake of
doing, so I feel guilty. The other thing is, if I don’t do the work properly,
later the IRB audits the client, the blame is on me, it’s not nice if being
penalised, professionally it is not nice”
(Participant 5, senior tax executive, medium size public accounting firm)

313
“Any decisions which are against the tax law will have effect on the
taxpayers. It will damage our credibility as tax agents. As a tax
professional I have to understand this and be ethical. The Code of
Ethics by the Malaysian Institute of Accountants becomes my guideline.
Membership in professional accounting bodies is indeed helpful”
(Participant 9, tax director, medium size public accounting firm)
“…depends on that particular person whether or not to comply with
the tax laws, sometimes…we want to be ethical but others like our
clients they refused…but if [I] don’t comply with the tax law, I’ll feel
guilty”
(Participant 15, tax executive, small size public accounting firm)
In addition to attitudes, the discussion during the interviews also centred on
the influence of social pressure imposed by referent or important others in the
decision making of tax agents. The interview participants unanimously agreed that
subjective norms affect their decision making to a degree. The influence of
subjective norms comes from peers, superiors and friends who are in the same
profession, in the form of exchanging different experiences and opinions especially
in complicated tax cases. This could be due to the different level of expertise in
interpreting tax laws. Interestingly, perceptions of people around them and clients
can also influence their decision making. For example:
“Yes, my colleagues. Their influence may come from their experience
and knowledge”.
(Participant 1, tax consultant, sole practitioner)

314
“If there is something that I do not know, then I’ll refer to my
supervisor, then my supervisor will come out with her opinions,
supported by the Act”.
(Participant 4, senior tax executive, medium size public accounting firm)
“I think it depends on the boss as well, if my boss is not like that [strict
with clients], maybe there are times that I surrender with the client.
There is positive and negative influence from the colleagues”.
(Participant 5, senior tax executive, medium size public accounting firm)
“I share with my friends who are in the same profession to get their
opinion. Yes, I consider the opinions of my friends who are in the same
profession. Normally, I refer to senior partners about the final decision.
If it is a simple case, I don’t refer. It’s only for complicated or big
companies”.
(Participant 9, tax director, medium size public accounting firm)
“I do refer to my superior and colleagues. Maybe they have different
experience. So if they have similar experience then I use their advice on
my clients. Sometimes they have similar cases, so we exchange ideas”.
(Participant 11, tax executive, small size public accounting firm)

315
“If there are cases that require high level of technical knowledge I will
ensure that I discuss first with my colleagues, we do our own research,
especially in isolated cases. Not for all issues, only certain issues”.
(Participant 12, partner, small tax consulting firm)
“For me the perceptions of others around me are important in
complying with the tax law…influence by colleagues is an important
factor for me”.
(Participant 13, tax executive, small size public accounting firm)
“Influence from peers. We will ask around among ourselves, if we still
cannot find the answer, then we will ask our supervisor”.
(Participant 14, tax executive, small size public accounting firm)
“In cases where I am not familiar then I have to refer to someone else
but in cases that I am quite familiar then I do my own research. I also
seek clarification from friends working in other firms, I always ask
around”.
(Participant 17, manager, medium size public accounting firm)
It is also postulated that compliance behaviour with tax laws is influenced
by the perceived behavioural control that tax agents possessed, which is the ability
of an individual to have control and the perceived ease or difficulty in performing a
behaviour. This can be influenced by personal and environmental factors such as
having the skills and opportunities to engage in a particular behaviour (Fishbein &
Ajzen, 2010).

316
When asked to comment on the influence of perceived behavioural control
in complying with the tax laws, there are mixed opinions provided by the interview
participants. Some interview participants agree that they have control in their
decision making of whether or not to comply with the tax law, yet some interview
participants disagreed, stating that they only have control at the initial stage of
preparing documents for tax compliance purposes. One possible reason for the
mixed of opinion is because tax agents perceived themselves as advocates who
assist their clients, and eventually it is the clients who decide themselves. This
could possibly lessen the influence of perceived behavioural control in complying
with the tax laws. Some of the comments are presented here:
“Yes, I always have full control. Maybe because I understand how the
tax laws work. My clients typically have little knowledge. Rather than
arguing the amount of tax payable, they normally need my advice”.
(Participant 1, tax consultant, sole practitioner)
“Not necessarily, let’s say I am preparing a file for my client then
finally there is something that I am not sure, so I refer to my superior.
Things that I am sure, I will make my own decision”.
(Participant 5, senior tax executive, medium size public accounting firm)
“…I’ll ask the client. We will prepare the tax computation then we will
see what the Act says, we discuss any other transactions, so the decision
of how much tax the clients have to pay is not only based on me, it
depends on the client as well”.
(Participant 9, tax director, medium size public accounting firm)

317
“Normally, it’s the client who makes the decision, we advise the client.
We only advise about their tax needs, what is compulsory for those with
income reaching the tax limit.
(Participant 10, tax director, small size public accounting firm)
“If possible the client does not want to pay much tax. The client will
come for advice…how to reduce tax. So, we will advise the client to
reduce the amount of tax according to the law, such as through
claiming incentives. The decision is based on our discussion with the
client and not against the Income Tax Act”.
(Participant 12, partner, small tax consulting firm)
“At the end of the day, the superior made the final decision. At the
beginning, yes I have control but eventually I do not have the control.
Sometimes, I do not have the confidence to support my argument.
Maybe because I think, my superior has more experience than me, more
expert”.
(Participant 14, tax executive, small size public accounting)
“My boss will make the decision. Initially, yes I’ll make the decision but
final decision is always my boss”.
(Participant 16, tax executive, small size public accounting firm)
7.1.1.2 Ethical sensitivity and tax compliance
The issue of ethical sensitivity was also discussed during the interviews to
elicit tax agents’ opinions as to whether ethical sensitivity helps tax agents in this
study to comply with the tax laws. Generally, tax agents who participated in the

318
interview agreed that ethical sensitivity is beneficial in complying with the tax laws
especially after spending some time working in tax environment. They suggested
that their experience in tax practice and their observation skills help to develop
their ethical sensitivity. Some of the comments obtained from the interviews are
presented here:
“Yes…[I] can see the clients try to play around with the figure…try to
reduce the tax…sometimes the client thought they are good enough to
hide from us, but after sometime as a tax professional, yes, we can
detect”.
(Participant 2, principal, medium size public accounting firm)
“Well, if we look at the clients’ file, normally, we could know that the
clients try to evade tax”.
(Participant 6, tax director, small tax consulting firm)
“Based on my experience, during the discussion, we can detect how
much tax the clients want to pay”.
(Participant 9, tax director, medium size public accounting firm)
“Normally, when the clients come to us, they will inform us that they
only have this amount of income…but …sometimes, they actually have
other extra income. Sometimes they want to tell us, but half of the
clients do not want to declare. When our clients bring their documents
to us, we will see whether the documents are enough. Once we prepare
their computation, and there is not enough information or it is
suspicious, then…we will ask them. You could detect if you have been

319
doing tax work for years. Even when we look at their documents, they
could be guidelines as well”.
(Participant 10, tax director, small size public accounting firm)
“It is helpful. Normally, the client will bring their documents and they
will ask us to prepare the tax computation. Then…they will see whether
there is anything which is against their wish. Sometimes we can detect,
if there is something suspicious”.
(Participant 12, partner, small tax consulting firm)
There were some interview participants, especially the junior tax agents,
who appeared to be confused with the term ‘ethical sensitivity’ itself, possibly
because as junior tax staff they only deal with less complicated tax cases. This
perhaps explains the different point of view offered by the more junior interview
participants with regard to the importance of ethical sensitivity. For instance:
“As a tax agent I will prepare based on the documents provided by the
client, what they declare. I will not ask more than that. Basically…I
could say that I still do not have the sensitivity…to detect if the client
has the intention to evade tax based on the documents provided to me”
(Participant 13, tax executive, small size public accounting firm)
“So far, I don’t think I have the ethical sensitivity”
(Participant 14, tax executive, small size public accounting firm)
Interestingly, an interview participant commented that ethical sensitivity
does not only help in detecting the intention to evade tax, but also in identifying
320
any potential amount of tax that could be saved by the client according to the tax
law,. The participant commented:
“Based on my experience, I can sense if there is ‘something’ with the
information provided by the client. But that does not mean that
‘something’ always lead to unethical conduct. It could be after a
thorough review, the client can actually claim certain expenses which
have been previously overlooked”
(Participant 4, senior tax executive, medium size public accounting firm)
7.1.1.3 Culture and tax compliance behaviour
To understand the influence of culture in tax compliance behaviour, the
interviews discussed how tax agents in the study make their decision. For instance,
as mentioned in Chapter 2, it is a common practice in high a Power Distance
society for decision making to be centralized with the senior staff due to the large
gap between senior staff and other staff.
The findings from the interviews indicate there are mixed of opinions
amongst the Malaysian interview participants with regard to how decisions are
being made in complying with the tax laws. Generally, while the subordinates are
allowed to give their opinions on clients’ tax matters, the final decisions before
advising the clients are always determined by the senior staff. However, an
interview participant commented that, it is not the position as “superior” that
persuades her to follow her superior’s decision, but rather because the decision
itself is correct. Some of the comments are provided here:

321
“My superior does not mind if I want to give my opinions. If I don’t
understand then she will explain, so if I accept her decision, it is not
because she is my boss but because what she says is correct”.
(Participant 5, senior tax executive, medium size public accounting firm)
“The [staff] play important roles. I accept the opinions of the staff,
depends on situations. We will discuss, then we come to a decision but
normally, I determine the final decision”.
(Participant 6, tax director, small tax consulting firm)
“The opinions from lower staff are also important. For every job, I’ll
review and discuss. I will consider the opinions by lower level staffs if it
is appropriate then I will apply”.
(Participant 9, tax director, medium size public accounting firm)
“[My] staff will deal with the client first, if there is any problem then
only I will meet the client. The [staff] are given the opportunity to
express their opinion but the final decision is from me”.
(Participant 10, tax director, small size public accounting firm)
“Superior is important. In my opinion, whatever decision that I take, I
will refer to my superior. I do not have much experience in tax work, so
anything I will refer to my superior. I am afraid if I simply based on my
decision, there will be problems later on, so it is better to refer to
someone who is experienced”.
(Participant 11, tax executive, small size public accounting firm)

322
“My superior allows me to speak up. If I do my work, I will depend
solely on my superior…because a junior should not go against the
superior. I depend a lot on my superior. As a junior staff…I have to
follow my superior…I never liaise with the IRB, my superior will handle
it”.
(Participant 14, tax executive, small size public accounting firm)
“I still do not have the courage to come out with my own decision…so I
rely on my superior to comply with the tax law”.
(Participant 15, tax executive, small size public accounting firm)
“Yes, I have discussions with my superior, and I can give my opinions
since I am the one who knows about the case”.
(Participant 16, manager, medium size public accounting firm)
To further understand the influence of culture in tax compliance behaviour,
the interviews also discussed the willingness of interview participants to be in
uncertain situations, for instance, whether or not they are willing to undertake risks
in performing their roles as tax agents. Mixed opinions regarding risks and tax
compliance were recorded from Malaysian tax agents in the interviews. Some of
the opinions provided by the interview participants indicate that depending on
situations, tax agents are willing to tolerate a certain level of risk in complying with
the tax laws. On the other hand, there was agreement that dealing with risks in
complying with the tax laws should be avoided due to the high cost of penalty and
probability of being audited:

323
“No, I do not feel afraid to take risks. My clients are generally made up
of small businesses which are not normally on the tax authority’s
sight”.
(Participant 1, tax consultant, sole practitioner)
“I will go for a win-win situation, comply with the tax law and
safeguard my client’s interest. I always use the tax knowledge that I
have to make my clients aware of their responsibility. The challenging
part is to have the confidence to inform the client and of course there is
also risk involved”.
(Participant 3, manager, medium size public accounting firm)
“We have to take around 80-90 percent risks in our decision
making…have to be brave enough to take risk depending on the facts
and effects of previous amount of tax that we pay”.
(Participant 9, tax director, medium size public accounting firm)
“[T]hat’s why we prepare a letter of undertaking because we don’t feel
comfortable to take risk”.
(Participant 10, tax director, small size public accounting firm)
“[W]e prepared an undertaking letter, stating the extent of our
responsibility in preparing the tax return, so if there is any audit the
client cannot blame us because we prepared the tax computation based
on the information provided to us…the client has to sign the letter of
undertaking. I don’t feel comfortable to prepare based on estimation

324
because the risk is high. As a tax professional we have to be ethical in
our dealings so that there is no risk in the future”.
(Participant 11, tax executive, small size public accounting firm)
“It depends, yes or no. Whatever it is, my superior always reminds me
to reduce the risks”.
(Participant 16, manager, medium size public accounting firm)
“Basically when I assist my client, I want them to fully comply with the
tax law because I do not [want] any problems with the IRB. For me, I
do not want any problems with the IRB, being subject to audit in the
future. I make it clear to my clients, whatever type of job, whatever
documents provided to me, I will rely on the audited accounts, at the
end it depends on the client, as to my knowledge, what is being said by
the client is correct and of course the audited accounts…those things
which are sensitive to the IRB, I’ll ask for breakdown, like management
fees, professional fees, but if the client still cannot provide the proof, it
is simple, no deduction. Once a client is being audited, then tax agents
cannot simply ‘wash their hands’, the tax agent is in trouble because
the clients can always say they have tax agent and we, tax agent should
know”.
(Participant 5, senior tax executive, medium size public accounting firm)

325
“We want to minimise our tax risks. We do research on grey areas…we
look at the relevant tax laws and what has been decided in the court.
The non-compliance with the tax laws results in high penalty, so we
cannot take risks on behalf of our client”.
(Participant 17, manager, medium size public accounting firm)
To probe further the influence of culture in tax compliance behaviour, the
issue of whether or not tax agents consider the effect of decision making in tax
compliance benefits or harms society was also raised. While there was agreement
among tax agents to consider the effect of complying with the tax law to the society
and country, a majority of the interview participants did not consider the effect on
society in complying with the tax laws. To many of the interview participants, they
held the opinion that their duty is to assist their clients and safeguard the interests
of their clients. Therefore, they are less concerned with the effect of their decision
making to society or country as a whole. Some of their comments are presented
here:
“Yes, I consider the mutual benefits or effects that may be gained or
suffered by both the society and also the taxpayers [client] who also
form part of the society”.
(Participant 1, tax consultant, sole practitioner)
“As a tax professional, I never think about the effect to society or
country, but if the client has to pay then I always say…’you contribute
to the development of the country”.

326
(Participant 4, senior tax executive, medium size public accounting firm)
“[N]ever think about the effect to the society…maybe because I have
very little knowledge about how the money from tax is being spent in
black and white”.
(Participant 5, senior tax executive, medium size public accounting firm)
“[T]think about the effect to the society, the wealthy people try to
escape tax, that’s not fair”.
(Participant 7, tax consultant, sole practitioner)
“I don’t reach that level…to think about the effect to the society and
country. In assisting my client, I will think about my responsibility as
tax professionals and try to put myself in client’s situation so that I
know whether the amount of tax paid is reasonable or appropriate with
the income”.
(Participant 9, tax director, medium size public accounting firm)
“The income from tax contributes significantly to our country. The tax
is being used for many things, if there is less income, then, there are
fewer benefits that can be enjoyed. So the effect is to the society and
country”.
(Participant 10, tax director, small size public accounting firm)
“As an individual, what are the risks involved. I think as well the effect
to the society, but more to the effect to individual taxpayers”.
(Participant 11, tax executive, small size public accounting firm)

327
“Me and my client…I have to take care of my client because they pay
me. But I’ll make sure that the client complies with the tax laws.
Normally the clients listen to me”.
(Participant 12, partner, small tax consulting firm)
“I never think about the effect to the society or country. I only think
about the benefit to the clients”.
(Participant 15, tax executive, small size public accounting firm)
7.2 New Zealand
In New Zealand, the researcher sent out 1,500 invitations to participate in
interviews, together with the survey. At the beginning of the interview process, 17
survey respondents indicated their interest to participate in the interview. However,
3 of them did not answer the telephone calls seeking their involvement, resulting in
a final number of 14 participants for the interview study. The interview participants
came from various positions, types of firm, and generally are experienced tax
agents based on the years of service in tax practice. The interviews were conducted
between November 2011 and February 2012.
The demographic profiles of the New Zealand interview participants
indicate that 11 males and 3 females participated in the interviews. In terms of
positions in the firms, the interview participants are regarded to be at the middle
and high levels of positions as indicated below.
(1) One tax accountant
(2) One tax associate

328
(3) Four tax directors
(4) Seven tax consultants
(5) One partner
The middle and high level positions held by the interview participants from
New Zealand could possibly be related to the number of years they have been
involved in tax practice. In this study, the interview participants ranged from those
with more than five years of tax experience to those who have more than twenty
one years of tax experience. Half of the interview participants from New Zealand
have more than 20 years of tax working experience as indicated below:
1. Between five to ten years of tax experience – 2 participants
2. Between sixteen to twenty years of tax experience – 5 participants
3. Twenty one years of tax experience and more – 7 participants
Similar to Malaysia, the interview participants also came from different
types and sizes of firms in public practices, ranging from sole practitioners, tax
consulting firms and public accounting firms. The background of their firms is as
follows:
(1) Sole practitioner – 3 participants
(2) Small tax consulting firms – 4 participants
(3) Medium sized tax consulting firm – 1 participant
(4) Medium sized public accounting firm – 3 participants
(5) Small size public accounting firm – 3 participants

329
The demographic backgrounds of the interview participants are expected to
provide an interesting insight into tax compliance behaviour of tax agents in New
Zealand. Furthermore, most of the tax agents in this interview have a high level of
experience, based on the period spent in a tax working environment. The following
Table 7.2 presents the demographic background of the interview participants from
New Zealand.
Table 7.2 Demographic Profiles of Interview Participants – New Zealand
Position
Gender
Years of
experience in
tax practice
Type of firms
Reference in
the thesis
Tax
Associates
Male 10 Small size public
accounting firm
Participant A
Tax Director Male 21 Medium size public
accounting firm
Participant B
Tax Director Male 16 Medium size public
accounting firm
Participant C
Tax
Consultant
Male 28 Small size tax
consulting firm
Participant D
Tax
Consultant
Female 27 Sole practitioner Participant E
Tax
Accountant
Male 5 Small size public
accounting firm
Participant F
Tax Director Male 20 Small size public
accounting firm
Participant G
Tax
Consultant
Female 26 Sole practitioner Participant H
Tax
Consultant
Male 24 Small size tax
consulting firm
Participant I
Tax
Consultant
Male 31 Small tax
consulting firm
Participant J
Tax
Consultant
Male 16 Sole practitioner Participant K
Tax
Consultant
Male 30 Medium size tax
consulting firm
Participant L
Partner Male 20 Medium size public
accounting firm
Participant M
Tax Director Female 20 Small tax
consulting firm
Participant N

330
7.2.1 Data analysis and interview findings
7.2.1.1 Tax compliance behaviour
In explaining their understanding about tax compliance behaviour, the
general understanding of the tax agents who participated in the interviews
described tax compliance as following the tax laws, legislation, complying with the
NZIRD requirements, meeting the deadlines for filing the tax returns and paying
the amount of tax due accordingly. Some of the comments are reproduced here:
“Tax compliance means comply with the tax legislation. Taxpayers
complete the file for their tax return, declare their income in
accordance with the tax legislation, pay the tax due accordingly”.
(Participant M, partner, medium size public accounting firm)
“Complying with the requirements from the tax department… I mean it
includes filing the tax returns on time, paying the tax on time, you
know…making sure it is correct to the best of your ability. Filing the tax
return on time, that includes paying on time. You are complying with
ethics in mind”.
(Participant N, tax director, small tax consulting firm)
“[T]ax compliance would basically mean meeting all the legislation,
laws set by the government and following any sort of process that the
IRD may have in following those tax laws”.
(Participant F, tax accountant, small size public accounting firm)

331
“Tax compliance is to adhere to all the tax law, applicable to the
particular tax types we are dealing with…and most of the taxation
system is strict in compliance and require taxpayers to completely meet
the filing of tax return and in compliant with the time frame to make
payment”.
(Participant L, tax consultant, medium size tax consulting firm)
There is also an opinion that tax compliance is not only about fulfilling the
tax obligations set out by the tax laws, rules and legislation. As commented by an
interview participant, tax compliance also means avoiding over paying or under
paying the correct amount of tax, and as a tax agent, assisting their clients in
interpreting the tax law especially in grey areas:
“I guess for me, tax compliance is about…compliance, ensuring your
clients meet the obligations under the New Zealand tax legislation
without paying too little tax or too much tax…and also tax compliance
is resolving for clients, you know, grey areas around the interpretation
of legislation and the likes…”
(Participant A, tax associate, small size public accounting firm)
An interview participant also commented that, since tax compliance means meeting
tax obligations, the most important thing in tax compliance is to understand the tax
rules and therefore, tax law should be easy to understand:
“It’s about meeting tax obligations. I suppose the first thing is the
ability to understand what the tax rules are. For instance in the case of
Penny and Hooper, it has been undefined for years and the IRD has not

332
clearly determined what is acceptable and what is not acceptable…how
ethics is defined is very subjective, there is no clear guidance. In a
voluntary compliance, people have to be good on their own, manage
their resources, complying with the tax law, those who don’t, rely on tax
professional. It reflects the tax regime should be easy to understand”.
(Participant C, tax director, medium size public accounting firm)
Another point to be considered in complying with the tax, law as noted by
an interview participant, is that, being ethical in a tax context is situational. For
instance, to an extent complying with the tax law is influenced by the amount of
tax involved:
“Tax compliance…is following the tax rules, GST rules…the level of
IRD investigation in New Zealand involves extremely large
amount…tax audits for small business are very rare. It is interesting
that you just put a small amount of dollars in your survey, if you put
larger amount, the responses would be different”.
(Participant I, tax consultant, small size tax consulting firm)
The interview also delved into the tax agents’ perceptions towards the
influence of their attitude in complying with the tax laws. The interview responses
indicate that generally they agree their attitude to an extent influences their
decision making to comply with the tax law. They associated attitudes with moral
obligation as NZICA members, fairness, ethics, reputation, trade-off between costs
and benefits, and also the complexity of the tax legislation, which can be evidenced
from the following comments:

333
“We are…engaged by the client and my job is basically engaged by the
client to work for them…I would say that we would not always take the
most conservative approach on behalf of our clients but neither we are
likely to overtake the legislation. The moral obligation under the NZICA
rules, obviously we are not allowed to file a tax return which we know
is definitely incorrect…for me it’s a way of doing it. I guess it’s a little
bit of fairness issues and moral issue. That becomes the foundation for
me”.
(Participant A, tax associate, small size public accounting firm)
“I want to make sure I do comply with the tax law when I try to keep up
to date and that is my policy. I want to make sure that I apply what I
know, to my client’s case. Maybe it means that…attitude. It’s quite a
grey area in tax. It depends on where you want to be. You can’t be seen
dishonest. I don’t want that reputation. My reputation is very
important”.
(Participant E, tax consultant, sole practitioner)
“Generally my decision making is based on what I think is correctly
following the legal position…it’s often legal position that keeps on
going, but generally I am interested only to see it from a legal
position”.
(Participant H, tax consultant, sole practitioner)
“Well…I think personally I try to get it right by the book. I do know
there are tax professionals who do not mind and quite happy with it.

334
Firstly, I want to put it right. I mean there are some situations that you
might…the other philosophy I have is the cost and benefit. For example,
I am doing a tax file for a few years and I know there are mistakes in
the previous years…so what is the quantum of the mistakes, whether is
it worth an assessment this year. Normally, what I do is I will see if it is
something minor and take a lot of time to detect and re-do, and the cost
is minimal…then I don’t bother a minor mistake”.
(Participant N, tax director, small tax consulting firm)
“I know that tax practice is part of professional service. My attitude
is…sometimes there are too many things need to comply which could be
costly to businesses and time consuming, and demanding…so it
becomes too complex and demanding…at the end of the day, the
government has to provide services and someone has to pay for it. It
doesn’t however to be complicated…as a member of NZICA, you are
bound by the Institute’s rules, you have less flexibility, you have to be
more strict in following the rules”.
(Participant J, tax consultant, small tax consulting firm)
“[T]he individuals’ interpretation of what is right and what is wrong.
My own personal attitude towards tax compliance is a strong
motivation that influences my approach in advising client…the rules are
here for everyone”.
(Participant L, tax consultant, medium size tax consulting firm)

335
“To me fear on behalf of the client is far more important than some
other factors. It’s fear towards the IRD. When the client comes to us,
they may not say it but one of the reasons why the client used Certified
Accountant is they do not want to override the law and being imposed
penalty…the penalty is very expensive”.
(Participant I, tax consultant, small size tax consulting firm)
The fear towards the NZIRD is also supported by other tax agents who
commented on the aggressive approach by the NZIRD in ‘ensuring’ tax compliance
in New Zealand.
“…I wouldn’t want to take risks…when it comes to tax laws. Do you see
the IRD is doing a lot more audit?”
(Participant F, tax accountant, small size public accounting firm)
“The approach of the IRD is becoming more aggressive. They are
looking at every loophole”.
(Participant H, tax consultant, sole practitioner)
“The Revenue [authority] is extremely aggressive towards taxpayers.
Their approach is extremely aggressive”.
(Participant G, tax director, small size public accounting firm)
The interviews also asked whether or not the social pressure from important
others, or people around tax agents, influence them in their compliance behaviour.
There was agreement that the social pressure from people around tax agents, to a
certain extent, influences them in complying with the tax laws while performing

336
their engagement roles. Depending on the complexity of the tax cases and their
level of expertise, tax agents in the interviews also sought opinions from other tax
experts, either internally or externally. For instance, there are interview participants
who sought the opinion of tax experts in the ‘Big Four’ public accounting firms
and the tax advisory services managed by the NZICA:
“I go to the specialist, for certain specific issues…like those from the
Big Four”.
(Participant C, tax director, medium size public accounting firm)
“In situation where you are not clear about something, you will ask
your colleagues, other tax practitioner, that’s done before you address
the case to your client”.
(Participant I, tax consultant, sole practitioner)
“Yes, different tax professionals have different views. We always
discuss our views. In a way they influence me”.
(Participant M, partner, medium size public accounting firm)
“…I would look at the Master tax guide. I would also look at the IRD’s
website, if there is something unclear about it. I talk to my tax
practitioners friends or if I still could not figure it out, I ask the Institute
of Chartered Accountant because they run a tax advisory service. I
don’t like to ask them too much. I don’t like to always on asking them. I
don’t like sending them emails every week, so I try to find out on my
own and sometimes I look for courses. Often when there is something
new, there are courses…and yes, they do, my friends in tax profession,

337
because if I have sort of questions, I ask them, and we talk about it and
in that way they influence me”.
(Participant E, tax consultant, sole practitioner)
“Yes, sometimes…because I am living in Hawkes Bay, I have far less
day to day contact then I would have if I stay in Auckland or
Wellington”.
(Participant H, tax consultant, sole practitioner)
“Yes, people around me, I take advice both from my colleagues and
external tax professionals”.
(Participant G, tax director, small size public accounting firm)
“The complexity of the clients’ cases determines whether or not I have
sufficient knowledge to be able to advise my clients. Sometimes…me
and a number of I know…if it is too complicated, I invite other tax
experts…it is way beyond my understanding…I have sufficient
knowledge but there are things which need high level of
expertise…because I am in small to medium size…not all the time
complexity arises but time and again they just pop up…I will go to other
experts…probably the Big Four because they are dealing with a lot of
complexity…not often but when it is too complicated…that’s of course
before you go to client. Again, what is complex to me may not be the
same to you or anyone else”.
(Participant J, tax consultant, small tax consulting firm)

338
“Certainly, my friends in the tax profession in a way influence me. Any
particular situation is subject to degree of interpretation and it is useful
to have an outside view”.
(Participant C, tax director, medium size public accounting firm)
“…I do refer if it’s a very complicated case, to KPMG or some
specialist”.
(Participant D, tax consultant, small tax consulting)
In discussing the influence of subjective norms in tax compliance, there are
also suggestions that perceptions of people around tax agents are important in their
decision making. For instance:
“We looked at the fact of the case, we come down with those who have
more experience, like the senior accountants and the tax partner, we
look at it…not only from the dollar and cents, but the risks as well, not
only the risk to the client but also, the risk to the firm. The kind of
people that I deal on the tax work, the whole team are senior employees
or senior tax professional, they provide a more matured approach in
decision making. I regularly socialise at various courses and meet some
other tax professionals around where we do talk about development in
tax issues…I guess you know you do not want to be seen among your
peers as being overly aggressive with the tax planning, but you do not
want to be seen to be conservative as well”.
(Participant A, tax associate, small size public accounting firm)

339
“I would say my family and friends could influence me. Some of them
have the accounting background. I would like to clarify, when I say my
family, they influence me on the attitude of complying with the tax
law…other motivation, I guess reputation within the organization, my
friends and colleagues within the accounting industry and also
reputation of the firm, because we do not want bad publicity”.
(Participant F, tax accountant, small size public accounting firm)
The discussions in the interviews also focused on the influence of perceived
behavioural control in complying with the tax law. Generally, there are mixed
opinions with regard to the influence of perceived behavioural control by the
interview participants. Some agree that they have the control, yet there are tax
agents who suggest that, as tax agents, they can only advise their clients, but the
final decision is the responsibility of the taxpayers:
“We will outline an interpretation for the client but at the end of the
day, we will probably outline a number of options for them, a number of
outcomes, some may be more conservative for the client but some may
be more aggressive for the client, but at the end of the day we leave the
decision up to the client based on all the facts, to have the final say,
which I guess it comes down to the particular client’s risk profile”.
(Participant A, tax associate, small size public accounting firm)
“The final decision is upon me, initially I will discuss with the manager
and the accountants”.
(Participant M, partner, medium size public accounting firm)

340
“…when you are at your level, you’ll have the control. People who do
not have the control might be the juniors”.
(Participant N, tax director, small tax consulting firm)
“Client always…the decision is always with the client…might be based
on our recommendations but what we do we always put forward the
recommendation. We would have…there are a few options available,
we are not in the position to provide all recommendations because some
of them might not be relevant…and I think we have some control
because we would probably put more emphasis on one particular
options than the others. At the end of the day, it’s the clients’ decision”
(Participant G, tax director, small size public accounting firm)
“So far yes, as a professional I would have control, which options…to
give to clients…you are very much in control, it determines that you
have done a good job but you can only recommend to the client. At the
end of the day, it’s the client who determines to accept or not to
accept…it depends on the relationship with the client as well…if you
have good relationship then most of the time, they will take your
advice”.
(Participant J, tax consultant, small tax consulting)
7.2.1.2 Ethical sensitivity and tax compliance
Generally, the interview participants in New Zealand agreed that ethical
sensitivity helps them in complying with the tax law. Similar to Malaysian tax

341
agents, the interview participants in New Zealand also commented that their
experience has helped them in developing their ethical sensitivity. For instance:
“Over the years you can tell if someone tries to cross the law. The
particular individual ethics are reflected in complying with the tax
law”.
(Participant C, tax director, medium size public accounting firm)
“…tax experience is the best teacher, which guides you when something
does not seem right, something seems to be pushed to the boundary,
something so good to be true and you at that time start to feel you want
to look closer…but you have to be mindful not to look at something
which is not necessary”.
(Participant L, tax consultant, medium size public accounting firm)
“Yes, I think I would…if I look at the documents. It took sometime”.
(Participant M, principal, medium size public accounting firm)
As commented by an interview participant, it is also interesting to note that
ethical sensitivity could be useful for tax agents to determine the type of advice
given to their clients. Based on the risk profiles of their clients, there is a
suggestion here that tax agents use their ethical sensitivity to determine whether or
not an aggressive approach is suitable for a particular client in the process of
complying with the tax law. The findings are consistent with Tan (2011) who
found that the type of advice given by tax agents to their clients to a certain extent
is influenced by the clients’ risk propensities:

342
“In [the] real world, some clients are more aggressive and some other
clients are less aggressive, the ethical sensitivity becomes a
boundary…what type of advice to give to the clients. Sometimes, we
probably would detect clients who try to evade, sometimes we wouldn’t.
For clients, they really want to get through some deductions that they
know is 100 percent correct…they will hide in their accounting system,
something which is incorrect”.
(Participant A, tax associate, medium size public accounting firm)
During the interviews, there were also tax agents who indicated that they
use their ethical sensitivity to assist them in their consideration of accepting an
appointment as tax agent or to retain a client. For instance:
“Actually, we did have a person who tried to be our client but we do not
accept people who have the intention to act unethically with the New
Zealand tax law…”.
(Participant F, tax accountant, small size public accounting firm)
“We should be encouraging our clients, recommending our clients to
comply with the tax law. Yes, we have turned down clients who are
aggressive, that they are looking at transaction which are basically tax
evasion”.
(Participant G, tax director, small size public accounting firm)
Notwithstanding ethical sensitivity is useful to help tax agents in complying
with the tax law, having ethical sensitivity on the part of tax agents does not
necessarily result in complying with the tax laws on the part of their clients. This is

343
most likely because tax agents’ roles are restricted to advising their clients based on
the information given and ultimately it is the clients themselves who make the
decision whether or not to comply with the tax laws. Some of the comments are
presented here:
“[W]e provide the clients with the correct information, so they make
their own decision, so…our responsibility ends as providing the
information and they make the decision and sign off the tax return at the
end of the day. If someone comes to me with dodgy
information…well…I would really be sceptical about the
information…and be very aggressive in making sure the right amount of
income was true”.
(Participant B, tax director, small size public accounting firm)
“Yes, to some extent. We are all aware that my clients who are dealing
with cash do not declare all their income. We encourage our client to
comply with the tax law. If the money goes back to the bank account,
then we know but if the money goes to their back pocket, we do not
know. We know the ratio but we do not know how much”.
(Participant I, tax consultant, sole practitioner)
“You can determine that…most of the time the client themselves, they
want to follow the law…so it could be, someone else who has the
technical knowledge, doing that for them. It could be a dodgy
accountant. But, we can always argue that we do on the basis of
information provided to us. There is a disclaimer on that. The

344
disclaimer is a protection and we cannot prepare anything without the
disclaimer. The ethics here is a broad issue. If you want to be honest,
maintain your reputation, then you have to follow the ethics. So there
are two ways looking at it, that you are not aware and rely on the
information provided to you or you are aware but choose not to, there
is where ethics come in”.
(Participant J, tax consultant, small tax accounting firm)
7.2.1.3 Culture in tax compliance behaviour
The influence of culture in the tax compliance behaviour of tax agents was
also brought up during the interviews. Similar to Malaysian tax agents, the
discussion was initially focused on how the New Zealand interview participants
make decisions before advising their clients. Generally, the tax agents in the study
suggested that the more junior staff have the opportunity to express their opinion,
and as commented by an interview participant, while the final decision is always
determined by the more senior staff, the decision making itself is based on a
consultative approach. Some of the comments are presented here:
“I guess in terms of colleagues, being the tax made at my
firm…probably more from the senior accountant and the partner…and
the expectation that I advise appropriately a client regarding tax
matters…and the other partner relies on my expertise to advise client,
prepare the most recent opinion or other advisory engagement to make
sure the advice is well researched, well structured”.
(Participant A, tax associate, small size public accounting firm)

345
“I let them to express their opinion. Tax is so complex, sometimes I miss
something and they always change my decision. They know much of the
case from the beginning”.
(Participant M, partner, medium size public accounting firm)
“They, the staff, will discuss with me, then if it is too technical or not
clear, we might discuss with another tax lady who is much senior…”.
(Participant N, tax director, small tax consulting firm)
“I look at the particular case, look at what the facts are, important
factors of the case, make sure understand all the background, so I need
to understand the background to find options…discuss the facts with
people in the office and external tax expert”.
(Participant G, tax director, small size public accounting firm)
“I do invite them to give opinion with the knowledge that they have. The
simple things…but others much more complicated I take upon myself”.
(Participant J, tax consultant, small tax consulting)
“Generally, it comes down to the individual responsibility to make the
final decision, but it’s a consultative approach”.
(Participant L, tax consultant, medium size tax consulting firm)
“Yes, staff under me have the opportunity to give [an] opinion but the
final decision is me and the client”.
(Participant D, tax consultant, small tax consulting firm)

346
“The staff deals with client on more general issues, the partners deal
with more technical issues. The staff will prepare the GST return for
instance but the amount of tax will be decided by one of the directors”.
(Participant B, tax director, medium size public accounting firm)
Another topic brought up during the interviews was how comfortable tax
agents may be in uncertain situations. For that purpose, the interviews discussed
whether or not tax agents feel comfortable to take risks while performing their
engagement roles. There was agreement by some tax agents that they felt
comfortable with risks, while on the other hand, some tax agents indicated their
preference not to be in risky situations while complying with the tax laws. Some of
the opinions are stated below:
“I am very in the middle with risks. If the client is asking me to do
something, I’ll look at it, depending on the situation”.
(Participant M, partner, medium size public accounting firm)
“I am very conservative. In terms of grey areas, no…no…I am pretty
conservative. I do not want to be investigated by the IRD and what if
later proven I am wrong, the client would blame me. I would rather
comply absolutely with the tax law”.
(Participant E, tax consultant, sole practitioner)
“…I wouldn’t want to take risks…when it comes to tax laws. Do you see
the IRD is doing a lot more audit? …and also being the member of the
Institute (NZICA), if you take risks like that you can be quite in
trouble…and also if we create a very bad culture in our firm…we take

347
big risks for our client. We try to avoid risks, at all cost and we
really…even if our client asks us to take risks, we will analyse whether
it is highly unethical or just maybe marginal”.
(Participant F, tax accountant, small size public accounting firm)
“I think…as a sole practitioner it is one of the big risks not having 2 or
3 people around, sometimes I do this and I can do that, but it’s not
without big cost…that’s always a reluctant. I would be really nervous to
giving wrong answer. When I look at it carefully and allowed time, I am
confident with my answer, but if the time is not allowable, then I’ll
nervous. It’s not so much about taking risk, I don’t mind taking risk, but
being a sole practitioner it is easier to make mistake…but having said
that, you find people working in firms with many partners also always
make mistake”.
(Participant H, tax consultant, sole practitioner)
“…in terms of taking risks, if I believe something is a way beyond of my
knowledge, I would probably not to take risks at all. As a professional, I
am liable to be sued by my clients. I do take risks, but not often”.
(Participant J, tax consultant, small tax consulting firm)
“If there is $200 in the account from interest then you don’t want to
declare…yes, there are risks but the $200 is not worth to do it, it’s not
economical to chase it, yes you may get caught doing it…we look at
acceptable risks…another thing is risks around to determine how tax

348
law should be applied to situation…look we can do that, but the cost is
a lot more, no adding values to that”.
(Participant C, tax director, medium size public accounting firm)
“It depends on the situations and depends on the type of the clients is
interested in. Some clients maybe, are more conservative or aggressive.
I am doing my family’s tax as well. I would take a middle road. Tax law
is a grey area. It’s how you interpret it. One of the difficulties of a tax
practitioner is there is a lot of grey areas in law. It’s so upset…even
though I didn’t have clients like the Penny and Hooper type”.
(Participant D, tax consultant, small tax consulting firm)
“Calculated risk I suppose. I wouldn’t want to push someone to an
extreme position and might end up what we advise them is not based on
rules. Again, this is an area where there is grey area and that the client
pushes to the boundaries”.
(Participant B, tax director, medium size public accounting firm)
The influence of culture in tax compliance behaviour of tax agents was also
described from their perceptions towards benefits or harm to society as a result of
their decision making. Based on the comments provided by the interview
participants, a majority of them do not consider the benefits to society when
making tax decisions. Most likely because, they regard themselves as advocates for
their clients and thus, priority should be to the economic benefits of the clients.
Some of the comments are presented here:

349
“[W]e are looking for the benefits of the client, we are engaged by the
client. We produce the work for them…we are paid to give the best
outcome to them…”.
(Participant A, tax associate, small size public accounting firm)
“I suppose the benefit of the society…what I mean there’s a law which
make people to comply. I am thinking more of maintaining a system to
make people comply”.
(Participant E, tax consultant, sole practitioner)
“I advise the client to comply with the tax law, for instance advising on
the long term investment. I only agree to reduce tax within the tax
legislation. Reducing the tax liability of my client legally, I am sitting
on the bench of my client”.
(Participant M, partner, medium size public accounting firm)
“Benefits to the clients are the priority, no…I don’t think about the
benefit to the society”.
(Participant G, tax director, small size public accounting firm)
“Yes, I do consider…but not to the extent we see people eligible for
benefits from other people”.
(Participant N, tax director, small tax consulting firm)
“I look at myself as a good citizen, following the NZ standard in terms
of practising as a professional. My professional status is important to

350
me. I don’t want to be seen as lousy accountant, manipulating the book,
it takes a while to build up reputation”.
(Participant J, tax consultant, small tax consulting)
“When it comes to…when dealing with our clients, not only we advise
our clients about tax compliance law but we also do consulting, we help
them minimise their tax liability according to NZ law. So, just making
sure the actions are legal and making sure they are not overpaying tax.
You can say we want to have a better relationship with our client and
that means more fees for us…it will be more on the client rather than
the society at large”.
(Participant F, tax accountant, small size public accounting firm)
“Certainly, cost of the client…the fees cost, obviously I have to take
into account the law and I’ve got to take into account the client’s risk
tolerance”.
(Participant I, tax consultant, small size tax consulting)
7.3 Discussions of the interview findings: Malaysia and New Zealand
The earlier sections in this chapter have demonstrated the perceptions of
Malaysian and New Zealand tax agents with regard to their tax compliance
behaviour in general, the influence of attitudes, social pressure from important or
referent others, perceived control, ethical sensitivity and culture in complying with
the tax laws. To further understand their tax compliance behaviour, the findings
from the interviews are summarised to find any similarities or differences in the
opinions.

351
Overall, based on their interview responses, both Malaysian and New
Zealand interview participants have similar understanding with regard to tax
compliance. Interestingly, when delving into each concept from the interview the
findings indicate some differences on how tax agents interpret the concepts.
Generally, interview participants from Malaysia and New Zealand understand tax
compliance as complying with the tax act, rules, regulations and the requirement by
the tax authorities. Their understanding is translated by meeting the deadlines for
filing tax return, settling any amount of tax due within the stipulated period,
preparing proper documentation and declaring their income and expenses
accordingly.
There is also agreement by interview participants from both countries that
tax compliance is also understood as upholding justice on the sides of taxpayers
and tax authority. This could be achieved by ensuring that taxpayers do not
overpay or underpay tax. Overpayment of tax for instance could mean taxpayers
are over-compliance whilst underpayment of tax could result into less income for
tax authorities. When probed further, there was also agreement by interview
participants from Malaysia and New Zealand that tax compliance could be
achieved if taxpayers understand the tax rules. As commented by an interview
participant from Malaysia, since the roles of tax agents are to assist their clients,
tax agents have to ensure that they have sound technical knowledge. In New
Zealand, there is agreement that since understanding tax rules is important to
motivate tax compliance, tax laws should be easy to understand and not
complicated. In addition, interview participants in New Zealand argued that being
ethical in complying with the tax law connotes a subjective interpretation based on

352
the recent judgment of the Supreme Court of New Zealand in the case of Penny &
Hooper v CIR (Elliffe, 2011).
Interestingly, there is agreement by interview participants in both countries
that complying with the tax law to a certain extent is situation specific. In
Malaysia, for instance, a tax agent commented on the need to be flexible when
dealing with their clients in extraordinary cases and cited natural disasters as an
example. In New Zealand, on the other hand, situation specific refers more to the
amount of tax involved. For instance, there is a suggestion that their level of
compliance to an extent depends on the amount of tax and risks involved in the
transaction. Consistent with Jones (1991), this perhaps indicates that being ethical
in tax compliance depends on the intensity of the moral issue, which is situation
specific. There is a possibility that if the amount of tax or risk is minimal, then tax
agents would regard the intensity of the moral issue as low and would response
differently to tax compliance.
The discussion in the interviews also attempted to understand the influence
of attitudes of tax agents in complying with the tax law. Generally, the interview
participants in both countries concur that their attitude could influence their tax
compliance behaviour. For instance, there is agreement by some interview
participants that as tax agents they perceived themselves as professionals who are
obligated to abide the professional ethical rules. As members of professional
bodies, such as NZICA and MIA, they are bound by the Institutes’ rules in their
professional judgment. In addition, some interview participants in both countries
addressed their fear that if they as tax agents do not comply with the tax laws in
assisting their clients, the repercussions will be felt by their clients, such as

353
becoming the subject of tax audit or being penalised by the tax authority. As a
result, they will lose their credibility or will be perceived as being dishonest by
their clients, which could damage their reputation as tax agents. There is also
agreement by New Zealand tax agents that the tax authority is becoming more
aggressive in their approach and to an extent, their fear towards NZIRD influences
their compliance behaviour to abide tax laws.
The influence of attitude in complying with the tax law is also translated by
the feeling of guilt for non-compliance, as commented by an interview participant
from Malaysia. In New Zealand, the influence of attitudes is also described as
ensuring fairness by the relevant tax players in the tax system. For instance, in
some circumstances, tax agents may take an aggressive tax approach on behalf of
their clients but that does not mean overriding the tax laws. Interestingly, there is
also an opinion that tax agents’ attitude to tax compliance to some extent is
influenced by the trade-off between costs and benefits. As commented by an
interview participant, mistakes made in previous years’ tax returns are only worth
re-assessment if it would be cost effective. Again, the complexity of the tax laws in
New Zealand was raised during the discussion. Arguably, the complexity of the tax
law results in high cost for businesses, and is time consuming, since tax agents
have to comply with ‘too many’ tax requirements.
The interview participants from Malaysia and New Zealand also
unanimously agree that to an extent, that there is influence from referent or
important others (subjective norms) in their decision making. Peers, superiors and
friends in the same profession, could influence the decision making of the tax
agents in this interview study. The influence could come from exchanging opinions

354
and experiences especially in complicated tax situations. As commented by some
interview participants, in many cases the complexity of the tax law and the level of
knowledge that they possess will determine whether or not this influence exists.
Interestingly, in New Zealand, some interview participants also sought the
help from tax specialists from the ‘Big Four’ public accounting firms and NZCIA’s
tax advisory services. This in a way indicates the dominant influence of ‘Big Four’
public accounting firms in the tax profession and the importance of tax agents in
the ‘Big Four’ public accounting firms to be more ethical, since they are not only
providing their expert opinions to their taxpayer clients, but to other tax agents,
especially from smaller firms or sole practitioners. In addition, the interview
findings also suggest the importance of NZICA, as a resource centre in assisting
their members. The assistance of NZICA through the tax advisory services to its
members could also be translated as providing indirect training to members with
regard to being ethical in their decision making. In New Zealand, the perception of
peers is also considered as an important factor in decision making. There are
suggestions that tax agents do not want to be seen as too conservative or too
aggressive in their tax approach while assisting their clients or be perceived as not
being capable, despite requesting help from other tax specialists. During the
interviews, there is also a suggestion from New Zealand tax agents that another
concern in complying with the tax laws is the bad reputation to the firm from the
decision making of tax agents, which is something they try to avoid.
The discussion in the interviews also delved into the importance of
perceived control in the decision making of tax agents. The findings suggest that
Malaysian and New Zealand interview participants had similar views on the

355
influence of perceived control in their decision making. Some interview
participants believe that they have control, whilst some disagree. In Malaysia, some
interview participants suggest that they only have control at the initial stage of
decision making. This is most likely because they may not have reached a certain
level of expertise that is required in the decision making process. When probed
further, those tax agents who believe that they have control, explained that they
have the control in providing the type of advice to their clients, but not necessarily
in the final decision making. This is because their role is to assist their clients and
the final decision making is made by the clients based on the recommendations of
tax agents. They also commented that, to a degree, having a good relationship with
clients becomes another factor which determines whether or not clients will make
decisions based on their recommendation.
With regard to ethical sensitivity, the interview participants from Malaysia
and New Zealand had similar views that ethical sensitivity is helpful in complying
with the tax laws. When inquiring further, interview participants from Malaysia
responded that ethical sensitivity is useful to avoid unethical conduct in tax practice
and at the same time this may have a positive influence, such as in identifying
potential tax claims for the clients which may have been initially overlooked. In
New Zealand, ethical sensitivity is considered as helpful in assisting tax agents to
provide the type of advice to their clients based on the risks profile of the clients.
For instance, tax agents use their ethical sensitivity to decide whether or not an
aggressive tax approach is suitable for a particular client. Some interview
participants from New Zealand also suggested that their ethical sensitivity to a
certain extent helps them to understand their client and serves as a guideline to
356
either to accept or decline appointment as a tax agent. The interview participants
from both countries also agreed that their ethical sensitivity is developed through
experience. Despite the support for ethical sensitivity, some interview participants
have different opinions. More junior interview participants from Malaysia, for
instance, indicate that they have yet to reach the level of having ethical sensitivity
in complying with the tax law, possibly because junior staff does not handle
complicated tax cases. In New Zealand, as commented by an interview participant,
having ethical sensitivity does not necessarily mean complying with the tax law
since it also depends on the ethical belief of the tax agents.
The study also recorded mixed opinions amongst interview participants
from both countries with regard to the influence of culture in complying with the
tax laws. The influence of culture in this interview study is predominantly explored
from three aspects: the gap in decision making whether or not more junior staff are
given the opportunity to contribute to the decision making before advising the
client; willingness to be in uncertain situations such as taking risk; and their
consideration for the benefit of society in their decision making while performing
their roles as tax agents. Apart from those three abovementioned aspects, in
interpreting the influence of culture, the researcher also examined the existence of
cultural traits in all of their interview responses. Similar to the approach used in a
series of interviews with SME operators, tax agents and business experts in New
Zealand by Yong (2011), the interplay of cultures based on Hofstede’s (1980)
National Cultural Dimensions were used as a basis to explain the influence of
culture in tax compliance behaviour of tax agents.

357
When discussing the gap in decision making between the more junior and
senior staff, interview participants from both countries concurred that more junior
staff have the opportunity to contribute ideas in the decision making before
advising their clients. However, the final decision to suggest the type of advice
given to the client was always in the hands of the senior staff. As commented by an
interview participant from New Zealand, while the final decision is always based
on senior staff’s decision, the approach to arrive at the decision is more
consultative than autocratic. This is also supported by a comment from an
interview participant in Malaysia that it is not the position of senior staff that
makes their decisions accepted, but it is because the senior staff’s opinions are
more accurate. Based on the comments from more junior staff from Malaysia,
indicate that more junior staff feel more comfortable to rely on their superior in
making decisions. As commented by an interview participant from Malaysia, the
lack of experience to a certain extent limits their courage to come out with their
own decision in assisting their clients.
The interviews also tackled how comfortable tax agents are with
uncertainties in their tax practices. Based on their comments, there are mixed
opinions with respect to their willingness to undertake risks in complying with the
tax laws. There is agreement by some Malaysian interview participants to consider
undertaking risks of certain amount in performing their roles. However, they do not
elaborate on the basis to determine the amount of risks they considered acceptable.
Similar to the Malaysian interview participants, the New Zealand tax agents in the
interview study indicate their willingness to undertake risks. When probed further,
they mentioned cost and benefits as the basis to determine the level of risks that

358
they would tolerate in complying with the tax laws. On the other hand, there are
interview participants in Malaysia and New Zealand who avoid taking any risks,
and cited high penalties and the possibility of being audited by the tax authority as
reasons for not undertaking risks in complying with the tax laws.
In an attempt to understand the influence of culture in tax compliance, the
interview participants were also asked to comment whether or not they consider the
benefits to society in their decision making while performing their roles. The
interview analysis indicates that tax agents in the interview study from both
countries have mixed opinions on this matter of benefits to society. There is
agreement by some tax agents from Malaysia that they consider the benefits of the
society in their decision making while performing their engagement roles. An
interview participant for instance commented that since Malaysia relies heavily on
tax collection to build up the country, thus less income from taxation could
possibly affect the benefits that society could enjoy. Similar opinions on the
importance of benefits to society in decision making of tax agents are also recorded
from New Zealand tax agents in the interview study. They translate the benefits to
the society in the form of maintaining a good tax system in the country which
eventually benefits the society at large. Different opinions from interview
participants in Malaysia and New Zealand were also documented, stating that they
consider their clients’ economic interest more than the benefits to the society.
There are also interview participants who only care about their clients’ economic
benefits in their decision making. Some tax agents commented that their role as tax
agents is to assist their clients, thus their priority is to safeguard their clients’
interest.

359
The interplay of cultural traits such as low Power Distance, high
Individualism, and moderate Uncertainty Avoidance, could be evidenced in the
responses of interview participants from Malaysia and New Zealand. To a certain
extent the evidence supports the influence of culture in the decision making of tax
agents in the study. The findings reveal that junior staff have the opportunity to
give their opinions in decision making, and do not merely follow their senior staff’s
decisions, which imply low Power Distance cultural characteristic. A high
Individualism trait is also noticeable among the interview participants. For
instance, the decision making is eventually centred on an individual’s decision
making which is consistent with the argument by Hofstede (1980), that in an
individualistic society, decision making is always made by an individual rather
than collective. In addition, their priority towards clients’ economic interest,
consideration about the amount of fees paid by client for their services, the trade-
off between cost and benefit in complying with the tax laws imply preference
towards performance and materialistic, which are all traits of an individualistic
society. Their unwillingness to undertake risks and uneasiness with the complexity
of the tax law in part translate their moderate Uncertainty Avoidance cultural
characteristic.
The interview findings are meant to provide further understanding of the tax
compliance behaviour of tax agents in this study. Drawing from the discussion with
17 tax agents from Malaysia and 14 tax agents from New Zealand, the findings
indicate that the interview participants generally had similar views in most issues.
The key concepts from the interview findings are simplified in Table 7.3.
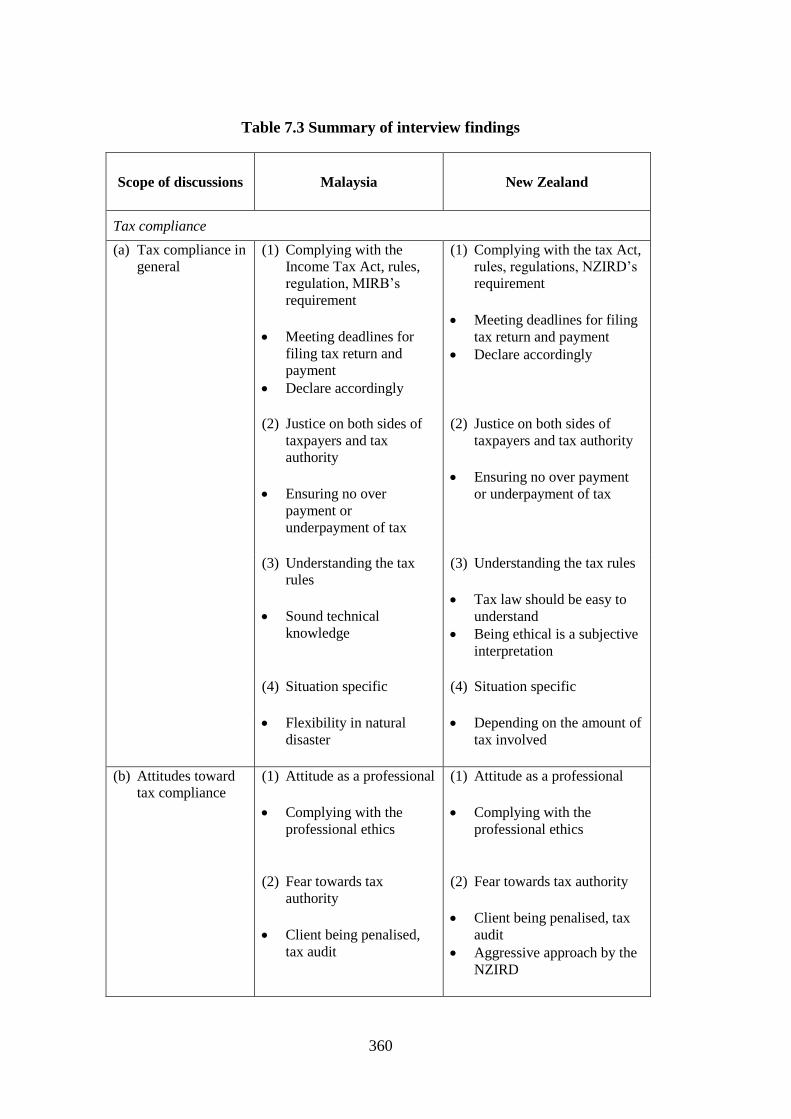
360
Table 7.3 Summary of interview findings
Scope of discussions Malaysia New Zealand
Tax compliance
(a) Tax compliance in
general
(1) Complying with the
Income Tax Act, rules,
regulation, MIRB’s
requirement
Meeting deadlines for
filing tax return and
payment
Declare accordingly
(1) Complying with the tax Act,
rules, regulations, NZIRD’s
requirement
Meeting deadlines for filing
tax return and payment
Declare accordingly
(2) Justice on both sides of
taxpayers and tax
authority
Ensuring no over
payment or
underpayment of tax
(2) Justice on both sides of
taxpayers and tax authority
Ensuring no over payment
or underpayment of tax
(3) Understanding the tax
rules
Sound technical
knowledge
(3) Understanding the tax rules
Tax law should be easy to
understand
Being ethical is a subjective
interpretation
(4) Situation specific (4) Situation specific
Flexibility in natural
disaster
Depending on the amount of
tax involved
(b) Attitudes toward
tax compliance
(1) Attitude as a professional
Complying with the
professional ethics
(1) Attitude as a professional
Complying with the
professional ethics
(2) Fear towards tax
authority
Client being penalised,
tax audit
(2) Fear towards tax authority
Client being penalised, tax
audit
Aggressive approach by the
NZIRD

361
(3) Reputation
Losing credibility as tax
agents
(3) Reputation
Perceived as dishonest
(4) Feeling guilty for not
complying
(4) Fairness
(5) Trade –off between costs
and benefits
(6) Complexity of the tax law
(c) Influence of
referent or
important others
(1) Peers, superiors, friends
in the profession
Exchanging opinions and
experience especially in
complicated tax
situations
(1) Peers, superiors, friends in
the profession, tax specialist
especially from ‘Big Four’
public accounting firms,
NZICA tax advisory
services
Exchanging opinions and
experiences especially in
complicated tax situations
Perceptions of peers
(2) Reputation to the firm
(d) Perceived control (1) Mixed opinions (1) Mixed opinions
Control at the initial
stage of decision making
Control in providing the
advice but not
necessarily in the final
decision making
Control in providing the
advice to clients but not
necessarily in the final
decision making
Ethical sensitivity (1) Helpful in complying
with the tax law
(1) Helpful in complying with
the tax law
Avoid unethical conduct
Identify potential tax
claims
Guideline to provide type of
advice to clients based on
their risk profiles
Guidelines to accept or
decline appointment as tax
agent
(2) Less support from junior
staff
(2) Awareness does not
necessarily mean comply
with the tax law

362
(3) Developed through
experience and
observation
(3) Developed through
experience
Culture
(a) Gap in decision
making
(1) Mixed opinions
More junior staff are
allowed to contribute
ideas but final decisions
before advising clients
are made by more senior
staff
Junior staff prone to rely
on more senior staff in
decision making
(1) Mixed opinions
More junior staff are
allowed to give ideas but
final decisions before
advising clients are made by
more senior staff
Consultative approach
(b) Willingness to be
in uncertain
situations
(example: taking
risks)
(1) Mixed opinions
Willing to take risk of
certain amount
Avoid risks due to high
penalty and probability
being audited
(1) Mixed opinions
Willing to take risks
depending on situation (cost
and benefits consideration )
Avoid risks due to high cost
(penalty and audit)
(c) Consideration for
society
(1) Mixed opinion
Consider the benefits to
society from tax
collected
Safeguard clients’
economic interest
(1) Mixed opinions
Maintaining a good tax
system in the society
Safeguard clients’ economic
interest
7.4 Summary
In this chapter, the analysis and findings from the interviews with tax agents
from Malaysia and New Zealand are presented. The findings are then summarized
and compared to find out if the tax agents differ in their opinions. As mentioned in
section 4.8.6 of Chapter 4 Research Method the researcher started the analysis
process by transcribing the recording into written text, coding the data and putting

363
this into the respective themes. While the themes in this interview study were
determined a priori, which are basically related to the topics under study, some
new concepts also emerged from the interview responses.
Essentially, tax agents in Malaysia and New Zealand shared similar views
on the factors that could influence them in their decision making while performing
their roles. Some differences in interpreting the concepts discussed in the
interviews are also documented. With regard to their understanding about tax
compliance behaviour, generally, interview participants perceived tax compliance
as following the tax laws, exercising justice, understanding the tax rules and
situation specific. They also agreed that to a certain extent, attitudes towards
compliance influence them when complying with the tax laws. While there are
some consistencies between interview participants from Malaysia and New
Zealand in interpreting attitudes in tax compliance, their opinions also differ in a
few areas.
Another factor considered as important by interview participants in the
study is the influence of referent or important others. Peers, superiors and friends in
the same profession, are the common important others who influenced tax agents in
this study. The findings indicate some agreement and disagreement by interview
participants in relation to the influence of perceived control, ethical sensitivity and
culture in the tax compliance behaviour of tax agents. In interpreting the concepts
discussed in the study, it was also discovered that complexity of the tax laws,
economic factors such as penalties, probability of being audited, trade-off between
cost and benefits, risks and aggressiveness of tax authority, could be among the
reasons for complying with the tax laws.

364
The findings from the interview, to an extent, support the argument by
Roberts (1998) and Blanthorne and Kaplan (2008) that economic and non-
economic factors influence individuals in complying with the tax law. The next
chapter presents a synopsis of the study, discussions of the key findings of the
study, conclusions, contributions of the study, limitations of the study, and future
recommendations.

365
CHAPTER 8
DISCUSSIONS AND CONCLUDING STATEMENTS
8.0 Introduction
This chapter presents a synopsis of the study before discussing the findings
from the survey and interviews from Malaysia and New Zealand. In addition, this
chapter also presents the contributions of the study, its limitations and
recommendations for future research.
8.1 The study – A Synopsis
The purpose of this study is to understand the tax compliance behaviour of
tax agents in Malaysia and New Zealand while performing their engagement roles.
Prior studies, such as Jackson and Milliron (1986) and Richardson and Sawyer
(2001), suggest various factors that can influence an individual’s tax compliance
behaviour. Given the wide scope of tax compliance studies, based on the prior
literature, this study selected several factors that could potentially contribute to the
ethical decision making of tax agents in complying with the tax laws by extending
the Theory of Planned Behaviour (TPB) by Ajzen (1991) with ethical sensitivity
and culture.
The abovementioned theoretical suggestion is conceptually illustrated in a
framework in Chapter 3 and tested in two scenarios: overstating tax expenses and
understating tax income. Considering that this study is comparative in nature, it is
essential to examine whether or not tax agents in this study have similar
perceptions towards the TPB elements, ethical sensitivity and culture in complying

366
with the tax laws. This study used Multidimensional Ethics Scale (MES) to
measure ethical sensitivity and Hofstede’s (1980) National Cultural Dimensions to
measure culture, and prior studies (eg. Cruz et al., 2000; Yeoh, 1999) suggest that
both are conceptually multidimensional. Therefore, it is also necessary to examine
whether or not tax agents in the study perceive ethical sensitivity and culture in this
study as a multidimensional construct.
Drawing from the conceptual framework, ten research questions, which
were later translated into hypotheses, were developed to achieve the objective of
the study. To answer the research questions and test the hypotheses, a mixed-
method approach was employed in the study, adopting a partially sequential
explanatory and partially concurrent mixed-method research design with survey
and semi-structured telephone interviews as the data collection instruments.
The first three research questions, which also represent the preliminary
hypotheses on the overall perceptions of tax agents with regards to the TPB
elements, ethical sensitivity and culture, were analysed by performing t-test
analysis. To answer the remaining research questions, their respective hypotheses
were tested using Structural Equation Modelling (SEM), particularly through
operationalizing the partial least squares (PLS) approach using the SmartPLS 2.0
(M3) Beta software developed by Ringle et al. (2005).
The interview findings from the study are useful for explaining further the
survey responses. In a mixed method study, the interview findings could be used to
either support or challenge the findings in the survey (Creswell, 2009; Bryman and
Bell, 2011; Creswell and Plano Clark, 2011). In this study, the data from the

367
interview was analysed following approaches suggested by Lincoln and Guba
(1985) and Braun and Clarke (2006). The next section discusses the main findings
of the study from the survey and interviews.
8.2 Key findings of the study
In this section, the integration of findings from the survey and interviews
are presented for each variable of the study.
8.2.1 Culture and tax compliance
In this study, culture is measured using Hofstede’s (1980) National Cultural
Dimensions. Since this is a comparative study, there is a need to examine whether
or not tax agents in Malaysia and New Zealand have the same perceptions with
regard to Hofstede’s (1980) National Cultural Dimensions, which is captured in the
first research question,
“Do tax agents in Malaysia and New Zealand have the same level of
perceptions with regard to Hofstede’s (1980) National Cultural Dimensions in
complying with the tax laws?”
The t-test results from Chapter 5 indicate that tax agents in Malaysia and
New Zealand do not differ significantly with regard to their perceptions towards
the cultural traits of Power Distance, Individualism and Uncertainty Avoidance in
complying with the tax laws. They do, however, differ in their perceptions towards
Masculinity in complying with the tax law.
Therefore, the hypothesis stating “There is no significant difference
between tax agents from Malaysia and New Zealand with regard to the Hofstede’s

368
(1980) National Cultural Dimensions in complying with the tax laws” is not fully
supported.
The findings contradict with Hofstede’s (1980) propositions on the cultural
dimensions of Malaysia and New Zealand. On the contrary, the findings are similar
to Saad (2011) who found that in general, individual taxpayers in Malaysia and
New Zealand have similar perceptions towards tax compliance. One possible
explanation is that, while the cultural dimensions of Malaysia and New Zealand are
different according to Hofstede (1980), both suggest some similarities in their
accounting practices which were developed based on the British system (Gernon &
Meek, 2001). The different results recorded for Masculinity and tax compliance in
this study is possibly because tax agents in New Zealand and Malaysia have
different perceptions with regard to how to deal with the tax authorities in their
countries.
Since Hofstede’s (1980) National Cultural Dimensions are perceived to be
multidimensional (Hofstede, 1980), the validity and reliability of cultural measures
in this study were tested in the first order factor model, and later as a second order
factor model using the repeated indicator approach, suggested by Chin (2010), and
Hair et al. (2013) on the overstating tax expenses scenario and understating income
scenario. The results of the second order factor models and multicollinearity test of
the constructs, as presented in Tables 6.14, 6.16 and 6.17 for the overstating tax
expense scenario and in Tables 6.15, 6.18 and 6.19 for the understating income
scenario in Chapter 6, support the Hypothesis 9 “Tax agents in Malaysia and New
Zealand perceive culture as a multidimensional concept”.

369
To test the strength of the relationship between culture and intention to
comply with the tax law in the proposed model, the path coefficient and the t-
values from the bootstrapping were observed. In the case of overstating tax
expenses, culture was not a significant factor in Malaysia and suggested only a
weak relationship with intention in New Zealand. In the understating income
scenario, culture was also found not to be significant in explaining the tax
compliance behaviour of tax agents from Malaysia but suggested a moderate
relationship with intention in New Zealand.
Given the above mentioned findings Hypothesis 10 “Culture significantly
influences tax agents in Malaysia and New Zealand in complying with the tax law”
was rejected for Malaysia but accepted in New Zealand for both scenarios of
overstating tax expenses and understating income. The results imply that there are
differences with regard to tax culture between Malaysian and New Zealand
respondents. As suggested by Alm and Torgler (2006), tax culture differs across
countries, which is possibly related to trust in the government policies. Nerré
(2008) also commented that tax culture is a subset of national culture and this tax
culture is determined by the cultural norms and historically developed legal
institutions in every country.
Based on the guidelines provided by Cohen (1988), effect size which
explains the impact of independent variable on dependent variable (Henseler et al.,
2009; Hair et al., 2012) for culture in overstating tax expenses scenario in Malaysia
and New Zealand, suggests that culture has only a small effect on intention. In the
understating income scenario, culture does not have any effect on intention in
Malaysia and reported only a small effect on intention in New Zealand.

370
The interview findings indicate further the interplay of cultural traits in the
responses of tax agents in Malaysia and New Zealand. Overall, the findings from
the interviews indicate that tax agents in Malaysia and New Zealand have mixed
opinions on the influence of culture in complying with the tax laws. While the
overall findings from the interviews and the survey may be inconsistent, scholars
such as Creswell (2009), Bryman and Bell (2011), and Creswell and Plano Clark
(2011), argue that inconsistencies in findings between quantitative and qualitative
approaches in mixed-method-based studies are common and indeed, these
inconsistencies are one of the challenges in conducting mixed-method studies.
The interview results revealed that tax agents in Malaysia and New Zealand
in the study allowed junior staff to participate in the decision-making process
before advising their clients, but the final decisions were always made by the senior
staff member suggesting low Power Distance and high Individualism cultural traits.
Tax agents in the study from both countries also have mixed opinions on their
willingness to take risks. There was agreement between tax agents from both
countries that certain amount of risks were tolerable in complying with the tax laws
but some tax agents from Malaysia and New Zealand avoided taking any risks
citing reasons such as high penalty and possibilities of being audited, indicating
overall a moderate Uncertainty Avoidance cultural trait. Furthermore, tax agents’
priority for clients’ economic benefits, consideration of the amount of fees paid by
clients, and the trade-off between costs and benefits of complying with the tax
laws, reinforce the cultural traits of Individualism and Masculinity.
The findings on the influence of culture in complying with the tax law in
this study are inconclusive and add to the literature on the mixed findings of the
371
influence of culture in tax compliance behaviour. While the findings on the
influence of culture on tax compliance behaviour for New Zealand are consistent
with prior studies (eg. Bobek et al., 2007b), contradictory results are recorded for
Malaysia. It is interesting to note that while tax agents from Malaysia and New
Zealand in the study have some similarities in their perceptions towards Hofstede’s
(1980) National Cultural Dimensions in complying with the tax law (as evidenced
from the t-test results and their interview responses) both agreed that culture in this
study is a multidimensional concept. This is shown in the results of the second
order factor models, where the influence of culture in their decision making is
slightly different.
One possible reason is that, while the interview responses related to taking
risks, consideration of economic benefits and cost imply the existence of cultural
traits, they also imply the concern of tax agents on other contextual factors. This
includes economic factors in complying with the tax laws, which result in lack of
support for the influence of culture in explaining tax compliance behaviour of tax
agents in the study.
Another possible reason is that, notwithstanding New Zealand tax agents in
this study are members of NZICA, the accounting profession in New Zealand relies
on a self-regulatory approach, which differs to Malaysia where the accounting
profession is statutorily governed by the MIA. As suggested by Cohen et al.
(1996), the close monitoring of the professional body, in this case the MIA, as a
statutory body, could possibly reduce the impact of culture in the ethical decision
making of tax agents in this study.

372
8.2.2 TPB items and tax compliance behaviour
The second research question, “Do tax agents in Malaysia and New
Zealand have the same level of perceptions in relation to the TPB elements in
complying with the tax law while performing their roles?”, examined whether or
not tax agents in this study have similar perceptions towards the TPB items in
complying with the tax law in overstating tax expense and understating income
scenarios. The results from the t-test analyses suggest that tax agents in Malaysia
and New Zealand differed significantly in their perceptions towards attitudes,
subjective norms and perceived behavioural control in overstating tax expense and
understating income.
Thus, this led to rejecting Hypothesis 2a “There is no significant difference
in the perceptions in relation to the intention to comply, attitudes towards
behaviour, subjective norms and perceived behavioural control between tax agents
in Malaysia and New Zealand in overstating tax expense scenario” and likewise
rejecting Hypothesis 2b “There is no significant difference in the perceptions in
relation to the intention to comply, attitudes towards behaviour, subjective norms
and perceived behavioural control in understating income scenario”.
Overall, the means in the overstating tax expenses scenario and understating
income scenario suggest that in this study, tax agents from New Zealand were more
likely to act ethically compared to tax agents from Malaysia.
8.2.2.1 Attitudes and tax compliance behaviour
The path coefficient and p-values for attitudes in the overstating tax
expenses scenario indicate that attitude has a strong relationship with intention to

373
comply with the tax laws for tax agents from Malaysia. Equally, attitude towards
complying with the tax laws is also significant in New Zealand in the overstating
tax expenses scenario. When the conceptual model is tested on the understating
income scenario, attitude towards complying with the tax law is also found to be a
significant variable in explaining the tax compliance behaviour of tax agents in
Malaysia and New Zealand.
In view of the foregoing, the Hypothesis 4 “Attitude towards behaviour
significantly influences the tax agents in Malaysia and New Zealand in complying
with the tax law” is accepted in both Malaysia and New Zealand for the overstating
tax expenses and understating income scenarios. The effect size of attitude on the
intention is also large in the overstating tax expenses’ scenario in Malaysia and a
consistent result is also recorded in New Zealand. Similarly, the effect size of
attitude on the intention is large in understating income scenario in Malaysia and
New Zealand.
The interview findings explain further the influence of attitude in the tax
compliance behaviour of tax agents. Essentially, tax agents in the study understand
attitudes as their professional attitude in complying with the professional ethics,
fear towards being penalised by the tax authority and safeguarding their reputation.
In Malaysia, attitudes are also perceived as the feeling of guilt for not complying,
while in New Zealand, attitudes are also associated with fairness, a trade-off
between costs and benefits, and complexity of the tax law.
The significant influence of attitudes in explaining the tax compliance
behaviour of tax agents in this study supports the findings of prior studies such as

374
Bobek and Hatfield (2003), Buchan (2005), Trivedi et al. (2005), Saad (2011),
Langham et al. (2012) and Smart (2012). Interestingly, the interview findings
provide more understanding on how tax agents in this study understand attitudes in
complying with the tax law. The interview findings for instance, raised the concern
over whether complying with the tax law is a public relations exercise as argued by
Doyle et al. (2009), since tax agents fear their reputation would be tarnished if they
do not comply. Support is also present for the argument by Blanthorne and Kaplan
(2008) that complying with the law to a certain extent involves economic factors.
8.2.2.2 Subjective norms and tax compliance behaviour
The findings from the survey on the path coefficient and p-values for
subjective norms, in the case of overstating tax expenses for Malaysia and New
Zealand, suggest that subjective norms are not significant in explaining the
behaviour of tax agents in complying with the tax law. Equally, when the same
model was tested on understating income scenario, the results from the path
coefficient and p-values also suggest that subjective norms are not able to explain
the tax compliance behaviour of tax agents in complying with the tax laws.
The findings result into the rejection of the Hypothesis 5 “Subjective norms
significantly influences tax agents in Malaysia and New Zealand in complying with
the tax laws” in both tax scenarios in this study. This is further supported by the
small effect size of subjective norms on intention in overstating tax expense and
understating income scenarios in this study for both countries.
It is, however, interesting to find that the interview findings on the
influence of subjective norms in complying with the tax laws by tax agents,

375
recorded inconsistent results to the survey. Essentially, tax agents in the interviews
in Malaysia and New Zealand concurred that the influence of referent or important
others (subjective norms) exists in their decision making as to whether or not to
comply with the tax laws. One possible explanation on the inconsistencies of the
findings between the survey and the interviews could be due to the complexity of
the tax scenarios presented in the study. There is a possibility that the survey
respondents in the study did not perceive the moral issues in the tax scenarios
presented in the study as complicated which required them to ask for tax opinions
from important others. This is supported by comments in the interview, where the
participants agreed that the influence of referent or important others is important in
especially complicated tax scenarios.
It is also interesting to note that New Zealand tax agents raised their
concern on the perceptions of peers and reputation of the firm in explaining the
influence of subjective norms in their decision making. Again, this raises the
question of whether complying with the tax law by public accounting practitioners
is associated more with exercising a public relations activity rather than complying
with the tax law itself (Doyle et al., 2009). The survey findings of the study are
consistent with Buchan (2005) who found that subjective norms are not significant
in explaining public accounting practitioners’ ethical intention. The findings of the
interview also support the survey results of Smart (2012) who found that important
referent’s expectations and threat of losing respect from important referents (which
can be translated in this study as perception of peers), as an important factor for
complying with the tax law.

376
8.2.2.3 Perceived behavioural control and tax compliance behaviour
Perceived behavioural control, (PBC), is another variable examined in the
study. The hypothesis H6, “Perceived behavioural control significantly influences
tax agents in Malaysia and New Zealand in complying with the tax laws” was
tested twice, on the overstating tax expense scenario and understating income
scenario.
The path coefficients and p-values for PBC in overstating tax expense
scenario for Malaysia and New Zealand suggest that PBC has no significant
influence on intention. A similar finding was recorded for Malaysia in the case of
understating income but a contradictory result suggests that PBC has moderate
influence on intention in New Zealand for the same case. The findings from the
survey led to the rejection of hypothesis H6 in Malaysia and New Zealand for the
overstating tax expenses scenario. Likewise, H6 was also rejected for Malaysia in
understating income scenario but was accepted in New Zealand.
The results were supported further with the examination on the effect of
PBC on intention. It was found that PBC has small effect on intention in the
overstating tax expenses scenario in Malaysia and New Zealand. A small effect
size was also reported for New Zealand in the understating income scenario with
no effect between PBC and intention recorded in Malaysia for the same tax
scenario. It is interesting to note that while PBC was not significant for both tax
scenarios in Malaysia, a different result was found for New Zealand. One
possibility for the different finding in New Zealand between the two tax scenarios
is that, the understating income scenario involved a cash sale with no records and
thus, the probability of the cash transaction being detected by the tax authority is

377
low. As commented by some interview participants, while the NZIRD is actively
doing audits, their focus has been more on large amounts of money and tax audits
for small businesses are rare. Therefore, there is a possibility that tax agents in the
survey in New Zealand found that they have more control in understating cash
income compared to overstating tax expenses. The survey findings from this study
supported the unfavourable findings of the influence of PBC in complying with the
tax law documented in prior tax research. Bobek and Hatfield (2003), Buchan
(2005), Trivedi et al. (2005), Bobek et al. (2007a), Saad (2011), Langham et al.
(2012) and Smart (2012) all found non-significant influence of PBC on intention
in their studies.
The unfavourable results of the survey on the influence of PBC in tax
compliance in this study could perhaps be explained further by the interview
findings. The interview participants in Malaysia and New Zealand had a common
agreement on the influence of PBC in their decision making. Essentially, they
agreed that they have control in providing advice to their clients but they do not
necessarily have control in the final decision making in complying with the tax
laws. Some interview participants from New Zealand commented that, to a certain
extent, having a good relationship with their clients would help to determine
whether or not they have control in the final decision making. The interview
findings suggest the tax agents’ roles include acting as advocates for their clients.
8.2.3 Ethical sensitivity and tax compliance
Similar to culture and the TPB items, since this study is comparative in
nature, the researcher performed a t-test to answer the third research question of
whether or not tax agents in Malaysia and New Zealand have the same level of

378
perceptions with regard to the dimensions in MES which was used to measure
ethical sensitivity. The results from the t-test indicate that tax agents in Malaysia
and New Zealand differed in perceiving moral equity, relativism and egoism
dimensions, but had similar views on utilitarianism and contractualism in
overstating tax expense scenario.
Given these results, the hypothesis H3a “There is no significance difference
in the perceptions between tax agents in Malaysia and New Zealand with regard to
the dimensions of MES in overstating tax expense scenario” was not fully
supported.
When tested on understating income scenario, the t-test results suggest that
the hypothesis H3b stating “There is no significance difference in the perceptions
between tax agents in Malaysia and New Zealand with regard to the dimensions of
MES in understating income scenario” was rejected.
In the understating income scenario, the results revealed that tax agents in
Malaysia and New Zealand had different perceptions towards MES dimensions.
Overall, the mean values in both scenarios suggest that tax agents in New Zealand
have higher ethical sensitivity compared to tax agents in Malaysia. One possible
reason is because recent tax court decisions in New Zealand seem to favour the
NZIRD (Elliffe, 2011). This is supported by responses from the interview
participants in New Zealand that the aggressiveness of NZIRD in ensuring tax
compliance to a certain extent influences them to comply with the tax laws.
Prior studies using MES suggest that MES is multidimensional. Similar to
culture, in this study MES was also subject to first order factor model assessment

379
and later, as a second order factor model, using repeated indicator approach for
both tax scenarios applied in the study. The results from the second order factor
model confirmed that MES was formed by multidimensional constructs in
Malaysia and New Zealand for both tax scenarios in the study. Thus, this enabled
acceptance of hypothesis H7 “Tax agents in Malaysia and New Zealand perceive
ethical sensitivity as a multidimensional concept”.
The relationship between ethical sensitivity and intention was examined
from the strength of the path coefficient and the p-values. The results from the
structural model in the overstating tax expenses scenario show that ethical
sensitivity was significant, but indicated a weak relationship in Malaysia but a
significant moderate relationship between ethical sensitivity and intention in New
Zealand. In the understating income scenario, ethical sensitivity was not significant
in Malaysia but had a strong relationship with intention in New Zealand.
As a result, it could be suggested that hypothesis H8, “Ethical sensitivity
significantly influences tax agent in Malaysia and New Zealand in complying with
the tax law” was accepted for Malaysia and New Zealand in the case of overstating
tax expenses, and also accepted in New Zealand for the understating income
scenario (but rejected in Malaysia). When examined further, ethical sensitivity had
only small effect on intention in both tax scenarios in the study for both countries.
The inconsistent findings in Malaysia between overstating tax expenses and
understating income scenarios support the argument in prior accounting studies
such as Cohen et al. (1993) and Buchan (2005), that MES is situation specific.
While ethical sensitivity is significant for both scenarios in New Zealand, the levels

380
of significance (p-values of 0.001 for understating income and 0.05 for overstating
expenses) are different, indicating that the results from applying MES depend on
the type of situations. The findings from the survey support the argument by
Collins (2000) on the influence of ethical sensitivity on accountants in situations
involving violation of laws. The survey findings, however, are not consistent with
Buchan (2005) who found no support for ethical sensitivity on public accountants’
ethical intention.
The interview findings to a certain extent clarify the survey findings of the
study on the influence of ethical sensitivity in tax compliance behaviour of tax
agents. Interview participants in Malaysia and New Zealand indicated common
agreement that ethical sensitivity is helpful in tax agents’ compliance behaviour
with the tax laws. They also concurred that experience is an important factor to
develop ethical sensitivity. When probed further, interview participants in Malaysia
explained that ethical sensitivity is helpful in avoiding unethical conduct in their
tax practices and helpful in identifying any potential allowable tax claims. In New
Zealand, ethical sensitivity is beneficial in guiding tax agents on the type of advice
given to their clients based on the clients risk profiles. Interestingly, ethical
sensitivity does not necessarily lead to ethical behaviour, as commented by some
interview participants in New Zealand.
8.2.4 Tax compliance behaviour of tax agents – Some selected factors
The tax compliance behaviour of tax agents in this study was examined
using the conceptual model developed in Chapter 3 of this thesis, and tested on two
tax scenarios of overstating tax expenses and understating income in Malaysia and
New Zealand. The R–squares of the structural model for overstating tax expenses

381
scenario in Malaysia of 0.78 and 0.72 in New Zealand, as well as 0.67 in Malaysia
and 0.58 in New Zealand for the understating income scenario, suggest that the
proposed models have the potential to explain the tax compliance behaviour of tax
agents in the study in both Malaysia and New Zealand.
In the overstating tax expenses scenario in Malaysia, it was found that
attitude was a significant factor in explaining the tax agents’ compliance behaviour
with tax laws, followed by ethical sensitivity. The study, however, found no
support for subjective norms and perceived behavioural control in tax agents’
compliance behaviour in Malaysia. In New Zealand, similar to Malaysia, attitude
was found to be the most significant factor influencing tax agents’ tax compliance
behaviour, followed by ethical sensitivity and culture.
With regard to understating income, attitude was found to be the only
significant factor in explaining tax agents’ compliance behaviour with tax laws and
no support for subjective norms, perceived behavioural control, ethical sensitivity
and culture was recorded in Malaysia. In New Zealand, attitude and ethical
sensitivity were the most significant factors in influencing the tax agents’ ethical
decision making, followed by culture and perceived behavioural control. Similar to
Malaysia, no support was recorded for subjective norms in New Zealand for the
second scenario.
Interestingly, while there are some differences between tax agents in
Malaysia and New Zealand in explaining the tax compliance behaviour of tax
agents in the study, there are also similarities. Regardless of countries and tax
scenarios presented in the study, it is interesting to note that attitude has recorded

382
consistent significant results in explaining the tax agents’ tax compliance
behaviour. Likewise, subjective norms were not significant in both countries for
both scenarios. The inconsistent results on ethical sensitivity between tax scenarios
within Malaysia, and between Malaysia and New Zealand in the understating
income scenario, support the argument by Jones (1991) that being ethical is
situation specific.
The tax compliance behaviour of tax agents was further explained in the
interviews with some tax agents in Malaysia and New Zealand which produced
more interesting findings. For instance, while attitude was found to be important
from the survey, the interview clarified further the meaning of attitude as
understood by the tax agents in the interview. The attitude, for instance, was
translated as complying with the professional ethics, their fear towards being
penalised and audited, and their fear towards their reputation being tarnished as a
result of non-compliance. While the survey findings indicate that behavioural
factors could explain the tax compliance behaviour of tax agents in the study, the
interview findings further suggest that economic factors were also relevant in
understanding tax agents’ ethical decision making. Overall, the findings support the
suggestions by Alley and James (2006), Blanthorne and Kaplan (2008) and Smart
(2012), that economic and non-economic factors are relevant in influencing the
ethical decision making of individuals whether or not to comply with the tax laws.
8.3 Contributions of the study
This study has attempted to understand the tax compliance behaviour of tax
agents in Malaysia and New Zealand using selected factors. The study extends the
TPB with ethical sensitivity and culture. The researcher is of the view that this

383
study has contributed to tax compliance studies as well as the accounting
professions in a number of ways.
8.3.1 Contribution to tax literature
First, notwithstanding the calls for more cross-cultural studies in tax
settings (Richardson and Sawyer, 2001; Singh, 2003; Yong, 2011), tax studies in
cross-cultural settings especially in Asia-Pacific region remain scarce. One recent
example is a study by Saad (2011) which compared the individual taxpayers in
Malaysia and New Zealand. To the best knowledge of the researcher, this study is
the first to compare tax agents in Malaysia and New Zealand, and it assists with
providing some insights into the tax compliance behaviour of tax agents between
two countries which share some similarities but have several differences. It is
interesting to observe that the findings from the study reveal some similarities and
differences in the tax compliance behaviour of tax agents in these two tax
jurisdictions.
Second, prior studies such as Richardson and Sawyer (2001) suggest there
are various factors which are important in understanding tax compliance behaviour.
Some factors were selected for this study on the following basis:
(1) The TPB has been proven to explain individual behaviour in social science
research. However, the application of the TPB in tax studies is still limited. The
researcher believes this study adds to the scarce literature on the TPB in tax
studies which in this study, is not fully supported.
(2) The use of Hofstede’s (1980) National Cultural Dimensions, as suggested by
Tsakumis et al. (2007) and Yong (2011), is still largely absent in tax studies. As

384
a response to this suggestion, this study employed Hofstede’s (1980) National
Cultural Dimensions to examine whether culture has any influence on the
ethical decision making of tax agents in this study. The findings, overall, are
inconclusive and add to the literature on the mixed findings of the influence of
culture in tax compliance behaviour.
(3) While ethical sensitivity is important, only few studies have attempted to
address the issue of ethical sensitivity of tax agents (Tan & Sawyer, 2003; Tan,
2006). At the same time, Jackson and Milliron (1986) and Richardson and
Sawyer (2001) raised the concern of how to measure ethics in tax studies. This
study attempts to address these issues by incorporating the ethical sensitivity of
tax agents into the model to understand their tax compliance behaviour and
measured this ethical sensitivity using a tool, MES, which has been widely
accepted in marketing studies but is still limitedly applied in accounting (and
tax) context. To the knowledge of the researcher, this study is the first to
examine ethical sensitivity of tax agents in Malaysia and New Zealand using
MES in tax context. The findings support the MES to explain ethical sensitivity
of tax agents in the study and provide some support on the influence of ethical
sensitivity and tax compliance behaviour of tax agents in the study.
Third, with regard to the research methods applied in the study, the
researcher is of the opinion that this study has the potential to contribute in several
ways explained as follows:
(1) To ensure tax studies contribute to the body of knowledge, Oats (2012) suggest
tax researchers should venture into other research paradigms and do not be

385
dogmatic about the positivist research paradigm. While a mixed-method
approach has been widely implemented in other social science research areas of
study (Creswell and Plano Clark, 2011), the mixed-method approach is still not
widely explored in tax studies (McKerchar, 2010). Thus, applying pragmatism
as the research paradigm, the researcher used the quantitative (survey) and
qualitative (interview) methods to answer the research questions of the study. It
is interesting to note that the interview findings have contributed to richer
understandings on the tax compliance behaviour of tax agents in the study.
Furthermore, the adoption of a mixed-method approach in this study could
provide another example of how to apply mixed-method approach in a tax
study, other than studies by Saad (2011), Mohd Isa (2012) and Mohd Ali (2013).
(2) The use of structural equation modelling (SEM) has been widely supported in
other social science research areas of study such as marketing and information
systems. However, the use of SEM in tax studies is still limitedly explored,
notwithstanding its potential to explain complex relationships among variables
which frequently exist in tax studies. The application of SEM in this study,
namely Partial Least Squares (PLS), allows for a single, comprehensive and
systematic analysis to be performed on all variables simultaneously. The use of
SEM also allows for two variables, culture and ethical sensitivity, to be tested as
a second order factor model to confirm their multidimensionality
simultaneously.
(3) Common method bias is a potential threat in behavioural-type studies which
employ self-reported survey (Podsakoff et al., 2003). Hair et al. (2011), Chin et
al. (2012) and Hair et al. (2012) also suggest the importance of checking for

386
common method bias in studies applying SEM. This study provides an example
of how to check for common method bias in tax studies which has been ignored
or only lightly mentioned in prior tax studies. While common method bias is not
a serious threat in this study, it is not fully guaranteed that the survey findings
are free from any bias. Likewise, for studies using surveys and involving the
assessment of ethical behaviour as frequently seen in tax studies, it is important
to check for social desirability bias since social desirability bias can become a
threat to the robustness of the findings. Notwithstanding its importance, prior
tax studies using surveys and involving the decision of whether or not to comply
with the tax laws are likely to ignore the examination of social desirability bias.
This study provides an example of how to check for social desirability bias by
using the measures adopted from Cruz et al. (2000). The findings suggest that
social desirability bias exists in both scenarios tested in the study for Malaysia
and New Zealand. The presence of social desirability bias is consistent with
findings from prior studies in accounting and tax context such as by Cruz et al.
(2000) and Buchan (2005), thus underlying the importance of including social
desirability bias measures in accounting and tax studies.
8.3.2 Contribution to the accounting profession
Based on the findings of the study, the researcher has the opinion that the
findings could contribute to further understanding of the tax compliance behaviour
of accounting practitioners, in this case the tax agents in public accounting services
while they perform their roles. The findings indicate that the tax compliance
behaviour of tax agents in this study in Malaysia and New Zealand was based on
the moral intensity of the tax issues. Therefore, the compliant behaviour of tax

387
agents in this study was motivated in part by the economic factors such as the
amount of tax involved, trade-off between cost and benefits, and the amount of
risks considered as acceptable by the tax agents and their clients.
In addition, their concern on their reputation and the complexity of the tax
laws also contributes to their decision-making. It is interesting also to note that
attitude towards intention was found to be the most significant factor in both
scenarios presented in the study for tax agents in Malaysia and New Zealand. The
findings from the second order factor model in ethical sensitivity also revealed that
tax agents’ ethical intention was motivated the most by the perception of moral
equity of an action. This suggests that tax agents in this study put high
consideration of what was perceived as morally right, fairness and justice in their
ethical decision making.
For professional bodies in Malaysia and New Zealand, the findings also
provide some insights into the ethical behaviour of their members. The findings
from this study and other prior tax studies involving tax agents, collectively, could
be useful in promoting ethical behaviour among their members. Training provided
by professional bodies to their members is essentially focused on the technical
aspect of accounting issues. One way is to incorporate the non-technical accounting
elements in the training of their members, such as emphasizing what is morally
right, the concept of fairness and justice, in their decision making.

388
8.4 Limitations of the study
Notwithstanding the potential contributions of this study, it also has some
limitations which need to be considered in interpreting its findings. It is important
to note that the study recorded low response rates in both countries. However, the
number of useable responses was adequate for the researcher to perform the
relevant statistical analysis. The low response rates could possibly be due to the
method of distributing the questionnaire. In Malaysia, the researcher requested the
addressee to distribute another two sets of the questionnaire survey to their
colleagues. However, using this method does not allow the researcher to trace the
true number of questionnaires being distributed. In New Zealand, the higher
internet security practised by organizations may result into some emails that were
sent to tax agents considered to be spam emails. In addition, tax agents are busy
people and may not have the time to participate in the study. These factors could
possibly contribute to the understated low response rates for the study.
There is a concern that the observed samples do not truly represent the
population of tax agents in the country as explained earlier in sub-section 5.1.3. For
instance, the respondents came mainly from small size public accounting firms and
only a small number came from ‘Big Four’ public accounting firms. Pierce and
Sweeney (2009) for example suggest that firm size has significant influence on the
ethical decision making of accountants. One possible reason could be due to the
presence of selection bias as a result from using a cross between systematic random
sampling and snowballing in Malaysia, and systematic random sampling in New
Zealand. In view of this, generalisations of the findings from this study need to be
performed with caution. However, given the limited studies on the ethical decision

389
making of tax agents in Malaysia and New Zealand, the findings from this study
are still useful in understanding their compliance behaviour while performing their
engagement roles.
Notwithstanding that potential nonresponse bias and common method bias
are not serious threats to the study, it cannot be fully guaranteed that this study is
free from any bias, considering that this study had low response rates. It is also
noteworthy to mention that the presence of social desirability bias in this study
suggests that the findings need to be interpreted with caution since tax agents in the
study have the tendency to perceive themselves as being more ethical compared to
their peers.
Some of the loadings for the measures used in this study from the PLS
analysis were marginally below the suggested threshold values. However,
considering that this study involved some newly developed measures, it is
acceptable to retain the low loadings measure for content validity purpose and to
avoid using a single measure for the constructs which could create more bias in the
PLS results.
8.5 Future research
The explanatory power shown by the model proposed in this study indicates
the potential of the model to explain the tax compliance behaviour of tax agents.
Thus, testing the model in other tax jurisdictions could be a worthwhile effort to
test the stability of the model and allow for comparisons with other countries to be
made. In addition, the use of a mixed-method approach in this study and cross-
cultural based type of research, has the potential to offer a better understanding of

390
tax compliance behaviour of tax agents. For instance, the qualitative findings from
the interviews revealed some other interesting factors such as the possibility of
economic factors influencing tax agents’ decision making. The comparison
between Malaysia and New Zealand offers some similarities and differences of
factors that influence tax agents in complying with the tax laws. As a result, future
tax studies should be encouraged to adopt a mixed-method approach and venture
into cross-cultural research.
In this study, the proposed model was tested on two tax scenarios involving
overstating tax expense and understating income, which, according to Elliffe
(2011), represent the core aspects of the tax gap in a tax system. The findings,
however, suggest that being ethical is situation specific. Therefore, to add more to
our understanding on tax compliance behaviour of tax agents, future studies should
test the proposed model on other tax scenarios. Bobek and Robin (2007), for
instance, have identified some tax scenarios which could potentially cause an
ethical dilemma to tax agents, which would be worthwhile to be tested further
using the proposed model of this study. The complexity of the ethical dilemma
could possibly provide different responses to the tax compliance behaviour of tax
agents. As evidenced in this study, the survey results indicate that subjective norms
were not significant for both scenarios in both countries. The interview findings,
however, suggest that tax agents only refer to important others or referent others in
complicated tax issues.
Since attitude was found to be the most significant factor in influencing tax
agents in their decision making, future studies could examine the antecedents of
attitude. The interview findings, for instance, revealed that tax agents in the study

391
associated their attitudes with economic factors, such as the fear of being penalised,
the probability of being audited, the consideration for cost and benefits, and the
amount of tax involved. In addition, attitudes towards ensuring their reputation
among peers, the public and accounting profession were also addressed during the
interviews. Combining economic and non-economic factors could possibly reveal
more interesting information on the compliance behaviour of tax agents which
could be explored further in future studies.


393
REFERENCES
Abdul Aziz, S., & Md. Idris, K. (2012). The Determinants of Tax E-filing among
Tax Preparers in Malaysia. World Journal of Social Sciences, 2(3), 182-
188.
Abdul-Jabbar, H., & Pope, J. (2009). Tax attitudes and compliance among small
and medium enterprises in Malaysia. New Zealand Journal of Taxation Law
and Policy, 15(3), 198-222.
Abdullah, A. (1996). Going Global: Cultural Dimensions in Malaysian
Management. Kuala Lumpur: Malaysian Institute of Management.
Accountants and Tax Agents Institute of New Zealand. (2013). Institute's
Philosophy. Retrieved 9 January 2013, 2013, from http://www.tinz.co.nz.
Ajzen, I. (1991). The Theory of Planned Behaviour. Organizational Behaviour and
Human Decision, 50, 179-221.
Ajzen, I. (2006). Constructing a TPB Questionnaire: Conceptual and
Methodological Consideration. Retrieved 21 March, 2011, from
http://www.people.umass.edu/aizen.
Ajzen, I. (2011). The Theory of Planned Behaviour: Reactions and reflections.
Psychology & Health, 26(9), 1113-1127.
Ajzen, I., & Fishbein, M. (1980). Understanding attitudes and predicting social
behavior. Englewood Cliffs, NJ: Prentice-Hall.
Alley, C., & James, S. (2006). Research into economic and behavioural approaches
in tax compliance. In A. Sawyer (Ed.), Taxation Issues in Twenty-First
Century (pp. 3-14). Christchurch: The Centre for Commercial and
Corporate Law, School of Law.
Allingham, M. G., & Sandmo, A. (1972). Income tax evasion: a theoretical
analysis. Journal of Public Economics, 1, 323-328.
Alm, J. (1991). A perspective on the experimental analysis of taxpayer reporting.
The Accounting Review, 66, 577-593.
Alm, J., Sanchez, I., & De Juan, A. (1995). Economic and noneconomic factors in
tax compliance. KYKLOS, 48, 13-18.
Alm, J., & Torgler, B. (2006). Culture differences and tax morale in the United
States and Europe. Journal of Economic Psychology, 27, 224-246.

394
Alm, J., & Torgler, B. (2011). Do ethics matter? Tax compliance and morality.
Journal of Business Ethics, 101(4), 635-651.
Alvesson, M., & Deetz, S. (2000). Doing Critical Management Research. SAGE:
Thousand Oaks, California.
Alzola, M. (2011). The reconciliation project: Separation and integration in
business ethics research. Journal of Business Ethics, 99, 19-36.
Anderson, J. C., & Gerbing, D. W. (1988). Structural equation modeling in
practice: A review and recommend two-step approach. Psychological
Bulletin, 103, 411-423.
Anderson, S. E., & Cuccia, A. D. (2000). A closer examination of the economic
incentives created by tax preparer penalties. The Journal of American
Taxation Association, 22(1), 56-77.
Andreoni, J., Erard, B., & Feinstein, J. (1998). Tax Compliance. Journal of
Economic Literature, 36(2), 818-860.
Armitage, C. J., & Christian, J. (2003). From attitudes to behaviour: Basic and
applied research on the Theory of Planned Behaviour. Current Psychology:
Development, Learning, Personality, Social, 22(3), 187-195.
Armitage, C. J., & Conner, M. (2001). Efficacy of the Theory of Planned
Behaviour: A meta-analytic review. British Journal of Social Psychology,
40, 471-499.
Armstrong, J. S., & Overton, T. S. (1977). Estimating nonresponse bias in mail
surveys. Journal of Marketing Research, 14(3), 396-396.
Attwell, R. L., & Sawyer, A. J. (2001). The Ethical Attitude of New Zealand
Practitioners - Still Barely Passing. New Zealand Journal of Taxation Law
and Policy, 7(2), 111-146.
Axinn, C. N., Blair, M. E., Heorhiadi, A., & Thach, S. V. (2004). Comparing
ethical ideologies across cultures. Journal of Business Ethics, 54(2), 103-
119.
Ayres, F. L., & Ghosh, D. (1999). Guest Editorial: Research in ethics and
economic behavior in accounting. Journal of Accounting and Public Policy,
18, 335-338.
Bailey, J. (2008). First steps in qualitative data analysis: transcribing Family
Practice Advance, 25(2), 127-131.

395
Bame-Aldred, C. W., Cullen, J. B., Martin, K. D., & Parboteeah, K. P. (2013).
National culture and firm-level tax evasion. Journal of Business Research,
66(3), 390-396.
Baskerville, R. F. (2005). A research note: the unfinished business of culture.
Accounting, Organizations and Society, 30, 389-391.
Beauchamp, T. L., Bowie, N. E., & Arnold, D. G. (2009). Ethical Theory and
Business (8th ed.). Upper Saddle River, New Jersey: Pearson Education Inc.
Becker, G. S. (1968). Crime and Punishment: An Economic Approach. Journal of
Political Economy, 76(2), 169-217.
Becker, J.M., Klein, K., & Wetzels, M. (2012). Hierarchical latent variable models
in PLS-SEM: Guidelines for using reflective-formative type models. Long
Range Planning, 45, 359-394.
Berry, J. W. (1999). Emics and Etics: A Symbiotic Conception. Culture
Psychology, 5(2), 165-171.
Blanthorne, C., & Kaplan, S. (2008). An egocentric model of the relations among
the opportunity to underreport, social norms, ethical beliefs and
underreporting behavior. Accounting, Organizations and Society, 33(1),
684-703.
Blumenthal, M., & Christian, C. (2004). Tax Preparers. In H. J. Aaron & J.
Slemrod (Eds.), The Crisis in Tax Administration (pp. 201-217).
Washington, D.C: Brookings Institution Press.
Bobek, D. D., & Hatfield, R. C. (2003). An investigation of the Theory of Planned
Behavior and the role of moral obligation in tax compliance. Behavioral
Research In Accounting, 15, 13-38.
Bobek, D. D., Hatfield, R. C., & Wentzel, K. (2007a). An investigation of why
taxpayers prefer refunds: A Theory of Planned Behavior approach. Journal
of the American Taxation Association, 29(1), 93-111.
Bobek, D. D., Roberts, R. W., & Sweeney, J. T. (2007b). The social norms of tax
compliance: evidence from Australia, Singapore and the United States.
Journal of Business Ethics, 74, 49-64.
Bobek, D. D., & Robin, R. R. (2007). An experiential investigation of tax
professionals' ethical environments. The Journal of American Taxation
Association, 29(2), 63-84.

396
Bollen, K. A., & Lennox, R. (1991). Conventional wisdom on measurement: A
structural equation perspective. Psychological Bulletin, 110(2), 305-314.
Brand, V. (2009). Empirical business ethics research and paradigm analysis.
Journal of Business Ethics, 86(4), 429 - 449.
Braun, V., & Clarke, V. (2006). Using thematic analysis in psychology. Qualitative
Research in Psychology, 3(2), 77-101.
Brooking, T. (2004). The History of New Zealand. Connecticut: Greenwood Press.
Bryman, A., & Bell, E. (2011). Business Research Methods. New York: Oxford
University Press.
Buchan, H. F. (2005). Ethical decision making in the public accounting profession:
an extension of Ajzen’s Theory of Planned Behavior. Journal of Business
Ethics, 61, 165-181.
Burns, J. O., & Kiecker, P. (1995). Tax Practitioner Ethics: An Empirical
Investigation of Organizational Consequences. The Journal of American
Taxation Association, 17(2), 20-35.
Burton, M., & Dabner, J. (2009). The limits of the responsive regulation model:
What really defines the relationship between the New Zealand Inland
Revenue and tax practitioners. New Zealand Journal of Taxation Law and
Policy, 15(2), 111-132.
Carnes, G. A., Harwood, G. B., & Sawyers, R. B. (1996). A comparison of tax
professionals, individuals and group decision when resolving ambiguous
tax questions. The Journal of American Taxation Association, 18(2), 1-18.
Casali, G. L. (2011). Developing a multidimensional scale for ethical decision
making. Journal of Business Ethics, 104, 485-497.
Cenfetelli, R. T., & Bassellier, G. (2009). Interpretation of formative measurement
in information systems research. MIS Quarterly, 33(4), 689-707.
Chan, C. W., Troutman, C. S., & O'Bryan, D. (2000). An expanded model of
taxpayer compliance: Empirical evidence from USA and Hong Kong.
Journal of International Accounting Audit and Taxation, 9(2), 83-103.
Chanchani, S., & MacGregor, A. (1999). A synthesis of cultural studies in
accounting. Journal of Accounting Literature, 18, 1-30.
397
Chang, M. K. (1998). Predicting unethical behavior: A comparison of the Theory
of Reasoned Action and the Theory of Planned Behavior. Journal of
Business Ethics, 17(16), 1825-1834.
Chartered Tax Institute of Malaysia. (2010). President's Statement. Retrieved 19
March, 2010, from http://www.ctim.org.my.
Chattopadhyay, S., & Das-Gupta, A. (2002). The compliance costs of the personal
income tax and its determinants. New Delhi: National Institute of Public
Finance and Policy.
Chau, G., & Leung, P. (2009). A critical review of Fischer tax compliance model:
A research synthesis. Journal of Accounting and Taxation, 1(2), 34-40.
Chin, W. W. (2010). How to write up and report PLS analyses. In V. E. Vinzi, W.
W. Chin, J. Henseler & H. Wang (Eds.), Handbook of partial least squares:
Concepts, methods and applications (pp. 655-690). Berlin: Springer.
Chin, W. W., & Gopal, A. (1995). Adoption intention in GSS: Relative importance
of beliefs. The Data Base for Advances in Information Systems, 26(2 & 3),
42-64.
Chin, W. W., & Newsted, P. R. (1999). Structural equation modeling analysis with
small samples using partial least squares. In R. Hoyle (Ed.), Statistical
strategies for small sample research (pp. 307-341). Thousand Oaks, CA:
Sage Publications.
Chin, W. W., Thatcher, J. B., & Wright, R. T. (2012). Assessing Common Method
Bias: Problems With The ULMC Technique. MIS Quarterly, 36(3), 1003-
1019.
Cohen, J. (1988). Statistical Power Analysis for the Behavioral Sciences (2nd ed.).
Hillsdale, NJ: Lawrence Erlbaum Associates.
Cohen, J. R., Pant, L. W., & Sharp, D. J. (1993). A validation and extension of a
Multidimensional Ethics Scale. Journal of Business Ethics, 12(1), 13-26.
Cohen, J. R., Pant, L. W., & Sharp, D. J. (1996). A methodological note on cross-
cultural accounting ethics research. The International Journal of
Accounting, 31(1), 55-66.
Collins, D. (2000). The quest to improve human condition: the first 1500 articles
published in Journal of Business Ethics. Journal of Business Ethics, 26(1),
1-73.

398
Collins, K. M. T., Onwuegbuzie, A. J., & Jiao, Q. G. (2007). A mixed methods
investigation of mixed methods sampling designs in social and health
science research. Journal of Mixed Methods Research, 1(3), 267-294.
Conway, J. M., & Lance, C. E. (2010). What Reviewers Should Expect From
Authors Regarding Common Method Bias in Organizational Research.
Journal Business Pscyhology, 25, 325-334.
Cox, S. P., & Eger, R. J. (2006). Procedural Complexity of Tax Administration:
The Road Fund Case. Journal of Public Budgeting, Accounting & Financial
Management, 18(3), 259-283.
Coyne, I. T. (1997). Sampling in qualitative research. Purposeful and theoretical
sampling: merging or clear boundaries? Journal of Advanced Nursing,
26(3), 623-630.
CPA Australia. (2013). New opportunity for New Zealand accountants to join CPA
Australia. Retrieved 18 November, 2013, from
http://www.cpaaustralia.com.au/news.
Crane, A., & Matten, D. (2007). Business Ethics. New York: Oxford University
Press.
Creswell, J. W. (2009). Research Design: Qualitative, Quantitative and Mixed
Methods Approaches. Thousand Oaks: Sage Publications Inc.
Creswell, J. W., & Miller, D. L. (2000). Determining Validity in Qualitative
Inquiry. Theory into Practice, 39(3), 124-130.
Creswell, J. W., & Plano Clark, V. L. (2011). Designing and conducting mixed
methods research. Thousand Oaks, California: Sage Publications Inc.
Crowne, D. P., & Marlowe, D. (1960). A New Scale of Social Desirability
Independent of Psychopathology. Journal of Consulting Psychology, 24,
349-354.
Cruz, C. A., Shafer, W. E., & Strawser, J. R. (2000). A multidimensional analysis
of tax practitioners' ethical judgments. Journal of Business Ethics, 24(3),
223-244.
De Mooij, M. (1998). Global marketing and advertising: Understanding cultural
paradoxes. Thousand Oaks, California: Sage.
De Mooij, M. (2004). Consumer behavior and culture: Consequences of global
marketing and advertising. Thousand Oaks, CA: Sage.

399
Department of Statistics of Malaysia. (2010, 24 December 2012). Population
distribution and basic demographic characteristic report 2010. Retrieved 27
December, 2012, from http://www.statistics.gov.my.
Devos, K. (2012). The impact of tax professionals upon the compliance behavior of
Australian individual taxpayers. Revenue Law Journal, 22(1), 1-26.
Diamantopoulos, A., Sarstedt, M., Fuchs, C., Wilczynski, P., & Kaiser, S. (2012).
Guidelines for choosing between multi-item and single-item scales for
construct measurement: a predictive validity perspective. Journal of the
Academy Marketing Science, 40, 434-449.
Diamantopoulos, A., & Siguaw, J. A. (2006). Formative versus reflective
indicators in organizational measure development: A comparison and
empirical illustration. British Journal of Management, 17(4), 263-282.
Diamantopoulos, A., & Winklhofer, H. M. (2001). Index construction with
formative indicators: An alternative to scale development. Journal of
Marketing Research, 38(2), 269-277.
Dilley, P. (2000). Conducting successful interviews: Tips for intrepid research.
Theory into Practice, 39(3), 131-137.
Dillman, D. A., Smyth, J. D., & Christian, L. M. (2009). Internet, mail and mixed-
mode surveys: The tailored design method. Hoboken, New Jersey: John
Wiley and Sons Inc.
Doyle, E., Frecknall Hughes, J., & Summers, B. (2012). Moral Reasoning in Tax
Practice. In L. Oats (Ed.), Taxation: A Fieldwork Research Handbook.
Oxon: Routledge.
Doyle, E., Frecknall-Hughes, J., & Glaister, K. W. (2012). Ethics in tax practice:
An exploratory analysis. In L. Oats (Ed.), Taxation: A Fieldwork Research
Handbook. Oxon: Routledge.
Doyle, E. M., Frecknall Hughes, J., & Glaister, K. W. (2009). Linking Ethics and
Risk Management in Taxation: Evidence from an Exploratory Study in
Ireland and the UK. Journal of Business Ethics, 86(1), 177-198.
Duarte, P. A. O., & Raposo, M. L. B. (2010). A PLS model to study brand
preference: An application to the mobile phone market. In V. Esposito
Vinzi, W.W. Chin, J. Henseler & H. Wang (Eds)., Handbook of Partial
Least Squares: Concepts, methods and applications (pp. 449-485). Berlin:
Springer.

400
Dubin, J. A., Graetz, M. J., Udell, M. A., & Wilde, L. L. (1992). The Demand for
Tax Return Preparation Services. The Review of Economics and Statistics,
74(1), 75-82.
Elliffe, C. (2011). The thickness of a prison wall-when does tax avoidance become
a criminal offence? New Zealand Business Law Quarterly, 17(4), 441-446.
Emerson, T. L. N., Conroy, S. J., & Stanley, C. W. (2007). Ethical Attitudes of
Accountants: Recent Evidence from a Practitioners' Survey. Journal of
Business Ethics, 71(1), 73-87.
Emery, M., Hooks, J., & Stewart, R. (2002). Born at the wrong time? An oral
history of women professional accountants in New Zealand. Accounting
History, 7(2), 7-34.
Erard, B. (1993). Taxation with representation: An analysis of the role of tax
practitioners in tax compliance. Journal of Public Economics, 52, 163-197.
Eriksen, K., & Fallan, L. (1996). Tax knowledge and attitudes towards taxation: A
report on a quasi-experiment. Journal of Economics Psychology, 17(3),
387-402.
Evans, C. (2003). Studying the studies: An overview of recent research into
taxation operating costs. e Journal of Tax research, 1(1), 64-92. Eynon, G.,
Hill, N. T., & Stevens, K. T. (1997). Factors that influence the moral
reasoning abilities of accountants: implications for universities and the
profession. Journal of Business Ethics, 16, 1297-1309.
Feilzer, M. Y. (2010). Doing Mixed Methods Research Pragmatically: Implications
for the Rediscovery of Pragmatism as a Research Paradigm. Journal of
Mixed Methods Research, 4(1), 6-16.
Ferrell, O. C., & Gresham, L. G. (1985). A contingency framework for
understanding ethical decision making in marketing. Journal of Marketing,
49(3), 87-96.
Field, A. (2009). Discovering Statistics Using SPSS (3rd ed.). London: SAGE
Publications Ltd.
Fischer, C. M., Wartick, M., & Mark, M. (1992). Detection probability and
taxpayer compliance: A review of the literature. Journal of Accounting
Literature, 11, 1-46.
Fishbein, M., & Ajzen, I. (2010). Predicting and changing behavior. New York:
Taylor and Francis Group.

401
Fisher, R. (2010). Tax agent registration and regulation: A cross-Tasman contrast.
New Zealand Journal of Taxation Law and Policy, 16(4), 395-416.
Fontaine, R., & Richardson, S. (2003). Cross-cultural research in Malaysia. Cross
Cultural Management, 10(2), 75-89.
Foo, B., & Richards, C. (2004). English in Malaysia. RELC Journal, 35(2), 229-
240.
Fornell, C., & Larcker, D. F. (1981). Evaluating structural equation models with
unobserved variables and measurement error. Journal of Marketing
Research, 18, 39-50.
Frecknall-Hughes, J., & Moizer, P. (2005). Taxation and ethics In M. Lamb, A.
Lymer, J. Freedman & S. James (Eds.), Taxation: An Interdisciplinary
approach (pp. 125-137). New York: Oxford University.
Gaur, A. S., & Gaur, S. S. (2006). Statistical Methods for Practice and Research: A
guide to data analysis using SPSS. New Delhi: Response Books.
Gefen, D., Rigdon, E. E., & Straub, D. (2011). Editor's comments: An update and
extension to SEM guidelines for administrative and social science research.
MIS Quarterly, 35(2), iii-xiv.
Gefen, D., Straub, D. W., & Boudreau, M.-C. (2000). Structural equation modeling
and regression: Guidelines for research practice. Communications of the
Association for Information Systems, 4, 1-76.
Gendron, Y., Suddaby, R., & Iam, H. (2006). An examination of the ethical
commitment of professional accountants to auditor independence. Journal
of Business Ethics, 64, 169-193.
Gernon, H., & Meek, G. K. (2001). Accounting: An International Perspective (5th
ed.). New York: Irwin-McGraw Hill.
Goodwin, J., & Goodwin, D. (1999). Ethical judgment across cultures: a
comparison between business students from Malaysia and New Zealand.
Journal of Business Ethics, 18(3), 267-281.
Gotz, O., Liehr-Gobbers, K., & Krafft, M. (2010). Evaluation of structural equation
models using the partial least squares (PLS) approach. In V. Espositio
Vinzi, W. W. Chin, J. Henseler & H. Wang (Eds.), Handbook of partial
least squares: Concepts, methods and applications. Berlin: Springer.
Grafton, J., & Lillis, A. M. (2011). Mixed Methods Research in Accounting.
Qualitative Research in Accounting and Management, 8(1), 5-21.

402
Gray, S. J. (1988). Towards a theory of cultural influence on the development of
accounting systems internationally. Abacus, 24, 1-15.
Guest, G., Bunce, A., & Johnson, L. (2006). How many interviews are enough? An
experiment with data saturation and variability. Field Methods, 18(1), 59-
82.
Gupta, R. (2006). Perceptions of tax evasion as a crime: Evidence from New
Zealand. New Zealand Journal of Taxation Law and Policy, 12(3), 199-223.
Gupta, R., & McGee, R. W. (2010). A comparative study of New Zealanders'
opinion on the ethics of tax evasion: Students v Accountants. New Zealand
Journal of Taxation Law and Policy, 16(1), 47-84.
Haenlein, M., & Kaplan, A. M. (2004). A Beginner's Guide to Partial Least
Squares Analysis. Understanding Statistics, 3(4), 283-297.
Hair, J. F., Black, W. C., Babin, B. J., & Anderson, S. E. (2010). Multivariate Data
Analysis. Upper Saddle River, NJ: Prentice-Hall.
Hair, J. F., Ringle, C. M., & Sarstedt, M. (2011). PLS-SEM: Indeed a silver bullet.
Journal of Marketing Theory and Practice, 19(2), 139-151.
Hair, J. F., Sarstedt, M., & Ringle, C. M. (2012). An assessment of the use of
partial least squares structural equation modeling in marketing research.
Journal of the Academy Marketing Science, 40, 414-433.
Hair, J.F., Tomas, G., Hult, M., Ringle, C. M. & Sarstedt, M. (2013). A Primer on
Partial Least Squares Structural Equation Modeling (PLS-SEM). Thousand
Oaks, California: Sage Publication.
Hankins, M., French, D., & Horne, R. (2000). Statistical guidelines for TRA and
TPB. Journal of Psychology and Health, 15, 151-161.
Hanno, D. M., & Violette, G. R. (1996). An analysis of moral and social influences
on taxpayer behavior. Behavioral Research In Accounting, 9(Supplement),
57-75.
Harrison, R. L. (2013). Using mixed methods designs in the Journal of Business
Research, 1990–2010. Journal of Business Research, 66, 2153-2162.
Hasseldine, J., Evans, C., Hansford, A., Lignier, P., Smulders, S., & Vaillancourt,
F. (2012, November). A comparative analysis of tax compliance costs and
the role of special concessions and regimes for small businesses in
Australia, Canada, South Africa and the United Kingdom. Paper presented
at the National Tax Association Conference. Rhode Island.

403
Hasseldine, J., Holland, K., & Van Der Rijt, P. G. A. (2012). The Management of
Tax Knowledge. In L. Oats (Ed.), Taxation: A Fieldwork Research
Handbook (pp. 145-151). Oxon: Routledge.
Helfrich, H. (1999). Beyond the dilemma of cross-cultural psychology: Resolving
the tension between etic and emic approaches. Culture & Psychology, 5(2),
131-153.
Henderson, B. C., & Kaplan, S. E. (2005). An examination on the role of ethics in
tax compliance decisions. The Journal of American Taxation Association,
27(1), 39-72.
Henseler, J. (2010). On the convergence of the partial least squares path modeling
alogrithm. Computational Statistics, 1(25), 107-120.
Henseler, J., Ringle, C. M., & Sinkovics, R. R. (2009). The use of partial least
squares path modeling in international marketing. New Challenges to
International Marketing: Advances in International Marketing, 20, 277-
319.
Hite, P., Hasseldine, J., Al-Khoury, A., James, S., Toms, S., & Toumi, M. (2003).
Tax practitioners and tax compliance. In A. Lymer & D. Salter (Eds.),
Contemporary Issues in Taxation Research (pp. 17-43). England: Ashgate
Publishing Limited.
Ho, D., & Wong, B. (2008). Issues on compliance and ethics in taxation: what do
we know? Journal of Financial Crime, 15(4), 369-382.
Hofstede, G. (1980). Culture's consequences: international differences in work-
related values. Beverly Hills: Sage Publications.
Hofstede, G. (1991). Cultures and Organizations: software of the minds. London:
McGraw-Hill.
Hofstede, G. (1998). A case for comparing apples with oranges: International
differences in values. International Journal of Comparative Sociology,
39(1), 16-31.
Hofstede, G. (2001). Culture's consequences: comparing values, behaviors,
institutions and organization across nations. California: Sage Publications.
Hofstede, G. (2002). Dimensions do not exist: A reply to Brendan McSweeney.
Human Relations, 55(11), 1-7.
Hofstede, G. (2007). Asian Management in the 21st Century. Asia Pacific Journal
of Management, 24, 411-420.

404
Hopman, H. A., & Lord, B. R. (2009). The glass ceiling and women in accounting:
New Zealand experiences and perceptions. Paper presented at the
Interdisciplinary Perspectives on Accounting Conference, Innsbruck,
Austria.
House, R. J., Hanges, P. J., Javidan, M., Dorfman, P. W., & Gupta, V. (2004).
Culture, leadership and organizations: The GLOBE study of 62 societies.
Thousand Oaks, California: Sage Publications.
Howell, R. D., & Breivik, E. (2007). Reconsidering formative measurement.
Psychological Methods, 12(2), 205-218.
Hume, E. C., Larkins, E. R., & Iyer, G. (1999). On compliance with ethical
standards in tax return preparation. Journal of Business Ethics, 18(2), 229-
238.
Hunt, S. D., & Vitell, S. (1986). A general theory of marketing ethics. Journal of
Macromarketing, 8(Spring), 5-16.
Hunter, M. G. (2006). Experiences conducting cross cultural research Journal of
Global Information Management, 14(2), 75-89.
Hyman, R. M. (1996). A critique and revision of the Multidimensional Ethics
Scale. Journal of Empirical Generalisations in Marketing Science, 1, 1-35.
Jackson, B. R., & Milliron, V. C. (1986). Tax compliance research: findings,
problems and prospects. Journal of Accounting Literature, 5, 125-161.
Jakubowski, S. T., Chao, P., Huh, S. K., & Maheshwari, S. (2002). A cross-country
comparison of the Codes of Professional Conduct of Certified /Chartered
Accountants. Journal of Business Ethics, 35, 119-129.
James, S., & Alley, C. (2002). Tax compliance, self-assessment and tax
administration. Journal of Finance and Management in Public Services,
2(2), 27-42.
Jardins, J.D. (2011). An introduction to business ethics. Singapore: McGraw Hill.
Jarvis, C. B., MacKenzie, S. B., & Podsakoff, P. M. (2003). A critical review of
construct indicators and measurement model misspecification in marketing
and consumer research. Journal of Consumer Research, 30(2), 199-218.
Johnson, R. B., & Onwuegbuzie, A. J. (2004). Mixed methods research: A research
paradigm whose time has come. Educational Researcher, 33(7), 14-26.

405
Johnson, R. B., Onwuegbuzie, A. J., & Turner, L. A. (2007). Toward a Definition
of Mixed Methods Research. Journal of Mixed Methods Research, 1(2),
112-133.
Jones, T. M. (1991). Ethical Decision Making by Individuals in Organizations: An
Issue-Contingent Model. The Academy of Management Review, 16(2), 366-
395.
Kahle, J. B., & White, R. A. (2004). Tax Professionals Decision Biases: The
Effects of Initial Beliefs and Client Preference. The Journal of American
Taxation Association, 26, 1-29.
Kassipillai, J., Baldry, J., & Rao, P. (2000). Estimating the size and determinants of
hidden income and tax evasion in Malaysia. Asian Review of Accounting,
8(2), 25-42.
Kennedy, J. C. (2000). Leadership and culture in New Zealand. Discussion paper.
Commerce. Lincoln University. Canterbury.
Kennedy, J. C. (2002). Leadership in Malaysia: Traditional Values, International
Look. The Academy of Management Executive (1993-2005), 16(3), 15-26.
Kennedy, J. C. (2012). Leadership and Culture in New Zealand. In J. S. S.
Chhokar, F. C. C. Brodbeck & R. J. J. House (Eds.), Culture and
Leadership Across the World (pp. 397-429). Hoboken: Lawrence Erlbaum
Associates.
Kinsey. K.A. (1985). Theories and models of tax cheating. Tax Compliance Project
Working Paper 84-2. Chicago: American Bar Foundation.
Kirchler, E. (2007). The Economic Psychology of Tax Behaviour. Cambridge:
Cambridge University Press.
Kirchler, E., Hoelzl, E., & Wahl, I. (2008). Enforced versus voluntary tax
compliance: The “slippery slope” framework. Journal of Economic
Psychology, 29, 210-225.
Kirkman, B. L., Lowe, K. B., & Gibson, C. B. (2006). A quarter century of
"Culture's Consequences": A Review of Empirical Research. Journal of
International Business Studies, 37(3), 285-320.
Klepper, S., Mazur, M., & Nagin, D. (1991). Expert Intermediaries and Legal
Compliance: The Case of Tax Preparers. Journal of Law and Economics,
34(1), 205-229.

406
Klepper, S., & Nagin, D. (1989). The Role of Tax Preparers in Tax Compliance.
Policy Sciences, 22, 167-194.
Kohlberg, L. (1969). Stages and sequences: The cognitive developmental approach
to socialization In D. A. Goslin (Ed.), Handbook of Socialization Theory
and Research (pp. 347-480). Chicago: Rand McNally.
Krauss, S. E. (2005). Research paradigms and meaning making: a primer. The
Qualitative Report, 10(4), 758-770.
Krejcie, R. V., & Morgan, D. W. (1970). Determining sample size for research
activities. Educational and Psychological Measurement, 30(3), 607-610.
Kroeber, L., & Kluckhohn, C. (1952). Culture: A critical review of concepts and
definition. Massachusetts: Harvard University Printing Office.
Krosnick, J. A. (1999). Survey Research. Annual Review of Psychology, 50, 537-
567.
Kuhn, T. S. (1970). The Structure of Scientific Revolutions (2nd ed.). Chicago:
University of Chicago Press.
Kujala, J., Lamsa, A. M., & Pentilla, K. (2011). Managers' moral decision -making
patterns over time: A multidimensional approach. Journal of Business
Ethics, 100(2), 191-207.
Kujala, J., & Pietilaihen, T. (2007). Developing moral principles and scenarios in
the light of diversity: an extension to Multidimensional Ethics Scale.
Journal of Business Ethics, 70, 141-150.
Lai, M. L., & Choong, K. F. (2009). Self-assessment system and compliance
complexities: Tax practitioners' perspectives. Paper presented at the 2009
Oxford Business & Economics Conference Program, St. Hugh's College,
Oxford University.
Lai, M. L., & Choong, K. F. (2010). Motivators, Barriers and Concerns in
Adoption of Electronic Filing System: Survey Evidence from Malaysian
Professional Accountants. American Journal of Applied Sciences, 7(4), 562-
567.
Langham, J. A., Paulsen, N., & Hartel, E. J. (2012). Improving tax compliance
strategies: Can the Theory of Planned Behaviour predict business
compliance? eJournal of Tax Research, 10(2), 364-402.
Le Compte, M. D. (2000). Analyzing Qualitative Data. Theory into Practice, 39(3),
146-154.

407
Lewis, A., Carrera, S., Cullis, J., & Jones, P. (2009). Individual, cognitive and
cultural differences in tax compliance: UK and Italy compared. Journal of
Economic Psychology, 30, 431-445.
Lignier, P. & Evans, C. (2012). The Rise and Rise of Tax Compliance Costs for the
Small Business Sector in Australia. Australian Tax Forum, 27(3), 615-672.
Lim, L. (2001). Work-related Values of Malays and Chinese Malaysians.
International Journal of Cross Cultural Management, 1(2), 209-226.
Lincoln, Y. S., & Guba, E. G. (1985). Naturalistic Inquiry. Beverly Hills,
California: Sage Publications Inc.
Lind, D.A, Marchal, W.G. & Wathen, S.A. (2008). Statistical Techniques in
Business & Economics with Global Data Sets. New York: McGraw-
Hill/Irwin.
Loe, T. W., Ferrell, L., & Mansfield, P. (2000). A Review of Empirical Studies
Assessing Ethical Decision Making in Business. Journal of Business Ethics,
25, 185-204.
Loo, E. C., McKerchar, M., & Hansford, A. (2010). Findings on the impact of self-
assessment on the compliance behaviour of individual taxpayers in
Malaysia: A case study approach. Journal of Australian Taxation, 13(1), 1-
23.
Lyness, K. S. & Kropf, M. B. (2007). Cultural values and potential non response
bias: A multilevel examination of cross national differences in mail survey
response rates. Organizational Research Methods, 10(2), 210-224.
MacKenzie, S. B., Podsakoff, P. M., & Podsakoff, N. P. (2011). Construct
measurement and validation procedures in MIS and behavioral research:
Integrating new and existing techniques. MIS Quarterly, 35(2), 293-334.
Madden, T. J., Ellen, P. S., & Ajzen, I. (1992). A comparison of the Theory of
Planned Behaviour and the Theory of Reasoned Action. Personality and
Social Psychology Bulletin, 18(1), 3-9.
Malaysian Association of Tax Accountants. (2013). Profiles. Retrieved 8 January
2013 http://www.mata.org.my.
Malaysian Inland Revenue Board. (2011). Annual Report 2011. Retrieved 22
August, 2013, from http://www.hasil.org.my.
408
Malaysian Inland Revenue Board. (2012). Code of Ethics for Tax Agents.
Amendment No. 4/2012. Retrieved 12 June 2012, from
http://www.hasil.org.my.
Malaysian Inland Revenue Board. (2013). Budget 2014. Retrieved 18 November,
2013, from http://www.hasil.org.my.
Malaysian Institute of Accountants. (2010). Professional Standard and Practices
Retrieved 19 March, 2010, from http://www.mia.org.my.
Malaysian Institute of Accountants. (2012a). Annual Report Retrieved 7th
November 2012, from http://www.mia.org.my.
Malaysian Institute of Accountants. (2012b, June 4). MIA supports Government’s
call to increase the number of Chartered Accountants. [Press Release].
Retrieved from http://www.mia.org.my.
Malhotra, N. K., Agarwal, J., & Peterson, M. (1996). Methodological issues in
cross cultural marketing studies International Marketing Review, 13(5), 7-
43.
Malina, M. A., Norreklit, S. O & Selto, F. H. (2011). Lessons learned: advantages
and disadvantages of mixed method research. Qualitative Research in
Accounting and Management, 8(1), 59-71.
Marshall, R. L., Armstrong, R. W., & Smith, M. (1998). The ethical environment
of tax practitioners: Western Australia evidence. Journal of Business Ethics,
17(12), 1265-1279.
Matsumoto, D. (2007). Culture, Context, and Behavior. Journal of Personality,
75(6), 1285 - 1319.
Matsumoto, D., & Juang, L. (2008). Culture and Psychology (4th ed.). Belmont,
CA: Thomson Wadsworth.
McDonald, G. (2000). Cross-cultural Methodological Issues in Ethical Research.
Journal of Business Ethics, 27(September), 89-104.
McEachan, R. R. C., Conner, M., Taylor, N., & Lawton, R. J. (2011). Prospective
prediction of health-related behaviors with the Theory of Planned Behavior:
A meta-analysis Health Psychology Review, 5, 97-144.
McKerchar, M. (2008). Philosophical Paradigms, Inquiry Strategies and
Knowledge Claims: Applying the Principles of Research Design and
Conduct to Taxation. eJournal of Tax Research, 16(1), 5-22.

409
McKerchar, M. (2010). Design and conduct of research in tax, law and
accounting. Sydney: Thomson Reuters/Lawbook Co.
McKerchar, M. (2012a). Designing and Administering Survey. In L. Oats (Ed.),
Taxation: A Fieldwork Research Handbook. Oxon: Routledge.
McKerchar, M. (2012b). Using Quantitative Approaches. In L. Oats (Ed.),
Taxation: A Fieldwork Research Handbook. Oxon: Routledge.
McMahon, J. M., & Harvey, R. J. (2007). Psychometric properties of the
Reidenbach-Robin Multidimensional Ethics Scale. Journal of Business
Ethics, 72(1), 27-39.
McSweeney, B. (2002). Hofstede's model of national cultural differences and their
consequences: A triumph of faith - a failure of analysis. Human Relations,
55(1), 89-118.
Merritt, A. C. (2000). Culture in the cockpit: Do Hofstede’s dimensions replicate?
Journal of Cross-Cultural Psychology, 31, 283-301.
MIA supports call for more chartered accountants (2012, June 5). The Star.
Retrieved from http:///www.thestar.com.my.
Mir, M. Z., Chatterjee, B., & Rahaman, A. S. (2009). Culture and corporate
voluntary reporting: A comparative exploration of the chairperson's report
in India and New Zealand. Managerial Auditing Journal, 24(7), 639-667.
Mohd Ali, R. (2013). The influence of religiosity on tax compliance in Malaysia.
Doctor of Philosophy. Curtin University, Perth.
Mohd Isa, K. (2012). Corporate tax payers' compliance variables under the self-
assessment system in Malaysia: A mixed method approach. Doctor of
Philosophy. Curtin University, Perth.
Mohd Iskandar, T., & Pourjalali, H. (2000). Cultural Influences on the
Development of Accounting Practices in Malaysia. Asian Review of
Accounting, 8(2), 126-147.
Moore, D., & McCabe, G. (2006). Introduction to the practice of statistics (4th
ed.). New York: Freeman.
Morris, M. W., Leung, K., Ames, D., & Lickel, B. (1999). Views from inside and
outside integrating emic and etic insights about culture and justice
judgment. The Academy of Management Review, 24(4), 781-796.

410
Morse, J. M. (1994). Designing funded qualitative research. In N. K. Denzin & Y.
S. Lincoln (Eds.), Handbook of qualitative research (pp. 220-235).
Thousand Oaks: Sage.
Murphy, K. (2004). Aggressive tax planning: Differentiating those playing the
game from those who don't. Journal of Economic Psychology, 25, 307-329.
Mustamil, N., & Quaddus, M. (2009). Cultural Influence in the Ethical Decision
Making Process: The Perspective of Malaysian Managers. The Business
Review, Cambridge, 13(1), 171-176.
Nerré, B. (2008). Tax culture: A basic concept for tax politics. Economic Analysis
& Policy, 38(1), 153-167.
New Zealand Institute of Chartered Accountants. (2010). Ethical and Professional
Standard. Retrieved 1 March, 2010, from http://www.nzica.com.
New Zealand Inland Revenue Department. (2012). Tax Statistics Retrieved 12
October 2012, from http://www.ird.govt.nz.
New Zealand Institute of Chartered Accountants. (2012). Annual Report Retrieved
7 December 2012, from http://www.nzica.com.
New Zealand Institute of Chartered Accountants. (2013). GAA and affiliation.
Retrieved 18 November 2013, from http://www.nzica.com.
Nguyen, N. T., & Biderman, M. D. (2008). Studying ethical judgments and
behavioral intentions using structural equations: Evidence from the
Multidimensional Ethics Scale. Journal of Business Ethics, 83(4), 627-640.
Noar, S. M. (2003). The Role of Structural Equation Modeling in Scale
Development. Structural Equation Modeling: A Multidisciplinary Journal,
10(4), 622-647.
Nosek, B. A., Graham, J., Lindner, N. M., Kesebir, S., Hawkins, C. B., Hahn, C.,
Motyl, M., Joy-Gaba, J., Frazier, R & Tenney, E. R. (2010). Cumulative
and career-stage citation impact of social-personality psychology programs
and their members. Personality and Social Psychology Bulletin, 36(10),
1283-1300.
Oats, L. (2012). Tax Research Going Forward. In L. Oats (Ed.), Taxation: A
Fieldwork Research Handbook. Oxon: Routledge.
O'Fallon, M. J., & Butterfield, K. D. (2005). A review of the empirical ethical
decision-making literature: 1996-2003. Journal of Business Ethics, 59, 375-
413.

411
Onwuegbuzie, A. J., & Collins, K. M. T. (2007). A typology of mixed methods
sampling designs in social science research. The Qualitative Report, 12(2),
281-316.
Onwuegbuzie, A. J., Jiao, Q. G., & Bostick, S. L. (2004). Library anxiety: Theory,
research, and applications. Lanham: Scarecrow Press.
Patel, C. (2003). Some Cross-Cultural Evidence on Whistle-Blowing as an Internal
Control Mechanism. Journal of International Accounting Research, 2(1),
69-96.
Patton, M. Q. (1990). Qualitative Evaluation and Research Methods. California:
SAGE Publications Inc.
Patton, M. Q. (1999). Enhancing the Quality and Credibility of Qualitative
Analysis. Health Services Research, 34(5), 1189-1208.
Pierce, B., & Sweeney, B. (2009). The relationship between demographic variables
and ethical decision making of trainee accountants. International Journal of
Auditing, 10, 1099-1123.
Podsakoff, P. M., MacKenzie, S. B., Lee, J. Y., & Podsakoff, N. P. (2003).
Common method biases in behavioral research: A critical review of the
literature and recommended remedies. Journal of Applied Psychology, 88,
879-903.
Podsakoff, P. M., & Organ, D. W. (1986). Self-reports in organizational research:
problems and prospects. Journal of Management, 12, 531-544.
Ponemon, L. A. (1992). Ethical reasoning and selection-socialization in
accounting. Accounting, Organizations and Society, 17(3/4), 239-258.
Qu, S. Q., & Dumay, J. (2011). The qualitative research interview. Qualitative
Research in Accounting and Management, 8(3), 238-264.
Reckers, P. M. J., Sanders, D. B., & Roark, S. J. (1994). The influence of ethical
attitude on taxpayer compliance. National Tax Journal, 47(4), 825-836.
Reidenbach, E. R., & Robin, D. P. (1988). Some initial steps toward improving the
measurement of ethical evaluations of marketing activities. Journal of
Business Ethics, 7, 871-879.
Reidenbach, E. R., & Robin, D. P. (1990). Toward the development of a
multidimensional scale for improving evaluations of business ethics.
Journal of Business Ethics, 9, 639-653.

412
Rest, J. R. (1986). Moral development: advances in research and theory. New
York: Praeger.
Richardson, G. (2008). The relationship between culture and tax evasion across
countries: Additional evidence and extensions. Journal of International
Accounting, Auditing and Taxation, 17(2), 67-78.
Richardson, M., & Sawyer, A. J. (2001). A taxonomy of the compliance literature:
further findings, problems and prospects. Australian Tax Forum, 16(2),
137-320.
Ringle, C. M., Sarstedt, M., & Mooi, E. A. (2010). Response-based segmentation
using finite mixture partial least squares: theoretical foundations and an
application to American Customer Satisfaction Index Data. Annals of
Information System, 8, 19-49.
Ringle, C. M., Sarstedt, M., & Straub, D. W. (2012). Editor's comments: A critical
look at the use of PLS-SEM in MIS Quarterly. MIS Quarterly, 36(1), iii-
xiv.
Ringle, C. M., Wende, S., & Will, S. (2005). SmartPLS 2.0 (M3) Beta, from
http://www.smarpls.de.
Roberts, M. L. (1998). Tax accountants' judgment/decision making research: A
review and synthesis. The Journal of the American Taxation Association,
20(1), 78-102.
Roberts, M. L., Hite, P. A., & Bradley, C. F. (1994). Understanding attitudes
towards progressive taxation. Public Opinion Quarterly, 58(2), 165-190.
Roth, J. A., Scholz, J. T., & Witte, A. D. (Eds.). (1989). Taxpayer Compliance
Volume I: An Agenda for Research. United States of America University of
Pennsylvania.
Roxas, M. L., & Stoneback, J. Y. (1997). An investigation of the ethical-decision
making process across varying culture. The International Journal of
Accounting, 32(4), 503-535.
Saad, N. (2010). Fairness perceptions and compliance behaviour: The case of
salaried taxpayers in Malaysia after implementation of the self-assessment
system. eJournal of Tax Research, 8(1), 32-63.
Saad, N. (2011). Fairness Perceptions and Compliance Behaviour: Taxpayers'
Judgments in Self-Assessment Environments. Doctor of Philosophy,
University of Canterbury, Christchurch.

413
Sakurai, Y., & Braithwaite, V. (2003). Taxpayers' perceptions of practitioners:
finding one who is effective and does the right thing? Journal of Business
Ethics, 46(4), 375-387.
Saunders, M., Lewis, P., & Thornhill, A. (2003). Research methods for business
students. England: Pearson Education Limited.
Sawyer, A.J. (2007). New Zealand’s Tax Rewrite Program – In pursuit of the
(Elusive) Goal of Simplicity. British Tax Review, 4, 405-417.
Sawyer, A. (2009). Comment: Surgeon's Practices and Tax Avoidance: A mutually
Exclusive Relationship? New Zealand Journal of Taxation Law and Policy,
15(2), 97-109.
Schwartz, S. H. (1994). Beyond Individualism/Collectivism: New cultural
dimensions of values. In U. Kim, H. C. Triandis, C. Kagiteibasi, S. C. Choi
& G. Yoon (Eds.), Individualism and Collectivism: Theory, methods and
applications (pp. 85-122). Thousand Oaks, California: Sage.
Sekaran, U. (2002). Research methods for business: A skill building approach (4th
ed.). New York: John Wiley & Sons Inc.
Sekaran, U., & Bougie, R. (2010). Research Methods for Business: A Skill Building
Approach. West Sussex: John Wiley and Sons Ltd.
Selvaraj, S. D. (1999). "Interest" and accounting standard setting in Malaysia.
Accounting, Auditing and Accountability Journal, 12(3), 358-387.
Shawver, T. J., & Sennetti, J. T. (2009). Measuring ethical sensitivity and
evaluation. Journal of Business Ethics, 88(4), 663-678.
Sheppard, B. H., Hartwick, J., & Warshaw, P. R. (1988). The Theory of Reasoned
Action: A meta-analysis of past research with recommendations for
modifications and future research. Journal of Consumer Research, 15(3),
325-343.
Singh, V. (2003). Tax compliance and ethical decision making: a Malaysian
perspective. Petaling Jaya: Pearson Malaysia Sdn Bhd.
Smart, M. (2012). The Application of the Theory of Planned Behaviour and
Structural Equation Modelling in tax compliance behaviour: A New
Zealand Study. Doctor of Philosophy, University of Canterbury,
Christchurch.

414
Smith, A., & Hume, E. C. (2005). Linking Culture and Ethics: A comparison of
Accountants' Ethical Belief Systems in the Individualism/Collectivism and
Power Distance Contexts. Journal of Business Ethics, 62(3), 209-220.
Song, Y., & Yarbrough, T. E. (1978). Tax ethics and taxpayer attitude: a survey.
Public Administration Review, 38(5), 442-452.
Spilker, B. C., Worsham Jr, R. G., & Prawitt, D. F. (1999). Tax professionals'
interpretations of ambiguity in compliance and planning decision contexts.
The Journal of the American Taxation Association, 21(2), 75-89.
Statistics New Zealand. (2012). Ethnic groups. Retrieved 27/12/2012, 2012, from
http://www.stats.govt.nz/Census/2006CensusHomepage.
Tan, L. M. (1999). Taxpayers' preference for type of advice from tax practitioner:
A preliminary examination. Journal of Economic Psychology, 20, 431-447.
Tan, L. M. (2006). Research on the role of tax practitioners in taxpayer
compliance: identifying some of the gaps In A. Sawyer (Ed.), Taxation
Issues in the Twenty-First Century (pp. 15-28). Christchurch: The Centre
for Commercial and Corporate Law, School of Law, University of
Canterbury.
Tan, L. M. (2011). Giving advice under ambiguity in a tax setting. Australian Tax
Forum, 26 (1),73-101.
Tan, L. M., & Sawyer, A. J. (2003). A synopsis of taxpayer compliance studies:
Overseas vis-a-vis New Zealand. New Zealand Journal of Taxation Law
and Policy, 9(4), 431-454.
Taras, V., Kirkman, B. L., & Steel, P. (2010). Examining the impact of culture's
consequences: A three-decade, multi-level, meta-analysis review of
Hofstede's Cultural Value Dimensions. Journal of Applied Psychology,
95(3), 405-439.
Taras, V., Steel, P., & Kirkman, B. L. (2012). Improving National Cultural Indices
Using a Longitudinal Meta-Analysis of Hofstede's Dimensions. Journal of
World Business, 47, 329-341.
Teddlie, C., & Tashakkori, A. (2006). A General Typology of Research Designs
Featuring Mixed Methods. Research In The Schools, 13(1), 12-28.
Thiagarajah, L. (2012). To statutorily regulate tax practitioners or not to: The
Malaysian perspective. New Zealand Journal of Taxation Law and Policy,
18(1), 32-48.
415
Tomasic, R., & Pentony, B. (1991). Taxation law compliance and the role of
professional tax advisers. Australia & New Zealand Journal of
Criminology, 24, 241-257.
Tooley, S. T. (1992). Tax practitioners: towards an understanding of ethical
problem and attitudes in taxation. Discussion paper. Palmerston North,
Massey University.
Torgler, B., & Schneider, F. (2007). What shapes attitudes toward paying taxes?
Evidence from multicultural European countries. Social Science Quarterly,
88(2), 444-470.
Tran-Nam, B., & Karlinsky, S. (2008). Small Business Tax Law Complexity in
Australia. Paper presented at the Atax International Tax Administration
Conference, Sydney.
Trivedi, V. U., Shehata, M., & Mestelman, S. (2005). Attitudes, incentives and tax
compliance. Canadian Tax Journal, 53(1), 29-61.
Trompenaars, F. (1993). Riding the waves of culture: Understanding cultural
diversity in business. London: Economists Books.
Tsakumis, G. T. (2007). The influence of culture on accountants’ application of
financial reporting rules. Abacus, 43(1), 27-48.
Tsakumis, G. T., Curatola, A. B., & Porcano, T. M. (2007). The relation between
national cultural dimensions and tax evasion. Journal of International
Accounting, Auditing and Taxation, 16(2), 131-147.
Urbach, N., & Ahlemann, F. (2010). Structural Equation Modeling in Information
Systems: Research Using Partial Least Squares. Journal of Information
Technology Theory and Application, 11(2), 5-40.
Uysal, O. O. (2009). Business ethics research with an accounting focus: A
bibliometric analysis from 1988 to 2007. Journal of Business Ethics, 93,
137-160.
Vijver, F. J. R. v. d., & Leung, K. (1997). Methods and Data Analysis for Cross-
Cultural Research. Thousand Oaks, CA: Sage Publication Inc.
Waldron, M. (2009). Issue contingency: A review of moral intensity components.
The Business Review, Cambridge, 14(1), 9-16.
Waldron, M., & Doty, E. (2010). Accountants' values and ethics: self-regulatory
outcomes. Journal of American Academy of Business Cambridge, 15(2),
268-274.
416
Wasieleski, D. M., & Weber, J. (2009). Does job function influence ethical
reasoning? An adapted Wason Task application. Journal of Business Ethics,
85(1), 187-199.
Wenzel, M. (2007). The multiplicity of taxpayer identities and their implications
for tax ethics. Journal of Law and Policy, 29(1), 31-50.
Westerman, W., Beekun, R. I., Stedham, Y., & Yamamura, J. (2007). Peers Versus
National Culture: An Analysis of Antecedents to Ethical Decision-making.
Journal of Business Ethics, 75(3), 239-252.
Wheeldon, J. (2010). Mapping Mixed Methods Research: Methods, Measures, and
Meaning. Journal of Mixed Methods Research, 4(2), 87-102.
Whiting, R., & Wright, C. (2001). Explaining gender inequity in the New Zealand
accounting profession. British Accounting Review, 33(2), 191-222.
Whittier, N. C., Williams, S., & Dewett, T. C. (2006). Evaluating ethical decision-
making models: A review and application. Society and Business Review, 3,
235-24.
Williams, J. J., & Seaman, A. E. (2001). Predicting change in management
accounting systems: National culture and industry effects. Accounting,
Organizations and Society, 26, 443-460.
Wold, H. (1985). Partial least squares. Encyclopedia of Statistical Sciences, 6, 581-
591.
Yeoh, J. P. A. (1999). Accounting education and culture: An exploratory study
comparing Malaysia and New Zealand's accounting education using
Hofstede’s four dimension of culture. Doctor of Philosophy, University of
Otago, Dunedin.
Yetmar, S. A., & Eastman, K. K. (2000). Tax practitioners' ethical sensitivity: a
model and empirical examination. Journal of Business Ethics, 26(4), 271-
288.
Yong, S. S. E. (2011). Tax compliance and small and medium enterprise
operators: An intra-cultural study in New Zealand. Doctor of Philosophy,
Auckland University of Technology, Auckland.
Yoo, B., Donthu, N., & Lenartowicz, T. (2011). Measuring Hofstede's Five
Dimensions of Cultural Values at the Individual Level: Development and
Validation of CVSCALE. Journal of International Consumer Marketing,
23(3-4), 193-210.

417
Appendix A: Human Ethics approval letter
Ref: HEC 2010/163
6 December 2010
Suhaila Abdul Hamid
Department of Accounting & Information Systems
UNIVERSITY OF CANTERBURY
Dear Suhaila
The Human Ethics Committee advises that your research proposal “Tax compliance and tax
professionals in self-assessment systems” has been considered and approved.
Please note that this approval is subject to the incorporation of the amendments you have provided
in your email of 1 December 2010.
This approval is subject to advising the HEC of the storage details in Malaysia.
Best wishes for your project.
Yours sincerely
Dr Michael Grimshaw
Chair, Human Ethics Committee

418
Appendix B: Letter of approval from Economic Planning Unit
UNIT PERANCANG EKONOMI
Economic Planning Unit
JABATAN PERDANA MENTERI
Prime Minister’s Department
BLOK B5 &B6
PUSAT PENTADBIRAN KERAJAAN PERSEKUTUAN
62502 PUTRAJAYA
MALAYSIA Telefon :603-8888 3333
603-88725281/5272
________________________________________________________________________________
Ruj.Tuan:
Your Ref. : UPE:
40/200/19/2728
Tarikh : 8 March 2011
SUHAILA ABDUL HAMID
2/116 Main South Road,
Sockburn 8042 Christchurch,
New Zealand
Email: [email protected]
APPLICATION TO CONDUCT RESEARCH IN MALAYSIA
With reference to your application, I am pleased to inform you that your application to conduct
research in Malaysia has been approved by the Research Promotion and Co-Ordination
Committee, Economic Planning Unit, Prime Minister’s Department. The details of the approval
are as follows:
Researcher’s name : SUHAILA ABDUL HAMID
Passport No. / I. C No: 730918-01-6626
Nationality : MALAYSIAN
Title of Research : “TAX COMPLIANCE AND TAX PROFESSIONALS IN
SELF-ASSESSMENT SYSTEM”
Period of Research Approved: 3 YEARS
2. Please collect your Research Pass in person from the Economic Planning Unit, Prime
Minister’s Department, Parcel B, Level 4 Block B5, Federal Government Administrative Centre,
62502 Putrajaya and bring along two (2) passport size photographs. You are also required to

419
comply with the rules and regulations stipulated from time to time by the agencies with which you
have dealings in the conduct of your research.
3. I would like to draw your attention to the undertaking signed by you that you will submit
without cost to the Economic Planning Unit the following documents:
a) A brief summary of your research findings on completion of your research and
before you leave Malaysia; and
b) Three (3) copies of your final dissertation/publication.
4. Lastly, please submit a copy of your preliminary and final report directly to the State
Government where you carried out your research. Thank you.
Yours sincerely,
(MUNIRAH ABD. MANAN)
For Director General,
Economic Planning Unit.
E-mail: [email protected]
Tel: 88725281/88725272
Fax: 88883961
ATTENTION
This letter is only to inform you the status of your application and cannot be used as a research
pass.

420
Appendix C: Sample of email invitation to CTIM members
Department of Accounting and Information Systems
College of Business and Economics
Suhaila Abdul Hamid Email: [email protected]
Phone: +64 3 3642613 Fax: +64 3 3642727
Date: 1st July 2011
A SURVEY AND INTERVIEW OF TAX COMPLIANCE AND TAX PROFESSIONALS IN
SELF-ASSESSMENT SYSTEM (SAS)
Dear Sir/Madam,
My name is Suhaila Abdul Hamid and I am currently pursuing the Degree of Doctor of Philosophy
(PhD) in the Department of Accounting and Information Systems (ACIS), at the University of
Canterbury, Christchurch, New Zealand. I am conducting a study on the decision making of tax
professionals in complying with the tax law under the supervision of Professor Adrian Sawyer and
Associate Prof. Andrew Maples.
This study aims to solicit the views of the members of the Chartered Tax Institute of Malaysia
(CTIM). Thus I am inviting all CTIM members to participate in this research. The research has been
reviewed and approved by the Human Ethics Committee, University of Canterbury and the
Economic Planning Unit (EPU), Prime Minister’s Department of Malaysia. All responses are
confidential and will only be used for the purpose of this PhD study. Since a PhD is a public
document via the University of Canterbury database, the information provided would be available to
the public. However, the only personal details published would be the key demographic background
of the participants.
The online questionnaire survey
It is important for me to receive as many completed questionnaires as possible to ensure the findings
to be meaningful. It will take no longer than 30 minutes for you to complete the questionnaire.
Please send your responses by 31 July 2011, however, if you are unable to meet the deadline I still
appreciate a late response. Please click on the following link to start the survey:
http://canterbury.qualtrics.com/SE/?SID=SV_5oGmgJtHHIQhmJu.
For Malay version of the survey please click the following link:
http://canterbury.qualtrics.com/SE/?SID=SV_dgaDerjh75HlakI.
The telephone interview
The interview is important to provide further understanding into the issue being studied. You could
still participate in the interview even if you do not participate in the survey. It will take no longer
than 30 minutes and will be recorded. Please click on the following link to participate in the
telephone interview: http://canterbury.qualtrics.com/SE/?SID=SV_2gU1hztHpfbdZQw.
Your contribution is very much appreciated and important to the completion of my research study.
The findings could contribute to enriching our knowledge on tax professionals’ decision making
and could be useful in assisting the accounting profession as well as the accounting educators to
shape the future generation of accounting professionals.

421
Should you have any enquiries, please do not hesitate to contact myself at [email protected] or
my Senior Supervisor: Professor Adrian Sawyer at [email protected].
Yours Sincerely,
Suhaila Abdul Hamid Professor Adrian Sawyer
PhD Candidate Professor of Taxation
ACIS Department ACIS Department
University of Canterbury, Christchurch University of Canterbury, Christchurch

422
Appendix D: Sample of survey questionnaire
Department of Accounting and Information Systems (ACIS)
College of Business and Economics
A SURVEY OF TAX COMPLIANCE AND TAX AGENTS
Suhaila Abdul Hamid
Department of Accounting and Information Systems
University of Canterbury
Christchurch, New Zealand

423
Dear Sir/Madam,
1. I would like to invite you to share your views by participating in this study. It should
take no longer than 15 minutes for you to complete the questionnaire. There is no right
or wrong answer.
2. In addition to completing the questionnaire, I would also like to invite you to participate
in a telephone interview later. If you agree, please complete the consent form attached.
3. Please send your responses and the consent form to participate in the telephone
interview (if agreed) within four week time from the date of received in the two
separate self-addressed stamped envelopes enclosed to ensure anonymity and
confidentiality. However, I still appreciate late response.
4. If you would like to answer the Malay version of the questionnaire you could log on to
this link: http://canterbury.qualtrics.com/SE/?SID=SV_6L7IauyR9LWAwBe
5. This study had been approved by the Human Ethics Committee, University of
Canterbury. Should you have any enquiries, please do not hesitate to contact myself at
[email protected] or my Senior Supervisor, Professor Dr. Adrian Sawyer at
Thank you very much for participating. I look forward to receiving your responses.
Yours Sincerely,
Suhaila Abdul Hamid Professor Dr. Adrian Sawyer
Phd Student Professor of Taxation
ACIS Department ACIS Department
University of Canterbury University of Canterbury

424
SECTION 1
Below are statements concerning tax compliance behaviour. Please tick (√)
ONE answer that best describes your opinion.
Strongly
Disagree
Strongly
Agree
1 2 3 4 5 6 7
1. A junior staff should follow the
instructions from his/her superior in
complying with the tax law
1 2 3 4 5 6 7
2. The benefits that we as a society could
enjoy from the amount of tax
collected is very important to me
1 2 3 4 5 6 7
3. I would rather challenge the tax
authority than negotiate with them in
a tax lawsuit
1 2 3 4 5 6 7
4. The more precise the tax law the
better
1 2 3 4 5 6 7
5. A junior staff should feel afraid to
disagree with his/her superior in
complying with the tax law
1 2 3 4 5 6 7
6. When complying with the tax law, I
only consider the effect to my client
1 2 3 4 5 6 7
7. I always feel confident with the
decision that I make when complying
with the tax law
1 2 3 4 5 6 7
8. I do not mind to have differences in
tax judgment with the tax authority
1 2 3 4 5 6 7
9. Most of the time a superior is
expected to tell his/her junior staff on
what to do in complying with the tax
law
1 2 3 4 5 6 7
10. I do not care whether or not the
society would benefit from the
amount of tax collected as long as I
could enjoy the tax benefit
1 2 3 4 5 6 7
11. I prefer to challenge the tax
authority’s decision rather than
negotiate with them
1 2 3 4 5 6 7

425
12. When complying with the tax law, I
avoid taking any tax risk since a tax
risk could cause unfavourable effect
1 2 3 4 5 6 7
13. A junior staff should always be
involved in the decision making when
dealing with client’s tax matters
1 2 3 4 5 6 7
14. I would consider the long term effect
to the society when complying with the
tax law
1 2 3 4 5 6 7
15. I always feel confident to make my
own tax decision while dealing with
my client’s tax matters
1 2 3 4 5 6 7
16. When complying with the tax law, a
tax risk is an opportunity
1 2 3 4 5 6 7
SECTION 2
In this section you are provided with two (2) hypothetical tax scenarios. Please read
carefully all scenarios and answer the questions that follow. For each question, please
tick (√) only ONE answer that best describes your opinion.
Scenario A
Rose is a sole proprietor who runs a small catering business and calculates that 50
percent of her travelling expenses are for business purposes. However, she notices that
if she overstates her claim to 55 percent, the deduction claimed will increase by
RM500 and her tax will drop to a lower tax bracket. Since her current business is not
doing well, she wants to introduce additional menus in her catering business. For that
purpose, she wants to participate in a cooking course and use the money from the tax
saved to pay for her enrolment fees. Rose is certain that it is very unlikely for the tax
authority to detect the overstated claim.

426
For that year, Rose claims 55 percent of her travelling expenses are for business
purposes. What would you do if you face a similar situation?
1. If I had the opportunity I would
overstate the business travelling
expenses in the tax return
Likely 1 2 3 4 5 6 7 Unlikely
2. For me to overstate the business
travelling expenses claimed in the
tax return is
Good 1 2 3 4 5 6 7 Bad
3. Most of people important to me
think I should overstate the
business travelling expenses
claimed in the tax return
Agree 1 2 3 4 5 6 7 Disagree
4. For me to overstate the business
travelling expenses in the tax return
is
Easy 1 2 3 4 5 6 7 Difficult
5. I would never overstate the
business travelling expenses
claimed in the tax return
True 1 2 3 4 5 6 7 False
6. For me to overstate the business
travelling expenses in the tax return
is
Worthless 1 2 3 4 5 6 7 Useful
7. Most people who are important to
me will look down at me if I
overstate the business travelling
expenses in the tax return
Likely 1 2 3 4 5 6 7 Unlikely
8. With my expertise, I could easily
overstate the business travelling
expenses in the tax return if I
wanted to
Agree 1 2 3 4 5 6 7 Disagree
9. In the future, I may overstate the
business travelling expenses in the
tax return
True 1 2 3 4 5 6 7 False
10. For me to overstate the business
travelling expenses in the tax return
is
Harmful 1 2 3 4 5 6 7 Beneficial
11. No one who is important to me
thinks it is OK to overstate the
business travelling expenses in the
tax return
Agree 1 2 3 4 5 6 7 Disagree
12. How much control do you have
over overstating the business
travelling expenses in the tax
return?
Complete
control
1 2 3 4 5 6 7 Absolutely
no control
Please refer to the following statement to answer questions 13 to 24.
In your opinion, Rose’s decision to overstate the business travelling expenses is:

427
13. Just 1 2 3 4 5 6 7 Unjust
14. Fair 1 2 3 4 5 6 7 Unfair
15. Morally right 1 2 3 4 5 6 7 Not morally right
16. Acceptable to my family 1 2 3 4 5 6 7 Not acceptable to my family
17. Traditionally acceptable 1 2 3 4 5 6 7 Traditionally unacceptable
18. Culturally acceptable 1 2 3 4 5 6 7 Culturally unacceptable
19. Not self-promoting for
Rose
1 2 3 4 5 6 7 Self-promoting for Rose
20. Personally satisfying for
Rose
1 2 3 4 5 6 7 Not personally satisfying for
Rose
21. Produces greatest utility 1 2 3 4 5 6 7 Produces the least utility
22. Minimizing benefits
while maximizing harm
1 2 3 4 5 6 7 Maximizing benefits while
minimizing harm
23. Violating an unwritten
contract
1 2 3 4 5 6 7 Not violating an unwritten
contract
24. Violating an unspoken
promise
1 2 3 4 5 6 7 Not violating an unspoken
promise
25. The probability that my peers will take the same action is
High 1 2 3 4 5 6 7 Low
26. The probability that I will take the same action is
High 1 2 3 4 5 6 7 Low
Scenario B
Adam is a sole proprietor who receives cheques and cash for his business. In the
current year, he received a cash sale of RM2,000 from one of his friends. He is
certain that the tax authority will not know the income is not reported and will
not detect the income since there is no record about the cash sale. He notices that
he will fall under a higher tax bracket if he declares the RM2,000 cash sale. At
the same time, he wants to renovate is shop and intends to use the RM2,000 cash
sale for that purpose.
For that year, Adam omits the RM2,000 cash sale from his current year tax
computation. If you are in a similar situation, what would you do?
1. If I had the opportunity I would
omit the RM2,000 cash sale from
the tax computation
Likely 1 2 3 4 5 6 7 Unlikely
2. For me to omit the RM2,000 cash
sale from the tax computation is
Good 1 2 3 4 5 6 7 Bad
3. Most of people important to me
think I should omit the RM2,000
cash sale from the tax computation
Agree 1 2 3 4 5 6 7 Disagree
4. For me to omit the RM2,000 cash
sale from the tax computation is
Easy 1 2 3 4 5 6 7 Difficult

428
5. I would never omit the RM2,000
cash sale from the tax computation
True 1 2 3 4 5 6 7 False
6. For me to omit the RM2,000 cash
sale from the tax computation is
Worthless 1 2 3 4 5 6 7 Useful
7. Most people who are important to
me will look down at me if I omit
the RM2,000 cash sale from the tax
computation
Likely 1 2 3 4 5 6 7 Unlikely
8. With my expertise, I could easily
omit the RM2,000 cash sale from
the tax computation if I wanted to
Agree 1 2 3 4 5 6 7 Disagree
9. In the future, I may omit the
RM2,000 cash sale from the tax
computation
True 1 2 3 4 5 6 7 False
10. For me to omit the RM2,000 cash
sale from the tax computation is
Harmful 1 2 3 4 5 6 7 Beneficial
11. No one who is important to me
thinks it is OK to omit the
RM2,000 cash sale from the tax
computation
Agree 1 2 3 4 5 6 7 Disagree
12.
How much control do you have
over omitting the RM2,000 cash
sale from the tax computation
Complete
control
1 2 3 4 5 6 7 Absolutely
no control
Please refer to the following statement to answer questions 13 to 24.
In your opinion, Adam’s decision to omit the RM2,000 cash sale is:
13. Just 1 2 3 4 5 6 7 Unjust
14. Fair 1 2 3 4 5 6 7 Unfair
15. Morally right 1 2 3 4 5 6 7 Not morally right
16. Acceptable to my family 1 2 3 4 5 6 7 Not acceptable to my family
17. Traditionally acceptable 1 2 3 4 5 6 7 Traditionally unacceptable
18. Culturally acceptable 1 2 3 4 5 6 7 Culturally unacceptable
19. Not self-promoting for
Adam
1 2 3 4 5 6 7 Self-promoting for Adam
20. Personally satisfying for
Adam
1 2 3 4 5 6 7 Not personally satisfying for
Adam
21. Produces greatest utility 1 2 3 4 5 6 7 Produces the least utility
22. Minimizing benefits
while maximizing harm
1 2 3 4 5 6 7 Maximizing benefits while
minimizing harm
23. Violating an unwritten
contract
1 2 3 4 5 6 7 Not violating an unwritten
contract
24. Violating an unspoken
promise
1 2 3 4 5 6 7 Not violating an unspoken
promise
25. The probability that my peers will take the same action is
High 1 2 3 4 5 6 7 Low

429
26. The probability that I will take the same action is
High 1 2 3 4 5 6 7 Low
SECTION 3
In this section you are provided with questions related to your background. For
each question, please tick (√) the answer that represents you.
1. Please indicate your gender
Male Female
2. Please indicate your age
25 years or below 26-30 years old 31-35 years
old
36-40 years old 41-45 years old 46-50 years
old
51-55 years old 56-60 years old Over 60 years
old
3. Please indicate your ethnicity
Malay Chinese Indian Others (Please
state):
__________
4. Please indicate your years of experience as a tax professional
Less than 5
years
5-10 years 11-20 years More than 20 years
5. What type of firm are you currently working in?
Big Four public accounting
firm
Medium size public accounting
firm
Small size public
accounting firm
O Others (Please state): ________
6. Please state your current position in the firm (for example: Junior, Senior, Assistant
Manager, Manager, Partner, etc.)
______________________________________________________________________
Thank you very much for your participation. Please return the completed
questionnaire in the enclosed self-addressed envelope.

430
Appendix E: Sample of invitation email promoted by NZICA
Department of Accounting and Information Systems
College of Business and Economics
Suhaila Abdul Hamid Email: [email protected]
Phone: +64 3 3642613 Fax: +64 3 3642727
A SURVEY AND INTERVIEW OF TAX COMPLIANCE AND TAX PROFESSIONALS IN
SELF-ASSESSMENT SYSTEM (SAS)
Dear Sir/Madam,
My name is Suhaila Abdul Hamid and I am currently pursuing the Degree of Doctor of Philosophy
(PhD) in the Department of Accounting and Information Systems (ACIS), at the University of
Canterbury, Christchurch, New Zealand. As a requirement for the degree, I am conducting a study
on the decision making of tax professionals in complying with the tax law under the supervision of
Professor Adrian Sawyer and Associate Prof. Andrew Maples. The research has been reviewed and
approved by the Human Ethics Committee, University of Canterbury.
The success of this project depends greatly on your participation. Therefore, I would like to invite
you to participate in the study by completing the questionnaire survey and take part in the telephone
interview later. With your support, it is hoped the study would be of great utility to enriching our
knowledge on tax professionals’ decision making and could be useful in assisting the accounting
profession, the professional bodies and the accounting educators to shape the future generation of
accounting professionals.
This questionnaire is anonymous and you will not be identified as a participant. By completing the
questionnaire it is understood that you have provided your consent to the publication of the
collective results of the study with the understanding that your anonymity will be preserved. You
may withdraw from the project until your questionnaire has been posted. Please click the following
link to answer the survey http://canterbury.qualtrics.com/SE/?SID=SV_0keNFtrysbiNXfu.
In addition to completing the questionnaire, I would like to invite you to share more of your views
and experience regarding the issue under study in a telephone interview later. It will take no longer
than an hour and will be recorded by audiotape for the purpose of ensuring that the researcher
understands correctly the information provided. You will be offered to check the transcript of the
interview to confirm the correctness of the information provided. If you agree to participate, please
complete the following link http://canterbury.qualtrics.com/SE/?SID=SV_07hFAfpkz3eoZi4.
All responses and information provided for this study will be treated with strict confidential and will
only be used for the purpose of this PhD study. All information provided will be securely stored and
subsequently destroyed upon completion of my PhD study. Since a PhD is a public document via
the University of Canterbury database, the information provided would be available to the public.
However, only collective results or information will be published without referring to any particular
individual.

431
Should you have any enquiries, please do not hesitate to contact myself at [email protected] or
my Senior Supervisor: Professor Adrian Sawyer at [email protected].
Yours Sincerely,
Suhaila Abdul Hamid
PhD Candidate
ACIS Department
University of Canterbury
Christchurch, New Zealand

432
Appendix F: Survey measures or indicators
Measures or indicators used in the survey
Measures Code Strongly
Disagree
Strongly
Agree
Power Distance PD
A junior staff should follow the instructions from
his/her superior in complying with the tax law
PD1 1 2 3 4 5 6 7
A junior staff should feel afraid to disagree with
his/her superior in complying with the tax law
PD2 1 2 3 4 5 6 7
Most of the time, a superior is expected to tell
his/her junior staff on what to do in complying
with the tax law
PD3 1 2 3 4 5 6 7
A junior staff should always be involved in the
decision making when dealing with client’s tax
matters *
PD4R 1 2 3 4 5 6 7
Individualism IND
The benefits that we as a society could enjoy
from the amount of tax collected is very
important to me *
IND1R 1 2 3 4 5 6 7
When complying with the tax law, I only
consider the effect to my client
IND2 1 2 3 4 5 6 7
I do not care whether or not the society would
benefit from the amount of tax collected as long
as I could enjoy the tax benefit
IND3 1 2 3 4 5 6 7
I would consider the long term effect to the
society when complying with the tax law*
IND4R 1 2 3 4 5 6 7
Masculinity MAS
I would rather challenge the tax authority than
negotiate with them in a tax lawsuit
MAS1 1 2 3 4 5 6 7
I always feel confident with the decision that I
make when complying with the tax law
MAS2 1 2 3 4 5 6 7
I prefer to challenge the tax authority’s decision
rather than negotiate with them
MAS3 1 2 3 4 5 6 7
I always feel confident to make my own
decisions while dealing with my client’s tax
matter
MAS4 1 2 3 4 5 6 7
Uncertainty Avoidance UAV
The more precise the tax law, the better UAV1 1 2 3 4 5 6 7
I do not mind having differences in tax
judgments with the tax authority. *
UAV2R 1 2 3 4 5 6 7
When complying with the tax law, I avoid taking
any tax risk since a tax risk could cause
unfavourable effect
UAV3 1 2 3 4 5 6 7
When complying with the tax law, a tax risk is an
opportunity. *
UAV4R 1 2 3 4 5 6 7

433
Measures Code 1 2 3 4 5 6 7
Intention INO
If I had the opportunity, I would overstate the
business travelling expenses in the tax return*
(Likely…Unlikely)
INO1R
1 2 3 4 5 6 7
I would never overstate the business travelling
expenses claimed in the tax return (True…False)
INO2 1 2 3 4 5 6 7
In the future, I may overstate the business travelling
expenses in the tax return (True…False)
INO3R 1 2 3 4 5 6 7
Attitude ATO
For me to overstate the business travelling expenses
claimed in the tax return is* (Good…Bad)
ATO1R 1 2 3 4 5 6 7
For me to overstate the business travelling expenses
in the tax return is (Worthless…Useful)
ATO2 1 2 3 4 5 6 7
For me to overstate the business travelling expenses
in the tax return is (Harmful…Beneficial)
ATO3 1 2 3 4 5 6 7
Subjective norms SNO
Most of people important to me think that I should
overstate the business travelling expenses*
(Agree…Disagree)
SNO1R
1 2 3 4 5 6 7
Most of people important to me will look down at me
if I overstate the business travelling expenses in the
tax return (Likely…Unlikely)
SNO2
1 2 3 4 5 6 7
No one who is important to me thinks it is OK to
overstate the business travelling expenses in the tax
return (Agree…Disagree)
SNO3
1 2 3 4 5 6 7
Perceived Behavioural Control PBO
For me to overstate the business travelling expenses
in the tax return is (Easy…Difficult)
PBO1 1 2 3 4 5 6 7
With my expertise, I could easily overstate the
business travelling expenses in the tax return if I
wanted to (Agree…Disagree)
PBO2
1 2 3 4 5 6 7
How much control do you have over overstating the
business travelling expenses in the tax return
(Complete control…Absolutely no control)
PBO3
1 2 3 4 5 6 7

434
Measures Code 1 2 3 4 5 6 7
Intention INU
If I had the opportunity I would omit the $2,000
cash sale from the tax computation.*
(Likely…Unlikely)
INU1R
1 2 3 4 5 6 7
I would never omit the $2,000 cash sale from
the tax computation (True…False)
INU2 1 2 3 4 5 6 7
In the future, I may omit the $2,000 cash sale
from the tax computation* (True…False)
INU3R 1 2 3 4 5 6 7
Attitude ATU
For me to omit the $2,000 cash sale from the
tax computation is (Good…Bad)
ATU1R 1 2 3 4 5 6 7
For me to omit the $2,000 cash sale from the
tax computation is (Worthless…Useful)
ATU2 1 2 3 4 5 6 7
For me to omit the $2,000 cash sale from the
tax computation is (Harmful…Beneficial)
ATU3 1 2 3 4 5 6 7
Subjective norms SNU
Most of people important to me think I should
omit the $2,000 cash sale from the tax
computation* (Agree….Disagree)
SNU1R
1 2 3 4 5 6 7
Most people who are important to me will look
down at me if I omit the $2,000 cash sale from
the tax computation (Likely…Unlikely)
SNU2
1 2 3 4 5 6 7
No one who is important to me thinks it is OK
to omit the $2,000 cash sale from the tax
computation (Agree…Disagree)
SNU3
1 2 3 4 5 6 7
Perceived Behavioural Control PBU
For me to omit the $2,000 cash sale from the
tax computation is (Easy…Difficult)
PBU1 1 2 3 4 5 6 7
With my expertise, I could easily omit the
$2,000 cash sale from the tax computation if I
wanted to (Agree…Disagree)
PBU2
1 2 3 4 5 6 7
How much control do you have over omitting
the $2,000 cash sale from the tax computation?
(Complete control…Absolutely no control)
PBU3
1 2 3 4 5 6 7

435
Measures Code 1 2 3 4 5 6 7
In your opinion, Rose’s decision to overstate the business travelling expenses is:
Moral Equity MEO
Just…….Unjust MEO1 1 2 3 4 5 6 7
Fair…….Unfair MEO2 1 2 3 4 5 6 7
Morally right …….Not morally right MEO3 1 2 3 4 5 6 7
Acceptable to my family…….Not acceptable to
my family
MEO4 1 2 3 4 5 6 7
Relativism REO
Traditionally acceptable…….Traditionally
unacceptable
REO1 1 2 3 4 5 6 7
Culturally acceptable…….Culturally
unacceptable
REO2 1 2 3 4 5 6 7
Egoism EGO
Not self-promoting for Rose…….Self-
promoting for Rose*
EGO1R 1 2 3 4 5 6 7
Personally satisfying for Rose…….Not
personally satisfying for Rose
EGO2 1 2 3 4 5 6 7
Utilitarian UTO
Produces greatest utility……..Produces the
least utility
UTO1 1 2 3 4 5 6 7
Minimizing benefits while maximizing
harm……Maximizing benefits while
minimizing harm*
UTO2R
1 2 3 4 5 6 7
Contractualism COO
Violating an unwritten contract…….Not
violating an unwritten contract*
COO1R 1 2 3 4 5 6 7
Violating an unspoken promise…….Not
violating an unspoken promise
COO2R 1 2 3 4 5 6 7

436
Measures Code 1 2 3 4 5 6 7
In your opinion, Adam’s decision to omit the $2,000 cash sale is:
Moral Equity MEU
Just…….Unjust MEU1 1 2 3 4 5 6 7
Fair…….Unfair MEU2 1 2 3 4 5 6 7
Morally right …….Not morally right MEU3 1 2 3 4 5 6 7
Acceptable to my family…….Not acceptable to
my family
MEU4 1 2 3 4 5 6 7
Relativism REU
Traditionally acceptable…….Traditionally
unacceptable
REU1 1 2 3 4 5 6 7
Culturally acceptable…….Culturally
unacceptable
REU2 1 2 3 4 5 6 7
Egoism EGU
Not self-promoting for Adam…….Self-
promoting for Adam*
EGU1R 1 2 3 4 5 6 7
Personally satisfying for Adam…….Not
personally satisfying for Adam
EGU2 1 2 3 4 5 6 7
Utilitarian UTU
Produces greatest utility……..Produces the
least utility
UTU1 1 2 3 4 5 6 7
Minimizing benefits while maximizing
harm……Maximizing benefits while
minimizing harm*
UTU2R
1 2 3 4 5 6 7
Contractualism COU
Violating an unwritten contract…….Not
violating an unwritten contract*
COU1R 1 2 3 4 5 6 7
Violating an unspoken promise…….Not
violating an unspoken promise
COU2R 1 2 3 4 5 6 7

437
Appendix G: Interview guide
Introduction
Thank you very much for your kind cooperation. Before we start our interview, I would like to
inform you the purpose and procedures for the interview today.
Purpose
The purpose of the interview is to delve into the factors that contribute to ethical decision making
by tax professionals in complying with the tax laws.
Procedure
The telephone interview should take no longer than 60 minutes each.
All interviews are recorded using audio to ensure the researcher understands the information given
during the interview.
The data would be kept securely and published only for the purposes of this research without
identifying you as a participant.
Participants will be referred by numbers in any publication to maintain confidentiality. For instance
(participant no 1. no. 2 etc).
The questions are related to your opinions and experience as tax professionals in complying with
the tax laws. Thus, I would be grateful if you could provide examples in your answers for better
understanding.
Section 1: Demographic details
Could you please tell me a little bit of your background
Gender
Age
Years of experience in doing tax job
Position in the firm
Type of firm currently working
Ethnicity
Section 2: General tax compliance
Could you please explain the term ‘tax compliance’?
Could you please explain how do you make decisions before advising your clients?
Section 3: Theory of Planned Behaviour
Could you please explain whether or not your own attitude towards tax compliance influences your
intention to comply with the tax laws?
Could you please explain whether the people close to you (for example: family, friends, colleagues)
have any influence in your decision making when complying with the tax law?
Do you always have control in deciding whether or not to comply with the tax laws? Please explain.
Section 3: Ethics and tax compliance
What do you understand by the term ‘ethics’?
What do you understand about ethical sensitivity or ethical awareness in complying with tax law?
Please explain.

438
Do you think your ethical sensitivity helps you in complying with the tax law? If yes, please
explain.
Section 4: Culture and tax compliance
How do you perceive yourself (apart from as a tax professional) while assisting your clients to
comply with tax laws? (for example: as an individual, a member of a society, a citizen of a nation)
In complying with the tax law, how important is your superior or your staffs to you? Please explain.
(For instance, do you consider their opinion, consult with them or discuss with them before making
decision?)
In complying with the tax law, do you consider the effect to the society? Please explain.
In complying with the tax law, do you feel afraid or uncomfortable to take risk? Please explain.
Wrap up section
What is the most important motivation that drives you to comply with the tax law?
Do you have any questions?
Thank you very much. I appreciate very much your contribution in this study.
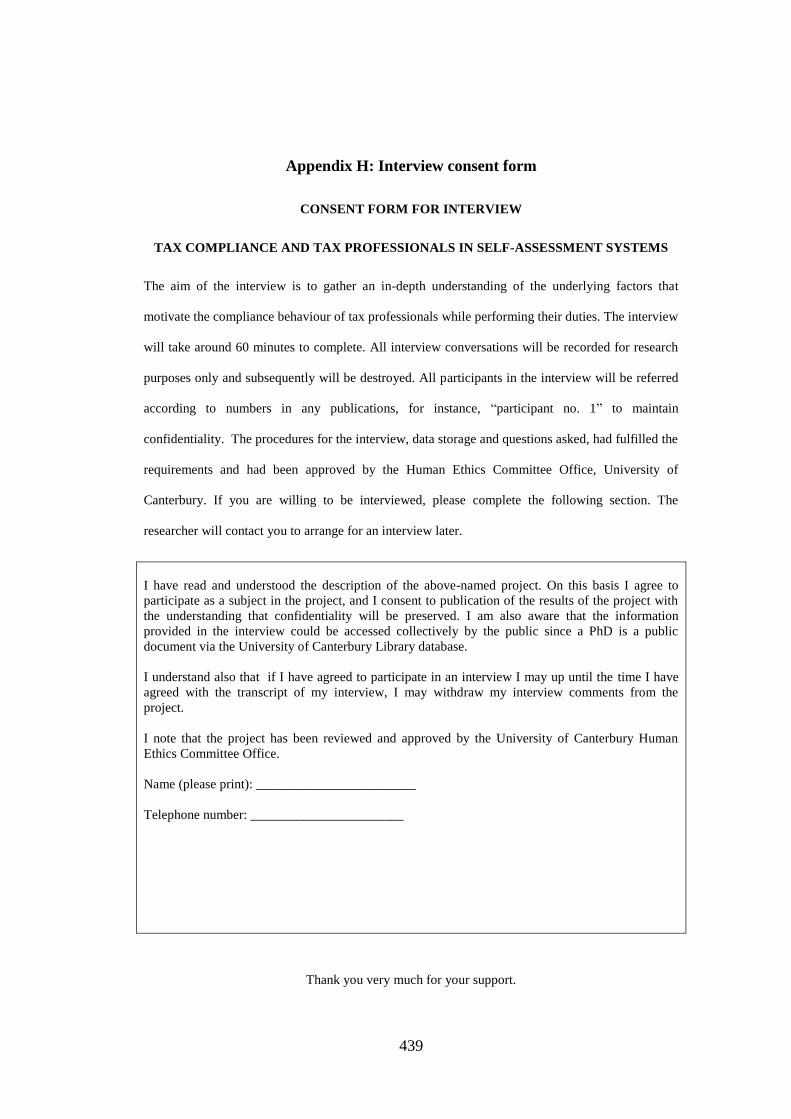
439
Appendix H: Interview consent form
CONSENT FORM FOR INTERVIEW
TAX COMPLIANCE AND TAX PROFESSIONALS IN SELF-ASSESSMENT SYSTEMS
The aim of the interview is to gather an in-depth understanding of the underlying factors that
motivate the compliance behaviour of tax professionals while performing their duties. The interview
will take around 60 minutes to complete. All interview conversations will be recorded for research
purposes only and subsequently will be destroyed. All participants in the interview will be referred
according to numbers in any publications, for instance, “participant no. 1” to maintain
confidentiality. The procedures for the interview, data storage and questions asked, had fulfilled the
requirements and had been approved by the Human Ethics Committee Office, University of
Canterbury. If you are willing to be interviewed, please complete the following section. The
researcher will contact you to arrange for an interview later.
I have read and understood the description of the above-named project. On this basis I agree to
participate as a subject in the project, and I consent to publication of the results of the project with
the understanding that confidentiality will be preserved. I am also aware that the information
provided in the interview could be accessed collectively by the public since a PhD is a public
document via the University of Canterbury Library database.
I understand also that if I have agreed to participate in an interview I may up until the time I have
agreed with the transcript of my interview, I may withdraw my interview comments from the
project.
I note that the project has been reviewed and approved by the University of Canterbury Human
Ethics Committee Office.
Name (please print): ________________________
Telephone number: _______________________
Thank you very much for your support.

440
Appendix I: Nonresponse bias test - Malaysia
Independent Samples Test for Non-response Bias : Malaysia
Levene's Test
for Equality of
Variances t-test for Equality of Means
F Sig. t df
Sig. (2-
tailed)
Mean
Difference
Std. Error
Difference
95% Confidence Interval of
the Difference
Lower Upper
PD1 Equal variances assumed .001 .980 -.696 90 .488 -.254 .365 -.978 .470
Equal variances not
assumed
-.697 89.997 .488 -.254 .364 -.978 .470
PD2 Equal variances assumed .703 .404 -1.574 90 .119 -.606 .385 -1.372 .159
Equal variances not
assumed
-1.581 87.025 .117 -.606 .383 -1.369 .156
PD3 Equal variances assumed .480 .490 -1.288 90 .201 -.471 .366 -1.198 .256
Equal variances not
assumed
-1.284 87.820 .202 -.471 .367 -1.200 .258
PD4R Equal variances assumed .000 .985 -.461 90 .646 -.126 .274 -.670 .418
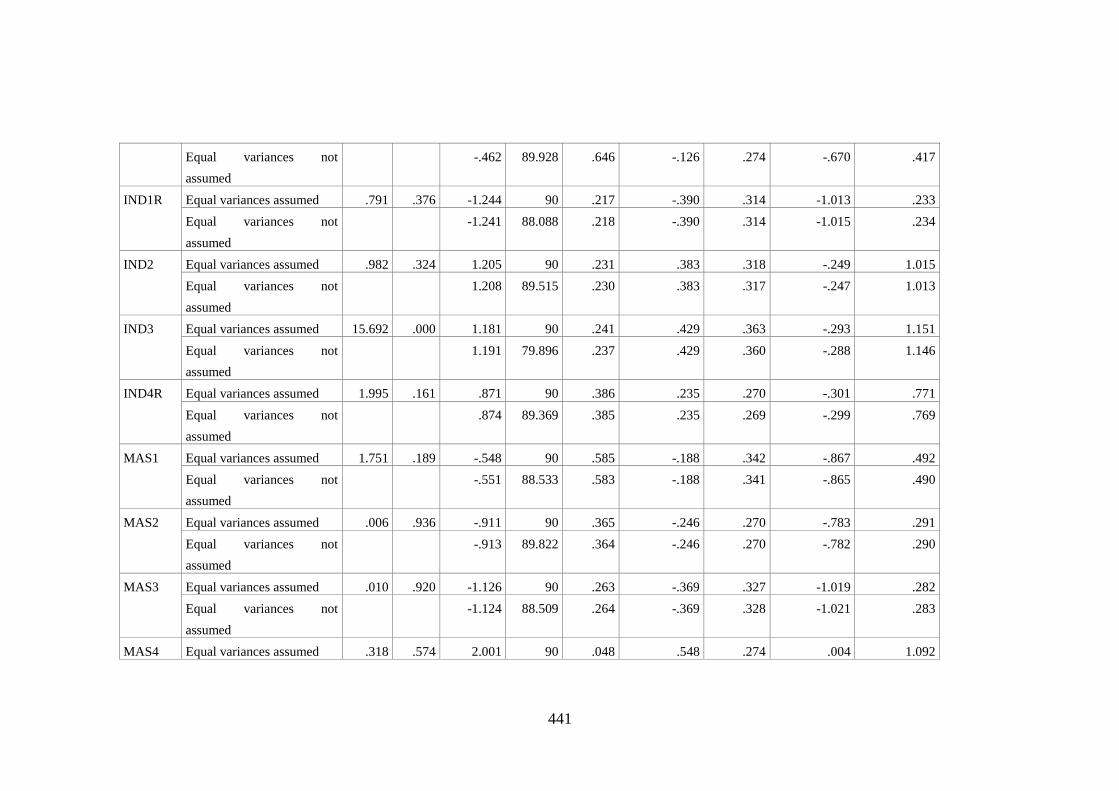
441
Equal variances not
assumed
-.462 89.928 .646 -.126 .274 -.670 .417
IND1R Equal variances assumed .791 .376 -1.244 90 .217 -.390 .314 -1.013 .233
Equal variances not
assumed
-1.241 88.088 .218 -.390 .314 -1.015 .234
IND2 Equal variances assumed .982 .324 1.205 90 .231 .383 .318 -.249 1.015
Equal variances not
assumed
1.208 89.515 .230 .383 .317 -.247 1.013
IND3 Equal variances assumed 15.692 .000 1.181 90 .241 .429 .363 -.293 1.151
Equal variances not
assumed
1.191 79.896 .237 .429 .360 -.288 1.146
IND4R Equal variances assumed 1.995 .161 .871 90 .386 .235 .270 -.301 .771
Equal variances not
assumed
.874 89.369 .385 .235 .269 -.299 .769
MAS1 Equal variances assumed 1.751 .189 -.548 90 .585 -.188 .342 -.867 .492
Equal variances not
assumed
-.551 88.533 .583 -.188 .341 -.865 .490
MAS2 Equal variances assumed .006 .936 -.911 90 .365 -.246 .270 -.783 .291
Equal variances not
assumed
-.913 89.822 .364 -.246 .270 -.782 .290
MAS3 Equal variances assumed .010 .920 -1.126 90 .263 -.369 .327 -1.019 .282
Equal variances not
assumed
-1.124 88.509 .264 -.369 .328 -1.021 .283
MAS4 Equal variances assumed .318 .574 2.001 90 .048 .548 .274 .004 1.092

442
Equal variances not
assumed
2.001 89.934 .048 .548 .274 .004 1.092
UAV1 Equal variances assumed 10.566 .002 2.713 90 .008 .624 .230 .167 1.081
Equal variances not
assumed
2.695 80.209 .009 .624 .231 .163 1.085
UAV2R Equal variances assumed 2.710 .103 -.976 90 .332 -.335 .343 -1.018 .347
Equal variances not
assumed
-.980 88.535 .330 -.335 .342 -1.015 .345
UAV3 Equal variances assumed 1.140 .289 1.360 90 .177 .401 .295 -.185 .987
Equal variances not
assumed
1.355 86.216 .179 .401 .296 -.187 .989
UAV4R Equal variances assumed 1.025 .314 -.458 90 .648 -.146 .319 -.780 .488
Equal variances not
assumed
-.459 89.895 .648 -.146 .319 -.779 .487

443
Appendix J: Nonresponse bias test - New Zealand
Independent Samples Test for Non-response Bias : New Zealand
Levene's Test for
Equality of Variances t-test for Equality of Means
F Sig. t df Sig. (2-tailed)
Mean
Difference
Std. Error
Difference
95% Confidence
Interval of the
Difference
Lower Upper
PD1 Equal variances assumed 1.615 .206 -.961 117 .339 -.281 .293 -.860 .298
Equal variances not
assumed
-.947 91.279 .346 -.281 .297 -.871 .308
PD2 Equal variances assumed 4.549 .035 -2.383 117 .019 -.582 .244 -1.067 -.098
Equal variances not
assumed
-2.288 83.220 .025 -.582 .255 -1.089 -.076
PD3 Equal variances assumed 3.490 .064 -.457 117 .648 -.136 .298 -.725 .453
Equal variances not
assumed
-.442 84.910 .660 -.136 .308 -.749 .477
PD4R Equal variances assumed 2.842 .094 .748 117 .456 .202 .270 -.332 .736
Equal variances not
assumed
.730 87.917 .468 .202 .277 -.348 .752
IND1R Equal variances assumed 2.600 .110 .582 117 .562 .108 .186 -.260 .476

444
Equal variances not
assumed
.619 113.108 .537 .108 .175 -.238 .454
IND2 Equal variances assumed 4.059 .046 .044 117 .965 .015 .332 -.643 .672
Equal variances not
assumed
.042 84.570 .966 .015 .344 -.670 .700
IND3 Equal variances assumed .255 .615 -.511 117 .610 -.137 .268 -.669 .394
Equal variances not
assumed
-.507 92.855 .614 -.137 .271 -.675 .401
IND4R Equal variances assumed 2.699 .103 -.308 117 .758 -.092 .300 -.687 .502
Equal variances not
assumed
-.298 85.543 .766 -.092 .310 -.709 .524
MAS1 Equal variances assumed .888 .348 .267 117 .790 .087 .325 -.557 .730
Equal variances not
assumed
.263 91.993 .793 .087 .329 -.567 .740
MAS2 Equal variances assumed 4.824 .030 1.828 117 .070 .412 .225 -.034 .859
Equal variances not
assumed
1.683 71.720 .097 .412 .245 -.076 .900
MAS3 Equal variances assumed 3.377 .069 -.274 117 .784 -.058 .212 -.477 .361
Equal variances not
assumed
-.261 80.725 .795 -.058 .222 -.500 .384
MAS4 Equal variances assumed .507 .478 .034 117 .973 .009 .255 -.495 .513
Equal variances not
assumed
.034 92.236 .973 .009 .257 -.503 .520
UAV1 Equal variances assumed .102 .750 -.856 117 .394 -.189 .221 -.627 .249

445
Equal variances not
assumed
-.856 95.838 .394 -.189 .221 -.628 .250
UAV2R Equal variances assumed 1.778 .185 1.069 117 .287 .346 .324 -.295 .988
Equal variances not
assumed
1.097 103.752 .275 .346 .316 -.280 .972
UAV3 Equal variances assumed .187 .666 1.028 117 .306 .298 .290 -.276 .873
Equal variances not
assumed
1.035 98.035 .303 .298 .288 -.274 .870
UAV4R Equal variances assumed .644 .424 -.398 117 .692 -.100 .251 -.596 .397
Equal variances not
assumed
-.390 89.318 .698 -.100 .256 -.608 .409

446
Appendix K: Descriptive statistics - Malaysia
N Minimum Maximum Skewness Kurtosis
Statistic Statistic Statistic Statistic
Std.
Error Statistic Std. Error
PD1 92 1 7 -.920 .251 .140 .498
PD2 92 1 7 1.077 .251 3.301 .498
PD3 92 1 7 .052 .251 -.189 .498
PD4R 92 1 7 .652 .251 .159 .498
IND1R 92 1 7 1.165 .251 1.110 .498
IND2 92 1 7 -.130 .251 -.218 .498
IND3 92 1 7 .550 .251 -.630 .498
IND4R 92 1 7 .398 .251 .070 .498
MAS1 92 1 7 .017 .251 -.677 .498
MAS2 92 2 7 -.155 .251 -.720 .498
MAS3 92 1 7 .258 .251 -.401 .498
MAS4 92 1 7 -.469 .251 .385 .498
UAV1 92 3 7 -.510 .251 -.682 .498
UAV2R 92 1 7 .149 .251 -.728 .498
UAV3 92 1 7 -.522 .251 .103 .498
UAV4R 92 1 7 -.080 .251 -.448 .498
INO1R 92 1 7 .321 .251 -1.073 .498
INO2 92 1 7 .291 .251 -.982 .498
INO3R 92 1 7 .418 .251 -1.014 .498
ATO1R 92 1 7 .314 .251 -.760 .498
ATO2 92 1 7 -.148 .251 -1.071 .498
ATO3 92 1 7 .345 .251 -.654 .498
SNO1R 92 1 7 .095 .251 -.943 .498
SNO2 92 1 7 -.171 .251 -.617 .498
SNO3 92 1 7 .126 .251 -.473 .498
PBO1 92 1 7 -.103 .251 -.842 .498
PBO2 92 1 7 .288 .251 -.980 .498
PBO3 92 1 7 .557 .251 -.113 .498
MEO1 92 1 7 -.055 .251 -.902 .498
MEO2 92 1 7 -.496 .251 -.179 .498
MEO3 92 2 7 -.325 .251 -.703 .498
MEO4 92 1 7 -.218 .251 -.860 .498
REO1 92 1 7 .046 .251 -.646 .498
REO2 92 1 7 -.104 .251 -.798 .498
EGO1R 92 1 7 .096 .251 -.402 .498

447
N Minimum Maximum Skewness Kurtosis
Statistic Statistic Statistic Statistic
Std.
Error Statistic
Std.
Error
EGO2 92 1 7 .138 .251 -.853 .498
UTO2R 92 1 7 .025 .251 -.520 .498
COO1R 92 1 7 .003 .251 -.225 .498
COO2R 92 1 7 -.016 .251 -.156 .498
PEERO 92 1 7 .113 .251 -.752 .498
SELFO 92 1 7 -.187 .251 -.764 .498
INU1R 92 1 7 .414 .251 -.845 .498
INU2 92 1 7 .150 .251 -.881 .498
INU3R 92 1 7 .441 .251 -.661 .498
ATU1R 92 1 6 .364 .251 -.603 .498
ATU2 92 1 7 -.103 .251 -.606 .498
ATU3 92 1 7 .222 .251 -.248 .498
SNU1R 92 1 7 .266 .251 -.748 .498
SNU2 92 1 7 .047 .251 -.835 .498
SNU3 92 1 7 .178 .251 -.349 .498
PBU1 92 1 7 .357 .251 -.716 .498
PBU2 92 1 7 .774 .251 -.046 .498
PBU3 92 1 7 .296 .251 -.432 .498
MEU1 92 1 7 -.432 .251 -.294 .498
MEU2 92 1 7 -.468 .251 -.045 .498
MEU3 92 1 7 -.588 .251 -.016 .498
MEU4 92 1 7 -.097 .251 -.780 .498
REU1 92 1 7 .030 .251 -.615 .498
REU2 92 1 7 -.012 .251 -.831 .498
EGU1R 92 1 7 .056 .251 -.024 .498
EGU2 92 1 7 .061 .251 -.441 .498
UTU1 92 1 7 .123 .251 -.339 .498
UTU2R 92 1 7 .071 .251 -.454 .498
COU1R 92 1 7 .120 .251 -.736 .498
COU2R 92 1 7 .062 .251 -.446 .498
PEERU 92 1 7 -.018 .251 -.811 .498
SELFU 92 1 7 -.457 .251 -.560 .498
Valid N
(listwise)
92

448
Appendix L: Descriptive statistics – New Zealand
N Minimum Maximum Skewness Kurtosis
Statistic Statistic Statistic Statistic Std. Error Statistic Std. Error
PD1 119 1 7 -.646 .222 -.110 .440
PD2 119 1 6 .695 .222 .005 .440
PD3 119 1 7 -.148 .222 -.562 .440
PD4R 119 1 7 .088 .222 -.232 .440
IND1R 119 1 6 .957 .222 1.658 .440
IND2 119 1 7 -.240 .222 -1.149 .440
IND3 119 1 7 1.175 .222 1.112 .440
IND4R 119 1 7 -.222 .222 -.911 .440
MAS1 119 1 7 .371 .222 -.938 .440
MAS2 119 1 7 -1.298 .222 1.534 .440
MAS3 119 1 5 .421 .222 -.575 .440
MAS4 119 2 7 -.751 .222 -.515 .440
UAV1 119 2 7 -1.400 .222 1.737 .440
UAV2R 119 1 7 .206 .222 -1.284 .440
UAV3 119 1 7 -.045 .222 -.968 .440
UAV4R 119 2 7 -.138 .222 -1.026 .440
INO1R 119 1 7 1.705 .222 1.806 .440
INO2 119 1 7 .996 .222 -.236 .440
INO3R 119 1 7 1.658 .222 2.062 .440
ATO1R 119 1 7 1.999 .222 4.454 .440
ATO2 119 1 7 .630 .222 -.595 .440
ATO3 119 1 7 .948 .222 .122 .440
SNO1R 119 1 6 1.229 .222 .463 .440
SNO2 119 1 7 .487 .222 -1.023 .440
SNO3 119 1 7 .569 .222 -.915 .440
PBO1 119 1 7 -.273 .222 -1.558 .440
PBO2 119 1 7 1.349 .222 .708 .440
PBO3 119 1 7 1.336 .222 1.652 .440
MEO1 119 1 7 -1.463 .222 2.014 .440
MEO2 119 1 7 -1.191 .222 .872 .440
MEO3 119 1 7 -2.033 .222 5.638 .440
MEO4 119 2 7 -1.145 .222 .335 .440
REO1 119 1 7 -.423 .222 -1.049 .440
REO2 119 1 7 -.229 .222 -1.105 .440
EGO1R 119 1 7 .901 .222 -.285 .440

449
N Minimum Maximum Skewness Kurtosis
Statistic Statistic Statistic Statistic
Std.
Error Statistic
Std.
Error
EGO2 119 1 7 .518 .222 -.930 .440
UTO1 119 1 7 -.077 .222 -.510 .440
UTO2R 119 1 7 -.258 .222 -.507 .440
COO1R 119 1 7 -.705 .222 -.427 .440
COO2R 119 1 7 -.637 .222 -.183 .440
PEERO 119 1 7 -.118 .222 -1.189 .440
SELFO 119 1 7 -.943 .222 -.567 .440
INU1R 119 1 7 3.383 .222 12.265 .440
INU2 119 1 7 1.797 .222 2.034 .440
INU3R 119 1 7 2.032 .222 3.637 .440
ATU1R 119 1 5 2.441 .222 7.643 .440
ATU2 119 1 7 .619 .222 -1.030 .440
ATU3 119 1 7 1.234 .222 .413 .440
SNU1R 119 1 7 1.605 .222 1.919 .440
SNU2 119 1 7 .905 .222 -.392 .440
SNU3 119 1 7 .998 .222 -.309 .440
PBU1 119 1 7 -.230 .222 -1.743 .440
PBU2 119 1 7 1.685 .222 2.234 .440
PBU3 119 1 7 1.658 .222 2.479 .440
MEU1 119 1 7 -3.407 .222 11.916 .440
MEU2 119 1 7 -3.426 .222 13.448 .440
MEU3 119 4 7 -3.481 .222 11.597 .440
MEU4 119 2 7 -2.532 .222 6.331 .440
REU1 119 2 7 -1.012 .222 -.477 .440
REU2 119 2 7 -.774 .222 -.673 .440
EGU1R 119 1 7 1.395 .222 .724 .440
EGU2 119 1 7 .630 .222 -.846 .440
UTU1 119 1 7 -.353 .222 -.155 .440
UTU2R 119 1 7 -.234 .222 -.911 .440
COU1R 119 1 7 -1.023 .222 .167 .440
COU2R 119 1 7 -.953 .222 .190 .440
PEERU 119 1 7 -.637 .222 -.840 .440
SELFU 119 1 7 -1.561 .222 1.094 .440
Valid N
(listwise)
119

450
Appendix M: Common method bias - Malaysia
Common Method Bias Test - Total Variance Explained
Component Initial Eigenvalues Extraction Sums of Squared Loadings
Total
% of
Variance Cumulative % Total % of Variance Cumulative %
1 18.183 26.740 26.740 18.183 26.740 26.740
2 5.226 7.685 34.425
3 3.600 5.294 39.719
4 3.386 4.979 44.698
5 2.928 4.306 49.004
6 2.517 3.701 52.705
7 2.408 3.542 56.247
8 2.146 3.156 59.403
9 2.019 2.969 62.373
10 1.770 2.603 64.976
11 1.659 2.440 67.416
12 1.548 2.276 69.692
13 1.466 2.155 71.847
14 1.303 1.916 73.763
15 1.252 1.841 75.604
16 1.165 1.713 77.317
17 1.150 1.691 79.008
18 1.036 1.523 80.532
19 .972 1.429 81.960
20 .858 1.261 83.222
21 .827 1.216 84.437
22 .763 1.123 85.560
23 .707 1.039 86.599
24 .676 .994 87.593
25 .648 .953 88.546
26 .537 .790 89.336
27 .531 .781 90.117
28 .495 .727 90.845
29 .457 .672 91.517
30 .444 .653 92.170
31 .423 .622 92.792
32 .389 .572 93.364
33 .351 .517 93.881
34 .343 .505 94.385
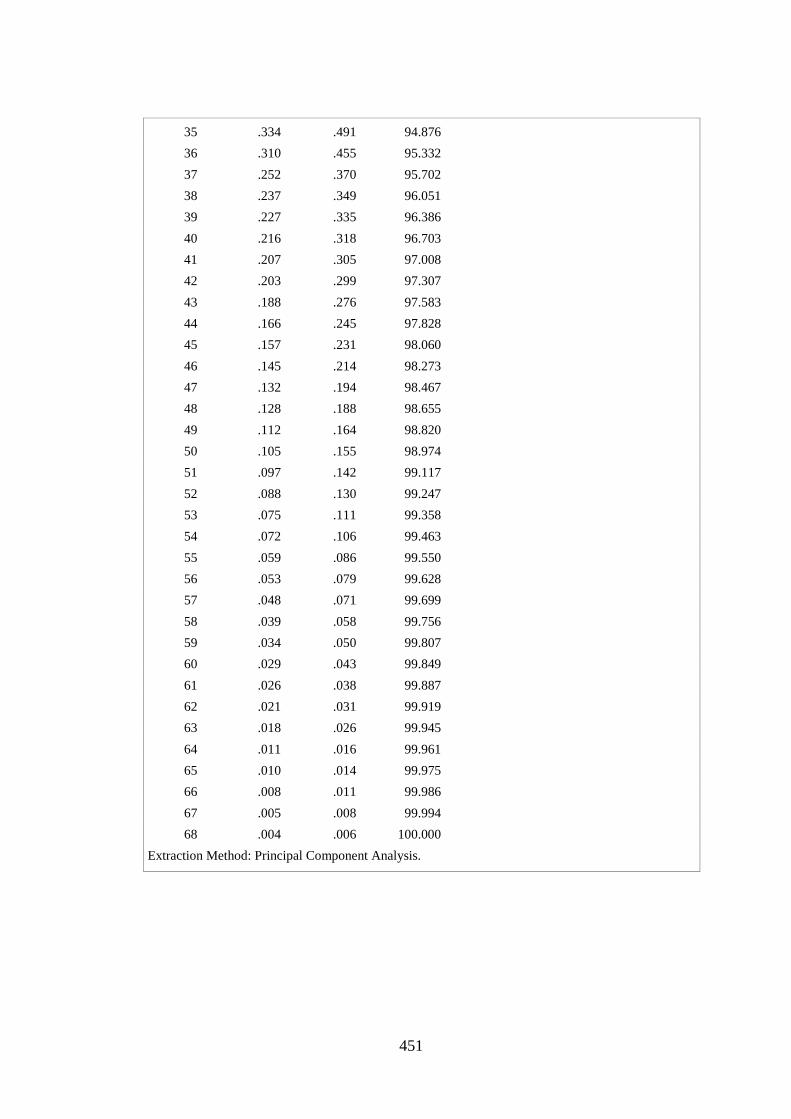
451
35 .334 .491 94.876
36 .310 .455 95.332
37 .252 .370 95.702
38 .237 .349 96.051
39 .227 .335 96.386
40 .216 .318 96.703
41 .207 .305 97.008
42 .203 .299 97.307
43 .188 .276 97.583
44 .166 .245 97.828
45 .157 .231 98.060
46 .145 .214 98.273
47 .132 .194 98.467
48 .128 .188 98.655
49 .112 .164 98.820
50 .105 .155 98.974
51 .097 .142 99.117
52 .088 .130 99.247
53 .075 .111 99.358
54 .072 .106 99.463
55 .059 .086 99.550
56 .053 .079 99.628
57 .048 .071 99.699
58 .039 .058 99.756
59 .034 .050 99.807
60 .029 .043 99.849
61 .026 .038 99.887
62 .021 .031 99.919
63 .018 .026 99.945
64 .011 .016 99.961
65 .010 .014 99.975
66 .008 .011 99.986
67 .005 .008 99.994
68 .004 .006 100.000
Extraction Method: Principal Component Analysis.

452
Appendix N: Common method bias – New Zealand
Common Method Bias Test - Total Variance Explained
Component Initial Eigenvalues Extraction Sums of Squared Loadings
Total
% of
Variance
Cumulative
% Total
% of
Variance Cumulative %
1 13.919 20.468 20.468 13.919 20.468 20.468
2 4.493 6.608 27.076
3 3.767 5.540 32.616
4 3.077 4.525 37.141
5 2.864 4.212 41.353
6 2.551 3.752 45.105
7 2.501 3.678 48.783
8 2.293 3.373 52.155
9 2.224 3.271 55.426
10 2.108 3.100 58.526
11 1.724 2.535 61.061
12 1.599 2.352 63.413
13 1.526 2.244 65.657
14 1.448 2.129 67.786
15 1.343 1.975 69.761
16 1.226 1.803 71.564
17 1.175 1.728 73.292
18 1.128 1.658 74.950
19 1.086 1.598 76.548
20 1.012 1.488 78.036
21 .960 1.412 79.448
22 .917 1.349 80.797
23 .869 1.277 82.074
24 .856 1.259 83.333
25 .732 1.076 84.409
26 .692 1.017 85.426
27 .666 .980 86.405
28 .626 .920 87.326
29 .615 .905 88.230
30 .541 .796 89.027

453
31 .519 .763 89.790
32 .489 .719 90.509
33 .475 .699 91.208
34 .449 .660 91.868
35 .413 .607 92.475
36 .354 .520 92.995
37 .349 .514 93.509
38 .338 .497 94.006
39 .326 .479 94.485
40 .307 .451 94.936
41 .277 .407 95.343
42 .247 .364 95.707
43 .243 .358 96.064
44 .233 .342 96.407
45 .229 .337 96.744
46 .213 .313 97.057
47 .198 .292 97.349
48 .183 .269 97.617
49 .171 .251 97.869
50 .165 .243 98.111
51 .147 .215 98.327
52 .140 .205 98.532
53 .127 .187 98.720
54 .109 .160 98.880
55 .103 .151 99.031
56 .099 .145 99.176
57 .088 .129 99.305
58 .083 .122 99.427
59 .073 .108 99.536
60 .062 .092 99.627
61 .055 .081 99.708
62 .052 .076 99.784
63 .042 .061 99.845
64 .031 .046 99.891
65 .027 .040 99.931
66 .022 .032 99.963
67 .017 .025 99.988
68 .008 .012 100.000

454
Appendix O: Social desirability bias tests - Malaysia
Paired Samples Test (Overstating tax expenses) – Malaysia
Paired Differences
t df Sig. (2-tailed) Mean Std. Deviation Std. Error Mean
95% Confidence Interval of the
Difference
Lower Upper
Pair 1 PEERO - SELFO -.848 1.575 .164 -1.174 -.522 -5.162 91 .000
Paired Samples Test (Understating income scenario) – Malaysia
Paired Differences
t df Sig. (2-tailed) Mean Std. Deviation Std. Error Mean
95% Confidence Interval of the
Difference
Lower Upper
Pair 1 PEERU - SELFU -.761 1.550 .162 -1.082 -.440 -4.707 91 .000

455
Appendix P: Social desirability bias tests – New Zealand
Paired Samples Test (Overstating tax expenses) – New Zealand
Paired Differences
t df Sig. (2-tailed) Mean Std. Deviation Std. Error Mean
95% Confidence Interval of the
Difference
Lower Upper
Pair 1 PEERO - SELFO -.983 1.647 .151 -1.282 -.684 -6.513 118 .000
Paired Samples Test (Understating income expenses) – New Zealand
Paired Differences
t df Sig. (2-tailed) Mean Std. Deviation Std. Error Mean
95% Confidence Interval of the
Difference
Lower Upper
Pair 1 PEERU - SELFU -.899 1.607 .147 -1.191 -.607 -6.103 118 .000

456
Appendix Q: Independent samples test for overall perceptions between Malaysia and New Zealand tax agents
Independent Samples Test – Comparison between Tax Agents from Malaysia and New Zealand on Culture, Theory of Planned Behaviour
and Ethical Sensitivity
Levene's Test for Equality
of Variances t-test for Equality of Means
F Sig. t df
Sig. (2-
tailed)
Mean
Difference
Std. Error
Difference
95% Confidence Interval of the
Difference
Lower Upper
PD Equal variances assumed .368 .545 -.390 209 .697 -.054 .139 -.328 .220
Equal variances not assumed -.388 191.812 .698 -.054 .140 -.329 .221
IND Equal variances assumed 2.566 .111 .971 209 .333 .121 .125 -.125 .367
Equal variances not assumed .990 206.461 .323 .121 .122 -.120 .362
MAS Equal variances assumed .011 .916 -3.536 209 .000 -.401 .113 -.625 -.178
Equal variances not assumed -3.529 194.169 .001 -.401 .114 -.626 -.177
UAV Equal variances assumed 3.219 .074 1.373 209 .171 .165 .120 -.072 .403
Equal variances not assumed 1.393 204.877 .165 .165 .119 -.069 .399
INO Equal variances assumed 8.312 .004 -4.566 209 .000 -.925 .202 -1.324 -.525
Equal variances not assumed -4.475 178.739 .000 -.925 .207 -1.332 -.517
ATO Equal variances assumed 4.496 .035 -4.812 209 .000 -.908 .189 -1.280 -.536
Equal variances not assumed -4.687 173.006 .000 -.908 .194 -1.291 -.526
SNO Equal variances assumed 11.478 .001 -5.939 209 .000 -1.067 .180 -1.421 -.713
Equal variances not assumed -6.092 208.319 .000 -1.067 .175 -1.412 -.722

457
PBO Equal variances assumed 1.906 .169 -4.607 209 .000 -.785 .170 -1.121 -.449
Equal variances not assumed -4.679 205.137 .000 -.785 .168 -1.116 -.454
MEO Equal variances assumed 6.220 .013 6.464 209 .000 1.126 .174 .782 1.469
Equal variances not assumed 6.272 169.132 .000 1.126 .179 .771 1.480
REO Equal variances assumed 2.955 .087 2.630 209 .009 .602 .229 .151 1.053
Equal variances not assumed 2.646 200.043 .009 .602 .227 .153 1.050
EGO Equal variances assumed 5.798 .017 -4.658 209 .000 -.833 .179 -1.186 -.480
Equal variances not assumed -4.658 202.866 .000 -.133 .177 -1.182 -.484
UTO Equal variances assumed 1.045 .308 1.735 209 .084 .319 .184 -.044 .682
Equal variances not assumed 1.749 201.418 .082 .319 .183 -.041 .679
COO Equal variances assumed 4.351 .038 1.576 209 .116 .360 .228 -.090 .810
Equal variances not assumed 1.614 207.935 .108 .360 .223 -.080 .799
INU Equal variances assumed 12.345 .001 -7.944 209 .000 -1.434 .181 -1.790 -1.078
Equal variances not assumed -7.694 167.501 .000 -1.434 .186 -1.802 -1.066
ATU Equal variances assumed .027 .870 -5.285 209 .000 -.907 .172 -1.245 -.569
Equal variances not assumed -5.258 191.811 .000 -.907 .172 -1.247 -.567
SNU Equal variances assumed 13.976 .000 -7.249 209 .000 -1.324 .183 -1.684 -.964
Equal variances not assumed -7.436 208.289 .000 -1.324 .178 -1.675 -.973
PBU Equal variances assumed .005 .942 -2.017 209 .045 -.391 .194 -.774 -.009
Equal variances not assumed -1.994 186.411 .048 -.391 .196 -.779 -.004
MEU Equal variances assumed 51.304 .000 10.455 209 .000 1.524 .146 1.237 1.812
Equal variances not assumed 9.780 134.816 .000 1.524 .156 1.216 1.832
REU Equal variances assumed 1.832 .177 5.162 209 .000 1.107 .214 .684 1.530
Equal variances not assumed 5.184 198.814 .000 1.107 .214 .686 1.528

458
EGU Equal variances assumed 35.676 .000 -7.348 209 .000 -1.326 .181 -1.682 -.971
Equal variances not assumed -7.643 208.337 .000 -1.326 .174 -1.669 -.984
UTU Equal variances assumed 5.709 .018 3.013 209 .003 .550 .183 .190 .910
Equal variances not assumed 3.061 205.312 .002 .550 .180 .196 .904
COU Equal variances assumed 3.392 .067 2.932 209 .004 .665 .227 .218 1.112
Equal variances not assumed 2.997 207.404 .003 .665 .222 .227 1.102

459
Appendix R: Extracts of SmartPLS results
1. PLS algorithm for overstating tax expense scenario (revised model) –
Malaysia
2. Bootstrapping for overstating tax expense scenario (revised model) –
Malaysia
3. PLS algorithm for overstating tax expense scenario (revised model) – New
Zealand
4. Bootstrapping for overstating tax expense scenario (revised model) – New
Zealand
5. PLS algorithm for understating income scenario (revised model) – Malaysia
6. Bootstrapping for understating income scenario (revised model) – Malaysia
7. PLS algorithm for understating income scenario (revised model) – New
Zealand
8. Bootstrapping for understating income scenario (revised model) – New
Zealand
9. PLS algorithm for second order factor and structural models for overstating
tax expense scenario – Malaysia
10. Bootstrapping for second order factor and structural models for overstating
tax expense scenario – Malaysia
11. PLS algorithm for second order factor and structural models for overstating
tax expense scenario – New Zealand
12. Bootstrapping for second order factor and structural models for overstating
tax expense scenario – New Zealand
13. PLS algorithm for second order factor and structural models for
understating income scenario – Malaysia
14. Bootstrapping for second order factor and structural models for understating
income scenario – Malaysia
15. PLS algorithm for second order factor and structural models for
understating income scenario – New Zealand
16. Bootstrapping for second order factor and structural models for understating
income scenario – New Zealand

460
PLS algorithm for overstating tax expense scenario (revised model) - Malaysia
Report November 12, 2013 11:36:58 AM
Table of contents (complete)
Model
o Specification
Measurement Model Specification
Manifest Variable Scores (Original)
Structural Model Specification
PLS
o Quality Criteria
Overview
Redundancy
Cronbachs Alpha
Latent Variable Correlations
R Square
Cross Loadings
AVE
Communality
Total Effects
Composite Reliability
o Calculation Results
Stop Criterion Changes
Outer Loadings
Outer Model (Weights or Loadings)
Path Coefficients
Latent Variable Scores
Manifest Variable Scores (Used)
Outer Weights
Data Preprocessing
o Results (chronologically)
Step 0 (Original Matrix)
Index Values
o Results
Measurement Model (restandardised)
Path Coefficients
Measurement Model
Latent Variable Scores (unstandardised)
Index Values for Latent Variables

461
PLS Quality Criteria
Overview
AVE Composite
Reliability R Square
Cronbachs
Alpha Communality Redundancy
ATO 0.831852 0.936874 0.899142 0.831852
COO 0.977573 0.988659 0.977064 0.977573
EGO 0.518203 0.680212 0.071925 0.518203
IND 0.469939 0.639064 -0.128288 0.469939
INO 0.814119 0.929273 0.797143 0.885818 0.814119 0.584440
MAS 0.608104 0.755497 0.359538 0.608104
MEO 0.789087 0.937197 0.909926 0.789087
PBO 0.539955 0.673440 0.203867 0.539955
PD 0.554380 0.782706 0.628208 0.554380
REO 0.901219 0.948043 0.890406 0.901219
SNO 0.630956 0.766831 0.466314 0.630956
UAV 0.528282 0.690551 0.107917 0.528282
UTO 0.616493 0.762631 0.378590 0.616493

462
Latent Variable Correlations
ATO COO EGO IND INO MAS MEO PBO PD REO SNO UAV UTO
ATO 1.000000
COO -0.276721 1.000000
EGO -0.238661 0.166970 1.000000
IND 0.301539 -0.094764 0.138585 1.000000
INO 0.865590 -0.322379 -0.275835 0.259234 1.000000
MAS -0.181255 0.179226 -0.063334 -0.301364 -0.249162 1.000000
MEO -0.806090 0.413296 0.272274 -0.225227 -0.775977 0.221933 1.000000
PBO -0.304107 0.158895 0.107383 0.086630 -0.250828 -0.082570 0.366329 1.000000
PD 0.295825 -0.165822 -0.200692 0.046991 0.274015 0.080267 -0.351399 -0.208647 1.000000
REO -0.489186 0.104688 0.200750 -0.020287 -0.498893 0.202641 0.620882 0.369404 -0.120217 1.000000
SNO 0.669349 -0.306927 -0.200770 0.165731 0.673164 -0.289296 -0.647403 -0.311092 0.349611 -0.565837 1.000000
UAV -0.165336 0.177104 0.041411 -0.344042 -0.184592 0.230442 0.159848 0.024873 -0.054330 -0.035387 -0.029688 1.000000
UTO -0.572225 0.416395 0.331365 -0.006047 -0.467756 0.027089 0.600605 0.267793 -0.238907 0.480846 -0.452872 0.010908 1.000000

463
Cross Loadings
Loadings
ATO COO EGO IND INO MAS MEO PBO PD REO SNO UAV UTO
ATO1R 0.912703 -0.267367 -0.221351 0.362247 0.851415 -0.175044 -0.772481 -0.264083 0.254403 -0.456167 0.602745 -0.340046 -0.474921
ATO2 0.907171 -0.176580 -0.217096 0.214911 0.758504 -0.184554 -0.692581 -0.236994 0.272157 -0.405329 0.633415 -0.014961 -0.517298
ATO3 0.916281 -0.312010 -0.214087 0.236822 0.750499 -0.134835 -0.735995 -0.333235 0.284920 -0.476100 0.596103 -0.073385 -0.579864
COO1
R
-0.275110 0.989074 0.174188 -0.086473 -0.323606 0.150843 0.405254 0.147371 -0.162140 0.100141 -0.304477 0.170786 0.391611
COO2
R
-0.272047 0.988371 0.155700 -0.101147 -0.313731 0.204397 0.412127 0.167144 -0.165822 0.106982 -0.302426 0.179565 0.432425
EGO1
R
-0.159755 0.242204 0.639701 -0.007799 -0.174662 -0.112591 0.131879 -0.078034 -0.257408 -0.026014 -0.137873 -0.068646 0.150065
EGO2 -0.183381 0.024678 0.791953 0.186372 -0.219870 0.007098 0.249226 0.201600 -0.056443 0.281664 -0.151501 0.108371 0.311605
IND1R 0.208165 0.019948 -0.029860 0.658874 0.171599 -0.085900 -0.068417 0.085461 -0.070662 0.126853 -0.005699 -0.332309 -0.023419
IND3 0.205578 -0.144387 0.211797 0.711170 0.183616 -0.319609 -0.234920 0.035084 0.128391 -0.145470 0.225237 -0.145957 0.013863
INO1R 0.792906 -0.295774 -0.318184 0.270623 0.909299 -0.239792 -0.675973 -0.166766 0.231840 -0.403583 0.570925 -0.160307 -0.439635
INO2 0.776137 -0.248751 -0.184753 0.138159 0.896134 -0.198098 -0.702207 -0.254326 0.224225 -0.466792 0.654534 -0.046252 -0.394351
INO3R 0.773928 -0.327841 -0.243108 0.292238 0.901376 -0.236349 -0.722374 -0.258220 0.285566 -0.480308 0.597103 -0.292399 -0.431946
MAS2 -0.136338 0.178384 -0.169394 -0.401517 -0.173240 0.726757 0.143816 0.016266 0.003998 0.174328 -0.276336 0.136634 0.033974
MAS4 -0.146598 0.109527 0.047779 -0.101578 -0.213049 0.829477 0.198298 -0.130512 0.110762 0.146085 -0.186226 0.216225 0.010852
MEO1 -0.763383 0.382121 0.266578 -0.190911 -0.729026 0.168654 0.925407 0.377399 -0.366801 0.542102 -0.577313 0.142819 0.538463
MEO2 -0.749887 0.399775 0.300522 -0.182863 -0.724116 0.221090 0.910487 0.385693 -0.304442 0.533848 -0.610167 0.178143 0.547240
MEO3 -0.717080 0.415082 0.155883 -0.226651 -0.672773 0.251308 0.906246 0.313718 -0.350192 0.474928 -0.560222 0.142438 0.544606
MEO4 -0.625405 0.262720 0.239258 -0.203431 -0.625111 0.145673 0.806041 0.209743 -0.218510 0.669193 -0.551765 0.099637 0.503541
PBO1 -0.300199 0.140038 0.132896 0.058154 -0.244192 -0.085153 0.291984 0.944853 -0.162031 0.266128 -0.250211 -0.008460 0.230956
PBO2 -0.096154 0.096532 -0.040080 0.102720 -0.088702 -0.016077 0.307536 0.432622 -0.186921 0.388045 -0.254959 0.098748 0.176605
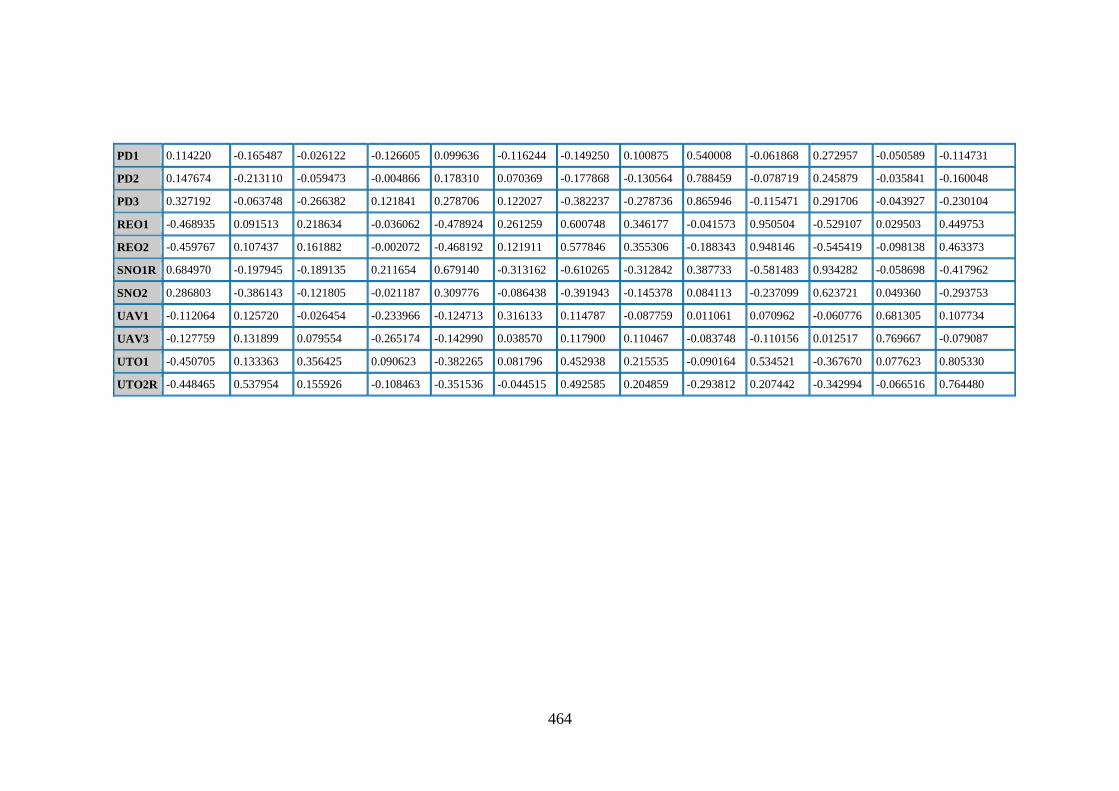
464
PD1 0.114220 -0.165487 -0.026122 -0.126605 0.099636 -0.116244 -0.149250 0.100875 0.540008 -0.061868 0.272957 -0.050589 -0.114731
PD2 0.147674 -0.213110 -0.059473 -0.004866 0.178310 0.070369 -0.177868 -0.130564 0.788459 -0.078719 0.245879 -0.035841 -0.160048
PD3 0.327192 -0.063748 -0.266382 0.121841 0.278706 0.122027 -0.382237 -0.278736 0.865946 -0.115471 0.291706 -0.043927 -0.230104
REO1 -0.468935 0.091513 0.218634 -0.036062 -0.478924 0.261259 0.600748 0.346177 -0.041573 0.950504 -0.529107 0.029503 0.449753
REO2 -0.459767 0.107437 0.161882 -0.002072 -0.468192 0.121911 0.577846 0.355306 -0.188343 0.948146 -0.545419 -0.098138 0.463373
SNO1R 0.684970 -0.197945 -0.189135 0.211654 0.679140 -0.313162 -0.610265 -0.312842 0.387733 -0.581483 0.934282 -0.058698 -0.417962
SNO2 0.286803 -0.386143 -0.121805 -0.021187 0.309776 -0.086438 -0.391943 -0.145378 0.084113 -0.237099 0.623721 0.049360 -0.293753
UAV1 -0.112064 0.125720 -0.026454 -0.233966 -0.124713 0.316133 0.114787 -0.087759 0.011061 0.070962 -0.060776 0.681305 0.107734
UAV3 -0.127759 0.131899 0.079554 -0.265174 -0.142990 0.038570 0.117900 0.110467 -0.083748 -0.110156 0.012517 0.769667 -0.079087
UTO1 -0.450705 0.133363 0.356425 0.090623 -0.382265 0.081796 0.452938 0.215535 -0.090164 0.534521 -0.367670 0.077623 0.805330
UTO2R -0.448465 0.537954 0.155926 -0.108463 -0.351536 -0.044515 0.492585 0.204859 -0.293812 0.207442 -0.342994 -0.066516 0.764480

465
Outer Loadings
AT
O
COO EGO IND INO MAS ME
O
PBO PD REO SNO UAV UTO
ATO
1R
0.91
270
3
ATO
2
0.90
717
1
ATO
3
0.91
628
1
COO
1R
0.989
074
COO
2R
0.988
371
EGO
1R
0.639
701
EGO
2
0.791
953
IND1
R
0.658
874
IND3 0.711
170
INO1
R
0.909
299
INO2 0.896
134
INO3
R
0.901
376
MAS
2
0.726
757
MAS
4
0.829
477
MEO
1
0.925
407
MEO
2
0.910
487
MEO
3
0.906
246
MEO
4
0.806
041
PBO
1
0.944
853
PBO
2
0.432
622
PD1 0.540
008
PD2 0.788
459
PD3 0.865
946
REO
1
0.950
504
REO
2
0.948
146
SNO
1R
0.934
282
SNO
2
0.623
721
UAV
1
0.681
305
UAV
3
0.769
667
UTO
1
0.805
330 UTO
2R

466
Outer Model (Weights or Loadings)
ATO COO EGO IND INO MAS MEO PBO PD REO SNO UAV UTO
ATO
1R
0.91
2703
ATO
2
0.90
7171
ATO
3
0.91
6281
COO
1R
0.9890
74
COO
2R
0.9883
71
EGO
1R
0.63
9701
EGO
2
0.79
1953
IND1
R
0.65
8874
IND3 0.71
1170
INO1
R
0.90
9299
INO2 0.89
6134
INO3
R
0.90
1376
MAS
2
0.72
6757
MAS
4
0.82
9477
MEO
1
0.9254
07
MEO
2
0.9104
87
MEO
3
0.9062
46
MEO
4
0.8060
41
PBO1 0.94
4853
PBO2 0.43
2622
PD1 0.54
0008
PD2 0.78
8459
PD3 0.86
5946
REO
1
0.95
0504
REO
2
0.94
8146
SNO1
R
0.93
4282
SNO2 0.62
3721
UAV
1
0.68
1305
UAV
3
0.76
9667
UTO
1
0.80
5330 UTO
2R
0.76
4480

467
Bootstrapping for overstating tax expense scenario (revised model) – Malaysia
Report November 12, 2013 4:00:47 PM
Table of contents (complete)
Bootstrapping
o Bootstrapping
Outer Weights
Inner Model T-Statistic
Path Coefficients
Total Effects (Mean, STDEV, T-Values)
Outer Model T-Statistic
Path Coefficients (Mean, STDEV, T-Values)
Outer Weights (Mean, STDEV, T-Values)
Total Effects
Outer Loadings
Outer Loadings (Mean, STDEV, T-Values)
Model
o Specification
Measurement Model Specification
Manifest Variable Scores (Original)
Structural Model Specification
Data Preprocessing
o Results (chronologically)
Step 0 (Original Matrix)

468
Outer Model T-
Statistic
ATO COO EGO IND INO MAS MEO PBO PD REO SNO UAV UTO
ATO1
R
46.46
3277
ATO2 34.41
2794
ATO3 32.54
0838
COO
1R
211.1
5510
0
COO
2R
222.2
9199
1
EGO1
R
2.371
267
EGO2 3.350
298
IND1
R
2.346
458
IND3 2.597
531
INO1
R
35.7
953
52
INO2 36.7
665
27
INO3
R
40.7
107
89
MAS2 3.72
667
MAS4 4.26
2341
MEO
1
42.90
1335
MEO
2
26.05
1300
MEO
3
39.98
5792
MEO
4
12.87
2314
PBO1 5.28
8199
PBO2 1.66
3227
PD1 2.45
7614
PD2 4.70
6874
PD3 6.79
7728
REO1 46.53
7923
REO2 59.32
9492
SNO1
R
28.66
8461
SNO2 4.276
856
UAV1 2.39
6103
UAV3 2.76
7635
UTO1 6.87
5372 UTO2
R
5.16
4239

469
PLS algorithm for overstating expense scenario (revised model) – New
Zealand
Report November 12, 2013 4:53:59 PM
Table of contents (complete)
Model
o Specification
Measurement Model Specification
Manifest Variable Scores (Original)
Structural Model Specification
PLS
o Quality Criteria
Overview
Redundancy
Cronbachs Alpha
Latent Variable Correlations
R Square
Cross Loadings
AVE
Communality
Total Effects
Composite Reliability
o Calculation Results
Stop Criterion Changes
Outer Loadings
Outer Model (Weights or Loadings)
Path Coefficients
Latent Variable Scores
Manifest Variable Scores (Used)
Outer Weights
Data Preprocessing
o Results (chronologically)
Step 0 (Original Matrix)
Index Values
o Results
Measurement Model (restandardised)
Path Coefficients
Measurement Model
Latent Variable Scores (unstandardised)
Index Values for Latent Variables

470
PLS Quality Criteria
Overview
AVE Composite
Reliability
R
Square
Cronbachs
Alpha Communality Redundancy
ATO 0.687059 0.868043 0.775300 0.687059
COO 0.949898 0.974305 0.947444 0.949898
EGO 0.485432 0.636767 -0.069556 0.485432
IND 0.713614 0.831379 0.622944 0.713614
INO 0.722758 0.886044 0.745807 0.807445 0.722757 0.417913
MAS 0.641250 0.771578 0.532766 0.641250
MEO 0.718726 0.910133 0.867695 0.718726
PBO 0.475977 0.503133 0.438183 0.475978
PD 0.600182 0.817993 0.675866 0.600182
REO 0.931223 0.964387 0.926143 0.931223
SNO 0.689191 0.815797 0.551445 0.689191
UAV 0.595052 0.745583 0.321737 0.595052
UTO 0.634283 0.776187 0.423647 0.634283
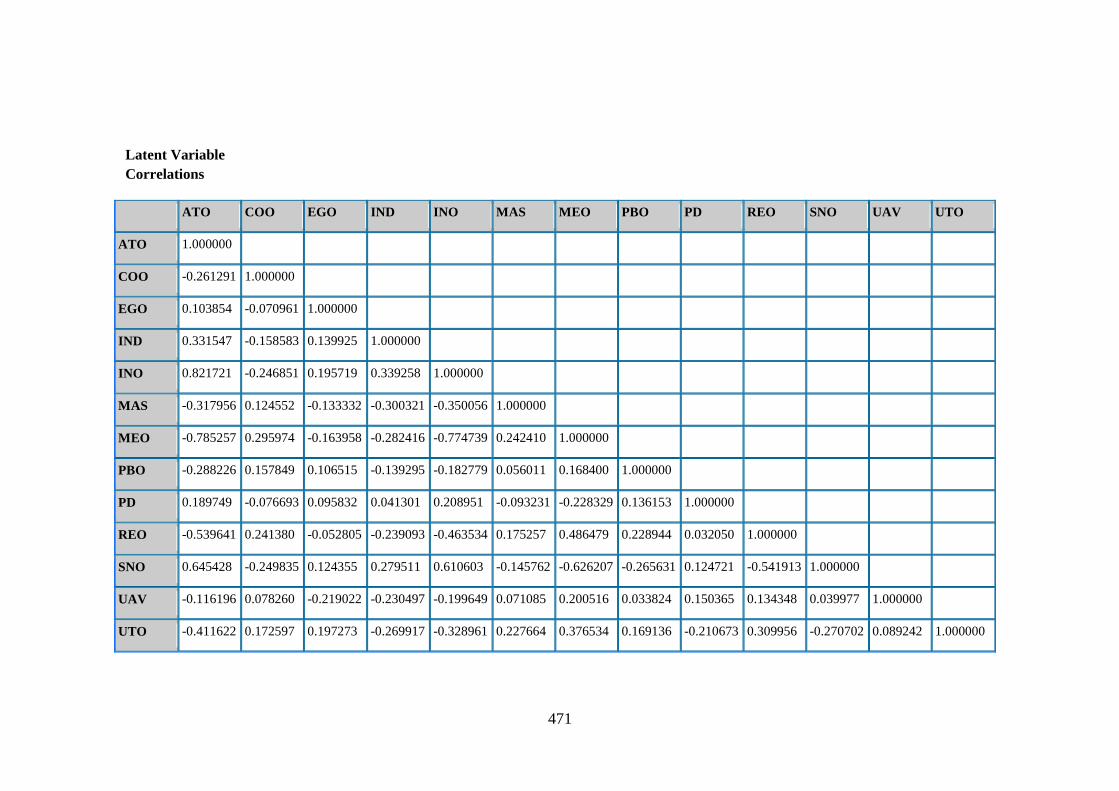
471
Latent Variable
Correlations
ATO COO EGO IND INO MAS MEO PBO PD REO SNO UAV UTO
ATO 1.000000
COO -0.261291 1.000000
EGO 0.103854 -0.070961 1.000000
IND 0.331547 -0.158583 0.139925 1.000000
INO 0.821721 -0.246851 0.195719 0.339258 1.000000
MAS -0.317956 0.124552 -0.133332 -0.300321 -0.350056 1.000000
MEO -0.785257 0.295974 -0.163958 -0.282416 -0.774739 0.242410 1.000000
PBO -0.288226 0.157849 0.106515 -0.139295 -0.182779 0.056011 0.168400 1.000000
PD 0.189749 -0.076693 0.095832 0.041301 0.208951 -0.093231 -0.228329 0.136153 1.000000
REO -0.539641 0.241380 -0.052805 -0.239093 -0.463534 0.175257 0.486479 0.228944 0.032050 1.000000
SNO 0.645428 -0.249835 0.124355 0.279511 0.610603 -0.145762 -0.626207 -0.265631 0.124721 -0.541913 1.000000
UAV -0.116196 0.078260 -0.219022 -0.230497 -0.199649 0.071085 0.200516 0.033824 0.150365 0.134348 0.039977 1.000000
UTO -0.411622 0.172597 0.197273 -0.269917 -0.328961 0.227664 0.376534 0.169136 -0.210673 0.309956 -0.270702 0.089242 1.000000

472
Cross Loadings
ATO COO EGO IND INO MAS MEO PBO PD REO SNO UAV UTO
ATO1R 0.835452 -0.292826 0.122363 0.288390 0.747731 -0.209934 -0.739177 -0.257092 0.244638 -0.473050 0.604521 0.019063 -0.281874
ATO2 0.789482 -0.116791 0.006518 0.139771 0.521199 -0.188297 -0.490150 -0.300153 -0.017164 -0.447632 0.495464 -0.047402 -0.326350
ATO3 0.860184 -0.212399 0.106639 0.360094 0.734986 -0.374649 -0.682934 -0.179866 0.194014 -0.426286 0.498750 -0.249541 -0.416182
COO1R -0.271941 0.977701 -0.077337 -0.150174 -0.254179 0.112228 0.315096 0.173283 -0.121808 0.214396 -0.270194 0.022213 0.167483
COO2R -0.235272 0.971543 -0.059964 -0.159565 -0.225352 0.131775 0.258538 0.131979 -0.021696 0.258876 -0.213478 0.137282 0.169113
EGO1R 0.091741 -0.041283 0.486118 0.117092 0.097927 0.017192 -0.149763 0.001054 -0.076645 -0.302855 0.172947 -0.210583 -0.023408
EGO2 0.064686 -0.056816 0.857062 0.090993 0.166102 -0.162622 -0.099218 0.121196 0.154787 0.118161 0.040256 -0.126335 0.239413
IND1R 0.228362 -0.171612 0.000877 0.753005 0.197498 -0.105970 -0.186034 -0.207945 -0.008430 -0.214999 0.335478 -0.058720 -0.250352
IND3 0.319602 -0.117423 0.189146 0.927476 0.347589 -0.346822 -0.277063 -0.070637 0.060766 -0.201888 0.188213 -0.279035 -0.223578
INO1R 0.757749 -0.219232 0.215059 0.353292 0.907754 -0.358680 -0.727305 -0.164378 0.276780 -0.361140 0.509464 -0.210128 -0.275530
INO2 0.567714 -0.278373 0.127257 0.178889 0.757576 -0.301581 -0.489571 -0.127107 0.105549 -0.399906 0.528290 0.005487 -0.246664
INO3R 0.749628 -0.153958 0.148811 0.308931 0.877686 -0.238110 -0.727344 -0.170429 0.132705 -0.432184 0.533414 -0.261580 -0.314407
MAS2 -0.068448 0.155626 -0.119943 -0.236520 -0.116838 0.590390 0.053262 -0.019911 -0.096537 0.043979 -0.021736 0.011427 0.031354
MAS4 -0.345256 0.094226 -0.115725 -0.271375 -0.366902 0.966406 0.262880 0.071001 -0.076886 0.188314 -0.161347 0.078422 0.252834
MEO1 -0.738289 0.260260 -0.188111 -0.310298 -0.752152 0.308819 0.899985 0.117660 -0.260336 0.368615 -0.512266 0.272942 0.332070
MEO2 -0.791712 0.288532 -0.125374 -0.205090 -0.759190 0.241793 0.941281 0.181123 -0.263067 0.502116 -0.603489 0.137749 0.378586

473
MEO3 -0.520029 0.257189 -0.218431 -0.282359 -0.525412 0.169510 0.797749 0.142267 -0.085330 0.308042 -0.436052 0.242586 0.293658
MEO4 -0.564112 0.192147 -0.020162 -0.159920 -0.542334 0.056888 0.736557 0.131716 -0.118520 0.469975 -0.574249 0.010768 0.259464
PBO1 -0.282402 0.141084 0.161800 -0.109199 -0.167132 0.034986 0.146759 0.974067 0.135580 0.232181 -0.260329 0.025894 0.199701
PBO2 -0.023460 -0.047060 0.262120 0.109046 0.037875 -0.083228 -0.066773 0.056110 0.020690 0.053327 -0.021905 -0.029223 0.163722
PD1 0.105493 0.010038 0.063513 -0.073339 0.143209 -0.064574 -0.177747 0.219713 0.762299 0.186860 -0.007863 0.104958 -0.184623
PD2 0.191933 -0.149919 0.051695 0.127864 0.192784 -0.145509 -0.171694 0.000402 0.738277 -0.114143 0.182587 0.074963 -0.118284
PD3 0.122855 -0.001548 0.116566 0.005664 0.133096 0.027513 -0.179011 0.132095 0.821214 0.051156 0.082086 0.186096 -0.201111
REO1 -0.543322 0.249143 -0.050375 -0.287050 -0.446409 0.180248 0.472395 0.194975 0.013646 0.964856 -0.514746 0.157154 0.318349
REO2 -0.498275 0.216786 -0.051536 -0.174624 -0.448208 0.158043 0.466521 0.246782 0.048142 0.965142 -0.531111 0.102248 0.279943
SNO1R 0.586981 -0.189773 0.103835 0.305315 0.546195 -0.189209 -0.491904 -0.293043 0.110876 -0.518285 0.860218 0.003355 -0.308682
SNO2 0.478233 -0.229265 0.103060 0.146828 0.463177 -0.041202 -0.555495 -0.136129 0.095422 -0.371527 0.799005 0.068539 -0.126883
UAV1 -0.091563 -0.024470 -0.169264 -0.219810 -0.165567 0.053739 0.153519 -0.039213 0.035908 0.110990 0.081084 0.811428 0.061873
UAV3 -0.087914 0.160072 -0.169606 -0.129691 -0.141401 0.056448 0.156966 0.102713 0.210459 0.095650 -0.027808 0.729170 0.077413
UTO1 -0.310360 0.057491 0.339624 -0.114978 -0.268311 0.114364 0.265820 0.129525 -0.203085 0.313889 -0.200185 -0.001759 0.807578
UTO2R -0.346329 0.221512 -0.034483 -0.320084 -0.255485 0.251721 0.335798 0.140209 -0.130795 0.176579 -0.231882 0.147599 0.785101
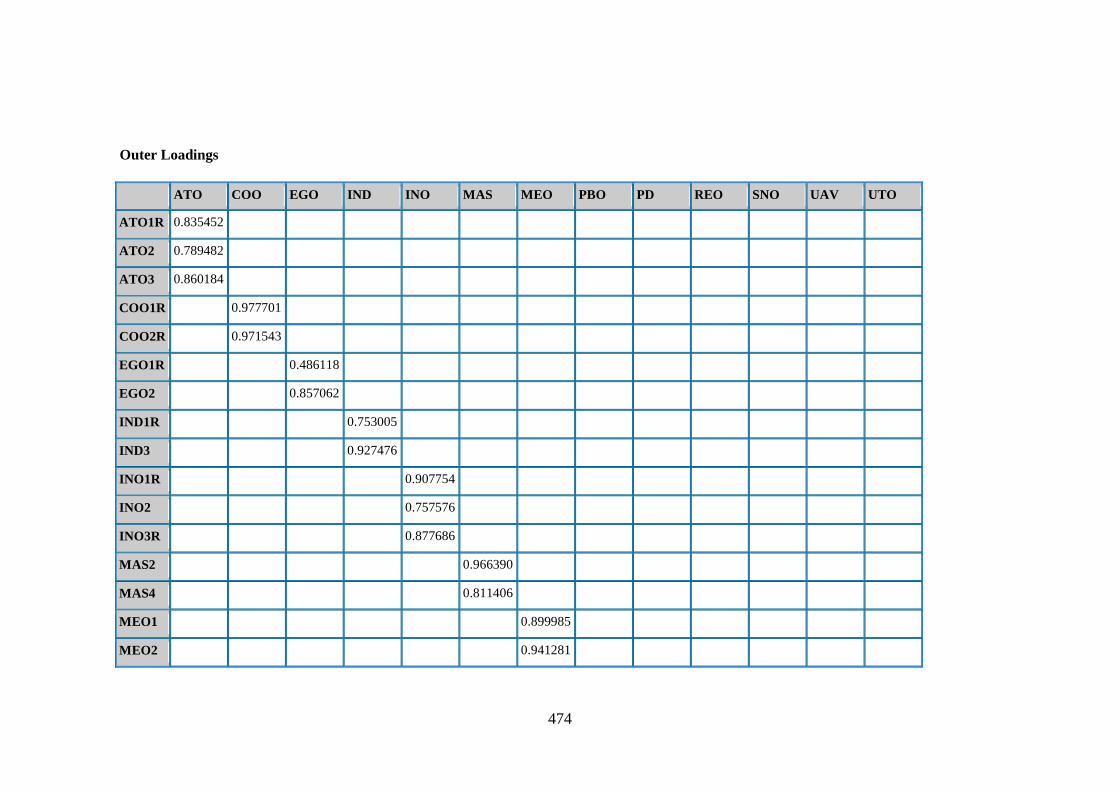
474
Outer Loadings
ATO COO EGO IND INO MAS MEO PBO PD REO SNO UAV UTO
ATO1R 0.835452
ATO2 0.789482
ATO3 0.860184
COO1R 0.977701
COO2R 0.971543
EGO1R 0.486118
EGO2 0.857062
IND1R 0.753005
IND3 0.927476
INO1R 0.907754
INO2 0.757576
INO3R 0.877686
MAS2 0.966390
MAS4 0.811406
MEO1 0.899985
MEO2 0.941281

475
MEO3 0.797749
MEO4 0.736557
PBO1 0.974067
PBO2 0.056110
PD1 0.762299
PD2 0.738277
PD3 0.821214
REO1 0.964856
REO2 0.965142
SNO1R 0.860218
SNO2 0.799005
UAV1 0.808428
UAV3 0.785170
UTO1 0.807578
UTO2R 0.785101

476
Bootstrapping for overstating tax expense scenario (revised model) – New
Zealand
Report November 12, 2013 5:26:54 PM
Table of contents (complete)
Bootstrapping
o Bootstrapping
Outer Weights
Inner Model T-Statistic
Path Coefficients
Total Effects (Mean, STDEV, T-Values)
Outer Model T-Statistic
Path Coefficients (Mean, STDEV, T-Values)
Outer Weights (Mean, STDEV, T-Values)
Total Effects
Outer Loadings
Outer Loadings (Mean, STDEV, T-Values)
Model
o Specification
Measurement Model Specification
Manifest Variable Scores (Original)
Structural Model Specification
Data Preprocessing
o Results (chronologically)
Step 0 (Original Matrix)

477
Outer Model T-Statistic
ATO COO EGO IND INO MAS MEO PBO PD REO SNO UAV UTO
ATO1R 32.254885
ATO2 14.536983
ATO3 30.081746
COO1R 19.572455
COO2R 15.270520
EGO1R 1.710375
EGO2 3.518439
IND1R 4.66881
4
IND3 15.0466
4
INO1R 45.414151
INO2 12.108791
INO3R 26.640641
MAS2 17.50946
MAS4 2.825574
MEO1 26.594639
MEO2 70.899124

478
MEO3 8.754612
MEO4 10.09949
PBO1 3.94922
5
PBO2 0.24010
4
PD1 3.346791
PD2 3.201792
PD3 4.158887
REO1 104.287784
REO2 89.637769
SNO1R 22.455078
SNO2 13.244797
UAV1 2.825480
UAV3 2.535100
UTO1 7.223108
UTO2R 5.9158116
2
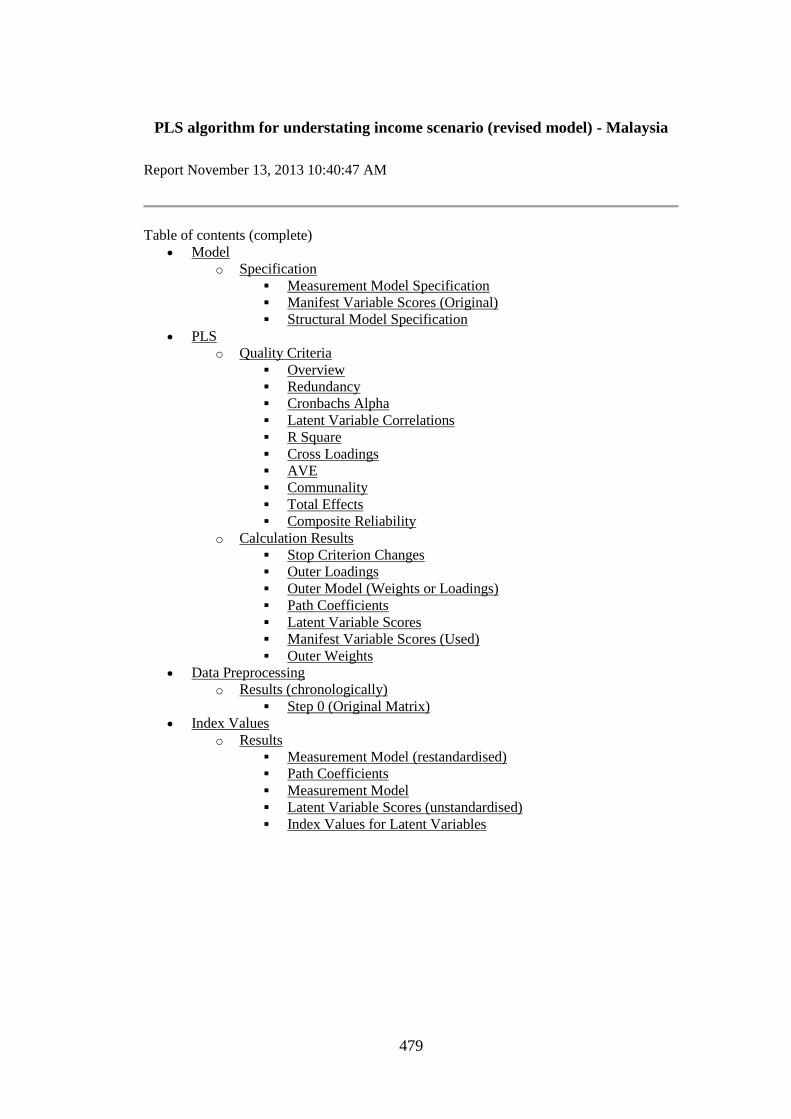
479
PLS algorithm for understating income scenario (revised model) - Malaysia
Report November 13, 2013 10:40:47 AM
Table of contents (complete)
Model
o Specification
Measurement Model Specification
Manifest Variable Scores (Original)
Structural Model Specification
PLS
o Quality Criteria
Overview
Redundancy
Cronbachs Alpha
Latent Variable Correlations
R Square
Cross Loadings
AVE
Communality
Total Effects
Composite Reliability
o Calculation Results
Stop Criterion Changes
Outer Loadings
Outer Model (Weights or Loadings)
Path Coefficients
Latent Variable Scores
Manifest Variable Scores (Used)
Outer Weights
Data Preprocessing
o Results (chronologically)
Step 0 (Original Matrix)
Index Values
o Results
Measurement Model (restandardised)
Path Coefficients
Measurement Model
Latent Variable Scores (unstandardised)
Index Values for Latent Variables

480
PLS Quality Criteria
Overview
AVE Composite
Reliability
R
Square
Cronbachs
Alpha Communality Redundancy
ATU 0.729590 0.889980 0.816972 0.729590
COU 0.962519 0.980902 0.961063 0.962519
EGU 0.484000 0.516315 -0.283484 0.483999
IND 0.469862 0.639325 -0.128288 0.469862
INU 0.720635 0.885254 0.709067 0.805195 0.720635 0.390329
MAS 0.609574 0.757430 0.359538 0.609574
MEU 0.800757 0.941245 0.916439 0.800757
PBU 0.631755 0.756700 0.691391 0.631757
PD 0.683169 0.806533 0.608215 0.683169
REU 0.892317 0.943094 0.879404 0.892317
SNU 0.629776 0.772610 0.413586 0.629776
UAV 0.484997 0.639180 -0.069912 0.484997
UTU 0.585830 0.738830 0.293022 0.585830

481
Latent Variable Correlations
ATU COU EGU IND INU MAS MEU PBU PD REU SNU UAV UTU
ATU 1.000000
COU -0.461510 1.000000
EGU -0.243433 0.286914 1.000000
IND 0.217161 -0.165112 -0.181376 1.000000
INU 0.797732 -0.397198 -0.255522 0.230136 1.000000
MAS -0.261785 0.138264 -0.079206 -0.313585 -0.208268 1.000000
MEU -0.740645 0.468519 0.285010 -0.213411 -0.734277 0.216081 1.000000
PBU -0.272096 0.073303 -0.198858 0.246927 -0.206115 -0.058608 0.111856 1.000000
PD 0.250370 -0.068157 -0.163231 0.094468 0.293829 0.112188 -0.376721 -0.036919 1.000000
REU -0.471411 0.210965 0.014114 -0.087248 -0.399590 0.193965 0.608355 0.117268 -0.201734 1.000000
SNU 0.607057 -0.342362 -0.207046 0.028073 0.591191 -0.208416 -0.614173 -0.231483 0.204743 -0.597056 1.000000
UAV -0.215107 0.270056 -0.081879 -0.334922 -0.230460 0.144794 0.125184 -0.087795 0.031638 0.051214 -0.118032 1.000000
UTU -0.608015 0.262189 0.263666 -0.050375 -0.505756 0.153405 0.513200 0.311312 -0.166309 0.365656 -0.489082 0.004323 1.000000
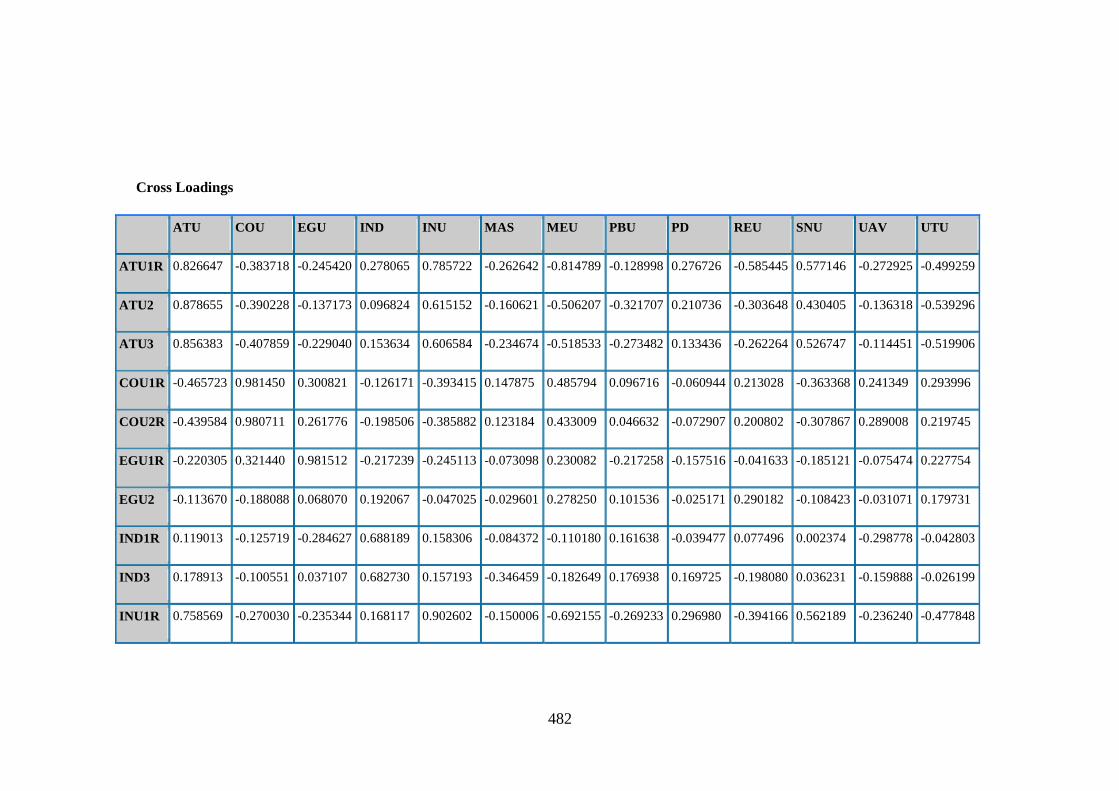
482
Cross Loadings
ATU COU EGU IND INU MAS MEU PBU PD REU SNU UAV UTU
ATU1R 0.826647 -0.383718 -0.245420 0.278065 0.785722 -0.262642 -0.814789 -0.128998 0.276726 -0.585445 0.577146 -0.272925 -0.499259
ATU2 0.878655 -0.390228 -0.137173 0.096824 0.615152 -0.160621 -0.506207 -0.321707 0.210736 -0.303648 0.430405 -0.136318 -0.539296
ATU3 0.856383 -0.407859 -0.229040 0.153634 0.606584 -0.234674 -0.518533 -0.273482 0.133436 -0.262264 0.526747 -0.114451 -0.519906
COU1R -0.465723 0.981450 0.300821 -0.126171 -0.393415 0.147875 0.485794 0.096716 -0.060944 0.213028 -0.363368 0.241349 0.293996
COU2R -0.439584 0.980711 0.261776 -0.198506 -0.385882 0.123184 0.433009 0.046632 -0.072907 0.200802 -0.307867 0.289008 0.219745
EGU1R -0.220305 0.321440 0.981512 -0.217239 -0.245113 -0.073098 0.230082 -0.217258 -0.157516 -0.041633 -0.185121 -0.075474 0.227754
EGU2 -0.113670 -0.188088 0.068070 0.192067 -0.047025 -0.029601 0.278250 0.101536 -0.025171 0.290182 -0.108423 -0.031071 0.179731
IND1R 0.119013 -0.125719 -0.284627 0.688189 0.158306 -0.084372 -0.110180 0.161638 -0.039477 0.077496 0.002374 -0.298778 -0.042803
IND3 0.178913 -0.100551 0.037107 0.682730 0.157193 -0.346459 -0.182649 0.176938 0.169725 -0.198080 0.036231 -0.159888 -0.026199
INU1R 0.758569 -0.270030 -0.235344 0.168117 0.902602 -0.150006 -0.692155 -0.269233 0.296980 -0.394166 0.562189 -0.236240 -0.477848

483
INU2 0.642098 -0.468915 -0.338407 0.181605 0.787798 -0.170093 -0.541836 -0.065811 0.114814 -0.270903 0.456770 -0.103506 -0.381292
INU3R 0.621960 -0.297083 -0.084389 0.242443 0.852402 -0.216560 -0.625505 -0.167961 0.321927 -0.342176 0.478703 -0.236062 -0.421995
MAS2 -0.169582 0.116425 -0.061591 -0.389928 -0.161200 0.776437 0.178625 -0.076819 -0.003051 0.184819 -0.247715 0.058362 0.082265
MAS4 -0.238616 0.099626 -0.062090 -0.102228 -0.163998 0.785043 0.158966 -0.015230 0.176692 0.118637 -0.079188 0.166808 0.156646
MEU1 -0.701091 0.395122 0.324884 -0.138188 -0.701545 0.203938 0.926539 0.150967 -0.402609 0.479335 -0.526194 0.029145 0.533400
MEU2 -0.735945 0.445846 0.349946 -0.207497 -0.733758 0.268514 0.954301 0.126273 -0.329309 0.497623 -0.606661 0.108206 0.587629
MEU3 -0.669371 0.486409 0.170772 -0.244594 -0.648381 0.204803 0.877247 0.079942 -0.352659 0.523283 -0.492504 0.156154 0.332661
MEU4 -0.517601 0.342031 0.138630 -0.177326 -0.517580 0.063628 0.815047 0.022111 -0.249464 0.740731 -0.587504 0.177653 0.348288
PBU1 -0.270164 0.065775 -0.202012 0.248077 -0.203874 -0.060498 0.109694 0.999851 -0.036095 0.118031 -0.231676 -0.088785 0.311339
PBU3 -0.045620 -0.336394 -0.260516 0.185851 0.004096 -0.124564 -0.049314 0.513622 0.021795 0.099037 -0.130208 -0.095048 0.163536
PD2 0.144460 -0.205300 -0.091915 -0.009482 0.111627 0.067609 -0.180234 -0.085940 0.661791 -0.147036 0.109364 -0.011922 -0.147544
PD3 0.248816 -0.008481 -0.163028 0.116726 0.312679 0.110465 -0.387638 -0.013614 0.963519 -0.189545 0.206604 0.042215 -0.146861
REU1 -0.407548 0.170903 -0.030677 -0.039574 -0.367317 0.228226 0.533207 0.097608 -0.132150 0.941626 -0.530165 0.101100 0.296590

484
REU2 -0.481198 0.226239 0.055089 -0.123077 -0.387146 0.140555 0.614093 0.123284 -0.246014 0.947614 -0.596177 -0.001637 0.391778
SNU1R 0.479438 -0.243058 -0.013147 0.018763 0.496897 -0.144308 -0.588648 -0.189055 0.282200 -0.638315 0.821651 -0.147815 -0.318240
SNU2 0.485973 -0.304984 -0.335813 0.026328 0.439356 -0.189796 -0.374512 -0.178260 0.027626 -0.289350 0.764488 -0.032742 -0.468463
UAV1 -0.124810 0.216309 -0.233536 -0.236414 -0.192937 0.309518 0.118662 -0.089417 0.024223 0.109130 -0.105668 0.845221 0.035134
UAV4R -0.200779 0.155820 0.223906 -0.244668 -0.119504 -0.228918 0.042537 -0.019828 0.020061 -0.080408 -0.050138 0.505564 -0.048639
UTU1 -0.508104 -0.001438 0.106762 -0.020839 -0.388136 0.199774 0.472336 0.245837 -0.176729 0.462947 -0.436488 -0.044245 0.766839
UTU2R -0.422413 0.403879 0.297365 -0.056369 -0.386067 0.034617 0.312843 0.230678 -0.077592 0.095817 -0.311864 0.051117 0.763949

485
Outer Loadings
ATU COU EGU IND INU MAS MEU PBU PD REU SNU UAV UTU
ATU1R 0.826647
ATU2 0.878655
ATU3 0.856383
COU1R 0.981450
COU2R 0.980711
EGU1R 0.981512
EGU2 0.068070
IND1R 0.688189
IND3 0.682730
INU1R 0.902602
INU2 0.787798
INU3R 0.852402
MAS2 0.776437
MAS4 0.785043
MEU1 0.926539
MEU2 0.954301
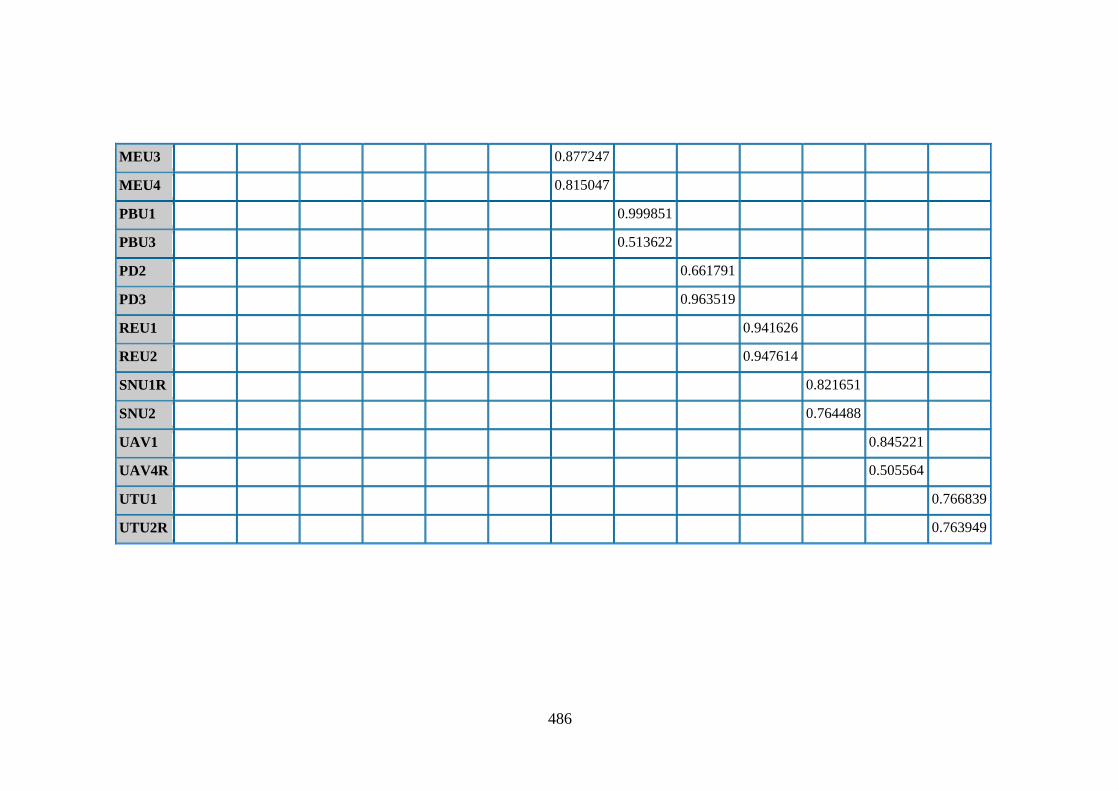
486
MEU3 0.877247
MEU4 0.815047
PBU1 0.999851
PBU3 0.513622
PD2 0.661791
PD3 0.963519
REU1 0.941626
REU2 0.947614
SNU1R 0.821651
SNU2 0.764488
UAV1 0.845221
UAV4R 0.505564
UTU1 0.766839
UTU2R 0.763949

487
Outer Model (Weights or Loadings)
ATU COU EGU IND INU MAS MEU PBU PD REU SNU UAV UTU
ATU1R 0.826647
ATU2 0.878655
ATU3 0.856383
COU1R 0.981450
COU2R 0.980711
EGU1R 0.981512
EGU2 0.068070
IND1R 0.688189
IND3 0.682730
INU1R 0.902602
INU2 0.787798
INU3R 0.852402
MAS2 0.776437
MAS4 0.785043
MEU1 0.926539
MEU2 0.954301

488
MEU3 0.877247
MEU4 0.815047
PBU1 0.999851
PBU3 0.513622
PD2 0.661791
PD3 0.963519
REU1 0.941626
REU2 0.947614
SNU1R 0.821651
SNU2 0.764488
UAV1 0.845221
UAV4R 0.505564
UTU1 0.766839
UTU2R 0.763949

489
Bootstrapping for understating income scenario (revised model) - Malaysia
Report November 13, 2013 11:25:43 AM
Table of contents (complete)
Bootstrapping
o Bootstrapping
Outer Weights
Inner Model T-Statistic
Path Coefficients
Total Effects (Mean, STDEV, T-Values)
Outer Model T-Statistic
Path Coefficients (Mean, STDEV, T-Values)
Outer Weights (Mean, STDEV, T-Values)
Total Effects
Outer Loadings
Outer Loadings (Mean, STDEV, T-Values)
Model
o Specification
Measurement Model Specification
Manifest Variable Scores (Original)
Structural Model Specification
Data Preprocessing
o Results (chronologically)
Step 0 (Original Matrix)

490
Outer Model T-Statistic
ATU COU EGU IND INU MAS MEU PBU PD REU SNU UAV UTU
ATU1R 26.5382
ATU2 23.9935
ATU3 18.3863
COU1R 113.1856
COU2R 140.6366
EGU1R 4.6876
EGU2 0.2536
IND1R 2.4109
IND3 2.3998
INU1R 53.3002
INU2 10.4425
INU3R 15.6706
MAS2 3.4162
MAS4 3.1964
MEU1 36.57690
MEU2 82.51710

491
MEU3 19.8692
MEU4 13.9111
PBU1 3.8861
PBU3 1.9079
PD2 3.4968
PD3 11.2228
REU1 21.6578
REU2 56.0294
SNU1R 8.78972
SNU2 7.1000
UAV1 3.4197
UAV4R 1.7482
UTU1 5.9934
UTU2R 5.3213

492
PLS algorithm for understating income scenario (revised model) – New
Zealand
- Report November 13, 2013 11:32:21 AM
Table of contents (complete)
Model
o Specification
Measurement Model Specification
Manifest Variable Scores (Original)
Structural Model Specification
PLS
o Quality Criteria
Overview
Redundancy
Cronbachs Alpha
Latent Variable Correlations
R Square
Cross Loadings
AVE
Communality
Total Effects
Composite Reliability
o Calculation Results
Stop Criterion Changes
Outer Loadings
Outer Model (Weights or Loadings)
Path Coefficients
Latent Variable Scores
Manifest Variable Scores (Used)
Outer Weights
Data Preprocessing
o Results (chronologically)
Step 0 (Original Matrix)
Index Values
o Results
Measurement Model (restandardised)
Path Coefficients
Measurement Model
Latent Variable Scores (unstandardised)
Index Values for Latent Variables

493
PLS Quality Criteria
Overview
AVE Composite
Reliability
R
Square
Cronbachs
Alpha Communality Redundancy
ATU 0.544719 0.780392 0.620449 0.544719
COU 0.970744 0.985155 0.970035 0.970744
EGU 0.538420 0.685323 0.167169 0.538420
IND 0.694425 0.815471 0.622944 0.694425
INU 0.666327 0.856814 0.651200 0.752795 0.666327 0.260471
MAS 0.641588 0.771928 0.532766 0.641589
MEU 0.669510 0.889060 0.840028 0.669510
PBU 0.504910 0.551966 0.245333 0.504910
PD 0.509211 0.588839 0.498284 0.509212
REU 0.879828 0.936045 0.866886 0.879828
SNU 0.690950 0.815819 0.570554 0.690950
UAV 0.502826 0.594326 0.025466 0.502826
UTU 0.610020 0.756727 0.366099 0.610020
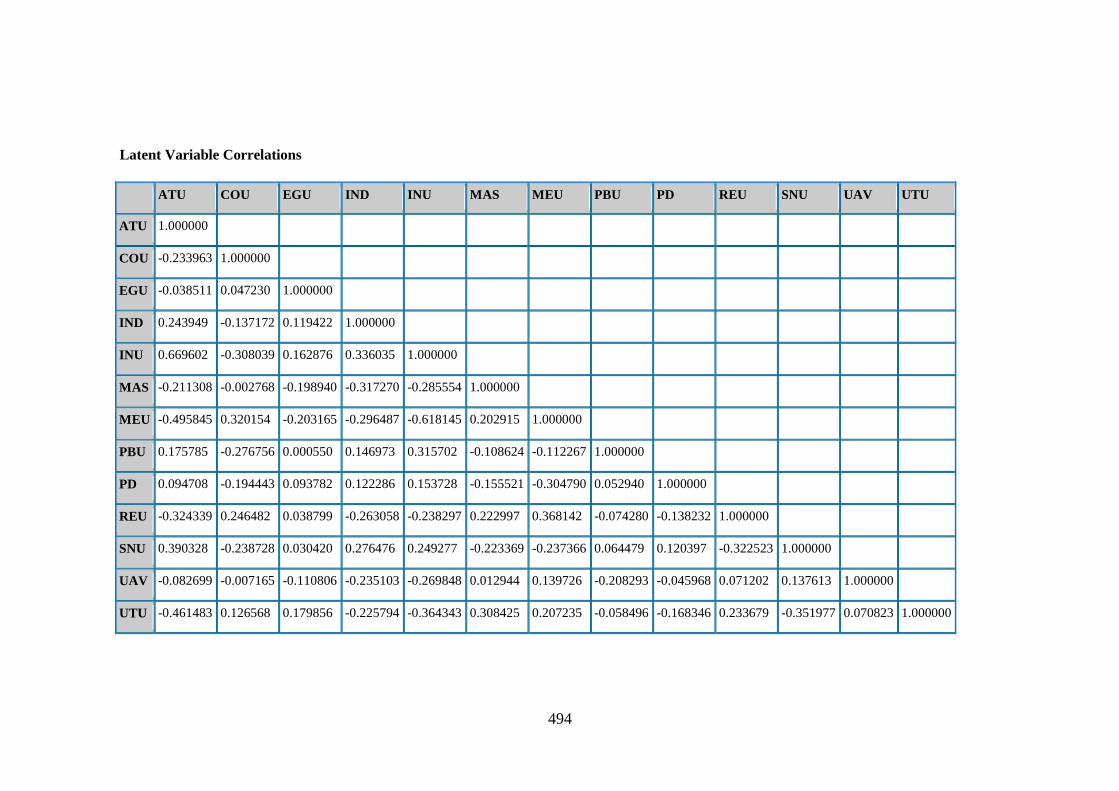
494
Latent Variable Correlations
ATU COU EGU IND INU MAS MEU PBU PD REU SNU UAV UTU
ATU 1.000000
COU -0.233963 1.000000
EGU -0.038511 0.047230 1.000000
IND 0.243949 -0.137172 0.119422 1.000000
INU 0.669602 -0.308039 0.162876 0.336035 1.000000
MAS -0.211308 -0.002768 -0.198940 -0.317270 -0.285554 1.000000
MEU -0.495845 0.320154 -0.203165 -0.296487 -0.618145 0.202915 1.000000
PBU 0.175785 -0.276756 0.000550 0.146973 0.315702 -0.108624 -0.112267 1.000000
PD 0.094708 -0.194443 0.093782 0.122286 0.153728 -0.155521 -0.304790 0.052940 1.000000
REU -0.324339 0.246482 0.038799 -0.263058 -0.238297 0.222997 0.368142 -0.074280 -0.138232 1.000000
SNU 0.390328 -0.238728 0.030420 0.276476 0.249277 -0.223369 -0.237366 0.064479 0.120397 -0.322523 1.000000
UAV -0.082699 -0.007165 -0.110806 -0.235103 -0.269848 0.012944 0.139726 -0.208293 -0.045968 0.071202 0.137613 1.000000
UTU -0.461483 0.126568 0.179856 -0.225794 -0.364343 0.308425 0.207235 -0.058496 -0.168346 0.233679 -0.351977 0.070823 1.000000

495
Cross Loadings
ATU COU EGU IND INU MAS MEU PBU PD REU SNU UAV UTU
ATU1R 0.791230 -0.324334 -0.019369 0.238532 0.592331 -0.087138 -0.535300 0.185862 0.055965 -0.299112 0.326729 -0.046466 -0.237294
ATU2 0.630332 -0.059935 -0.194138 0.036933 0.201494 -0.110506 -0.046094 -0.011114 0.127105 -0.255065 0.385404 0.133000 -0.332683
ATU3 0.781532 -0.062162 0.021382 0.184293 0.537115 -0.261941 -0.329806 0.131533 0.069652 -0.187638 0.233042 -0.154998 -0.485973
COU1R -0.253944 0.987504 0.048954 -0.145942 -0.324745 0.001608 0.330081 -0.277241 -0.189495 0.247378 -0.238623 -0.021655 0.136406
COU2R -0.203318 0.983017 0.043734 -0.122635 -0.278871 -0.007776 0.298498 -0.267464 -0.194074 0.237666 -0.231322 0.009935 0.111121
EGU1R 0.019695 0.063226 0.519778 0.073377 0.077253 -0.056292 -0.199079 -0.000445 0.131697 -0.150478 0.131661 0.009600 0.099816
EGU2 -0.055028 0.022514 0.898148 0.101441 0.150099 -0.202926 -0.134361 0.000871 0.041537 0.122675 -0.032304 -0.134104 0.158279
IND1R 0.057310 -0.133025 0.044621 0.683051 0.136694 -0.106015 -0.131610 0.057249 0.159180 -0.269791 0.234288 -0.085066 -0.214852
IND3 0.276003 -0.116724 0.128792 0.960360 0.358147 -0.346944 -0.311797 0.157613 0.088564 -0.218239 0.248173 -0.254608 -0.193705
INU1R 0.579826 -0.189762 0.250406 0.360160 0.843001 -0.324021 -0.588631 0.307098 0.097965 -0.137925 0.128243 -0.379914 -0.261268
INU2 0.492875 -0.377314 0.090411 0.175427 0.777708 -0.192471 -0.407948 0.206950 0.162726 -0.174462 0.249989 -0.109016 -0.368455

496
INU3R 0.560157 -0.214547 0.022810 0.259820 0.826741 -0.156452 -0.492706 0.244600 0.127079 -0.288685 0.258781 -0.121595 -0.279893
MAS2 0.018099 0.063678 -0.250442 -0.249220 -0.095933 0.591589 0.129153 0.126269 -0.170398 0.014925 -0.022629 0.056435 0.113605
MAS4 -0.250004 -0.023612 -0.149624 -0.286767 -0.299252 0.966023 0.193100 -0.166012 -0.125106 0.252926 -0.250886 -0.003132 0.320019
MEU1 -0.407936 0.236324 -0.291320 -0.342799 -0.653925 0.248085 0.858140 -0.161346 -0.218286 0.238807 -0.125392 0.283027 0.201632
MEU2 -0.330322 0.260383 -0.048252 -0.159847 -0.372600 0.058254 0.819511 -0.035641 -0.253177 0.320237 -0.168111 0.047234 0.117938
MEU3 -0.516568 0.316415 -0.197106 -0.256026 -0.571849 0.225658 0.903174 -0.084261 -0.329383 0.362854 -0.250595 0.091504 0.180160
MEU4 -0.336053 0.252765 0.007841 -0.127511 -0.277801 0.020329 0.674028 -0.033524 -0.191349 0.342295 -0.305192 -0.128156 0.167698
PBU1 -0.224971 0.025854 0.065985 0.094681 -0.011044 -0.033804 0.044475 0.105091 0.080380 0.133302 -0.147766 -0.116015 0.055763
PBU3 0.167113 -0.274654 0.002869 0.149671 0.313953 -0.109345 -0.110219 0.999388 0.055540 -0.069271 0.059003 -0.211477 -0.056282
PD2 0.100227 -0.176421 0.087239 0.120171 0.144886 -0.145649 -0.296198 0.037851 0.990029 -0.124574 0.121032 -0.032171 -0.175561
PD3 0.063522 0.073934 -0.020697 0.017686 -0.020811 0.027509 -0.020964 -0.091018 0.195616 0.058448 0.036329 0.083876 -0.094847
REU1 -0.351732 0.238206 0.042441 -0.273100 -0.254060 0.223398 0.352326 -0.084525 -0.132574 0.958116 -0.287305 0.070017 0.234769
REU2 -0.240622 0.223284 0.028277 -0.212075 -0.182851 0.191049 0.338296 -0.049590 -0.126633 0.917426 -0.326055 0.062825 0.199271

497
SNU1R 0.236782 -0.116175 0.003374 0.193924 0.155023 -0.203949 -0.147112 0.026551 0.019859 -0.242179 0.746764 0.148147 -0.316100
SNU2 0.388851 -0.255879 0.039810 0.258910 0.245934 -0.179378 -0.234501 0.072155 0.153461 -0.291974 0.907879 0.096329 -0.285983
UAV1 -0.071344 -0.024722 -0.119802 -0.228245 -0.264011 0.053850 0.129004 -0.192332 -0.012922 0.093807 0.145293 0.975821 0.082807
UAV4R -0.060756 0.077267 0.026359 -0.059566 -0.059311 -0.180483 0.064983 -0.096771 -0.152775 -0.091827 -0.017189 0.231140 -0.044599
UTU1 -0.374015 -0.040683 0.320580 -0.025580 -0.248540 0.130130 0.106459 -0.057412 -0.167871 0.148163 -0.205633 -0.007866 0.719784
UTU2R -0.353733 0.209682 0.000383 -0.296872 -0.316036 0.330656 0.207211 -0.036971 -0.104320 0.211539 -0.332419 0.105613 0.837825

498
Outer Loadings
ATU COU EGU IND INU MAS MEU PBU PD REU SNU UAV UTU
ATU1R 0.791230
ATU2 0.630332
ATU3 0.781532
COU1R 0.987504
COU2R 0.983017
EGU1R 0.519778
EGU2 0.898148
IND1R 0.683051
IND3 0.960360
INU1R 0.843001
INU2 0.777708
INU3R 0.826741
MAS2 0.591589
MAS4 0.966023

499
MEU1 0.858140
MEU2 0.819511
MEU3 0.903174
MEU4 0.674028
PBU1 0.105091
PBU3 0.999388
PD2 0.990029
PD3 0.195616
REU1 0.958116
REU2 0.917426
SNU1R 0.746764
SNU2 0.907879
UAV1 0.975821
UAV4R 0.231140
UTU1 0.719784
UTU2R 0.837825

500
Outer weights or loadings
ATU COU EGU IND INU MAS MEU PBU PD REU SNU UAV UTU
ATU1R 0.791230
ATU2 0.630332
ATU3 0.781532
COU1R 0.987504
COU2R 0.983017
EGU1R 0.519778
EGU2 0.898148
IND1R 0.683051
IND3 0.960360
INU1R 0.843001
INU2 0.777708
INU3R 0.826741
MAS2 0.591589
MAS4 0.966023

501
MEU1 0.858140
MEU2 0.819511
MEU3 0.903174
MEU4 0.674028
PBU1 0.105091
PBU3 0.999388
PD2 0.990029
PD3 0.195616
REU1 0.958116
REU2 0.917426
SNU1R 0.746764
SNU2 0.907879
UAV1 0.975821
UAV4R 0.231140
UTU1 0.719784
UTU2R 0.837825

502
Bootstrapping for understating income scenario (revised model) – New
Zealand
Report November 13, 2013 11:46:16 AM
Table of contents (complete)
Bootstrapping
o Bootstrapping
Outer Weights
Inner Model T-Statistic
Path Coefficients
Total Effects (Mean, STDEV, T-Values)
Outer Model T-Statistic
Path Coefficients (Mean, STDEV, T-Values)
Outer Weights (Mean, STDEV, T-Values)
Total Effects
Outer Loadings
Outer Loadings (Mean, STDEV, T-Values)
Model
o Specification
Measurement Model Specification
Manifest Variable Scores (Original)
Structural Model Specification
Data Preprocessing
o Results (chronologically)
Step 0 (Original Matrix)

503
Outer Model T-Statistic
ATU COU EGU IND INU MAS MEU PBU PD REU SNU UAV UTU
ATU1R 13.765991
ATU2 6.726457
ATU3 12.741660
COU1R 199.130520
COU2R 91.144979
EGU1R 1.886234
EGU2 3.931943
IND1R 3.926299
IND3 24.225172
INU1R 17.580146
INU2 12.270185
INU3R 15.843830
MAS2 2.335924
MAS4 9.285640

504
MEU1 16.585650
MEU2 6.718003
MEU3 18.368364
MEU4 4.624730
PBU1 0.547014
PBU3 9.159642
PD2 4.048575
PD3 0.688607
REU1 18.394794
REU2 10.892945
SNU1R 4.792238
SNU2 12.982682
UAV1 6.805834
UAV4R 0.967578
UTU1 5.050600
UTU2R 10.320005

505
PLS algorithm for second order factor and structural models for overstating
tax expense scenario – Malaysia
Report November 13, 2013 12:14:35 PM
Table of contents (complete)
Model
o Specification
Measurement Model Specification
Manifest Variable Scores (Original)
Structural Model Specification
PLS
o Quality Criteria
Overview
Redundancy
Cronbachs Alpha
Latent Variable Correlations
R Square
Cross Loadings
AVE
Communality
Total Effects
Composite Reliability
o Calculation Results
Stop Criterion Changes
Outer Loadings
Outer Model (Weights or Loadings)
Path Coefficients
Latent Variable Scores
Manifest Variable Scores (Used)
Outer Weights
Data Preprocessing
o Results (chronologically)
Step 0 (Original Matrix)
Index Values
o Results
Measurement Model (restandardised)
Path Coefficients
Measurement Model
Latent Variable Scores (unstandardised)
Index Values for Latent Variables

506
Path Coefficients
ATO COO CUL EGO ES IND INO MAS MEO PBO PD REO SNO UAV UTO
ATO 0.664097
COO 0.189737
CUL 0.023597
EGO 0.074819
ES -0.164381
IND -0.328162
INO
MAS 0.392061
MEO 0.595538
PBO 0.056057
PD 0.638304
REO 0.245258
SNO 0.125282
UAV 0.302449
UTO 0.166836

507
Bootstrapping for second order factor and structural models for overstating
tax expense scenario – Malaysia
Report November 13, 2013 12:56:59 PM
Table of contents (complete)
Bootstrapping
o Bootstrapping
Outer Weights
Inner Model T-Statistic
Path Coefficients
Total Effects (Mean, STDEV, T-Values)
Outer Model T-Statistic
Path Coefficients (Mean, STDEV, T-Values)
Outer Weights (Mean, STDEV, T-Values)
Total Effects
Outer Loadings
Outer Loadings (Mean, STDEV, T-Values)
Model
o Specification
Measurement Model Specification
Manifest Variable Scores (Original)
Structural Model Specification
Data Preprocessing
o Results (chronologically)
Step 0 (Original Matrix)

508
PLS Quality Criteria
Overview
AVE Composite
Reliability
R
Square
Cronbachs
Alpha Communality Redundancy
ATO 0.831853 0.936874 0.899142 0.831853
COO 0.977576 0.988661 0.977064 0.977576
CUL 0.197347 0.051786 0.999467 0.087092 0.197347 0.056929
EGO 0.515869 0.664739 0.071925 0.515869
ES 0.434372 0.892911 0.999977 0.865132 0.434372 0.075433
IND 0.486858 0.568023 -0.128288 0.486857
INO 0.814119 0.929273 0.776502 0.885818 0.814119 0.576934
MAS 0.601057 0.746006 0.359538 0.601058
MEO 0.789085 0.937219 0.909926 0.789085
PBO 0.539945 0.673414 0.203867 0.539945
PD 0.576154 0.801994 0.628208 0.576154
REO 0.901223 0.948045 0.890406 0.901223
SNO 0.630961 0.766836 0.466314 0.630961
UAV 0.527715 0.688147 0.107917 0.527715
UTO 0.616747 0.762948 0.378590 0.616747

509
Inner Model T-Statistic
ATO COO CUL EGO ES IND INO MAS MEO PBO PD REO SNO UAV UTO
ATO 7.76563
6
COO 4.06358
2
CUL 0.54841
5
EGO 2.78512
2
ES 1.94561
3
IND 3.44
2030
INO
MAS 2.86
8103
MEO 11.5380
53
PBO 1.30682
8
PD 2.70
7332
REO 8.07537
1
SNO 1.58059
4
UAV 3.20
3052
UTO 7.37929
9

510
PLS algorithm for second order factor and structural models for overstating
tax expense scenario – New Zealand
- Report November 13, 2013 2:25:12 PM
Table of contents (complete)
Model
o Specification
Measurement Model Specification
Manifest Variable Scores (Original)
Structural Model Specification
PLS
o Quality Criteria
Overview
Redundancy
Cronbachs Alpha
Latent Variable Correlations
R Square
Cross Loadings
AVE
Communality
Total Effects
Composite Reliability
o Calculation Results
Stop Criterion Changes
Outer Loadings
Outer Model (Weights or Loadings)
Path Coefficients
Latent Variable Scores
Manifest Variable Scores (Used)
Outer Weights
Data Preprocessing
o Results (chronologically)
Step 0 (Original Matrix)
Index Values
o Results
Measurement Model (restandardised)
Path Coefficients
Measurement Model
Latent Variable Scores (unstandardised)
Index Values for Latent Variables

511
PLS Quality Criteria
Overview
AVE Composite
Reliability
R
Square
Cronbachs
Alpha Communality Redundancy
ATO 0.687087 0.868060 0.775300 0.687087
COO 0.950050 0.974385 0.947444 0.950050
CUL 0.217225 0.058421 0.999376 0.267062 0.217225 0.115165
EGO 0.497337 0.526870 -0.069556 0.497337
ES 0.355294 0.823224 0.999704 0.766930 0.355294 0.056738
IND 0.719415 0.836032 0.622944 0.719415
INO 0.723221 0.886360 0.717101 0.807445 0.723221 0.441897
MAS 0.681299 0.810393 0.532766 0.681299
MEO 0.719773 0.910773 0.867695 0.719773
PBO 0.474716 0.499807 0.438183 0.474716
PD 0.586795 0.809523 0.675866 0.586793
REO 0.931218 0.964384 0.926143 0.931218
SNO 0.689192 0.815798 0.551445 0.689192
UAV 0.557726 0.683405 0.321737 0.557728
UTO 0.633905 0.775763 0.423647 0.633905
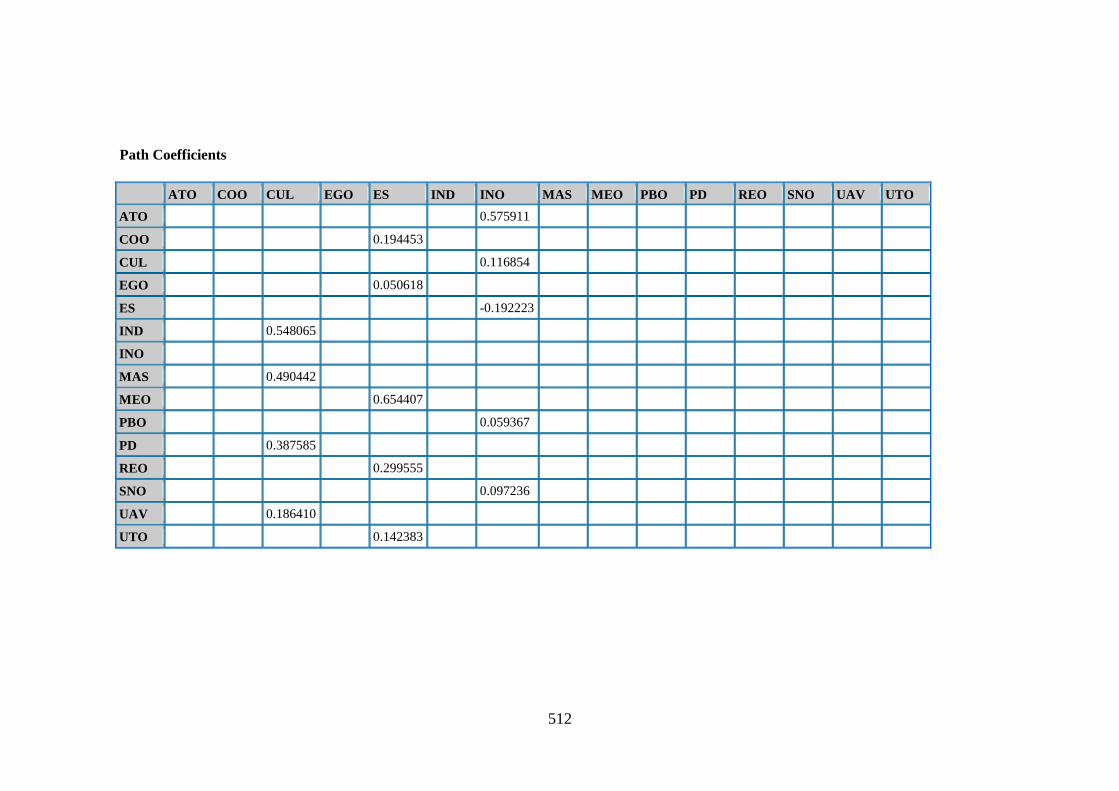
512
Path Coefficients
ATO COO CUL EGO ES IND INO MAS MEO PBO PD REO SNO UAV UTO
ATO 0.575911
COO 0.194453
CUL 0.116854
EGO 0.050618
ES -0.192223
IND 0.548065
INO
MAS 0.490442
MEO 0.654407
PBO 0.059367
PD 0.387585
REO 0.299555
SNO 0.097236
UAV 0.186410
UTO 0.142383

513
Bootstrapping for second order factor and structural models for overstating
tax expense scenario – New Zealand
Report November 13, 2013 3:19:41 PM
Table of contents (complete)
Bootstrapping
o Bootstrapping
Outer Weights
Inner Model T-Statistic
Path Coefficients
Total Effects (Mean, STDEV, T-Values)
Outer Model T-Statistic
Path Coefficients (Mean, STDEV, T-Values)
Outer Weights (Mean, STDEV, T-Values)
Total Effects
Outer Loadings
Outer Loadings (Mean, STDEV, T-Values)
Model
o Specification
Measurement Model Specification
Manifest Variable Scores (Original)
Structural Model Specification
Data Preprocessing
o Results (chronologically)
Step 0 (Original Matrix)

514
Inner Model T- Statistic
ATO COO CUL EGO ES IND INO MAS MEO PBO PD REO SNO UAV UTO
ATO 6.276476
COO 4.188292
CUL 1.712842
EGO 2.016393
ES 2.079796
IND 3.790446
INO
MAS 4.245451
MEO 14.350930
PBO 1.522954
PD 1.818727
REO 9.615902
SNO 1.552824
UAV 1.854711
UTO 5.005469

515
PLS algorithm for second order factor and structural models for understating
income scenario – Malaysia
- Report November 13, 2013 1:36:28 PM
Table of contents (complete)
Model
o Specification
Measurement Model Specification
Manifest Variable Scores (Original)
Structural Model Specification
PLS
o Quality Criteria
Overview
Redundancy
Cronbachs Alpha
Latent Variable Correlations
R Square
Cross Loadings
AVE
Communality
Total Effects
Composite Reliability
o Calculation Results
Stop Criterion Changes
Outer Loadings
Outer Model (Weights or Loadings)
Path Coefficients
Latent Variable Scores
Manifest Variable Scores (Used)
Outer Weights
Data Preprocessing
o Results (chronologically)
Step 0 (Original Matrix)
Index Values
o Results
Measurement Model (restandardised)
Path Coefficients
Measurement Model
Latent Variable Scores (unstandardised)
Index Values for Latent Variables

516
PLS Quality Criteria
Overview
AVE Composite
Reliability
R
Square
Cronbachs
Alpha Communality Redundancy
ATU 0.729693 0.890029 0.816972 0.729693
COU 0.962459 0.980871 0.961063 0.962459
CUL 0.214066 0.010426 0.999289 -0.050904 0.214066 0.089618
EGU 0.438342 0.608487 -0.283484 0.438342
ES 0.429436 0.890119 0.999819 0.858551 0.429436 0.094249
IND 0.488850 0.557387 -0.128288 0.488850
INU 0.720718 0.885354 0.670456 0.805195 0.720718 0.420447
MAS 0.601373 0.746440 0.359538 0.601373
MEU 0.801278 0.941491 0.916439 0.801278
PBU 0.626581 0.751675 0.691391 0.626581
PD 0.717715 0.835565 0.608215 0.717715
REU 0.892029 0.942931 0.879404 0.892029
SNU 0.629851 0.772695 0.413586 0.629851
UAV 0.508717 0.322382 -0.069912 0.508717
UTU 0.584244 0.736295 0.293022 0.584244

517
Path Coefficients
ATU COU CUL EG
U
ES IND INU MAS MEU PBU PD REU SNU UA
V
UTU
ATU 0.572541
COU 0.227269
CUL -0.053819
EGU 0.065310
ES -0.189093
IND 0.408370
INU
MAS 0.545654
MEU 0.608988
PBU -0.004306
PD -0.285547
REU 0.221407
SNU 0.101959
UAV 0.329494
UTU 0.150929

518
Bootstrapping for second order factor and structural models for understating
income scenario – Malaysia
Report November 13, 2013 2:11:04 PM
Table of contents (complete)
Bootstrapping
o Bootstrapping
Outer Weights
Inner Model T-Statistic
Path Coefficients
Total Effects (Mean, STDEV, T-Values)
Outer Model T-Statistic
Path Coefficients (Mean, STDEV, T-Values)
Outer Weights (Mean, STDEV, T-Values)
Total Effects
Outer Loadings
Outer Loadings (Mean, STDEV, T-Values)
Model
o Specification
Measurement Model Specification
Manifest Variable Scores (Original)
Structural Model Specification
Data Preprocessing
o Results (chronologically)
Step 0 (Original Matrix)

519
Inner Model T-Statistic
ATU COU CUL EGU ES IND INU MAS MEU PBU PD REU SNU UAV UTU
ATU 4.704148
COU 5.430726
CUL 0.891708
EGU 2.369549
ES 1.657514
IND 4.375407
INU
MAS 4.454106
MEU 15.578184
PBU 0.105695
PD 1.440995
REU 6.351521
SNU 1.264282
UAV 3.476244
UTU 5.269384

520
PLS algorithm for second order factor and structural models for understating
income scenario – New Zealand
- Report November 13, 2013 3:35:53 PM
Table of contents (complete)
Model
o Specification
Measurement Model Specification
Manifest Variable Scores (Original)
Structural Model Specification
PLS
o Quality Criteria
Overview
Redundancy
Cronbachs Alpha
Latent Variable Correlations
R Square
Cross Loadings
AVE
Communality
Total Effects
Composite Reliability
o Calculation Results
Stop Criterion Changes
Outer Loadings
Outer Model (Weights or Loadings)
Path Coefficients
Latent Variable Scores
Manifest Variable Scores (Used)
Outer Weights
Data Preprocessing
o Results (chronologically)
Step 0 (Original Matrix)
Index Values
o Results
Measurement Model (restandardised)
Path Coefficients
Measurement Model
Latent Variable Scores (unstandardised)
Index Values for Latent Variables

521
PLS Quality Criteria
Overview
AVE Composite
Reliability
R
Square
Cronbachs
Alpha Communality Redundancy
ATU 0.545450 0.780986 0.620449 0.545450
COU 0.970898 0.985234 0.970035 0.970898
CUL 0.243222 0.012016 0.999432 -0.051085 0.243222 0.148981
EGU 0.522270 0.629601 0.167169 0.522270
ES 0.315250 0.794275 0.999273 0.736232 0.315250 0.084497
IND 0.722184 0.838229 0.622944 0.722184
INU 0.668122 0.857848 0.581743 0.752795 0.668122 0.274220
MAS 0.681488 0.810564 0.532766 0.681488
MEU 0.678645 0.893675 0.840028 0.678645
PBU 0.503922 0.548182 0.245333 0.503922
PD 0.600870 0.728466 0.498284 0.600868
REU 0.882518 0.937593 0.866886 0.882518
SNU 0.690833 0.815717 0.570554 0.690833
UAV 0.497318 0.370471 0.025466 0.497318
UTU 0.593477 0.734163 0.366099 0.593477

522
Path Coefficients
ATU COU CUL EGU ES IND INU MAS MEU PBU PD REU SNU UAV UTU
ATU 0.484993
COU 0.295109
CUL 0.161393
EGU 0.053772
ES -0.282935
IND 0.598517
INU
MAS -0.502688
MEU 0.662647
PBU 0.162176
PD 0.191699
REU 0.261472
SNU -0.094671
UAV -0.211635
UTU 0.140640

523
Bootstrapping for second order factor and structural models for understating
income scenario – New Zealand
- Report November 13, 2013 4:09:05 PM
Table of contents (complete)
Bootstrapping
o Bootstrapping
Outer Weights
Inner Model T-Statistic
Path Coefficients
Total Effects (Mean, STDEV, T-Values)
Outer Model T-Statistic
Path Coefficients (Mean, STDEV, T-Values)
Outer Weights (Mean, STDEV, T-Values)
Total Effects
Outer Loadings
Outer Loadings (Mean, STDEV, T-Values)
Model
o Specification
Measurement Model Specification
Manifest Variable Scores (Original)
Structural Model Specification
Data Preprocessing
o Results (chronologically)
Step 0 (Original Matrix)

524
Inner Model T-Statistic
ATU COU CUL EGU ES IND INU MAS MEU PBU PD REU SNU UAV UTU
ATU 5.906430
COU 6.240079
CUL 2.748569
EGU 1.454729
ES 3.581011
IND 6.205474
INU
MAS 5.814545
MEU 12.290886
PBU 1.863370
PD 2.030104
REU 7.614010
SNU 1.616854
UAV 2.456804
UTU 4.086740