tax panel overview of connecticut state revenue system tax panel/20150916/ct... · tax panel...
TRANSCRIPT

Tax Panel
Overview of Connecticut State Revenue System
Office of Policy and Management
Matthew Pellowski, Budget Analyst
September 16, 2015

2

3
Table of Contents
I. Overview of Connecticut’s State Revenue System .........................................................4
II. Revenue Performance..........................................................................................................9
III. Revenue Volatility..............................................................................................................15
IV. Tax Incidence ......................................................................................................................18
V. Impact of Tax Credits ........................................................................................................21
VI. Policy Changes 2000-2015 .................................................................................................24
VII. Appendices .........................................................................................................................27

4
Section I – Overview of Connecticut’s State Revenue System
General Fund
General Fund revenues are derived primarily from the collection of State taxes,
including the personal income tax, the sales and use tax and the corporation business
tax. See appendix A, attached, for a historical summary of revenue raised by each
General Fund source.
Personal Income Tax
Since 1991, Connecticut has imposed a personal income tax on the income of residents
of the state (including resident trusts and estates), part-year residents and certain non-
residents who have taxable income derived from or connected with sources within
Connecticut. The current tax, as amended during the 2015 legislative session, is
imposed on a progressive scale with a maximum rate of 6.99% on adjusted gross
income. Prior to recent legislation, the top marginal rate was 6.7%. Connecticut uses
Federal adjusted gross income (AGI) as the starting point to calculate the state income
tax. The following table summarizes current tax rates for single and joint filers.
Personal Income Tax
Tax Rates – Effective Income Year 2015
Single Filers Joint Filers
Taxable Income Taxable Income
From To Rate From To Rate
$0 $10,000 3.0% $0 $20,000 3.0%
$10,000 $50,000 5.0% $20,000 $100,000 5.0%
$50,000 $100,000 5.5% $100,000 $200,000 5.5%
$100,000 $200,000 6.0% $200,000 $400,000 6.0%
$200,000 $250,000 6.5% $400,000 $500,000 6.5%
$250,000 $500,000 6.9% $500,000 $1,000,000 6.9%
$500,000 & Over 6.99% $1,000,000 & Over 6.99%
Depending on federal income tax filing status, the taxable year and Connecticut
adjusted gross income, personal exemptions are available to taxpayers, ranging from
$12,000 to $24,000. The singles exemption has increased annually and is scheduled to
reach $15,000 by taxable year 2016. In addition, tax credits ranging from 1% to 75% of a
taxpayer’s Connecticut tax liability are also available depending upon federal income
tax filing status, the taxable year and Connecticut adjusted gross income. Such

5
exemptions and tax credits are phased out at higher income levels. In addition, lower
tax rates are phased out or “recaptured” for high income earners. There is also an
income tax credit for property tax paid. The value of the credit has changed several
times; the credit is currently valued at $300 per filer. Legislation passed during the 2015
legislative session will decrease the credit to $200 per filer beginning in income year
2016. This credit is phased-out for higher income earners. Taxpayers are also subject to a
Connecticut minimum tax, based on their liability, if any, for payment of the federal
alternative minimum tax. Neither the personal exemption nor the tax credits described
above are available to trusts or estates.
Sales and Use Tax
A sales tax is imposed, subject to certain limitations, on the gross receipts from certain
transactions within the state of persons engaged in business in the state, including (a)
retail sales of tangible personal property, (b) the rendering of certain services, (c) the
leasing or rental of tangible personal property, (d) the production, fabrication,
processing, printing, or imprinting of tangible personal property to special order or
with materials furnished by the consumer, (e) the furnishing, preparation or serving of
food, meals, or drinks, and (f) hotel or lodging house rooms for a period not exceeding
thirty consecutive calendar days. A use tax is imposed, with certain exceptions, on the
consideration paid for certain services or purchases or rentals of tangible personal
property used within the state pursuant to a transaction not subject to the sales tax. The
tax rate for the sales and use tax is 6.35%. A separate rate of 15% is charged on the
occupancy of hotel rooms. Various exemptions from the sales and use taxes are
provided, based on the nature, use or price of the property or services involved or the
identity of the purchaser.
Legislation passed during the 2015 legislative session would direct a portion of sales
and use tax to the Special Transportation Fund and the Municipal Revenue Sharing
Account beginning October 1, 2015 for the Special Transportation Fund and January 1,
2016 for the Municipal Revenue Sharing Account.
Corporate Business Tax
A Corporation Business Tax is imposed on any corporation, joint stock company or
association, any dissolved corporation that continues to conduct business, any electric
distribution company or fiduciary of any of the foregoing that carries on or has the right
to carry on business within the state, owns or leases property, maintains an office within
the state, or is a general partner in a partnership or a limited partner in a limited

6
partnership, except an investment partnership, which does business, owns or leases
property or maintains an office within the state. Certain financial services companies
and domestic insurance companies are exempt from this tax. Corporations compute
their tax liability under three methods, determine which calculation produces the
greatest tax, and pay that amount to the state.
The first method of computing the Corporation Business Tax is a tax measured
by the net income of a taxpayer (the “Income-Base Tax”). Net income means
federal gross income with limited variations less certain deductions, most of
which correspond to the deductions allowed under the Internal Revenue Code of
1986, as amended. The Income-Base Tax is at a rate of 7.5% for taxable years
commencing on and after January 1, 2000 (exclusive of a surcharge described
later.)
The second method of computing the Corporation Business Tax is a tax on
capital. This tax is determined either as a specific maximum dollar amount or at a
flat rate on a defined base, usually related in whole or in part to the corporation’s
capital stock and balance sheet surplus, profit and deficit.
The third method of computing the Corporation Business Tax is a minimum tax
in the amount of $250.
The state requires multi-state and multi-national firms to pay the corporation business
tax on the amount of economic activity apportionable to Connecticut. Companies are
required to calculate the portion of their profits attributable to Connecticut using a three
factor formula: property, payroll, and sales. The sales factor is double weighted.
Broadcasting, manufacturing, financial services, and credit card firms use a single-factor
receipts formula.
The state limits corporation credits from reducing tax liability by more than 70%.
Legislation passed during the 2015 legislative session lowered the amount corporations
may reduce their liability using tax credits to 50.01%. Connecticut permits groups of
corporations to file a “combined” return if they are permitted to file a federal
consolidated return. Corporation groups filing combined returns are also liable for the
preference tax; they must also calculate their liability as separate entities and are not
entitled to the first $500,000 of tax savings over what they would pay if they filed
separately. During the 2015 legislative session, the General Assembly passed, as part of
the FY 2016-FY 2017 biennium budget, mandatory unitary reporting beginning in
income year 2016. This change would require businesses with multiple majority-owned

7
companies to report those companies as part of a unitary group for purposes of
apportioning income to the State of Connecticut.
The state imposed a corporation business tax surcharge of 10% for income years 2009,
2010 and 2011 for businesses with over $100 million in federal adjusted gross income,
and increased it to 20% for tax years 2012 through 2015. Legislation passed during the
2015 legislative session would extend the 20% surcharge through tax years 2016 and
2017, lower it to 10% in tax year 2018, and completely phase it out beginning in tax year
2019.
Limited liability corporations (LLCs), limited liability partnerships (LLPs), and S
corporations are not subject to the state corporation tax. Rather, a flat $250 charge is
levied on these entities. The tax extends to single-member LLCs that are not considered
entities separate from their owners for federal tax purposes. Beginning with taxable
year 2013, this tax is due biennially.
Other Taxes
Other tax revenues are derived from gift and estate taxes; taxes on gross receipts of
public service corporations, on net direct premiums of insurance companies, on gross
receipts from the sale of petroleum products, on cigarettes and alcoholic beverages, on
real estate transfers, on admissions and dues, on healthcare providers; and other
miscellaneous taxes.
Other Non-Tax Revenues
The largest source of non-tax revenue to the General Fund is federal grants. Depending
upon the program being funded, federal grants-in-aid are normally conditioned, to
some degree, on resources provided by the state. Most unrestricted federal grant
revenue is based on expenditures. The state also receives certain restricted federal
grants that are not reflected in annual appropriations but that nonetheless are
accounted for in the General Fund.
Other non-tax revenues are derived from special revenue transfers (lottery); Indian
gaming payments; licenses, permits and fees; sales of commodities and services; rents,
fines and escheats; investment income; other miscellaneous revenue sources; and
designated Tobacco Settlement Revenues.

8
Special Transportation Fund
The state has established the Special Transportation Fund for the purpose of budgeting
and accounting for all transportation-related taxes, fees and revenues credited to such
Fund. Motor fuel taxes, motor vehicle receipts, motor vehicle related licenses, permits
and fees, the oil companies tax, and portions of the sales tax are deposited to the fund.
Please see appendix B, attached, for a historical summary of revenue raised by each
Special Transportation Fund source.
Motor Fuels Tax
The largest source of tax revenue to the Special Transportation Fund is the state excise
tax on motor fuels. The Gasoline Tax is imposed on each gallon of gasoline or gasohol
sold or used within the state by a distributor and is currently levied at 25¢ per gallon.
The tax on special fuels (diesel fuel) is assessed on each gallon of special fuels used
within the state in a motor vehicle licensed, or required to be licensed, to operate upon
the public highways of the state. The diesel fuel tax rate is adjusted annually and for
fiscal year 2016 has been set at 50.3¢ per gallon.

9
Section II - Revenue Performance
Over the long run, General Fund revenue has grown in conjunction with the state
economy, increasing during expansionary periods and decreasing during recessions.
Revenue peaked in FY 2001 prior to the early 2000’s recession. According to the
National Bureau of Economic Research (NBER), the recession’s trough occurred in
November 2001, during FY 2002. Revenue increased following that recession and hit
another peak in FY 2008 before entering into the Great Recession. Since that time,
revenue has been growing, albeit at an uneven pace. The graph below shows historical
General Fund revenue as reported in the Annual Report of the State Comptroller.
Chart 1
General Fund Revenue by Fiscal Year (in millions)
Source: Office of the State Comptroller
Please note that in FY 2014 the state moved to net budgeting of Medicaid; prior to that
year, the state counted matching federal reimbursements for Medicaid as General Fund
revenue. The change to net budgeting resulted in nearly $3 billion less general fund
revenue in FY 2014. The dashed line in Chart 1 represents the revenue that would have
been recorded as General Fund revenue in the absence of this change.
While Chart 1 represents nominal growth in General Fund revenue, there have been
many tax policy changes over that period of time which have had a fundamental impact
on revenue collections. OPM has estimated the “economic growth rate,” or baseline
$12,886.0
$11,943.7
$16,418.8
$15,700.8
$19,405.0
$17,608.1
$20,601.1
$10,000.0
$12,000.0
$14,000.0
$16,000.0
$18,000.0
$20,000.0
$22,000.0
'01 '02 '03 '04 '05 '06 '07 '08 '09 '10 '11 '12 '13 '14
Fiscal Year

10
growth rate, of the General Fund by controlling for the estimated impact of policy
changes. Please note that this method is limited by its reliance on fiscal estimates of
policy changes produced prior to implementation of those changes.
Chart 2
General Fund Economic Growth Rates
As shown in this graph, The Great Recession resulted in two years of underlying
revenue decline in fiscal years 2009 and 2010. Following the recession, Federal stimulus,
rebounding equity markets, and the expectation that the Bush-era tax cuts were going
to expire at the end of 2010 led to a 10.3% jump in FY 2011 followed by only a 0.9%
increase in FY 2012. Similar to the pattern exhibited in FY 2011 and FY 2012, the partial
expiration of the Bush tax cuts at the end of 2012 led to a 6.6% increase in FY 2013
followed by a weakened 0.6% growth in FY 2014.
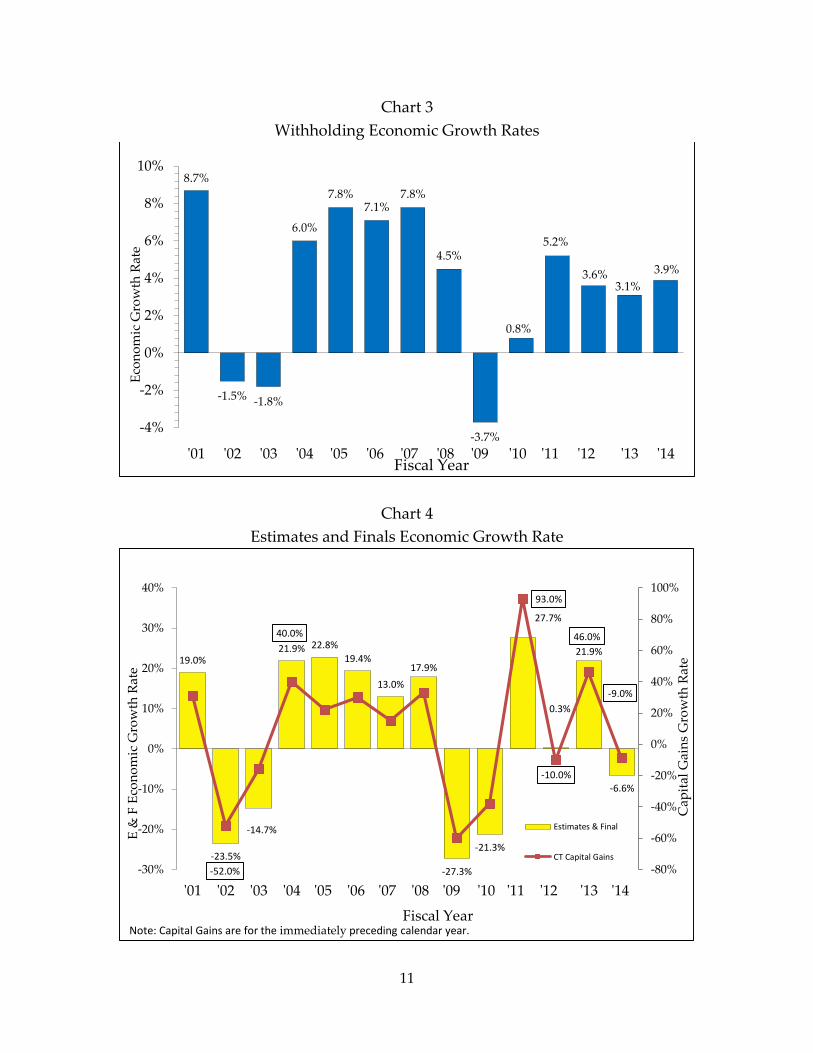
Over the past decade Connecticut’s income tax revenue has fluctuated dramatically.
Volatility was primarily driven by estimates and finals collections of the personal
income tax. This was due to the performance of the stock market and two recessions.
Performance in the financial markets significantly influences the growth in this revenue
source. The following two graphs show the economic growth rates, as calculated by
OPM, for 1.) withholding and 2.) estimates and finals collections of the personal income
tax. Chart 4 also includes data on the growth in capital gains realization from the prior
year, demonstrating the outsized impact this source of income has on collections.
7.1%
-7.5%
0.2%
8.9%7.6%
8.9%
6.1%
3.3%
-11.1%
-2.1%
10.3%
0.9%
6.6%
0.6%
-15%
-9%
-3%
3%
9%
15%
'01 '02 '03 '04 '05 '06 '07 '08 '09 '10 '11 '12 '13 '14
% G
row
th
Fiscal Year
11
Chart 3
Withholding Economic Growth Rates
Chart 4
Estimates and Finals Economic Growth Rate
8.7%
-1.5% -1.8%
6.0%
7.8%7.1%
7.8%
4.5%
-3.7%
0.8%
5.2%
3.6%3.1%
3.9%
-4%
-2%
0%
2%
4%
6%
8%
10%
'01 '02 '03 '04 '05 '06 '07 '08 '09 '10 '11 '12 '13 '14
Eco
no
mic
Gro
wth
Rat
e
Fiscal Year
19.0%
-23.5%
-14.7%
21.9% 22.8%
19.4%
13.0%
17.9%
-27.3%
-21.3%
27.7%
0.3%
21.9%
-6.6%
-52.0%
40.0%
93.0%
-10.0%
46.0%
-9.0%
-80%
-60%
-40%
-20%
0%
20%
40%
60%
80%
100%
-30%
-20%
-10%
0%
10%
20%
30%
40%
'01 '02 '03 '04 '05 '06 '07 '08 '09 '10 '11 '12 '13 '14
Cap
ital
Gai
ns
Gro
wth
Rat
e
E &
F E
con
om
ic G
row
th R
ate
Fiscal Year
Estimates & Final
CT Capital Gains
Note: Capital Gains are for the immediately preceding calendar year.

12
After the personal income tax, the sales and use tax is the second largest source of
income to the General Fund. In the aftermath of the Great Recession, the sales tax
dropped in two consecutive years, FY 2009 and FY 2010, due to chaos in the financial
markets and the worst economic downturn since WWII. Collections in late FY 2011
improved markedly as employment and personal income increased. Weak economic
growth and the expiration of the federal payroll tax cut that was a component of the
federal government’s stimulus measures, effective January 2013, led to only 1.3%
growth in FY 2013. Chart 5 show the economic growth rates, as calculated by OPM, for
the sales and use tax.
Chart 5
Sales and Use Tax Growth Rates
The recovery of General Fund revenues following the Great Recession has been weaker
than prior recoveries. The following graphs compare the recoveries in Personal Income
Tax and Sales Tax collections following the prior two recessions. By setting peak years
to an index value of 100 and removing the impact of tax changes, ready comparisons
can be made about subsequent performance. For the two most recent recession and
recovery periods, revenue peaked in FY 2001 and FY 2008, respectively, before entering
into recession.
4.9%
1.2%
-1.9%
5.6%
3.9%2.8% 3.0%
2.3%
-7.9%
-3.5%
4.9%
2.4%1.3%
1.9%
-10%
-7%
-4%
-1%
2%
5%
8%
'01 '02 '03 '04 '05 '06 '07 '08 '09 '10 '11 '12 '13 '14
Eco
no
mic
Gro
wth
Rat
e
Fiscal Year

13
Chart 6
Chart 7
As the graphs above show, as of FY 2014, income tax revenues had exceeded their pre-
recession peak for the last two fiscal years. Controlling for tax changes, revenue was
4.8% above pre-recession levels. If this recovery had been similar to the 2003 recovery,
income tax revenue would have been $2.0 billion higher in FY 2014. Unlike the income
91.5 86.3
95.9
108.1
120.2
131.7
88.5 82.7 93.2
95.5
104.4 104.8
75.0
85.0
95.0
105.0
115.0
125.0
135.0
0 1 2 3 4 5 6Years from Peak
Personal Income TaxImpact of Recessions on Baseline Revenue
2002 Recession 2008 Recession
Peak Years: FY 2001 & FY 2008
101.2 99.3
104.8
108.9 112.0
115.3
92.1 88.9
93.2 95.5 96.7
98.5
80.0
85.0
90.0
95.0
100.0
105.0
110.0
115.0
120.0
0 1 2 3 4 5 6
Years from Peak
Sales TaxImpact of Recessions on Baseline Revenue
2002 Recession 2008 Recession
Peak Years: FY 2001 & FY 2008

14
tax, the state’s sales tax had not exceeded its pre-recession peak as of FY 2014; the tax
was down 1.5% from FY 2008 levels. Had the sales tax recovered at the same pace as in
2003, revenues would have been $601 million higher in FY 2014. It is important to note
that, while personal income tax had a deeper trough than sales and use tax, it also
recovered more quickly than sales and use tax when controlling for policy changes.

15
Section III – Revenue Volatility
Connecticut’s General Fund and Special Transportation Fund revenue portfolios are
comprised of several different revenue sources. Each source has a different base and is
subject to different economic and behavioral phenomena. As a result, some revenue
sources are more volatile than others. Greater volatility implies more difficulty
forecasting future receipts and less reliability as changes occur in the economy.
Buoyancy Analysis
Two common measures of tax volatility are tax buoyancy and tax elasticity. Tax
buoyancy measures a revenue source’s response to economic growth by comparing
changes in tax receipts to changes in gross state product (GSP). Tax elasticity measures
the same phenomena while controlling for changes in tax policy. Buoyancy models do
not control for changes in tax policy – a major limitation to these types of models.
However, tax buoyancy is still commonly used as a measure of tax volatility due to the
complexity and uncertainty of estimating the impacts of policy changes.
The Office of Policy and Management has conducted tax buoyancy analyses of General
Fund, personal income tax, sales and use tax, and corporation tax revenue. These
models were conducted using the following model:
𝐿𝑜𝑔 𝑇𝐴𝑋𝑖 = 𝛽0 + 𝛽1𝐿𝑜𝑔 𝐺𝑆𝑃 + 𝜀
Where TAX is the source of revenue, GSP is Connecticut gross state product, and 𝜀 is an
error term. Ordinary least squares regression analysis techniques are used to estimate
the coefficients. Logarithmic values of TAX and GSP are used to compare a percentage
change in GSP to a percentage change in TAX, rather than a unit change. In such a
model, the coefficient 𝛽1 is an estimate of the percentage change of a tax type associated
with a one percent change in gross state product.
The models were conducted using data found in the Annual Report of the State
Comptroller for fiscal years 2001 to 2014. This “peak-to-peak” measurement attempts to
control for the impact of economic cycles. In addition, the amount of federal grant
money that would have been deposited to the General Fund in the absence of “net-
budgeting” of Medicaid is added back to the General Fund for purposes of this analysis.
The following table contains the buoyancy of each tax type and the adjusted r-square
for each model. The adjusted r-square indicates how much of the variation in each tax

16
type is explained by the model, with values closer to 1.0 fully explaining the change,
and weaker explanatory power as the value declines from 1.0:
Buoyancy Adjusted R-Square
General Fund 1.18 0.86
Personal Income Tax 1.80 0.92
Sales and Use Tax 0.60 0.66
Corporation Tax 1.43 0.66
This indicates that a 1% change in Connecticut gross state product resulted in a 1.8%
change in personal income tax, a 0.6% change in sales and use tax, a 1.4% change in
corporation tax, and a 1.2% change in General Fund revenue during the period from
fiscal year 2001 to 2014. This finding affirms that personal income tax, the largest source
of revenue to the General Fund, is the most volatile and susceptible to changes in the
economy of the three largest General Fund taxes. The corporation tax is also volatile
relative to the overall General Fund, while sales and use tax has been relatively
inelastic.
Budget Reserve Fund Reform
Public Act 15-244, the FY 2016-2017 biennium budget, included several reforms to the
Budget Reserve Fund (BRF). The intent of these changes is to mitigate the revenue
volatility which has led to budget uncertainty in the state in recent years. In addition,
the bill raises the cap on BRF balance from 10% to 15% of General Fund Appropriations.
The bill requires that growth in “combined revenue” above a threshold be deposited to
the Budget Reserve Fund beginning in FY 2021. “Combined revenue” means tax
revenue from the estimated and final payments of the personal income tax and the
corporation business tax. As discussed, estimates and finals payments and the
corporation business tax are two of the largest and most volatile sources of General
Fund revenue. The threshold is a dollar amount that is derived by taking the ten year
average of combined revenue and multiplying that average by the ten year average
growth in the ten year moving average of combined revenue. The Comptroller is
responsible for determining the threshold for deposits.
If tax changes are enacted that affect combined revenue by 1% or more the Office of
Fiscal Analysis (OFA) and the Office of Policy and Management (OPM) are responsible
to determine the threshold. The growth should be adjusted for any policy changes.

17
Adjustments shall be made for a period of ten fiscal years. If revisions in the January or
April consensus revenue estimate impact combined reporting in the current year, OFA
and OPM may recalculate the threshold level and shall report such revisions along with
consensus revenue.
The Act creates a Restricted Grants Fund as a temporary holding account of surplus
funds in excess of the threshold within a fiscal year. Amounts above the threshold level
are deposited to the Restricted Grants Fund on January 31 and May 15 following
consensus revenue estimates. If forecasted combined revenue declines after January 31,
revenue within the restricted grants fund can be transferred back to the General Fund
based upon a formula. If the consensus revenue estimate of January 15 or April 30
projects a deficit, no transfers will be made to the Restricted Grants Fund. Amounts
held in the Restricted Grants Fund will be transferred to Budget Reserve Fund at the
close of the fiscal year.

18
Section IV – Tax Incidence
One of the most common and significant questions regarding state tax revenues is how
they impact Connecticut households and businesses. In particular, there is frequent
discussion as to whether certain tax types are regressive, progressive, or proportional:
A tax is “progressive” if higher income earners pay more than lower income
earners as a percentage of their income.
A tax is “proportional” if higher income earners and lower income earners pay a
similar amount as a percentage of their income.
A tax is “regressive” if higher income earners pay less than lower income earners
as a percentage of their income.
Department of Revenue Services Study
In order to assess the equity of Connecticut’s tax system, the Department of Revenue
Services published the Connecticut Tax Incidence study in December 2014. The study
utilizes tax year 2011 data, the most recent year for which DRS was able to obtain
federal income tax data to match with state income tax data.
The study analyzed the tax incidence for Connecticut taxpayers. Tax incidence differs
from tax liability, which is the legal obligation to pay a tax. The study assumes
households tend to bear the full impact of their tax liabilities, while businesses
distribute their tax impact to individuals and households through consumer pricing, or
workforce-related practices. The incidence refers to the ultimate impact of a tax after
shifting.
Suits Index
The study utilized the Suits Index to gauge the progressivity of each tax and
Connecticut’s taxes overall. The Suits Index is a statistical, nonbinary measure of
progressivity ranging from negative one to positive one where regressive taxes have
negative values, progressive taxes have positive values and a proportional tax would be
equal to zero. The degree of a tax’s progressive or regressive nature increases the
further it is from zero.
The most progressive tax with a Suits Index of 1.0 would have the single Connecticut
household with the highest Connecticut AGI paying all of the taxes. Likewise, the most
regressive tax would have a Suits Index of -1.0 and have the single Connecticut
household with the lowest Connecticut AGI paying all of the taxes. In reality, neither of
those scenarios would exist and the Suits Index indicators for Connecticut’s taxes will
lie somewhere on the spectrum between 1.0 and -1.0.

19
The DRS model uses a full sample of returns from all taxpayers within a specific tax
type to compute the Suits Index that accounts for each Connecticut income tax filer in
the model. The full-sample Suits Index provides a more robust and targeted analysis as
it takes into account all points of data, as opposed to other levels of analysis which may
only compute the Suits Index based on aggregated population or income decile data.
Results
The Suits Index can be used to compare relative progressivity between taxes within
Connecticut. The following table summarizes the Suits Index for the taxes studied in the
report.
Tax Type Suits Index
Gift and Estate 0.76
Personal Income 0.11
Corporation Business -0.02
Real Estate Conveyance -0.14
Insurance -0.35
Gross Earnings -0.38
Local Property Taxes -0.39
Sales and Use -0.39
Excise -0.67
Total -0.22
Excise taxes include taxes on alcoholic beverages, cigarettes, tobacco, and motor
fuels
Gross Earnings taxes include taxes on community antenna TV, certified
competitive video service providers, satellite TV, railroad companies, gas
companies, gas sales to residential customers, and electric distribution companies
The Personal Income Tax (0.11) and the Gift and Estate Tax (0.76) are the only two taxes
classified as progressive. Some of the many items that contribute to the progressivity of
the Personal Income Tax are its graduated rates that increase with Connecticut AGI, tax
recapture at higher AGI levels, the Earned Income Tax Credit, and the automatic credits
based on AGI that phase out at higher income levels. The Gift and Estate Tax is the most
progressive tax due to its $2 million exemption threshold. The incidence of the Gift and
Estate Tax is borne entirely by the highest decile of taxpayers.

20
Excise Taxes (-0.67), which include alcohol, cigarettes and tobacco and motor fuels, are
the most regressive. Like the Sales and Use Tax (-0.39), Excise Taxes have a regressive
nature since the taxes are levied at the same rate for every consumer regardless of
income. Households with lower Connecticut AGIs spend a larger share of their income
on Excise and Sales and Use Taxes than households with larger Connecticut AGIs. The
overall Suits Index for taxes included in the study was -0.22.
For more information, DRS’ full report is available at:
http://www.ct.gov/drs/lib/drs/research/drstaxincidencereport2014.pdf

21
Section V – Tax Credits
In order to incentivize certain private sector behavior, Connecticut offers taxpayers
various tax credits. These credits reduce a taxpayer’s liability, and therefore reduce
General Fund revenue. Lost revenue may be “made up” by either increases in taxes or
decreases in appropriations. The amount that taxpayers may reduce their liability using
tax credits is currently capped at certain levels for the corporation business tax,
insurance premiums tax, and hospital net revenue tax. The Department of Economic
and Community Development (DECD) produces a report on the efficacy of these credits
every three years. In their 2014 report, they found that the biggest economic impact
results from those tax credits that are tied to job creation.
Connecticut’s Department of Revenue Services (DRS) provides annual data on the
amount of tax credits claimed against the corporation business tax and the insurance
premiums tax by income year. The following table summarizes the amounts claimed
during income year 2012, the latest data available, as well as during the five year period
from income year 2008 to 2012. The data reveal that, on average, tax credits resulted in
over $200 million in foregone revenue per income year during this time period.
Tax Credits Claimed Against Corporation Business and Insurance Premiums Taxes
Tax Credits Claimed
Type of Credit 2012 2008-2012
Fixed Capital $63,125,737 $358,236,881
Film Production* $76,567,036 $298,633,051
Electronic Data Processing $19,421,533 $118,537,600
Research and Experimental Expenditures $20,681,089 $86,239,102
Urban and Industrial Site Reinvestment $16,598,275 $54,045,821
Research and Development $5,516,301 $25,715,841
All Other $16,147,798 $88,532,982
TOTAL $218,057,769 $1,029,941,278
*Includes film production infrastructure and digital animation credits.
Source: DRS Annual Statement
The table also shows several of the most prevalent business tax credits offered by the
state. During the period from 2008-2012, a few tax credit types constituted the majority
of tax credits claimed.

22
The largest of these was the fixed capital credit. These credits are worth 5% of the
amount paid for any new capital property to be held and used in Connecticut.
The second largest are the film production tax credits, inclusive of the film
production infrastructure and digital animation credits. These credits are
available for qualifying media productions. There is currently a moratorium on
providing film production credits for major motion picture productions without
substantial investment in the state, effective through fiscal year 2017.
Electronic Data Processing credits provide a 100% credit for property tax owed
and paid on electronic data processing equipment.
Research and Experimental Expenditures credits are based on the incremental
increase in expenditures for research and experiments conducted in Connecticut.
The amount of the credit equals 20%.
Urban and Industrial Site Reinvestment Credits are awarded for investments in
eligible urban reinvestment projects and industrial site investment projects under
the Urban and Industrial Site Reinvestment Act.
Research and Development credits are based on expenses for research and
development conducted in Connecticut. The amount allowed varies from 1% to
6% of R&D expenses.
All other tax credits accounted for less than 10% of credits claimed against the
corporation business tax and insurance premiums tax during the period from
2008-2012.
Relative to corporation tax credits, the State of Connecticut offers few credits against the
personal income tax. However, two major credits are:
The Property Tax Credit. Connecticut residents are eligible for an income tax
credit for property taxes paid to a Connecticut political subdivision. Effective for
taxable years commencing on or after January 1, 2016, the maximum credit is
reduced from $300 to $200 per return. Approximately $209 million in property
tax credits were claimed in income year 2013.
The Earned Income Tax Credit. Connecticut taxpayers may claim an earned
income tax credit worth a percentage of any federal earned income credit
claimed and allowed. In income year 2013, the rate was 25% of the federal EITC
claimed. In income year 2014, the rate was 27.5% of the federal EITC.
Approximately $96 million in earned income tax credits were claimed in income
year 2013.

23
In addition, the Office of Policy and Management is required to include a forecast for
tax credits claimed as part of the annual Fiscal Accountability Report published in
November of each year. The following graph shows OPM’s projections for personal
income tax credits, business tax credits, and total credits claimed. Business tax
projections include credits claimed under the corporation tax, insurance premiums tax,
hospital net revenue tax, and the public service companies tax.
Chart 9
Projected Amounts of Tax Credits Claimed (Dollar Amounts in Thousands)
Source: OPM Fiscal Accountability Report, Nov. 2014
Please note that these projections are based on analysis conducted by the Office of
Policy and Management in November 2014 and are not reflective of policy changes in
the 2015 legislative session or the most recent data available. OPM will produce an
updated forecast for the November 2015 Fiscal Accountability Report.
$335,000
$391,200
$246,500
$291,700
$581,500
$682,900
$-
$100,000
$200,000
$300,000
$400,000
$500,000
$600,000
$700,000
$800,000
2014
Est.
2015
Proj.
2016
Proj.
2017
Proj.
2018
Proj.
Personal Income Tax Credits
Business Tax Credits
Total Credits

24
Section VI – Policy Changes 2000-2015
Tax rates in 2000 were significantly different from where they stand today. The impact
of two significant recessions, changes in the composition of state’s economy, and rising
costs for healthcare, education, and unfunded pension liabilities, resulted in numerous
tax and revenue policy changes for the state. Some of the more significant changes that
have been enacted over the past 15 years include:
Personal Income Tax
In 2000, Connecticut’s personal income tax contained two brackets – 3.0% and 4.5%.
During the 2003 legislative session the upper 4.5% bracket was raised to 5.0%. During
the 2009 legislative session a third bracket was added at a maximum 6.5% rate. During
the 2011 legislative session three new tax brackets were added and the maximum rate
was increased from 6.5% to 6.7%. Moreover, lower rate recapture provisions were
added that eliminated the benefit of various lower rates once a taxpayer reached a
certain income level. Finally, during the 2015 legislative session, a seventh tax bracket
was added and the maximum upper rate was set at 6.99%.
The property tax credit under the income tax which stood at $500 in 2000 was lowered
in the mid-2000s, then increased back to $500 in the later 2000s, only to be reduced
again to $300 beginning in 2011. It is scheduled to fall to $200 in income year 2016.
Additionally, a more aggressive phase-out of the property tax credit has been enacted
over the years.
One area of tax relief which Connecticut has adopted in recent years is a state Earned
Income Tax Credit (EITC), which mirrors the federal credit. Originally adopted during
the 2011 legislative session, the current value of the state credit is 27.5% of the federal
credit. The EITC is currently scheduled to increase to 30.0% of the federal credit
beginning in income year 2017.
Sales and Use Tax
In 2000, Connecticut’s sales and use tax rate was at 6.0%. Today it stands at 6.35%. In
2000, the clothing exemption was $75.00 whereas today it is has been eliminated.
Moreover, in the intervening years, the sales tax was extended to more items. Some
items were exempted from the tax during the same time period, but the net effect was a
broadening of the base and an overall increase in revenue raised.

25
Corporation Tax
In 2000, Connecticut’s corporation tax rate was at 7.5%, with no surtax. Over the
intervening years the rate has remained the same, but in ten of the 15 years covered by
this report there was a surtax imposed which ranged from 10% to 25% depending upon
the income year. In the most recent legislative session, Connecticut will be converting to
a unitary form of corporation tax beginning with income year 2016. The 2015 legislative
session also capped at 50% the amount that prior year net operating losses could serve
to reduce a firm’s net income.
Tax credits
One area where tax relief was provided was in the area of business tax credits.
The most significant tax credits that were enacted over that time period include
film tax credits (including infrastructure and digital media) and job creation tax
credits. In addition, the state facilitated increased use of previously earned
research and development tax credits for qualifying companies through the
aerospace reinvestment act.
Offsetting this benefit to some extent has been the enactment of overall
limitations on the use of tax credits. During the 2002 legislative session a cap of
70% was placed on the overall amount tax credits could reduce tax liability.
During the 2015 legislative session this cap was tightened further to 50.01%.
Apportionment
Another area where tax relief was provided was in the area of apportionment.
Multi-state businesses typically apportion their income to Connecticut based
upon a three factor formula – sales, property, and payroll, with the sales factor
double-weighted. During the 2000 legislative session a favorable single factor
apportionment based solely on sales was enacted for manufacturers and
broadcasters.
Cigarette Taxes
In 2000, the cigarette tax was at 50 cents per pack. Over the intervening years the tax
was increased and today stands at $3.65 per pack. It is scheduled to rise to $3.90 per
pack on July 1, 2016.

26
Oil Companies Tax
In 2000 the tax rate on petroleum products gross receipts was 5.0%. Today the rate is
8.1%.
Motor Fuels Tax
In 2000 the excise tax rate on motor fuels was 32 cents per gallon. Today the rate is 25
cents per gallon.
Succession/Estate Tax
During the 2005 legislative session, the state’s Succession Tax was repealed and in its
place a unified Gift and Estate Tax was enacted with a lifetime $2 million exemption.
Other Revenue Changes
Over the past fifteen years, other major policy changes have included transfers from
various funds to the General Fund. Several DRS related initiatives, including amnesty
programs, have been instituted in order to raise additional revenue. Taxes have also
been enacted on health services providers as part of an overall plan to garner additional
federal matching dollars under the Medicaid program.

27
Appendix A
GENERAL FUND REVENUES TAXES ($K) FY 2010 FY 2011 FY 2012 FY 2013 FY 2014
Personal Income $6,586,099 $7,246,431 $8,310,820 $8,719,245 $8,718,659 Sales and Use 3,203,988 3,353,230 3,830,117 3,896,998 4,100,564 Corporation 667,132 794,473 716,522 742,515 782,239 Public Service Corporation 267,945 269,806 250,397 266,647 293,303 Insurance Companies 226,550 220,626 237,609 260,858 240,666 Inheritance & Estate 177,601 237,573 191,699 439,519 168,075 Cigarettes 387,435 404,111 421,005 399,822 376,835 Oil Companies 123,018 169,163 146,067 175,526 35,580 Electric Generation - - 69,532 66,823 15,315 Real Estate Conveyance 100,267 94,822 107,531 113,830 180,511 Alcoholic Beverages 48,196 48,923 60,595 60,406 60,644 Admissions, Dues, Cabaret 34,379 34,456 34,398 36,544 39,935 Miscellaneous 141,892 140,506 536,810 523,028 498,260 Total - Taxes $11,964,502 $13,014,119 $14,913,103 $15,701,763 $15,510,588 Less Refunds of Taxes (1,061,433) (956,054) (1,105,171)
(1,144,993) (1,182,397) Less Refunds of R&D Credit (8,937) (8,599) (3,563) (4,086) (5,055) Total - Taxes Less Refunds $10,894,132 $12,049,467 $13,804,369 $14,552,684 $14,323,136
OTHER REVENUE Transfer-Special Revenue $289,314 $293,108 $313,757 $315,452 $323,219 Indian Gaming Payments 384,248 359,582 344,645 296,396 279,873 Licenses, Permits & Fees 257,569 250,442 283,414 262,068 314,722 Sales of Commodities & Services 33,678 35,506 35,007 36,298 40,523 Investment Income 4,062 29 964 (792) (336) Rents, Fines & Escheats 252,792 157,771 123,424 144,141 130,875 Miscellaneous 142,910 178,728 191,965 163,818 206,782 Less Refunds of Payments (1,189) (1,875) (85,377) (74,016) (66,625) Total - Other Revenue $1,363,384 $1,273,291 $1,207,780 $1,143,366 $1,229,032 OTHER SOURCES Federal Grants $4,066,314 $4,235,178 $3,607,163 $3,733,910 $1,243,861 Transfer from Tobacco Fund 102,898 95,304 96,100 103,100 107,000 Transfer From/(To) Other Funds 1,261,800 54,215 (153,799) (128,028) 106,528 Total - Other Sources $5,431,012 $4,384,697 $3,549,464 $3,708,982 $1,457,389
GRAND TOTAL $17,688,529 $17,707,454 $18,561,633 $19,405,031 $17,009,556
TAXES % of Total % of Total % of Total % of Total % of Total
Personal Income 37.23 40.92 44.77 44.93 51.26 Sales and Use 18.11 18.94 20.63 20.08 24.11 Corporation 3.77 4.49 3.86 3.83 4.60 Public Service Corporation 1.51 1.52 1.35 1.37 1.72 Insurance Companies 1.28 1.25 1.28 1.34 1.41 Inheritance & Estate 0.96 1.34 1.03 2.26 0.99 Cigarettes 2.19 2.28 2.27 2.06 2.22 Oil Companies 0.70 0.96 0.79 0.90 0.21 Electric Generation - - 0.37 0.34 0.09 Real Estate Conveyance 0.57 0.54 0.58 0.59 1.06 Alcoholic Beverages 0.27 0.28 0.33 0.31 0.36 Admissions, Dues, Cabaret 0.19 0.19 0.19 0.19 0.23 Miscellaneous 0.80 0.79 2.89 2.70 2.93 Total - Taxes 67.64 73.50 80.34 80.92 91.19 Less Refunds of Taxes (6.00) (5.40) (5.95) (5.90) (6.95) Less Refunds of R&D Credit (0.05) (0.05) (0.02) (0.02) (0.03) Total – Taxes Less Refunds 61.59 68.05 74.37 74.99 84.21 OTHER REVENUE
Transfer-Special Revenue 1.64 1.66 1.69 1.63 1.90 Indian Gaming Payments 2.17 2.03 1.86 1.53 1.65 Licenses, Permits & Fees 1.46 1.41 1.53 1.35 1.85 Sales of Commodities & Services 0.19 0.20 0.19 0.19 0.24 Investment Income 0.02 - 0.01 (0.00) (0.00) Rents, Fines & Escheats 1.43 0.89 0.67 0.74 0.77 Miscellaneous 0.81 1.01 1.01 0.84 1.22 Less Refunds of Payments (0.01) (0.01) (0.01) (0.38) (0.39) Total - Other Revenue 7.71 7.19 6.51 5.89 7.23 OTHER SOURCES Federal Grants 22.99 23.92 19.43 19.24 7.31 Transfer from Tobacco Fund 0.58 0.54 0.52 0.53 0.63 Transfer From/(To) Other Funds 7.13 0.31 (0.82) (0.66) 0.63 Total - Other Sources 30.70 24.76 19.12 19.11 8.57
GRAND TOTAL 100.00 100.00 100.00 100.00 100.00

28
Appendix B
SPECIAL TRANSPORTATION FUND REVENUES
TAXES ($K) FY 2010 FY 2011 FY 2012 FY 2013 FY 2014 Motor Fuels $503,635 $438,526 $492,795 $501,269 $508,058 Oil Companies 141,900 165,300 226,900 199,400 380,700 DMV Sales 67,784 71,943 76,618 79,000 82,216 Less Refunds of Taxes (7,315) (6,769) (7,006) (6,094) (6,993) Total - Taxes Less Refunds $706,004 $713,999 $789,306 $773,576 $963,981 OTHER REVENUE Motor Vehicle Receipts $220,703 $220,144 $235,446 $234,484 $236,063 Licenses, Permits & Fees 135,004 135,453 135,974 137,284 138,390 Interest Income 6,681 5,506 2,208 4,138 6,771 Federal Grants 3,002 9,360 12,915 12,416 12,100 Transfer from Other Funds 71,200 107,550 81,550 95,245 (76,500) Transfer to Other Funds (6,500) (6,500) (6,500) (6,500) (6,500) Transfer to TSB (15,300) (15,300) (15,000) (15,000) (15,000) Less Refunds of Payments (2,906) (3,005) (2,979) (3,154) (3,614) Total – Other Revenue $411,884 $453,208 $443,614 $458,912 $291,710 GRAND TOTAL $1,117,888 $1,167,208 $1,232,921 $1,232,487 $1,255,690
TAXES % of Total % of Total % of Total % of Total % of Total
Motor Fuels 45.05 37.57 39.97 40.67 40.46 Oil Companies 12.69 14.16 18.40 16.18 30.32 DMV Sales 6.06 6.16 6.21 6.41 6.55 Less Refunds of Taxes (0.65) (0.58) (0.57) (0.49) (0.56) Total – Taxes Less Refunds 63.15 61.17 64.02 62.77 76.77 OTHER REVENUE Motor Vehicle Receipts 19.74 18.86 19.10 19.03 18.80 Licenses, Permits & Fees 12.08 11.60 11.03 11.14 11.02 Interest Income 0.60 0.47 0.18 0.34 0.54 Federal Grants 0.27 0.80 1.05 1.01 0.96 Transfer from Other Funds 6.37 9.21 6.61 7.73 (6.09) Transfer to Other Funds (0.58) (0.56) (0.53) (0.53) (0.52) Transfer to TSB (1.37) (1.31) (1.22) (1.22) (1.19) Less Refunds of Payments (0.26) (0.26) (0.24) (0.26) (0.29) Total - Other Revenue 36.85 38.83 35.98 37.23 23.23 GRAND TOTAL 100.00 100.00 100.00 100.00 100.00

29
Appendix C
The following charts show the percentage of General Fund revenue derived from the
following sources:
Personal Income Tax;
Sales and Use Tax;
Corporation Tax;
Federal Grants; and,
All Other Sources
For fiscal years FY 2010 – FY 2014 as presented in Appendix A, revenues are shown as a
percentage of collections prior to refunds and net transfers to other funds. For
comparative purposes, FY 2014 has been adjusted for net budgeting of Medicaid.
Beginning in that year, direct federal grants for Medicaid were applied directly to
Medicaid expenditures, rather than being counted as a resource of the General Fund as
in prior years.
Chart 10
FY 2010
Refunds reduced collections by $1,072 million.
Personal
Income
35%
Sales and Use
17%
Corporation
3%
Federal Grants
22%
All Other
23%

30
Chart 11
FY 2011
Refunds reduced collections by $967 million.
Chart 12
FY 2012
Refunds and transfers reduced collections by $1,348 million.
Personal
Income
39%
Sales and Use
18%
Corporation
4%
Federal Grants
23%
All Other
16%
Personal
Income
42%
Sales and Use
19%
Corporation
4%
Federal Grants
18%
All Other
17%

31
Chart 13
FY 2013
Refunds and transfers reduced collections by $1,351 million.
Chart 14
FY 2014 – Adjusted for Net Budgeting of Medicaid*
Refunds reduced collections by $1,254 million.
*For purposes of this chart, $2,993 million was added to Federal Grants
in order to estimate what General Fund revenues would have been had the
State of Connecticut not switched to net budgeting Medicaid in FY 2014.
Personal
Income
42%
Sales and Use
19%
Corporation
3%
Federal Grants
18%
All Other
18%
Personal
Income
41%
Sales and Use
19%
Corporation
4%
Federal Grants
20%
All Other
16%