tax policy center urban institute and brookings institution the individual alternative minimum tax...
TRANSCRIPT

Tax Policy Tax Policy CenterCenter
Tax Policy Tax Policy CenterCenter
Urban InstituteAnd
Brookings Institution
www.taxpolicycenter.org
The Individual Alternative Minimum Tax
President’s Advisory Panel on
Federal Tax Reform
3 March 2005
Leonard E. Burman
Senior Fellow, The Urban Institute
Codirector, The Tax Policy Center
Visiting Professor, Georgetown Public Policy Institute
Tax Policy Tax Policy CenterCenter
Tax Policy Tax Policy CenterCenter
Urban InstituteAnd
Brookings Institution
www.taxpolicycenter.org
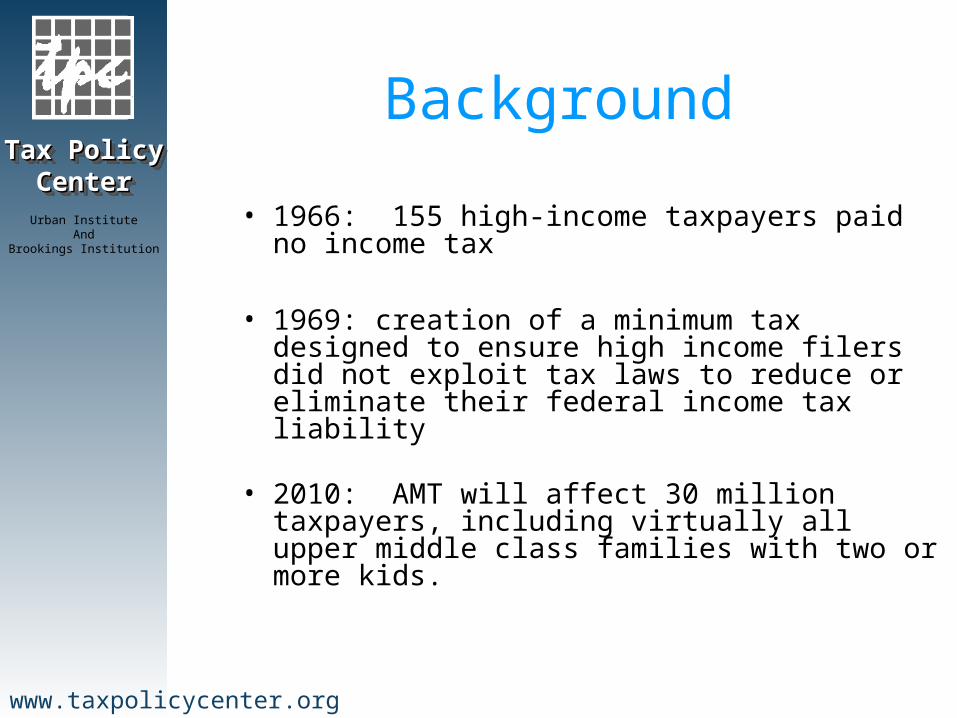
Background
• 1966: 155 high-income taxpayers paid no income tax
• 1969: creation of a minimum tax designed to ensure high income filers did not exploit tax laws to reduce or eliminate their federal income tax liability
• 2010: AMT will affect 30 million taxpayers, including virtually all upper middle class families with two or more kids.
Tax Policy Tax Policy CenterCenter
Tax Policy Tax Policy CenterCenter
Urban InstituteAnd
Brookings Institution
www.taxpolicycenter.org
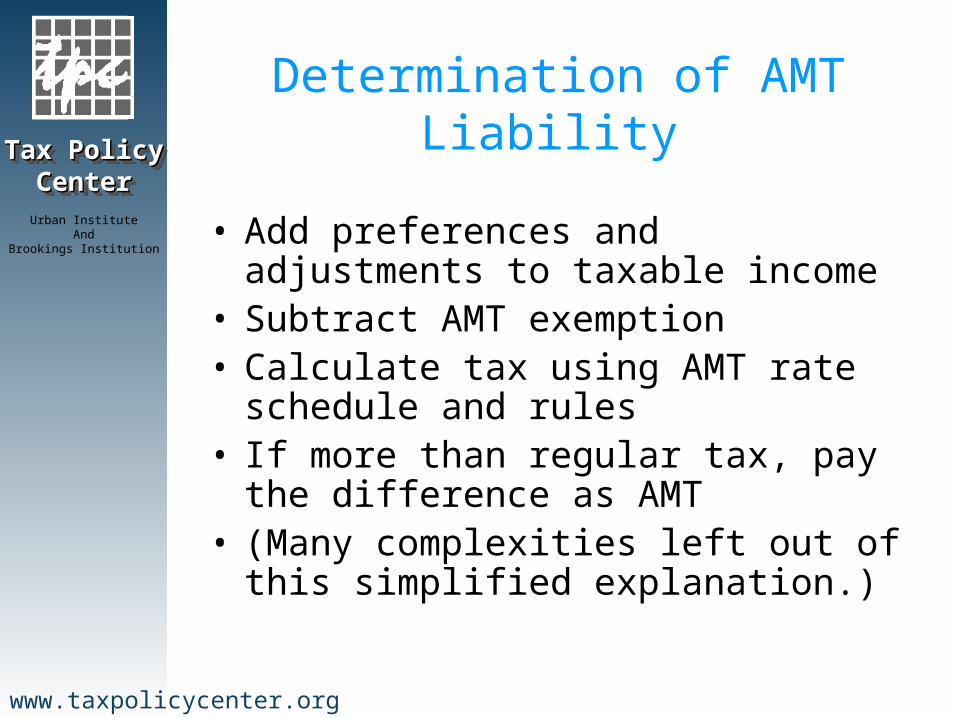
Determination of AMT Liability
• Add preferences and adjustments to taxable income
• Subtract AMT exemption• Calculate tax using AMT rate schedule
and rules• If more than regular tax, pay the
difference as AMT• (Many complexities left out of this
simplified explanation.)

Tax Policy Tax Policy CenterCenter
Tax Policy Tax Policy CenterCenter
Urban InstituteAnd
Brookings Institution
www.taxpolicycenter.org
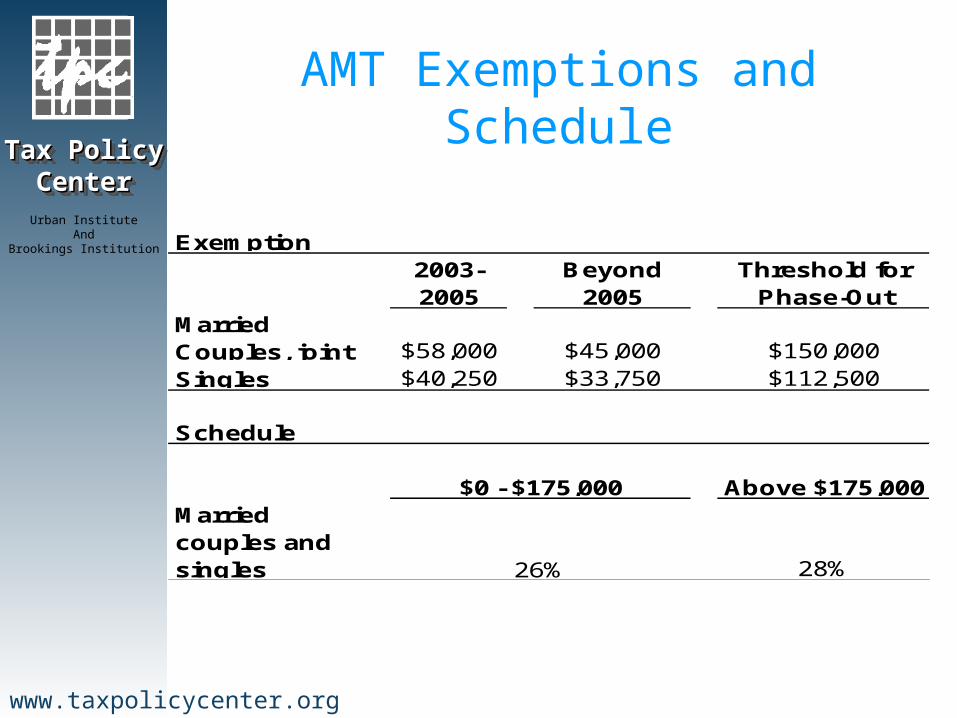
AMT Exemptions and Schedule
• AMT exemption currently $58,000 for couples, $40,250 for singles– In 2006, exemption drops to $45,000/$33,750
• Exemption phases out at higher incomes, creating high implicit tax rates
• Statutory rates = 26% and 28%, but exemption phaseout creates phantom rates of 32.5% and 35%
• Not indexed for inflation
Tax Policy Tax Policy CenterCenter
Tax Policy Tax Policy CenterCenter
Urban InstituteAnd
Brookings Institution
www.taxpolicycenter.org
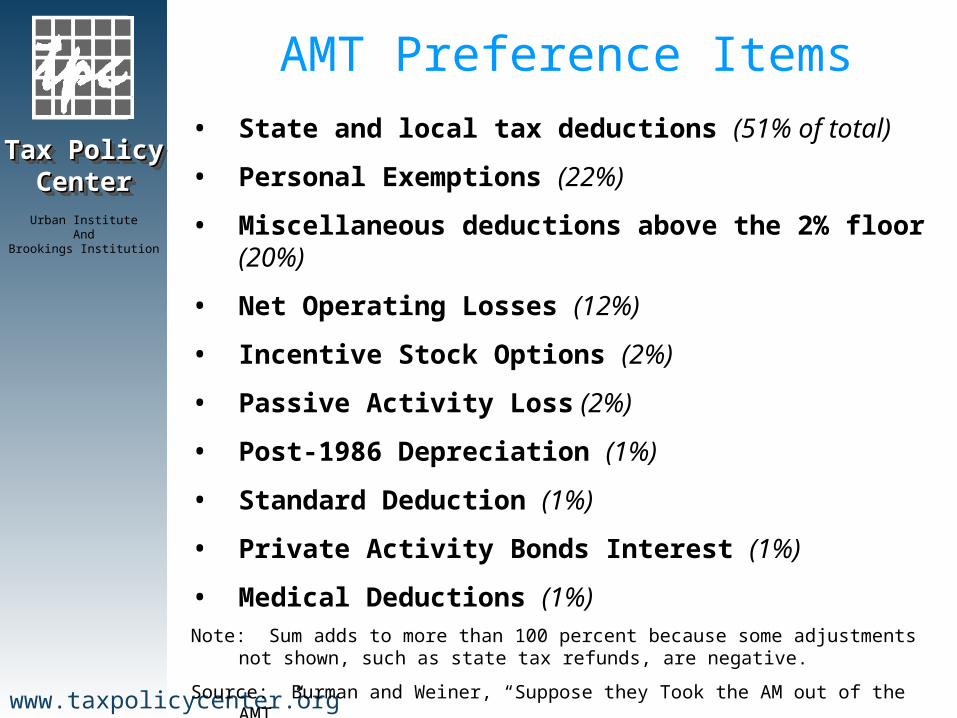
AMT Preference Items• State and local tax deductions (51% of total)
• Personal Exemptions (22%)
• Miscellaneous deductions above the 2% floor (20%)
• Net Operating Losses (12%)
• Incentive Stock Options (2%)
• Passive Activity Loss (2%)
• Post-1986 Depreciation (1%)
• Standard Deduction (1%)
• Private Activity Bonds Interest (1%)
• Medical Deductions (1%)Note: Sum adds to more than 100 percent because some adjustments not shown, such
as state tax refunds, are negative.
Source: Burman and Weiner, “Suppose they Took the AM out of the AMT.”
Tax Policy Tax Policy CenterCenter
Tax Policy Tax Policy CenterCenter
Urban InstituteAnd
Brookings Institution
www.taxpolicycenter.org
0
5
10
15
20
25
30
35
40
45
2006 2007 2008 2009 2010 2011 2012 2013 2014 2015Year
Num
ber o
f AMT
Ta
xpay
ers (
Millio
ns)
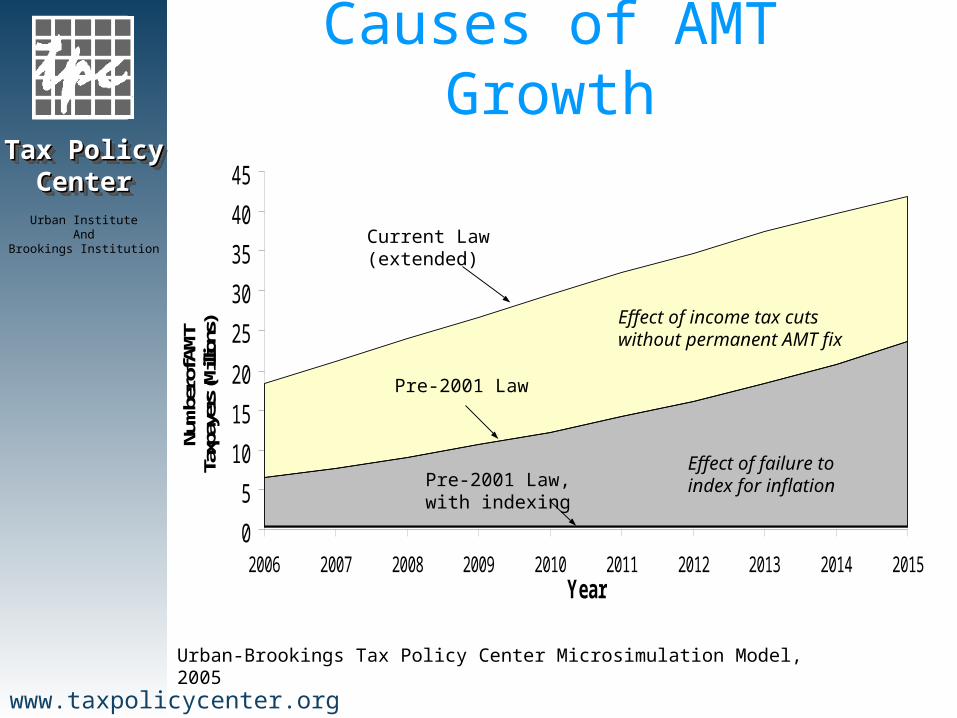
Causes of AMT Growth
Effect of failure to index for inflationPre-2001 Law,
with indexing
Current Law (extended)
Effect of income tax cuts without permanent AMT fix
Pre-2001 Law
Urban-Brookings Tax Policy Center Microsimulation Model, 2005
Tax Policy Tax Policy CenterCenter
Tax Policy Tax Policy CenterCenter
Urban InstituteAnd
Brookings Institution
www.taxpolicycenter.org
AMT Projections
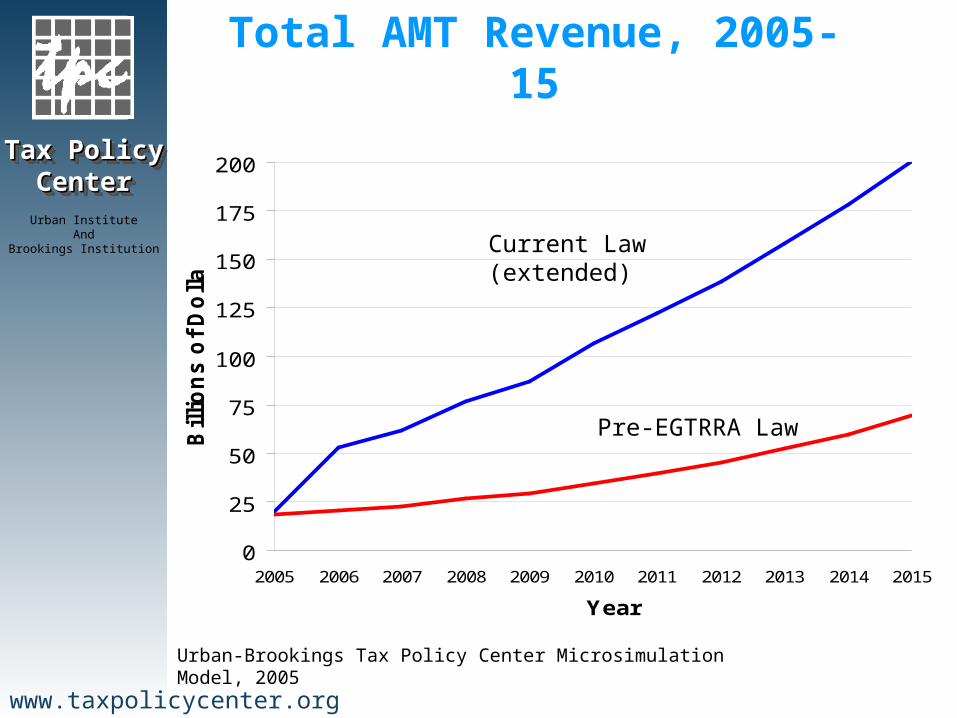
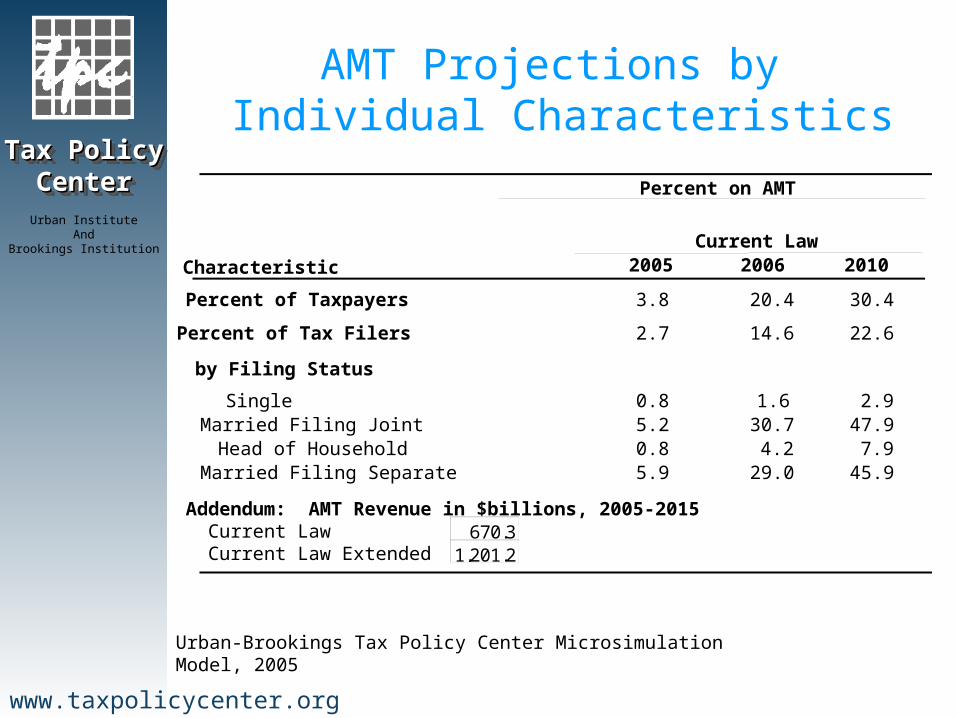
• Baseline AMT revenue = $1.2 trillion from 2005-15– $670 billion if the tax cuts are
not extended in 2010
• About 4% of taxpayers on AMT in 2005– 20% in ’06 and 30% in ’10
Tax Policy Tax Policy CenterCenter
Tax Policy Tax Policy CenterCenter
Urban InstituteAnd
Brookings Institution
www.taxpolicycenter.org
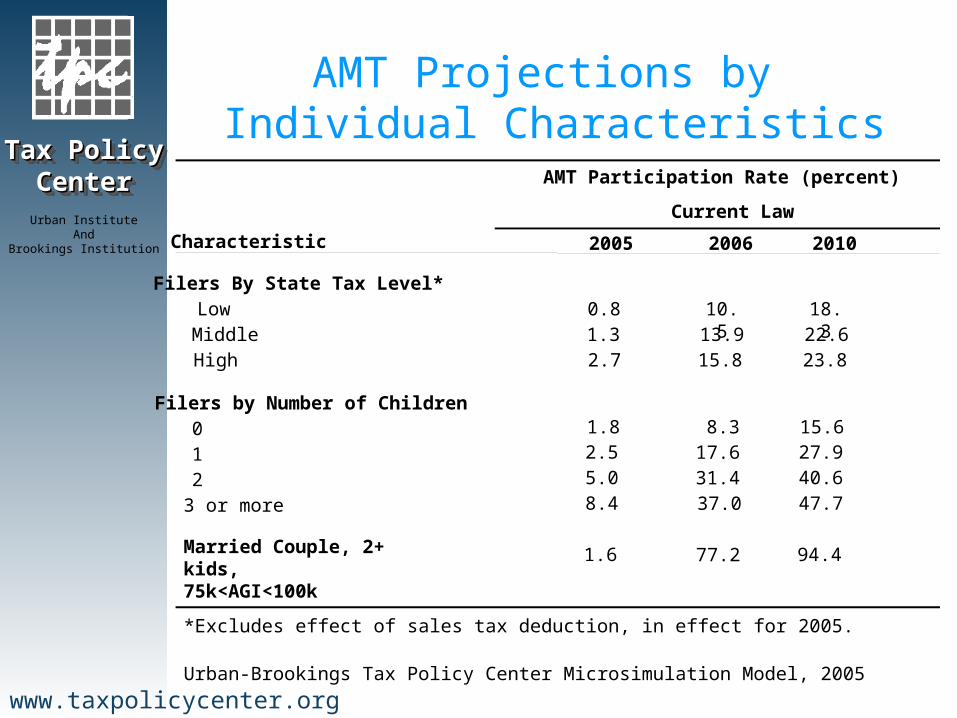
AMT Demographics (2010)
• AMT inflicts large marriage/child penalties– 48% of married couples vs. 3% of
singles on AMT– 94% of marrieds with 2+ kids and AGI
between $75&100K
• Residents of high-tax states are 5 percentage points more likely to be on AMT than those in low-tax states
Tax Policy Tax Policy CenterCenter
Tax Policy Tax Policy CenterCenter
Urban InstituteAnd
Brookings Institution
www.taxpolicycenter.org
Drifting Off Target
• Though intended to make high-income people pay tax, AMT will increasingly hit middle class– Over 80% of AMT taxpayers will have
income < $200K in 2010• More than 1/3 have income < $100K
– Families earning $75-100K 18% more likely to be on AMT than those earning over $1 million
• Those earning $100-200K more than twice as likely as millionaires
Tax Policy Tax Policy CenterCenter
Tax Policy Tax Policy CenterCenter
Urban InstituteAnd
Brookings Institution
www.taxpolicycenter.org
Problems with the AMT
• Good Tax Policy is…– Simple– Efficient– Fair
• The AMT violates all of these principles.

Tax Policy Tax Policy CenterCenter
Tax Policy Tax Policy CenterCenter
Urban InstituteAnd
Brookings Institution
www.taxpolicycenter.org
Pointless Complexity
• Many middle class taxpayers must file AMT Form 6251, but owe no AMT
• AMT rules regarding credits, capital gains, dividends, deferral preferences very complex
• Most deferral preferences don’t even generate much revenue, just change the timing of tax payments
• Vastly complicates tax planning

Tax Policy Tax Policy CenterCenter
Tax Policy Tax Policy CenterCenter
Urban InstituteAnd
Brookings Institution
www.taxpolicycenter.org
Efficiency
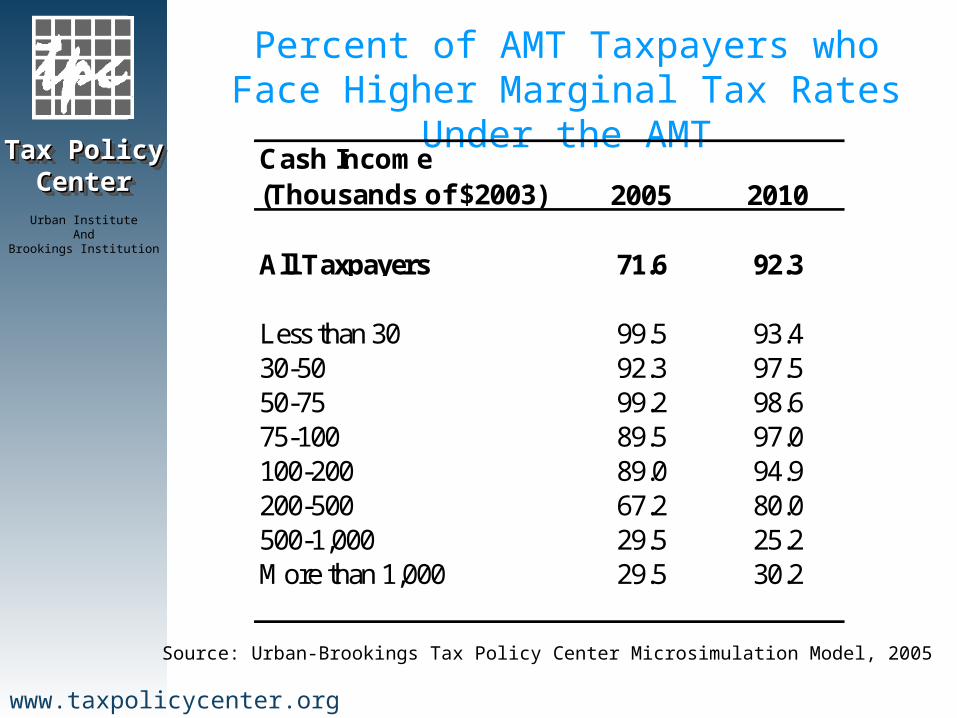
• The AMT raises marginal tax rates for most– 71% of AMT taxpayers face higher marginal tax rates
under AMT in 2005– 92% will be in that situation in 2010– People creep into higher brackets over time
because, unlike the regular income tax, AMT is not indexed
• Might enhance efficiency to extent that it deterred tax shelters, but 90% of AMT preferences have nothing to do with shelters

Tax Policy Tax Policy CenterCenter
Tax Policy Tax Policy CenterCenter
Urban InstituteAnd
Brookings Institution
www.taxpolicycenter.org
Equity
• Nasty marriage/child penalties• Some legitimate adjustments to ability to pay
are disallowed under AMT (e.g., contingent legal fees)
• AMT makes the tax system more progressive, but less so over time
• Relatively little tax collected from very rich
Tax Policy Tax Policy CenterCenter
Tax Policy Tax Policy CenterCenter
Urban InstituteAnd
Brookings Institution
www.taxpolicycenter.org
Conclusions
• Pointless complexity and bizarre pattern of taxes
• Increasingly a tax on the upper middle class
• Better to build anti-tax shelter provisions into regular tax and adjust rates to hit revenue target
Tax Policy Tax Policy CenterCenter
Tax Policy Tax Policy CenterCenter
Urban InstituteAnd
Brookings Institution
www.taxpolicycenter.org
Appendix
• Supplemental tables and charts
• Further reading
Tax Policy Tax Policy CenterCenter
Tax Policy Tax Policy CenterCenter
Urban InstituteAnd
Brookings Institution
www.taxpolicycenter.org
2003-2005
Beyond 2005
Threshold for Phase-Out
Married Couples, joint $58,000 $45,000 $150,000 Singles $40,250 $33,750 $112,500
Above $175,000Married couples and singles 28%
$0 - $175,000
26%
Exemption
Schedule
AMT Exemptions and Schedule
Tax Policy Tax Policy CenterCenter
Tax Policy Tax Policy CenterCenter
Urban InstituteAnd
Brookings Institution
www.taxpolicycenter.org
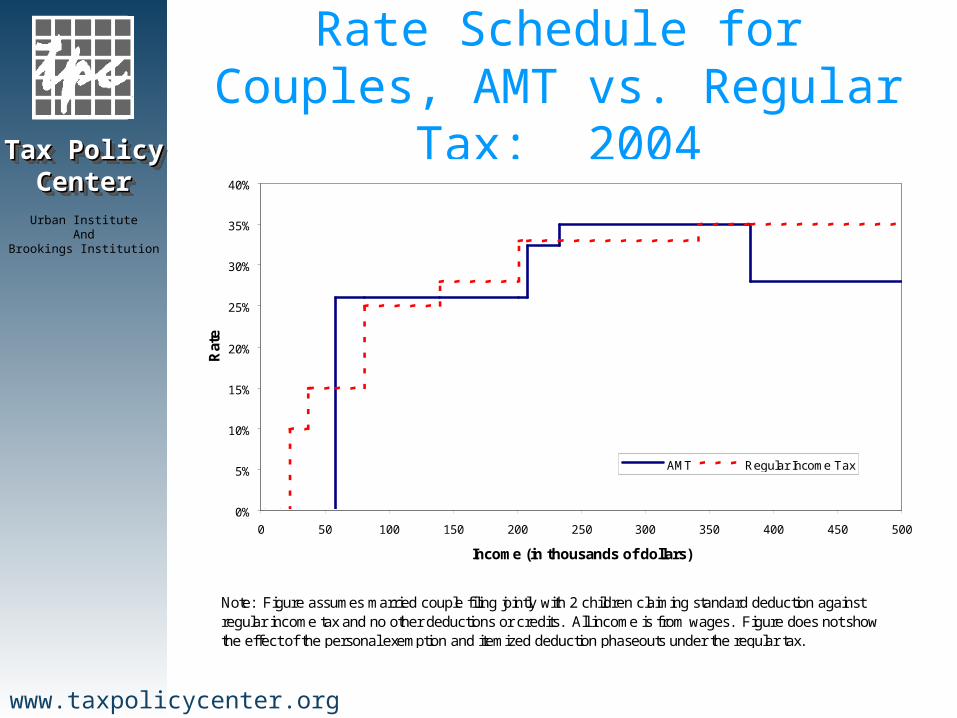
Rate Schedule for Couples, AMT vs. Regular Tax: 2004
0%
5%
10%
15%
20%
25%
30%
35%
40%
0 50 100 150 200 250 300 350 400 450 500
Income (in thousands of dollars)
Rat
e
AMT Regular Income Tax
Note: Figure assumes married couple filing jointly with 2 children claiming standard deduction against regular income tax and no other deductions or credits. All income is from wages. Figure does not show the effect of the personal exemption and itemized deduction phaseouts under the regular tax.
Tax Policy Tax Policy CenterCenter
Tax Policy Tax Policy CenterCenter
Urban InstituteAnd
Brookings Institution
www.taxpolicycenter.org
0
25
50
75
100
125
150
175
200
2005 2006 2007 2008 2009 2010 2011 2012 2013 2014 2015
Year
Billio
ns
of
Do
lla
rs
Urban-Brookings Tax Policy Center Microsimulation Model, 2005
Total AMT Revenue, 2005-15
Current Law (extended)
Pre-EGTRRA Law

Tax Policy Tax Policy CenterCenter
Tax Policy Tax Policy CenterCenter
Urban InstituteAnd
Brookings Institution
www.taxpolicycenter.org
0
40
80
120
160
200
2005 2006 2007 2008 2009 2010
Year
Revenue C
ost in
$B
illio
ns
By 2008, it will cost more to repeal the AMT than the regular income tax.
Urban-Brookings Tax Policy Center Microsimulation Model, 2005
Cost of repealing the regular tax
Cost of repealing the AMT
Tax Policy Tax Policy CenterCenter
Tax Policy Tax Policy CenterCenter
Urban InstituteAnd
Brookings Institution
www.taxpolicycenter.org
AMT Projections by Individual Characteristics
Percent on AMT
Current Law
Characteristic 2005 2006 2010
Percent of Taxpayers 3.8 20.4 30.4
Percent of Tax Filers 2.7 14.6 22.6
by Filing Status
Single 0.8 1.6 2.9Married Filing Joint 5.2 30.7 47.9Head of Household 0.8 4.2 7.9Married Filing Separate 5.9 29.0 45.9
Urban-Brookings Tax Policy Center Microsimulation Model, 2005
Addendum: AMT Revenue in $billions, 2005-2015 Current Law Current Law Extended
670.31,201.2
Tax Policy Tax Policy CenterCenter
Tax Policy Tax Policy CenterCenter
Urban InstituteAnd
Brookings Institution
www.taxpolicycenter.org
AMT Projections by Individual Characteristics
AMT Participation Rate (percent)
Current Law
Characteristic 2005 2006 2010
Filers by Number of Children0 1.8 8.3 15.6
1 2.5 17.6 27.9
2 5.0 31.4 40.6
3 or more 8.4 37.0 47.7
Filers By State Tax Level*Low 0.8 10.5 18.3Middle 1.3 13.9 22.6High 2.7 15.8 23.8
*Excludes effect of sales tax deduction, in effect for 2005.
Urban-Brookings Tax Policy Center Microsimulation Model, 2005
Married Couple, 2+ kids,75k<AGI<100k
1.6 77.2 94.4

Tax Policy Tax Policy CenterCenter
Tax Policy Tax Policy CenterCenter
Urban InstituteAnd
Brookings Institution
www.taxpolicycenter.org
AMT Projections by Income
AMT Participation Rate (percent)
Current LawCash Income (thousands of 2003$) 2005 2006 2010
75-100 0.86.8
53.4
1,000 and more39.3
Less than 30 0.030-50 0.150-75 0.5
100-200
500-1,000200-500
26.7
31.863.087.051.8
0.01.16.0
33.4
53.481.093.962.6
0.02.9
16.9
35.3
Urban-Brookings Tax Policy Center Microsimulation Model, 2005
Tax Policy Tax Policy CenterCenter
Tax Policy Tax Policy CenterCenter
Urban InstituteAnd
Brookings Institution
www.taxpolicycenter.org
Source: Urban-Brookings Tax Policy Center Microsimulation Model, 2005
Percent of AMT Taxpayers who Face Higher Marginal Tax Rates Under the AMT
Cash Income (Thousands of $2003) 2005 2010
All Taxpayers 71.6 92.3
Less than 30 99.5 93.430-50 92.3 97.550-75 99.2 98.675-100 89.5 97.0100-200 89.0 94.9200-500 67.2 80.0500-1,000 29.5 25.2More than 1,000 29.5 30.2
Tax Policy Tax Policy CenterCenter
Tax Policy Tax Policy CenterCenter
Urban InstituteAnd
Brookings Institution
www.taxpolicycenter.org
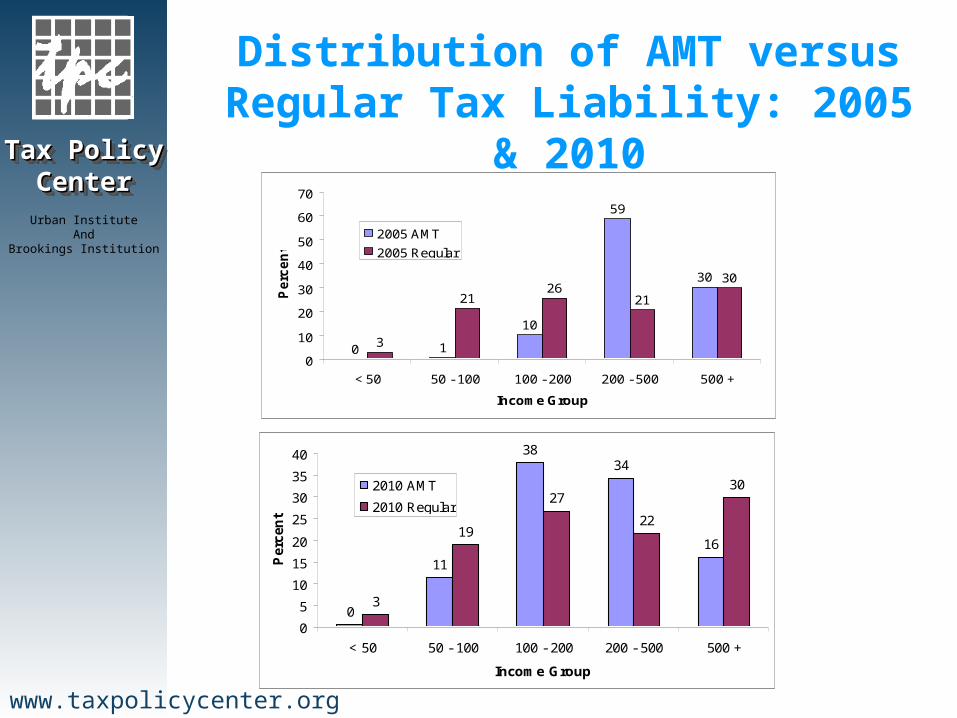
Distribution of AMT versus Regular Tax Liability: 2005 & 2010
0 1
10
59
30
3
2126
21
30
0
10
20
30
40
50
60
70
< 50 50 - 100 100 - 200 200 - 500 500 +
Income Group
Pe
rce
nt
2005 AMT
2005 Regular
0
11
3834
16
3
19
27
22
30
0
5
10
15
20
25
30
35
40
< 50 50 - 100 100 - 200 200 - 500 500 +
Income Group
Perc
en
t
2010 AMT
2010 Regular
Tax Policy Tax Policy CenterCenter
Tax Policy Tax Policy CenterCenter
Urban InstituteAnd
Brookings Institution
www.taxpolicycenter.org
Further ReadingBurman, Leonard E. and David Weiner. 2004. “Suppose They Took the AM out of the AMT?” available at
www.taxpolicycenter.org. (examines issues raised if the AMT were a standalone income tax)
Burman, Leonard E., William G. Gale, Jeffrey Rohaly, Matthew Hall, and Mohammed Adeel Saleem. 2004. “AMT: A Data Update” available at www.taxpolicycenter.org. (includes estimates of some reform options)
Burman, Leonard E., William G. Gale and Jeffrey Rohaly. 2003. “Policy Watch: The Expanding Reach of the
Individual Alternative Minimum Tax,” with Journal of Economic Perspectives 17(2): 173-186. Burman, Leonard E., William G. Gale, Jeffrey Rohaly, and Benjamin H. Harris. 2002. “The Individual AMT:
Problems and Potential Solutions,” National Tax Journal 55(3): 555-596. Feenberg, Daniel R., and James M. Poterba. 2004. “The Alternative Minimum Tax and Effective Marginal Tax
Rates,” National Tax Journal 57(2): 407-427.
General Accounting Office. 2000. “Alternative Minimum Tax: An Overview of its Rationale and Impact on Individual Taxpayers.” Report to the Chairman, Committee on Finance, U.S. Senate (GAO/GGD-00-180). August.
Harvey, Robert P. and Jerry Tempalski. 1997. “The Individual AMT: Why it Matters.” National Tax Journal 50(3):
453-473. Rebelein, Robert and Jerry Tempalski. 2000. “Who Pays the Individual AMT?” U.S. Department of the Treasury,
OTA Paper 87.