tax-subsidized underpricing: issuers and underwriters in...
TRANSCRIPT

Tax-Subsidized Underpricing:Issuers and Underwriters in the Market for Build
America Bonds∗
Dario CestauTepper School of BusinessCarnegie Mellon University
Richard C. GreenTepper School of BusinessCarnegie Mellon University
and
Norman SchurhoffUniversity of Lausanne, Swiss Finance Institute, and CEPR
This manuscript was prepared forCarnegie Rochester NYU Conference Series on Public Policy
February 25, 2013
∗We greatly appreciate the help of Tal Heppenstall and John Roll who provided us with dataand advice. Rich Ryffel of Edward Jones and Paul Luhmann of Stifle Financial patiently educatedus about the process of issuing and trading municipal bonds. Of course, none of the above namedindividuals are responsible for any errors, omissions, or misinterpretations that, despite their bestefforts, may have found their way into this paper. Participants in seminars at Carnegie Mellon,

Abstract
Build America Bonds (BABs) were issued by states and municipalities in 2009 and 2010as an alternative to tax-exempt bonds as part of the 2009 fiscal stimulus package. The bondsare taxable to the holder, but the federal Treasury rebates 35% of the coupon payment tothe issuer. The stated purpose of the program was to provide municipal issuers with accessto a more liquid market by making them attractive to foreign, tax-exempt, and tax-deferredinvestors. We evaluate the liquidity of the bonds and the underpricing when the bonds areissued. The structure of the rebate creates additional incentives to underprice the bonds.The BABs do not exhibit greater liquidity than traditional municipals, contrary to thestated purpose of the program, and they are more underpriced. Several findings suggest thatissuers and underwriters are strategically underpricing the bonds to increase the tax subsidy.There is a negative correlation between the underwriter’s spread and the underpricing. Theunderpricing for BABs is visible in all types of trades, including institutional and interdealertrades, while that for tax-exempt and non-BAB taxable municipals is evident primarily forsmaller sales to customers.
Notre Dame and Rice Universities, and at the 2012 UBC Summer Finance Conference and the Fall2012 Carnegie-Rochester-NYU Conference provided helpful comments and suggestions. We thankour discussant, Erik Sirri and editors Marvin Goodfriend and Burton Hollifield, for a number ofsuggestions that focused and enhanced the analysis. The third author gratefully acknowledgesresearch support from the Swiss Finance Institute and from NCCR FINRISK of the Swiss NationalScience Foundation.

1 Introduction
Build America Bonds (BABs) were created as part of the American Recovery and Reinvest-
ment Act of February 2009, the fiscal stimulus package passed early in the Obama adminis-
tration in response to the recession triggered by the financial crisis. The program was offered
as an alternative to traditional municipal bonds, which pay interest that is exempt from the
federal income tax. While the interest from BABs is taxed as ordinary income, the Treasury
refunds 35% of the coupon on the BABs to the issuer.1 These bonds were popular with
issuers. From April 2009 to December 2010, when the program ended, our sample includes
1,875 separate underwritings, involving 14,043 separate bond issues of $145 billion in face
value. This comprised a quarter of the par value of all municipal issues during the period.
Since it ended several proposals have emerged to revive the program, although all of them
involve rebate rates below 35%.
State and local governments can borrow to fund capital investments in infrastructure.
Municipalities were seen as a source of “shovel-ready” projects by policy makers, but as
constrained by the difficult credit conditions consequent to the financial crisis. The stated
purpose of the BAB program was to give municipal issuers access to a “deeper” or “broader”
market. The natural clientele for traditional municipal bonds, because they are tax-exempt
and therefore have low yields, are taxable individuals, along with the mutual funds and trusts
that hold the bonds on their behalf. Allowing municipalities to issue taxable bonds, while
preserving the benefits of the tax exemption through the coupon rebate, would give munici-
palities access to a deeper pool of investors, including pension funds and endowments, along
with sovereign funds and foreign investors who do not pay U.S. income taxes. According to
1The program authorized two types of bond issues: direct-pay bonds, which work as described in thetext, and tax-credit bonds under which the rebate is paid to the bond holder. To our knowledge, based onreports by practitioners and a Bloomberg search, no tax-credit bonds were issued under the program. Whileit is possible some were, it is clear that they are a tiny fraction of the bonds issued.
1

the “Fact Sheet” on the Treasury’s web site2:
The Build America Bond program has broadened the market for municipal bondsto include investors that do not normally hold tax-exempt debt, such as pensionfunds and sovereign wealth funds. By attracting new investors to municipalbonds, BABs have helped to relieve the supply pressure in the municipal bondmarket and lower borrowing costs.
The stated rationale raises several questions. Why should one tax clientele be preferred
to another? If the equilibrating flows across taxable and tax-exempt bonds reflect a 35%
marginal tax rate, yields on newly issued BABs times (1− 0.35) should closely approximate
yields on tax-exempt bonds of similar credit and maturity. Issuers should then be indifferent
between the two forms of financing, regardless of the “depth” or “breadth” of either set of
potential investors. If the relative yields do not reflect a 35% tax rate, why choose that
number for the rebate rate?
One economically meaningful interpretation of the stated rationale for the program is
that a broader, deeper set of potential investors enhances liquidity—the ability to trade at
short notice in large quantities at low cost. Municipal bonds are notoriously illiquid.3
One place to look for evidence of improved liquidity is in the underpricing of the new
issues. Underpricing refers to the extent to which the price eventually paid by final investors
exceeds the price at which the security is initially offered to the public. Underpricing of
new issues is typically described by underwriters as a cost of liquidity or immediacy—the
price concession needed to move a large quantity of securities simultaneously. It is also the
subject of controversy in the academic finance literature and among practitioners. Under-
2See U.S. Treasury web site, http://www.treasury.gov/initiatives/recovery/Pages/babs.aspx.3See, for example, Hong and Warga (2004), Harris and Piwowar (2006), and Green, Hollifield and
Schurhoff (2007a) who all document mean or median implicit spreads on retail-sized trades in excess of2% using different methods. Green, Hollifield and Schurhoff (2007b) document a great deal of price disper-sion for newly issued bonds, where there is considerable trade. On some bonds investors pay prices thatvary by close to 5% of par value virtually simultaneously. Green, Li, and Schurhoff (2010) show that pricesrise faster than they fall, as they often do in markets for consumer goods. Ang, Bhansali, and Xing (2011)decompose municipal yield spreads relative to Treasuries into several components, and identify the differencebetween pre-refunded yields and Treasury yields as due to liquidity.
2
pricing transfers value from issuers to the intermediaries and customers who initially buy
the underpriced security. Since underwriters control access to the initial offering, it can also
be a means of rewarding favored customers at the expense of the issuers.
A second explanation for the popularity of the bonds is that the structure of the BAB
program leads to unintended subsidies. We explore this as a motive for underpricing in
the case of the Build America Bonds. Since the tax subsidy is tied to the coupon payment
on the bonds, by inflating the coupon level relative to competitive rates, the issuer and
underwriter can raise the tax subsidy paid by the Treasury. The higher coupon is a cost
to the issuer, and the issuer cannot initially price the bonds at a premium over par value
without violating “de minimus” rules, but the present value of the higher coupon can be
captured by the underwriters or favored customers who buy the bonds in the secondary
market. The underwriter, in turn, can share the benefits of the underpricing with the issuer
through lower fees. Thus, viewed as a coalition, the underwriter, the issuer, and investors
have a shared interest in underpricing the bonds. We attempt to disentangle the liquidity
costs and the strategic tax-induced underpricing by focusing on differences in the pricing of
BABs, tax-exempt bonds, and non-BAB taxable municipals issued over the same period.
We examine patterns of trade and costs of trade for BABs, and compare them to tra-
ditional municipal bonds issued during the same period. Despite its stated goals the BAB
program does not appear to have achieved improved liquidity. The patterns of trade in
the secondary market evolve through time in a similar manner for BABs and tax-exempts.
The large numbers of retail trades and evidence that the bonds are being flipped by large
investors acting as intermediaries are also consistent with the behavior of tax-exempt mu-
nicipals. Measures of trading activity and trading cost in the secondary market are the same
or worse for BABs relative to tax-exempts.
BABs also exhibit more underpricing, particularly after controlling for characteristics
such as trade size, par principal of the bond issue, and maturity. Several findings suggest
3

that the greater underpricing may, indeed, be a strategic response to the coupon rebate. We
show that the underwriter discount is lower for BABs than for tax-exempts, controlling for
characteristics, despite the lower liquidity. The underwriter discount is, in particular, lower
for issues that are more underpriced, for BABs but not for tax-exempts. This is consistent
with transfer of some of the surplus created by underpricing back to the issuers, who bear
the cost of the higher coupons. This negative correlation becomes more pronounced through
time, suggesting participants were learning how to respond to the program’s structure. Most
notably, underpricing of BABs, unlike tax-exempts, is also quite evident in the prices at which
dealers trade with each other. These behaviors are consistent with a recognition on the part
of the issuers and underwriters of a shared tax benefit to the underpricing.
The differences in underpricing are robust to controls for obvious sources of heterogeneity
across BABs and tax-exempts. Moreover, we see similar differences between BABs and
taxable municipals that were not part of the BAB program. Non-BAB taxable bonds are
sold through the same distribution channels and appeal to the same clienteles as BABs, but
there is no incentive to underprice them by inflating the coupon to capture a larger tax
rebate.
The underpricing of newly issued securities has provided financial economists with a
number of interesting and long-standing puzzles. For the most part, these questions revolve
around why issuers tolerate underpricing, and how financial intermediaries benefit from it.
Initial public offerings of equities are dramatically underpriced, and a long and rich literature
speculates on the cross-sectional determinants of the underpricing, theoretical rationales such
as adverse selection and signalling, and what indirect benefits issuing firms or investment
banks might capture in exchange for surrendering underpriced securities to investors.4
Underpricing has also been studied in bond markets. There, because the newly issued
4See Jay Ritter’s Web Page at http://bear.warrington.ufl.edu/ritter/ for useful summaries of theempirical facts and of the research concerning them.
4

securities are often absorbed into underwriter inventories or purchased by hedge funds func-
tioning as “flippers,” the underpricing is largely captured by intermediaries. The questions
in this setting involve why issuers do not bargain more effectively, how the opacity of the
market facilitates underpricing by the intermediaries, and whether the underpricing is com-
pensation for the illiquidity and costs of distributing the bonds to final investors or rents
captured by financial intermediaries through market power.5
For BABs, the rebate from the Treasury is tied to the coupon rate, reducing the costs of
underpricing to the issuer. While the benefit of the underpricing is captured by the under-
writers, or any favored intermediaries who act as flippers in the market, the underwriter’s
spread provides a straightforward means of transferring some of this surplus back to the
issuer. Indeed, it appears the Treasury expressed concern about the possibility that the
coupons were being set on the bonds at excessively high rates, triggering a vigorous lobbying
effort on the part of the issuers, underwriters, and bond counsels in response. We discuss
this debate in Section 3.
We are not suggesting that strategic underpricing is the only reason for the BAB pro-
gram’s popularity. It is possible that a tax rate of 35% simply is not the relevant marginal
rate for equilibrating flows across the two markets. There is a history of evidence in the
finance literature that long-term municipal rates are “too high” to be consistent with high-
tax investors being marginal holders in both the taxable and tax-exempt markets. The
tax-exempt yield curve is, typically, steeper than the taxable yield curve. Long-term tax-
able yields, times one minus the tax rate, understate long-term municipal yields of the same
maturity.6 Long-term tax-exempt bonds are an expensive source of financing for municipal
5Green, Hollifield, and Schurhoff (2007b) show that average prices of municipal bonds rise from the re-offering price, but that this increase is associated with price dispersion and changes in the mix of buyers.Green (2007) argues that capacity constraints in retail distribution networks allow underwriter-dealers toavoid competitive outcomes in negotiating with issuers. Schultz (2011) argues that increased price trans-parency due to real-time reporting of transaction prices has reduced price dispersion, but has had little effecton average markups to final investors.
6Green (1993) documents this behavior, and proposes a model to explain it based on tax-avoidance
5

issuers, who would prefer to issue taxable bonds with a 35% coupon rebate. The limited
amount of formal research on BABs to this point bears this out. Ang, Bhansali, and Xing
(2010) estimate interest savings on newly issued BABs of 54 basis points on average relative
to equivalent newly issued tax-exempt municipal bonds, with this benefit increasing in ma-
turity. Thus, our purpose here is not to deny that the BAB program provided less expensive
funding to municipalities. It is to evaluate whether the benefit is associated with enhanced
liquidity, as suggested by the program’s goals, and to explore its unintended consequences.7
The paper is organized as follows. Section 2 illustrates how underpricing can collectively
benefit the issuer and underwriter, and reviews the public debate about how the Treasury
should determine the “interest rate” and the “issue price” on which the rebate is based. Sec-
tion 3 describes the data and Section 4 evaluates patterns of trade and measures of liquidity
for newly issued BAB and tax-exempt bonds. In Section 5 we document the differences in un-
derpricing across BABs, tax-exempt municipals, and non-BAB taxable municipals. We also
provide some measures there of the aggregate costs of intermediation for issuers and study
the relationship between the underwriter discount and amount of underpricing. Section 6
concludes.
2 Underpricing and the Tax Subsidy
In this section we illustrate how underpricing creates shared surplus for the issuers and
underwriters at the expense of the Treasury. Assume an issuer and underwriter set the
strategies. Chalmers (1998) shows the behavior is also evident in pre-refunded municipal bonds, which arebacked by U.S. Treasury securities.
7Advocates for the program also argue that an additional benefit of the program is that the size of the taxbenefits do not depend on the marginal rates of the bond holders, and is thus more equitable and efficient.The value of the tax exemption for traditional municipals is higher for high-tax, wealthy individual. Thisargument might apply to tax-credit bonds, but these were apparently not used by issuers under the BABprogram. It is not clear how the argument would apply to direct-pay bonds. Even with tax-credit bonds,the argument ignores the fact that low-tax inframarginal investors benefit from the tax-exempt status ofmunicipals if higher yields on taxable bonds reflect the differential tax treatment.
6

terms on a taxable bond, a BAB, of maturity T . The reoffering price R of the bond must
be set at a par value of $1,8 and the issuer receives this price less the underwriter discount
of D. If the bond has coupon C, aT is the value of a T-period taxable annuity, and qT is the
value of a pure-discount bond maturing at T , then the value of the bond to investors is
VT = CaT + 1qT .
This present value can be viewed as what the bond would sell for in frictionless secondary
market trading. In our empirical work, we use the inter-dealer price as a proxy for VT .
The issuer receives a rebate of the coupon equal to τC each period, so the present value
of the issuer’s liability from the bond is C(1 − τ)aT + qT .9 Let C∗ be the coupon rate on
a bond that would trade at par value in the secondary market—the coupon rate solving
1 = C∗aT + qT . Note that VT − 1 = (C − C∗)aT .
The underwriter pays the issuer the reoffering price of $1 and receives the discount of D.
He then sells the bonds to investors and receives (1 − φ)1 + φVT , where φ is a reduced-form
representation of the extent to which the underwriter is able to recapture some of the benefits
of the underpricing. This recapture could come in a number of forms. At the extreme, the
underwriter might simply sell the bonds from inventory at full value, in which case φ = 1.
Alternatively, he may sell some of the bonds at the reoffering price, and others later at
a higher value. Even if the entire issue is sold at the reoffering price, underpricing might
reduce the underwriter’s costs of marketing the bonds. Selling underpriced bonds to favored
customers might also benefit the underwriter through purchases of other financial services
8Under IRS rules, the reoffering price may deviate from par value by the “de minimis” amount, an amountequal to 0.25% of the par value for each complete year until the bond’s maturity.
9We assume here that the issuer applies the same discount rate to these cash flows as does the taxablebond market. That is, the value of a T-period annuity is what it can be sold for in the taxable market. Analternative derivation, which treats the tax-exempt municipal bond rate as the opportunity cost of capitalto be applied to the coupon stream net of the rebate, is available in the on-line appendix to this paper. Itrelies on the steeper slope of the tax-exempt term structure to arrive at the result.
7

by those customers.
The net liability to the issuer, VI , and the net benefit to the issuer, VU , are
VI = 1 −D − C(1 − τ)aT − qT ,
VU = (1 − φ)1 + φ(CaT + qT ) − 1 +D.
Adding these together, the net surplus associated with issuing the bond is:
S = τCaT − (1 − φ)(VT − 1).
Alternatively, the issuer and underwriter could issue a bond that sold in the secondary
market at par, with coupon C∗, and create a surplus of S∗ = τC∗aT . The difference between
these two expressions gives the benefit (or cost) of underpricing the bond,
S − S∗ = τ(C − C∗)aT − (1 − φ)(VT − 1) (1)
= [τ − (1 − φ)](VT − 1)
Thus, if none of the benefit of underpricing is captured by the underwriter (φ = 0), then
the issuer and underwriter have no incentive to underprice the bonds. The tax rebate reduces
the cost to the issuer of a higher coupon, but not sufficiently to offset the present value of the
greater liability. Similarly, if the tax rate τ is zero, as is the case with traditional, tax-exempt
municipals, then there is no incentive to underprice. Even if the underwriters fully capture
the value, it is offset one-to-one by the greater liability to the issuer, so that underpricing
is purely a transfer from issuer to underwriters or investors. Issuers and underwriters may
have a shared interest in underpricing, however, when the tax rebate is positive and some of
the present value of the underpriced bonds flows back to them.
8

The Treasury appears to have expressed some concerns about the possibility that the
bonds were being systematically underpriced. In August 2010 an open letter to the Trea-
sury, widely reported in the financial press, was released jointly by the Government Finance
Officers Association, the National Association of Bond Lawyers, the Regional Bond Dealers
Association, and the Securities Industry and Financial Markets Association. This document
complains about actions taken by IRS personnel that “continue to create uncertainty regard-
ing the IRS’s interpretation of the rules for establishing ‘issue price’.” The letter urges the
Treasury to continue the established practice of treating the reoffering price set through ne-
gotiation between issuers and underwriters, and made public in the final pricing wire as the
issue price, and claims subsequent secondary market prices cannot be used for this purpose
because they are uncertain at the time the bonds are issued:
The final pricing wire, substantiated by evidence of the offering process, providesthe basis for the parties’ reasonable expectations regarding the proper issue priceof the bonds, irrespective of the actual sales executed once the bonds becomeavailable to investors.
The letter goes on to provide evidence of initial underpricing in other settings and appeals
to traditional practices in the tax-exempt setting: “The issue price for tax-exempt bond
purposes has been based on the initial offering price to the public for over 25 years. We
submit that there is no reason to depart from this approach.” The underpricing in the tax-
exempt market is coming at the expense of the issuer, and one might sensibly argue that
issuers who fail to effectively bargain with their underwriters have only themselves to blame.
Underpricing in the BAB market, however, is coming at the expense of a third party, the
tax-paying public.
9

3 Data
Our data consist of the transaction-by-transaction trade reports for municipal bonds made
available through the Municipal Securities Rulemaking Board (MSRB). The MSRB dataset
reports every trade carried out through registered broker-dealers in the U.S., which is vir-
tually the entire public municipal bond market. Trades are reported as sales to customers,
purchases from customers, and inter-dealer trades. For each trade there is a price, the par
value of the bonds exchanged, and the time at which the trade took place. When new bonds
are issued, the MSRB data do not include the transfer of the bonds from the issuers to the
underwriters. Thus, the first trades we see are sales from the underwriters to customers, or
possibly to other dealers.
Along with the transactions data, we have information about specific bonds and issuers
from two sources: SDC Platinum, and a database collected and made available to us by
Primuni.com. The latter was hand collected from the official statements and information
provided on the MSRB’s Electronic Municipal Market Access (EMMA) website. We use both
of these databases to check inconsistencies and resolve missing data where possible. The data
include issuer characteristics (such as name, state, type), reoffering prices or yields for each
bond issue, and issue characteristics (such as maturity, coupon, call schedule, taxable status,
stated use of funds, and sinking fund provisions). These data also provide information on
the underwriting syndicate, including underwriters’ names and underwriting fees. The filters
we apply to clean the data are similar to those in Green, Hollifield and Schurhoff (2007b).
The on-line appendix provides a detailed description of how records with missing or clearly
incorrect data were treated, and an accounting of steps that lead to our final sample of
166,486 bonds, or CUSIPs, and 3,313,924 trades.10 The first issuance in our sample was on
May 12, 2009, and the last was on December 29, 2010.
10These totals include 12,148 non-BAB taxable bonds that we only consider in certain portions of theanalysis.
10
Municipal bonds are typically issued “in series,” and this is often cited as a source of their
low liquidity.11 Multiple bonds with different maturities are underwritten simultaneously in
one “deal.” Each maturity has a separate CUSIP number and trades as a separate security
in the secondary market. The separate maturities in a deal are commonly referred to as
“CUSIPs,” bonds with the same terms and initial price.
Panel A of Table 1 shows that there were fewer BAB deals over the sample period than
traditional tax-exempts, but BAB deals were substantially larger. There were also fewer
individual CUSIPs per deal. Liquidity requires coincident needs between large numbers of
potential buyers and sellers, and this is, of course, facilitated by a greater supply of identical
bonds. Thus, we would expect that the larger deals, with fewer CUSIPs per deal, enhance
liquidity, independently of the investor clientele.
Occasionally, multiple deals are combined in a single underwriting, managed by the same
underwriter for the same issuer. For example, we have 984 instances where a municipal-
ity issues both BABs and tax-exempts at the same time through the same underwriting
syndicate. We exploit these situations in some of our analysis.
4 Market Liquidity Measures
Panel B of Table 1 provides statistics on the overall patterns of trade over the first 60 days of
trading. For both types of bonds, volume is dominated by sales to customers. The median
sale by dealers to customers is smaller for BABs than for tax-exempts. This is striking
considering that one of the stated purposes of the program was to give municipal issuers
access to institutional investors, such as endowments and pension funds, that trade in larger
quantities.
When we consider the cross section of CUSIPs rather than the cross section of trades, we
11See, for example, Ang and Green (2011).
11
see that trading activity is highly concentrated in a small number of bonds. The dramatic
differences between medians and means of trades per CUSIP show trading activity for both
BABs and tax exempts is highly skewed, particularly for the BABs. The next line in the
table shows that the median over all CUSIPs of the median trade size within each CUSIP
is somewhat larger for the BABs than for tax-exempts. This suggests that many of the
CUSIPs are indeed being placed with institutional investors, as intended. The small number
of trades for the median CUSIP shows that, for both BABs and tax-exempts, relatively little
trading is involved in distributing many of the bonds to their final holders. The typical bond
is quickly sold off in large blocks to institutions. Most of the trading activity is associated
with a subset of bonds that are widely distributed to smaller investors. These tend to be
associated with larger, more visible issuers in bigger deals.
The financial press and the regulatory authorities have frequently expressed concern over
“flipping” of new municipal bonds by large intermediaries such as hedge funds. Customers
who flip municipal bonds are effectively performing the underwriters’ function of distributing
the bonds to final customers. They buy large blocks of bonds from a dealer, and then sell
them to other dealers with retail distribution capability, who in turn sell them to retail
investors that buy and hold the bonds. Since the stated purpose of the BAB program was to
provide issuers with access to a more liquid market, we might expect less need for flipping,
since they can be purchased and held directly by large institutional investors. On the other
hand, since the final customers for BABs are not the traditional clientele for municipal issuers
and underwriters, we might alternatively expect more intermediation by third parties as the
bonds make their way through new distribution channels to the final investors.
A simple means of detecting flipping of newly issued bonds is to ask if the par value
of total sales to customers over the first 60 days of trading exceeds the par value of the
issue. If that is the case for a given CUSIP, then evidently some customers are buying the
bonds, selling them back to dealers, who are in turn selling them to other customers. A
12

less conservative measure of the bonds being recycled through dealers is the ratio of sales to
customers over total “underwriter sales,” defined as the difference between the par value of
an issue and the par value of bonds still in dealer inventory at the end of 60 days. Suppose,
for example, a dealer initially places 85% of the bonds in a specific new issue with one hedge
fund, and the dealer is unable to sell the remaining bonds, which remain in inventory. If the
hedge fund sells its bonds to regional broker-dealers, who in turn sell them to retail investors,
then sales will be two-times underwriter sales, which means all the bonds the dealer has sold
have been flipped. None of them end up with the investors who first purchased them.12
Panel C of Table 1 shows a similar picture emerges for either measure of flipping. For
each CUSIP in the sample, we compute the ratios of total sales to par value and total sales
to underwriter sales, and report the means across CUSIPs. For both tax-exempts and BABs
the averages exceed one, and they are slightly higher for BABs, statistically significantly
so at less than 1%. We define bonds that have been flipped as those where total sales
over underwriter sales exceed one, and the table shows that 26% of the BABs have this
characteristic, while only 16% of tax-exempts issued during the same period of time show
evidence of flipping. This difference is economically and statistically significant. The greater
prevalence of flipping for BABs may be due to the larger deals and fewer CUSIPs per deal.
The size of the issues may require dealers to enlist and compensate non-broker-dealers in
the distribution process. If higher liquidity is the reason the BABs are turning over more
in the first 60 days of trade, then we would expect less underpricing for those bonds. On
the other hand, if the reason the bonds are turning over is because of limited access to the
12We exclude from the sample in these calculations CUSIPs with final inventory greater than the CUSIP’spar principal. Missing sales to customers will increase the ratio of total sales to underwriter sales. We donot include CUSIPs with ratios that are obviously too large (i.e., greater than 10). When underwriter salesare greater than the CUSIP principal (i.e., negative final inventory), we set them to be equal to the CUSIP’spar principal. This might underestimate the ratio of total sales to underwriters sells. Obviously, theseprocedures would only bias our comparison of the BABs and tax-exempts if omissions or other data errorsare more prevalent in one case than another, which seems unlikely given that the same issuers, regulators,and underwriters are involved.
13

final customers, which one would associate with lower liquidity, then we would expect higher
markups over the reoffering price, or greater underpricing, to be associated with BABs. We
consider underpricing in the next section.
Trade in the days immediately following the issuance of the bonds combines trade between
secondary market participants and the movement of the bonds from the inventories of the
underwriters to investors. Investors, when they purchase the bonds, will ultimately pay
less for bonds they expect will be costly or difficult to sell in the secondary market, should
they find the need to do so. Activity in the bonds after 60 days of trade is informative
about the liquidity investors should be most concerned about. Greater secondary market
liquidity for BABs, because they are aimed at a different investor clientele, would provide a
rationalization for the program consistent with its stated objectives.
Panel D of Table 1 shows mixed evidence on the differences in trading activity between
BABs and tax exempts after the first 60 days of trade. The BABs show a slightly larger
fraction of CUSIPs with sales to customers and more sales per CUSIP, but there is also a
larger decline in trade relative to the first 60 days, and the median trade sizes are lower.
In Table 2 a clearer distinction between BABs and tax exempts emerges when controlling
for deal and CUSIP characteristics. Each column presents the results of regressing a different
measure of liquidity on a BAB dummy and a large number of controls. Panel A covers the
first 60 days of trade, and Panel B the trades after 60 days. Panel B includes probit and
logit regressions for the probability that any trade at all occurs (omitted in Panel A because
all bonds in our sample show some trade initially). The coefficients on the BAB dummy
represent the increase in liquidity for the BABs relative to the tax-exempts issued over the
same period. Over the first 60 days, the coefficients on the BAB indicator are insignificant for
two of the four measure, marginally significantly negative for one, and significantly positive
for trade size as a fraction of size of the issue.
After 60 days, the BABs appear to trade significantly less than the tax-exempts control-
14

ling for characteristics. Panel B shows the coefficients on the BAB indicators are significantly
negative for all but the trade size measure, for which they are insignificant. Bonds issued
later in our sample are mechanically more likely to show trading activity after 60 days and
bonds issued early on. If the timing of the issues differs across the two types of bonds, then
this could affect our results. We show in Appendix C of the on-line appendix to the paper
that our results are robust to controlling for this possibility, by reporting details of logit and
probit regressions for the probability of trade in various amounts that include indicators for
quarters and interaction terms between these time and BAB dummies.
The amount of trading activity should be associated with the ease with which market par-
ticipants can identify counterparties. What investors are ultimately most concerned about,
however, is the cost of trade. Table 3 shows that, controlling for characteristics of deals and
CUSIPs, trading costs are higher for BABs than for tax-exempt bonds issued over the same
period. We use two measures of trading costs that have been employed in the literature
on OTC markets. The first follows Schultz (2001). We regress the price changes from one
trade to the next on the change in the sign of the trade. For example, if the previous trade
was a buy from a customer (−1) and the current trade is a sale to a customer (+1), the
independent variable would be +2 (= (+1) − (−1)). We would expect the price to increase
in this situation. In the reverse situation, the change in the trade sign is −2, and we would
expect the price to decrease. The coefficient on this variable, therefore, measures the average
half-spread between the prices at which customers buy or sell and the mid-point. We interact
the change in trade sign variable with a BAB indicator to measure the increase or decrease in
trading costs for BABs. The second specification follows Hendershott and Madhavan (2012).
It regresses the ratio of the transactions price over a benchmark price, which proxies for the
midpoint or common value of the bond, against the sign of the trade. This ratio should
be higher for customer purchases than sales. The benchmark we employ is the most recent
interdealer price, or the reoffering price if no interdealer trades have occurred.
15

The first line of Table 3 shows that average trading costs are significantly higher for
BABs, both before and after 60 days of trading. The three-way interaction that combines
BAB and trade sign with the par value of the trade has an insignificant coefficient (third
line of the table), which makes clear that the higher costs for the BABs are not attributable
simply to differences in trade size. The estimates of the increased trading costs for the BABs
are robust to excluding the control variables.13
To summarize our results on liquidity, then, the amount of secondary trading activity is
not higher for BABs (Table 1, Panel B) and controlling for characteristics of the bonds it
is actually lower (Table 2). Trading costs are, on average, significantly higher for BABs in
both issuance period and after 60 days (Table 3). If BABs offer less expensive financing for
municipalities, it does not appear to be due to higher secondary market liquidity.
5 Underpricing of Build America Bonds
We now turn to the differences between the behavior of the BAB prices and those of the
tax-exempts in relation to the reoffering price, which is set by the underwriter.
5.1 Amount of Underpricing
Figure 1 shows average markups for the cross section of new issues during the sample period,
and various subsamples. We define the markup as the difference between the price at which
a trade occurred and the reoffering price, as a percentage of the reoffering price. The top
two figures plot the average percentage markup by day from the start of trading and by
type of trade. The BAB bonds are on the left-hand side, and the tax-exempt bonds are on
the right. The horizontal line in the figures represents a zero markup—that is, trades at
13The coefficient estimates for the interaction term with the controls excluded are 0.04, 0.24, 0.27, and0.20. The first is significant at the 10% level and the others at the 1% level. These are very similar to theresults in the first line of Table 3.
16

the reoffering price. For each day after the start of trade, we compute the average markup
for each CUSIP for which trades occur on that day. We then average across all of these
CUSIPs. This gives bonds for which relatively few trades occur equal weight with those for
which there was heavy volume, and is thus more representative of the typical bond.14
The figure shows that for traditional municipals the average price at which sales to
customers occur rises after the first day, while the interdealer trades and purchases from
customers are much more stable through time and close to the reoffering price. In contrast,
all the prices continue to rise for the BABs after the first day, and the initial underpricing is
much larger.
The plots also point to a reason for the larger markups on sales to final customers. The
distance between the average prices at which investors purchase bonds from dealers and the
prices at which dealers purchase bonds, from customers and each other, is not dramatically
different for BABs and tax-exempts. For the BABs, however, there are larger markups for
the interdealer trades and purchases from customers. These markups rise steadily through
time.
A difference between the prices at which bonds are finally sold to customers and the cost
of the bonds to dealers could be due to several factors. The dealers face costs reaching final
customers through their distribution network for which they must be compensated (Schultz
(2011)). They may, alternatively, have market or bargaining power when negotiating with
issuers initially and investors subsequently. Either the costs of intermediation or the rewards
to market power could vary across BABs and tax-exempt bonds. The decision to issue
one type of bond versus another is endogenous. It is made in light of anticipated liquidity
and credit risk, and is thus likely to be correlated with both observed and unobserved
heterogeneity. Thus, we should not find it surprising to observe differences in the relationship
14The same plots of average markups with every trade weighted equally has a very similar appearance, asis evident from the bottom row of Figure 1, which weights all trades equally within trade size category.
17

between final prices and dealer costs for the two types of bonds.
It seems, however, that the most dramatic differences in the evolution of prices are in the
degree to which the BABs are initially underpriced relative to the terms at which dealers
trade with each other. A strategic response by underwriters and issuers to the tax incentive
to inflate the coupon level is one possible explanation for this behavior.
Given the large numbers of CUSIPs in our sample, it is not surprising that the differences
evident in these figures are statistically significant. Panels A and B of Table 4 provide
statistics, for BABs and tax-exempt municipals, respectively, for the par-weighted average
price at which bonds are sold to customers (P ) over the first 60 days, the average interdealer
price (V ), and the reoffering price (R). For each CUSIP, we first compute the par-value
weighted average price. In contrast to the plots in Figure 1, here we pool all observations
across days. The table reports the mean and standard deviation of this number across
CUSIPs, and similarly for V and R. The average differences between these prices are all
statistically significant at high levels of confidence. The bottom panel of the table reports the
same information for taxable municipals that are not part of the BAB program, discussed
below.
5.2 Trade Size, Maturity, Issuer Effects and Non-BAB Taxable
Municipals
The evidence that the BABs are as underpriced, or more underpriced, than tax-exempt
municipals is subject to the caveat that the issuers and underwriters are choosing to is-
sue BABs in light of anticipated liquidity, credit risk, and other sources of heterogeneity
through time and across issuers. The remaining rows in Figure 1 show that the difference
between the BABs and tax-exempt municipals survive controls for the most obvious sources
of heterogeneity.
18
As we discussed in the introduction, the term structure is steeper for tax-exempt bonds
than it is for taxables. BABs, therefore, are more likely to be issued for longer maturities.
Indeed, in some instances during the program tax-exempt bonds and BABs were issued
simultaneously in series, with traditional municipals at the shorter maturities and BABs and
the longer maturities. If underpricing is associated with illiquidity, then longer maturities
are likely to be more underpriced.
The second row of plots in Figure 1 shows the evolution of markups over the reoffering
price for bonds with a fixed maturity of 20 years.15 As with the first row, these plots show
averages across CUSIPs of daily average markups on trades for each CUSIP. The panel on
the left is for BABs and the one on the right is for tax-exempts. Note that the basic behaviors
evident for the overall sample are also present here. Fixing the maturity, BABs appear to
be as underpriced or more underpriced than the tax-exempt bonds. In particular, the BABs
show more evidence of larger markups for interdealer trades and purchases from customers.
Unobserved heterogeneity across issuers potentially contaminates some of the compar-
isons described above. While our regression analysis below controls for many factors, there
are thousands of issuers, and it is difficult to obtain data on their characteristics that could
fully account for differences in credit risk, familiarity to investors, and transparency in re-
porting that might bear upon a given bond’s liquidity. The data provides something of a
natural check on the robustness of the results on this dimension because many BABs were
issued simultaneously with tax-exempt bonds in a single underwriting.
In the third row of plots in Figure 1, we reproduce the top row of the figure, but we limit
the sample to BABs and tax-exempts issued at the same time by the same municipality.
We have 984 cases where tax-exempts and BABs from the same issuer have exactly the
same sale date. Again, the central behaviors evident for the overall sample are present
here. The BABs show more price appreciation through time, especially when considering
15Plots for fixed maturities of ten and thirty years look very similar.
19

the interdealer prices.
BABs are issued in larger deals with fewer CUSIPs, which should enhance liquidity. They
were also intended to appeal to institutional investors, such as pension and sovereign funds.
They should, therefore, trade in larger quantities. The final row of Figure 1 stratifies the
markups on sales to customers by the par value of the trade. For every trade-size category,
the initial underpricing is higher for the BABs, and the increases in price appear to continue
for a longer time. The contrast between the BABs and the tax-exempts is most dramatic
for the largest trades. This reinforces the evidence that the BABs are underpriced relative
to interdealer trades and purchases from customers. The underpricing of the BABs is most
apparent in the institutionally sized trades. This points to strategic reasons for underpricing,
rather than underpricing as a concession to liquidity or as compensation for the costs of
reaching small investors.
Another difference between traditional municipals and BABs is the sales and trading
desks within the underwriting firms that intermediate their distribution. The BABs, be-
cause they are being sold to a taxable clientele, are typically handled by the corporate
trading desk, when the underwriter or dealer is large enough to separate these functions.
Since compensation and institutional practices may vary across desks, this might explain
the differences in the underpricing evident in Figure 1.
Municipal entities, however, have frequently issued bonds that do not qualify for tax-
exempt status. For example, a number of municipalities have issued debt to fund their
pension plans. Since the pension invests in taxable securities, the Treasury does not allow
debt issued for this purpose to qualify as tax exempt. For these bonds, however, there is no
incentive to underprice due to a tax rebate on the coupon. Panel C of Table 4 shows that
these bonds, in fact, behave more like tax-exempt municipals than BABs. The par-weighted
average interdealer price is slightly less than the reoffering price, as it is with tax-exempts
and in contrast to the BABs where P − V is positive. The overall amount of underpricing,
20

when compared to tax-exempts, is only slightly larger for taxable municipals (59 cents per
100 face value, versus 51 cents).
5.3 Aggregate Costs of Intermediation
Any underpricing of the bonds represents a cost of financial intermediation to the issuers.
It may be “money left on the table,” due to inattention by the issuer, or it may represent
market power for the underwriters. It may also be an alternative form of compensation for
the underwriter and other intermediaries for the costs of identifying and distributing bonds
to the final investors with the highest valuations. The BABs, however, are also underpriced
relative to the interdealer market. Since we do not see evidence of underpricing in the
interdealer market for tax-exempts and non-BAB taxable municipals, it seems less plausible
that this form of underpricing for BABs would be simply a cost of reaching retail investors.
Table 4 provides some summary measures of these costs for the issuers during the 20
months of the BAB program. The final column reports, for each measure of underpricing,
the aggregate amount summing across all issues in billions of dollars. We also provide an
estimate of the total fees paid through the underwriter discount. In parentheses we report
each of these as a percentage of the principal value of the debt. The underpricing of the
BABs amounted to $2.79 billion, of which $0.58 billion was due to the difference between
the average interdealer price and the price at which the bonds were reoffered to the public.
In addition, issuers paid about $1.24 billion in underwriting fees. On the tax-exempt bonds
issued during the same period, $395 billion, the underpricing cost issuers $3.50 billion, as a
percentage of face value half as much as with BABs. Underwriting fees, at $3.33 billion were
slightly lower for tax-exempt bonds as a percentage of principal. The analysis in Section 2
suggests that the cost of the coupon inflation to the Treasury can be viewed as approximately
the tax rate times the value of the underpricing as reflected in the interdealer market, or 35%
of $580 million. While not a large amount by the norms of the federal budget, this would,
21

of course, become much larger if the BAB program were permanently reinstated and came
to be a preferred form of debt financing by municipal issuers, and if no steps were taken to
control the underpricing.
5.4 Determinants of Markups
The characteristics of a bond deal, its pricing, and whether to use tax-exempts or BABs
are determined simultaneously and endogenously. An attempt to deal with the resulting
possible selection bias is made in Tables 5, 6, and 7. The first of these provides estimates
of probit and logit specifications that use characteristics of the bond to predict whether the
municipality chooses to issue BABs or tax-exempt bonds. The results are very similar across
specifications. BABs are likely to be longer maturity, more likely to be rated, and are issued
in larger deals. We then examine the determinants of the percentage markup on interdealer
trades (Table 6) and sales to customers conditional on the sale not occurring at the reoffering
price (Table 7). In each case, the deal is the unit of observation, and the characteristics of
the component CUSIPs within a deal are par-value weighted. The first three columns report
results of OLS regressions, controlling for progressively larger sets of characteristics. The
probit model from the second column of Table 5 is then used to control for selectivity (the
“Heckman correction”) in the final column.
The coefficient on the BAB dummy variable in these regressions measures the under-
pricing controlling for characteristics and selectivity. The first column shows that, uncon-
ditionally, BABs are more underpriced than tax-exempts by roughly half a percent in the
interdealer market, and by three-quarters of a percent when sold to investors. These magni-
tudes fall to around 30 and 25 basis points, respectively, when controlling for bond and deal
characteristics, and these measures of the underpricing are affected very little by the control
for selectivity.
These differences are not surprising given the different reasons for underpricing. The
22
price dealers charge each other provides a natural measure of the intrinsic value of the bond.
If the bonds are being underpriced strategically, due to tax incentives, this should be evident
in the prices dealers pay each other, as we see in the BABs. If underpricing is compensation
to dealers and other intermediaries for the costs of distributing the bonds to final investors,
or a concession to liquidity, then we should see underpricing evident in prices those investors
pay when they buy the bonds, but not in the prices dealers pay each other. This is what we
see in traditional tax-exempts. Hence the difference between the markups to investors for
BABs and tax-exempts is actually less than the difference in markups on interdealer trades.
5.5 The Underwriter Discount
Underwriters are compensated through fees, as well as any profits they can earn on newly
issued bonds they absorb into inventories. The fees, known as the underwriter “discount”
or “gross spread,” are specified in the official statement for the bonds (the analogue of a
prospectus). The underwriter discount applies to all the CUSIPs in a given financing or
“deal.” (Recall that municipals are issued “in series,” and each maturity has a separate
CUSIP.).
The previous section showed that, despite being issued in larger deals with fewer CUSIPs
per deal, the BAB are more underpriced than municipal bonds issued in the same period. To
what extent is this a strategic response to the tax subsidy, which increases with underpricing,
versus simply underestimation of the value of the bond or compensation to the intermediaries
for the costs of distributing the bonds? The analysis in Section 2 suggests that underpricing
increases the shared surplus to the issuers and underwriter, but the means through which the
issuers would capture part of this surplus would be through lower fees, which are a transfer
payment from the issuer to the underwriter. Accordingly, in this section we ask whether the
gross spread is negatively correlated with the amount of underpricing.
Bonds that are simply distributed to institutional investors at or very near the reoffering
23

price in large blocks should be relatively inexpensive to distribute, and in a competitive envi-
ronment with no strategic incentive to underprice, we would expect underwriters to earn low
fees on such deals. Placing bonds with retail investors is more costly, and underwriters can
be compensated for those costs through fees or markup on the bonds. Market participants
report that fees are more transparent to the press, the public, and regulators. Issuers and
underwriters therefore are reluctant to raise fees, even when costs would justify doing so.
Heterogeneity in costs, inventory risk, or dealer market power is more likely to be reflected
in underpricing than in fees.
There is no definitive theoretical argument that would predict a particular cross sectional
relationship between fees and underpricing, since both could respond to underlying sources
of heterogeneity. On the one hand, fixing the underwriters total expected payoff, fees and
underpricing clearly substitute for each other, which would lead to a negative association
in the cross section. On the other hand, as costs rise both underpricing and fees may rise,
leading to a positive cross sectional correlation between the two.
Nevertheless, an outcome for BABs that contrasts with what we observe for tax-exempt
bonds, or for taxable, non-BAB bonds, issued during the same period is suggestive of a
strategic response to the tax incentives, particularly when controlling for the most obvious
sources of heterogeneity in costs. This is what we find. Fees and underpricing are negative
correlated for the BABs, but not for the tax-exempts. Moreover, this negative association
tends to increase over the life of the BAB program. When compared to non-BAB taxable
municipals the contrast is less striking, but still evident.
The average gross spread is lower for BABs than for tax-exempts (81.5 versus 92.8 basis
points), and the deals are on average larger ($81 million par value versus $28 million).
We would expect lower spreads for bigger deals if there are fixed costs to underwriting, as
emphasized by Chen and Ritter (2000) in the context of IPOs. Table 8 reports coefficients
from regressing average markups for bonds in each deal in our sample against controls along
24

with the gross spread, a BAB dummy, and interaction terms. The first three columns,
(A)-(C) pool together BABs and tax-exempt bonds. The last two columns pool BABs and
non-BAB taxables. The first row shows BABs have higher markups, as we have seen. The
first specification, in column (A), shows that across all deals, both BABs and tax-exempts,
the gross spread has a positive, though insignificant, correlation with the underpricing. The
next column, (B), shows that when the spread is interacted with a BAB indicator, the
markup is positively related to spread for tax-exempts, negatively for BABs. Column (C)
shows that the interaction term becomes more negative through time. This suggests dealers
and issuers may have taken some time to fully adjust to the incentives to underprice under
the BAB program. For non-BAB taxables the association between spread and underpricing
is negative but insignificant. It becomes significantly negative for BABs in the later periods
of the life of the program.
6 Conclusion
The Build America Bonds were an attempt to give municipal issuers access to a deeper
pool of investors. We have examined the effect this had on several measures of liquidity,
and on the initial underpricing of the bonds when issued. The BABs are more underpriced
than traditional tax-exempt municipal bonds issued in the same period. The prices between
dealers show the most dramatic underpricing when compared to the tax-exempts. One reason
for this might be that the tax rebate to the issuer on the bonds is tied to the coupon level,
reducing the costs of underpricing to issuers, underwriters, and investors as a coalition.
While the BAB program may well have reduced financing costs for municipal entities,
it does not appear to be for the reasons offered for the program. In addition, the direct-
pay mechanism substituted for the tax-exemption of interest appears to have led to the
unintended consequence of encouraging underpricing of the bonds, creating a larger wedge
25

between the price issuers receive for their bonds and the prices at which they sell in the
secondary market.
26

References
Ang, Andrew, Vineer Bhansali, and Yuhang Xing, 2010, Build America Bonds, Journal of
Fixed Income 20, 67-73.
Ang, Andrew, Vineer Bhansali, and Yuhang Xing, 2011, Decomposing Municipal Bond
Yields, working paper, Columbia University.
Ang, Andrew and Richard C. Green, 2012, “Reducing Borrowing Costs for States and Mu-
nicipalities Through CommonMuni,” Brookings Institute, Hamilton Project Discussion
Paper 2011-01, February 2011.
Chen, Hsuan-Chi and Jay R. Ritter, 2000, “The Seven Percent Solution,” Journal of Finance
50, 1105-1131.
Edwards, Amy K., Lawrence Harris and Michael S. Piwowar, 2007, “Corporate Bond Market
Transparency and Transactions Costs,” Journal of Finance 62, 1421-1451.
Green, Richard C., 2007, “Issuers, Underwriter Syndicates, and Aftermarket Transparency,”
Journal of Finance 62, 1529-1550.
Green, Richard C., Burton Hollifield and Norman Schurhoff, 2007a, “Financial Intermedi-
ation and Costs of Trading in an Opaque Market,” Review of Financial Studies 20,
275-314.
Green, Richard C., Burton Hollifield and Norman Schurhoff, 2007b, “Dealer Intermediation
and Price Behavior in the Aftermarket for New Bond Issues,” Journal of Financial
Economics 86, 643-682.
Hendershott, Terrence, and Ananth Madhavan, 2012, Click or Call? Auction versus Search
in the Over-the-Counter Market, working paper, University of California, Berkeley.
27

Schultz, Paul, 2001, “Corporate Bond Trading Costs: A Peek Behind the Curtain,” Journal
of Finance, 56, 677-698.
Schutz, Paul, 2011, “The market for new issues of municipal bonds: The roles of transparency
and limited access to retail investors,” Notre Dame University, working paper.
28

Table 1Descriptive Statistics on Deal and Trade Characteristics
Multiple CUSIPs, or bond issues, are underwritten simultaneously in a deal. Panel A reports
descriptive statistics for deals in our sample for Build America Bonds (BABs) and traditional tax-
exempt municipals. Panel B reports descriptive information for trades in those bonds over the first
60 days. Panel C reports ratios of sales-to-customers to par value of the issue or to total sales of
the bond by underwriters. Underwriter sales are defined as the par value of the issue less bonds
that remain in dealer inventories after the first 60 days of trade. We define bonds that have been
“flipped” are bonds where the ratio of total sales to underwriter sales exceeds one. All differences
in means between BABs and tax-exempts (indicated by *) have levels of significance beyond 0.01%.
BAB Muni
Panel A: Deals
Number of Deals 1,875 13,554Number of CUSIPs 14,043 140,350Mean Number of CUSIPs per Deal* 8.1 11.4Mean Par Value per CUSIP ($ M)* 10.3 2.81Median Par Value per CUSIP ($ M) 1.14 0.52Mean Deal Value ($ M)* 80.9 27.7Median Deal Value ($ M) 20.8 5.8
Panel B: Trades ≤ 60 days after issuance
Number of Trades (thousands) 620 2,422Number of Sales to Customers (thousands) 478 1,629Median Par Value of Sales ($ K) 15 30Median Number of Sales per CUSIP 3 3Mean Number of Sales per CUSIP* 34 12Median across CUSIPs of Median Par Value of Sales 160 104
Panel C: Flipping
Mean Total Sales / Par Value of New Issues* 1.05 1.03Mean Total Sales / Underwriter Sales* 1.08 1.04CUSIPs with flipping by customers (%)* 26.4 15.6
Panel D: Trades > 60 days after issuance
CUSIPs with Sales (% of Panel A) 29% 25%Number of Trades (% of Panel B) 24% 28%Number of Sales to Customers (% of Panel B) 17% 20%Median Par Value of Sales ($ K) 15 25Median Number of Sales per CUSIP 4 3Mean Number of Sales per CUSIP* 19 9Median across CUSIPs of Median Par Value of Sales 25 33

Table 2Determinants of BAB Liquidity
The table reports the determinants of BAB liquidity. Each bond issue is an observation. Turnover istotal volume over issue size, log transformed. No. Trades is total number of trades, log transformed.Trade size is the average par transaction size. All specifications include state, month of issuance,issuer type, and use of proceeds fixed effects. Standard errors are clustered by month of issuance.Levels of significance are denoted by ∗ (5%), ∗∗ (1%), and ∗ ∗ ∗ (0.1%).
Pr(Trade) Pr(Trade)
Turnover No. Trades Trade size Trade sizeIssue size Probit Logit
Panel A: Trades ≤ 60 days after issuance
BAB -0.67 -6.79 -0.12* 0.04*** – –Maturity 1.09*** 6.13*** 0.01*** -0.01*** – –Rating 0.14 2.94*** -0.04*** -0.00* – –Unrated -2.92*** 7.19*** 0.14* -0.01 – –Insured 9.55*** 23.19*** -0.20*** -0.03** – –Callable 1.25* -8.94*** -0.43*** 0.04*** – –Sinkable -0.03 -1.03 -0.09** 0.02* – –Fixed coupon -2.77*** -3.88* 0.17*** -0.01 – –Extraord. redemption 0.49 8.45** -0.08* -0.02* – –ln(Deal size) 0.56** 31.53*** 0.50*** -0.11*** – –No. Cusips 0.17*** -1.56*** -0.04*** 0.00*** – –Competitive offering 4.43*** -2.41 0.35*** 0.02** – –Refunding bond 1.02* 2.21 -0.14*** -0.00 – –Advanced refunding -2.28* -7.69* -0.09* 0.00 – –Constant 77.85*** 99.95*** 0.70** 0.72*** – –R2 0.119 0.374 0.111 0.159 – –N 153,819 153,819 153,819 153,819 – –
Panel B: Trades > 60 days after issuance
BAB -1.68** -10.47*** -0.03 0.01 -0.15*** -0.25***Maturity 0.29*** 2.93*** 0.00 -0.00*** 0.03*** 0.06***Rating -0.31** 0.25 -0.01** -0.00 -0.01 -0.02Unrated -1.93*** 0.06 0.09* 0.00 -0.12*** -0.21***Insured -1.39*** -3.38* -0.04** -0.00 -0.07*** -0.11**Callable -1.60*** -9.06*** -0.13*** 0.01 -0.19*** -0.33***Sinkable -0.68*** -2.49** -0.03* 0.02*** -0.09*** -0.15***Fixed coupon 0.09 -1.41 0.02 -0.00 0.01 0.02Extraord. redemption -0.57 -0.73 -0.02 -0.01* -0.01 -0.01ln(Deal size) 2.86*** 22.74*** 0.13*** -0.05*** 0.42*** 0.72***No. Cusips -0.08** -1.15*** -0.01*** 0.00*** -0.02*** -0.03***Competitive offering 0.45 -3.01* 0.09** 0.01* -0.04** -0.07*Refunding bond 0.64** 5.50*** -0.04 -0.00 0.06*** 0.11***Advanced refunding 0.88 0.23 -0.00 -0.00 0.10*** 0.17***Constant 21.73*** 128.05*** 0.14 0.25*** -0.86*** -1.53***R2 0.100 0.318 0.042 0.102 0.253 0.253N 153,819 153,819 39,591 39,591 147,737 147,737

Table 3Determinants of BAB Trading Cost
The table reports the determinants of BAB trading cost. Each trade is an observation. We estimatethe following specifications for all trades i:
(1) ∆Pricei = α+β∆TradeSigni∗BAB+γ∆TradeSigni+δ∆Pari∗TradeSigni∗BAB+ξXi+εi
(2)Pricei
Benchmarki= α+βTradeSigni ∗BAB+γTradeSigni+δPari ∗TradeSigni ∗BAB+ξXi+εi
TradeSigni takes the value plus (minus) one for a customer buy (sell), and zero otherwise.Benchmarki is the last interdealer price or the reoffer price if no interdealer has occurred. Thecoefficient γ measures the average trading cost for munis, and β measures the difference in tradingcost between BABs and munis. All specifications include state, month of issuance, issuer type, anduse of proceeds fixed effects. Standard errors are clustered by issue and time. Levels of significanceare denoted by ∗ (5%), ∗∗ (1%), and ∗ ∗ ∗ (0.1%).
Trade date ≤ 60 days Trade date > 60 days
(1) (2) (1) (2)
BAB*TradeSign 0.05** 0.19*** 0.28*** 0.22***TradeSign 0.96*** 0.75*** 0.88*** 0.98***BAB*TradeSign*Par 0.00 -0.01 -0.01 -0.01TradeSign*Par -0.02*** -0.02*** -0.07*** -0.10***Par 0.01* -0.01** 0.01 -0.04***BAB 0.01*** 0.01 0.05*** 0.05Maturity 0.00 0.04*** -0.00 0.03***Rating 0.00 0.01* 0.00** 0.03***Unrated 0.00 0.05* 0.04*** 0.23***Insured 0.01*** 0.10*** 0.03*** 0.02Callable 0.01*** 0.04 0.01* 0.02Sinkable 0.00* 0.08*** 0.01* 0.04Fixed coupon -0.00 -0.01 -0.01** -0.07*Extraord. redemption 0.00* -0.06 0.00 0.09*ln(Deal size) -0.00** 0.01 -0.02*** -0.01No. Cusips 0.00* 0.00 0.00** 0.00Competitive offering -0.02*** -0.09*** -0.00 -0.04Refunding bond -0.01*** 0.01 -0.00 0.01Advanced refunding -0.01* -0.03 -0.01 -0.03Constant -0.54*** 2.78*** 0.23 0.32R2 0.399 0.359 0.375 0.215N 2,860,293 2,166,486 798,992 546,423

Table 4Measures of the Costs of Intermediation
The table reports descriptive statistics on underpricing and the costs of financial intermediation
for three types of municipal bonds. Each CUSIP is an observation. P is the value weighted
average price at which bonds are sold to customers for the CUSIP. V is the value weighted average
interdealer price, set to the reoffering price if no interdealer trades occur. R is the reoffering price
for the CUSIP. Aggregate cost is the average across all CUSIPs of principle times the underpricing,
times the number of CUSIPs. Since the underwriter discount is often missing, we approximate the
aggregate fees by multiplying the average cost per CUSIP by the total number of CUSIPs. Levels
of significance are denoted by ∗ (5%), ∗∗ (1%), and ∗ ∗ ∗ (0.1%).
Mean SD Aggregate ($ B, % of Principal)
Panel A: BABs (N=14,043)
P ($) 100.95 1.25 –V ($) 100.17 0.92 –R ($) 100.12 0.57 –P-R ($) 0.83*** 1.20 2.79 (1.92%)V-R ($) 0.05*** 0.80 0.58 (0.40%)P-V ($) 0.78*** 1.00 2.21 (1.53%)Underwriter spread ($ K) 88.56 445.81 1.24 (0.86%)
Panel B: Tax-exempt muni (N=140,350)
P ($) 103.12 4.70 –V ($) 102.43 4.75 –R ($) 102.61 4.76 –P-R ($) 0.51*** 0.84 3.50 (0.89%)V-R ($) -0.18*** 0.82 -0.41 (-0.10%)P-V ($) 0.69*** 1.01 3.90 (0.99%)Underwriter spread ($ K) 23.70 125.70 3.33 (0.84%)
Panel C: Taxable muni (N=12,148)
P ($) 100.79 1.40 –V ($) 100.16 1.24 –R ($) 100.21 1.14 –P-R ($) 0.59*** 1.00 0.59 (1.21%)V-R ($) -0.04*** 0.69 0.07 (0.14%)P-V ($) 0.63*** 0.89 0.52 (1.07%)Underwriter spread ($ K) 33.55 155.51 0.41 (0.83%)
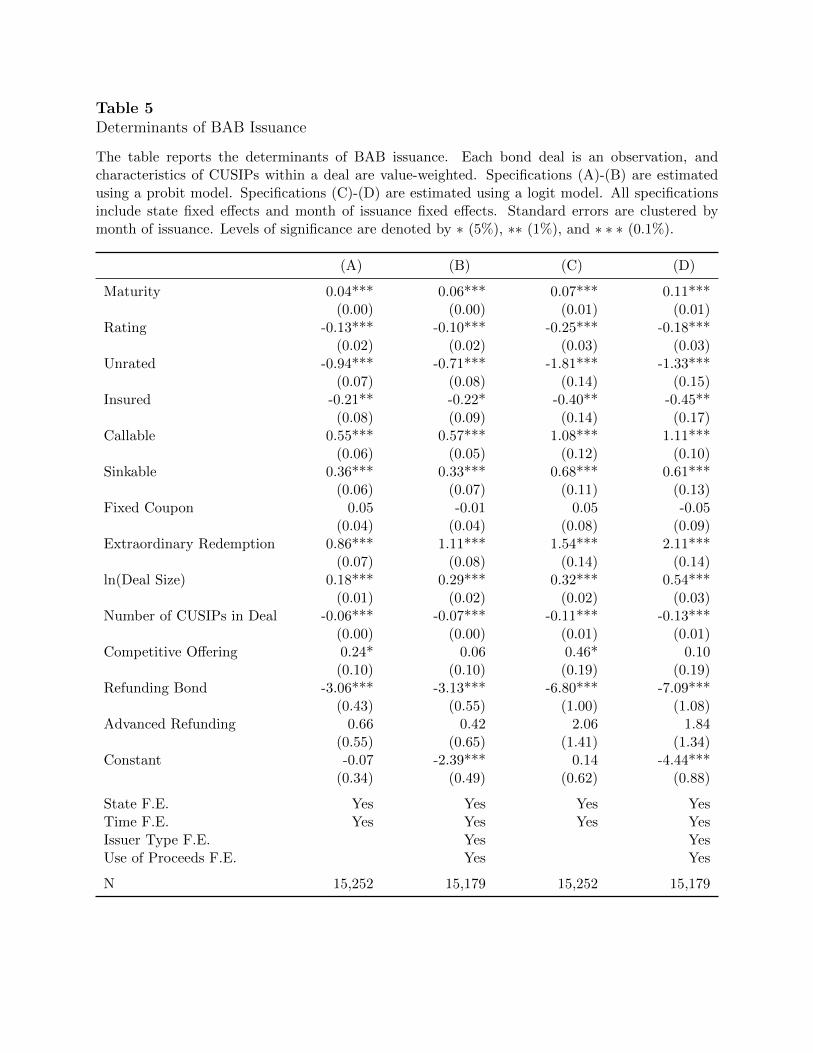
Table 5Determinants of BAB Issuance
The table reports the determinants of BAB issuance. Each bond deal is an observation, andcharacteristics of CUSIPs within a deal are value-weighted. Specifications (A)-(B) are estimatedusing a probit model. Specifications (C)-(D) are estimated using a logit model. All specificationsinclude state fixed effects and month of issuance fixed effects. Standard errors are clustered bymonth of issuance. Levels of significance are denoted by ∗ (5%), ∗∗ (1%), and ∗ ∗ ∗ (0.1%).
(A) (B) (C) (D)
Maturity 0.04*** 0.06*** 0.07*** 0.11***(0.00) (0.00) (0.01) (0.01)
Rating -0.13*** -0.10*** -0.25*** -0.18***(0.02) (0.02) (0.03) (0.03)
Unrated -0.94*** -0.71*** -1.81*** -1.33***(0.07) (0.08) (0.14) (0.15)
Insured -0.21** -0.22* -0.40** -0.45**(0.08) (0.09) (0.14) (0.17)
Callable 0.55*** 0.57*** 1.08*** 1.11***(0.06) (0.05) (0.12) (0.10)
Sinkable 0.36*** 0.33*** 0.68*** 0.61***(0.06) (0.07) (0.11) (0.13)
Fixed Coupon 0.05 -0.01 0.05 -0.05(0.04) (0.04) (0.08) (0.09)
Extraordinary Redemption 0.86*** 1.11*** 1.54*** 2.11***(0.07) (0.08) (0.14) (0.14)
ln(Deal Size) 0.18*** 0.29*** 0.32*** 0.54***(0.01) (0.02) (0.02) (0.03)
Number of CUSIPs in Deal -0.06*** -0.07*** -0.11*** -0.13***(0.00) (0.00) (0.01) (0.01)
Competitive Offering 0.24* 0.06 0.46* 0.10(0.10) (0.10) (0.19) (0.19)
Refunding Bond -3.06*** -3.13*** -6.80*** -7.09***(0.43) (0.55) (1.00) (1.08)
Advanced Refunding 0.66 0.42 2.06 1.84(0.55) (0.65) (1.41) (1.34)
Constant -0.07 -2.39*** 0.14 -4.44***(0.34) (0.49) (0.62) (0.88)
State F.E. Yes Yes Yes YesTime F.E. Yes Yes Yes YesIssuer Type F.E. Yes YesUse of Proceeds F.E. Yes Yes
N 15,252 15,179 15,252 15,179

Table 6Determinants of Interdealer Markups
The table reports the determinants of the markups on interdealer trades. Markups on interdealertrades are constructed as the mean markup over the reoffering price on all interdealer transactionsweighted by the trade par. The dependent variable is scaled by the reoffering price and expressedin basis points. Markups and characteristics are value weighted by bond deal. Specifications (A)-(C) are estimated using OLS. Specification (D) is estimated using a treatment effect model. Allspecifications include state fixed effects and month of issuance fixed effects. Standard errors areclustered by month of issuance. Levels of significance are denoted by ∗ (5%), ∗∗ (1%), and ∗ ∗ ∗(0.1%).
(A) (B) (C) (D)
BAB 47.69*** 32.96*** 28.89*** 32.44***(5.08) (4.20) (4.09) (4.23)
Maturity 0.76* 0.90* 0.85***(0.36) (0.37) (0.15)
Rating -0.10 -0.01 0.05(0.49) (0.49) (0.45)
Unrated -3.14 -2.29 -2.01(2.66) (2.52) (2.20)
Insured 17.59*** 17.73*** 17.87***(3.26) (3.41) (2.35)
Callable -0.75 -0.75 -0.92(1.83) (1.78) (2.00)
Sinkable 2.51 3.68* 3.52*(1.48) (1.60) (1.73)
Fixed Coupon -7.32*** -7.38*** -7.42***(1.60) (1.69) (1.87)
Extraordinary Redemption -1.70 1.02 0.13(2.68) (2.45) (2.61)
ln(Deal Size) 1.54 2.70 2.53***(1.68) (1.56) (0.64)
Number of CUSIPs in Deal -0.95*** -0.95*** -0.91***(0.09) (0.09) (0.12)
Competitive Offering -51.46*** -53.27*** -53.19***(2.21) (2.14) (1.72)
Refunding Bond 4.38 3.76 4.15*(2.62) (2.58) (1.78)
Advanced Refunding -8.29* -9.41* -9.24**(3.93) (3.89) (3.32)
Constant -59.44** -53.96** -69.30** -69.88***(16.15) (16.18) (22.65) (19.14)
State F.E. Yes Yes Yes YesTime F.E. Yes Yes Yes YesIssuer Type F.E. Yes YesUse of Proceeds F.E. Yes Yes
R2 0.160 0.248 0.255 –N 12,058 11,963 11,963 11,963

Table 7Determinants of Investor Markups
The table reports the determinants of markups on investor trades. Markups on investor trades areconstructed as the mean markup over the reoffer price on all transactions not at the reoffer price,weighted by the trade par. The dependent variable is scaled by the reoffer price and expressedin basis points. Underpricing and characteristics are value weighted by bond deal. Specifications(A)-(C) are estimated using OLS. Specification (D) is estimated using a treatment effect model.All specifications include state fixed effects and month of issuance fixed effects. Standard errorsare clustered by month of issuance. Levels of significance are denoted by ∗ (5%), ∗∗ (1%), and ∗∗∗(0.1%).
(A) (B) (C) (D)
BAB 75.39*** 26.15*** 24.65*** 23.14***(7.81) (5.79) (5.70) (3.55)
Maturity 4.96*** 5.08*** 5.10***(0.26) (0.27) (0.14)
Rating 2.31*** 2.03*** 2.01***(0.50) (0.45) (0.41)
Unrated 5.03* 4.65* 4.53*(2.22) (1.98) (2.02)
Insured 17.02*** 16.43*** 16.38***(3.08) (2.98) (2.13)
Callable 14.47*** 14.23*** 14.30***(2.05) (2.01) (1.87)
Sinkable 7.30*** 6.36*** 6.43***(1.51) (1.55) (1.58)
Fixed Coupon -3.94 -3.94 -3.92*(1.98) (2.07) (1.71)
Extraordinary Redemption 3.20 4.15 4.53(2.29) (2.59) (2.37)
ln(Deal Size) 1.56 1.25 1.33*(1.31) (1.34) (0.59)
Number of CUSIPs in Deal 0.20 0.21* 0.20(0.10) (0.10) (0.11)
Competitive Offering -38.53*** -38.81*** -38.84***(1.65) (1.70) (1.59)
Refunding Bond 1.91 1.47 1.29(1.81) (1.92) (1.64)
Advanced Refunding 0.00 -0.08 -0.15(2.93) (3.10) (3.08)
Constant 82.45*** 7.18 0.44 0.65(9.05) (10.74) (12.75) (17.58)
State F.E. Yes Yes Yes YesTime F.E. Yes Yes Yes YesIssuer Type F.E. Yes YesUse of Proceeds F.E. Yes Yes
R2 0.177 0.428 0.434 –N 11,367 11,272 11,272 11,272

Table 8Gross Spread and Underpricing
The dependent variable is the average percentage markup over the reoffering price on all trades ina deal. The independent variable GS is the gross spread, BAB is an indicator for a BAB bond, andthe intervals of months are indicators for the associated subperiod. The sample for columns A-Cpools all deals on tax-exempt municipals and BABs. The sample for columns D-E pools BABs andnon-BAB taxable municipals. Deal size is measured in hundreds of millions. The sample periodfrom 05/2009 to 12/2010 is divided into five equal subperiods of four months each. Standard errorsin parentheses are clustered by month of issuance. Levels of significance are denoted by ∗ (5%), ∗∗(1%), and ∗ ∗ ∗ (0.1%).
(A) (B) (C) (D) (E)
BAB 98.59*** 141.94** 139.52** 72.22 76.44(12.47) (23.47) (23.59) (28.36) (29.38)
GS 0.11 0.50** 0.49** -0.77 -0.75(0.15) (0.11) (0.11) (0.92) (0.92)
BAB × GS -5.19* -1.45 -2.37 2.13(1.73) (2.22) (1.69) (2.90)
BAB × GS × (09–12/2009) -3.34*** -1.35*(0.22) (0.45)
BAB × GS × (01–04/2010) -1.92*** -4.25***(0.11) (0.32)
BAB × GS × (05–08/2010) -3.37*** -5.58***(0.38) (0.14)
BAB × GS × (09–12/2010) -6.34*** -8.19***(0.13) (0.14)
Deal Size 0.01 0.01 0.01 -0.00 -0.00(0.01) (0.01) (0.01) (0.01) (0.01)
No. CUSIPs in Deal 1.16 1.22* 1.23* -0.94 -0.87(0.46) (0.46) (0.46) (0.48) (0.44)
Constant 34.41* 30.03* 14.46 163.72* 121.74*(10.21) (9.97) (12.24) (38.83) (27.39)
State F.E. Yes Yes Yes Yes YesTime F.E. Yes Yes Yes Yes YesIssuer Type F.E. Yes Yes Yes Yes YesUse of Proceeds F.E. Yes Yes Yes Yes Yes
R2 0.295 0.301 0.306 0.282 0.292N 6,151 6,151 6,151 2,208 2,208

Figure 1Evolution of markup over reoffering price by day from initial trading. In each row the plot onthe left describes BABs and the plot on the right tax-exempts. The first row plots cross sectionalaverages of mean markups for all bonds in the sample. The second row includes only bonds withfixed maturity of 20 years. The third row includes only deals where BABs and tax-exempts wereissued simultaneously. The final row provides average markups for all transactions stratified bytrade size.