taxation papers aggressive tax working paper no · pdf file3.3.2 identifying roles in atp...
TRANSCRIPT

TAXATION PAPERS
Taxation and Customs Union
WORKING PAPER No 71 – 2017
IHS (project leader)In consortium with
CPBDONDENA
Aggressive tax planning indicators
Final Report
ISSN 1725-7565 (PDF) ISSN 1725-7557 (Printed)
Taxation Papers are written by the staff of the European Commission’s Directorate-General for Taxation and Customs Union, or by experts working in association with them. Taxation Papers are intended to increase awareness of the work being done by the staff and to seek comments and suggestions for further analyses. These papers often represent preliminary work, circulated to encourage discussion and comment. Citation and use of such a paper should take into account of its provisional character. The views expressed in the Taxation Papers are solely those of the authors and do not necessarily reflect the views of the European Commission.
Comments and inquiries should be addressed to:TAXUD [email protected]
Cover photo made by Milan Pein
Despite all our efforts, we have not yet succeeded in identifying the authors and rights holders for some of the images. If you believe that you may be a rights holder, we invite you to contact the Central Audiovisual Library of the European Commission.
This paper is available in English only.
Europe Direct is a service to help you find answersto your questions about the European UnionFreephone number:
00 800 6 7 8 9 10 11A great deal of additional information on the European Union is available on the Internet.It can be accessed through EUROPA at: http://europa.eu.
For information on EU tax policy visit the European Commission’s website at:http://ec.europa.eu/taxation_customs/taxation/index_en.htm
Do you want to remain informed of EU tax and customs initiatives? Subscribe now to the Commission’s e-mail newsflash at: http://ec.europa.eu/taxation_customs/common/newsflash/index_en.htm
Cataloguing data can be found at the end of this publication.
Luxembourg: Publications Office of the European Union, 2017
doi:10.2778/822243 (printed) doi:10.2778/847061 (PDF)ISBN 978-92-79-75355-8 (printed) ISBN 978-92-79-75356-5 (PDF)
© European Union, 2017Reproduction is authorised provided the source is acknowledged.
PRINTED ON WHITE CHLORINE-FREE PAPER
mmmll
Aggressive tax planning indicators
Final Report
TAXUD/2016/DE/319
FWC No. TAXUD/2015/CC/131 Institute for Advanced Studies (Project leader) Institute for Advanced Studies (Consortium leader) In consortium with CPB DONDENA

European Commission
Aggressive tax planning indicators
2
Preface This report has been prepared for the project “Aggressive tax planning indicators”, Specific Contract No.5 TAXUD/2016/DE/319 implementing the Framework Service Contract No. TAXUD/2015/CC/131 for the provision of economic analysis in the area of taxation.
The following institutions and persons contributed to this project: IHS (project leader) Simon Loretz Richard Sellner Bianca Brandl DONDENA Giampaolo Arachi Valeria Bucci CPB Maarten van't Riet Ali Aouragh The information and views set out in this report are those of the author(s) and do not necessarily reflect the official opinion of the Commission. The Commission does not guarantee the accuracy of the data included in this study. Neither the Commission nor any person acting on the Commission’s behalf may be held responsible for the use which may be made of the information contained therein.
European Commission
Aggressive tax planning indicators
3
Table of contents
Preface ............................................................................................................. 2 Table of contents ............................................................................................... 3 List of tables ..................................................................................................... 5 List of figures .................................................................................................... 6 List of abbreviations ........................................................................................... 7 List of country acronyms .................................................................................... 7 Executive Summary ........................................................................................... 8 Sommaire ........................................................................................................15 1 Introduction ...............................................................................................21
1.1 Background .........................................................................................21 1.2 Objectives ...........................................................................................22
2 Characterising aggressive tax planning ..........................................................23 2.1 Definition and boundaries of aggressive tax planning ................................23 2.2 Main channels and defining features of aggressive tax planning .................24
2.2.1 Income shifting through interest payments ........................................27 2.2.2 Income shifting through royalty payments .........................................30 2.2.3 Strategic transfer pricing .................................................................32
2.3 Use of Member States’ tax rules in aggressive tax planning .......................36 2.4 Use of third countries in aggressive tax planning ......................................37
3 Economic indicators for aggressive tax planning ..............................................39 3.1 General indicators ................................................................................39
3.1.1 General indicators: country level ......................................................39 3.1.2 General indicators: MNE group-level .................................................44
3.2 Specific indicators ................................................................................47 3.2.1 Specific indicators: firm-level ...........................................................47 3.2.2 Specific indicators: country-pair-level ...............................................53
3.3 Combinations of indicators ....................................................................55 3.3.1 Relative tax situation of MNE entities ................................................55 3.3.2 Identifying roles in ATP channels ......................................................56
3.4 Methodological considerations ................................................................61 3.4.1 Aggregation of indicators.................................................................61 3.4.2 Data sources and limitations ............................................................62 3.4.3 Sample period and time consistency of different data sets ...................64
4 Results for EU 28 Member States ..................................................................65 4.1 Distribution of indicators and data at country level ...................................65
4.1.1 Tax rates and revenues ...................................................................65 4.1.2 Foreign direct investment ................................................................68 4.1.3 Geographical distribution of MNEs and relative tax situations ...............73 4.1.4 Consolidated profitability and effective tax burden in MNE groups ........77 4.1.5 ATP-specific indicators at entity level ................................................87 4.1.6 Royalty flows, bilateral import price anomalies and treaty shopping indicators ................................................................................................. 101
4.2 Roles in ATP structures, by Member States ............................................ 111 4.2.1 Roles within ATP via interest payments ........................................... 111 4.2.2 Roles within ATP via royalty payments ............................................ 114 4.2.3 Roles within ATP via strategic transfer pricing .................................. 117
4.3 Overall assessment of exposure and tax base impact of ATP on Member States 119
5 Conclusions .............................................................................................. 128 References..................................................................................................... 131 Technical appendix ......................................................................................... 136

European Commission
Aggressive tax planning indicators
4
A Detailed description of ATP structures .......................................................... 136 A.1. Offshore loan ATP structure ................................................................. 136 A.2. Hybrid loan ATP structures .................................................................. 136 A.3. Hybrid entity ATP structure .................................................................. 138 A.4. Interest free loan ATP structure ........................................................... 138 A.5. Patent box ATP structure ..................................................................... 139 A.6. Further ATP structures using intangible assets ....................................... 140 A.7. ATP structures and tax rules of Member States ...................................... 141
B Overview combination of indicators ............................................................. 144 B.1. Combination of indicators to identify roles in main ATP channels .............. 144 B.2. Combination of indicators to identify roles in all ATP structures ................ 148
C Dealing with complex ownership structures .................................................. 154 D Gravity equation estimates to control for economic factors ............................. 156
D.1. Using gravity equations for FDI estimates ............................................. 156 D.2. Simulation of FDI stocks using a simple gravity approach ........................ 156 D.3. Results gravity equations for geographical distribution of MNE entities and for aggregate FDI stocks ................................................................................... 157
E Appendix Tables ....................................................................................... 159

European Commission
Aggressive tax planning indicators
5
List of tables Table 1: ATP, main mechanisms and corresponding ATP structures .........................25 Table 2: Cost of Capital and Effective Tax Rate in ZEW study (2016) ......................26 Table 3: Summary characteristics ATP via interest payments .................................28 Table 4: Summary characteristics ATP via royalty payments ..................................31 Table 5: Summary characteristics ATP via transfer pricing .....................................35 Table 6: Description of general indicators - country-level .......................................40 Table 7: Description of general indicators - MNE group-level ..................................45 Table 8: Description of specific indicators - firm-level ............................................50 Table 9: Description of specific indicators - country-pair-level ................................54 Table 10: Tax rates and decomposition of corporate tax revenues (2015) ................66 Table 11: Foreign direct investment positions (2015) ............................................70 Table 12: Foreign-controlled corporate activities (2014) ........................................72 Table 13: MNE entities by relative statutory tax rates (2015) .................................74 Table 14: Consolidated ETR (Tax/PLBT), by Member States (2010-2015) ................79 Table 15: Consolidated ETR (Tax/EBIT), by Member States (2010-2015) .................81 Table 16: Consolidated profitability (PLBT/Assets), by Member States (2010-2015) ..84 Table 17: Consolidated profitability (EBIT/Assets), by Member States (2010-2015) ..86 Table 18: Profitability (PLBT/ASSETS), by Member States (2010-2015) ...................88 Table 19: Profitability (EBIT/ASSETS), by Member States (2010-2015) ...................90 Table 20: Profitability (FIN_PL/ASSETS), by Member States (2010-2015) ................92 Table 21: Debt share (% of ASSETS), by Member States (2010-2015) ....................94 Table 22: Interest payments (% of ASSETS), by Member States (2010-2015) .........96 Table 23: Intangible assets (% of ASSETS), by Member States (2010-2015) ...........98 Table 24: Patents granted, by Member States (2010-2015) ................................. 100 Table 25: Royalty flows, by Member States (2010-2015) ..................................... 102 Table 26: Bilateral import price anomalies, by Member States (2010-2015) ........... 105 Table 27: Treaty shopping indicators (2013) ...................................................... 108 Table 28: Roles ATP structures using interest payments, by Member States ........... 112 Table 29: Roles ATP structures using royalty payments, by Member States ............ 115 Table 30: Roles ATP structures using strategic transfer pricing, by Member States .. 118 Table 31: Summary of results: Country-level indicators....................................... 120 Table 32: Summary of results: Consolidated MNE indicators ................................ 122 Table 33: Summary of results: Specific indicators by firm types ........................... 123 Table 34: Summary of results: Bilateral indicators .............................................. 123 Table 35: Summary of results: Combination of indicators – roles within ATP channels .................................................................................................................... 125 Table 36: Overview of indicators and broad assessment ...................................... 127 Table 37: Legal indicators and roles of countries in ATP structures ........................ 142 Table 38: Combination of indicators: ATP via interest payments ........................... 145 Table 39: Combination of indicators: ATP via royalty payments ............................ 146 Table 40: Combination of indicators: ATP via strategic transfer pricing .................. 147 Table 41: Combination of indicators and ATP channels – strict classification ........... 151 Table 42: Combination of indicators and ATP channels –standard classification ....... 152 Table 43: Results gravity estimates .................................................................. 158 Table 44: Comparison FDI stock data ................................................................ 159 Table 45: Ownership structures MNE groups (by ultimate owner) ......................... 160 Table 46: Ownership structures MNE groups (by ultimate owner) continued ........... 161 Table 47: Ownership structures MNE groups (by direct owner) ............................. 162 Table 48: Ownership structures MNE groups (by direct owner) continued .............. 163 Table 49: Statutory corporate tax rates Europe and low tax countries ................... 164 Table 50: Statutory corporate tax rates Africa, Americas, Caribbean countries ....... 165 Table 51: Statutory corporate tax rates Asian, Australia and Oceania countries ...... 166 Table 52: Tax rates in Patent boxes (2015) ....................................................... 167

European Commission
Aggressive tax planning indicators
6
Table 53: Country grouping for comparison groups (part1) .................................. 168 Table 54: Country grouping for comparison groups (part2) .................................. 169 Table 55: Country grouping for comparison groups (part3) .................................. 170 Table 56: Number of observations with consolidated accounts by MNE status ......... 171 Table 57: Number of observations in dataset by relative tax rate status ................ 172 Table 58: Profitability (PLBT/EMP), by Member States (2010-2015) ...................... 173 Table 59: Profitability (EBIT/EMP), by Member States (2010-2015) ...................... 174 Table 60: Financial Profitability (FIN_PL/EMP), by Member States (2010-2015) ...... 175 Table 61: Number of observations in dataset, by Member States (2010-2015) ....... 176 Table 62: Roles ATP structures using interest payments, by Member States ........... 177 Table 63: Roles hybrid loan ATP structure, by Member States .............................. 178 Table 64: Roles transfer pricing ATP structure, by Member States......................... 179 Table 65: Roles intellectual property ATP structure, by Member States .................. 180 Table 66: Roles in patent box ATP structure, by Member States ........................... 181
List of figures Figure 1: Boundaries of ATP definition .................................................................23 Figure 2: ATP structures - Tax planning via interest payments ...............................28 Figure 3: ATP structures – Tax planning via royalty payments ................................31 Figure 4: ATP structure - Strategic transfer pricing ...............................................33 Figure 5: Decomposition of corporate tax revenues ...............................................67 Figure 6: Corporate tax rates (2015) and MNE entities by relative tax rates .............75 Figure 7: Distribution of consolidated ETRs by MNE status (2010-2015) ..................78 Figure 8: Distribution of profitability by MNE status (2010-2015) ............................83 Figure 9: Roles by Member States within ATP channel via interest payments.......... 113 Figure 10: Roles by Member States within ATP channel via royalty payments ......... 116 Figure 11: Roles by Member States within ATP channel via transfer pricing ............ 117 Figure 12: Offshore loan ATP structure .............................................................. 136 Figure 13: Hybrid loan ATP structure (ZEW study) .............................................. 137 Figure 14: Hybrid loan ATP structure (ATP study) ............................................... 137 Figure 15: Hybrid entity ATP structure .............................................................. 138 Figure 16: Interest free loan ATP structure ........................................................ 139 Figure 17: Patent box ATP structures (ATP study) ............................................... 139 Figure 18: Two-tiered intellectual property ATP structure..................................... 140 Figure 19: Cost contribution agreements ATP structure ....................................... 141 Figure 20: Example ownership structure ............................................................ 155

European Commission
Aggressive tax planning indicators
7
List of abbreviations
ATP Aggressive tax planning BEPS Base Erosion and Profit Shifting CCCTB Common Consolidated Corporate Tax Base CFC Controlled Foreign Company CI Corporate income CIT Corporate income tax CoC Cost of capital EATR Effective average tax rate EBIT Earnings before interest and taxation EBOPS Extended Balance of Payments Services ETR Effective tax rate EU European Union FATS Foreign affiliate statistics FDI Foreign direct investment FIN_PL Financial profit/losses GDP Gross domestic product IP Intellectual property MNE Multinational enterprise MS Member State PLBT Profit and loss before taxation OP Operating profit SBS Structural Business Survey SPE Special purpose entity ZEW Zentrum für Europäische Wirtschaftsforschung (Centre for European
Economic Research)
List of country acronyms
Member State Acronym Member State Acronym Austria AT Italy IT Belgium BE Latvia LV Bulgaria BG Lithuania LT Croatia HR Luxembourg LU Cyprus CY Malta MT Czech Republic CZ Netherlands NL Denmark DK Poland PL Estonia EE Portugal PT Finland FI Romania RO France FR Slovakia SK Germany DE Slovenia SI Greece EL Spain ES Hungary HU Sweden SE Ireland IE United Kingdom UK

European Commission
Aggressive tax planning indicators
8
Abstract
The aim of this study is to provide economic evidence of the relevance of aggressive tax planning (ATP) structures for all EU Member States. The study relies on economic indicators available at macro-level and on indicators derived from firm-level data. The objective is indeed to look at the relevance of ATP for all Member States through these two complementary angles. For each indicator, the study identifies outliers based on a consistent methodology. None of the indicators provides per se an irrefutable causality towards aggressive tax planning. However, considered together, the set of indicators shall be seen as a "body of evidence". While there are some data limitation, the study provides a broad picture of which Member States appear to be exposed to ATP structures, and how it impacts on their tax base (erosion or increase).
The discussed ATP structures can be grouped into three main channels: i) ATP via interest payments, ii) ATP via royalty payments and iii) ATP via strategic transfer pricing. In addition to general indicators assessing the overall exposure to ATP, we also derive specific indicators for each of the ATP channels. In combination, these indicators allow to classify entities within multinational enterprises (MNEs) into three types: i) target entities, where the tax base is reduced ii) the lower tax entities where the tax base is increased but taxed at a lower rate, and iii) conduit entities which are in a group with ATP activities but no clear effect on the tax base is observable.
Résumé
Le but de la présente étude est de fournir des éléments de preuve économique sur l’importance des structures de planification fiscale agressive (PFA) pour tous les Etats Membres de l’UE. L’étude utilise des indicateurs disponibles au niveau macroéconomique et des indicateurs dérivés de données à l’échelle des entreprises. L’objectif est ainsi de considérer l’importance de la PFA pour tous les Etats Membres à travers ces deux angles complémentaires. Pour chaque indicateur, l’étude identifie des valeurs anormales sur la base d’une méthodologie uniforme. Aucun des indicateurs en soi ne permet d’établir une causalité irréfutable quant à la présence de planification fiscale agressive. Cependant, pris dans leur ensemble, ces indicateurs sont à voir comme des ‘éléments de preuves’. Malgré le caractère limité de certaines données, l’étude fournit une vue d’ensemble sur les Etats Membres qui apparaissent exposés aux structures de PFA, et sur leur impact sur les bases d’imposition (érosion ou croissance).
Les structures de PFA qui sont considérées peuvent être regroupées en trois canaux principaux: i) PFA à travers le paiement d’intérêts; ii) PFA à travers le paiement de royalties; et iii) PFA par une stratégie de prix de transferts. Outre les indicateurs généraux évaluant l’exposition d’ensemble à la PFA, nous définissons des indicateurs spécifiques pour chacun des canaux de PFA. Par combinaisons, ces indicateurs permettent de classifier les entités faisant partie d’entreprises multinationales en trois types: i) entités cibles, dont la base d’imposition est réduite; ii) entités plus faiblement taxées, dont la base d’imposition est augmentée et taxée à un taux faible; et iii) entités relais, qui font partie d’un groupe multinational pratiquant la PFA sans que des effets clairs sur la base d’imposition soient observables.

European Commission
Aggressive tax planning indicators
9

European Commission
Aggressive tax planning indicators
10
Executive Summary
The international corporate tax system aims to tax the profits of multinational enterprises (MNE) where they arise. However, MNEs have in some instances exploited mismatches and loopholes in the international tax framework to reduce their overall tax burden. This entails substantial problems, such as revenue losses, unfair competitive advantages or lower tax morale. Therefore, the Commission has made it a priority to fight aggressive tax planning (ATP).
The aim of this study is to provide country-level indicators which potentially identify the relevance of ATP structures for all EU Member States, based on economic elements. This study builds on two previous studies by Ramboll and Corit (2015) and ZEW (2016) where typical ATP structures were identified and examined. These studies focused respectively on the tax rules (or absence thereof) that facilitate ATP, and the impact of ATP on the theoretical effective tax burdens. They did however not encompass any economic analysis based on observed empirical facts. The main objective of this study will therefore be to complement existing studies with empirical economic effects.
We focus on the economic substance of the ATP structures, identified in the Ramboll and Corit (2015) and ZEW (2016) studies and group them into three ATP channels.
ATP via interest payments
ATP via royalty payments
ATP via strategic transfer pricing
For each of these three ATP channels, we identify relevant economic measures which we link to publicly available data. We define a set of general indicators which can be indicative of exposure and general impact of ATP and a set of specific indicators which potentially yield information about a specific ATP channel. These indicators are used in two ways. First, we look at country-level distributions of these indicators to highlight the possible overall exposure and impact of ATP for each Member State. Secondly, we combine the specific indicators to clarify which "type" of entity within MNE groups is likely to be present in a country, according to the following three categories:
Target entity (firm within a MNE group, where the tax base is reduced)
Lower tax entity (firm within a MNE group, where the tax base is increased and taxed at a lower rate)
Conduit entity (firm within a MNE group, which seemingly engages in ATP, but where the tax base is not necessarily significantly affected) The label "conduit entity" may have a broader meaning than is generally understood in tax literature as it does not only encompass entities through which income flows transit.
The analysis of the relative prevalence of these three types of entities across Member States complements the results from the country-level distribution of the indicators.
The derived indicators can be grouped into four categories:

European Commission
Aggressive tax planning indicators
11
Country-level and bilateral indicators (Corporate tax rates and revenues, foreign direct investment and market structure, royalty flows, bilateral import prices and treaty shopping indicators)
MNE group-level indicators (MNE geographical structure and relative tax burden, consolidated tax burden and profitability)
Firm-level indicators by firm types (Specific indicators such as profitability, debt shares, interest payments, intangible assets, patent applications by relative tax rate situation)
Combination of firm-level indicators (Shares of firms classified as target, lower tax or conduit entities)
Methodology, data and caveats:
The study relies on indicators available at macro-level and on indicators derived from firm-level data. The objective is indeed to look at the relevance of ATP for all Member States through these two complementary angles. For each indicator, the study identifies outliers based on a consistent methodology (with thresholds based on standard deviations away from the mean). However, there are some clear data limitations, notably in terms of availability and quality, which affect the choice of the indicators and the interpretation of the results. The data limitations are particularly true for firm-level indicators. Furthermore, some indicators are clearly influenced by other factors (e.g. general economic conditions) than ATP and none of the indicators provides therefore per se an irrefutable causality towards aggressive tax planning. Rather, considered together, the set of indicators shall be seen as a "body of evidence" that are consistent with the possible existence of an ATP structure. Being an outlier country for one (or several) indicators does therefore not suggest that the country is without any doubt used by MNEs in ATP structures. Instead, it indicates that such structure potentially exists. Another important limitation of the study is the impossibility to obtain reliable information to identify permanent establishments.
Corporate tax rate and revenues:
The statutory corporate tax burden varies substantially between the Member States, which implies scope for ATP practices. The corporate tax revenues only partly reflect the differences in the statutory rates and the data show that some small Member States like Cyprus, Malta and Luxembourg are able to raise more corporate tax revenues relative to their GDP than others. The decomposition of the corporate tax revenues into size, profitability and implicit tax burden of the corporate sector, reveals that some countries, in particular Ireland, seem able to attract substantial tax base. In other Member States, a profitability of the corporate sector well below the EU average, could indicate an erosion of the tax base owing to ATP, although other factors may of course be at play. Profitability of the corporate sector is found to be particularly low in France, Croatia, Slovenia and the United Kingdom.
Foreign direct investment (FDI) and market structure:
The FDI stocks measured as a percentage of GDP shed some light on the importance of MNE activities in the Member States and therefore can give a broad impression whether a Member State is potentially exposed to ATP. In some countries, extraordinarily high values could indicate that substantial ATP activities take place. Both inward and outward FDI stocks are several times higher than GDP in Cyprus,

European Commission
Aggressive tax planning indicators
12
Ireland, Luxembourg, Malta and the Netherlands. Together with Hungary, those countries have actual FDI stocks significantly above those predicted by our gravity model. These large numbers are primarily due to FDI through special purpose entities (SPEs), which could also be an indication of ATP through the use of SPEs.
Large market shares of large corporations suggest that some Member States like Germany or the United Kingdom are more vulnerable to ATP because of high concentration among the corporate tax payers. The extraordinarily high share of foreign-controlled firms in Estonia and Luxembourg might possibly reflect some tax driven behaviour. Equally, the high share of gross operating surplus in foreign-controlled firms in Ireland, Hungary, Luxembourg and Romania can also be consistent with a high profitability of the corporate sector in these countries, which could in turn indicate ATP.
Royalty flows:
The country-level information of royalty payments and receipts draws a very clear picture. Ireland stands out as the Member State with the highest net royalty payments (as a percentage of GDP), which is consistent with a potential ATP channel using royalty payments. Other Member States with significant royalty inflows and outflows (and positive net outflows) are Luxembourg, Malta and the Netherlands. Sweden, Finland, Denmark and the United Kingdom have the highest net royalty receipts.
Bilateral import prices:
The analysis of bilateral import price anomalies shows that larger, and often higher tax countries, such as Germany and France tend to have more inexplicably high import prices than low ones. This might be an indication of transfer mispricing that erodes tax bases in those countries. Spain, the United Kingdom, the Netherlands and Italy also have a relatively high number of price anomalies, which suggests that strategic transfer pricing strategies could affect the base in these countries.
Treaty shopping indicators:
The treaty shopping indicators identify some countries like the United Kingdom, Luxembourg, Estonia and the Netherlands as central on dividend repatriation routes. Overall, treaty shopping is of particular relevance for repatriation from outside the EU.
MNE geographical structure and relative tax burden:
In several European countries (Belgium, Germany, Hungary, Luxembourg and Italy) all MNE entities have at least one subsidiary in a country with a lower tax burden. This indicates that these Member States are potentially more vulnerable to ATP. Being exposed to ATP does however not necessarily mean that a country's tax base is eroded. It can also be an indication that the country's tax rules are being used to shift profits but with limited direct impact on the tax base. In comparison, in Bulgaria, Cyprus, Ireland, Lithuania and Latvia, i.e. the countries identified among those having the lowest statutory tax rates, the MNE entities are in most cases the lowest tax entities. This could indicate that these Member States are more likely to benefit from ATP structures shifting tax base into these entities. Furthermore, looking at the share of MNE entities which are in MNE groups with a presence in a zero/no corporate tax country, the Netherlands, France, Ireland, the United Kingdom, Bulgaria and Latvia

European Commission
Aggressive tax planning indicators
13
stand out with the strongest links which may be an indication that these countries are more exposed to ATP, albeit in different ways.
Consolidated effective tax rates (ETR) and profitability:
The comparison of the consolidated ETRs finds a clearly higher ETR for MNEs than for domestic companies, which is at odds with the expectation of MNEs being able to reduce their tax burden through ATP. That said, looking at the profitability measures one can clearly see that MNE groups have a substantially higher operating profitability than domestic firms. In contrast, the consolidated pre-tax profitability of MNEs is comparable to the one of the domestic firms. This reflects the ability of MNE groups to reduce their tax base through financial losses (or other extraordinary deductions). The analysis of consolidated account does at the same time not reveal clear patterns across Member States.
ATP-Specific indicators at entity level:
The study looks a set of indicators (such as profitability, debt shares, interest payments, intangible assets, patent applications) which are relevant to understand which ATP structures may be more prevalent in a given Member State. These indicators are provided per Member State and for three types of entities: domestic companies, MNE entities located in relatively higher tax countries, and MNE entities located in relatively lower tax countries. Those indicators show patterns which are generally consistent with at least some ATP taking place. For 25 out of 28 Member States, we see a higher pre-tax profitability in MNE entities located in countries with a relatively low statutory tax burden. A similar picture for operating profitability indicates the importance of ATP structures using royalty payments or strategic transfer pricing. In a majority of countries, on average, MNE entities post financial losses. However, we see on average financial profits for the MNE entities in some Member States, including the Netherlands, Sweden, Austria and Denmark. This may suggest that some MNE groups relocate corporate tax base to their entities in these Member States via ATP structures using interest payments. The result of lower debt shares in lower tax MNE entities is broadly in line with the predictions of the ATP via interest payments which sees debt being allocated in higher tax entities. For a subset of companies where we can match patent ownership information we see a concentration of patent holdings in countries with patent boxes, most notable France, Belgium and the Netherlands, as well as Germany (that does not have a patent box).
Roles in ATP structures:
The study aims at identifying for each of the three ATP channels what is the function (if any) of a given entity in a given Member State. The objective was to confirm with firm-level information some pattern that emerges from macro-data. However, limited data availability means that the results need to be interpreted with caution. Furthermore, the statutory corporate tax rate of a country plays an important role in the classification, thereby possible over/under-stating the relevance of ATP.
The analysis of roles within the three different ATP channels find consistently that MNE entities in France, Belgium and Malta are most often classified as target entities. While this could partly be driven by the high tax rate in these Member States, this can also

European Commission
Aggressive tax planning indicators
14
reflect that relative profitability in these MNE groups could be consistent with ATP taking place. The countries with the largest share of lower tax entities are consistently Bulgaria, Poland, Slovenia, Hungary and Latvia, which again may be driven by the low tax rates. Additionally, we find a large share of conduit entities in Hungary, the Netherlands, Ireland, the United Kingdom and Austria. This indicates that these Member States are likely to be more exposed to ATP. Since our definition of conduit entities implies that at least one entity of the MNE group is classified as a target entity, the classification as a conduit entity may also partly reflect incomplete information about lower/no tax entities outside the EU.
For the ATP channel using interest payments the number of entities classified as target or lower tax entities is only moderate. This is partly driven by the combination of data quality and requirements for the classification in the types of entities. In comparison, for the ATP channel using royalty payments we are able to classify a larger share of the MNE entities into roles within the ATP structures. This partly reflects better data quality for operating profitability in comparison to the financial profitability, but also confirms that the distribution of intangible assets at the firm level is broadly consistent with ATP via royalty payments. The analysis of the role in strategic transfer pricing ATP channel, finds for three quarters of the MNE groups that the firm-level distribution of pre-tax profitability and operating profitability is consistent with tax-motivated relocation of profits in some part of the MNE group.

European Commission
Aggressive tax planning indicators
15
Sommaire
Le cadre de la fiscalité internationale des entreprises vise à l'imposition des profits des entreprises multinationales là où ils sont générés. Cependant, les entreprises multinationales ont exploité dans certains cas les écarts et les lacunes du cadre fiscal international pour réduire leur charge fiscale globale. Des problèmes substantiels s’ensuivent, tels que pertes de revenu fiscaux, avantage compétitif déloyal ou diminution de la morale fiscale. La Commission européenne a par conséquent fait de la lutte contre la planification fiscale agressive (abrégé par la suite en PFA) une priorité.
Le but de la présente étude est de fournir des indicateurs à l’échelon national qui identifient potentiellement l’importance des structures de PFA pour tous les Etats Membres de l’Union européenne, en se basant sur des éléments de nature économique. Cette étude s’appuie sur deux études précédentes, l’une par Ramboll et Corit (2015) et l’autre par ZEW (2016), où les structures types de planification fiscale agressive sont identifiées et examinées. Ces études mettent respectivement l’accent sur les règles fiscales (ou leur absence) facilitant la PFA et sur l’impact de la PFA sur les charges fiscales effectives théoriques. Ni l’une ni l’autre ne comprennent toutefois d’analyse économique basée sur des observations empiriques. L’objectif principal de la présente étude est donc d’apporter ce complément, à l’aide d’analyses de données économiques empiriques.
Nous nous concentrons sur les structures de planification fiscale agressive identifiées par les études de Ramboll et Corit (2015) et ZEW (2016), que nous regroupons en trois canaux:
PFA à travers le paiement d’intérêts
PFA à travers le paiement de royalties
PFA par une stratégie de prix de transferts
Pour chacun de ces trois canaux, nous identifions les indicateurs économiques pertinents et les mettons en lien avec des données publiquement disponibles. Nous définissons ainsi un ensemble d’indicateurs généraux qui peuvent mettre en lumière une possible exposition à la PFA et les impacts globaux, ainsi qu’un ensemble d’indicateurs spécifiques qui peuvent fournir des informations sur les canaux de PFA. Ces indicateurs sont utilisés de deux manières. Premièrement, nous considérons la distribution par pays de chacun de ces indicateurs afin de révéler l'exposition potentielle et l’impact potentiel de la PFA dans chacun des Etats Membres. Deuxièmement, nous combinons des indicateurs spécifiques afin d’identifier et de classifier les types d’entités de groupes multinationaux dont la présence dans l’une des trois catégories suivantes est probable:
Entité cible (entreprise d’un groupe multinational dont la base d’imposition est réduite)
Entité plus faiblement taxée (entreprise d’un groupe multinational dont la base d’imposition est augmentée et taxée à un taux faible)
Entité relais (entreprise d’un groupe multinational semblant impliquée dans la PFA mais dont la base d’imposition n’est pas affectée de manière sensible; au-delà de la compréhension courante de la littérature sur la fiscalité, l'entité relais couvre d’autres entités que celles où des flux de revenus transitent)
European Commission
Aggressive tax planning indicators
16
L’analyse de la prévalence de ces trois types d’entités dans chacun des Etats Membres complète les résultats issus de la distribution des indicateurs par pays. Les indicateurs définis pour les besoins des analyses peuvent être regroupés en quatre catégories :
Indicateurs nationaux et bilatéraux (Taux et revenus des impôts sur les sociétés, investissements directs étrangers et structure du marché, flux de royalties, prix des importations et indicateurs de « chalandage fiscal »)
Indicateurs au niveau des groupes multinationaux (Structure géographique des groupes multinationaux et charge fiscale relative, charge fiscale consolidée et rentabilité)
Indicateurs par types d’entreprises (Indicateurs spécifiques tels que rentabilité, distribution de l’endettement, paiement d’intérêts, immobilisations incorporelles, dépôts de brevets en fonction de la situation fiscale relative des entités)
Combinaison d’indicateurs de niveau entreprise (Proportion d’entreprises classifiées comme cible, plus faiblement taxée ou relais)
Méthodologie, données et réserves :
L’étude exploite aussi bien des indicateurs de niveau macroéconomique que des indicateurs à l’échelle des entreprises. L’objectif est en effet de considérer l’importance de la planification fiscale agressive pour tous les Etats Membres à travers ces deux angles complémentaires. Pour chaque indicateur, l’étude identifie des valeurs anormales sur la base d’une méthodologie uniforme (à l’aide de seuils basés sur les écarts types par rapport à la moyenne). Cependant, le caractère limité des données, notamment en termes de disponibilité et de qualité, affecte le choix des indicateurs et l’interprétation des résultats. Les limitations dues aux données sont particulièrement vraies pour les indicateurs à l’échelle des entreprises. De plus, certains indicateurs étant clairement influencés par d’autres facteurs (p.ex. les conditions économiques générales) que la PFA, aucun des indicateurs en soi ne permet d’établir une causalité irréfutable quant à la présence de planification fiscale agressive. Par contre, pris dans leur ensemble, ces indicateurs sont à voir comme des ‘éléments de preuves’ qui correspondent à l’existence possible de structures de PFA. Être identifié comme un cas particulier ("outlier") pour un ou plusieurs indicateurs n'indique ainsi pas qu'un pays est utilisé sans doute aucun par les multinationales pour des activités de PFA. Il s’agit plutôt de signaler l’existence possible de telles structures. Une autre limitation importante de cette étude est l’impossibilité d’obtenir des informations fiables qui permettent d’identifier les établissements stables.
Taux et revenus des impôts sur les sociétés :
Le taux d’imposition légal sur les sociétés varie de manière substantielle d’un Etat Membre à l’autre, ouvrant la porte à des pratiques de planification fiscale agressive. Les revenus de l’impôt sur les sociétés ne reflètent que partiellement les différences de taux nominaux et les données montrent que certains Etats Membres de taille plus modeste, comme Chypre, Malte ou le Luxembourg, sont capables de générer plus de revenus de l’impôt sur les sociétés par rapport à leur PIB que d’autres. La décomposition des revenus de l’impôt sur les sociétés selon la taille, la rentabilité et la charge fiscale implicite des entreprises révèle que certains pays, en particulier

European Commission
Aggressive tax planning indicators
17
l’Irlande, semblent capables d’attirer une base fiscale considérable. Dans d'autres Etats Membres, une rentabilité des entreprises bien inférieure à la moyenne de l’Union européenne pourrait révéler une érosion de la base fiscale qui soit due à la PFA, même si d’autres facteurs peuvent bien entendu entrer en jeu. La rentabilité du secteur privé se trouve être ainsi particulièrement basse en France, en Croatie, en Slovénie et au Royaume-Uni.
Investissements directs étrangers (IDE) et structure du marché :
Les stocks d’IDE, mesurés en pourcentage du PIB, donnent une certaine vision de l’importance des activités des groupes multinationaux dans les Etats Membres et peuvent ainsi donner une impression générale de l’exposition d’un Etat Membre aux pratiques de PFA. Dans certains pays, des valeurs extraordinairement élevées pourraient potentiellement révéler une pratique substantielle de PFA. Aussi bien les stocks d’IDE depuis l’étranger que les stocks d’IDE vers l’étranger ont des valeurs qui sont plusieurs fois supérieures au PIB à Chypre, en Irlande, au Luxembourg, à Malte et aux Pays-Bas. Les stocks d’IDE observés dans ces pays et en Hongrie sont largement supérieurs aux stocks théoriques calculés à l'aide de notre modèle gravitationnel. Ces valeurs élevées sont principalement dues aux IDE réalisés par l’intermédiaire d’entités ad-hoc spécialisées, ce qui pourrait signaler la réalisation de PFA à l’aide de ces entités.
Des secteurs fortement concentrés, avec donc des grandes entreprises qui ont de fortes parts de marché, suggèrent que certains Etats Membres, comme l’Allemagne et le Royaume Uni, sont plus vulnérables à l’ATP; les revenus de l’impôt sur les sociétés étant très concentrés sur certaines entreprises contribuables. La proportion extraordinairement élevée d’entreprises contrôlées par des multinationales étrangères en Estonie et au Luxembourg pourrait refléter des comportements motivés par le système fiscal. Par ailleurs, le niveau élevé des excédents bruts d'exploitation des entreprises contrôlées par des multinationales étrangères en Irlande, en Hongrie, au Luxembourg et en Roumanie peut également coïncider avec une grande rentabilité du secteur privé dans ces pays, ce qui pourrait signaler des pratiques de PFA.
Flux de royalties :
Les informations disponibles à l’échelon national sur les paiements et la réception de royalties fournissent une image très claire. L’Irlande se démarque comme l’Etat Membre au volume de paiement net de royalties le plus élevé (en pourcentage du PIB), ce qui est potentiellement cohérent avec des pratiques de PFA utilisant ces royalties. Les autres Etats Membres à volume de royalties entrants et sortants significatifs (pour un volume net sortant) sont le Luxembourg, Malte et les Pays-Bas, tandis que la Suède, la Finlande, le Danemark et le Royaume-Uni ont les volumes nets de royalties entrants les plus élevés.
Prix des importations :
L’analyse des anomalies de prix des importations et exportations révèle que des pays de grande taille et à haut niveau d’imposition, comme l’Allemagne et la France, sont plus souvent confrontés à des prix d’importation inexplicablement élevés que confrontés à des prix bas. Cette observation peut être une indication de manipulation des prix de transferts destinés à réduire la base fiscale dans ces pays. L’Espagne, le Royaume-Uni, les Pays-Bas et l’Italie sont également confrontés à un nombre

European Commission
Aggressive tax planning indicators
18
relativement élevé d’anomalies de prix, ce qui suggère que des stratégies de prix de transferts pourraient affecter la base fiscale de ces pays.
Indicateurs de chalandage fiscal :
Les indicateurs de chalandage fiscal identifient quelques pays, comme le Royaume-Uni, le Luxembourg, l’Estonie et les Pays-Bas, comme étant centraux sur les parcours de rapatriement des dividendes. Dans l’ensemble, le chalandage fiscal apparait comme particulièrement important pour le rapatriement des dividendes venant de pays situés hors de l’UE.
Structure géographique des groupes multinationaux et charge fiscale relative :
Dans plusieurs pays Européens (la Belgique, l’Allemagne, la Hongrie, le Luxembourg et l’Italie), tous les groupes multinationaux disposent d’au moins une filiale dans un pays où la charge fiscale est plus basse. Cela peut révéler une plus grande vulnérabilité de ces Etats Membres aux pratiques de PFA. Être exposé à la PFA ne veut cependant pas dire que la base fiscale du pays est réduite. Cela peut aussi être une indication que les règles fiscales sont utilisées pour déplacer des profits, tout en ayant un impact direct limité sur la base fiscale. En comparaison, en Bulgarie, à Chypre, en Irlande, en Lituanie et en Lettonie, c’est-à-dire dans les pays caractérisés par les taux d’impositions nominaux parmi les plus bas, les entités des groupes multinationaux sont dans la plupart des cas les entités les plus faiblement taxées. Cela pourrait révéler le fait que ces Etats Membres ont une plus grande chance de bénéficier des structures de PFA qui déplacent les bases fiscales des multinationales dans ces entités faiblement taxées. De plus, si on considère la proportion d'entités qui font partie d’un groupe multinational qui est présent dans des pays sans impôts sur les sociétés (ou avec un taux nul), les Pays-Bas, la France, l’Irlande, le Royaume-Uni, la Bulgarie et la Lettonie se démarquent par leur grand nombre de liens, ce qui peut être une indication que ces pays sont exposés de manière plus forte à la PFA, de façons toutefois différentes.
Taux d’imposition effectifs (TIE) consolidés et rentabilité :
La comparaison des TIE consolidés mène à un TIE clairement plus élevé pour les entreprises multinationales que pour les entreprises dont l'activité est nationale, contrairement aux attentes qu’il est possible d’avoir, les groupes multinationaux ayant en théorie moyen de réduire leur charge fiscale par des pratiques de PFA. Cependant, les mesures de rentabilité montrent que les groupes multinationaux ont une rentabilité opérationnelle qui est plus élevée que celle des entreprises dont l'activité est purement nationale et ceci de manière substantielle. Par contraste, la rentabilité consolidée avant impôt des groupes multinationaux est comparable à celle des entreprises dont l'activité est purement nationale. Cela reflète la capacité des groupes multinationaux à réduire leur base fiscale à l’aide de pertes financières (ou autres déductions extraordinaires). L’analyse des comptes consolidés ne révèle toutefois pas de différences systématiques d’un Etat Membre à l’autre.
Indicateurs spécifiques à la PFA au niveau des entités :
L’étude considère un ensemble d’indicateurs (tels que rentabilité, distribution de l’endettement, paiement d’intérêts, immobilisations incorporelles, dépôts de brevets)

European Commission
Aggressive tax planning indicators
19
qui sont pertinents pour comprendre quelles structures de PFA sont les plus présentes pour un Etat Membre donné. Ces indicateurs sont produits pour chaque Etat Membre et pour chacun des trois types d’entités suivants: entreprises dont les activités sont uniquement nationales; entités multinationales situées dans des pays à charge fiscale relativement plus élevée; et entités multinationales situées dans des pays à charge fiscale relativement plus faible. Ces indicateurs révèlent des configurations qui en général peuvent permettre de mettre en évidence une certaine activité de PFA. Pour 25 des 28 Etats Membres on constate une rentabilité avant impôt plus élevée dans les entités multinationales qui se situent dans des pays dont les taux d’impositions nominaux sont comparativement plus faibles. Une configuration similaire pour la rentabilité opérationnelle montre l’importance des structures de PFA qui utilisent les paiements de royalties ou les stratégies de prix de transferts. Dans la majorité des pays, en moyenne, les entités multinationales affichent des pertes financières. Cependant, des profits financiers sont en moyenne visibles pour les entités multinationales dans quelques Etats Membres, incluant les Pays-Bas, la Suède, l’Autriche et le Danemark. Cela peut suggérer que certains groupes multinationaux déplacent leur base d’imposition dans leurs entités qui se trouvent dans ces Etats Membres, à l’aide de structures de PFA basées sur les paiements d’intérêts. L'observation d’une part d’endettement plus faible des entités multinationales plus faiblement taxées correspond dans l’ensemble aux prédictions de structures de PFA basées sur les paiements d’intérêts qui allouent la dette aux entités taxées plus fortement. Pour la partie des entreprises où il est possible d’exploiter les informations sur les propriétaires de brevets se voit une concentration de la détention des brevets dans les pays où existent des régimes fiscaux favorables aux brevets (boîtes à brevets ou patent boxes), surtout en France, en Belgique et aux Pays-Bas, ainsi qu’en Allemagne (qui n’a pas de régime fiscal spécifique favorable aux brevets).
Rôles dans les structures de PFA :
Pour chacun des trois canaux de PFA, l’étude vise à identifier la fonction (si tant est qu'elle existe) d’une entité donnée dans un Etat Membre donné. L’objectif est de confirmer avec des données empiriques à l’échelle des entreprises certaines observations qui émergent des données à l’échelle macroéconomique. Toutefois, la disponibilité limitée de certaines données invite à la prudence dans l’interprétation des résultats. De plus, le taux d’imposition nominal sur les sociétés d’un pays joue un rôle important dans la classification, ce qui peut ainsi soit surestimer soit sous-estimer l’importance de la PFA.
L’analyse des rôles pour chacun des trois canaux de PFA montre de manière récurrente que les entités multinationales situées en France, en Belgique et à Malte sont le plus souvent des entités cibles. Bien que ce résultat puisse en partie être dû aux taux d’imposition élevés de ces pays, le résultat peut également refléter une rentabilité des entités relatives à leur groupe multinational qui correspondrait à des pratiques de PFA. Les pays comprenant la part d’entités plus faiblement taxées la plus large sont de manière récurrente la Bulgarie, la Pologne, la Slovénie, la Hongrie et la Lettonie, ce qui là aussi peut être la conséquence de taux d’imposition faibles. Par ailleurs, nous observons une grande part d’entités relais en Hongrie, aux Pays-Bas, en Irlande, au Royaume-Uni et en Autriche. Cette observation indique une plus grande probabilité pour ces pays d’être exposés aux pratiques de PFA. Etant donné que notre

European Commission
Aggressive tax planning indicators
20
définition des entités relais implique au minimum une entité cible dans le même groupe multinational, la classification comme entité relais pourrait en partie refléter un manque d’information sur les entités faiblement ou non taxées situées en dehors de l’UE.
Pour le canal de PFA basé sur le paiement d’intérêts, le nombre d’entités classées comme des entités cibles ou des entités plus faiblement taxées est faible. Cet état de fait est en partie dû à une combinaison de problèmes de qualité des données avec le besoin des données nécessaire à une classification dans l’une des deux catégories. En comparaison, pour le canal de PFA basé sur les paiements de royalties, il est possible de classifier un plus grand nombre d’entités multinationales dans des rôles au sein des structures de PFA. Cette observation reflète en partie une meilleure qualité des données sur la rentabilité opérationnelle que sur la rentabilité financière, mais confirme également le fait que la distribution des immobilisations incorporelles au niveau des entreprises peut correspondre dans l’ensemble à des pratiques de PFA à base de paiements de royalties. L’analyse des rôles dans le canal de PFA à base de prix de transferts identifie dans trois quarts des groupes multinationaux, à l’échelle des entreprises, une distribution de la rentabilité avant impôts et une distribution de la rentabilité opérationnelle qui sont possiblement cohérents avec un déplacement de profits au sein du groupe motivé par des considérations fiscales.

European Commission
Aggressive tax planning indicators
21
1 Introduction
1.1 Background
The notion that corporations, in line with all other taxpayers, should pay their fair amount of taxes is widely shared. At the same time, it is also evident that especially Multinational Enterprises (MNEs) have more opportunities to reduce their corporate tax burden. Under the term aggressive tax planning (ATP), defined as “taking advantage of the technicalities of a tax system or of mismatches between two or more tax systems” the European Commission (2012) subsumes the excessive use of the opportunities to reduce the corporate tax burden. Widespread aggressive tax planning implies fewer revenues for countries and leads to unfair contributions by some taxpayers, thereby reducing tax morale and creating distortions of competition between companies.
These issues are increasingly recognised in the policy debate and the Commission has made it a priority to fight tax avoidance. Actions taken include the June 2015 Action Plan for a fair and efficient corporate tax system in the EU, the automatic exchange of information on tax rulings and advance pricing arrangements as well as of country-by-country reports, and the adoption of the Anti-Tax Avoidance Directives. The relaunch of the Common Consolidated Corporate Tax Base (CCCTB) further contributes towards the achievement of the goal of a fairer and simpler tax system for MNEs. Furthermore, in the context of the European Semester, the importance of fighting tax abuse has been repeatedly stressed, and a number of country reports have highlighted the risk that some Member States’ tax rules might be used in ATP schemes. There is also a much broader international policy debate, with initiatives like the Base Erosion and Profit Shifting (BEPS) of the G20/OECD.
A solid understanding of the extent and channels of ATP is fundamental to draw policy conclusion and recommendations for the fight against unfair tax practices. To this end the European Commission (DG TAXUD) has commissioned a study on Structures of Aggressive Tax Planning and Indicators (Ramboll Management Consulting & Corit Advisory (2015)), hereafter the “ATP study”. The ATP study provides a legal analysis of common ATP structures. The objectives of the study were threefold: (i) identification of model ATP structures; (ii) identification of ATP factors (i.e. critical tax rules and practices that facilitate or allow ATP); and (iii) individual assessment of the prevalence of such factors across Member States. Concretely, the study identifies seven legal structures that are most commonly used by MNEs that engage in ATP. These are: (1) Offshore loan ATP structure, (2) Hybrid loan ATP structure, (3) Hybrid entity ATP structure, (4) Interest-free loan ATP structure, (5) Patent box ATP structure, (6) Two-tiered IP ATP structure, and (7) ATP structure based on IP and cost contribution agreement.
A subsequent study by ZEW (2016), hereafter the “ZEW study”, uses three of the basic mechanisms of the ATP structures and calculates the effective tax burdens for hypothetical cross-border investment projects of MNEs in the European Union and the United States.1 This allows to theoretically quantify the potential tax savings of the 1 The two structures "offshore loan ATP structure" and "hybrid loan structure" of the ATP study are combined in an ATP channel labelled "profit shifting via interest payments".

European Commission
Aggressive tax planning indicators
22
different tax planning strategies. Both studies allow assessing all Member States in a consistent manner and enable the identification of those tax rules, which could - potentially- be used in aggressive tax planning structures.
Both the ATP study and the ZEW study focus on a subset of national tax rules and practices and exclude issues such as international rules regarding the allocation of taxing rights.
1.2 Objectives
The overarching objective of this study is to complement the existing legal evidence base and theoretical considerations about ATP in the EU Member States with economic substance. The ATP study enhances the understanding of how countries’ tax rules can be used in ATP schemes and which Member States have tax rules which are most vulnerable to be used in ATP. The ZEW study uses the tax law provisions and calculates theoretical effective tax burdens incorporating ATP structures. Both studies focus on the possibilities of ATP but do not encompass any economic analysis based on observed empirical facts. The main objective of this study will be to substantiate the legal analysis of the ATP study and the results of the theoretical effective tax burdens in the ZEW study with economic evidence.
The economic importance of tax avoidance has been addressed in several recent studies (e.g. OECD, 2015 and the European Commission 2015b).2 However, examining the relevance of ATP in all EU Member States thanks to a set of comparable indicators largely remains an unresolved issue. Hence, the main objective of the study is to assess which Member States’ tax rules are effectively being used in ATP structures. Since ATP structures involve at least two countries, the Member States’ tax rules can be used in different ways in these structures. Therefore, another key aim of this study is to identify how Member States’ tax rules are used within ATP structures. Building on this information, this study furthermore has the goal to have a broad assessment as to whether Member States seem to gain or lose corporate tax base through these tax practices.
2 The terms aggressive tax planning and tax avoidance both describe behaviour against the spirit of the law to reduce the tax liability and therefore may be used interchangeably for the purpose of this report.

European Commission
Aggressive tax planning indicators
23
2 Characterising aggressive tax planning
Active management of the tax affairs by (multinational) corporations does not in itself result in aggressive tax planning. A number of Member States have actually implemented tax provisions which allow firms to lower their overall tax burden if they change their behaviour in the desired way (e.g. invest more in qualifying R&D expenditure). To separate these aspects from aggressive tax planning, this section first clarifies the boundaries of ATP used for this report. Based on this definition, we describe the main channels of tax planning and how model ATP structures relate to them. Subsequently, we illustrate in which different ways the tax systems of the Member States can be used within the various ATP structures. Finally, we outline the potentially important role of third country jurisdictions.
2.1 Definition and boundaries of aggressive tax planning
In line with the ATP study (2015, p. 23), we start with the definition of the European Commission (2012), which describes aggressive tax planning as “taking advantage of the technicalities of a tax system or of mismatches between two or more tax systems for the purpose of reducing tax liability.”
While it is theoretically possible to draw a line between acceptable tax planning and aggressive tax planning, the boundaries will in reality be somewhat blurred.
Figure 1 presents some firm behaviour on a continuum of tax aggressiveness. The continuum ranges from activities, which are clearly in the spirit of the law e.g. claiming tax credits or using loss carry forwards etc., to behaviour which is clearly illegal, i.e. tax evasion.
Figure 1: Boundaries of ATP definition
Source: own illustration
The bracket in Figure 1 highlights the boundaries of ATP for the purpose of this study, i.e. behaviour of MNEs, which substantially reduces their tax burden and runs against the spirit of the law. Such a definition still aims to exclude tax planning by domestic or standalone companies and tax reductions, which are clearly intended by the policy makers. Furthermore, in line with the ATP study, it excludes all illegal measures to lower the tax burden.
The use of a continuum in Figure 1 highlights the difficulties of defining sharp boundaries of ATP. This also implies that several of the indicators will partly include non-aggressive tax planning and their outcome. Since we rely on publicly available

European Commission
Aggressive tax planning indicators
24
information and are not always able to fully identify the underlying causes of reallocations or reductions of the corporate tax base, the proposed indicators are most likely to partly include non-ATP behaviour. That said, the current analysis provides a partial analysis of ATP, since we are necessarily excluding relevant issues in international taxation (e.g. lack of reliable coverage of permanent establishments in publicly available information), due to data constraints. In this light, the results of the study should be interpreted with some caution.
2.2 Main channels and defining features of aggressive tax planning
The empirical economic literature identifies different channels used by MNEs to lower their corporate tax burden. A recent survey by Heckemeyer and Overesch (2017), identifies two main strategies: i) the use of both internal and external debt and ii) the use of transfer pricing and licensing of intellectual property.3 Overesch (2016) distinguishes along the same line, but also separates the relocation of intellectual property and the corresponding use of royalty payments from general strategic transfer pricing. Additionally, Overesch (2016) discusses tax reducing repatriation strategies as a part of tax planning by MNEs. The restructuring of the corporate group in order to benefit from bilateral tax treaties is also discussed under the term treaty shopping.4 Furthermore, the tax law literature has a stronger focus on more complicated ATP structures, and also stresses the importance of hybrid structures. The European Commission (2012) and consequently the ATP study also refer to this channel as “mismatch” highlighting that the same transaction or entity is legally treated differently in two countries.
We group the channels into three broad categories based on the main mechanism at work. Broadly following the logic of the ZEW study, Table 1 summarises the relation between the three ATP channels and the specific ATP structures.5
3 Dharmapala (2014) reviews similar empirical evidence with a focus on the BEPS initiative and has a much stronger focus on profit shifting. 4 See also Avi-Yonah and Panayi (2010) for a discussion about treaty shopping. 5 We present the main ATP channels and examples of specific ATP structures in the main text and refer interested readers to the more detailed description in the Appendix A.

European Commission
Aggressive tax planning indicators
25
Table 1: ATP, main mechanisms and corresponding ATP structures
ATP channel Economic mechanisms at work
Corresponding ATP structures
ATP study ZEW study
Tax planning via interest payments
Interest costs are deducted in target entity and not taxed/taxed at zero rate in offshore entity
Offshore loan Financing via Offshore
Interest costs are deducted in target entity and taxed at a lower rate in lower tax entity
n.a. Financing via Average a
Interest costs are deducted in target entity and treated as dividend income (and exempted) in other entity
Hybrid loan Hybrid financing via Offshore /Average
Interest costs are deducted in target entity, while interest cancels out because target entity is transparent for other entity
Hybrid entity n.a.
Deemed interest costs are deducted in target entity, while no interest is paid/received by other entities
Interest-free loan n.a.
Tax planning via royalty payments
Royalty costs are deducted in target entity and not taxed/taxed at zero rate in offshore entity
n.a. IP tax planning via Offshore
Royalty costs are deducted in target entity and taxed at a reduced rate in patent box entity
Patent box IP tax planning via IP-box countries
Royalty costs are deducted in target entity and taxed at a reduced rate in lower tax entity
n.a. IP tax planning via Average a
Royalty costs are deducted in target entity and royalty income is not taxed in receiving entity which is legal but not tax resident
Two-tiered IP n.a.
Royalty costs are deducted in target entity, and income arises in tax free entity
IP and cost contribution agreement
n.a.
Strategic transfer pricing of goods and services
Prices for intra-firm transactions are distorted to increase profits in lower tax entity at the expense of higher tax entities
n.a. n.a.
Notes: a The ZEW study uses the average rates as a technical assumption. But without a lower tax rate the mechanism of this ATP channel does not deliver tax benefits. See also the higher average tax burden under this channel in Table 2.
Source: Own considerations based on ZEW study (2016) and ATP study (2015)
The ATP channel based on income shifting through interest payments is at the heart of several ATP structures presented in the ATP study and the ZEW study. The most obvious ATP structures falling into this category are the offshore loan ATP structure and the corresponding financing via offshore/average structures. Additionally, we include the hybrid loan ATP structures, the hybrid entity ATP structure and the interest free loan ATP structure in the income shifting through interest payments channel. The main reason is that the tax base in the target entity is reduced via the interest deduction. In contrast to the offshore/average loan ATP structures the

European Commission
Aggressive tax planning indicators
26
interest payments are not received in a lower or no tax country. Due to a legal mismatch of the treatment of the interest payment in the receiving entity, the financial flow is exempted from taxation.
The ATP channel based on the income shifting through royalty payments have in common that the tax base in the target entity is reduced through a deduction of royalty costs. The tax saving in most ATP structures using this channel results from lower taxation of the royalty payments in the receiving lower tax entity. This lower tax burden on the royalty received is either due to a generally lower corporate tax rate or to a specific regime benefitting income from intellectual property (a patent box).
The ATP channel of using strategic transfer pricing of goods and services for internal transactions is not directly presented in any of the specific ATP structures in the ATP or the ZEW study. By mispricing internal transactions, corporate tax base is reallocated to jurisdictions where lower taxes are levied.
Finally, it is worth noting that treaty shopping is not included as separate ATP channel in this study. Under the term treaty shopping, we subsume the diverting of dividend flows with the aim to reduce/eliminate the tax burden on the repatriation of the profits. Nevertheless, treaty shopping may remain an important part of offshore ATP structures since the repatriation of profits from non-Member States may still be subject to withholding taxation.
Before discussing the different channels in more detail Table 2 summarises the main findings regarding the impact of profit shifting on the Cost of Capital (CoC) and the Effective Average Tax Rate (EATR) of the ZEW study (2016).
Table 2: Cost of Capital and Effective Tax Rate in ZEW study (2016)
Mean CoC Mean EATR
Baseline 5.7 21.1
Profit shifting via interest payments
Financing via ‘offshore treaty’ 4.1 16.2 Financing via ‘offshore no treaty’ 6.0 36.4 Financing via ‘EU average’ 5.8 21.6 Hybrid financing via ‘EU average’ 3.8 14.3
Profit shifting via royalty payments
IP via ‘offshore treaty’ only intangible 4.7 2.0 all assets 5.5 17.5
IP via ‘offshore no treaty’
only intangible 11.4 40.7 all assets 6.9 25.2
IP via ‘EU average’ only intangible 5.1 18.2 all assets 5.6 20.7
IP via ‘most beneficial IP regime in EU’
only intangible 2.3 -0.9 all assets 5.1 16.9
Source: ZEW study (2016)
The results in Table 2 show a strong reduction in the average CoC and EATR for both channels. At the same time, the reduction only materialises if the tax planning is done through a country with a lower tax burden and a tax treaty in force.

European Commission
Aggressive tax planning indicators
27
2.2.1 Income shifting through interest payments
The fact that interest costs are usually deductible from the tax base, allows for an internal financing structure, to reallocate corporate income to a lower tax jurisdiction. The European Commission (2015b) refers to the meta-analysis of Heckemeyer and Overesch (2013), which attributes up to one third of the observed profit shifting to the debt shifting channel.6 Using a combined empirical framework, Loretz and Mokkas (2015) find the debt channel being dominant for their subsample of European firms. The importance of debt financing to reduce the corporate tax burden is well known and several countries have already established legal measures to reduce aggressive tax planning using this channel such as e.g. interest limitation rules.7 For example, Büttner and Wamser (2013) investigate the role of internal debt in tax planning for Germany MNEs, and find that the CFC rules have successfully reduced the extent of tax revenue losses for Germany.8
Figure 2 depicts an ATP structure relying on the financing via an offshore loan.9 An offshore subsidiary is set up in country B (with lower or no corporate taxation) and financed by the parent company in Member State A. The money is lent on to the target subsidiary in Member State C, which pays interest in turn. The interest payments are deductible from the profits in the target entity and thereby reduce the tax burden there. The interest income is taxable in the offshore subsidiary, but since the tax rate in this country is zero (or significantly lower), the overall tax burden is reduced.
On the right-hand side of Figure 2 we identify the main characteristics we can observe in the different entities of the MNE engaged in ATP structure based on interest payments. Additionally, Table 3 summarises the information and links the characteristics to the indicators in Section 3.
6 The revised version of the paper (Heckemeyer and Overesch, forthcoming, p. 18f) finds “[…] a share of profit shifting that can be attributed to non-financial shifting mechanisms of at least two-third or above”. 7 The anti-avoidance directive (Council directive (EU) 2016/1164) also provides for CFC rules in Article 7 and interest limitation rules. 8 They conclude that “the upper limit for the implied tax-elasticity of reported profits due to profit shifting is around 0.11 percent” (Büttner and Wamser, 2013, p. 84) compared to estimates of 1.3 to 2 in the previous literature. However, Büttner et al. (2012) find that CFC rules have resulted in a shift towards external debt. 9 This builds on the financing via offshore structre in the ZEW study and shares the main characteristics with the offshore loan ATP structure in the ATP study. See also the Appendix A for a detailed description.

European Commission
Aggressive tax planning indicators
28
Figure 2: ATP structures - Tax planning via interest payments
Source: Own illustration based on ZEW study (2016) and ATP study (2015)
Table 3: Summary characteristics ATP via interest payments
Level of information
MNE Group - Headquarter country
Offshore Company – Lower Tax country
Subsidiary – Target country
MNE group level
[5b] Ownership structure: at least one subsidiary in a lower tax country
[6a] Consolidated ETR is lower than the statutory tax rate in the headquarter country [6b] Gap between consolidated pre-tax profitability and consolidated operating profitability
Country level [5a] No binding/effective CFC rules
[1a] No / zero CIT rate / lower CIT rate
Subsidiary level
[7a] [7b] Higher pre-tax profitability
[7a] [7b] Lower pre-tax profitability
[9a] [9b] Higher financial profitability
[9a] [9b] Lower financial profitability
[10a] [10b] Lower interest payments
[10a] [10b] Higher interest payments
[11a] [11b] Lower debt share
[11a] [11b] Higher debt share
Notes: The numbers in squared brackets refer to the indicators as described in Section 3.
Source: Own consideration based on ZEW study (2016) and ATP study (2015)
Successful ATP strategies should be reflected in a lower consolidated tax burden for the MNE group overall. One obvious candidate for the measurement of this feature is a lower effective tax rate (ETR) observed in the consolidated accounts of the MNE. When comparing the consolidated ETRs of MNEs to similar domestic corporations, the use of ATP structures should be reflected in a significantly lower tax burden. As empirical approach to compare MNEs and domestic companies, we can

European Commission
Aggressive tax planning indicators
29
follow the logic of Egger et al. (2010) and match on observable characteristics.10 However, there are number of other reasons for lower effective tax burden, so the reverse conclusion that a lower effective tax burden is always due to ATP is not generally possible. Furthermore, the expectation of a lower consolidated ETR builds on the assumption that the ATP structures primarily affect the tax liabilities but leave the tax base unchanged. In contrast, if the ATP structure reduces the corporate tax base, we will not necessarily see a difference in the effective tax burden, but rather see a difference in the pre-tax profitability. Hence, an alternative indicator of successful ATP structures is a larger gap between operating profitability and pre-tax profitability in the consolidated MNE accounts.11
The second characteristic for the headquarter entity originates directly from legal analysis in the ATP study. The financing via offshore loan ATP structure demand that the headquarter country has no (binding and effective) CFC rules. Most of the ATP channels include an intra-firm transaction, which results in the taxable income being transferred to a zero or lower tax country. If the headquarter country has binding CFC rules, these ATP channels are closed down by including the foreign income in the headquarters tax base. Hence for the offshore financing ATP structure and for most of the other ATP structures a headquarter country not imposing CFC rules is a pre-requisite.
The next key feature of the financing via offshore loan ATP structure is the fact that the MNE group has a subsidiary in a zero/lower tax country. All ATP channels designed to relocate the tax base to a country with no respectively a significantly lower tax burden require that at least one of the MNE subsidiaries is located in such a country. The use of financial transactions to relocate the corporate tax base to the zero/lower tax country will be reflected in a higher (financial) profitability in the offshore entity.
The relocation of the tax base via the financial transaction is also evident through a lower (financial) profitability in the target entity. This indirectly reflects the deduction of the interest payments. Likewise, we should see a higher debt share and higher interest payments. These characteristics of the target entity hold true also for the ATP structures using hybrid instruments and for the interest-free loan ATP structure. All these ATP structures have the deduction of interest payments and the corresponding lower (financial) profitability in the target entity in common. The differences to the offshore loan ATP structure lie in the mismatch in the legal treatment in the receiving entity. See Appendix A for a more detailed description of the mechanisms in ATP structures based on hybrid instruments and mismatches.
10 Egger et al. (2010) use a propensity score matching approach, which identifies the likelihood of a firm becoming a MNE. The comparison between MNE and domestic firms which were originally equally likely to become an MNE then allows separating the self-selection effect from the effect of being a MNE. 11 Economic theory and empirical tests (e.g. Maffini and Mokkas, 2011) suggest that more profitable firms select to become MNE groups. Therefore, the consolidated profitability measures are not used as indicators for the identification of roles of entities.

European Commission
Aggressive tax planning indicators
30
2.2.2 Income shifting through royalty payments
Early empirical evidence for the link between intangible assets and tax planning has been established by Grubert and Slemrod (1998), who show that intangible assets are a key determinant for investment and profit shifting between US and Puerto Rico. Similarly, Grubert (2003) finds that R&D intensive subsidiaries engage in a greater volume of intercompany transactions, which is seen as indirect evidence for tax planning. More directly Desai et al. (2006) show that R&D intensive firms are more likely to use tax havens, and Grubert and Mutti (2009) highlight that check-the-box rules in the US have fostered the setup of hybrid entities to move intangible assets to lower tax jurisdictions. Lipsey (2010) even starts from the assumption that intangible assets are by nature not bound to a jurisdiction and as a result the final reported location is mainly due to legal and tax reasons. Using European data, Dischinger and Riedel (2011) find a significant negative tax effect on the location of intangible assets within MNEs.
More recent contributions shift their focus from the broader concept of intangibles, to the location of intellectual property, specifically patents. Starting with Karkinsky and Riedel (2012), the analyses build on firm-level data linked to the information from the European patent office. Karkinsky and Riedel (2012) find a negative effect of corporate taxes on the location of patent holdings within MNEs, while at the same time a strong tendency towards holding the patent at the headquarter is observed. The negative effect of corporate taxation on the holding of patent is also found in Ernst and Spengel (2011) and Griffith et al. (2014). The latter are also taking into account a quality measure of the patents. The strong negative impact of taxation on the quality rather the simple quantity of patent applications is central to the studies of Ernst et al. (2014) and Böhm et al. (2015).
Yet another angle of the impact of taxation on the patenting activities of firms is investigated in Evers et al. (2015) and Alstadsæter et al. (2015) who particularly focus on the role of patent boxes. While Evers et al. (2015) calculate the effective tax reduction offered because of the various patent box regimes, Alstadsæter et al. (2015) are the first to comprehensively investigate the impact of the patent boxes on the location of patents.
The fast-growing literature on the impact of corporate taxation on the location of intangible assets and the recent focus on patent boxes already indicate that intangible assets and the related royalty payments may be used in aggressive tax planning strategies. Figure 3 describes an ATP structure which uses royalty payments.12 Central to the ATP structure using royalty payments is the lower tax rate on royalties received in country B. In combination with the tax deduction of the royalties paid by the subsidiary in country C, this significantly lowers the overall tax burden of the MNE. Country B in Figure 3 can represent two types of countries. When we refer to a patent box country, the lower tax burden on the royalty income in country B is the result of a reduced tax rate for royalty income in a patent box. Alternatively, if we refer to a no/zero or lower income tax rate country, country B taxes all types of income at a
12 This reflects the mechanism of the patent box ATP structures presented in the ZEW study, while the corresponding ATP structures from the ATP study are once again described in the Appendix A.

European Commission
Aggressive tax planning indicators
31
lower rate. The right-hand side of Figure 3 again identifies the main features of the ATP channel using royalty payments and Table 4 summarises the link to the indicators of the next section.
Figure 3: ATP structures – Tax planning via royalty payments
Source: Own illustration based on ZEW study (2016)
Table 4: Summary characteristics ATP via royalty payments
Level of information
MNE Group - Headquarter country
Offshore Company – Lower Tax country
Subsidiary – Target country
MNE group level
[5b] Ownership structure: at least one subsidiary in a lower tax country
[5d] Ownership structure: at least one subsidiary in a patent box country
[6a] Consolidated ETR is lower than the statutory tax rate in the headquarter country
Country level [5a] No binding/effective CFC rules
[1a] No / zero CIT rate
[1b] Patent box in place
Subsidiary level
[7a] [7b] Higher pre-tax profitability
[7a] [7b] Lower pre-tax profitability
[8a] [8b] Higher operating profitability
[8a] [8b] Lower operating profitability
[12a] [12b] More intangible assets
[10a] [10b] Less intangible assets
[13a] [13b] More patents granted
[11a] [11b] Less patents granted
Country-pair level [15] Royalty inflow [15] Royalty outflow
Notes: The numbers in squared brackets refer to the indicators as described in Section 3.
Source: Own consideration based on ZEW study (2016) and ATP study (2015)
For the headquarter country and the MNE group overall, the features are similar to the other ATP structures. First, the lack of a binding CFC rule ensures that profits taxed in

European Commission
Aggressive tax planning indicators
32
a lower tax jurisdiction are not included in the tax base of the headquarter. Secondly, the use of an ATP structure should be reflected in a lower consolidated tax burden for the MNE. A pre-requisite for the patent box ATP structure is a subsidiary in a country which offers lower rates through a patent box. In the lower tax entity we should see more patents/intangible assets and a higher (operating) profitability. In line with the ATP structure using interest payments, we expect a higher pre-tax profitability in the lower tax entity. Due to the different ATP channel, the higher profitability should also be present in the operating profitability, while the financial profits are not affected.
The target entity in Member State C is characterised through a lower (operating) profitability. The deduction of the royalty costs result in a lower operating profit as well as in a lower profit and loss before taxation. Again, in contrast to the offshore loan ATP structure the financial profits are not affected through the patent box ATP channel. Finally, it is worth noting that instead of relocating the royalty bearing intangible assets into a country which offers lower rates through a patent box, it is also possible to achieve the overall tax savings by using a zero tax/lower tax country. Since the zero tax countries are outside the EU, the lack of a binding CFC rule and the ability to repatriate the dividends without additional repatriation taxes become more relevant.
2.2.3 Strategic transfer pricing
The strategic pricing of intra-firm cross-border transactions can be one of the most direct channels of tax planning.13 MNEs are able to relocate their profits by over-pricing exports from subsidiaries in lower tax jurisdictions or under-pricing imports in high tax jurisdiction. This general principle applies to all intra-company transactions including payments for the use of intangibles assets or debt payments. However, because of low data availability for these categories, we specifically focus in this subsection on the mispricing of intra-firm sales of goods.
Early empirical evidence about the economic importance of strategic transfer pricing is mostly dealing with transactions between US-based MNEs and their tax haven affiliates. While early papers provide indirect evidence by looking at differences in profitability, Clausing (2003) is the first to use firm-level export data to compare prices of intra-firm transactions to the prices of arms-length transactions.14 She finds that intra-firm import prices change by 1.8 percent as a reaction of a one percent change in the tax rate. This finding is in line with Bernard et al. (2006) who use a more sophisticated approach, and find that, while prices of intra-firm trade are significantly below arms-length transactions, they differ according to the tax rate of the subsidiary country. The overall tax loss for the US Treasury is estimated to be 4.8 billion US dollars.15 There is also evidence for European countries. Bartelsman and Beetsma (2003) use industry level data for OECD countries and find the very strong 13 Most MNE groups are at least to some extent vertically integrated and sell intermediate inputs to other entities within the MNE group. In consequence, no further structure needs to be set up to use this channel of ATP. 14 See Hines (1997) for a survey of early empirical papers on profit shifting by US MNEs. 15 This is much lower than the estimate of Pak and Zdanowicz (2002) who simply compare the unit prices of good across destinations and find an estimated tax loss of 53.1 billion US dollar for 2001.

European Commission
Aggressive tax planning indicators
33
result that up to 65 percent of additional tax revenues following a corporate tax increase may be lost through transfer pricing. In contrast, using firm-level trade data from French firms, Davies et al. (2015) find that only a small number of firms (about 7% of multinationals) engages into transfer pricing, via exports to at most ten countries, and is responsible for a tax revenue loss of up to 1 percent of the total French corporate tax revenues. Based on a less precise identification strategy, Vicard (2015) finds that strategic transfer prices translate into a loss of French corporate tax base of around 8 billion US dollar.16
Figure 4 describes the mechanism of the strategic transfer pricing ATP structure and Table 5 links the characteristics to the indicators of Section 3.
Figure 4: ATP structure - Strategic transfer pricing
Source: Own illustration
The pre-requisite for this ATP channel is the presence of a subsidiary in a country with a zero or lower corporate tax rate. This lower tax entity then is engaged in intra-firm sales to a subsidiary, i.e. the target entity, in a country with a higher tax rate.
By strategically mispricing this intra-firm transaction, corporate tax base is relocated from the target entity in the higher tax country to the lower tax entity in the zero/lower tax country. The prices will be set artificially high for imports from zero/lower tax countries or artificially low for imports from the target entity. This results in a higher operating profitability in the zero/lower tax entity and a lower operating profitability in the target entity. These features are similar with the patent box ATP structure. However, in contrast to the ATP channel using royalty payments,
16 Specifically, Vicard (2015) assumes that all transactions to a country where the MNE has a subsidiary are intra-firm and thereby the study is likely to overestimate the extent of intra-firm transactions.

European Commission
Aggressive tax planning indicators
34
we see no abnormal distribution of patent of intangible assets, but only distorted import prices.

European Commission
Aggressive tax planning indicators
35
Table 5: Summary characteristics ATP via transfer pricing
Level of information
MNE Group - Headquarter country
Offshore Company – Lower Tax country
Subsidiary – Target country
MNE group level
[5b] Ownership structure: at least one subsidiary in a lower tax country
[6a] Consolidated ETR is lower than the statutory tax rate in the headquarter country
Country level [5a] No binding/effective CFC rules
[1a] No / zero CIT rate / lower CIT rate
Subsidiary level
[7a] [7b] Higher pre-tax profitability
[7a] [7b] Lower pre-tax profitability
[8a] [8b] Higher operating profitability
[8a] [8b] Lower operating profitability
Country-pair level [14] Import price anomalies
Notes: The numbers in squared brackets refer to the indicators as described in Section 3.
Source: Own consideration
In line with the other ATP structures which relocate the corporate tax base to a zero/lower tax entity, it is important for the MNE group to be able to repatriate the profits without additional taxation. To highlight the importance of international repatriation strategies, we include separate indicators for treaty shopping. The international corporate tax environment can be seen as a network of jurisdictions. MNEs can exploit differences in the national tax codes and bilateral tax treaties in several ways, among them the practice of tax treaty shopping. This involves MNE’s funneling investment through a third country, rather than investing directly in a host country, to take advantage of treaty provisions not found between the host and the home country of the investment. More than one conduit country can be involved in such tax minimizing routes. This ATP practice leads to a tax revenue loss for national governments.
The literature on treaty shopping has so far mainly considered its effect on FDI, and then direct evidence is scarce. Weyzig (2013) makes use of micro data of Dutch Special Purpose Entities (SPE’s) from 2007. By relating these flows to the direct FDI flows from the Balance of Payment statistics, he finds structural FDI diversion via the Netherlands. Weichenrieder and Mintz (2010) construct for German multinationals in 2001 the chains of corporate structures across various countries and relate these to the underlying fiscal motives. The level of withholding taxes is found to be important in determining, which countries are used as investment platforms in repatriation strategies.
Van’t Riet and Lejour (2014) apply a network analysis to investigate worldwide treaty shopping. They find that the potential reduction of dividend repatriation taxes for MNE’s by using tax minimizing routes is on average six percentage points.
MNE’s respond to the tax parameters of the international system set by the Members States and other national governments. These parameters are the rates of the corporate income tax and withholding taxes as well as double tax relief methods. In addition, countries engage in signing bilateral tax treaties with reduced rates and sometimes preferential double tax relief. The entirety of the tax parameters of an

European Commission
Aggressive tax planning indicators
36
individual country determines its role in the international corporate tax system and its potential for accommodating tax treaty shopping, i.e. the role of a conduit country. Van’t Riet and Lejour (2014) identify potential conduit countries with a measure that captures centrality in the international tax network.
This network analysis focuses on dividend repatriation routes, which seek to minimise taxation on dividend payments. Such tax planning can be combined with strategic location of intangible assets and intellectual property or debt shifting. The network analysis however takes the host country taxation of corporate income as given, while royalty payments or interest payments typically reduce this tax base, and hence is not suited to address the interaction. The use of interest or royalty payments is covered by two separate model ATP structures, discussed above.
2.3 Use of Member States’ tax rules in aggressive tax planning
From the above described ATP structures, we can identify different roles the entity located in the Member States can take. We distinguish four different roles. First there is the role of the headquarter. This role is mostly characterised through the fact that the headquarter country has no binding and effective CFC rules. Furthermore, the tax rules applicable in the headquarter country also affect the tax treatment of repatriated profits, which in turn affects the relevance of tax treaty shopping strategies. E.g. if the headquarter country has only signed few tax treaties, rerouting of dividend flows can be a tax optimal strategy. Per definition, we only treat the country of the global ultimate owner as the headquarter country. This implies that we do not consider intermediate owners as headquarters, i.e. we do not classify companies owned by other corporate owners as headquarter entities. Consequently, only one country per MNE group can be identified as a headquarter country.
The role of a headquarter differs from the other roles because it is the only role which is not exclusive. We allow for the headquarter entities to also take the other roles with the same criteria applicable than for other entities within the MNE group. This reflects that there is nothing to prevent from the situation that the headquarter country is also gaining or losing corporate tax base. On the contrary, once the ATP structures are reduced to their bare minimum, it is often the case that, there are just two entities in two countries involved. In consequence, the country where the headquarter is located is then either the target country or the lower tax country.
A Member State can be identified as the target country. For the purpose of this study, we define the target country as the country losing corporate tax base as a result of the ATP structures. There are two different ways to lose corporate tax base. First, there is a deduction which reduces the taxable profits and second there is the non-inclusion of taxable income. In most of the ATP structures considered in this study, both aspects play a role. However, treating both countries as target countries would result in double-counting in most instances.17 Therefore, we treat an entity as a
17 Consider for example the offshore loan ATP structure as depicted in Figure 3. The target entity in Member State C sees a reduction of the corporate tax base because of the deduction of the interest costs. In the headquarter entity in Member State A, this tax base is not included because the CFC rules are not binding. Treating this entity as target entity as well, would result in counting one transaction twice.

European Commission
Aggressive tax planning indicators
37
target entity, only if it sees a reduction in corporate tax base because of a deduction directly related to the ATP channel.
The lower tax country hosts lower tax entities, which are defined as entities that attract corporate tax base through the ATP structures. Here it is necessary to draw a distinction between a typical zero/no corporate tax country, which is a country that is not taxing corporate profits at all, and a lower tax country. Since there is no Member State with a corporate income tax rate of zero the zero/no tax countries are per definition always third countries. Whether a country can be used in the role of a lower tax country is even less trivial. Being a lower tax country does not only depend on the characteristics of the country itself, but also on the group structure of the MNE. For example, a subsidiary in Ireland (12.5 % corporate tax rate) may take the role of a lower tax entity if parts of the MNE are located in Austria (25 % corporate tax rate). At the same time, if the MNE is in addition to the Irish subsidiary only located in Bulgaria (10 % corporate tax rate), the entity in Ireland does not qualify as a lower tax entity. To operationalise this, we take a 5-percentage point difference to a higher tax country within the same MNE, as the pre-requisite for qualifying as a lower tax country.
Some ATP structures include entities which are not gaining or losing significant tax base themselves, but are nonetheless needed for an ATP structure to exist. We name countries with subsidiaries playing this role conduit countries. It is important to note that the role of a conduit country can be very different, depending on the ATP structure. It can be an intermediate subsidiary, which allows tax efficient repatriation, or it can also be an entity which channels through profits to disguise the mechanisms of the ATP structure role as described in the ATP study. Given that we concentrate on the main channels of ATP and combine ATP structures which use the same mechanism, this poses the problem that we subsume very different types of entities under the term conduit entities. Together with the lack of detailed information about intra-firm transactions this complicates the clear definition of conduit entities. Therefore, we operationalise the definition of conduit entities as those entities which are neither target nor lower tax entities within a MNE group where we find at least one target entity. This primarily highlights the exposure to ATP of this entities and demands for more detailed future research for a more complete understanding of the roles of conduit entities. Since ATP takes place at the corporate group level and not at the Member States level, it will be possible that Member States’ tax rules are used in different roles by different MNEs.
2.4 Use of third countries in aggressive tax planning
The scope of this study focuses on the Member States. However, several of the ATP structures clearly include non-Member States. Therefore, it is appropriate to extend the analysis, at least to some extent to non-Member States. While it is outside the scope of the study to fully capture all non-Member States, we will include third countries when relevant. In particular, the complete group structure including non-EU Member States will be used when identifying the opportunities for ATP structures. Since the coverage for non-EU Member States is often less complete, the inclusion of third countries may also be achieved by classifying them into functional categories, such as developed zero/no tax countries, geographic regions (such as Asia or Africa)

European Commission
Aggressive tax planning indicators
38
and by income level regions. Specifically, such consideration of third countries will also build on current work by the European Commission (2016) providing a scoreboard for a common EU list of non-cooperative tax jurisdictions.

European Commission
Aggressive tax planning indicators
39
3 Economic indicators for aggressive tax planning
The economic indicators aim to shed some light on the extent and impact of ATP at the Member States level. This includes an assessment of how Member States’ tax rules are used in ATP structures. This section therefore presents (i) general indicators, which give an indication about the overall extent of ATP, and (ii) specific indicators which allow to distinguish between the various ATP channels. Further, this section, presents how combining several indicators allows to identify the roles of entities within MNE groups in the different ATP structures. The methodological considerations about the aggregation to country level indicators are complemented by a discussion about data sources and limitations.
3.1 General indicators
The first category of indicators paints a broad picture of the situation in the Member States and does not distinguish between the ATP channels. We therefore refer to them as general indicators. Some of the indicators are country-specific by nature, such as legal aspects in the Member States, and therefore readily available at country level. Other general indicators in contrast are available at the bilateral country-pair level or even at the MNE group level and need to be aggregated to the country level.
3.1.1 General indicators: country level
Table 6 summarises the country-level indicators and groups them into four categories. First, there are the various measures of the statutory tax burden giving an indication about the overall corporate tax system in each country. Second, there are the measures of corporate tax revenues and the corporate tax base in each country, which give an overview of the macro economic situation of the corporate sector. Third, there are some measures of the likely exposure to ATP in each Member State. Finally, there are treaty shopping indicators which are derived from both the statutory tax system and the optimised repatriation routes.
1. Statutory tax burden
One obvious starting point is the statutory corporate tax burden. The statutory tax burden can be measured with various degrees of complexity, taking into account different aspects of the tax base definition. Hence, we define four indicators related to the legal definition of the statutory corporate tax burden.
1a Top statutory corporate tax rate: We use the information from ZEW (2015) about the top statutory corporate income tax rate. This measure also includes either averages or a typical rate for local profit tax rates and therefore is representative for the tax rate a large corporation needs to pay in the respective Member States. Even if the headline statutory top corporate tax measure is only an imprecise measure for the actual tax burden, it is still the most salient reference point for most tax planning

European Commission
Aggressive tax planning indicators
40
structures. The marginal unit of corporate tax base is usually subject to the top statutory tax rate and therefore it is considered as a very important indicator.18
1b Statutory corporate income tax rate in a patent box: A number of Member States offer a lower tax rate for income derived from intellectual property, which is captured in the second indicator. Using the information from the ZEW study (2016) and Alstadsæter et al. (2015), we define this indicator as the applicable tax rate for the income qualifying for the patent box.19
Table 6: Description of general indicators - country-level
Indicator Unit and definition Source 1. Statutory tax burden
1a Top statutory corporate tax rate In % including local profit taxation ZEW (2015)
1b Statutory corporate income tax rate in a patent box In % ZEW (2016)
1c Effective average tax burden In %, measuring the tax burden on a hypothetical investment project with 20 % pre-tax profit
ZEW (2015)
1d Lack of CFC rule Indicator (binary) for absence of a general CFC rule ATP study (2015)
2. Corporate tax revenues and base
2a Corporate tax revenues In % of GDP European Commission (Taxation Trends)
2b Decomposition of Corporate income tax revenues
In %, ratios of corporate income tax revenues, gross value added, operating surplus, and GDP
Eurostat: AMECO database, (own calculation)
3. Exposure to aggressive tax planning 3a Foreign direct investment In % of GDP, excluding SPE Eurostat/IMF
3b Unexplained FDI Ratio FDI to FDI predicted through GDP and bilateral distance
Eurostat, Mayer and Zignago (2011) (own calculation)
3c Activities in foreign controlled companies
Ratio turnover, value added and surplus in foreign controlled companies to total value added
Eurostat: Foreign affiliate statistics
3d Market concentration Share of output by firms with more than 250 employees
Eurostat: Structural Business Statistics (own calculation)
4. Treaty shopping indicators
4a No. Tax Treaties Sum of bilateral tax treaties in force Own calculation
4b Average repatriation tax direct flows
In %, average of 108 direct bilateral repatriation taxes Own calculation
4c Average repatriation tax optimised flows
In %, average of 108 treaty shopping repatriation taxes Own calculation
4d Attractiveness for treaty shopping
In %, share of optimal repatriation strategies which involve this country
Own calculation
Source: Own consideration
18 This statement greatly simplifies the complexity of corporate tax planning and ignores separate tax treatment for specific types of income, such as a reduced tax rate for income from royalty payments in a patent box. 19 See Table 52 in the appendix for a description of the situation of the patent boxes in Europe.

European Commission
Aggressive tax planning indicators
41
1c Effective average tax burden: The main headline statutory tax rate may give an incomplete picture of the generosity of the tax system because it does not take into account the tax base definition. Therefore we follow the economic literature and also use the effective average tax burden, calculated according to the Devereux and Griffith (1998) methodology. The data is available from the European Commission, calculated by ZEW. A variant of the effective average tax burden is the tax efficient bilateral effective average tax burden. As a development of the standard Devereux and Griffith effective tax rate, the ZEW study (2016) calculates bilateral effective tax rates taking into account the tax planning opportunities. We use the bilateral information available and calculate the most tax efficient effective tax burden for each Member State.20
1d Lack of a CFC rule: The ATP study provides useful legal information at the Member State level. For the purpose of this study we concentrate on the legal indicator which identifies the lack of a CFC rule.21 This indicator still needs to be seen with caution, since it only looks into the existence of a legal rule and is not measuring its effectiveness.
2. Corporate tax revenues and base
2a Corporate tax revenues in % of GDP: One of the main concerns about ATP is the undermining of the ability to raise revenues from corporate income taxation. Therefore, we use a general indicator measuring the corporate income tax revenues as a percentage of GDP. To this end, we use the data available from the European Commission (2017) publication about the taxation trends in Europe.
2b Decomposition of Corporate income tax revenues: Corporate tax revenues depend on a series of factors: the tax policy implemented by the government (through the choice of the tax rate, the definition of the tax base and the intensity of tax enforcement), the profitability of the corporate sector and its size, as well as the intensity of ATP. We will try to disentangle the relative contribution of each factor by separating the ratio of corporate income tax revenues to GDP into its component parts following the approach of Sørensen (2006), Clausing (2007) and Piotrowska and Vanborren (2008). As shown below, corporate tax revenues as a percentage of GDP is equal to the multiple of the tax rate, the fraction of corporate income that is taxed, the ratio between overall corporate income and income from ordinary business transaction (excluding profits or losses due to financial transactions) and the share of the corporate income in GDP
𝐶𝐶𝐶𝐶𝐶𝐶𝐺𝐺𝐺𝐺𝐺𝐺
= 𝐶𝐶𝐶𝐶𝐶𝐶𝐶𝐶𝐶𝐶
×𝐶𝐶𝐶𝐶𝐶𝐶𝐶𝐶
×𝐶𝐶𝐶𝐶𝑂𝑂𝐺𝐺
×𝑂𝑂𝐺𝐺𝐺𝐺𝐺𝐺𝐺𝐺
where CIT are corporate tax revenues, CB is the corporate tax base, CI is corporate income and OP is net operating surplus of the corporate sector. Given that, data on the tax base are not readily available we will use a simplified version of the decomposition 20 We are not using the tax efficient bilateral effective tax rates as separate indicators, but rather used them as input for the gravity regression presented in the appendix. 21 It is worth noting that the ATP study provides a much more comprehensive set of legal rules. However, since the strict combination of the legal indicator in Table 28 would rule out most ATP structures in most Member States, we concentrate on a general indicator looking at the presence of CFC rules.

European Commission
Aggressive tax planning indicators
42
𝐶𝐶𝐶𝐶𝐶𝐶𝐺𝐺𝐺𝐺𝐺𝐺
= 𝐶𝐶𝐶𝐶𝐶𝐶𝐶𝐶𝐶𝐶
×𝐶𝐶𝐶𝐶𝑂𝑂𝐺𝐺
×𝑂𝑂𝐺𝐺𝐺𝐺𝐺𝐺𝐺𝐺
The first term on the right-hand side measures the implicit tax rate on corporate income. It is a synthetic indicator of the tax policy implemented by the government. The second term measures the relevance of profits and losses from financial transactions. The third term measures the weight of corporate profits in GDP.22
ATP strategies that exploit internal financing or mismatches should have an impact on the second term in the product. Furthermore, to the extent that such strategies relocated the tax base from higher to lower tax countries, we should observe a negative correlation between the implicit tax rate and CI/OP.
3. Exposure to aggressive tax planning
3a Foreign direct investment in % of GDP: In line with the OECD (2015) we also include the value of FDI as a percentage of GDP as an indicator.23 However, even in the BEPS initiative (OECD 2015, p. 20) it is warned that “FDI include both real and BEPS-related investment and returns, which are difficult or impossible to separate”. Therefore, we are conservative with the use of this indicator. Without an adequate control for non-tax reasons for FDI, we primarily see this indicator as an indication about the exposure to ATP. The larger the inbound or outbound FDI stock of a country is, the more we expect the Member State being at risk to play any role in ATP structures.
3b Unexplained Foreign direct investment: In an attempt to disentangle standard economic factors from tax reasons, we build on a gravity model for the bilateral FDI stock and simulate a FDI position which is predicted only by the geographical location and the relative country size (measured by GDP). Comparing this simulated FDI position to the observed FDI position will give an indication about the potential impact of taxation on FDI.24 Since this measure will also include real responses to taxation, we interpret this general indicator still with some caution. But overall strong positive (negative) deviations from the bilateral inward FDI positions should indicate that a country benefits (loses) from tax induced changes in firm behaviour. ATP is one important but not the only one of such tax-induced activities.
3c Activities in foreign controlled companies: The size of the FDI stock in a country does not take into account the extent of the activities and gross profitability of the firms held by foreign corporations. To take this into account we define three indicators measuring the share of turnover, value added and operating surplus in foreign controlled companies. This indicator is derived from the Eurostat foreign affiliates statistics (FATS) and aggregated at the country level. Like the share of FDI this indicator serves as a measure of exposure to ATP, in the sense that more value
22 Although this indicator is based on National accounts data and therefore not directly comparable to a profit and loss account, one could think of the following analogies: OP ~ turnover, CI ~ EBITDA, CIT ~ tax liabilities. 23 An important aspect is the choice of data source for FDI stocks because they differ with respect to the inclusion of Special Purpose Vehicles. See the discussion of the data sources in Section 3.4.2 for more details. 24 An alternative approach is to estimate a full structural gravity model to isolate the tax effects. See Appendix D for a description of the gravity model and the results from the estimation of a simple structural gravity model.

European Commission
Aggressive tax planning indicators
43
added in foreign controlled firms increases the impact of potential ATP. The Eurostat FATS outbound data would in principle provide the mirror indicator by reporting the activities in subsidiaries abroad controlled by firms in the reporting Member State. Since it does not matter for the mechanisms of ATP structures whether the tax base is relocated from the parent to the subsidiary or vice versa, the interpretation of this indicator is identical to the previous one. However, due to incomplete country coverage in the FATS outbound data we only concentrate on the activities in foreign controlled companies from the inbound statistics.
3d Market concentration: Typically, the corporate sector and in consequence the corporate tax payments are characterised through a very skewed distribution. This implies that a large fraction of tax revenues is paid by a few corporations.25 Additionally, larger companies are expected to be in a better position to engage in ATP. Therefore, the revenue loss is much bigger if larger companies engage in ATP. In sum, we interpret a higher value of this indicator as more exposure to ATP for the Member States.
4. Treaty shopping indicators
The final group of indicators are the treaty shopping indicators. MNEs respond to the tax parameters of the international system set by the Members States and other national governments. These parameters are the rates of the corporate income tax and withholding taxes as well as double tax relief methods. In addition, countries engage in signing bilateral tax treaties with reduced rates and sometimes preferential double tax relief. Specifically, we use the following set of indicators.
4a No. of bilateral tax treaties: The number of bilateral tax treaties, which are in force is a simple and easily available indicator. The more bilateral treaties a country has signed, the more likely it is that one of the treaties can be used for access to favourable conditions to repatriate profits. Therefore, it gives a broad indication about the attractiveness of a country for treaty shopping.
4b Average repatriation tax rate for direct flows: For each individual Member State, we compute the repatriation tax rates for inbound and for outbound dividends, for direct tax routes for 107 partner countries. The country average of these direct bilateral repatriation taxes gives a first indication about the extent a country aims to tax dividend flows. Connected to that, it also gives a broad quantification whether this country is vulnerable to lose significant tax revenues as a result of tax treaty shopping.
4c Average repatriation tax rate for tax optimised flows: We use a network analysis to identify the optimal – in the sense of tax-minimal - repatriation route for dividends. This analysis uses the tax parameters for 2013 in 108 countries.26 We calculate then the average repatriation tax for each Member State, when the MNEs are able to realise the full potential of treaty shopping. The comparison to the average repatriation tax burden for direct flows highlights the importance of treaty shopping. The larger the difference is, the more a country could be harmed by treaty shopping.
25 See for example Devereux and Loretz (2011) for a description of the characteristics of corporate taxpayers based on administrative data for the United Kingdom. 26 See van’t Riet and Lejour (2014) for more detailed description of the network analysis.

European Commission
Aggressive tax planning indicators
44
4d Attractiveness for treaty shopping: How attractive a Member State is for treaty shopping depends on the entirety of the tax parameters. To capture the potential for accommodating tax treaty shopping, we use the measure of the centrality in the network. This is defined as share of treaty shopping repatriation routes which use the Member States. In consequence, a higher value for the centrality measure indicates more attractiveness for treaty shopping.
3.1.2 General indicators: MNE group-level
The second group of general indicators are at the MNE group-level. We define these indicators with the aim to point at the likelihood of ATP at the MNE group level. The indicators in this category, broadly summarised in Table 7, build on two main sources of information: the ownership structure of the MNE groups – also in combination with the legal information of the countries – and information about the tax liabilities and profitability in the consolidated accounts.
The backbone of the MNE group specific indicators will be firm-level information about the ownership structure and the financial accounts from Bureau van Dijk.27
Once a comprehensive overview about the ownership structures of corporate groups is established, one can link further firm-specific and country level information. First of all, only corporate groups, which have a legal entity in more than one country and in at least one EU Member State, are considered in the analysis. In addition to that, all of the ATP structures require combinations of countries with certain legal characteristics. Therefore, an ownership structure which allows the respective ATP structure is a pre-requirement.
5. Ownership structure
5a Headquarter country has no effective and binding CFC rules: The first of the indicator builds on the ATP study and takes into account that a binding and effective CFC rule will rule out most of the ATP structures. Combining the legal information with the information about the ownership structure from Bureau van Dijk, we can derive the first specific indicator.28 For the purpose of this study, we operationalise the headquarter company as the highest corporate owner with a majority shareholding we can identify in the Bureau van Dijk data. In cases where a public authority or government is listed as the global ultimate owner, we use one owner below as the headquarter company.
5b MNE group has a subsidiary in a lower tax country: The second specific indicator combines the ownership information with the general indicator [1a] statutory corporate income tax. Since the reduction in the tax liabilities is achieved by relocating
27 Bureau van Dijk collects balance sheet, profit and loss account from different national sources and brings them into a standardised format. There are different products available, this report draws on a comprehensive download from the worldwide database ORBIS and complemented with a current download from the European subset Amadeus. See Section 3.4.2 for a discussion of the data sources. 28 There is some ambiguity in the ATP study concerning what constitutes a headquarter company. From the description of the ATP structures, one could interpret any corporate entity having control over the relevant subsidiaries as the headquarter company. However, from the fact that the absence of CFC rules is seen as necessary for the ATP structures we rule any intermediate owner out.
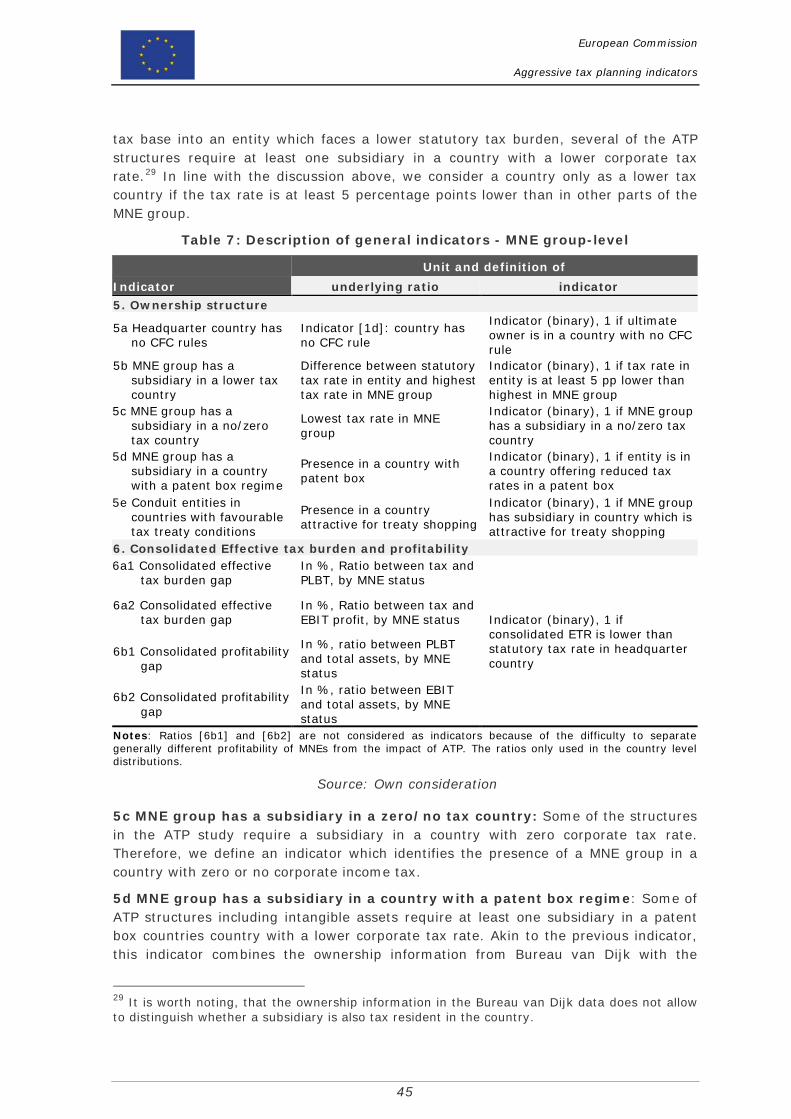
European Commission
Aggressive tax planning indicators
45
tax base into an entity which faces a lower statutory tax burden, several of the ATP structures require at least one subsidiary in a country with a lower corporate tax rate.29 In line with the discussion above, we consider a country only as a lower tax country if the tax rate is at least 5 percentage points lower than in other parts of the MNE group.
Table 7: Description of general indicators - MNE group-level
Unit and definition of Indicator underlying ratio indicator 5. Ownership structure
5a Headquarter country has no CFC rules
Indicator [1d]: country has no CFC rule
Indicator (binary), 1 if ultimate owner is in a country with no CFC rule
5b MNE group has a subsidiary in a lower tax country
Difference between statutory tax rate in entity and highest tax rate in MNE group
Indicator (binary), 1 if tax rate in entity is at least 5 pp lower than highest in MNE group
5c MNE group has a subsidiary in a no/zero tax country
Lowest tax rate in MNE group
Indicator (binary), 1 if MNE group has a subsidiary in a no/zero tax country
5d MNE group has a subsidiary in a country with a patent box regime
Presence in a country with patent box
Indicator (binary), 1 if entity is in a country offering reduced tax rates in a patent box
5e Conduit entities in countries with favourable tax treaty conditions
Presence in a country attractive for treaty shopping
Indicator (binary), 1 if MNE group has subsidiary in country which is attractive for treaty shopping
6. Consolidated Effective tax burden and profitability 6a1 Consolidated effective
tax burden gap In %, Ratio between tax and PLBT, by MNE status
Indicator (binary), 1 if consolidated ETR is lower than statutory tax rate in headquarter country
6a2 Consolidated effective tax burden gap
In %, Ratio between tax and EBIT profit, by MNE status
6b1 Consolidated profitability gap
In %, ratio between PLBT and total assets, by MNE status
6b2 Consolidated profitability gap
In %, ratio between EBIT and total assets, by MNE status
Notes: Ratios [6b1] and [6b2] are not considered as indicators because of the difficulty to separate generally different profitability of MNEs from the impact of ATP. The ratios only used in the country level distributions.
Source: Own consideration
5c MNE group has a subsidiary in a zero/no tax country: Some of the structures in the ATP study require a subsidiary in a country with zero corporate tax rate. Therefore, we define an indicator which identifies the presence of a MNE group in a country with zero or no corporate income tax.
5d MNE group has a subsidiary in a country with a patent box regime: Some of ATP structures including intangible assets require at least one subsidiary in a patent box countries country with a lower corporate tax rate. Akin to the previous indicator, this indicator combines the ownership information from Bureau van Dijk with the
29 It is worth noting, that the ownership information in the Bureau van Dijk data does not allow to distinguish whether a subsidiary is also tax resident in the country.

European Commission
Aggressive tax planning indicators
46
information from the general indicator [1b] statutory corporate income tax in patent box.
5e Presence in countries with favourable tax treaty conditions: Most of the ATP structures require that the intra-company flows of dividends are not subject to additional repatriation taxes. For dividend flows within the EU this is in most situations fulfilled through the parent subsidiary directive.30 At the same time, several of the ATP structures involve non-Member States, where the absence of repatriation taxes is not trivial. MNEs can opt to re-route their repatriations in a tax efficient manner, a strategy also referred to a treaty shopping. We use indicator [4d] about the attractiveness for treaty shopping and match this information with the ownership information from the Bureau van Dijk data.
6. Consolidated effective tax burden and profitability
The main aim of ATP structures is to reduce the tax burden of the MNEs, which should be reflected in a lower effective tax rate (ETR) in the consolidated accounts of the MNE engaged in ATP. Alternatively, if the ATP channels work through a non-inclusion of taxable income, the consolidated profitability of the MNE group should be reduced.
6a1 Consolidated effective tax burden gap: As a first indication whether MNEs are indeed able to reduce their effective tax burden, we use the effective tax burden based on the tax liabilities in the consolidated MNEs account. There are several important aspects to consider with such an indicator. First, regarding the denominator, we use the pre-tax profit and losses (PLBT) as reported in the balance sheet. This denominator has the benefit that it is the closest possible approximation to the taxable profit. At the same time, the profits and losses before taxation may also be distorted through large extraordinary income positions. The second important limitation is due to the loss carry forwards. Losses do not result in immediate negative tax liabilities, but rather in a future tax reduction. This rules out using observations with losses since the ETR is not meaningful in this case. Furthermore, the loss carry forward can result in a clearly reduced effective tax burden, even in the absence of ATP. To reduce the impact of the timing issues we use an average over full sample period. To separate potential ATP activities by MNEs from country specific characteristics which lower the effective tax burdens for all companies we compare the consolidated ETR measure to domestic firms. This highlights in which Member States MNEs are more able to lower their tax burden. The comparison, however, is only a rough approximation of ATP since different statutory tax rates in the subsidiary countries are affecting this comparison.
6a2 Consolidated effective tax burden gap: To avoid problems because of large extraordinary income positions we also use an alternative definition of ETR based on the denominator earnings before interest and taxation (EBIT). This consolidated ETR measure will also identify firms which generate overall financial losses as a result of ATP structures.
6b1 Consolidated profitability gap: Several of the ATP channels affect the overall (i.e. the consolidated) profit level. In consequence, the consolidated ETR will not necessarily reflect ATP strategies. To capture the impact of these ATP structures, we 30 Council directive 2003/123/EC amends the Directive 90/435/EEC with the objective exempt dividend payments from withholding taxes to eliminate double taxation at the parent level.

European Commission
Aggressive tax planning indicators
47
also include two measures of consolidated profitability. This approach also helps to overcome the drawback of ETRs not being properly defined in the case of non-positive profits. In line with the two other consolidated indicators we base the profitability measures on two profit measures. The first consolidated profitability indicator is therefore based on the PLBT as a share of total assets. We compare once more the consolidated profitability measures of MNEs to the consolidated profitability measures of purely domestic groups. In this case, however, it is worth noting that the international trade literature suggests a selection effect of more profitable firms being more likely to become MNEs. Therefore, the observation of more profitable MNEs may not be interpreted as necessarily reflecting the presence of ATP.31
6b2 Consolidated profitability gap: The second consolidated profitability indicator is based on the operating profits and uses EBIT divided through total assets. Following the same logic as before, we contrast the consolidated profitability measures with their domestic counterparts. Again, the same caveat of MNE groups generally being more productive applies. At the same time, the comparison between the two consolidated profitability indicators allows to see whether MNEs are able reduce the pre-tax profits more than the purely domestic groups.
Finally, it is worth noting that the consolidated effective tax burden of MNE groups can be influenced by numerous aspects unrelated to ATP. Therefore, we take a conservative approach and only define one indicator based on the consolidated ETR. Specifically, we define an indicator which is unity if the ETR is lower than the statutory tax rate in the headquarter country. This indicator is intended to filter out companies with reported liabilities apparently inconsistent with ATP. The consolidated profitability measures are additionally used in the analysis in Section 4.1.
3.2 Specific indicators
The specific indicators are more directly linked to the characteristics of the ATP structures, and aim not only to identify the presence of ATP, but also the ATP channel and the role played by the specific entity within the MNE. As such, the specific indicators are primarily at the level of the individual firm (i.e. parent or subsidiary) within the MNE group. In case the relevant information is not available at the firm-level, we complement the set of specific indicators with country-pair specific indicators.
3.2.1 Specific indicators: firm-level
The specific firm-level indicators - as summarised in Table 8 - are helpful to identify the various roles of the entities in the different Member States. At the same time, the simple identification of the roles of the entities will fall short of describing the overall extent of the ATP activities. Firm specific ratios on their own also reveal little about ATP structures, unless we use them in the correct context. Therefore, we evaluate the ratios in combination with the relative tax position within the MNE to draw a broader picture at the country level.32 Table 8 shows first the definition of the ratios used and
31 See Maffini and Mokkas (2011) for a discussion of this issue. 32 See subsection 3.4.1 for a discussion about the aggregation and subsection 4.1.5 for the results.

European Commission
Aggressive tax planning indicators
48
then how the indicator is defined by comparing the ratio in the specific entity to both the rest of the MNE group and to a comparison group based on domestic firms.
The various ATP structures have the goal to reduce the overall tax burden of the MNE by either relocating the tax base to lower tax jurisdictions, or by exploiting the mismatch in the qualification of income or entities across different jurisdictions. Either way, the distribution of corporate profits will be affected by the use of ATP structures. In the case of relocating profits the expected outcome is a reduction in pre-tax profits in MNE entities located in high tax countries and a corresponding increase in pre-tax profits in MNE entities located in lower tax countries. If a mismatch in tax treatment is exploited, the overall tax base is reduced because an intra-group transaction produces a deductible cost that is not matched by a corresponding taxable income elsewhere. In sum, the profit levels in the different entities will be affected differently. Therefore, we start with several measures of the profitability of the MNE entities.
7. Pre-tax profitability
7a Pre-tax profitability gap within MNE: The most obviously affected profit measure is the pre-tax profitability (PLBT) of the firm. Relating the PLBT to the amount of total assets gives a measure of the pre-tax profitability of the firm. Alternatively, we also relate PLBT to the number of employees to account for the fact that capital stock of a firm might be affected by the tax regime as well.33 In the description of the ATP structures we find the common feature that the pre-tax profitability of an entity will be higher in lower tax countries. The flipside of the coin is a lower profitability in higher tax countries. This directly implies that we need a reference point to establish what constitutes a lower or higher pre-tax profitability. We take two different approaches to define an indicator for lower (higher) profitability. First, we have a comparison between the pre-tax profitability in the entity and the average pre-tax profitability of the MNE group as a whole. Secondly, we also define the indicator 7b Pre-tax profitability gap to domestic companies, which identifies a lower pre-tax profitability by comparing the value of the entity to the median value of domestic companies. To reduce the non-tax reasons for differences in pre-tax profitability, we define the relevant comparison group as domestic firms being in the same industry, country and year. At the same time, we make sure that the comparison group consists of at least 20 observations, from which we take the median value as reference, to rule out a strong impact of outliers in the comparison group.34
8. Operating profitability
8a Operating profitability gap within MNE. The second pair of indicators follows the same logic but use earnings before interest and taxation (EBIT) as measure for the profitability of the MNE entity. Again, we use both total assets and number of employees as denominator to derive the profitability. The use of two different measures of profitability allows to distinguish between ATP structures which only affect
33 See Loretz and Mokkas (2015) for a discussion how profit shifting and tax induced relocation of investments are reflected in profit measures. 34 For most of the Member States coverage is not a big issue. In contrast, for non-Member States the coverage is less good. In these cases, we define the comparison group broader to ensure at least 20 observations. See Appendix for a more detailed description which industry-country-year cells were finally used.

European Commission
Aggressive tax planning indicators
49
pre-tax profitability but leave operating profit unchanged and ATP structures which also affect operating profits. In line with the previous indicators we first establish what a lower operating profitability is, by comparing the value to the average of the MNE group. Additionally, we define the 8b operating profitability gap to domestic companies indicator by comparing the profitability the domestic counterparts.

European Commission
Aggressive tax planning indicators
50
Table 8: Description of specific indicators - firm-level Unit and definition of ATP channel
Indicator underlying ratio indicator
I
Inte
rest
pa
ymen
ts
Roy
alty
pa
ymen
ts
Tran
sfer
Pr
icin
g
7. Pre-tax profitability
7a Pre-tax profitability gap within MNE in % PLBT divided
by total assets (by no. of employees)
binary indicator, 1 if PLBT/ASSETS is lower than the average PLBT/ASSETS of the MNE
X X X
7b Pre-tax profitability gap to domestic companies
binary indicator, 1 if PLBT/ASSETS is lower than the median PLBT/ASSETS of comparison group
X X X
8. Operating profitability
8a Operating profitability gap within MNE in %, EBIT divided
by total assets (by no. of employees)
binary indicator, 1 if EBIT/ASSETS is lower than the median EBIT/ASSETS of comparison group
X X
8b Operating profitability gap to domestic companies
binary indicator, 1 if EBIT/ASSETS is lower than the median EBIT/ASSETS of comparison group
X X
9. Financial profitability
9a Financial profits gap within MNE in %, financial
profit/losses divided by total assets (by no. of employees)
binary indicator, 1 if FIN_PL/ASSETS is lower than the average FIN_PL/ASSETS of the MNE
X
9b Financial profits gap to domestic companies
binary indicator, 1 if FIN_PL/ASSETS is lower than the median FIN_PL/ASSETS of comparison group
X
10. Interest payments
10a Interest gap within MNE
in %, interest payments divided by total assets (by no. of employees)
binary indicator, 1 if interest payments are lower than the average interest payments of the MNE
X
10b Interest gap to domestic companies
X
11. Debt share
11a Debt share gap within MNE in %, current + non-
current liabilities divided by total assets
binary indicator, 1 if debt ratio is lower than the average debt ratio of the MNE
X
11b Debt share gap to domestic companies
binary indicator, 1 if debt ratio is lower than the median debt ratio of comparison group
X
12. Intangible assets
12a Intangibles gap within MNE
in %, intangible assets divided by total assets
binary indicator, 1 if intangible assets ratio is lower than the average intangible assets ratio of the MNE
X
12b Intangibles gap to domestic companies
binary indicator, 1 if intangible assets ratio is lower than the median intangible assets ratio of comparison group
X
13. Patent holdings
13a Patent gap within MNE No. of granted patents held by firm
binary indicator, 1 if no. of patents held is lower than the average no. of patents of the MNE
X
13b Patent gap to domestic companies
binary indicator, 1 if no. of patents held is lower than the median no. of patents held of comparison group
X
Notes: All indicators build on the data from Bureau Van Dijk, see Appendix for more detailed description of the definitions.
Source: Own consideration

European Commission
Aggressive tax planning indicators
51
9. Financial profitability
9a Financial profitability gap within MNE: Akin to the pre-tax profitability measures, we repeat the exercise with the financial profit and losses and use total assets and the number of employees as denominator. The financial profit and losses item in the profit and loss account contains generally income respectively losses from all financial transactions. A substantial part of these profits and losses is expected to be interest payments, respectively interest income. Therefore, this indicator will indirectly capture flows originating from ATP structures involving internal financing. The comparison to the average financial profit in the MNE, will help to identify low financial profits or substantial financial losses in one subsidiary. This is especially true if financial losses in the observed entity are coinciding with high financial profits in other parts of the subsidiary. If this is the case, it points towards an ATP structure using internal debt. If financial losses in one country are not coinciding with financial profits in other countries, an ATP structure based on a hybrid mismatch may be the underlying cause.35
9b Financial profitability gap to domestic companies: The indicator comparing the financial profits and losses over total assets within MNEs is complemented by the same comparison between the MNEs subsidiaries and domestic companies in the respective countries. This allows to judge whether the observed financial profits and losses are unusually high or low in comparison to the relevant domestic firms. Together with the previous indicator, this allows the distinction between financial profits and losses simply being reallocated within the MNE, or whether they are higher or lower than from domestic companies. Again, it is worth mentioning that the strict interpretation of the two indicators in combination crucially depends on an adequate coverage of all relevant subsidiaries within the MNE.
10. Interest payments
10a Interest gap within MNE: Since financial profit and loss may be too broad as an indicator, we also use the item interest paid. While this only covers one side of the financial transaction of potential ATP structures using internal debt, it has the benefit of measuring the flow more precisely. Previous experience with Bureau van Dijk data has however shown that the coverage of interest paid may be less complete. Therefore, we do not want to solely rely on the interest gap indicator, but rather see it as a backup of the other indicators using financial profit and debt share. The comparison between subsidiaries within the same MNE provides now an even clearer picture since the item interest paid is one-sided.
10b Interest gap to domestic companies: The one-sided nature of interest paid implies that the comparison to domestic companies should by and large confirm the finding of the previous indicator.
11. Debt share
11a Debt share gap within MNE: To get more directly towards the ATP channel using internal debt financing we also define two indicators based on the liabilities of the subsidiaries. Defining the debt share as the ratio between total liabilities (i.e. the
35 That said, missing information about the subsidiary in the target country could bias our results away from ATP using internal debt towards ATP structures based on mismatches.

European Commission
Aggressive tax planning indicators
52
sum of current and non-current liabilities) and total assets is in line with large parts of the literature (e.g. Huizinga et al., 2008). This is a very broad measure of debt and likely to overestimate the relevance of internal debt. To have indicators, which clearly identify ATP structures using internal financing structures, one would need to distinguish between intra-company and external debt. Unfortunately, there is no cross-country dataset available, which contains the information about internal and external debt. For some countries, confidential datasets including the distinction between different forms of debt exist. See for example Büttner et al. (2012) for an analysis using the German MIDI dataset and Blouin et al. (2014) using the BEA data for the United States. It would be a useful avenue for further research if it would be possible i.) to extend the number of countries providing dataset with the distinction between internal and external debt and ii.) to link the different national dataset to an international one. But since this is clearly outside the scope of this study, we stick to the simple definition of the debt share, which we – in line with the approach described above – first compare between the different subsidiaries within the same MNE.
11b Debt share gap to domestic companies: Following the exact same logic as for the previous indicators, we also compare the debt share in the MNEs subsidiaries with their domestic counterparts. Like the indicator based on interest payments, the debt share only looks at one side of the transaction, and therefore the comparison to domestic firms should primarily verify the insights from the indicator looking at a comparison within the MNE.
12. Intangible assets
12a Intangibles gap within MNE: The balance sheet item intangible assets as an indicator aims to capture the ATP structures involving the holding of royalty bearing assets. Bureau van Dijk does not further specify what is included in the balance sheet item intangible assets, so we need to assume that it is a rather broad measure. Therefore, we have to bear in mind that it may also include non-royalty bearing items such as acquired goodwill. Therefore, the indicator may only be seen as a crude approximation. We measure our intangible assets indicator as fraction of total assets in order to filter out pure size effects. The comparison between subsidiaries within the same MNE follows the logic introduced above. However, it is additionally worth pointing out that we expect a tendency of MNEs to keep intangible assets in the headquarter country.36
12b Intangibles gap to domestic companies: The second comparison of the location of intangible assets is again with domestic companies. Similar to the argument raised by comparing the profitability of domestic companies to MNEs one has to bear in mind that we would expect MNEs to have a large share of intangible assets. Nevertheless, in combination with the information about the tax burden, we should be able to detect tax driven behaviour.
13. Patent holdings
13a Patent gap within MNE: Since the balance sheet item intangible assets is only a crude approximation we will also look at the information about patent holdings by 36 See Dischinger et al. (2014) for an empirical study about the home bias in profit shifting in general and Karkinsky and Riedel (2011) for evidence that patents being held at the headquarter country over-proportionally.

European Commission
Aggressive tax planning indicators
53
MNEs. Again, in addition to the comparison within the MNE we also define a second indicator 13b Patent gap to domestic companies, looking at the difference in comparison to domestic firms.
3.2.2 Specific indicators: country-pair-level
The last group of indicators are specific to ATP structures but not available at the firm-level. To this end, we match bilateral country-pair level and product-country-pair-level data on the firm-level data. Table 9 collects the indicators related to bilateral import price anomalies and to royalty payments. Table 9 also follows the logic from the description of the firm specific indicators and presents first the underlying ratios which are evaluated at the country level. In a second step the bilateral (and industry level in the case of import price anomalies) information is matched to the ownership structure and condensed in one indicator.
14 Bilateral import price anomalies: Using bilateral product specific trade data we can detect significant deviations from standard prices. Although our data is not able to distinguish between internal and arms’ length transactions, we are still in a position to identify anomalies in bilateral import prices in the spirit of Pak and Zdanowicz (2002). That is, for products where sufficient bilateral trade flows are observed we are able to compare the bilateral average price level to the overall median price level. Each transaction can be seen from the importing or exporting country to identify price anomalies. Therefore, we first identify the number of products which have a suspiciously high or low unit price and count them by importing or exporting country. Specifically, we treat value five times higher or lower than the median value as suspicious.37
In a second step, we combine the information of price anomalies with the relative tax position in the MNE groups. We define a binary indicator which takes the value of one if a too high import price coincides with an entity being a lower tax entity. Correspondingly, the indicator is also unity if the import prices are too low and the entity is a higher tax entity. For completeness, we also define the indicator from the exporter side. This measures the same transactions on the exporter side and should by and large be already covered by the import price anomalies.38
15 Bilateral royalty flows: To complement the analysis of the ATP structures using intellectual property we also define an indicator measuring bilateral royalty flows. We follow Dudar et al. (2015) and use the trade in services dataset.39 Specifically, we use the item “Charges for the use of intellectual property n.i.e” which has superseded the classification “Royalties and license fees”. While the new classification suggests that this item may be somewhat broader than pure royalty payments, this bilateral flow meets the economic criteria of the royalty payments and therefore should reflect ATP
37 The exact threshold is arbitrary, but a threshold set at larger than 500 percent or smaller than 20 percent of the median unit price should to a large extent rule out price variations because of other factors, e.g. quality differences. 38 The difference lies in the reference value for a ‘normal’ price, which is either the median import price at the importing country or the median export price at the exporting country. 39 The data for the trade in services statistics is provided by several institutions, most notably Eurostat, the OECD and the Worldbank, which in turn refers to the IMF. Since the data from the different sources is consistent but varying in coverage we combine the different sources.

European Commission
Aggressive tax planning indicators
54
strategies. We use different levels of details of the royalty flows. First, we start with the sum of royalty receipts and royalty payments by Member States and calculate the net royalty receipts by country. Relating this net position to GDP controls for pure country-size effects and gives an overall impression of the fiscal impact of ATP.
Table 9: Description of specific indicators - country-pair-level
Unit and definition of ATP channel
Indicator underlying ratio Indicator
Inte
rest
pay
men
ts
Roy
alty
pay
men
ts
Tran
sfer
Prici
ng
14. Bilateral import price anomalies
14a. Bilateral import prices are too high
binary indicator, 1 if import price is more than 500 % of median import price in importing country
binary indicator, 1 if at least one good of the industry has too high import price and entity is a lower tax entity
X
14b. Bilateral import prices are too low
binary indicator, 1 if import price is less than 20% of median import price in importing country
binary indicator, 1 if at least one good of the industry has too low import price and entity is a higher tax entity
X
14c. Bilateral export price are too high
binary indicator, 1 if export price is more than 500 % median export price in exporting country
binary indicator, 1 if at least one good of the industry has too high export price and entity is a lower tax entity
X
14d. Bilateral export price are too low
binary indicator, 1 if export price is less than 20 % of median export price in exporting country
binary indicator, 1 if at least one good of the industry has too low export price and entity is a higher tax entity
X
15. Bilateral royalty flows
15a Royalty receipts
In % of GDP, sum of royalty receipts from all countries divided by GDP Indicator (binary), 1 if the
bilateral net royalty receipts are bigger than 0.01 %
(lower than -0.01 %) of GDP and receiving entity is a lower (higher) tax entity
x
15b Royalty payments
In % of GDP, sum of royalty payments from all countries divided by GDP
x
15c Net Royalty flows
In % of GDP, difference of sum of royalty payments and sum of royalty receipts from all countries divided by GDP
x

European Commission
Aggressive tax planning indicators
55
Source: Own consideration
In a second step, we look at the bilateral net royalty flows and define a country as net recipient if the bilateral flow is larger than 0.1 percent of the GDP of the receiving country. Combining this net position with the relative tax status of the MNE entity we define a binary indicator which highlights patterns which are consistent with ATP channel using intellectual property. Since the bilateral information about royalty flows is not complete, we make a broad approximation for missing bilateral royalty flows. Specifically, we treat the Member States as receiving (paying) countries if the net royalty flow is positive (negative). Then we treat the country pair as consistent with the ATP structure if a receiving country is matched with a paying country. However, since this only a crude approximation, we will only place moderate importance on this indicator.
3.3 Combinations of indicators
On their own the specific indicators are only shedding light on particular aspects, but in combination with each other and the information about the tax situation in the countries, they allow an allocation of each entity within a MNE to one of the roles (i.e. target, lower tax or conduit entity) in the various ATP structures. Alternatively, if the specific indicators show no suspicious patterns, we can allocate the MNE group to the category “inconsistent with ATP structure”. This implies that this category is negatively defined, i.e. we subsume those firms where we fail to find evidence for an ATP structure. In consequence, the category “inconsistent with ATP structure” may only be interpreted as lack of evidence for an ATP structure and not as evidence against its presence.
3.3.1 Relative tax situation of MNE entities
One of the key indicators to identify which is the role of an entity is the relative tax situation of entities within the MNE group. Therefore, a first step of aggregation is to allocate entities into subgroups according to the relative tax rate they face. Denote the individual entity with the subscript 𝑖𝑖 and the country where the entity is incorporated as 𝑐𝑐.40 For all entities, which we allocate to a relevant MNE group we denote the group with the subscript 𝑔𝑔. Using the information about the country where the entities are incorporated, it is possible to define both the highest 𝜏𝜏𝑔𝑔𝑚𝑚𝑚𝑚𝑚𝑚 and lowest 𝜏𝜏𝑔𝑔𝑚𝑚𝑚𝑚𝑚𝑚 statutory corporate tax rates within each MNE group. Additionally, we can use the binary indicator 𝑁𝑁𝑁𝑁_𝐶𝐶𝐶𝐶𝐶𝐶𝑔𝑔 which takes the value 1 if the MNE group has an entity in a zero/no corporate income tax country.41 We also construct a binary indicator 𝐿𝐿𝑁𝑁𝐿𝐿𝐿𝐿𝐿𝐿_𝑡𝑡𝑡𝑡𝑡𝑡𝑚𝑚 which takes the value 1, if the entity within the MNE group faces a relatively lower statutory corporate tax rate, i.e. if 𝜏𝜏𝑔𝑔𝑚𝑚𝑚𝑚𝑚𝑚 − 𝜏𝜏𝑚𝑚 > 5. Furthermore, we define the binary indicator 𝐿𝐿𝑁𝑁𝐿𝐿𝐿𝐿𝐿𝐿𝑡𝑡_𝑡𝑡𝑡𝑡𝑡𝑡𝑚𝑚 if the entity is in the country with the lowest tax of the MNE group, i.e. 𝜏𝜏𝑔𝑔𝑚𝑚𝑚𝑚𝑚𝑚 = 𝜏𝜏𝑚𝑚. Averaging, these three indicator variables over the Member States represent the share of entities which are within MNEs group with a zero/no corporate income tax
40 For simplicity, we abstract from the time index in this description. Throughout the study the analysis will be based on the yearly observations. 41 This binary indicator is derived directly from the indicator [5c]. Technically, we can also define it as 𝜏𝜏𝑔𝑔𝑚𝑚𝑚𝑚𝑚𝑚 = 0.

European Commission
Aggressive tax planning indicators
56
subsidiary, which are facing relatively low tax burden or the lowest tax burden of the MNE group.
3.3.2 Identifying roles in ATP channels
To identify the roles of the entities in the ATP channel presented in Section 2.2 we combine the indicators presented in this Section. Following the logic of the presentation of the indicators we have general indicators which are identifying the presence of the ATP channel at the MNE group level and specific indicators which attribute the entities within the MNE to particular roles.
In many instances, a strict application of all possible indicators may be too conservative and fail to capture the real extent of ATP. Therefore, we use two levels of strictness to attribute entities to the respective roles within the ATP channels. First, we define criteria for a strict classification into roles which uses all available indicators regardless of the precision and data availability of the indicator. Alternatively, we also define a standard classification, which uses combinations of indicators which are clearer in their prediction and less data demanding and therefore produce a baseline allocation into roles. In the following descriptions this is reflected by the higher priority which is attributed to the indicators which are included in the standard classification. The additional indicators for the strict classification are given lower priority.42
Tax planning via interest payments
To identify the roles of the entities in the ATP channel using interest payments as described in Figure 2 we combine the indicators which measure the characteristics identified in Table 3. For a detailed description see also Table 38 in the appendix. First, there are two specific indicators which are not related to a role, but rather to the ATP structure generally. There is an indicator based on the ownership structure, which reflects the specifics of the ATP structure. In the case of the ATP via interest payments this is simply that the MNE group needs to have at least one [5b] subsidiary in a lower tax country. Since this is absolutely central for the mechanism of the ATP structure, this indicator has the highest priority. Secondly, the indicator [6] measures to what extent the MNE as a whole is able to reduce the tax burden through the effective tax burden of the consolidated accounts of the group. The lowering of the effective tax burden is equally a defining feature of any ATP structure. However, due to the difficulty of finding a reliable comparison group, and due to the uncertainty how well the tax liabilities in the accounts reflect the actual tax liabilities we only attribute a low to moderate importance to this indicator.43
The role of the headquarter country is basically limited to the fact that the headquarter of the MNE is located in a country without CFC rules. The headquarter location is given through the ownership information and in combination with the legal indicator we can determine whether the MNE group is in a country with no CFC rule. However, a binding and effective CFC rule should rule out the ATP structure in the first
42 See Appendix B for a comprehensive description of the combination of indicators and the classification of entities into roles within ATP structures. 43 The consolidated accounts blur the applicable tax rate because of the summation of countries with different tax rates. Additionally, the consolidated accounts may not be available for all MNEs, so allowing this indicator to be missing reduces our sample attrition.

European Commission
Aggressive tax planning indicators
57
place. If we still find evidence for the ATP structure in other indicators, we interpret the CFC rule as not binding or ineffective and therefore only attribute a moderate importance to this indicator, implying that we only use it for the strict categorisation.
The target entity is the part of the MNE, which loses tax base as the result of the ATP structure. The indicators for the identification of the target entity have in common that the indicator identifying a lower tax entity [5b] must be zero. Together with the general requirement that at least one entity in the MNE group is identified as a lower tax entity, this reflects that the tax rate in this entity is at least 5 percentage points higher than in the lowest tax entity in the MNE. Therefore, there is an incentive to relocate tax base out of this entity.
The defining feature of the target entity is the reduction of the corporate tax base. Therefore, we have a number of indicators which reflect this directly. First, there is the lower pre-tax profitability compared to the rest of the MNE [7a] and to domestic subsidiaries [7b].44
For the standard classification into roles, we require that at least one of the two profitability indicators is met, i.e. that either the comparison to the rest of the group or to the domestic comparison group reveals a lower pre-tax profitability. For the strict use of the indicators we require that both pre-tax profitability indicators are unity. The same applies for the indicators based on the financial profits compared to the rest of the MNE [9a] and to domestic subsidiaries [9b]. One indicator of the two showing a lower financial profitability suffices for the standard use of the indicators, while both need to be in line for the strict classification.
The indicators based on higher interest payments [10] and a higher debt share [11], both in comparison to the rest of the group and to the domestic subsidiaries are looking more directly at traces of the financial transaction. Since the ATP structure is based on internal debt and the resulting interest payments, the mirror of these transactions should be visible in the other parts of the MNE, notably in the lower tax country. Therefore, the differences between the subsidiaries of the same MNE should be more pronounced. To consider this, we tend to give more importance to the comparisons within the MNE. However, if we lack important parts of the MNE in our dataset, the comparison within the MNE might be misleading. To reduce this problem, we take one of the measures as sufficient for the standard classification. In contrast, for the strict interpretation of the indicators we require that all indicators are met.
The counterpart to the target entity is the lower tax entity. The basic economic mechanism of the ATP channel using an internal financial transaction lies in the fact that corporate tax base is shifted to an entity in a country where it faces a lower corporate tax burden. Therefore, the common defining indicator is [5b], indicating a statutory corporate tax burden which is at least 5 percentage points lower than in the highest tax entity in the MNE group. The other indicators are also used inverted but analogous to the target entity. In its purest form, the ATP structure using internal financial transactions relocates tax base from the target entity to the lower tax entity.
44 Note that all profitability indicators and the interest indicator are calculated both as ratios of total assets and number of employees. Throughout the analysis, we only require that one of the two ratios is in line with definition for the indicators to take the value 1. This is also reflected in the fact that we drop the superscripts EMP and ASSET.

European Commission
Aggressive tax planning indicators
58
In consequence, indicators should exactly reflect this and take the opposite values. Precisely, this requires the pre-tax profitability to be higher than in the other parts of the MNE [7a] and compared to domestic firms [7b]. In line with the use for the target entity we also require one indicator to be zero for the standard classification and both for the strict classification. This logic is also applied for the financial profitability in comparison to the rest of the MNE [9a] and to the domestic firms [9b]. Finally, we require the interest payments and debt share to be lower than in the domestic companies and also lower than in the rest of the MNE. These indicators are only defined indirectly since the high interest payments and debt share in the target entity are reflected in relatively low values in the lower tax entities. This is again reflected in the moderate importance we put on these indicators in the standard classification.
There are a number of variations of the ATP channel using interest payments, which we do not present in detail here, but rather describe in the appendix. The offshore loan ATP structure as described in the ATP study deviates from the described ATP structure insofar, as there is no lower tax country but rather a zero/no corporate tax country involved. The hybrid loan ATP structure as described by the ZEW study looks much like the described financial transaction ATP structure for the target country. The key difference lies in the fact that no lower tax entity is involved, but rather the interest payments are not included as income in the remainder of the MNE group. In the absence of more detailed legal indicators the economic indicators are also in line with the interest free loan ATP structure.
Finally, it is worth noting that basic ATP channel via interest payments does not require conduit entities. To acknowledge the presence and relevance of conduit entities, we nevertheless include this role. In particular, we allocate the attribute of a conduit entity to those parts of a MNE group, which are neither target nor lower tax entities, if the ATP channel is detected within the MNE group, i.e. if there are target or lower tax entities in the MNE group. In case of the strict use of indicators we additionally require that the conduit entity is in a country which is attractive for treaty shopping.
Roles in ATP structures: Tax planning via royalty payments
The combination of indicators for the ATP via royalty payments follows a similar logic.45. The starting point is again the ownership structure, which needs to involve at least one subsidiary in a lower tax country. The indicator for the relative tax situation of the entities and the indicators measuring the pre-tax profitability are used in the exact same way to distinguish the target entity and the lower tax entity. The differences to the previous ATP channel start with the second profitability measures, which are now based on operating profitability, again both in comparison [8a] to the rest of the MNE group and [8b] to domestic firms. This implies that for the target entity both the pre-tax and operating profitability indicator need to take the value 1 reflecting the lower profitability there. Again, in line with the previous ATP structure one of the indicators is sufficient for the standard classification, while both need to be consistent in the case of the strict classification. Furthermore, we also use the [12] intangible assets ratio indicators to identify whether the target entity has less intangible assets. For the strict classification, we demand that both indicators - the
45 For the detailed description see Table 39 in the appendix.

European Commission
Aggressive tax planning indicators
59
comparison to the domestic companies and within the MNE group – take the value 1, while for the standard classification one indicator with the value 1 is sufficient.
To identify the lower tax entity, we follow the exact same procedure as before and use the inverse of the indicators. This includes the indicators showing a higher pre-tax and operating profitability as well as the higher intangible assets ratio. All of these indicators need to coincide with the ownership based indicator identifying the lower tax status of the entity. Finally, we also combine the firm specific indicators with the country pair specific indicator of royalty flows. Specifically, we demand that the indicator takes the value one, which reflects that the net royalty payments flow from the country of the target entity to the country of the lower tax entity. However, since this is a less precise measure we place less weight on it, i.e. we only use it in the strict classification.
A variant of the intellectual property and royalty payment ATP structure is the ATP structure using patent boxes. In this case the general indicator regarding the lower tax entity is replaced through the indicator [5d] which identifies the presence of the MNE in a country with a patent box. The lower tax entity is now defined through having a low rate because of the patent box, rather than having a generally lower statutory tax rate. Additionally, we rely on the indicators [13a] and [13b] which measure the number of patents held by the entities. Using the number of patents held rather than the balance sheet item intangible assets has both advantages and disadvantages. The balance sheet item intangible assets is less suitable to measure royalty bearing intellectual property since it may amongst others include acquired goodwill. On the other hand, patent ownership is not well covered in the Bureau van Dijk databases since they i) include patent applications rather than patent ownership and ii.) are incomplete. We aim to overcome these weaknesses by merging information from PATSTAT to our firm-level data. However, this merge is only feasible for a small number of firms, which reduces the coverage dramatically.
Roles ATP structures: Strategic transfer pricing
The basic combination of indicators is mostly overlapping with the ATP structures using intellectual property and royalty payments.46 This includes the necessity of a lower tax entity within the MNE group and the pre-tax and operating profitability indicators.
The main difference is that the intangibles assets and bilateral royalty flows indicators are replaced by one very important indicator generally necessary to identify this type of ATP. Namely, the [14] bilateral import price anomalies need to be consistent with the ownership structure of the MNE. We only consider MNEs, where the ownership structure is line with the bilateral price anomalies, which themselves are already depending on the relevant tax rate differential. Therefore, it follows that the MNE needs to have at least one subsidiary in a lower tax country. Regarding the target country, apart from being the country with the higher tax rate, the most relevant indicators are based on the pre-tax and operating profitability. The comparison within the MNE should clearly show a lower effective tax burden and a lower profitability in the higher tax target country. For the lower tax country, the opposite is expected.
46 The combination of indicators to identify the roles for strategic transfer pricing are summarised in the appendix in Table 40.

European Commission
Aggressive tax planning indicators
60
Therefore, we place a higher weight on this indicator than on the comparison to the domestic subsidiaries.

European Commission
Aggressive tax planning indicators
61
3.4 Methodological considerations
3.4.1 Aggregation of indicators
While some of the general indicators are defined at the country level, the ATP specific indicators are mostly at the firm level. To draw conclusions for the Member States we therefore need some form of aggregation. The goal of the aggregation is to have indicators at the Member State level that are easy to interpret and carry as much information as possible. To achieve this goal, we have two separate approaches. First, we aggregate the underlying ratios of the specific indicators to country level averages and medians to get an indication of the overall extent of ATP structures. In a second step, we identify the roles at the firm level and aggregate these number of firms in different roles up to Member State totals. This gives an indication about the relative importance of the roles by Member States.
Type specific averages and medians
The starting point for the specific indicators are the underlying firm specific ratios. Denote 𝑡𝑡𝑚𝑚 as the underlying ratio, e.g. the pre-tax profitability of individual entity 𝑖𝑖. An entity in this context can be either a firm for the comparison group, i.e. a standalone company or a firm within a domestic group, or a subsidiary or headquarter company in a MNE group. Using the binary indicators for relative tax position of the entities within MNE groups we are able to group the firms into three categories:
• Standalone companies, respectively firms within purely domestic groups.
• Firms within MNE groups, which are considered a lower tax entity, i.e. 𝜏𝜏𝑔𝑔𝑚𝑚𝑚𝑚𝑚𝑚 − 𝜏𝜏𝑚𝑚 > 5 percentage points.
• Firms within MNE groups, which are not considered a lower tax entity, i.e. 𝜏𝜏𝑔𝑔𝑚𝑚𝑚𝑚𝑚𝑚 − 𝜏𝜏𝑚𝑚 ≤ 5 percentage points.
The second approach to aggregation is to construct a categorical variable for the three types of entities. Looking at the descriptive statistics of the underlying ratios by country and firm type allows to broadly quantify the average effect of (potential) ATP activities. By comparing the country averages and medians of domestic firms to averages and median of different types of entities within MNE groups we can judge the extent of ATP. And by additionally looking at higher moments of the distribution, i.e. identifying whether the distribution is symmetrical or dominated by low or high values, we can broadly quantify whether ATP is a mass-phenomenon or driven by a few MNE groups.
Finally, turning to the computation of overall values for the EU values, we report the weighted and unweighted average. The weights are the GDP for the general country-level indicators and the number of firms for the averages of firm-specific indicators.47 One caveat is that using a GDP-weighted average brings Member States with a large share of EU GDP closer to the EU average.
47 Most of the times the weights are implicit by calculating an overall mean over the complete dataset. In the case, where we have an explicit assumption about the weight, this will be mentioned specifically.

European Commission
Aggressive tax planning indicators
62
Identification of outliers, high and low value countries
The identification of Member States with particularly high or low value is a difficult task. In some cases, we can identify clear outliers but in other cases, it is difficult to decide on a clear threshold value. To avoid subjectivity as much as possible, we use one or two standard deviations below or above the mean.48 Indeed, assuming that the distribution is normal, the percentage of values that are within one or two standard deviations of the mean are approximately 68 and 95% respectively. In other words, there is 'only' 32 and 5% chances that the value is above the threshold.
Roles of firms by Member States
The categorisation of firms with MNE groups into lower tax entities and not lower tax entities already hints at heterogeneous ATP behaviour even within the Member States. Therefore, to appropriately capture the different ATP strategies we take an additional approach to aggregation. Specifically, we allocate each entity for each ATP strategy to a role as defined in Section 2.3, namely target entity, lower tax entity and conduit entity. Furthermore, since the allocation to a specific role will not always be unambiguous, or in many instances the data may not support the hypothesis of a specific ATP structure taking place, we also allow for a further category; either the data is inconsistent with the specific ATP structure or the data is insufficient or incomplete. Each entity which has been classified into one of these four categories can be further identified as a subsidiary or the headquarter. The combination of the classification of the role and the headquarter status leaves us with eight categories (𝑅𝑅𝑂𝑂𝐿𝐿𝑅𝑅) any entity within a MNE can fall in. Then we define for each of the three main ATP structures (𝐴𝐴𝐶𝐶𝐺𝐺) binary variables 𝜃𝜃𝑅𝑅𝑅𝑅𝑅𝑅𝑅𝑅𝐴𝐴𝐴𝐴𝐴𝐴
𝑚𝑚 taking unity if the entity takes the role and zero otherwise. We define for each of the Member States 𝑐𝑐 the total number of corporate entities 𝑖𝑖 which are part of a MNE group as 𝑁𝑁𝑐𝑐 . Then summing up dichotomous variables 𝜃𝜃𝑅𝑅𝑅𝑅𝑅𝑅𝑅𝑅𝐴𝐴𝐴𝐴𝐴𝐴
𝑚𝑚 within Member States will give the number of entities with perform a specific role in any of the ATP structures. Finally, relating this number to the total number of MNE entities in the Member States gives the share of MNE entities performing a specific role. This information can then be used to evaluate in which roles Member States are predominantly used in the ATP structures.
3.4.2 Data sources and limitations
Orbis (Bureau van Dijk)
The study builds on commercially available firm-level data, which include financial accounts and ownership structures. This information is used to examine how many companies are characterised by a corporate ownership structure which is consistent with ATP structures. The choice of the Orbis database provided by Bureau van Dijk implies several (dis-)advantages. The key advantages are the public availability which ensures that the analysis is (in principle) replicable by everybody with a commercial access to the dataset. The second and most important advantage is the consistency across countries, which would be difficult to achieve using different national datasets. Another important strength of the Orbis dataset is the combination of balance sheet and ownership information in one comprehensive database. 48 For this exercise, we use the unweighted mean over the country-level values and the corresponding standard deviation.

European Commission
Aggressive tax planning indicators
63
There are also several important limitations in the choice of the Orbis. First, the coverage in Orbis is incomplete since it is not an administrative dataset. While the coverage for European firms has improved over the last years, the coverage for low tax countries outside Europe is still poor. Secondly, the data included builds on the financial accounts which are different from the tax accounts. Thirdly, different accounting standards may not be adequately reflected in the standardised accounts provided by Bureau van Dijk.
Ownership information: All Bureau van Dijk datasets include a unique identifier, which allows to link balance sheet information to the ownership information and to general information about the company (e.g. geographic location, industry etc.). Regarding the shareholder, the available information includes the direct and the global ultimate owner and their respective shareholdings. By repeatedly merging information about unique direct owners (i.e. direct owners with more than 50 percent direct ownership) one can construct ownership chains to depict the overall ownership structure of the group.49 The use of ownership chains, rather than simply the subsidiary - direct owner pair, allows us to identify more complex ownership structures of MNEs, which can include several conduit entities. However, there are also substantial limitations to the available data, some originating from the data source, some from the bottom-up approach. The potentially strongest limitation in the data is the cross-sectional nature of the ownership information. This implies that we only have a snapshot of the latest information available at the time of the download. For the purpose of this study, we build the ownership chains based on a comprehensive download from the online version of Orbis in 2013.50 The bottom-up approach also has the limitation that we can only include firms in the MNEs ownership structure which are themselves included in the ORBIS data.
Foreign direct investment data
Data about the stock of foreign direct investment in any given country and the geographical split by investing country is available from different sources, amongst others from the IMF world investment database and Eurostat. The different data sources differ with respect to the definition of FDI. Most importantly, the Eurostat data series for FDI stocks has been changed in 2013 to include FDI positions in special purpose entities (SPEs). Additionally, the FDI stock held through SPEs is reported separately. However, this information is not yet available for all bilateral country pairs. Furthermore, the old Eurostat data series of FDI stocks has been discontinued, therefore the exact impact of the new definition can not be quantified.
In contrast, the FDI stock data provided by the IMF in the world investment database does report a data series which is consistent over time. The comparison to the Eurostat data can be seen as a crude approximation for the importance of SPEs. Comparing the values for 2015 shows sizeable differences for Cyprus (189 % of GDP for inward and 217 % of GDP for outward FDI stock), Hungary (84 % inward, 92 %
49 The discussion in the technical appendix builds on Jungmann and Loretz (2016). 50 This implies that the ownership information reflects the situation around the year 2013, because the ownership information typically has shorter lags to be included. See also Section 3.4.3 for the discussion of time consistency.

European Commission
Aggressive tax planning indicators
64
outward), Ireland (128 % inward), Luxembourg (5410 % inward, 6454 % outward) and the Netherlands (439 % inward, 488 % outward).51
3.4.3 Sample period and time consistency of different data sets
The main sample period for this study is 2010 to 2015. This use of a six-year time span allows to reduce the impact of outliers in one particular year. Additionally, picking a broader time window allows to reduce the impact of the financial crisis which may be reflected in the earlier years of the sample period.
There are two main exceptions for the sample period. The first one is the ownership information which is only available for the year 2013, which lies in the middle of the sample period. Correspondingly, we also have the treaty shopping indicators only for the year 2013.
For all other country or country-pair level indicators we use the yearly data to derive the indicator. For presentational issues, we do not report yearly values in the result tables, but rather the latest available value, i.e. the value for the year 2015. In cases where the values of the indicators are following a clear time trend (e.g. the increasing importance of royalty payments) we report the averages over the whole sample period together with the latest value. In cases where yearly volatility is high, we either pool the information over the six years (firm level information) or aggregate over the full sample period (e.g. the result for the consolidated accounts).
51 See Table 44 for the complete comparison.

European Commission
Aggressive tax planning indicators
65
4 Results for EU 28 Member States
The results presented in this section follow broadly the logic of the discussion so far. The starting point is the presentation of the general indicators, which outline the tax rates situation and the potential exposure to ATP for each Member State. The country-level descriptive statistics of the specific firm-level indicators give a first indication of the relative importance of the various ATP structures. Aggregating the number of entities, which have been identified to play roles in the main ATP channels we investigate to which extent Member States are affected by ATP structures.
4.1 Distribution of indicators and data at country level
4.1.1 Tax rates and revenues
The first two columns of Table 10 list the values for the statutory corporate income tax rate and the EATR as measures for the statutory corporate tax burden.
In 2015 (used as the cut-off date given that it is the latest year for which most of the indicators data is available), the statutory corporate tax rates within the European Union varied from 10 percent in Bulgaria, 12.5 percent in Ireland and Cyprus, 15 percent in Latvia and Lithuania to 30.2 percent in Germany, 31.2 in Italy, 34 percent in Belgium, 35 percent in Malta and 38 percent in France. The unweighted EU average in comparison was at 22.8 percent.52 At a first glance, the significant tax rate differentials suggest there is potential for ATP given the empirical role played by statutory tax rates in driving ATP. At the same time, there is also the caveat that some of the high tax countries have special tax regimes for certain types of income, e.g. reduced tax rates in a patent box. This is not captured by statutory rates and measures of effective tax rates such as the EATR below only capture them to the extent that they are modelled.
The EATR varies broadly in line with the top corporate statutory tax rate, with the lowest values being in Bulgaria (9.0%), Lithuania (13.6%) and Ireland (14.1%). The unweighted average is at 21.1 percent, which is only slightly lower than the statutory corporate tax rate.53 The highest values for the EATR are 38.3 percent in France, 32.9 percent in Spain, 32.2 in Malta and 28.2 in Germany.
The second part of Table 10 lists the corporate tax revenues measured in percent of GDP for the Member States. Additionally, broad components of corporate tax revenues are listed to show the main determinants of the corporate tax revenues. Figure 5 also depicts the pairwise combinations of the corporate income tax revenues indicators.
52 The clearly higher value for the weighted average reflects the higher tax rates in larger Member States, which is in line with the standard predictions of the tax competition literature. 53 Note that it is possible that the EATR is higher than the statutory tax rates if the tax base definition is very broad. Technically, this is due to the tax burden falling on income streams which pay for the economic depreciation of the invested goods.

European Commission
Aggressive tax planning indicators
66
Table 10: Tax rates and decomposition of corporate tax revenues (2015)
Country Statutory tax rate
Effective average tax rate
Corporate tax
revenues % of GDP
Corporate tax revenues % of corporate gross
operating surplus
Corporate gross
operating surplus %
of corporate value added
Corporate value
added % of GDP
Austria 25.0 23.0 2.3 9.8 40.3 58.0
Belgium 34.0 27.8 3.4 13.4 42.3 60.9
Bulgaria 10.0 9.0 2.1 7.4 48.8 60.3
Croatia 20.0 16.5 1.9 9.9 34.1 51.5
Cyprus 12.5 15.3 5.9 27.1 42.6 50.9
Czech Republic 19.0 16.7 3.4 10.5 51.9 59.4
Denmark 23.5 21.3 2.6 11.0 41.7 56.9
Estonia 20.0 15.7 2.1 7.4 44.5 63.4
Finland 20.0 18.6 2.2 11.1 41.3 54.5
France 38.0 38.3 2.6 14.2 32.1 55.3
Germany 30.2 28.2 2.4 9.4 41.1 60.8
Greece 29.0 27.1 2.2 18.1 54.2 35.7
Hungary 20.6 19.3 1.7 7.4 48.0 55.4
Ireland 12.5 14.1 2.7 5.6 69.4 72.6
Italy 31.4 23.8 2.0 10.1 41.9 49.1
Latvia 15.0 14.3 1.6 5.2 46.5 63.9
Lithuania 15.0 13.6 1.5 4.4 53.0 66.5
Luxembourga 29.2 25.5 4.5 19.2 43.3 65.8
Maltab 35.0 32.2 6.7 19.2 50.7 50.2
Netherlands 25.0 22.5 2.7 8.8 42.9 66.2
Poland 19.0 17.5 1.8 8.1 52.1 49.9
Portugal 29.5 26.6 3.1 14.7 42.5 51.3
Romania 16.0 14.8 2.3 9.4 57.3 55.5
Slovakia 22.0 19.6 3.7 15.3 51.2 49.2
Slovenia 17.0 15.5 1.5 7.6 36.0 55.3
Spain 28.0 32.9 2.4 9.7 42.3 56.9
Sweden 22.0 20.8 3.0 12.2 37.9 63.3
United Kingdom 20.0 19.5 2.5 12.5 36.6 58.1
EU 28 27.5 25.9 2.5 11.1 40.6 57.3
Average 22.8 21.1 2.7 11.4 45.2 57.0
Std. deviation 7.3 6.8 1.2 5.0 7.9 7.3
High values FR, MT, BE, IT, DE
FR, ES, MT, DE
MT, CY, LU
CY, LU, MT, EL IE, RO, GR IE, LT, NL,
LU
Low values BG, CY, IE, LV, LT BG, LT, IE LT, SI LT, LV,
IE FR, HR, SI,
UK GR, IT, SK
Notes: a Values for revenue decomposition from 2012, b Values for revenue decomposition from 2010. EU 28 denotes the GDP-weighted average and Average refers to the arithmetic mean. High values are those above the mean plus two standard deviations (in bold) and mean plus one standard deviation. Low values are those below the mean minus two standard deviations (in bold) and mean minus one standard deviation.
Source: European Commission (2017), AMECO database, ZEW study
Malta (6.7%), Cyprus (5.9%) and Luxembourg (4.5%) stand out with particularly high corporate tax revenues, expressed in percentage of GDP, while Slovenia and

European Commission
Aggressive tax planning indicators
67
Lithuania (1.5% each) are characterised with low corporate tax revenues (expressed in percentage of GDP). In comparison, the weighted average of corporate tax revenues lies around 2.5 percent for the EU. By and large, this aggregate data show that the extremes of the spectrum are made up of smaller Member States. While some of them are able to raise substantial corporate tax revenues it also appears that several small Eastern European Member States are limited in their ability or willingness to raise corporate tax revenues.54
Further decomposition of the corporate tax revenues, as illustrated in Figure 5, highlights some additional patterns.
Figure 5: Decomposition of corporate tax revenues
Source: AMECO database, ZEW study, own illustration
First, relating the corporate tax revenues to the gross operating surplus of the corporate sector gives some form of macro-level implicit tax rate. Except for Cyprus being a clear outlier with 27.1 percent, one can see a strong positive correlation with the statutory corporate tax rate. Lower tax countries such as Lithuania, Latvia and Ireland have values in the range of 4.4 to 5.6 percent. Along with Cyprus, Malta, Luxembourg (19.2% each) and Greece (18.1%) have the highest ratios of corporate tax revenues to gross operating surplus. Countries, which are typically considered higher tax countries such as Germany (9.4%), Spain (9.7%), Italy (10.1%) and France (14.2%) are only close to the arithmetic average of 11.4 percent in this
54 The lower statutory corporate tax rates are partly contributing to the lower revenues, but as the next paragraph shows are insufficient to completely explain this pattern. Other possible explanations include substantial loss carry forward, more lenient enforcement or generous tax breaks for corporations.
AT
BE
BG
HR
CY
CZ DK
EE
FI
FR
DE
EL
HUIE
IT
LVLT
LU MT
NLPL
PT
RO
SK
SIES
SEUK
510
1520
25C
orp.
tax
reve
nues
/Cor
p. S
urpl
us
10 20 30 40Statutory corp. tax rate
AT
BE
BG
HR
CY
CZDK
EE
FI
FR
DE
EL
HUIE
IT
LVLT
LU MT
NL PL
PT
RO
SK
SIES
SEUK
510
1520
25C
orp.
tax
reve
nues
/Cor
p. S
urpl
us
30 40 50 60 70Corp. surplus/Corp. VA
ATBE
BG
HR
CY
CZ
DKEE
FI
FR
DE
EL
HU
IE
IT
LV
LT
LU
MT
NL
PL
PT
RO
SK
SI
ES
SEUK
3040
5060
70C
orp.
sur
plus
/Cor
p. V
A
30 40 50 60 70Corp. VA/GDP
ATBEBG
HR CY
CZDK
EE
FI FR
DE
EL
HU
IE
IT
LVLT LU
MT
NL
PL PT
RO
SK
SI ES
SE
UK
3040
5060
70C
orp.
VA
/GD
P
1 2 3 4 5 6 7Corp. tax revenues/GDP

European Commission
Aggressive tax planning indicators
68
measure. One potential reason for this could be that they are not fully able to tax the corporate profits at the desired rate due to the presence of ATP.
Relating the gross operating surplus to the value added yields a macro measure of profitability of the corporate sector. The one country standing out with a particularly high value in this case is Ireland where the gross operating surplus of the corporate sector amounts to 69.4 percent of its value added.55 Other countries with relatively large values are Romania (57.3%) and Greece (54.2%). At the other end of the spectrum we find France (32.1%), Croatia (34.1%), Slovenia (36.0%) and the United Kingdom (36.6%), which are all clearly below the arithmetic EU average of 45.2 percent. The potential explanations for this pattern may be numerous, but in particular for France that displays high statutory and effective tax rates, this could reflect that some parts of the corporate profits are moved to lower tax countries.
Finally, relating the value added of the corporate sector to the GDP yields a measure of the size of the corporate sector. Comparing this to the statutory tax rate one can interpret a negative relationship as an impact of taxation on real activities rather than pure profit shifting. Again, Ireland stands out with the highest value of 72.6 percent for the corporate sector, followed by Lithuania, the Netherlands and Luxembourg with values around 66 percent. On the lower side, Greece is a clear outlier with a share of the corporate sector of only 35.7 percent, followed by Italy (49.1%) and Slovakia (49.2%). In comparison, the EU wide arithmetic average is at 57.0 percent.
Key findings
The statutory corporate tax rate varies substantially between the Member States which implies scope for ATP structures. The corporate tax revenues expressed as a percentage of GDP only partly reflect the differences in the statutory rates and suggest that some small Member States like Cyprus, Malta and Luxembourg are able to raise more tax revenues. The decomposition of the corporate tax revenues reveals that Ireland stands out with a particular high profitability of the corporate sector, which may indicate that it is able to attract substantial tax base. Others like France, Croatia, Slovenia or the United Kingdom appear to have a profitability of their corporate tax base well below the EU average. This may reflect an erosion of the tax base owing to ATP (as could be envisaged for a high tax country like France) but also reflect the general economic situation.
4.1.2 Foreign direct investment
The first four columns of Table 11 report the values of total inward and outward FDI stocks for all Member States. To account for country-size effects the FDI stocks are reported both in millions of Euro and in percent of GDP.
Several Member States stand out with particularly high values of both inward and outward FDI stocks. In Luxembourg both inward (5766%) and outward (6749%) FDI stocks are a multiple of the GDP. Similarly, in Malta, inward FDI amount to more than 17 times of the GDP and the FDI outward stocks are also almost 7 times larger than 55 The value for 2015 is particularly high due to a number of big corporate inversions which are also reflected in a 26.3 % growth in GDP. Nevertheless, Ireland also had above average values for the share of the corporate sector and the profitability of the corporate sector in the years 2010 to 2014.

European Commission
Aggressive tax planning indicators
69
the GDP. For Cyprus (roughly 900 percent of GDP), the Netherlands (more than 500 percent of GDP) and Ireland (more than 3 times GDP), we can also observe extraordinarily large inward and outward FDI stocks.56 Very large parts of this FDI stocks appear to be held in SPEs since the comparison to the IMF data does show less extreme values. Ireland in particular has recently experienced a large increase in outward FDI resulting in a substantially larger outward FDI stock compared to the inward FDI stock.57 The very high level of both inward and outward FDI stocks are a clear indication of the attractiveness of Cyprus, Luxembourg, Malta and the Netherlands for holding companies, which themselves are foreign owned.
Greece is yet again an outlier with both very low inward and outward FDI stocks. The characteristic of very low outward FDI stocks is also observed for most of the Eastern European Member States. However, in this case the disparity of inward and outward FDI stocks is more likely due to still underdeveloped capital markets.
The last two columns in Table 11 present hypothetical FDI stocks. Specifically, we predict bilateral FDI stocks using economic and geographical characteristics of the countries. We use a simple gravity framework to simulate the FDI patterns. In its simplest form, the gravity framework assumes that bilateral flows – in our case the bilateral FDI stocks – are directly proportional to the relative GDP and indirectly proportional to the distance between the country pair. In our case, we would expect larger countries to attract more FDI and also to hold larger FDI positions abroad. For any given country-sizes we expect that country pairs which are further apart are characterised by lower bilateral FDI stocks. Using the GDP data and bilateral distances for 166 countries we simulate the fraction of FDI stock which would be between each country pair, if the simple gravity model holds. Then the observed world FDI stock is apportioned to each country pair according to these theoretically predicted FDI shares and aggregated over the countries. For ease of interpretation the last column compares the predicted FDI stock with the observed one.58 We present the predicted value as percentage of the observed value, which implies that (by the simple gravity model) unexplained FDI results in a value different from unity; high (low) values implying that there should be more (less) FDI in this country. The fact that the predicted FDI stock only amounts to 76.9 percent for the EU overall is partly due to the fact, that we are relying on the world FDI stock without SPEs for our simulations. At the same time, since we are simulating the FDI stocks worldwide, there is no constraint that the predicted FDI stocks need to match the observed FDI stocks for a geographical region.
56 We deviate from the standard approach of only naming those countries with higher (lower) values than unweighted average plus (minus) standard deviation because the very large outlier Luxembourg inflates both average and standard deviation. 57 In the Eurostat data - which includes SPEs - there is a strong increase in both inward and outward FDI stock in Ireland in 2015. In the FDI data provided by the IMF there is only a strong increase in outward FDI stocks for Ireland in 2015. On possible reason is the different treatment of FDI through SPEs. The IMF aims to collect FDI flows and stocks for SPEs separately. However, up to date for Ireland no separate data about FDI flows/stock through SPEs are available. Therefore, it is difficult to fully account for the big differences between the two data sources. 58 Note that the simple gravity framework yields balanced inward and outward shares. Therefore, we compare the simulated value to the average of the inward and outward FDI stock.

European Commission
Aggressive tax planning indicators
70
Table 11: Foreign direct investment positions (2015)
inward FDI stock outward FDI stock Gravity FDI stock (simulated)
in % of GDP
Mio. of Dollars
in % of GDP
Mio. of Dollars
Mio. of Dollars
in % of observed
value Austria 70.6 240056 83.8 284737 235613 89.8
Belgium 102.2 418266 100.1 409880 538002 129.9
Bulgaria 86.0 37958 4.0 1762 23497 118.3
Croatia 54.0 23721 11.5 5035 30010 208.7
Cyprus 904.7 159557 906.5 159879 7239 4.5
Czech Republic 61.5 102756 10.1 16897 122468 204.7
Denmark 39.2 104234 63.0 167672 180815 133.0
Estonia 86.2 17462 27.9 5657 11831 102.4
Finland 35.5 74154 40.8 85352 104891 131.5
France 27.8 606370 50.5 1101103 1832664 214.7
Germany 23.8 722826 41.7 1264059 2471133 248.7
Greece 12.1 21348 14.6 25666 80372 341.9
Hungary 160.6 176125 124.1 136093 70387 45.1
Ireland 311.0 795644 318.7 815202 140908 17.5
Italy 18.9 309620 26.1 429228 842831 228.1
Latvia 55.6 13545 4.9 1196 13572 184.1
Lithuania 36.2 13497 6.4 2397 20784 261.5
Luxembourg 5766.8 3005207 6749.3 3517234 63527 1.9
Malta 1732.0 152216 700.4 61553 3414 3.2
Netherlands 534.9 3618685 633.4 4285080 823059 20.8
Poland 39.3 167917 5.2 22354 248081 260.8
Portugal 58.7 105475 30.5 54699 82590 103.1
Romania 40.2 64440 0.5 745 82087 251.9
Slovakia 51.0 40129 2.8 2177 62379 294.9
Slovenia 30.0 11565 14.2 5461 27438 322.3
Spain 46.7 502663 41.9 450361 514290 107.9
Sweden 62.2 277877 76.9 343786 239675 77.1
United Kingdom 50.2 1294795 55.6 1433450 1960756 143.7
EU 28 63.1 13078106 72.9 15088714 10834312 76.9
Average 374.9 362.3 151.9
Std. deviation 1115.7 1272.9 101.3
High values LU, MT LU EL, SI, SK, LT, PL
Low values LU, MT, CY, IE, NL, HU
Notes: EU 28 refers to the weighted average (for the ratios in % of GDP). Average refers to the arithmetic mean of the ratios (in % of GDP). High values are those above the mean plus two standard deviations (in bold) and mean plus one standard deviation. Low values are those below the mean minus two standard deviations (in bold) and mean minus one standard deviation.
Source: Eurostat, World Bank, own calculations

European Commission
Aggressive tax planning indicators
71
In line with the observed very large actual FDI positions, Luxembourg, Malta, Cyprus, Ireland, the Netherlands but also Hungary exhibit a very low value, which indicates that the observed FDI stocks can only be very poorly explained by the economic fundamentals in the gravity model.
Greece and some Eastern European Member States (Slovenia, Slovakia, Lithuania and Poland) have the highest values of this indicator, reflecting that their FDI positions are below what the simple theory would predict.
In Table 12 we move beyond the simple FDI stock and use the information from the foreign affiliate statistics and the structural business survey to investigate the economic relevance of the FDI situation in the countries. The first column provides a simple measure of market concentration by calculating the share of turnover in each Member States which is made by large companies, i.e. companies with more than 250 employees.
The United Kingdom (55.3%) and Germany (52.9%) stand out as the two Member States with the highest values for this indicator. At the other end of the distribution there are Malta (18.1%), Cyprus (18.8%), Estonia (22.2%) and Latvia (22.4%) which have much less turnover in large companies. In comparison, on average in the EU, around 44 percent of the turnover is made in large companies. One caveat of this measure is that the same definition of being a large company applies to all Member States. This may understate the importance of larger companies in smaller Member States, since in these smaller countries firms below 250 employees are already relatively large. The unweighted average 36.6 percent lies below the overall average for the EU, which underlines that larger Member States have a higher value in this indicator.
The rest of Table 12 presents the relative importance of foreign-controlled firms in the Member States. In terms of simple number of firms under foreign control Luxembourg (28.9%) and Estonia (24.7%) clearly stand out. Greece (0.2%), Italy (0.3%), Spain (0.5%), Portugal (0.6%), Slovakia (0.8%) and France (0.8%) show low values in line with their relatively small FDI stocks, while the low values for Belgium (0.2%), Malta (0.6%) and Cyprus (0.7%) do not reflect the large FDI stocks.59 An alternative explanation for low shares of foreign-controlled firms could be a high number of domestic firms, here again due to tax or non-tax reasons.
The last three columns in Table 12 show the percentage of turnover, value added and gross surplus made in foreign-controlled firms. Here, Ireland, Luxembourg and some of the Eastern European Member States, most notably Hungary, Romania and the Czech Republic stand out with high values. Compared to the EU-wide average of 28.3 percent of turnover made in foreign-controlled companies the share of turnover in firms under foreign control is above 45 percent – or about one standard deviation above the unweighted average of 32.7 percent – in all of these countries. This is also reflected in a corresponding larger share of value added and gross operating surplus by foreign-controlled companies in these countries.
59 The large outliers Luxembourg and Estonia imply that one standard deviation below the unweighted average results in a negative share. To still describe Member States with low values, we name all countries with a share below 1 percent.

European Commission
Aggressive tax planning indicators
72
Table 12: Foreign-controlled corporate activities (2014)
Country
Share of turnover in companies
with more than 250 employees
Share of foreign
controlled firms
Foreign-controlled firms’ percentage of
Turnover Value added
Gross operating surplus
Austria 33.7 3.1 34.0 24.8 21.9 Belgium 36.3 0.2 36.5 27.9 26.2 Bulgaria 30.5 3.8 33.8 31.2 34.2 Croatiaa 41.0 2.7 27.2 24.0 29.3 Cyprusb 18.8 0.7 12.5 11.0 14.0 Czech Republic 42.3 1.3 45.4 42.1 41.5 Denmark 40.8 1.8 24.0 22.9 22.0 Estonia 22.2 24.7 44.9 41.1 41.7 Finland 45.4 1.2 19.0 21.0 22.6 Franceb 42.1 0.8 19.9 15.7 12.0 Germany 52.9 1.2 23.6 23.6 27.0 Greecea 28.0 0.2 12.3 11.4 8.4 Hungary 42.4 3.5 53.1 52.2 58.4 Ireland 44.0 2.3 56.2 57.1 73.6 Italya 31.5 0.3 17.0 14.2 12.7 Latvia 22.4 6.7 39.4 32.1 33.6 Lithuania 33.4 2.2 35.6 27.6 29.2 Luxembourg 31.7 28.9 49.1 44.8 50.4 Malta 18.1 0.6 21.6 23.7 23.4 Netherlands 37.4 1.2 36.2 27.7 29.4 Poland 44.1 9.3 36.5 34.8 36.5 Portugalb 29.1 0.6 22.0 20.7 21.1 Romania 41.7 5.8 48.3 45.0 46.2 Slovakia 45.2 0.8 46.5 35.4 32.7 Slovenia 31.9 4.5 26.0 21.9 22.2 Spain 38.5 0.5 26.5 20.9 21.4 Sweden 43.2 1.8 31.0 26.6 25.1 United Kingdom 55.3 1.2 38.1 29.4 30.9
EU 28 44.2 1.2 28.3 24.2 26.2
Average 36.6 4.0 32.7 29.0 30.3 Std. deviation 9.5 6.8 12.2 11.7 14.4
High values UK, DE LU, EE IE, HU, LU, RO, SK, CZ
IE, HU, RO, LU,
CZ
IE, HU, LU, RO
Low values MT, CY, EE, LV
EL, CY, IT, FI,
FR
CY, EL, IT, FR
EL, FR, IT, CY
Notes: EU 28 refers to the average for the EU overall and Average refers to the arithmetic mean of the country values. High/low values are one standard deviation above/below the mean, bold entries are 2 standard deviations above/below. a Values for the year 2013. b Values for the year 2011. Values for the year 2015 are not yet available.
Source: Foreign affiliate statistics and Structural Business Survey (Eurostat), own calculations

European Commission
Aggressive tax planning indicators
73
The case of Ireland is particularly interesting, since it is the only country where the fraction of surplus made in foreign-controlled countries with a value of 73.6 percent is substantially larger than the fraction of turnover or value added. This hints at foreign-controlled companies being more profitable than the domestic ones. Together with the relatively low corporate tax rate in Ireland, this points into the direction of Ireland being able to attract corporate tax base from ATP. The opposite can be observed in Austria (21.9% of surplus compared to 34.0% of turnover) and Belgium (26.2% of surplus compared to 36.5% of turnover), where the foreign-controlled companies are substantially less profitable than the domestic ones. However, the tax rate situation in these two countries is less obvious with relative high statutory tax rates in combination with potentially substantial reductions in the tax base because of tax rules such as the notional interest deduction in Belgium.
Greece, Cyprus, France and Italy all have very low values for turnover, value added and profits in foreign-controlled firms. Except for Cyprus, this is consistent with the relatively small FDI stocks.
Key findings
The FDI stocks in percent of GDP give a broad impression whether a Member State is exposed to ATP. In some instances, extraordinarily high values might be an indication that substantial ATP takes place. Both inward and outward FDI stocks are several times higher than GDP in Luxembourg, Malta, Cyprus, the Netherlands and Ireland. These large numbers are to a large extent due to FDI through SPEs. Marked differences in market shares of large corporations suggest that some Member States like Germany or the United Kingdom are more exposed to ATP. The high share of foreign controlled firms in Luxembourg and Estonia is likely to reflect some tax driven behaviour. Equally, the very high share of surplus in foreign controlled firms in Ireland, Hungary, Luxembourg and Romania is also consistent with higher than average corporate tax bases, as measured by the ratio of gross operating surplus to value added in Table 10, and could indicate ATP.
4.1.3 Geographical distribution of MNEs and relative tax situations
The next step investigates the geographical distribution of the MNE groups and relates this information to the tax rate information per country. The starting point for our analysis at the firm level is the ownership structure of the corporations. To be relevant for our analysis, a corporate group must consist of at least two legal entities and have a legal entity in at least two countries.60 Additionally, since we are interested in the impact of ATP on MNEs located in Europe, we also impose the restriction that at least one of the entities needs to be located within the EU 28 countries. This leaves us with an overall number of 408,590 entities within 67,120 MNE groups.61
60 We use the term legal entity here, since for most of our analysis it does not matter where in the ownership structure the firm is located, i.e. it is not relevant whether the tax liabilities are reduced in a subsidiary or at the headquarter. 61 See Table 45 and Table 46 in the appendix for the geographical distribution.

European Commission
Aggressive tax planning indicators
74
Table 13: MNE entities by relative statutory tax rates (2015)
Share of firms/MNE groups in Member States which
are lower tax entities are the lowest tax entity
have a zero/no tax entity in the MNE group
firms MNE groups firms MNE
groups firms MNE groups
Austria 70.2 59.2 18.7 25.3 1.5 1.3 Belgium 31.8 29.4 0.0 0.0 3.9 1.7 Bulgaria 81.5 82.2 93.1 94.3 5.3 4.5 Croatia 49.6 49.1 25.8 32.8 2.1 2.1 Cyprus 79.3 79.1 96.8 97.0 1.2 1.0 Czech Republic 72.6 71.1 60.3 68.9 2.8 1.9 Denmark 54.1 49.4 22.9 25.2 1.9 1.9 Estonia 36.4 36.9 44.7 50.2 2.2 2.4 Finland 59.6 58.4 50.8 60.1 1.2 1.5 France 0.0 0.0 1.6 4.2 6.5 1.5 Germany 52.8 35.4 0.0 0.0 2.2 1.5 Greece 39.1 36.5 10.3 12.8 2.1 1.9 Hungary 59.0 48.2 0.0 0.0 3.3 2.3 Ireland 96.7 97.0 85.0 89.5 7.6 5.1 Italy 47.5 33.7 0.0 0.0 4.3 1.6 Latvia 53.6 52.0 74.0 74.6 3.3 4.0 Lithuania 56.7 57.8 82.8 82.2 1.6 2.0 Luxembourg 33.6 27.0 0.0 0.0 4.9 3.5 Malta 0.0 0.0 0.8 1.2 5.3 3.5 Netherlands 73.9 54.8 21.2 33.7 6.7 5.3 Poland 79.5 78.6 51.1 67.4 2.8 1.7 Portugal 47.6 44.3 11.1 14.4 1.5 1.9 Romania 68.3 66.6 60.4 66.9 4.2 3.2 Slovakia 51.2 47.4 13.5 15.5 2.7 1.9 Slovenia 40.5 40.6 26.7 32.4 1.1 1.3 Spain 60.0 49.9 28.2 36.7 3.2 2.2 Sweden 50.8 45.8 27.5 36.9 1.1 1.3 United Kingdom 83.6 73.0 37.6 64.1 7.3 5.6 EU 28 52.2 48.9 21.6 32.4 4.7 3.6
Average 54.6 50.1 33.7 38.8 3.3 2.5 Std. deviation 22.5 22.2 31.2 32.4 2.0 1.3
High values IE, UK, BG, PL, CY
IE, BG, CY, PL, UK
CY, BG, IE, LT, LV
CY, BG, IE, LT, LV
IE, UK, NL, FR, BG
UK, NL, IE, BG, LV
Low values FR, MT, BE
FR, MT, LU
BE, DE, HU, IT,
LU, MT, FR
BE, DE, HU, IT,
LU, MT, FR
SI, SE, CY, FI CY
Notes: A lower tax entity is defined as having a statutory corporate tax at least 5 percentage points lower than the highest statutory tax rates within the MNE group. The lowest tax rate entity is defined as entity with the lowest statutory corporate tax rate within the MNE group. Averaged over the period 2010 to 2015. The ownership information is from 2013, while tax rate information is from 2010 to 2015. EU 28 refers to the average value for the EU overall and Average refers to the arithmetic mean of country values. High/low values are one standard deviation above/below the unweighted "Average", bold entries are 2 standard deviations above/below.

European Commission
Aggressive tax planning indicators
75
Source: Orbis data (Bureau van Dijk), ZEW study, own calculations
We merge this ownership structure with information about the statutory corporate tax rates in the respective countries. This allows us to categorise each entity of the corporate groups as either a lower tax entity (at least 5 percentage point tax differential to the highest statutory tax rate in the MNE group) or as the lowest tax entity, if there is no entity within the group which has a lower statutory tax rate. Additionally, we can identify those groups, which have an entity in a zero/no tax country.62
In Table 13 we present the share of firms in each Member State which are classified into these three relative tax rate categories. For each of the category we also present the share of MNE groups in each Member State.63 Additionally, Figure 6 illustrates this categorisation together with the headline statutory tax rates in the Member States. The upper part in Figure 6 starts with comparing the share of firms which are classified as a lower tax entity to the statutory corporate tax burden. Not very surprisingly, the higher the corporate tax rate is, the smaller the share of firms which still classify as a lower tax entity.
Figure 6: Corporate tax rates (2015) and MNE entities by relative tax rates
Source: Orbis data (Bureau van Dijk), ZEW study, own calculations
62 See Table 49, Table 50 and Table 51 in the appendix for the assumptions about the corporate tax rates. 63 This removes the implicit weighting by number of entities, since it counts each MNE group – regardless the actual number of entities - only once in each Member State.
European Commission
Aggressive tax planning indicators
76
This is most evident at the extreme bounds of the corporate tax rate distribution. France has a corporate tax rate of 38 percent, which – in combination with no corporate tax rate higher than the 40 percent in the United States, rules out the classification as a lower tax entity. Equally, firms in Malta are never classified as lower tax entity. In contrast 96.7 percent of the firms in Ireland are classified as a lower tax entity, i.e. are in a group with at least on entity in a country with tax rate higher than 17.5 percent.64 Other Member States with a high share of firms classified as lower tax entities are the United Kingdom (83.6%), Bulgaria (81.5%), Poland (79.5%) and Cyprus (79.1%). Entities in Member States with relatively high statutory tax rates e.g. Germany, Italy or Spain, are nevertheless classified as lower tax entities to some extent, reflecting that they often belong to MNE groups with entities with an even higher tax burden, most notably Japan and the United States. This is also reflected in the overall average, where we find that 52.2 percent of the entities in the EU are classified as a lower tax entity.
However, looking at the second indicator in Table 13, it becomes evident that a large fraction of the MNE groups in the EU have further subsidiaries in lower tax jurisdictions. All the entities in Belgium, Germany, Hungary, Italy and Luxembourg belong to MNE groups with at least one entity in a lower tax country and only a very small fraction of the entities in Malta (0.8%) and France (1.6%) are the lowest tax entity.65 In contrast, for the vast majority of the entities in Member States with lower corporate tax rates, i.e. Cyprus (96.8%), Bulgaria (93.1%), Ireland (85.0%), Lithuania (82.8%) and Latvia (74%), these entities are also the entities with the lowest corporate tax rate within the MNE group. The low overall average of only 21.6 percent of entities (32.4 percent of the MNE groups) being in the lowest tax country reflects two different characteristics. First, MNE groups typically have only few entities in lower tax countries and a larger number of entities in higher tax countries. Secondly, the lowest tax entities are outside the EU and therefore not captured in this average based only on the EU part of the MNEs.
The latter claim is partly addressed in the third indicator in Table 13 which looks at the share of MNE groups which also have an entity in a zero/no tax country. Overall, we find that 4.7 percent of the entities in the EU are within MNE groups, which also have a presence in a zero/no tax country. In terms of MNE groups, we find that 3.7 percent also have a presence in a zero/no tax country. This lower number reflects that on average MNE groups with more subsidiaries also have a subsidiary in a zero/no tax country. Note, that this is a very conservative estimate of a presence in zero/no tax country, since we require to have a least the basic information about the zero/no tax country entity in the ORBIS data base.
Regarding the difference between the Member States, Ireland (7.6%), the United Kingdom (7.3%), the Netherlands (6.7%), France (6.5%) and Bulgaria (5.3%) stand out with the highest values. The type of countries that have a share above the EU average is quite diverse, ranging from high to low tax countries. This might indicate 64 Throughout the sample period of 2010 to 2015 the statutory tax rate in Ireland was 12.5 percent. Since to be classified as a lower tax entity, the tax rate in this entity must be at least 5 percentage points lower than the maximum tax rate within the MNE group, this implies at least one other entity with a tax rate of 17.5 percent or higher. 65 Note that is it is possible to be classified as a lowest tax entity, but not as a lower tax entity if the difference to the highest tax country is less than 5 percentage points.

European Commission
Aggressive tax planning indicators
77
that ATP is relevant for all these countries but in different ways. Of the traditionally higher tax countries MNE entities in France (6.5%) have a much stronger link to zero/no tax countries, compared to 4.3 percent for MNE entities in Italy and only 2.2 percent in Germany. However, this difference cannot be observed when looking at the share of MNE groups with a presence in zero/no tax countries. The Member States with the smallest number of entities in groups with links to zero/no tax countries are Slovenia, Sweden (1.1% each), Cyprus and Finland (1.2% each).
Key findings
In several European countries (Belgium, Germany, Hungary, Luxembourg and Italy), all MNE entities have at least one subsidiary in a country with a lower tax burden, which reflects that these Member States are potentially more exposed to ATP. Being exposed to ATP does however not necessarily mean that a country's tax base is eroded. It can also be an indication that the country's tax rules are being used to shift profits but with limited direct impact on the tax base. At the other end of the spectrum, the countries identified as having the lowest statutory tax rates (see section 4.1.1), i.e. Cyprus, Bulgaria, Ireland, Lithuania and Latvia, host the highest share of MNE entities classified as lowest tax entities. This may be an indication that these Member States are more likely to benefit from ATP structures, with tax base shifted into these entities. Finally, looking at the share of MNE entities which are in MNE groups with a presence in a zero/no corporate tax country, Ireland, the United Kingdom, the Netherlands, France and Bulgaria stand out with the strongest links which may be an indication that these countries are more exposed to ATP, but potentially in different ways.
4.1.4 Consolidated profitability and effective tax burden in MNE groups
One indication of the existence of ATP is to look at the effective tax burden of MNE groups compared to their domestic counterparts. Under the assumption that the ATP structure does primarily affect the tax liabilities but leaves the tax base unchanged, we should be able to see lower effective tax burdens for MNE groups. In contrast, if the ATP structure reduces the corporate tax base, we will not necessarily see a difference in the effective tax burden, but rather see a difference in the pre-tax profitability.
Furthermore, ATP structures can reduce the pre-tax profits via a reduction in financial profits and losses (e.g. through an interest deduction) or through a reduction in the operating profits (e.g. through transfer pricing or a royalty payment). Consequently, we may see different patterns of the effective tax rate and profitability measures, depending on the definition of our indicators.
Figure 7 compares the overall distribution of two effective tax rate measures of MNEs and domestic companies. The upper part of Figure 7 looks at the ratio of tax liabilities in the financial accounts to the profit and loss before taxation (PLBT). And the lower part displays the tax liabilities as percent of earnings before interest and taxation (EBIT).

European Commission
Aggressive tax planning indicators
78
Figure 7: Distribution of consolidated ETRs by MNE status (2010-2015)
Source: Orbis data (Bureau van Dijk), own calculations
In both measures we see that the MNE groups – depicted as the transparent bars in the histogram – appear to exhibit higher effective tax rates than the domestic groups.66 In Table 14 and Table 15, we compare some descriptive statistics, namely, means, medians and skewness, of both ETR measures at the Member State level. Additionally, we provide the share of firms with suitable data to calculate the effective tax burden.67 Because of the asymmetric tax treatment of taxable losses, we can only derive a meaningful ETR measure if the profit measure is positive. Even by aggregating over the full sample period of 2010 to 2015 we are still far from being able to use all observations.
66 A simple t-test confirms that the ratio EBIT-based ETR 3 percentage points higher for MNEs while the PLBT-based ETR is 7 percentage points higher. Both effects are statistically significant. 67 The share of firms used relates to the number of consolidated accounts in the data, see Table 56 in the appendix for the breakdown by Member States.
01
23
4D
ensi
ty
-1 -.5 0 .5 1(mean) etr_average1
domestic groups MNE
Taxation/PLBT
01
23
4D
ensi
ty
-1 -.5 0 .5 1(mean) etr_average
domestic groups MNEs
Taxation/EBIT

European Commission
Aggressive tax planning indicators
79
Table 14: Consolidated ETR (Tax/PLBT), by Member States (2010-2015)
Domestic groups Multinational groups
Country %
obs. used
TAX/PLBT % obs. used
TAX/PLBT
Mean Median Skewness Mean Median Skewness
Austria 56.2 22.9 24.7 0.9 62.3 28.7 28.8 0.3
Belgium 56.6 36.0 34.7 0.4 63.9 35.2 33.2 0.5
Bulgaria 41.2 14.2 10.3 3.7 57.1 9.8 8.7 0.4
Croatia 30.4 13.9 10.9 2.1 43.5 20.5 18.7 0.5
Cyprus 14.6 20.0 16.0 1.5 16.7 21.7 17.2 0.2
Czech Republic 26.5 26.8 18.7 2.3 50.0 24.4 21.5 0.6
Denmark 58.4 22.8 23.7 0.8 65.8 29.3 27.1 1.2
Estonia 80.0 9.2 9.0 0.1 72.7 19.0 16.2 1.5
Finland 71.0 22.2 21.8 1.8 64.8 28.1 24.6 1.2
France 41.6 29.7 29.7 0.7 46.6 37.1 37.1 0.3
Germany 49.5 31.7 30.9 0.7 61.5 40.0 38.1 0.5
Greece 26.1 32.6 28.9 0.7 30.7 37.9 34.4 0.6
Hungary 51.1 13.9 9.9 2.4 63.2 14.9 9.3 0.9
Ireland 30.2 18.3 16.3 1.8 47.7 21.6 18.7 1.5
Italy 40.3 47.6 44.7 0.3 55.1 45.6 43.0 0.2
Latvia 65.3 19.7 17.4 1.0 73.1 14.4 16.0 0.3
Lithuania 66.7 10.1 10.4 -0.2 25.0 9.0 9.0 n.a.
Luxembourg 50.0 18.2 13.0 0.5 46.6 32.8 32.3 0.6
Malta 55.1 21.7 23.7 -0.4 33.3 17.4 16.2 0.8
Netherlands 55.0 24.3 24.1 1.5 60.7 28.9 26.0 1.1
Poland 53.4 22.3 20.3 1.9 63.6 22.9 20.2 2.6
Portugal 46.0 28.7 27.2 1.3 54.3 38.4 34.2 0.8
Romania 52.7 19.5 17.8 1.1 100.0 21.2 21.2 0.0
Slovakia 39.1 26.5 23.8 0.3 28.6 14.6 14.6 0.0
Slovenia 45.5 11.7 14.1 -0.6 41.7 16.1 17.6 -0.2
Spain 40.8 27.2 27.7 1.0 50.6 30.7 29.4 1.0
Sweden 58.5 24.8 23.5 1.3 62.8 32.0 29.4 0.9
United Kingdom 41.9 23.2 22.7 1.2 59.0 30.3 28.3 0.9
EU 28 47.5 26.5 24.4 1.1 58.1 33.4 31.1 0.7 Average 22.8 21.3 1.1 25.8 24.0 0.7 Std. deviation 8.3 8.4 0.9 9.6 9.3 0.6
High values IT, BE, EL, DE
IT, BE, DE, FR
BG, HU, CZ, HR
IT, DE, PT, EL,
FR
IT, DE, FR, EL,
PT
PL, EE, IE
Low values
EE, LT, SI, HU, HR, BG
EE, HU, BG, LT,
HR
SI, MT, LT, EE LT, BG, LV,
SK, HU BG, LT, HU, SK
SI, SK, RO
Notes: Based on the consolidated accounts from Orbis. "% obs. used" refers the fraction of accounts which have a positive pre-tax profit, a non-negative tax liability and an effective tax rate within the interval of 0 to 1. Means and Medians are in %. n.a. represents a case, where the skewness is not defined because we have only one observation. EU 28 refers to the average value for the EU overall and Average refers to the arithmetic mean of the country values. High/low values are one standard deviation above/below the unweighted "Average", bold entries are 2 standard deviations above/below.
Source: Orbis data (Bureau van Dijk), own calculations
European Commission
Aggressive tax planning indicators
80
Overall, we can use 47.5 percent of the accounts of domestic companies and 58.1 percent of the MNEs. That said, since we only have consolidated accounts for a subset of 7,917 of the 48,318 EU-based global ultimate owners in our dataset of unconsolidated accounts, we have a meaningful measure of the ETR for approximately 10 percent of the MNE groups in our sample. 68 This limitation contributes to the only moderate importance attributed to this indicator when allocating entities to roles. One additional potential pitfall in the interpretation of the ETR indicator could be that MNE groups are more likely to report overall taxable losses, and hence we systematically drop more observations for the MNE groups. However, the higher percentage of usable observations for MNEs does not support this hypothesis.
The effective tax burden measure based on the PLBT (in Table 14) is higher in the EU on average for MNEs (33.4%) than for domestic groups (26.5%). It is neither driven by a larger number of MNEs in higher tax countries, nor is it due to higher ETRs in selected countries. On the contrary, for all Member States with decent coverage, the ETRs for MNE groups are higher. The same holds for the median values which rules out the potential explanation that higher ETRs are driven by extreme outliers. Looking at the skewness of the distributions by Member States we see almost only positive values which is also reflected in positive skewness overall. The positive skewness implies that indeed the averages are somewhat inflated by a few firms with larger values. This can be the case for Bulgaria, Hungary, Czech Republic and Croatia for their domestic companies and in Portugal, Estonia and Ireland for MNEs. However, the absolute value of the skewness is only moderately positive which implies that the averages are not too strongly affected by outliers.69
Italy stands out with the highest average and median ETRs for both domestic companies and MNEs (i.e. above 40%). It is clearly above the statutory tax rate. Several other countries are also exhibiting high average and median values of ETRs, e.g. Germany, France, Belgium, Greece and Portugal, while some of the Eastern European countries have quite low average ETRs, for example Hungary, Bulgaria, Lithuania. However, since several of these averages are based on very few observations the numbers have to be seen with caution.
Turning to differences between the ratios for domestic and MNE groups, seven Member States have both their mean and median domestic ETRs above the corresponding MNE ones. Slovakia has the largest difference with 11.9 and 9.2 pp. difference respectively. Malta comes second with differences of 4.3 and 7.5 pp. The other Member States are Belgium, Bulgaria, Italy, Latvia and Lithuania. At the other end of the spectrum, Luxembourg displays an ETR for domestic companies, which is well below the corresponding one for MNE groups.
68 The total number of global ultimate owner in our sample is 67,120. However, for this part of the analysis we are only considering the 48,318 EU-based owners. 69 This is also due to the fact, that we discard all observations with an ETR outside the interval of -1 to 1.

European Commission
Aggressive tax planning indicators
81
Table 15: Consolidated ETR (Tax/EBIT), by Member States (2010-2015)
Domestic groups Multinational groups
Country %
obs. used
TAX/EBIT % obs. used
TAX/EBIT
Mean Median Skewness Mean Median Skewness Austria 69.8 19.4 19.8 1.2 74.3 22.5 23.4 1.2
Belgium 65.2 27.8 29.0 0.6 72.5 25.9 24.8 1.5
Bulgaria 47.4 10.7 7.0 2.1 57.1 7.5 8.7 -1.0
Croatia 53.9 7.4 6.9 1.3 56.5 11.7 10.6 0.7
Cyprus 20.4 14.0 11.0 1.0 38.1 15.3 14.7 0.7
Czech Republic 29.4 32.5 21.7 1.6 87.5 24.7 18.8 1.9
Denmark 63.0 20.8 20.8 1.4 73.7 23.2 23.1 1.4
Estonia 60.0 28.3 17.7 0.7 63.6 15.5 13.6 1.0
Finland 72.5 19.9 19.8 1.7 72.8 23.6 22.2 1.6
France 57.2 24.9 24.9 1.1 66.5 26.9 26.0 1.4
Germany 67.1 24.0 23.4 1.3 76.1 27.8 27.4 1.5
Greece 43.2 20.6 17.4 1.7 58.7 22.7 21.7 0.9
Hungary 48.9 16.1 10.5 1.7 68.4 12.6 10.3 1.0
Ireland 39.7 14.7 13.5 2.4 54.9 19.3 15.3 2.6
Italy 59.7 37.3 35.3 0.9 73.3 33.5 32.7 0.8
Latvia 71.3 18.9 15.4 3.0 73.1 13.3 15.1 0.7
Lithuania 68.5 9.5 9.6 -0.3 50.0 11.3 11.3 0.0
Luxembourg 43.8 19.3 19.2 0.0 56.9 27.2 25.2 1.3
Malta 49.3 24.5 25.8 0.3 33.3 14.5 12.2 1.0
Netherlands 58.1 21.2 21.4 1.5 68.0 24.4 22.5 1.9
Poland 59.3 17.8 17.6 2.1 72.9 17.6 16.8 1.9
Portugal 57.9 20.0 19.1 1.8 72.8 21.8 20.0 1.7
Romania 51.6 15.8 13.9 1.9 100 12.8 12.8 0.0
Slovakia 30.4 24.2 23.3 1.2 14.3 16.3 16.3 n. a.
Slovenia 45.5 8.9 9.0 0.0 54.2 8.9 7.8 -0.1
Spain 49.6 21.6 21.7 1.0 58.5 20.8 20.1 1.2
Sweden 65.5 20.6 21.8 1.4 71.1 24.7 23.9 1.9
United Kingdom 58.6 19.2 20.3 1.3 69.4 22.1 22.3 1.4
EU 28 59.7 22.1 21.6 1.3 69.9 25.1 24.1 1.4 Average 20.0 18.5 1.3 19.6 18.6 1.1 Std. deviation 6.8 6.7 0.7 6.5 6.3 0.8 High values IT, CZ,
EE, BE IT, BE,
MT LV, IE,
BG IT, DE, LU, FR
IT, DE, FR, LU
IE, PL, SE, NL
Low values HR, SI, LT, BG
HR, BG, SI, LT,
HU
LT, LU, SI, MT,
EE
BG, SI, LT, HR, HU, RO
SI, BG, HU, HR, LT, MT
BG, SI, LT
Notes: Based on the consolidated accounts from Orbis. "% obs. Used" refers the fraction of accounts which have a positive operating profit (EBIT), a non-negative tax liability and an effective tax rate within the interval of 0 to 1. Means and Medians are in %. n.a. represents a case, where the skewness is not defined because we have only one observation. EU 28 refers to the average value for the EU overall and Average refers to the arithmetic mean of country values. High/low values are one standard deviation above/below the unweighted "Average", bold entries are 2 standard deviation above/below.
Source: Orbis data (Bureau van Dijk), own calculations

European Commission
Aggressive tax planning indicators
82
Table 15 presents the Member States specific descriptive statistics for the second ETR measure calculated as the ratio between tax liabilities and EBIT. Overall, we are now able to use a substantially larger share of observations, given that the aggregated EBIT over the period 2010 to 2015 is more often positive. In other words, a relevant share of firms reports pre-tax profits clearly lower than operating profits. The larger values for the profit measure are also directly reflected in a lower ETR measure in Table 15. The EU average for domestic companies is now only 22.1 percent compared to 25.1 percent for MNEs. This implies a much lower differential between domestic companies and MNEs, due to lower financial profits and lower extraordinary income for MNEs.
Regarding the distributions of the ETRs, we can still observe slightly lower medians compared to the averages, also reflected in a positive skewness. Despite the slightly higher value of the overall skewness, the averages are still not strongly affected by large positive outliers.
The ranking of the Member States remains broadly unchanged, with Italy still displaying the highest ETRs for both domestic companies and MNEs. The Czech Republic, Estonia, Belgium and Malta follow with high ETRs for domestic companies, while the MNE groups in Germany, France, and Luxembourg have clearly above average ETRs. However, it is worth pointing out, that the ETRs based on EBIT are substantially lower in all these countries. This reflects that, especially in high tax countries, firms in general and MNEs in specific, are able to substantially reduce the pre-tax profits compared to the operating profits. This highlights the importance of investigating the profitability, rather than only concentrating on the ETR.
In consequence, in the next step we look at the distribution of the two profit measures. The upper part of Figure 8 shows the distribution of the profitability measure PLBT divided by total assets, while the lower part displays the distribution of the profitability measure of EBIT over total assets. Analogous to Figure 7, the transparent bars display the distribution of the values for MNE groups in comparison to the domestic groups in the filled bars.
Both distributions of the PLBT-based profitability measures are very similar and have most observations close to a zero pre-tax profitability. In contrast, for the EBIT-based profitability measure the distribution for the MNE groups is slightly further right, indicating a moderately higher profitability.70 This confirms the observation made before, that MNE groups overall tend to have higher financial losses bringing down the corporate tax base.
70 This is also visible in the simple t-test which shows a 0.5 percent - statistically significant - higher EBIT/total assets ratio for the MNE group. The PLBT/total assets ratios are not statistically different between the groups.

European Commission
Aggressive tax planning indicators
83
Figure 8: Distribution of profitability by MNE status (2010-2015)
Source: Orbis data (Bureau van Dijk), own calculations
In Table 16 and Table 17 we compare the country level descriptive statistics of the two profitability measures to identify whether this effect is broadly based or due to individual Member States.
In contrast to the ETR measures, we are now also able to use loss making corporate groups as well, which increases the number of useable observations to some extent. Overall, we are now able to use 83.4 percent of the consolidated accounts of the domestic companies and 94.5 percent of the MNE groups. The difference in this percentage reflects to some extent that domestic groups tend to be smaller. Defining the profitability as return on assets, smaller values for total assets tends to lead to more extreme values. Together with our approach of excluding extreme values with a profitability outside the interval of -50 percent and 50 percent therefore leaves a smaller percentage of domestic companies. The overall average is almost identical with 2.8 percent for the domestic companies compared to the 2.9 for the MNEs, confirming the finding from the graphical comparison in Figure 8. However, the overall median is clearly lower for the domestic companies (1.6%) than for MNE groups (2.4%).
Looking at the overall skewness, we also see that pre-tax profitability of the domestic companies is slightly positively skewed, while the distribution for MNE groups is slightly more negatively skewed. This reflects the relatively larger number of domestic companies with a pre-tax profitability close to zero.
05
1015
Den
sity
-.5 0 .5profitability2
domestic groups MNE
PLBT/ASSETS
02
46
8D
ensi
ty
-.5 0 .5profitability1
domestic groups MNE
EBIT/ASSETS

European Commission
Aggressive tax planning indicators
84
Table 16: Consolidated profitability (PLBT/Assets), by Member States (2010-2015)
Domestic groups Multinational groups
Country %
obs. used
PLBT/ASSETS % obs. used
PLBT/ASSETS
Mean Median Skewness Mean Median Skewness Austria 94.5 1.9 1.0 -1.6 98.4 2.5 1.7 0.9
Belgium 91.4 3.0 2.0 1.1 97.5 2.5 2.6 -0.6
Bulgaria 91.8 -1.2 -0.1 -1.9 100.0 1.4 0.7 1.2
Croatia 95.1 -0.7 0.0 -1.7 100.0 -2.6 -2.1 -0.7
Cyprus 50.5 -5.3 -2.5 -1.8 76.2 -0.4 -1.0 3.1
Czech Republic 32.4 4.2 3.1 0.2 87.5 4.4 4.1 1.2
Denmark 87.7 3.9 2.6 0.2 98.1 4.2 3.5 0.5
Estonia 80.0 5.8 4.8 0.6 100.0 4.5 2.9 0.8
Finland 94.4 4.9 3.8 -0.2 97.3 2.8 3.0 -0.8
France 80.1 2.0 1.1 -1.0 90.5 1.5 1.3 -2.8
Germany 86.1 2.6 1.3 -0.4 92.5 3.9 3.4 -0.2
Greece 82.1 -1.1 0.0 -1.0 93.3 0.0 0.0 0.7
Hungary 95.7 -0.2 0.9 -1.5 89.5 3.6 2.9 -0.4
Ireland 60.5 1.3 0.1 -1.3 81.7 2.8 2.6 -0.9
Italy 83.4 1.3 0.7 -1.2 95.7 1.9 1.3 -1.0
Latvia 94.1 4.8 3.7 1.3 100.0 6.6 5.4 0.0
Lithuania 100 2.5 1.5 0.8 100.0 2.2 1.3 0.8
Luxembourg 81.3 1.2 1.0 -0.4 94.8 2.2 2.4 0.3
Malta 76.8 5.2 3.6 1.9 80.0 2.5 0.9 1.0
Netherlands 87.1 3.6 2.6 0.1 93.9 3.9 2.9 0.5
Poland 85.9 2.2 2.7 -1.0 96.3 5.2 3.9 1.5
Portugal 83.7 1.5 1.1 -0.1 95.7 1.7 1.6 1.3
Romania 100 -1.3 0.5 -0.8 100.0 5.2 5.2 0.0
Slovakia 69.6 1.3 0.7 0.9 57.1 0.1 -0.9 0.7
Slovenia 95.5 -1.3 -0.5 -2.1 95.8 -0.7 0.0 -1.1
Spain 79.9 1.6 0.8 -0.4 92.7 1.4 1.3 -0.6
Sweden 86.3 4.7 3.1 0.0 96.1 3.6 3.5 -0.3
United Kingdom 80.6 2.7 1.1 -0.1 96.0 3.0 3.1 -0.7
EU 28 83.4 2.8 1.6 0 94.5 2.9 2.4 -0.4 Average 1.8 1.5 -0.4 2.5 2.1 0.1 Std. deviation 2.5 1.6 1.1 2.0 1.8 1.1 High values EE, MT,
FI, LV, SE
EE, FI, LV, MT, SE, CZ
MT, LV, BE, SK,
LT LV, PL,
RO, EE LV, RO, CZ, PL
CY, PL, PT
Low values CY, RO, SI, BG, EL, HR
CY, SI SI, BG, CY, HR, AT, HU
HR, SI, CY, EL,
SK
HR, CY, SK, SI,
EL
FR, SI, IT
Notes: Based on the consolidated accounts from Orbis. % obs. used refers the fraction of accounts with a profitability measure within the interval of -0.5 to 0.5. Means and medians are in %. EU 28 refers to the average value for the EU overall and Average refers to the arithmetic mean of country values. High/low values are one standard deviation above/below the unweighted "Average", bold entries are 2 standard deviations above/below.
Source: Orbis data (Bureau van Dijk), own calculations

European Commission
Aggressive tax planning indicators
85
The average pre-tax profitability for domestic groups ranges from -5.3 percent in Cyprus to 5.8 in Estonia. For MNE groups the range is similar from -2.6 percent in Croatia to 6.6 percent in Latvia. However, most of these numbers are based on a few companies only and therefore affected by large outliers. This is also reflected in a smaller range of values for the medians, which are arguably the more reliable statistic for Member States with few observations. Member States with high medians for consolidated pre-tax profitability for domestic companies are Estonia (4.8%), Finland (3.8%), Latvia (3.7%), Malta (3.6%), Sweden and the Czech Republic (3.1% each), while in Cyprus (-2.5%) and Slovenia (-0.5%) even the median pre-tax profitability is negative. In comparison, MNE groups in Latvia (5.4%), Romania (5.2%), the Czech Republic (4.1%) and Poland (3.9%) have the highest median pre-tax profitability. In Croatia (-2.1%), Cyprus (-1.0%), Slovakia (-0.9%), Slovenia and Greece (0.0% each) have the lowest median pre-tax profitability. Of the countries with a larger number of observations, MNE groups in France stand out with an average (1.5%) or median pre-tax profitability (1.3%) which is clearly below the EU level. MNE groups in Italy and Spain also show low pre-tax profitability, while in contrast German MNE groups have relatively high pre-tax profitability. It is also remarkable, that the pre-tax profitability of German MNE groups is clearly higher than for domestic firms in Germany. The distribution of the pre-tax profitability in MNE groups in France shows a strongly negatively skewed distribution, reflecting the relatively large number of firms with a pre-tax profitability close to zero. The pre-tax profitability in MNE groups in Cyprus in contrast shows a clearly positive skewness.
Table 17 provides the descriptive statistics for the operating profitability. Overall domestic firms in the EU have an average profitability of 4.5 percent while the MNE groups are more profitable with 5.1 percent. The higher operating profitability for MNE groups (4.9% compared to 4.0% for domestic companies) is even more pronounced in the median profitability. Overall the distributions for both domestic firms and MNE groups are only slightly skewed to the left. This mirrors the generally more balanced distribution in the lower part of Figure 8. There is no evidence for relatively more firms at zero operating profitability, which seems plausible since there is no longer the direct impact of the asymmetric tax treatment of the pre-tax profitability. The percentage of usable observations is lowest in the Czech Republic, Slovakia, Cyprus and Ireland. While this in principle also can highlight the location of extreme values for profitability, it primarily reflects reporting standards in these countries, i.e. insufficient information.
Domestic firms have the highest average operating profitability in Sweden (5.9%), followed by Finland (5.5%), Malta (5.3%), Latvia (5.3%) and Germany (5.2%). This ranking is not driven by extreme outliers, which is confirmed by the corresponding median operating profitability which again sees Sweden (4.9%) ahead of Finland (4.8%). The operating profitability for domestic companies is found to be the lowest in Cyprus (-1.6% on average, 0.0% median), Romania (-0.3% average, 0.5% median), Greece (0.0% average, 0.8% median) and Slovakia (0.3% average, 0.3% median). For MNE groups the ranking is rather different with the highest value for Romania (10.6%), followed by the Czech Republic (8.7%), Poland (7.5%), Latvia (7.4%) and Germany (7.1%). While these values are based on very few observations, MNE groups in Germany are showing a high operating profitability on average (7.1%) and the median of 6.9 percent shows that this is not only due to some outliers. The MNE groups in Croatia, Slovakia and Slovenia have the lowest operating profitability.

European Commission
Aggressive tax planning indicators
86
Table 17: Consolidated profitability (EBIT/Assets), by Member States (2010-2015)
Domestic groups Multinational groups
Country % obs. used
EBIT/ASSETS % obs. used
EBIT/ASSETS
Mean Median Skewness Mean Median Skewness
Austria 92.8 3.7 3.1 0.5 95.3 4.2 3.8 0.3
Belgium 91.7 4.1 3.6 0.0 97.5 4.5 4.5 -1.0
Bulgaria 91.8 1.5 0.4 0.7 100.0 3.6 3.4 0.5
Croatia 95.1 1.5 1.8 0.8 100.0 0.7 1.3 -0.8
Cyprus 52.4 -1.6 0.0 -2.6 76.2 2.8 1.4 0.9
Czech Republic 32.4 4.5 2.1 0.7 87.5 8.7 8.0 0.7
Denmark 87.8 4.7 4.3 -0.3 98.1 5.7 5.2 0.5
Estonia 80.0 3.9 1.4 1.0 100.0 5.9 4.0 1.1
Finland 94.7 5.5 4.8 -0.7 97.3 4.5 4.3 -0.5
France 79.6 3.8 3.7 -0.8 90.5 4.2 4.6 -1.9
Germany 86.0 5.2 4.6 -0.5 92.3 7.1 6.9 -0.3
Greece 82.5 0.0 0.8 -1.7 92.0 3.4 2.2 1.2
Hungary 95.7 1.3 0.4 -1.5 89.5 4.3 4.6 -0.6
Ireland 60.8 2.2 3.1 -1.6 81.7 3.3 4.2 -1.2
Italy 83.4 2.7 2.6 -1.2 95.7 3.7 3.7 -0.7
Latvia 94.1 5.3 4.5 1.0 100.0 7.4 5.8 0.4
Lithuania 100.0 3.3 2.8 0.8 100.0 3.2 3.1 0.1
Luxembourg 81.3 2.8 0.8 1.3 94.8 4.7 4.9 -1.4
Malta 76.8 5.3 3.5 1.8 80.0 3.8 1.8 1.0
Netherlands 87.1 4.5 3.9 -0.1 93.6 5.5 4.9 0.1
Poland 87.2 3.8 4.3 -1.2 96.3 7.5 5.6 1.1
Portugal 83.7 3.6 3.4 0.9 95.7 3.9 3.4 0.9
Romania 100.0 -0.3 0.5 -0.7 100.0 10.6 10.6 0.0
Slovakia 73.9 0.3 0.3 0.8 57.1 1.6 -0.2 1.2
Slovenia 95.5 3.4 0.0 1.3 95.8 2.2 1.7 0.2
Spain 80.0 2.8 2.9 -0.6 92.9 3.1 3.6 -1.1
Sweden 86.2 5.9 4.9 -0.2 96.2 5.3 5.3 -0.5 United Kingdom 80.0 5.0 4.6 -0.3 95.1 5.7 5.8 -0.9
EU 28 83.2 4.5 4.0 -0.3 94.2 5.1 4.9 -0.5 Average 3.2 2.6 -0.1 4.7 4.2 0.0 Std. deviation 1.9 1.7 1.1 2.1 2.2 0.9
High values SE, FI, MT, LV,
DE
SE, FI, UK, DE,
LV, PL, DK
MT, LU, SI, LT,
EE
RO, CZ, PL, LV,
DE
RO, CZ, DE
EL, SK, PL, EE, MT, PT,
CY
Low values
CY, RO, EL, SK
CY, SI, SK, HU, BG, RO, LU, EL
CY, EL, IE, HU, IT, PL
HR, SK, SI
SK, HR, CY, SI,
MT
FR, LU, IE, ES,
BE
Notes: Based on the consolidated accounts from Orbis. % obs. used refers the fraction of accounts with a profitability measure within the interval of -0.5 to 0.5. Means and medians are in %. EU 28 refers to the average value for the EU overall and Average refers to the arithmetic mean of country values. High/low values are one standard deviation above/below the unweighted "Average", bold entries are 2 standard deviations above/below.
Source: Orbis data (Bureau van Dijk), own calculations

European Commission
Aggressive tax planning indicators
87
Key findings
The comparison of the consolidated ETRs finds a clearly higher ETR for MNEs, which is at odds with the expectation of MNEs being able to reduce their tax burden through ATP. The main message from the analysis of the consolidated accounts is that MNE groups are more profitable, measured through their operating profits. But this positive profitability gap for MNE groups is no longer observable once we compare pre-tax profitability. This implies that MNE groups are showing higher financial losses, or other extraordinary deductions, which help them to reduce the corporate tax base. The analysis of consolidated account does at the same time not reveal clear patterns across Member States and is hampered by data limitations.
4.1.5 ATP-specific indicators at entity level
In this subsection, we focus on the entities making up an MNE. Using the unconsolidated accounts of the individual entities (headquarters, intermediate owners and subsidiaries) of a MNE group allows learning more about the intra-group transactions. As a starting point, we divide the entities within MNE groups into those who are lower tax entities and those who are not. It allows comparing relevant indicators in these two subgroups to the domestic counterparts. This highlights whether key indicators are varying depending on the relative tax position of the entity within the MNE group. However, this approach has one important drawback. As already discussed in Section 4.1.3, Member States with very high (low) statutory tax rates will have hardly any MNE entities which are classified as lower (higher) tax entity. Together with incomplete coverage for some balance sheet items this implies that several of the Member State averages will be based on few observations. To mitigate this problem, we i.) also report the median per Member States and ii.) include the number of observations on which the aggregate statistics are based.71
In the following we present means and medians for (i) domestic companies, (ii) MNE entities with a local statutory tax rate at least 5 percentage points below the highest tax rate in the MNE group, and (iii) other MNE entities, broken down by Member State. We start with three different profitability measures. Table 18 reports profits and losses before taxation (PLBT) in percent of total assets, Table 19 earnings before interest and taxation (EBIT) over total assets and Table 20 the financial profits and losses (FIN_PL) over total assets.72
Starting with a few general observations about the distribution of pre-tax profitability in Table 18 one can see that, for all three subgroups, the averages are clearly higher than the medians, which suggests that the pre-tax profitability distribution is skewed to the left. This pattern is consistent with a smaller number of relatively profitable firms, while the bulk of firms are less profitable.
71 To put the numbers further into perspective, Table 57 in the appendix presents the overall number of observations in the dataset. 72 We also show profitability ratios based on the number of employees in Table 58, Table 59, and Table 60 in the appendix. Given that the coverage for the number of employees is worse, we restrict the discussion to the profitability measures based on total assets.

European Commission
Aggressive tax planning indicators
88
Table 18: Profitability (PLBT/ASSETS), by Member States (2010-2015)
Domestic companies Entities within a MNE group in a
higher tax country lower tax country PLBT/ASSETS (%)
No. obs. PLBT/ASSETS (%) No.
obs. PLBT/ASSETS (%) No.
obs. Country Mean Median Mean Median Mean Median Austria 4.7 2.9 7610 4.2 3.0 2817 6.0 4.8 13406
Belgium 4.3 2.8 85753 4.0 2.7 26656 4.6 3.4 15805
Bulgaria 2.2 1.1 18653 0.5 0.4 1233 3.6 2.0 6226
Croatia 1.9 0.8 130650 -0.7 0.4 3375 1.9 1.6 3942
Cyprus 2.2 2.5 193 9.7 5.2 24 4.2 1.6 133
Czech Republic 3.1 1.8 28004 3.2 2.0 6934 5.6 4.4 26190
Denmark 5.2 3.7 175902 4.3 3.6 14120 4.9 4.0 19680
Estonia 4.5 2.6 9212 4.1 3.4 4839 6.3 5.2 4208
Finland 5.7 3.4 39035 4.9 3.3 9689 6.6 5.3 11110
France 4.8 4.0 312231 3.2 2.7 156838 3.8 2.6 4961
Germany 5.3 3.4 62709 5.5 4.3 22680 6.8 5.6 35379
Greece -1.2 -0.1 6039 -0.9 0.2 3440 1.1 1.6 4791
Hungary 3.0 1.9 1353 3.4 2.5 708 4.5 4.1 4854
Ireland 1.9 1.0 4738 0.5 0.4 492 3.4 1.5 14674
Italy 1.2 1.0 265754 1.1 1.0 67153 2.6 2.1 42827
Latvia 1.4 0.2 8221 2.0 0.1 1706 3.3 2.1 5277
Lithuania 4.5 3.0 1861 5.8 5.2 659 7.7 6.6 3044
Luxembourg 2.2 0.9 2946 0.9 0.0 3532 3.5 1.0 4906
Malta 3.1 0.0 4703 7.3 3.3 1403 3.6 2.9 47
Netherlands 4.6 2.3 21171 3.7 1.2 4419 4.3 2.1 21348
Poland 3.0 2.0 37641 3.9 3.2 5111 6.0 5.4 33812
Portugal 1.3 1.2 47748 2.4 1.9 9618 4.1 3.4 9048
Romania 0.7 0.3 10508 -1.5 -0.6 13810 1.4 0.3 31876
Slovakia 2.9 1.5 3468 3.7 2.4 2762 5.8 4.8 5228
Slovenia 0.6 0.6 1872 0.8 1.3 834 4.7 3.8 1510
Spain 1.0 0.8 159196 1.2 1.1 33527 3.1 2.6 44829
Sweden 7.6 5.1 102383 5.7 3.9 19764 5.5 3.7 26525
United Kingdom 5.1 3.4 122538 3.8 2.2 28719 4.7 2.8 137927
EU 28 3.6 2.2 1672091 2.9 2.0 446862 4.5 3.1 533563
Average 3.1 1.9 3.1 2.1 4.4 3.3
Std. deviation 2.0 1.4 2.5 1.6 1.6 1.6
High values SE, FI, DE, DK,
UK
SE, FR, DK, UK, FI, DE
CY, MT, LT, SE
LT, CY, DE, SE LT, DE,
FI, EE
LT, DE, PL, FI,
EE
Low values EL, SI, RO, ES
EL, MT, LV, RO
RO, EL, HR, BG,
IE
RO, LU, LV, EL,
BG, HR, IE EL, RO,
HR, IT
RO, LU, IE, EL, CY, HR
Notes: Based on the unconsolidated accounts from Orbis. No. obs. refers to firms serving as base for the mean and medians, i.e. firms with accounts with a profitability measure within the interval of -0.5 to 0.5. Higher tax country is defined as not being a lower tax entity, hence includes also companies in MNE groups without a 5 percentage-points tax differential within the MNE group. EU 28 refers to the means and medians over all observations, respectively to the sum of the observations. Average refers to the arithmetic mean of country values. High/low values are one standard deviation above/below the unweighted average, bold entries are 2 standard deviations above/below.
Source: Orbis data (Bureau van Dijk), own calculations

European Commission
Aggressive tax planning indicators
89
The key overall observation in Table 18 is that entities which were classified as lower tax entities are the subgroup with the highest average (4.5%) and median (3.1%) pre-tax profitability. This is clearly above the domestic firms with an average of 3.6 percent (median of 2.2%) and the difference is even more pronounced if we compare it to the MNE entities which are not classified as lower tax entities. Here the average pre-tax profitability is only 2.9 percent and the median is at 2.0 percent. This observation is clearly consistent with some ATP taking place. The difference in pre-tax profitability between MNE entities in a lower tax country and in a higher tax country, is also reflected at the level of the Member States, except for Malta, Cyprus and to some extent Sweden, where we observe a different pattern. The number of observations available for Cyprus and Malta is however limited.
The pre-tax-profitability in domestic companies is highest in Sweden (7.6% on average, median at 5.1%). Domestic companies in Finland (5.7% average, 3.4% median), Germany (5.3% average, 3.4% median), Denmark (5.2% average, 3.7% median), the United Kingdom (5.1% average, 3.4% median) and in France (4.8% average, 3.4% median) also have high pre-tax profitability. For MNE entities which are not classified as lower tax entities the pre-tax profitability is relatively high in Cyprus (9.7% average, 5.2% median), Malta (7.3% average, 3.3% median), Lithuania (5.8% average, 5.2% median) and Sweden (5.7% average, 3.9%). In comparison, the pre-tax profitability in MNE entities which are classified as lower tax entities is clearly higher in most Member States. The highest values are found in Lithuania (7.7% average, 6.6% median), Germany (6.8% average, 5.6% median), Finland (6.6% average, 5.3 median) and Estonia (6.3% average, 5.2% median).
In Table 19, the broad overall picture about the profitability distributions in the three subgroups is confirmed for the measure of EBIT over total assets. Again, MNE entities facing relatively lower tax rates are showing the highest average (4.7%) and median (3.2%) operating profitability. This is higher than for domestic companies (3.8% average and 2.6 % median) and substantially higher than for the entities not classified as lower entities (3.1 % average and 2.1% median).
For domestic companies, the highest operating profitability is again found in Sweden (7.0% average, 4.6% median), followed by Germany (5.9% average, 4.4% median), United Kingdom (5.6% average, 4.2% median), Finland (5.5% average, 3.4% median) and Denmark (5.5% average, 3.9% median). For MNE entities not classified as lower tax entities the highest average operating profitability is in Cyprus (13.1% average, 7.5% median), Malta (6.8% average, 2.4% median) and Germany (6.2% average, 5.0% median). In MNE groups classified as lower tax entity we find the highest operating profitability in Lithuania (8.4% average, 7.2% median), Germany (7.0% average, 5.5% median), Poland (6.8% average, 6.2% median), Slovakia (6.6% average, 5.6% median), Finland (6.6% average, 5.1% median), Cyprus (6.6% average, 3.8% median) and the Czech Republic (6.5% average, 5.3% median).

European Commission
Aggressive tax planning indicators
90
Table 19: Profitability (EBIT/ASSETS), by Member States (2010-2015)
Domestic companies Entities within a MNE group in a
higher tax country lower tax country
EBIT/ASSETS (%) No. obs.
EBIT/ASSETS (%) No. obs.
EBIT/ASSETS (%) No. obs. Country Mean Median Mean Median Mean Median
Austria 4.4 3.0 7689 3.6 2.3 2818 5.5 3.9 13327
Belgium 4.9 3.6 86600 4.0 2.5 27203 4.6 3.2 15980
Bulgaria 2.9 1.8 19334 1.4 0.4 1254 4.4 2.9 6160
Croatia 2.2 1.2 130323 0.5 1.0 3335 2.9 2.7 3870
Cyprus 4.4 4.8 188 13.1 7.5 22 6.6 3.8 116
Czech Republic 3.7 2.6 28384 4.1 2.9 7131 6.5 5.3 27078
Denmark 5.5 3.9 178911 3.3 1.1 14638 4.0 1.7 20254
Estonia 4.4 2.3 9586 4.1 3.3 4933 6.3 5.3 4191
Finland 5.5 3.4 39250 5.0 3.2 9759 6.6 5.1 11248
France 3.9 2.8 319552 3.0 2.0 161245 3.3 1.8 4992
Germany 5.9 4.4 61846 6.2 5.0 22977 7.0 5.5 35987
Greece 0.4 1.0 6166 0.5 1.6 3475 1.9 2.2 4854
Hungary 3.0 1.8 1365 3.1 2.0 698 5.1 4.6 4835
Ireland 2.7 1.8 5222 2.7 1.7 533 4.3 2.4 14984
Italy 1.8 1.7 269204 1.7 1.6 68029 3.0 2.5 42855
Latvia 1.9 0.4 6492 2.6 0.5 1462 4.4 3.3 4530
Lithuania 4.9 3.6 1877 5.7 4.4 669 8.4 7.2 3053
Luxembourg 2.9 1.9 3002 1.3 0.0 3616 2.9 0.0 4940
Malta 3.1 0.0 4776 6.8 2.4 1409 3.3 0.0 45
Netherlands 4.5 2.5 21273 3.7 0.1 4602 3.6 0.5 22183
Poland 3.4 2.5 37999 4.4 3.9 5152 6.8 6.2 34338
Portugal 2.2 2.3 48150 3.2 2.9 9647 4.7 4.1 9235
Romania 1.3 0.6 10755 0.3 -0.1 13989 2.9 1.0 32124
Slovakia 3.3 2.0 3464 4.3 3.1 2750 6.6 5.6 5197
Slovenia 1.7 1.5 1849 1.5 1.8 786 5.0 4.4 1488
Spain 1.5 1.3 162865 1.9 1.6 34516 3.5 3.0 45808
Sweden 7.0 4.6 105025 4.9 2.7 20460 5.1 2.6 27210
United Kingdom 5.6 4.2 124618 4.1 2.8 28001 4.6 2.7 127597
EU 28 3.8 2.6 1695765 3.1 2.1 455109 4.7 3.2 528479
Average 3.5 2.4 3.6 2.3 4.8 3.3
Std. deviation 1.6 1.3 2.5 1.7 1.6 1.9
High values SE, DE, UK, DK,
FI
CY, SE, DE, UK,
DK
CY, MT, DE
CY, DE, LT
LT, DE, PL, FI,
CY, SI, CZ
LT, PL, SK, DE, CZ, EE
Low values EL, RO, ES, SI, IT, LV
MT, LV, RO, EL
RO, HR, EL
RO, LU, NL, BG,
LV
EL, RO, LU, HR,
IT
LU, MT, NL, RO
Notes: Based on the unconsolidated accounts from Orbis. No. obs. refers to firms serving as base for the mean and medians, i.e. firms with accounts with a profitability measure within the interval of -0.5 to 0.5. Higher tax country is defined as not being a lower tax entity, hence includes also companies in MNE groups without a 5 percentage-points tax differential within the MNE group. EU 28 refers to the means and medians over all observations, respectively to the sum of the observations. Average refers to the arithmetic mean of country values. High/low values are one standard deviation above the unweighted average, bold entries are 2 standard deviation above/below.
Source: Orbis data (Bureau van Dijk), own calculations

European Commission
Aggressive tax planning indicators
91
The difference in the operating profitability between lower and not lower tax entities within MNEs in Table 19 is consistent with ATP structures affecting the operational profitability, e.g. using royalty payments or strategic transfer pricing. Again, the overall differences in the average profitability are also reflected in almost all Member States. The exceptions are once more Cyprus and Malta, which are based on very few observations, and the Netherlands. The absence of a clear difference in operating profitability for MNE entities in the Netherlands is interesting since this would imply that Dutch firms are primarily using ATP structures not affecting the operating profit.
For the financial profitability measure in Table 20, the overall picture is different. First of all, we find that European firms report overall financial losses. The average financial losses are highest for domestic companies (-0.6% of total assets). The difference in the mean financial profitability between lower tax entities (-0.3%) and higher tax entities (-0.4%) is small but nevertheless consistent with ATP structures using financial instruments.
The overall negative financial profitability is inconsistent with purely intra-firm financial transactions in the EU, because in this case the financial losses would show up at the other entity and result in financial profit there. However, there are several explanations to reconcile an overall negative financial profitability for the EU firms with ATP structures.
First, in those cases where the financial profit shows up in a zero/no corporate country outside the EU, only the financial losses in the EU part of the MNE will be captured. Second, it is possible that the receiving entities are not included in the dataset due to either missing values or resulting extreme values.73 In fact, the coverage of financial profits is substantially less complete, which results in a drop of observations of about one third. Therefore, it is possible that we miss the MNE entities which receive the interest income in the ATP structures and therefore underestimate the extent of ATP.
For domestic companies, Austria (0.3% average, 0.0% median), Sweden (0.1% average, -0.1% median), France (0.0% average, -0.1% median) and Malta (0.0% average and median) exhibit the highest average financial profitability. For MNE entities not classified as lower tax, we find the highest average financial profitability in Denmark (0.7% average, -0.1% median), Austria (0.6% average, 0.0% median), Sweden (0.3% average, -0.2% median) and Malta (0.2% average, 0.0% median). In the lower taxed MNE entities the highest financial profitability is observable in the Netherlands (0.7% average, 0.0% median), Denmark (0.7% average, -0.1% median), Austria (0.6% average, 0.0 median) and Luxembourg (0.3% average, 0.0% median).
73 In order to avoid too much impact of outliers on the means, we exclude observations where the absolute value of financial profits or losses is larger than 50 percent of total assets.

European Commission
Aggressive tax planning indicators
92
Table 20: Profitability (FIN_PL/ASSETS), by Member States (2010-2015)
Source: Orbis data (Bureau van Dijk), own calculations
Domestic companies Entities within a MNE group in a
higher tax country lower tax country
FIN_PL/ASSETS (%) No. obs.
FIN_PL/ASSETS (%) No. obs.
FIN_PL/ASSETS (%) No. obs.
Country Mean Median Mean Median Mean Median Austria 0.3 0.0 5743 0.6 0.0 2063 0.6 0.0 9684
Belgium -0.7 -0.5 58285 -0.1 -0.2 19134 -0.1 -0.1 10801
Bulgaria -1.1 -0.3 12928 -1.5 -0.8 970 -0.9 -0.5 4680
Croatia -0.8 0.0 93650 -2.0 -0.7 2288 -1.5 -0.5 2739
Cyprus -2.6 -2.3 138 -2.6 -1.0 20 -1.9 -0.4 103
Czech Republic -1.0 -0.5 17848 -1.4 -0.6 5174 -1.2 -0.7 18668
Denmark -0.8 -0.6 123416 0.7 -0.1 10030 0.7 -0.1 13917
Estonia -0.2 0.0 4996 0.0 0.0 3468 -0.1 0.0 2674
Finland -0.3 -0.1 21237 -0.4 -0.1 5998 -0.3 0.0 8345
France 0.0 -0.1 172379 0.0 0.0 113029 n.a. n.a. 0
Germany -0.5 -0.6 42093 -0.5 -0.5 14027 0.0 -0.2 24767
Greece -1.7 -1.0 3204 -1.5 -0.6 2459 -1.0 -0.2 2927
Hungary -0.2 -0.1 717 -0.2 -0.3 501 -0.4 -0.2 3478
Ireland -1.0 0.0 2740 -2.4 0.0 332 -1.1 0.0 9714
Italy -1.0 -0.5 154148 -0.9 -0.4 41548 -0.5 -0.2 33440
Latvia -0.8 0.0 5402 -1.2 -0.1 1323 -1.1 -0.1 3820
Lithuania -0.4 -0.3 1099 0.0 -0.1 447 -0.5 -0.3 1913
Luxembourg -1.5 -0.5 1675 -0.9 -0.1 2207 0.3 0.0 2979
Malta 0.0 0.0 1616 0.2 0.0 1006 n.a. n.a. 0
Netherlands -0.1 0.0 12717 0.1 0.0 3026 0.7 0.0 15930
Poland -0.8 -0.2 22372 -0.9 -0.3 3876 -0.9 -0.4 23038
Portugal -1.0 -0.3 28478 -1.0 -0.3 7126 -0.7 -0.1 6114
Romania -0.7 0.0 6434 -2.3 -0.6 10179 -1.9 -0.7 23565
Slovakia -0.8 -0.5 2367 -0.8 -0.5 2257 -0.7 -0.4 3848
Slovenia -1.3 -0.5 1479 -1.4 -0.4 616 -0.6 -0.1 1200
Spain -0.6 -0.3 88855 -0.9 -0.3 21091 -0.6 -0.2 33479
Sweden 0.1 -0.2 91246 0.3 -0.2 14918 0.2 0.0 21418
United Kingdom -0.5 0.0 83584 -0.3 0.0 16198 0.3 0.0 99070
EU 28 -0.6 -0.2 1060846 -0.4 -0.1 305311 -0.3 -0.1 382311
Average -0.7 -0.3 -0.8 -0.3 -0.5 -0.2
Std. deviation 0.6 0.5 0.9 0.3 0.7 0.2
High values AT, SE, FR, MT DK, AT,
SE, MT
IE, UK, MT, AT, NL, EE
NL, DK, AT, LU,
UK
Low values CY, EL, LU CY, EL CY, IE,
RO, HR CY, BG,
HR, CZ, EL RO, CY, HR
RO, CZ BG, HR
Notes: Based on the unconsolidated accounts from Orbis. No. obs. refers to firms serving as base for the mean and medians, i.e. firms with accounts with a profitability measure within the interval of -0.5 to 0.5. Higher tax country is defined as not being a lower tax entity, hence includes also companies in MNE groups without a 5 percentage-points tax differential within the MNE group. EU 28 refers to the means and medians over all observations, respectively to the sum of the observations. Average refers to the arithmetic mean of country values. n.a. refers to cases where mean and median are not defined due to a lack of observations. High/low values are one standard deviation above the unweighted average, bold entries are 2 standard deviations above/below.

European Commission
Aggressive tax planning indicators
93
For several Member States, there is no clear differential between the MNE entities which are classified as lower tax or not, while for some other Member States the patterns are consistent with the ATP channel using interest payments. For example, in the Netherlands, we see clearly higher average financial profits in those entities which are classified as lower tax entities (0.7% compared to 0.1%). In Luxembourg and the United Kingdom, the average financial profitability (0.3% each) is positive only for those MNE entities which are classified as lower tax entities. Also, in Ireland, the average financial profitability is much lower (-2.4%) for MNE entities that are classified as the higher tax entities, while for the lower tax entities the average financial profitability is -1.1%. In sum, the country level statistics suggest that in some Member States at least, some MNEs entities play the role of a lower tax entity in the ATP channel using interest payments. For Ireland, together with Croatia and Romania, the higher average financial losses in relatively higher tax entities also suggests that some MNE use these entities in the role of a target entity.74
To look further into the ATP channels using (internal) financial transactions Table 21 and Table 22 report the debt share, respectively the interest payments by Member States and firm classification.
Overall, the crude measure of debt share, defined as the ratio between non-current and current liabilities to total assets, shows comparatively little variation between the different firm types. The average debt share for domestic companies in the EU is at 56.6 percent, which is slightly lower than the value for MNE entities with relatively higher tax rates, which have on average a debt share of 56.9 percent. In contrast, those MNE entities which are classified as lower tax entities have a somewhat lower average debt share of only 50 percent. Further, it is noteworthy that the median debt share is clearly higher for all three subgroups. This can be explained with a smaller number of firms with much lower debt shares, reducing the overall average debt shares.
Starting with the debt share of domestic companies one can see a positive correlation with the statutory tax burden in the Member States. Italy (67.5% average, 74.3% median) has the highest value, followed by Malta (60.6% average, 65.4% median), Sweden (60.2% average, 64.1% median) and Cyprus (60.1% average, 62.2% median). The lowest average debt shares in domestic companies are in Estonia (40.6% average, 36.4% median), Bulgaria (43.7% average, 41.2% median), Romania (43.8% average, 41.9% median), the Czech Republic (44.4% average, 43.0 median) and Poland (45.6% average, 44.7% median). The positive correlation between the debt share and the statutory tax rate is less pronounced for the MNE entities. The debt share in MNE entities not classified as lower tax entity is highest in Ireland (69.7% average, 87.7% median), followed by Italy (66.2% average, 72.6% median), Germany (63.8% average, 69.0% median) and Sweden (60.4% average, 65.9% median). The lowest values are found for the Netherlands (39.4% average, 33.8% median), Cyprus (43.4% average, 48.7% median) and Estonia (45.1% average, 43.4% median).
74 For Cyprus, we also observe a high average financial loss, but this is only based on very few observations. Therefore, we do not draw strong conclusion on this aggregate number.

European Commission
Aggressive tax planning indicators
94
Table 21: Debt share (% of ASSETS), by Member States (2010-2015)
Domestic companies Entities within a MNE group in a
higher tax country lower tax country
DEBT/ASSETS (%) No. obs.
DEBT/ASSETS (%) No. obs.
DEBT/ASSETS (%) No. obs.
Country Mean Median Mean Median Mean Median Austria 55.8 60.4 11927 53.4 58.2 3823 53.0 57.4 17127
Belgium 55.9 60.2 55234 52.7 56.6 19835 51.9 55.1 12404
Bulgaria 43.7 41.2 12014 48.5 49.2 809 48.3 48.7 4359
Croatia 54.4 57.5 64133 56.8 59.0 1586 52.5 52.4 2183
Cyprus 60.1 62.2 135 43.4 48.7 20 44.6 38.5 102
Czech Republic 44.4 43.0 15347 50.4 52.2 4279 47.2 46.1 18097
Denmark 56.0 60.7 95564 50.0 53.9 8740 47.8 50.6 13234
Estonia 40.6 36.4 5317 45.1 43.4 3469 41.5 37.8 2920
Finland 57.4 61.3 15074 56.9 60.3 4432 55.4 58.2 6379
France 59.4 62.5 169421 57.8 62.0 111682 55.5 59.1 2119
Germany 59.5 62.5 96780 63.8 69.0 32927 60.8 65.3 44079
Greece 58.2 63.4 3090 58.5 63.2 2174 59.6 63.5 3087
Hungary 52.5 55.8 710 54.9 59.5 485 55.1 58.3 3584
Ireland 52.9 53.6 4611 69.7 87.7 353 54.6 57.4 11663
Italy 67.5 74.3 145363 66.2 72.6 41700 62.9 68.0 34396
Latvia 50.2 54.0 4038 55.4 60.7 865 51.4 54.2 3021
Lithuania 49.5 49.5 1093 54.4 57.4 428 53.2 55.3 1980
Luxembourg 57.2 62.0 1908 47.6 49.3 2497 47.7 50.0 3567
Malta 60.6 65.4 1363 47.2 46.2 910 n. a. n. a. 0
Netherlands 48.4 51.3 29360 39.4 33.8 7160 38.1 32.9 28934
Poland 45.6 44.7 20076 47.8 47.4 3302 50.0 49.8 22501
Portugal 56.5 60.8 24425 54.7 58.2 6703 55.6 58.8 6604
Romania 43.8 41.9 5258 49.9 52.0 5077 50.6 52.1 16390
Slovakia 54.2 58.0 2004 53.1 54.9 1987 52.7 54.1 3723
Slovenia 51.0 54.2 1371 52.3 54.8 584 51.1 51.5 1160
Spain 48.2 49.3 87739 52.3 54.5 21397 54.2 56.6 35539
Sweden 60.2 64.1 89266 60.4 65.9 17326 58.7 63.5 24654
United Kingdom 50.8 54.2 122872 48.1 50.8 24784 41.9 40.3 135624
Total 56.6 60.7 1085493 56.9 61.5 329334 50.0 52.3 459430
Average 53.4 55.9 53.2 56.5 51.8 51.3
Std. deviation 6.3 8.7 6.7 10.1 5.9 8.5
High values IT, MT, SE, CY IT, MT, IE, IT,
DE, SE IE, IT,
DE IT IT, DE
Low values EE, BG, RO, CZ,
PL
EE, BG, RO, CZ,
PL NL, CY,
EE NL, EE,
MT NL, EE,
UK, CY NL, EE, CY, UK
Notes: Based on the unconsolidated accounts from Orbis. No. obs. refers to firms serving as base for the mean and medians, i.e. firms with a ratio of (non-current liabilities + current liabilities)/total assets in interval of 0 to 1. Higher tax country is defined as not being a lower tax entity, hence includes also companies in MNE groups without a 5 percentage-points tax differential within the MNE group. n. a. refers to cases where mean and median are not defined due to a lack of observations. EU 28 refers to the means and medians over all observations, respectively to the sum of the observations. Average refers to the arithmetic mean of country values. High/low values are one standard deviation above/below the unweighted average, bold entries are 2 standard deviations above/below.
Source: Orbis data (Bureau van Dijk), own calculations

European Commission
Aggressive tax planning indicators
95
In contrast, for the MNE entities which are classified as lower tax entities, only Italy has a very high average debt share of 62.9 percent, and an even higher median debt share of 68.0 percent. Lower tax MNE entities in the Netherlands (38.1% average, 32.9%) have the lowest debt share, followed by those in Estonia (41.5% average, 37.8% median), the United Kingdom (41.9% average, 40.3% median) and Cyprus (44.6% average, 38.5% median).
Table 22 reports the descriptive statistics for the interest payments, expressed in percentage of assets. The overall average of interest payments amounts to 1.4 percent for domestic companies, which is very similar to the 1.5 percent for MNE entities in relatively higher tax countries and 1.6 percent for MNE entities in lower tax countries. Overall, the coverage for interest payments is incomplete and for firms in Denmark, Estonia, Malta and the Netherlands no interest payments are reported. For those countries where interest payments are reported, the distribution is clearly skewed to the left with medians always lying below the averages. This implies that some larger values for the interest payments are driving up the averages. Secondly, in most Member States, the interest payments, measured as a percentage of total assets are higher in the MNE entities which are not classified as relatively lower tax entities.
The highest values for domestic companies are in Luxembourg (3.0% average, 1.5% median), Ireland (2.4% average, 1.1% median), the United Kingdom (2.3% average, 0.9% median), Latvia (2.3% average, 0.8% median), Greece (2.2% average, 1.4% median) and Bulgaria (2.2% average, 0.9% median). In MNE entities classified as not being the lower tax entities we find higher values for interest payments, starting with 4.9 percent average (3.8% median) for Ireland, 4.1 percent average (1.3% median) for Croatia, 4.0 percent average (1.7% median) for Luxembourg and 3.2 percent average (1.3% median) in Romania. Slovenia stands out as the Member State where the MNE entities have the lowest interest payments (0.5% average, 0.1% median). The MNE entities which are classified as lower tax entities have generally lower interest payments ranging from 3.2 percent average (1.2% median) in Ireland, 2.9 percent average (0.9% median) in Luxembourg, 2.4 percent average (0.9% media) in Latvia, 2.3 percent average (0.8% median) in the United Kingdom to 0.5 percent average in Slovenia (0.1% median).

European Commission
Aggressive tax planning indicators
96
Table 22: Interest payments (% of ASSETS), by Member States (2010-2015)
Domestic companies Entities within a MNE group in a
higher tax country lower tax country
INT/ASSETS (%) No. obs.
INT/ASSETS (%) No. obs.
INT/ASSETS (%) No. obs. Country Mean Median Mean Median Mean Median
Austria 0.8 0.4 5257 1.2 0.6 1865 0.9 0.4 8473
Belgium 1.3 0.8 18042 1.2 0.6 14906 0.9 0.3 8489
Bulgaria 2.2 0.9 10734 2.8 1.6 884 2.0 1.0 4180
Croatia 0.7 0.5 18 4.1 1.3 16 1.7 1.6 5
Cyprus 1.3 1.3 2 n. a. n. a. 0 0.0 0.0 1
Czech Republic 1.4 0.7 10089 1.7 0.7 3302 1.3 0.6 12102
Denmark n. a. n. a. 0 n. a. n. a. 0 n. a. n. a. 0
Estonia n. a. n. a. 0 n. a. n. a. 0 n. a. n. a. 0
Finland 1.7 0.9 15511 1.9 0.8 4467 1.6 0.5 6271
France 1.0 0.5 149982 1.3 0.4 91395 n. a. n. a. 0
Germany 1.4 1.1 39988 1.7 1.2 13376 1.3 0.8 23257
Greece 2.2 1.4 2846 2.1 1.2 2054 1.4 0.5 2559
Hungary 1.5 0.8 470 1.4 0.9 347 1.5 0.7 2220
Ireland 2.4 1.1 1578 4.9 3.8 167 3.2 1.2 5051
Italy 1.3 0.8 144053 1.3 0.7 38214 1.0 0.4 30211
Latvia 2.3 0.8 3247 2.6 1.0 864 2.4 0.9 2698
Lithuania 0.4 0.4 2 n. a. n. a. 0 0.7 0.7 1
Luxembourg 3.0 1.5 1600 4.0 1.7 2095 2.9 0.9 2798
Malta n. a. n. a. 0 n. a. n. a. 0 n. a. n. a. 0
Netherlands n. a. n. a. 0 n. a. n. a. 0 n. a. n. a. 0
Poland 1.7 0.7 16729 1.8 0.7 2720 1.7 0.7 17291
Portugal 1.7 0.9 18949 1.8 1.0 4983 1.5 0.6 3964
Romania 1.5 0.8 2982 3.2 1.3 4635 2.2 0.9 12712
Slovakia 1.1 0.5 1596 1.1 0.6 1497 1.1 0.4 2777
Slovenia 0.4 0.1 1189 0.5 0.1 535 0.5 0.1 1019
Spain 1.4 0.8 76898 1.7 0.8 17797 1.4 0.6 27908
Sweden 1.3 0.7 80339 1.5 0.8 13507 1.2 0.6 19213
United Kingdom 2.3 0.9 49878 2.7 1.2 8963 2.3 0.8 57372
EU 28 1.4 0.7 651979 1.5 0.6 228589 1.6 0.6 250572
Average 1.5 0.8 2.1 1.0 1.5 0.7
Std. deviation 0.6 0.3 1.1 0.7 0.7 0.4
High values LU, IE, LV, UK, BG, EL
LU, EL, CY IE, HR,
LU, RO IE IE, LU, LV, UK HR, IE
Low values SI, LT, HR, AT
SI, LT, AT, HR SI SI CY, SI,
LT CY, SI,
BE
Notes: Based on the unconsolidated accounts from Orbis. No. obs. refers to firms serving as base for the mean and medians, i.e. firms with accounts with a ratio of interest payments/total assets within the interval of -0.5 to 0.5. Higher tax country is defined as not being a lower tax entity, hence includes also companies in MNE groups without a 5 percentage-points tax differential within the MNE group. n. a. refers to cases where mean and median are not defined due to a lack of observations. EU 28 refers to the means and medians over all observations, respectively to the sum of the observations. Average refers to the arithmetic mean of country values. High/low values are one standard deviation above/below the unweighted average, bold entries are 2 standard deviation above/below.
Source: Orbis data (Bureau van Dijk), own calculations

European Commission
Aggressive tax planning indicators
97
Table 23 and Table 24 look at the descriptive statistics of two underlying ratios for indicators for ATP channels using intangible assets and royalty payments. Specifically, Table 23 looks at the ratio of intangible assets to total assets, which is a broadly available but imprecise measure of intellectual property based on the balance sheet item intangible assets. Since intangible assets may also include non-royalty bearing assets, e.g. acquired goodwill, Table 24 also looks directly at patent ownership by firms.
Starting with the intangible assets ratio in Table 23 we see that for all three subgroups less than 50 percent of the firms are reporting intangible assets. This is reflected in the median level of intangibles assets being zero. At the same time, there are some companies which report substantial intangible assets, which brings the overall ratio to an average of 2.9 percent for domestic companies. This is broadly in line with the average of 3.3 percent for entities within MNE groups not classified as lower tax entities and 2.2 percent for entities which face a relatively lower tax rate. This is against the expectation from the description of the ATP structures, which predicts more intangible assets in lower tax entities. In domestic companies, we find the highest share of intangible assets in France (6.3% average, 0.4% median), Italy (4.6% average, 0.4% median), Finland (3.4% average, 0.1% median) and Greece (3.3% average, 0.1% median), while the lowest shares are in Slovakia (0.6% average, 0.0% median) and the Czech Republic (0.8% average, 0.0% median). Within MNE entities in relatively higher tax countries France has the highest share of intangible assets (4.6% average, 0.0% median), followed by Italy (4.5% average, 0.3% median) and Portugal (3.7% average, 0.0% median). Low share of intangible assets in this subgroup of firms are found in Romania (0.8% average), Slovakia (0.9% average), Latvia (1.0% average), Czech Republic (1.0% average), Bulgaria (1.1% average) and the Netherlands (1.2% average).75 In the MNE entities which are classified as lower tax entities we find again the highest share of intangible assets in France (4.4% average, 0.2% median), Italy (3.8% average, 0.3% median), Spain (3.8% average, 0.0% median) and Finland (3.2% average, 0.2% median).
Overall, the differences between the different types of firms are much less pronounced than the differences between Member States. Hence, apart from the observation of less intangible assets in Eastern European countries, one cannot draw strong conclusions from the country-level descriptive statistics.
75 In all these Member States, the median share of intangible assets is zero.

European Commission
Aggressive tax planning indicators
98
Table 23: Intangible assets (% of ASSETS), by Member States (2010-2015)
Domestic companies Entities within a MNE group in a
higher tax country lower tax country
INT_A/ASSETS (%) No. obs.
INT_A/ASSETS (%) No. obs.
INT_A/ASSETS (%) No. obs. Country Mean Median Mean Median Mean Median
Austria 1.6 0.1 12598 1.4 0.0 4101 1.5 0.0 17853
Belgium 1.6 0.0 57245 1.7 0.0 20506 1.9 0.0 12326
Bulgaria 1.4 0.0 14466 1.1 0.0 1035 1.6 0.0 5145
Croatia 1.6 0.0 91860 2.0 0.0 2303 2.1 0.1 2757
Cyprus 1.2 0.0 137 3.2 0.0 20 1.3 0.0 110
Czech Republic 0.8 0.0 17867 1.0 0.0 5240 0.8 0.0 20305
Denmark 2.2 0.0 114839 2.4 0.0 9783 2.3 0.0 14614
Estonia 2.3 0.0 4193 1.9 0.0 3003 1.9 0.0 2551
Finland 3.4 0.1 19870 3.6 0.3 6089 3.2 0.2 8628
France 6.3 0.4 187228 4.6 0.0 131209 4.4 0.2 2333
Germany 1.4 0.1 93200 1.8 0.1 31966 1.9 0.1 42427
Greece 3.3 0.1 3597 3.3 0.1 2645 1.7 0.0 3602
Hungary 3.0 0.1 720 2.6 0.1 512 2.1 0.1 3641
Ireland 1.2 0.0 4526 2.3 0.0 225 2.5 0.0 10824
Italy 4.6 0.4 161314 4.5 0.3 45968 3.8 0.3 36699
Latvia 1.2 0.0 5464 1.0 0.0 1334 1.0 0.0 4006
Lithuania 1.5 0.0 1146 2.5 0.0 470 2.1 0.1 2096
Luxembourg 1.1 0.0 2366 1.3 0.0 3077 1.4 0.0 4135
Malta 2.1 0.0 1652 3.0 0.0 1037 n. a. n. a. 0
Netherlands 1.4 0.0 29686 1.2 0.0 7806 1.6 0.0 29428
Poland 2.0 0.0 21337 2.9 0.1 3627 1.4 0.0 23864
Portugal 2.1 0.0 26925 3.7 0.0 7200 2.3 0.0 6584
Romania 0.8 0.0 6835 0.8 0.0 10206 1.2 0.0 24478
Slovakia 0.6 0.0 2318 0.9 0.0 2246 1.3 0.0 3950
Slovenia 2.2 0.1 1473 2.5 0.3 616 2.8 0.3 1204
Spain 2.5 0.0 92363 3.3 0.0 23762 3.8 0.0 38858
Sweden 1.2 0.0 89730 1.7 0.0 17297 2.1 0.0 24857
United Kingdom 1.8 0.0 110596 2.1 0.0 22330 2.1 0.0 116067
EU 28 2.9 0.0 1175551 3.3 0.0 365613 2.2 0.0 463342
Average 2.0 0.0 2.3 0.1 2.1 0.0
Std. deviation 1.2 0.1 1.1 0.1 0.9 0.1
High values FR, IT, FI, EL
FR, IT, SI FR, IT,
PT SI, IT,
FI FR, IT, ES, FI
IT, SI, FI, FR
Low values SK, CZ RO, SK, CZ, LV, BG, NL
CZ, LV, RO
Notes: Based on the unconsolidated accounts from Orbis. No. obs. refers to firms serving as base for the mean and medians, i.e. firms with accounts with a ratio of intangible assets/total assets within the interval of 0 to 1. Higher tax country is defined as not being a lower tax entity, hence includes also companies in MNE groups without a 5 percentage-points tax differential within the MNE group. n. a. refers to cases where mean and median are not defined due to a lack of observations. EU 28 refers to the means and medians over all observations, respectively to the sum of the observations. Average refers to the arithmetic mean of country values. High/low values are one standard deviation above/below the unweighted average, bold entries are 2 standard deviations above/below.
Source: Orbis data (Bureau van Dijk), own calculations

European Commission
Aggressive tax planning indicators
99
Table 24 looks directly at patent ownership by firms. To avoid double counting, we include only the granted patents in our dataset. The match between the data from the European patent office and Orbis is at least until now not so good, which leaves us with a significantly reduced dataset. Overall, we are left only with 8,877 observations for domestic companies, 7,945 for MNE entities which are not a lower tax entity and 15,581 for lower tax entities in MNE groups. This is a remarkable shift between domestic companies and MNEs which reflects that patent applications tend to be concentrated in MNE groups. This point is further reinforced by the higher averages and medians in MNE groups. The average domestic company in the EU only hold 0.7 patents, while in lower tax entities in MNE groups an average of 2.6 patents is found. In comparison, in those MNE entities which are classified not as lower tax entities we find on average 2.0 patent applications. Furthermore, the patent applications are concentrated in a few companies which is visible through the clearly higher averages than medians. Overall, the relatively few observations for which we are able to match the patent information on the firm level data are consistent with the predictions of the ATP structures. This is also evident when we look at the level of the Member States.
In domestic companies, the few firms in Malta stand out with an average of 5.2 patent applications. In contrast, looking at the median number of patent application in domestic companies, France, Greece, Hungary and Lithuania have a relatively high value of 1. However, only in the case of France this is based on a meaningful number of observations.
For firms within MNEs not classified as lower tax entities, we observe the highest number of patent granted in France (3.1 average, 1.0 median) and Germany (1.6 average, 1.0 median). This pattern is also reflected in the MNE entities classified as lower tax entities where the highest number of patent granted is found for France (4.3 average, 1.0 median), Belgium (4.2 average, 1.0 median), Netherlands (3.6 average, 1.0 median) and Germany (3.5 average, 1.0 median). Among the top 4 countries in terms of number of patents, three have a patent box.76 While there may be also an economic and industrial underpinning behind this number of patents, this seems to indicate that patent boxes play a role in attracting patents.
76 In 2015 a patent box was in place in Belgium, Cyprus, France, Hungary, Italy, Luxembourg, Malta, Netherlands, Spain, Portugal, United Kingdom. See Table 52 for more information.

European Commission
Aggressive tax planning indicators
100
Table 24: Patents granted, by Member States (2010-2015)
Domestic companies Entities within a MNE group in a
higher tax country lower tax country
No. Patent granted No. obs.
No. Patent granted No. obs.
No. Patent granted No. obs. Country Mean Median Mean Median Mean Median
Austria 0.9 0.0 385 0.7 0.0 204 1.9 1.0 1091
Belgium 0.7 0.0 242 0.8 0.0 345 4.2 1.0 475
Bulgaria 0.0 0.0 2 n. a. n. a. 0 n. a. n. a. 0
Croatia n. a. n. a. 0 n. a. n. a. 0 n. a. n. a. 0
Cyprus n. a. n. a. 0 n. a. n. a. 0 n. a. n. a. 0
Czech Republic 0.7 0.0 30 0.4 0.0 20 0.8 0.0 118
Denmark 0.5 0.0 553 1.2 0.0 183 1.7 1.0 566
Estonia 0.2 0.0 10 0.1 0.0 8 1.0 1.0 1
Finland 0.3 0.0 337 0.4 0.0 174 2.1 1.0 684
France 1.0 1.0 1100 3.1 1.0 3250 4.3 1.0 213
Germany 1.0 0.0 2712 1.6 1.0 2656 3.5 1.0 6081
Greece 1.1 1.0 10 0.4 0.0 10 1.5 1.0 14
Hungary 1.0 1.0 1 n. a. n. a. 0 0.8 1.0 26
Ireland 0.3 0.0 32 n. a. n. a. 0 1.2 1.0 203
Italy n. a. n. a. 0 n. a. n. a. 0 n. a. n. a. 0
Latvia 0.5 0.5 2 n. a. n. a. 0 n. a. n. a. 0
Lithuania 1.2 1.0 6 0.3 0.0 3 0.0 0.0 2
Luxembourg 0.7 0.0 19 0.6 0.0 20 2.1 1.0 97
Malta 5.2 0.0 13 0.8 1.0 8 0.5 0.5 2
Netherlands 0.5 0.0 550 1.3 1.0 125 3.6 1.0 782
Poland 0.4 0.0 170 0.4 0.0 47 0.9 0.0 91
Portugal 0.5 0.0 58 0.2 0.0 43 0.3 0.0 35
Romania 0.3 0.0 4 0.2 0.0 6 n. a. n. a. 0
Slovakia 0.1 0.0 12 0.7 1.0 6 0.3 0.0 6
Slovenia 0.4 0.0 16 0.6 0.5 16 0.8 1.0 29
Spain 0.4 0.0 585 0.7 0.0 309 0.8 0.0 827
Sweden 0.4 0.0 717 1.3 0.0 252 2.3 1.0 1208
United Kingdom 0.6 0.0 1311 0.6 0.0 260 1.6 1.0 3030
EU 28 0.7 0.0 8877 2.0 1.0 7945 2.6 1.0 15581
Average 0.8 0.2 0.8 0.3 1.6 0.7
Std. deviation 1.0 0.2 0.7 0.4 1.3 0.5
High values MT FR, LT, EL, HU FR, DE
FR, DE, MT, NL,
SK FR, BE, NL,
DE
Low values LT, SK, RO CZ, LT, PT, SK,
ES
Notes: Based on the unconsolidated accounts from Orbis. No. obs. refers to firms serving as base for the mean and medians, i.e. firms which are matched with information of the European patent office. Higher tax country is defined as not being a lower tax entity, hence includes also companies in MNE groups without a 5 percentage-points tax differential within the MNE group. n. a. refers to cases where mean and median are not defined due to a lack of observations. EU 28 refers to the means and medians over all observations, respectively to the sum of the observations. Average refers to the arithmetic mean of country values. High/low values are one standard deviation above/below the unweighted average, bold entries are 2 standard deviation above/below.
Source: Orbis data (Bureau van Dijk), European patent office, own calculations

European Commission
Aggressive tax planning indicators
101
Key findings
The descriptive statistics of specific indicators are generally consistent with at least some ATP taking place. For 25 out of 28 Member States, we see a higher pre-tax profitability in MNE entities with a relatively low statutory tax burden. The fact, that we see a similar picture for operating profitability points into the direction that ATP structures using royalty payments or strategic transfer pricing are also playing a role. The MNE entities in the Netherlands fall somewhat outside this picture which is also reflected in their financial profits and losses. While, for most Member States, we can observe financial losses on average, we see on average financial profits for the MNE entities some Member States, including Denmark, Sweden, Austria and the Netherlands. This suggests that at least some MNE groups relocate corporate tax base to their entities in these Member States via ATP structures using interest payments. The results for debt shares are broadly in line with the predictions of the ATP structures while the interest payments reported in the profit and loss accounts are too incomplete to show any convincing evidence for the ATP channel via interest payments. Equally, looking at the aggregate distribution of the intangible assets does not show patterns which are consistent which the ATP channel using royalty payments while, for the relatively few companies where we can match patent ownership information, some pattern emerges. The patent holdings tend to be concentrated in countries with patent boxes, most notable France, Belgium and the Netherlands (albeit also in Germany). Overall, once we go beyond the profitability measures, the country level evidence for the specific indicators is less compelling. This may be due to several reasons; the most obvious one being poor data quality, due to insufficient coverage of the relevant balance sheet item or data points overall. Another reason is that the calculation of Member State wide means and medians masks compositional difference between the subgroups. If MNE entities are operating in systematically different industries, which also have different economic fundamentals, the averaging over the different groups can cover the traces of ATP structures. To overcome this issue, we will use industry-country cells for comparison in the analysis of the next section.
4.1.6 Royalty flows, bilateral import price anomalies and treaty shopping indicators
The royalty payments are not available at firm level, but rather only at the bilateral country-pair and country level. Furthermore, the bilateral data is in a number of instances incomplete, therefore Table 25 reports the total sums, i.e. royalty payments and receipts with all countries of the world. In order to relate the total royalty payments and receipts to the economic size of the Member States we report the values in percent of GDP. Additionally, to highlight imbalances we also report the difference between payments and receipts, i.e. the net payments. Positive values for the difference indicate that entities in the Member States pay more royalties than they are receiving from other entities abroad. Since royalty flows can be volatile and display large values for a particular year, the table reports both the averages of the sample period 2010 to 2015 and the value for 2015.

European Commission
Aggressive tax planning indicators
102
Table 25: Royalty flows, by Member States (2010-2015)
Royalty receipts Royalty payments Net payments
(% of GDP) (% of GDP) (% of GDP)
Country Average 2010-2015 2015 Average
2010-2015 2015 Average 2010-2015 2015
Austria 0.32 0.26 0.55 0.43 0.22 0.17
Belgium 0.75 0.78 0.75 0.81 0.00 0.03
Bulgaria 0.06 0.11 0.42 0.42 0.36 0.31
Croatia 0.07 0.10 0.61 0.61 0.55 0.51
Cyprus a 0.01 0.01 0.43 0.84 0.42 0.83
Czech Republic 0.23 0.28 0.71 0.72 0.48 0.44
Denmark 0.78 0.78 0.48 0.46 -0.30 -0.32
Estonia 0.09 0.06 0.33 0.21 0.24 0.16
Finland b 1.46 1.15 0.70 0.40 -0.76 -0.75
France 0.67 0.69 0.53 0.64 -0.14 -0.05
Germany 0.43 0.48 0.28 0.29 -0.14 -0.19
Greece 0.04 0.03 0.22 0.17 0.18 0.13
Hungary 1.95 1.37 1.73 1.27 -0.22 -0.11
Ireland 2.77 2.91 26.39 29.36 23.62 26.45
Italy 0.22 0.19 0.35 0.26 0.12 0.08
Latvia 0.04 0.03 0.20 0.14 0.15 0.11
Lithuania 0.04 0.06 0.13 0.13 0.09 0.07
Luxembourg 2.51 3.09 5.80 6.00 3.29 2.91
Malta 6.34 3.20 9.45 4.88 3.11 1.67
Netherlands 4.80 5.78 6.06 6.96 1.26 1.18
Poland 0.08 0.10 0.64 0.57 0.56 0.47
Portugal 0.04 0.05 0.34 0.39 0.31 0.34
Romania 0.17 0.06 0.46 0.50 0.28 0.45
Slovakia 0.03 0.03 0.51 0.66 0.48 0.63
Slovenia 0.14 0.15 0.82 0.57 0.67 0.42
Spain b 0.13 0.15 0.43 0.42 0.30 0.27
Sweden 1.81 1.98 0.65 0.93 -1.16 -1.04 United Kingdom 0.83 0.68 0.50 0.48 -0.33 -0.20
EU 28 0.80 0.82 1.14 1.29 0.34 0.47
Average 0.96 0.88 2.16 2.13 1.20 1.25
Std. deviation 0.96 1.36 5.22 5.62 4.49 4.99
High values MT, NL, IE, LU
NL, MT, LU, IE IE IE IE IE
Low values
Notes: a Average over 2011-2015. b Average over 2012-2015. We use the item “Charges for the use of intellectual property, n.e.c” as proxy for royalty flows. EU 28 refers to the average value for the EU overall. Average refers to the arithmetic mean of country values. High/low values are one standard deviation above/below the unweighted "Average", bold entries are 2 standard deviations above/below.
Source: Eurostat, OECD EBOPS 2010, World Development indicators

European Commission
Aggressive tax planning indicators
103
Overall, we see that all Member States together have an inflow of royalty payments of 0.80 percent of combined GDP, while they have an average outflow of royalty receipts of 1.14 percent. This implies an overall net payment of 0.34 percent of combined GDP. While the outflows in 2015 are similar to the average of the period 2010 to 2015 the inflows saw a marked increase in 2015. A broad comparison between the overall values to the unweighted average of the country values reveals that the receipts are much higher in a number of smaller Member States, resulting in a clearly higher unweighted average for receipts and net receipts.
The country level patterns in Table 25 are very clear. Malta (6.34%), the Netherlands (4.80%), Ireland (2.77%) and Luxembourg (2.51%) have the highest royalty receipts in percent of the GDP. With the exception of Malta, all the values are driven by an even higher value in 2015 suggesting that the importance of royalty receipts is increasing over time. Regarding royalty payments Ireland is the Member State which stands out with a very large amount of royalty payments. The royalty payments of 26.39 percent of GDP (29.36% for 2015) also result in extraordinarily high net payments of 23.62 percent (26.45% for 2015). Other countries which are reporting substantial royalty outflows are Luxembourg, Malta and the Netherlands.77 At the same time, these three countries are also characterised by large inflows of royalty payments, which reduces the net payments. The majority of Member States has moderately positive net royalty flows, while a few Member States experience a clear net inflow of royalty payments. This is most pronounced for the Scandinavian countries, Finland, Sweden, Denmark and the United Kingdom. Due to their size, France and Germany have a high total inflow of royalty payments in absolute value, but only a moderate net royalty inflow in relation to the GDP. Overall, the country level aggregates are consistent with the hypothesis of substantial ATP via royalty payments taking place.
Bilateral import price anomalies: We use bilateral trade data from the Eurostat Comext database to identify anomalies in bilateral import prices. We use the monthly import data from 2010 to 2015 for all EU 28 countries with each other and ten potential no/zero tax countries and aggregate them to bilateral yearly values at the 8-digit product classification. After data cleaning, we are left with 644,944 observations.78 We then calculate median unit values for each product-importer country-year combination. Then we relate each of the bilateral unit values to this benchmark. If we observe a bilateral unit value which is either five times higher or lower than a fifth of the median value of this product we treat this bilateral unit price as suspicious. This leads to 3,067 cases where import prices are too high and to 4,038 cases where import prices are too low.79 The flip-side of the coin are 2,892 cases where export prices are too high and 4,006 cases where the export prices are too low.
77 We depart from the rule of discussing Member States which fall outside one standard deviation of the unweighted average of the country values. This is because Ireland is such an extraordinary outlier, that it masks other patterns. 78 We use only those cells which have at least 100 tons and a total value of at least 100,000 Euros. Further we restrict the dataset to goods for which we have at least 10 transactions per year and a minimum of 5 importing and 5 exporting countries. 79 The choice of the threshold hardly affects the country ranking. We alternatively used thresholds between two times higher and half as high and the country ranking is still correlated with 0.97.

European Commission
Aggressive tax planning indicators
104
The remaining 207 cases involve non-EU countries and are therefore not visible in the exporting country perspective in Table 26.

European Commission
Aggressive tax planning indicators
105
Table 26: Bilateral import price anomalies, by Member States (2010-2015)
By exporting country: Prices are too
By import country: Prices are too
Country high low high Low
Austria 141 226 129 130 Belgium 237 304 178 165 Bulgaria 7 32 21 51 Croatia 17 14 12 11 Cyprus 1 0 1 0 Czech Republic 104 259 148 337 Denmark 63 113 84 81 Estonia 2 12 3 8 Finland 39 49 21 22 France 313 363 315 265 Germany 295 373 244 200 Greece 13 60 25 44 Hungary 62 146 129 98 Ireland 163 26 34 57 Italy 198 301 308 337 Latvia 4 20 17 16 Lithuania 8 49 17 31 Luxembourg 25 18 7 4 Malta 0 0 6 4 Netherlands 247 300 256 447 Poland 141 371 143 227 Portugal 14 57 28 28 Romania 26 68 63 117 Slovakia 41 143 131 312 Slovenia 14 99 42 21 Spain 124 212 314 542 Sweden 114 141 129 132 United Kingdom 479 250 262 351
EU 28 total 2892 4006 3067 4038
Average 103.3 143.1 109,5 144,2 Std. deviation 120.3 127.3 106.9 151.9
High values UK, FR, DE, NL, BE
DE, PL, FR, BE, IT, NL
FR, ES, IT, UK, NL, DE
ES, NL, UK, IT, CZ, SK
Low values MT, CY, EE, HR CY
Notes: Export prices too high (low) refers to the number of bilateral unit prices which are more than 5 times higher (lower) than the median price of the good in this year in the importing country, counted by the exporter country. The same applies for the import prices, but counted by the importer country. EU 28 total refers to the sum of the observations. Average refers to the arithmetic mean. High/low values are one standard deviation above/below the unweighted average, bold entries are 2 standard deviations above/below.
Source: Comext database, Eurostat, own calculations
European Commission
Aggressive tax planning indicators
106
Table 26 sums up the bilateral cases of too high or too low import prices by exporter and importer country. While the number of bilateral trade price anomalies is not showing a very clear picture, there are still some characteristics which indicate that the price anomalies might be driven by transfer pricing.
Starting with the view on the exporting countries, we see that, except for the United Kingdom (479), countries with the highest number of cases of abnormally high prices are relatively higher tax rates such as France (313), Germany (295), the Netherlands (247) and Belgium (247) have. The number of cases with abnormally low prices is highest in Germany (373), followed by Poland (371), France (363), Belgium (304), Italy (301) and the Netherlands (301). This suggests, that strategic transfer pricing is used for shifting profits into and out of these countries. The higher number of cases of abnormally high prices in the United Kingdom points into the direction of more tax base being moved to the United Kingdom. The other countries with high values, all have more cases of abnormally low prices. This is also reflected in the view on the importing countries. Here we find the highest number of abnormally high prices in France (315), followed by Spain (314), Italy (308), the United Kingdom (262), the Netherlands (256) and Germany (244). The prevalence of abnormally low import prices is highest in Spain (542), the Netherlands (447), the United Kingdom (351), Italy (337), the Czech Republic (337) and Slovakia (312). For France and Germany, the results are comparable to the trend observed discussed above, i.e. an erosion of the tax base through transfer pricing. For the United Kingdom, similar to what was mentioned above, there is an indication that tax base would be increased through transfer pricing. For Spain and the Netherlands, the higher number of low import prices would indicate that tax base is moved to these countries, which is not consistent with what is observed from the "exporting side". That said, the aggregation up to the Member States level does not allow for a more detailed analysis of the bilateral patterns. Additionally, one has to bear in mind that the overall number of abnormal prices amounts to only about one percent of the cases.
Treaty shopping indicators: There is little quantitative information on treaty shopping, no readily available measure exists for its magnitude, nor on the size of the subsequent reduction of the effective tax burden for MNE’s. Van‘t Riet and Lejour (2014 and 2017) consider dividend repatriation for a set of 108 countries, including all Member States, covering almost 95 percent of world GDP in 2013. Moreover, many zero/no tax countries and financial centres are included. For this set of countries treaty shopping indicators are generated.
For each pair of countries, the combined tax rate on repatriation of dividends can be determined. We denote the headquarter country as the home country of an investment, and the host country where the investment takes place. Further we abstract from the corporate income tax at in the host country, and fully concentrate on the additional tax burden upon repatriation to the headquarter. This tax burden may include a withholding tax levied by the host country. Countries have standard rates for their withholding taxes but also engage in bilateral tax treaties, in which, often reciprocally, reduced withholding tax rates have been agreed upon with their treaty partners. Next, the home country may subject the foreign dividend income to its own corporate income tax; this depends on the method of double tax relief they apply. With the dividend participation exemption there will be no further taxation in
European Commission
Aggressive tax planning indicators
107
the home country. With a credit system or deduction as tax relief method, there may still be taxation in the home country. The combined host and home taxation is the repatriation tax.
As a starting point, we calculate the bilateral repatriation tax rates for each country pair. This bilateral tax burden primarily depends on the interplay of unilateral rules by each country and the bilateral tax treaties between the country pairs.80 From the set of bilateral tax rates, country average repatriation tax rates are computed, for direct outward and inward dividend flows. For each host country, the bilateral repatriation tax rates of all the possible home countries are weighted with the GDP of the home country, as a proxy for the relative size of the outward dividend flows. Similarly, the inward average tax rates are weighted. These average tax burdens measure the repatriation tax in the absence of treaty shopping and are a useful reference point for the potential relevance of treaty shopping. The first columns in Table 27 reports these average dividend repatriation taxes together with the number of bilateral tax treaties in force. Regarding the number of tax treaties, France (80), the Netherlands (74), Germany (71), Spain (71) and Belgium (70) rank highest. Cyprus (35), Estonia (36), Malta (38), Greece and Slovakia (42 each) in contrast have signed the least number of tax treaties of all Member States.
Among the Member States Luxembourg is found to have the lowest average repatriation tax rate for outward dividends, thus in its capacity as a host country. This average rate is 6.8 percent, and Luxembourg ranks fourth lowest in the full set of 108 countries. The three countries with a lower average outward rate than Luxembourg have no withholding tax on dividends whereas Luxembourg has a standard rate of 15 percent. Other Member States with low average repatriation rates for outward dividends are France (8.0%), Slovakia (8.7%), the United Kingdom (8.8%) and Belgium (9.0%). At the other end of the spectrum are Cyprus (19.8%), Bulgaria (17.4%), Malta (16.8%), Ireland (16.1%) and Lithuania (16.0%). This partly reflects the lower number of tax treaties, which may result in substantial double taxation for subsidiaries in non-EU destinations.
For headquarter countries the average inward repatriation tax rates matter. The Netherlands (3.4%) has the lowest rate among the Member States and worldwide. Other Member States with low average inward repatriation rates are Finland (3.7%), the United Kingdom (3.8%), Sweden (3.8%) and Luxembourg (4%). Most other EU countries also have relatively low average inward rates, resulting in an EU average of 6.5 percent. This can be compared to the average rate of the USA which is 16.7 percent. This difference is one reason for the attractiveness of European countries for corporate inversions of US MNE’s. In comparison, the highest direct inward repatriation tax rates in EU Member States are 13.1 percent for Slovakia, 11.9 percent for Croatia, 11.8 percent for Greece and 9.7 percent in Portugal.
80 This calculation is based on the national, bilateral (tax treaties) and multilateral (e.g. parent subsidiary directive) tax law information for the year 2013. For more detailed information see van’t Riet and Lejour (2017).

European Commission
Aggressive tax planning indicators
108
Table 27: Treaty shopping indicators (2013)
Repatriation tax direct flows
Repatriation tax optimised flows
Attractiveness for treaty shopping
Country No. Tax treaties outward inward outward inward Centrality
Austria 66 11.2 4.8 5.3 1.6 1.9
Belgium 70 9.0 4.3 3.4 1.6 3.0
Bulgaria 50 17.4 6.7 5.3 1.6 1.9
Croatia 44 14.0 11.9 5.3 1.6 0.4
Cyprus 35 19.8 7.5 5.3 1.6 4.3
Czech Republic 66 14.3 6.7 5.3 1.6 1.2
Denmark 61 12.6 4.6 5.3 1.6 3.2
Estonia 36 10.0 6.7 5.3 1.6 6.7
Finland 59 11.6 3.7 5.3 1.6 3.9
France 80 8.0 6.9 3.3 1.7 3.8
Germany 71 11.1 5.2 4.7 1.7 2.4
Greece 42 9.8 11.8 5.3 1.6 1.5
Hungary 47 11.2 5.8 5.3 1.6 6.1
Ireland 53 16.1 5.6 5.3 1.6 5.5
Italy 69 10.5 6.9 4.2 1.7 1.1
Latvia 45 15.3 6.3 5.3 1.6 1.8
Lithuania 44 16.0 6.3 5.3 1.6 2.1
Luxembourg 57 6.8 4.0 4.8 1.6 7.7
Malta 38 16.8 6.6 4.8 1.6 4.2
Netherlands 74 9.9 3.4 5.3 1.7 6.6
Poland 64 13.7 6.3 5.3 1.7 1.3
Portugal 53 11.9 9.7 4.1 1.6 0.9
Romania 66 14.7 7.5 5.3 1.6 1.6
Slovakia 42 8.7 13.1 5.3 1.6 5.3
Slovenia 46 14.9 6.5 5.3 1.6 1.9
Spain 71 9.8 6.8 4.6 1.7 3.4
Sweden 67 12.4 3.8 5.3 1.6 3.6
United Kingdom 51 8.8 3.8 5.4 1.7 12.2
EU 28 56.0 12.4 6.5 5.0 1.7 3.6
Average 56.0 12.4 6.5 5.0 1.7 3.6
Std. deviation 12.9 3.2 2.5 0.6 0.0 2.6
High values FR, NL, DE, ES, BE
CY, BG, MT, IE, LT
SK, HR, EL, PT DE, UK,
FR, IT UK, LU, EE, NL
Low values CY, EE, MT, EL, SK
LU, FR, SK, UK,
BE
NL, FI, UK, SE, LU
FR, BE, PT, IT, HR, PT
Notes: Repatriation tax rate refers to the GDP weighted average for 108 countries. Centrality refers to the GDP-weighted percentage of tax optimal repatriation routes which include the respective country. EU 28 and average refers to the unweighted average of country values. High/low values are one standard deviation above/below the unweighted average, bold entries are 2 standard deviations above/below.
Source: van’t Riet and Lejour (2017), own calculations

European Commission
Aggressive tax planning indicators
109
The columns four and five in Table 27 report the corresponding average outbound and inbound dividend repatriation tax, if the repatriation path is optimised, i.e. treaty shopping is taking place. Treaty shopping is the practice where MNEs, rather than investing directly in a host country, funnel the investment through a third country (or more) to take advantage of treaty provisions not found between the host and the home country of the investment (Davies, 2004). This practice is implemented by letting the MNE’s determine their optimal dividend repatriation strategy. They consider the international corporate tax infrastructure as a network and choose their tax minimizing routes.
For each country pair, the tax minimizing repatriation routes are computed. These may still be the direct routes. However, for two-thirds of all country pairs there is an indirect route that is ‘cheaper’ than the direct route. Note, that an indirect route may involve more than one intermediate station (conduit country). For all country-pairs also the lowest possible repatriation tax rates are recorded. Again, GDP-weighted average repatriation tax rates are computed for the countries in their home and host capacities, for optimal repatriation strategies.
Two things are striking in the tax-optimised repatriation rates. First, they are clearly much lower than the direct repatriation rates. For outbound repatriation taxes the overall average drops from 12.4 percent to 5.0 percent, for inward repatriation rates from 6.5 percent to 1.7 percent. This confirms the relevance of treaty shopping strategies. Second, the variation between the Member States is much smaller, which represents a relatively even levelled playing field including treaty shopping. France (3.3%), Belgium (3.4%), Portugal (4.1%) and Italy (4.2%) are the Member States which still have relatively low outbound repatriation rates. The inward repatriation rates are close around 1.6 percent for all Member States, with values of 1.7 percent for Germany, the United Kingdom, France and Italy.
Furthermore, it is noteworthy that, with optimal repatriation strategies, no EU country will be able to impose residence taxation. Repatriated dividends will enter the EU through a country with the dividend participation exemption. With the Parent-Subsidiary directive, any other Member State can be reached without taxation. Additionally, most source taxation will disappear given optimal tax routes. Within the EU dividends can be moved without taxation to a Member State that levies no withholding tax. However, in some cases it may be preferable for MNE’s to pay some withholding tax in a Member State with a tax treaty with the non-EU residence country when this treaty stipulates a more favourable tax relief in the residence country.
The last column of Table 27 presents the centrality measure as a direct measure of the attractiveness of the Member States as a treaty shopping location. The value of the centrality measure can also be interpreted as a weighted fraction: the United Kingdom would be on 12.2 percent of the cheapest tax routes of all country pairs. It is followed by Luxembourg (7.7%), Estonia (6.7%) and The Netherlands (6.6%). At the bottom of the league, we find Croatia (0.4%) and Portugal (0.9%). The United Kingdom ranks high because it is an EU member and it levies no non-resident withholding tax on dividends. It shares these characteristics with Cyprus, Estonia, Hungary, Malta and Slovakia, all in the top 10. But the UK has signed more bilateral tax treaties, and multinationals face on average a lower withholding tax on incoming dividends. The impact on this ranking of a zero rate on the withholding tax is evident.

European Commission
Aggressive tax planning indicators
110
Luxembourg is the first country without a general rate of zero to appear on the list, the Netherlands and Ireland are second and third, but all three countries have signed many bilateral tax treaties. Finally, it is worth noting that each of the Member States features in some tax optimal repatriation strategies. Given, that almost a third of the 108 countries considered in the treaty shopping analysis are not used at all in treaty shopping strategies, this is a remarkable characteristic of EU Member States.
Key findings
The country-level information of royalty payments and receipts draws a very clear picture. Ireland stands out as the Member States with the highest net royalty payments, which is consistent with the ATP channel using royalty payments. Other Member States with significant royalty inflows and outflows are Luxembourg, Malta and the Netherlands. Sweden, Finland, Denmark and the United Kingdom have the highest net receipts. The analysis of bilateral import price shows that higher tax countries such as Germany or France tend to have more anomalies in terms of high import prices, pointing to an erosion of tax base through transfer pricing. Spain, the United Kingdom, the Netherlands and Italy also have a relatively high number of price anomalies, which suggests that strategic transfer pricing strategies could affect the base in these countries. Overall, however, the bilateral trade price anomalies can only give a first indication and further research would be necessary. The treaty shopping indicators identify some countries like the United Kingdom, Luxembourg, the Netherlands and Estonia as central on dividend repatriation routes. Treaty shopping is of relevance for repatriations from outside the EU.

European Commission
Aggressive tax planning indicators
111
4.2 Roles in ATP structures, by Member States
In this subsection, we present the roles of the entities within MNE groups and how the roles are distributed across Member States. We use the combination of indicators described in subsection 3.3 and allocate each entity within a MNE group to a unique role in the respective ATP structures. After excluding those observations where we have information for none of the indicators, we are left with a total of 1,432,034 observations for the period 2010 to 2015. Overall, we have at least some information about 251,744 European entities in 55,373 groups.81 We concentrate the presentation in the main text on the standard classification, because the strict classification into roles results in very low numbers of entities which can unambiguously attributed to roles within ATP structures.82
4.2.1 Roles within ATP via interest payments
The results for the ATP structure using interest payments are presented in Table 28. For each Member State, we present the share of companies which are classified as target entities (i.e. those entities where the tax base is reduced because of an interest deduction), lower tax entities (i.e. those entities where tax base is taxed at a lower rate), conduit entities (i.e. entities with an MNE group with ATP, but not a target or lower tax entity) and the share of companies for which the data is either not consistent with the ATP channel using interest payments or insufficient to draw any conclusion. The results in Table 28 present only the share of companies and do not distinguish between subsidiaries and headquarter companies. This information can be found in the detailed results in the appendix in Table 62.
As discussed in Section 2, target entities are characterised by lower pre-tax profitability, lower financial profitability together with either a higher debt share or higher interest payments in these entities. Additionally, they must be located in a country with a statutory tax rate relatively higher than in other parts of the MNE group.83 Overall, these requirements result in 5.0 percent of the firms being classified as target entities. France (20.5%) and Belgium (12.4%) stand out as the Member States with the largest share of the companies classified as target entities. In contrast, no firms are classified as target entities in Bulgaria, Cyprus, Ireland and Lithuania.
The second category is the lower tax entities, which are attracting corporate tax base through a potentially lower tax burden. These are the mirror image of the target entities and the requirements for an entity being classified as a lower tax entity are higher pre-tax profitability, higher financial profitability together with either a lower debt share or lower interest payments. Additionally, they need to be located in countries with a statutory tax rate being relatively lower than in other parts of the MNE group.
81 See Table 61 in the appendix for a break-down of observations by Member States. 82 See appendix for a summary of the different assumptions underlying the strict and weak classifications. For the detailed results see also Table 62, Table 63, Table 64, Table 65 and Table 66 in the appendix. 83 See Table 38 in the appendix for a complete description of the combination of indicators.

European Commission
Aggressive tax planning indicators
112
Table 28: Roles ATP structures using interest payments, by Member States
% of entities classified as
Country target entity lower tax entity conduit entity not consistent/ insufficient data
Austria 1.1 9.2 42.5 47.1 Belgium 12.4 4.4 33.9 49.4 Bulgaria 0.0 17.4 26.7 55.9 Croatia 1.5 3.1 30.5 64.9 Cyprus 0.0 1.3 29.9 68.7 Czech Republic 0.2 9.1 27.3 63.3 Denmark 1.1 5.1 34.2 59.6 Estonia 1.9 1.7 24.4 72.0 Finland 2.5 5.5 33.5 58.5 France 20.5 0.0 31.5 48.0 Germany 2.4 4.3 37.5 55.8 Greece 2.2 7.6 30.6 59.6 Hungary 0.9 9.9 49.0 40.1 Ireland 0.0 8.4 44.5 47.1 Italy 5.5 7.8 29.3 57.4 Latvia 0.0 10.3 23.9 65.8 Lithuania 0.0 4.5 28.3 67.2 Luxembourg 1.6 5.2 30.8 62.3 Malta 5.8 0.0 31.1 63.1 Netherlands 0.2 3.7 45.3 50.8 Poland 0.2 12.5 33.4 54.0 Portugal 5.2 6.0 30.2 58.7 Romania 0.1 8.7 17.3 73.8 Slovakia 1.4 7.8 29.0 61.8 Slovenia 4.2 13.0 38.0 44.8 Spain 3.3 6.9 33.9 56.0 Sweden 3.7 7.6 37.3 51.3 United Kingdom 0.7 7.7 42.5 49.1 EU 28 5.0 6.3 39.1 49.5 Average 2.8 6.7 33.1 57.4 Std. deviation 4.4 4.0 7.1 8.5
High values FR, BE BG, SI, PL
HU, NL, IE, AT,
UK
RO, EE, CY, LT
Low values FR, MT, CY, EE
RO, LV, EE
HU, SI, AT, IE,
FR Notes: Based on the unconsolidated accounts in Orbis, pooled over the years 2010-2015. Entries refer to percentage of entities, i.e. the sum of subsidiaries and owners. EU 28 refers to the average over all observations, while Average reports the arithmetic average of the country values. High/low values are one standard deviation above/below the unweighted average, bold entries are 2 standard deviations above/below.
Source: Orbis data (Bureau van Dijk), own calculations

European Commission
Aggressive tax planning indicators
113
For all Member States, we find on average 6.3 percent of the firms showing the characteristics of lower tax entities. The highest shares of lower tax entities are found in Bulgaria (17.4%), Slovenia (13.0%) and Poland (12.5%). In France and Malta none of the firms play the role of a lower tax entity and only very few firms in Cyprus (1.3%) and Estonia (1.7%) are classified as lower tax entities. It should be noted that this is based on the statutory tax rates (and does therefore not reflect specific tax regimes).
The third category is conduit entities. This category covers all firms for which we have at least one target entity within the MNE group, but are unable to allocate the entity itself to either target or lower tax entity. Overall, 39.1 percent fall in to this category. The conduit entity role is most common in Hungary (49.0%), the Netherlands (45.3%), Ireland (44.5%), United Kingdom (42.5%) and Austria (42.5%). In contrast, some Eastern European countries have the lowest share of conduit entities, namely in Romania (17.3%), Latvia (23.9%) and Estonia (24.4%) less than a quarter of the firms fall into this category.
The final category collects all firms, where data is insufficient or indicators inconsistent with the ATP structure. On average, this applies to 49.5 percent of firms. The highest shares of firms in this category is found in Romania (73.8%), Estonia (72.0%), Cyprus (68.7%) and Lithuania (67.2%). The lowest shares in this category are found in Hungary (40.1%), Slovenia (44.8%), Ireland (47.1%), Austria (47.1%) and France (48.0%).
Figure 9 visualises the findings by presenting the share of target entities as dark grey bars, the share of lower tax entities as light grey bars and the share of conduit entities as black squares.
Figure 9: Roles by Member States within ATP channel via interest payments
Source: Own calculations as described in the study
A variant of the ATP structure using financial transactions is the use of a hybrid loan. The key difference is that there is no lower tax country involved, where the interest receipts are facing a lower tax burden. In contrast, the interest income is not included in the tax base in the receiving country. However, since the analysis is based only on economic data, it struggles to adequately take into account the legal details involved in any ATP structure using mismatches. Therefore, the analysis of the ATP structure

European Commission
Aggressive tax planning indicators
114
using a hybrid loan is essentially a one-sided analysis of the ATP structure using financial assets. For the interested reader, we include the description and the results in the Appendix.84
Key findings
The analysis of roles within the ATP channel using interest payments finds that MNE entities in France and Belgium are most often found to be target entities. The countries with the largest share of lower tax entities are Bulgaria, Slovenia, and Poland. Additionally, we find a large share of entities in Hungary, the Netherlands, Ireland, the United Kingdom and Austria that belong to MNE groups that engage in ATP. One needs to be relatively cautious in the interpretation of these results given the data limitations. Especially, for the latter group of Member States, this may partly reflect incomplete information about these entities or lower tax entities outside the EU. Further the statutory tax rates play an important role in classifying the entities in the various Member States as either lower tax or target entities.
4.2.2 Roles within ATP via royalty payments
Table 29 summarises the results for the roles within ATP channels using royalty payments. The description again concentrates on the standard classifications and combines the results for subsidiaries and headquarter entities. A broad comparison to the results for the ATP via interest payments show that we are able to classify more firms into roles in ATP via royalty payments. This partly reflects that we have more information about intangible assets – compared to interest payments - and partly shows that the distribution of intangibles assets is also more in line with the predictions derived from the ATP structures.
Overall, we are able to classify 6.7 percent of the firms into the role of a target entity. This reflects that these entities have a lower pre-tax profitability, a lower operating profitability and less intangible assets while being a in a country with a relatively high statutory tax rate. The highest share of target companies is found in France (27.1%), Belgium (15.7%) and Malta (12.6%). In Bulgaria, Cyprus and Ireland no firms are classified as target entities.
The overall share of lower tax entities is 7.7 percent on average, with the highest share found in Slovenia (22.5%), Hungary (20.6%), Lithuania (20.2%), Bulgaria (20.2%) and Poland (19.6%). In comparison, in Malta (0%), France (0.4%), the Netherlands (2.6%), and Luxembourg (3.4%) only a small share of the firms are identified to be a low tax entity.
The share of firms classified as conduit entities amounts to 46.1 percent for the EU overall. In Hungary (61.2%), Ireland (60.6%), the United Kingdom (58.6%), the Netherlands (56.8%) and Austria (54.2%) more than half of the companies are classified to be in a group where some ATP takes place. In contrast in Romania (19.8%), Latvia (27.8%) and Estonia (29.6%) less than 30 percent of the firms are attributed the role of a conduit entity.
84 See Table 41 for a description of the strict use of the indicators, Table 42 for a description of the standard use and Table 47 for the results.
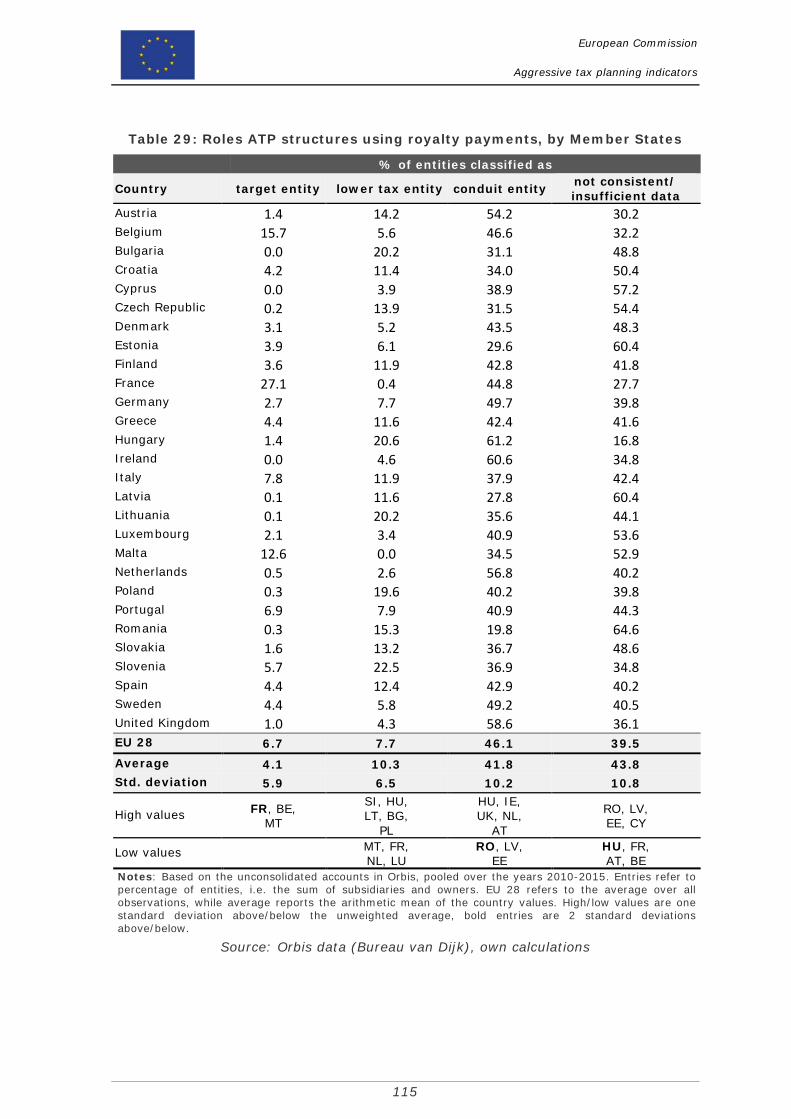
European Commission
Aggressive tax planning indicators
115
Table 29: Roles ATP structures using royalty payments, by Member States
% of entities classified as
Country target entity lower tax entity conduit entity not consistent/ insufficient data
Austria 1.4 14.2 54.2 30.2 Belgium 15.7 5.6 46.6 32.2 Bulgaria 0.0 20.2 31.1 48.8 Croatia 4.2 11.4 34.0 50.4 Cyprus 0.0 3.9 38.9 57.2 Czech Republic 0.2 13.9 31.5 54.4 Denmark 3.1 5.2 43.5 48.3 Estonia 3.9 6.1 29.6 60.4 Finland 3.6 11.9 42.8 41.8 France 27.1 0.4 44.8 27.7 Germany 2.7 7.7 49.7 39.8 Greece 4.4 11.6 42.4 41.6 Hungary 1.4 20.6 61.2 16.8 Ireland 0.0 4.6 60.6 34.8 Italy 7.8 11.9 37.9 42.4 Latvia 0.1 11.6 27.8 60.4 Lithuania 0.1 20.2 35.6 44.1 Luxembourg 2.1 3.4 40.9 53.6 Malta 12.6 0.0 34.5 52.9 Netherlands 0.5 2.6 56.8 40.2 Poland 0.3 19.6 40.2 39.8 Portugal 6.9 7.9 40.9 44.3 Romania 0.3 15.3 19.8 64.6 Slovakia 1.6 13.2 36.7 48.6 Slovenia 5.7 22.5 36.9 34.8 Spain 4.4 12.4 42.9 40.2 Sweden 4.4 5.8 49.2 40.5 United Kingdom 1.0 4.3 58.6 36.1 EU 28 6.7 7.7 46.1 39.5 Average 4.1 10.3 41.8 43.8 Std. deviation 5.9 6.5 10.2 10.8
High values FR, BE, MT
SI, HU, LT, BG,
PL
HU, IE, UK, NL,
AT
RO, LV, EE, CY
Low values MT, FR, NL, LU
RO, LV, EE
HU, FR, AT, BE
Notes: Based on the unconsolidated accounts in Orbis, pooled over the years 2010-2015. Entries refer to percentage of entities, i.e. the sum of subsidiaries and owners. EU 28 refers to the average over all observations, while average reports the arithmetic mean of the country values. High/low values are one standard deviation above/below the unweighted average, bold entries are 2 standard deviations above/below.
Source: Orbis data (Bureau van Dijk), own calculations

European Commission
Aggressive tax planning indicators
116
For 39.5 percent of the firms we have either insufficient data to classify them into a role within ATP using royalty payments, or the data is inconsistent with this ATP channel. The shares by Member States vary from 64.6 percent in Romania, 60.4 percent in Latvia, 60.4 percent in Estonia, 57.2 percent in Cyprus to 16.8 percent in Hungary, 27.7 percent in France, 30.2 percent in Austria and 32.2 percent in Belgium. Figure 10 once more illustrates the main results.
Figure 10: Roles by Member States within ATP channel via royalty payments
Source: Own calculations as described in the study
The variant of the intellectual property ATP structure which uses patent box rather than a lower tax country leads in our case to hardly any firms being classified into roles in this ATP structure. This is due to the fact that we are only able to match a small number of firms with patent data. Therefore, we only present the results in the Appendix in Table 66. The standard classification allows attributing some observations in almost all countries with patent boxes (Belgium, Spain, France, the United Kingdom, Hungary, Luxembourg, Malta, the Netherlands and Portugal) to the role of lower tax entities. The counterpart is the allocation of some entities in Germany, Austria, Finland, Sweden and the United Kingdom (prior to the introduction of the patent box) to the role of a target entity. Additionally, there are is a moderate share of the firms which are classified into the role of a conduit entity. This reflects that the few firms for which we have patent information tend to be larger MNE groups.
Key findings
For the ATP channel through royalty payments, we find that MNE entities in France, Belgium and Malta are most often classified as target entities. The countries with the largest share of lower tax entities are Slovenia, Hungary, Lithuania, Bulgaria and Poland. The countries with a large share of conduit entities are again Hungary, the Netherlands, Ireland, the United Kingdom and Austria. Overall, for around 60% of the MNE entities, we are able to classify them as target, lower tax or conduits entities, which is much higher than was possible for the ATP channel using interest payments (around 50% of MNE entities were not allocated). It reflects that the distribution of intangible assets at the firm level is broadly consistent with the ATP structure using royalty payments. One still needs to be relatively cautious in the interpretation of these results given the data limitations. Further the statutory tax rate plays an important role in classifying the entities in the various Member States.
0
10
20
30
40
50
60
70
AT BE BG CY CZ DE DK EE EL ES FI FR HR HU IE IT LT LU LV MT NL PL PT RO SE SI SK UKtarget lower tax conduit

European Commission
Aggressive tax planning indicators
117
4.2.3 Roles within ATP via strategic transfer pricing
The third ATP structure we look at is the use of strategic transfer pricing. In the scenario with the standard assumption this is primarily looking at differences in pre-tax and operating profitability coinciding with the relative tax situation in the respective part of the MNE. Table 30 summarises the results and Figure 11 graphically presents the key findings for this ATP channel.
Figure 11: Roles by Member States within ATP channel via transfer pricing
Source: Own calculations as described in the study
Overall, we are now able to classify three quarters of the firms into roles within ATP using strategic transfer pricing. For the remaining 25.0 percent of the observations, there is either insufficient information about the relative profitability or the geographical distribution of the entities does not result in a tax rates differences within the MNE groups.
The share of firms which are classified as target entities amounts to 12.0 percent overall. France (42.1%), Belgium (27.9%) and Malta (24.4%) have the largest share of firms classified as target entities. In contrast Cyprus, Ireland, and Bulgaria have no entities falling into this category.
Overall, we classify 21.3 percent of the firms as lower tax entities. The Member States with the highest share of lower tax entities are Bulgaria (45.7%), Poland (44.9%), Romania (42.5%), the Czech Republic (40.5%), and Lithuania (40.0%). In comparison, in France and Malta (1.1% each), Cyprus (11.7%) and Germany (12.2%) only few companies are classified as lower tax entities. This is not surprising for countries with higher statutory tax rates like France or Malta, but needs some explanation for Cyprus. The relatively low tax rate itself is not sufficient for the classification as a lower tax entity. The relatively low share of lower tax entities for Cyprus implies that either the relative profitability measures speak against a classification as a lower tax entity or data is insufficient for such a classification. Since our data requirements are less strong for the ATP via strategic transfer pricing, we would therefore expect some of the potential target or lower tax entities showing up as conduit entities.
0
10
20
30
40
50
60
70
AT BE BG CY CZ DE DK EE EL ES FI FR HR HU IE IT LT LU LV MT NL PL PT RO SE SI SK UK
target lower tax conduit

European Commission
Aggressive tax planning indicators
118
Table 30: Roles ATP structures using strategic transfer pricing, by Member States
% of entities classified as
Country target entity lower tax entity conduit entity not consistent/ insufficient data
Austria 3.3 24.0 55.9 16.8 Belgium 27.9 16.2 35.1 20.8 Bulgaria 0.0 45.7 29.5 24.8 Croatia 10.0 27.8 30.2 32.0 Cyprus 0.0 11.7 52.4 35.9 Czech Republic 0.5 40.5 28.1 30.8 Denmark 7.4 27.0 34.7 30.9 Estonia 10.3 25.0 23.3 41.4 Finland 9.4 25.3 32.9 32.4 France 42.1 1.1 36.3 20.5 Germany 6.6 12.2 55.0 26.2 Greece 6.7 25.5 35.3 32.5 Hungary 3.1 39.3 48.6 9.0 Ireland 0.0 34.6 54.6 10.8 Italy 17.1 18.9 30.7 33.4 Latvia 0.1 39.1 26.1 34.7 Lithuania 0.2 40.0 32.9 26.9 Luxembourg 4.3 15.0 43.3 37.4 Malta 24.4 1.1 43.9 30.6 Netherlands 1.5 14.8 60.4 23.4 Poland 0.5 44.9 35.3 19.3 Portugal 10.5 24.4 28.4 36.7 Romania 0.6 42.5 19.9 37.0 Slovakia 2.7 34.3 28.3 34.7 Slovenia 11.6 35.0 34.5 18.9 Spain 8.9 25.4 35.6 30.1 Sweden 8.1 21.3 39.9 30.7 United Kingdom 2.9 25.5 55.1 16.5 EU 28 12.0 21.3 41.8 25.0 Average 7.9 26.4 38.1 27.7 Std. deviation 9.8 12.3 11.1 8.4
High values FR, BE, MT
BG, PL, RO, CZ,
LT, HU, LV
NL, AT, UK, DE, IE, CY
EE, LU, RO, PT
Low values MT, FR CY, DE
RO, EE, LV
HU, IE, UK, AT,
SI Notes: Based on the unconsolidated accounts in Orbis, pooled over the years 2010-2015. Entries refer to percentage of entities, i.e. the sum of subsidiaries and owners. EU 28 refers to the average over all observations, while average reports the arithmetic mean of the country values. High/low values are one standard deviation above/below the unweighted average, bold entries are 2 standard deviations above/below.
Source: Orbis data (Bureau van Dijk), own calculations

European Commission
Aggressive tax planning indicators
119
The conduit entities are the largest group of companies in the ATP channel of strategic transfer pricing, with an overall average of 41.8 percent. Looking at the share of conduit entities by Member States, we see the Netherlands (60.4%), Austria (55.9%), the United Kingdom (55.1%), Germany (55.0%), Ireland (54.6%) and Cyprus (52.4%) with the largest shares. At the other end of the spectrum we find 19.9 percent of conduit entities in Romania, 23.3 percent in Estonia and 26.1 percent in Latvia. With our definition of conduit entities, a large share of companies classified as conduit entities can be due to a misclassification, because the data is not clear enough to classify them also as a target or lower tax country. Alternatively, it could truly reflect that the ATP structure shifts the profits between other entities and that these entities are only helpful for enabling tax free repatriation. Irrespective of the potential misclassification, the substantial share of conduit entities confirms that in a large proportion of the MNE groups at least some ATP takes place.
Looking at the share of companies, for which we have inconsistent or insufficient data to allocate them to a role in the transfer pricing ATP structure we find the highest shares in Estonia (41.4%), Luxembourg (37.4%), Romania (37.0%) and Portugal (36.7%). At the other end, we only have insufficient or inconsistent information for 9.0 percent of the firms in Hungary, 10.8 percent in Ireland and 16.5 percent in the United Kingdom, 16.8 percent in Austria and 18.9 percent in Slovenia.
Key findings
In line with the previous results we also find for the ATP channel using strategic transfer pricing that MNE entities in France, Belgium and Malta are most often classified as target entities. Some of the Eastern European Member States have the largest share of lower tax entities, namely Bulgaria, Poland, Romania, the Czech Republic Latvia, Lithuania and Hungary. The countries with a large share of conduit entities are again the Netherlands, Austria, Ireland and the United Kingdom but also Germany and Cyprus. Reflecting the lower data requirements, we are now able to classify a three quarter of the MNE entities to roles within the ATP structure using strategic transfer pricing. This confirms the finding of Section 4.1.5. where the operating profitability is lower in relatively higher tax MNE entities. One needs to be relatively cautious in the interpretation of these results given the data limitations. In particular, the statutory tax rate plays an important role in classifying the entities in the various Member States.
4.3 Overall assessment of exposure and tax base impact of ATP on Member States
This section combines the findings from the previous two subsections with the aim to draw a broad picture, which Member States are exposed, benefitting or losing from ATP structures. An overview of availability, clarity of the message and limitations of the various indicators concludes the section.
The country-level distribution of the indicators and the classification of entities into roles within ATP structures provide partial insights of the impact of ATP on the Member States. In this subsection, we collect these elements in order to see whether a broader picture emerges. Specifically, Table 31 summarises the results of the country-level indicators, Table 32 the results for the consolidated MNE group indicators, Table 33

European Commission
Aggressive tax planning indicators
120
the results for the ATP specific indicator by firm type, Table 34 the results for bilateral indicator and Table 35 the results from the combination of the indicators and the classification of entities into roles within ATP structures.
Table 31: Summary of results: Country-level indicators
Member States with
Indicator high values low values
[1a] Statutory tax rate FR, MT, BE, IT, DE BG, CY, IE, LV, LT
[1c] Effective average tax rate FR, ES, MT, DE BG, LT, IE
[2a] Corporate tax revenues (% of GDP) MT, CY, LU LT, SI, LV* [2b] Corporate tax revenues
(% of Corporate gross operating surplus) CY, LU, MT, EL LT, LV, IE
[2b] Corporate gross operating surplus (% of Corporate value added)
IE, RO, EL FR, HR, SI, UK
[2b] Corporate value added (% of GDP) IE, LT, NL, LU EL, IT, SK
[3a] inward FDI stock (% of GDP) LU, MT, CY* EL*, IT*, DE* [3a] outward FDI stock (% of GDP) LU, CY*, MT* RO*, SK*, BG* [3b] unexplained FDI stock (% observed FDI) EL, SI, SK, LT, PL LU, MT, CY, IE, NL, HU
[3c] Share of foreign-controlled firms LU, EE, PL* EL*, BE*, IT* [3c] Turnover by foreign-controlled firms
(% of total) IE, HU, LU, RO, SK, CZ EL, CY, IT, FI, FR
[3c] Value added by foreign-controlled firms (% of total)
IE, HU, RO, LU, CZ CY, EL, IT, FR
[3c] Surplus by foreign-controlled firms (% of total)
IE, HU, LU, RO EL, FR, IT, CY
[3d] Market concentration UK, DE, FI* MT, CY, EE, LV
[4a] No. bilateral tax treaties FR, NL, DE, ES, BE CY, EE, MT, EL, SK
[4b] Outward repatriation taxes: direct flows CY, BG, MT, IE, LT LU, FR, SK, UK, BE
[4b] Inward repatriation taxes: direct flows SK, HR, EL, PT NL, FI, UK, SE, LU [4c] Outward repatriation taxes: treaty
shopping UK*, PL*, NL* FR, BE, PT, IT,
[4c] Inward repatriation taxes: treaty shopping DE, UK, FR, IT MT*, CY*, EE* [4d] Attractiveness for treaty shopping UK, LU, EE, NL HR, PT, IT*
[5b] Share of firms are lower tax entities IE, UK, BG, PL, CY FR, MT, BE
[5b] Share of MNE groups are lower tax entities IE, BG, CY, PL, UK FR, MT, LU
[5b] Share of firms are the lowest tax entities CY, BG, IE, LT, LV BE, DE, HU, IT, LU, MT, FR [5b] Share of MNE groups are the lowest tax
entities CY, BG, IE, LT, LV BE, DE, HU, IT, LU, MT, FR
[5c] Share of firms have a zero/no tax entity in group
IE, UK, NL, FR, BG SI, SE, CY, FI
[5c] Share of MNE groups have a zero/no tax entity in group
UK, NL, IE, BG, LV CY, AT*, SI*
Notes: High/low values are one standard deviation above the unweighted average, bold entries are 2 standard deviations above/below. In cases where less than three countries are identified with high or low values, we have reported three countries with the highest/lowest values. These Member States are in italics and marked with an asterisk. Based on the results in Table 10, Table 11, Table 12, Table 27 and Table 13.
Source: Own calculations
All the results contain those Member States with particularly high or low values for the indicators. The identification of high or low values follows the same logic as the

European Commission
Aggressive tax planning indicators
121
previous section, namely the Member States which lie more than one standard deviation above or below the unweighted average of the country values. In this way, we are able identify those Member States, which appear to be exposed to ATP and benefit or lose tax base because of ATP. It is worth noting that each of the indicators may be driven by non-tax factors and therefore is not strictly measuring ATP. But if several indicators point into the same direction, one can arguably treat the sum of them as indications of ATP.
We start with the statutory corporate tax burden and treat those Member States with higher statutory corporate tax rates as most exposed to ATP.85 France, Malta and Germany are the Member States with highest values both for statutory and effective average tax rates, while Bulgaria, Lithuania and Ireland have low values for both statutory tax measures. The overall situation of corporate tax revenues shows high values for Malta, Cyprus and Luxembourg and very low values for Lithuania and Slovenia. The decomposition of the corporate tax revenues into main macroeconomic aggregates, provides us with the share of corporate tax revenues in the gross operating surplus, which can be seen as an implicit tax rate. Cyprus stands out here with a very high value while in Lithuania, Latvia and Ireland the implicit tax rate is low in line with the low statutory tax rates. We interpret the share of the corporate value added in GDP as a measure of the size of the corporate sector. We treat a larger corporate sector as more exposure to ATP. Alternatively, it can be seen as an indication of the size of the corporate sector as the result of tax planning activities. In this case a larger value for this indicator, as observed in Ireland, would signal that a Member State is gaining from ATP.
The third group of indicators are based on the aggregate FDI statistics. The high value for Luxembourg dominates these indicators, but also for other Member States both inward and outward FDI stocks are inexplicably high. The indicator unexplained FDI stock shows that the values for Luxembourg, Malta, Cyprus, Ireland, the Netherlands and Hungary are much higher than what we would expect from economic and geographical determinants. The activities in foreign-controlled firms, which can be used as a measure of the exposure to ATP, show high values amongst others for Luxembourg, Romania, Hungary, and Ireland. In particular, the high profitability in foreign controlled firms in Ireland is in line with the predictions of the ATP. Again, a higher value implies a larger exposure to ATP. The same interpretation applies for the concentration measure, where higher concentration also indicates more vulnerability to ATP strategies. The United Kingdom appears to be the country which is most likely to be used in a treaty shopping strategy, which is reflected in its attractiveness for treaty shopping. Finally, we also interpret a higher share of MNE groups with an affiliate in a zero/no corporate income tax country as more exposure to ATP. Member States which seems to be most exposed according to this indicator are the United Kingdom, the Netherlands, Ireland, Bulgaria and Latvia.
85 The Member States with the lowest statutory tax rates are also likely to be exposed to ATP, albeit for different reasons. However, since there are zero/no corporate income tax countries outside the EU which can serve as lower tax countries, we still attribute a “least exposed” to them.
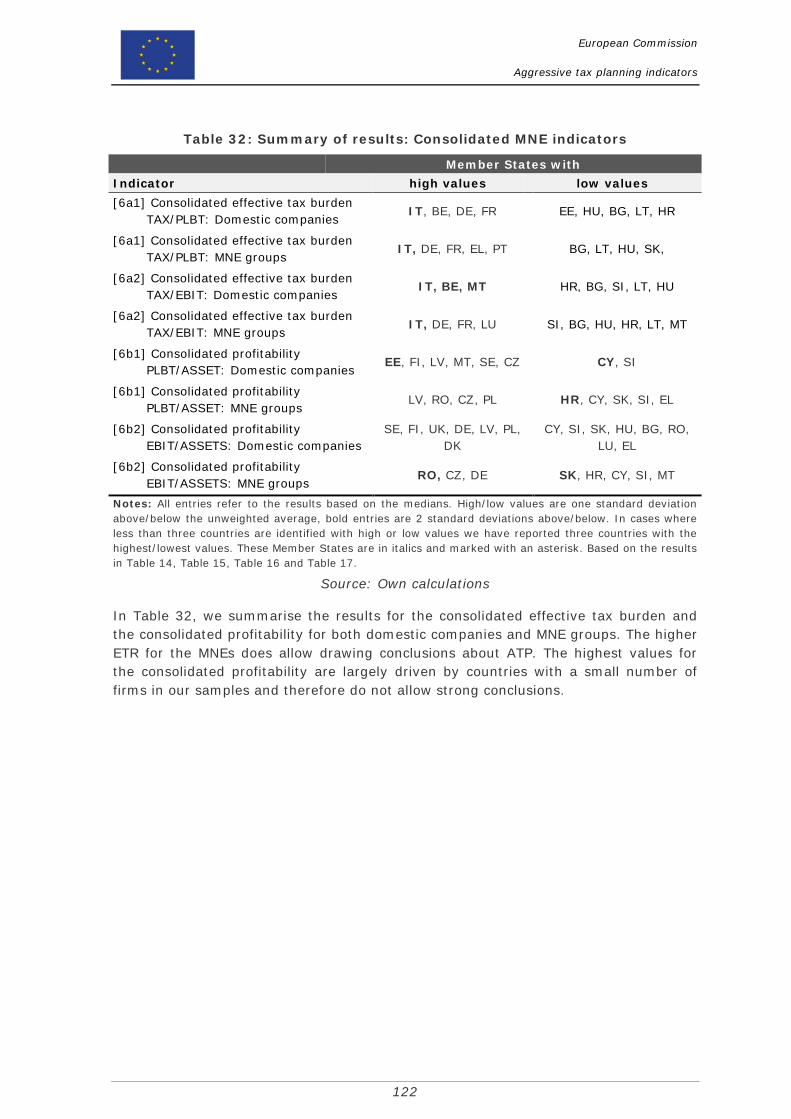
European Commission
Aggressive tax planning indicators
122
Table 32: Summary of results: Consolidated MNE indicators
Member States with Indicator high values low values [6a1] Consolidated effective tax burden
TAX/PLBT: Domestic companies IT, BE, DE, FR EE, HU, BG, LT, HR
[6a1] Consolidated effective tax burden TAX/PLBT: MNE groups
IT, DE, FR, EL, PT BG, LT, HU, SK,
[6a2] Consolidated effective tax burden TAX/EBIT: Domestic companies
IT, BE, MT HR, BG, SI, LT, HU
[6a2] Consolidated effective tax burden TAX/EBIT: MNE groups
IT, DE, FR, LU SI, BG, HU, HR, LT, MT
[6b1] Consolidated profitability PLBT/ASSET: Domestic companies
EE, FI, LV, MT, SE, CZ CY, SI
[6b1] Consolidated profitability PLBT/ASSET: MNE groups
LV, RO, CZ, PL HR, CY, SK, SI, EL
[6b2] Consolidated profitability EBIT/ASSETS: Domestic companies
SE, FI, UK, DE, LV, PL, DK
CY, SI, SK, HU, BG, RO, LU, EL
[6b2] Consolidated profitability EBIT/ASSETS: MNE groups
RO, CZ, DE SK, HR, CY, SI, MT
Notes: All entries refer to the results based on the medians. High/low values are one standard deviation above/below the unweighted average, bold entries are 2 standard deviations above/below. In cases where less than three countries are identified with high or low values we have reported three countries with the highest/lowest values. These Member States are in italics and marked with an asterisk. Based on the results in Table 14, Table 15, Table 16 and Table 17.
Source: Own calculations
In Table 32, we summarise the results for the consolidated effective tax burden and the consolidated profitability for both domestic companies and MNE groups. The higher ETR for the MNEs does allow drawing conclusions about ATP. The highest values for the consolidated profitability are largely driven by countries with a small number of firms in our samples and therefore do not allow strong conclusions.

European Commission
Aggressive tax planning indicators
123
Table 33: Summary of results: Specific indicators by firm types
Domestic companies MNE higher tax MNE lower tax
Indicator high values low values high
values low values high values low values
[7] Pre-tax profitability
SE, FR, DK, UK, FI, DE
EL, MT, LV, RO
LT, CY, DE, SE
RO, LU, LV, EL, BG, HR,
IE
LT, DE, PL, FI, EE
RO, LU, IE, EL, CY, HR
[8] Operating profitability
CY, SE, DE, UK, DK
MT, LV, RO, EL CY, DE, LT RO, LU, NL,
BG, LV LT, PL, SK, DE, CZ, EE
LU, MT, NL, RO
[9] Financial profitability
LV*, MT*, RO*, UK* CY, EL, DK* IE, UK, MT,
AT, NL, EE CY, BG, HR,
CZ, EL
AT*, EE*, LU*, NL*, IE*, UK*
RO, CZ, BG, HR
[10] Interest payments LU, EL, CY SI, LT, AT,
HR IE, LU*, BG* SI, FR*, BE* HR, IE, BG* CY, SI, BE
[11] Debt share IT, MT, SE* EE, BG, RO,
CZ, PL IE, IT, DE NL, EE, MT IT, DE, EL* NL, EE, CY, UK
[12] Intangible assets FR, IT, SI SI, IT, FI IT, SI, FI,
FR
[13] Patent applications
FR, LT, EL, HU FR, DE, MT,
NL, SK CZ, LT, PT, SK, ES
Notes: All entries refer to the results based on the medians. High/low values are one standard deviation above/below the unweighted average, bold entries are 2 standard deviations above/below. In cases where less than three countries are identified with high or low values we have reported three countries with the highest/lowest values. These Member States are in italics and marked with an asterisk. For the indicators, intangible assets and patent applications large number of zeros/missings result in many countries having the same median value, (i.e. zeros), these countries are not reported here. Based on the results in Table 18, Table 19, Table 20, Table 21, Table 22, Table 23, and Table 24.
Source: Own calculations
Table 34: Summary of results: Bilateral indicators
Member States with Indicator high values low values 14a. Bilateral import prices are too high: exporting country UK, FR, DE, NL, BE MT*, CY*, EE*
14b. Bilateral import prices are too low: exporting country DE, PL, FR, BE, IT, NL MT, CY, EE, HR
14c. Bilateral import price are too high: importing country FR, ES, IT, UK, NL, DE CY, EE*, MT*
14d. Bilateral import price are too low: importing country ES, NL, UK, IT, CZ, SK CY*, MT*, LU*
15a Royalty payments IE, MT*, NL* LV*, EL*, EE*
15b Royalty receipts MT, NL, IE, LU CY*, EL*, PT*
15c Net royalty payments IE, LU*, MT* SE*, FI*, UK* Notes: High/low values are one standard deviation above/below the unweighted average, bold entries are 2 standard deviations above/below. In cases where less than three countries are identified with high or low values we have reported three countries with the highest/lowest values. These Member States are in italics and marked with an asterisk. Based on the results in Table 26 and Table 25.
Source: Own calculations

European Commission
Aggressive tax planning indicators
124
Table 33 summarises the results for the analysis of the specific indicators by firm type. The key result here lies in the differences between the different types of firms. Not directly visible in Table 33 but a clear indication for the importance of ATP is the fact that for almost all Member States the profitability is highest in those MNE entities which are identified as facing a relatively lower tax rate. The mirror image of this is the lower profitability – even in comparison to the domestic companies - in those parts of the MNE groups which are facing a relatively higher tax rate. Regarding the Member States with higher values this is partly visible in Table 33. For example, Denmark is only showing a high pre-tax profitability for its domestic companies, but not for MNE groups. In contrast, in Lithuania only the MNE entities but not the domestic companies are exhibiting very high pre-tax profitability. Financial profits appear to be very unevenly distributed between Member States with only a few Member States having MNE entities with positive financial profits in the majority of firms and on average. Among those are Austria, the Netherlands, Denmark and Sweden. Similarly, the intangible assets and patent holdings are concentrated in few firms. Additionally, the data quality rules out strong conclusions based on the distribution across Member States.
Table 34 summarises the results for the bilateral indicators on import price anomalies and royalty payments. The country-level analysis of bilateral import price anomalies primarily reveals that larger and relatively higher tax Member States tend to have more anomalies in the import prices. Without the context of the firm structure this only confirms the potential importance of strategic transfer pricing. The bilateral royalty flows, in contrast, paint a stark picture. Ireland stands out as the Member States with by far the largest net royalty payments. Malta, the Netherlands and Luxembourg show some relevant royalty payments and receipts. Overall, Sweden, Finland and the United Kingdom have the highest net royalty receipts. These indicators highlight the importance of the royalty payments ATP channel.
Table 35 looks at the classification into roles for the three main ATP structures. Here, we treat those countries as gaining from an ATP structure, if the number of lower tax entities is higher than the number of target entities. Correspondingly we treat those countries are losing from an ATP structure if the number of target entities surpasses the number of lower tax entities. The share of entities that are classified as conduit entities gives further indication of the exposure to ATP.86
France, Malta and Belgium show up as the Member States with the highest share of target entities, while Cyprus, Bulgaria and Ireland are consistently the Member States with the smallest share of target companies. This reflects that the statutory tax rate plays an important role in our classification. Among the Member States with the highest share of firms classified as lower tax entities Bulgaria, Slovenia and Poland play a major role. The lowest shares are found for France, Malta and to a lesser extent also for Cyprus, Germany and the Netherlands. The connection to the tax rate is therefore much weaker in the classification into lower tax entity. The share of conduit entities is typically highest in Hungary, Austria, the Netherlands, Ireland and the United Kingdom. The lowest shares of conduit entities are found in Romania, Estonia and Latvia.
86 Note that we classify entities as conduit entities if they are in a MNE group with at least on target entity and are not allocated to another role themselves.

European Commission
Aggressive tax planning indicators
125
Table 35: Summary of results: Combination of indicators – roles within ATP channels
ATP via interest payments: Share of firms classified as
target entity lower tax entity conduit entity inconsistent/no data
High values FR, BE, MT* BG, SI, PL HU, NL, IE, AT, UK RO, EE, CY, LT
Low values BG*, CY*, LV*, IE*, LT* FR, MT, CY, EE RO, LV, EE HU, SI, AT, IE, FR
ATP via royalty payments: Share of firms classified as
target entity lower tax entity conduit entity inconsistent/no data
High values FR, BE, MT SI, HU, LT, BG, PL
HU, IE, UK, NL, AT RO, LV, EE, CY
Low values BG*, CY*, IE* MT, FR, NL, LU RO, LV, EE HU, FR, AT, BE
ATP via strategic transfer pricing: Share of firms classified as
target entity lower tax entity conduit entity inconsistent/no data
High values FR, BE, MT BG, PL, RO, CZ, LT, LV, HU
NL, AT, UK, DE, IE, CY EE, LU, RO, PT
Low values BG*, CY*, IE* MT, FR, CY, DE RO, EE, LV HU, IE, UK, AT, SI
Notes: High/low values are one standard deviation above/below the unweighted average, bold entries are 2 standard deviations above/below. In cases where less than three countries are identified with high or low values we have reported three countries with the highest/lowest values. These Member States are in italics and marked with an asterisk. Based on the results in Table 28, Table 29 and Table 30
Source: Own calculations
The share of conduit entities is strongly negatively correlated with the share of firms for which we have either insufficient data or evidence which is inconsistent with the ATP structures. Romania, and the Baltic countries have the highest share of firms for which we have no information consistent with ATP structures while for Hungary we find the clearly lowest share.
The broad picture emerging from the summary of the indicators is that several Member States appear to be exposed to ATP structures. This includes smaller Member States such as Ireland, Luxembourg, Cyprus, Malta or the Netherlands where the country-level indicators as summarised in Table 31 strongly suggest that ATP plays an important role. The summary of the results based on firm-level data in Table 35 also points into the direction of other countries being exposed to ATP. France, Belgium and Malta show up as Member States which tend to be losing tax base. Bulgaria, Poland, Slovenia, Hungary and Latvia are often qualified as having high numbers of lower tax entities. This pattern is in line with these countries gaining tax base, but the classification may also be strongly driven by the level of the statutory tax rates. In several other Member States, we find traces of ATP, which is reflected in a sizeable share of the firms classified as conduit entities. This includes Austria, Hungary, the Netherlands, Ireland and the United Kingdom. In some of these cases this might reflect profit shifting to zero/no tax countries outside the EU, since several of these

European Commission
Aggressive tax planning indicators
126
countries are also characterised through a relatively large share of MNE groups with links to such countries.
More generally, for almost all Member States the profitability measures in the MNE entities indicate some patterns consistent with ATP. In this context, the relative approach in Table 33 underemphasises the overall impact.87 Overall, the qualitative nature of the overall assessment implies this allocation is based on subjective judgement. Additionally, this does not take into account the underlying data quality at Member States level. For example, the small countries Cyprus and Malta both fall into the category, where the indicators show some impact of ATP but are not painting a clear picture whether the Member States are primarily benefitting or losing. These ambiguous results may also be partly driven by incomplete data and a small sample of firms to base the analysis on.
Table 36 therefore concludes the overall assessment by collecting the indicators derived in this study and assesses them with regard to their availability, clarity of message and limitations.
The indicators range from readily available and easy-to-interpret information, like the corporate tax revenues, to complex combination of indicators for the identification of the roles in the ATP channels. Very often there is a trade-off between data availability and the limitations of the indicator. For example, reliable data about bilateral royalty flows to zero/no corporate income tax countries outside the EU would clearly help to identify ATP channels. The trade-off between data availability and limitations is most extreme in the identification of the roles. The results for the strict use of the indicators would in principle produce reliable evidence for ATP structures. However, until now incomplete and imprecise data rules out meaningful results under the strict use of the indicators. As such, the discussion of the limitations of the indicators in Table 36 should be see a roadmap for future research.
87 The approach simply ranks the Member States by strength of evidence. If 25 out 28 countries show evidence consistent with ATP this implies that the four Member States with the weakest evidence for ATP are classified as least affected.

European Commission
Aggressive tax planning indicators
127
Table 36: Overview of indicators and broad assessment
Indicator Availability Ease of interpretation Limitations
Corporate tax revenues in % of GDP Very good Very Easy
Not possible to separate ATP from other economic factors, no information about channel of ATP
Decomposition of corporate tax revenues Good Easy Not possible to separate ATP from other
economic factors
(unexplained) FDI stock Good Easy (Moderate)
Not possible to (cleanly) separate the effect of ATP from other factors
Market structure Good Difficult No clear message about ATP, only qualitative statements possible
Presence in zero/no tax haven countries Mixed Very Easy
Clear message about ATP, but difficult to quantify impact of ATP. Results partly driven by data availability
Consolidated effective tax burden Limited Very Easy
Often not available. Difficult to separate ATP from confounding factors. Based on financial account rather than tax accounts.
Consolidated profitability Limited Easy
Often not available. Difficult to separate ATP from confounding factors. Based on financial account rather than tax accounts.
Distribution of pre-tax profitability Mixed Easy Validity is limited if coverage is incomplete
Distribution of operating profitability Mixed Easy Validity is limited if coverage is incomplete
Distribution of financial profitability Mixed Easy Validity is limited if coverage is incomplete
Distribution of debt share Mixed Easy
Validity is limited if coverage is incomplete, imprecise measure because distinction between internal and external debt is not possible
Distribution of interest payments Limited Easy
Validity is limited if coverage is incomplete, imprecise measure because distinction between internal and external debt is not possible
Distribution of intangible assets Mixed Easy
Validity is limited if coverage is incomplete, imprecise measure because of lack of information about the nature of the intangibles
Distribution of patent holding Very limited Easy Validity is limited if coverage is incomplete,
difficulty to identify ownership rights correctly
Bilateral import price anomalies Good Moderate Not very precise measure because of lack of
intra-firm transactions
Bilateral royalty flows Mixed Easy Imprecise measure because of lack of firm-level information, bilateral information is also often missing
Treaty shopping indicators Good Difficult
Indirect measure which is difficult to interpret, limited information about impact on tax revenues
Roles in ATP via interest payments Very limited Moderate Trade-off between reducing the impact of
confounding factors and data requirements Roles in ATP via royalty payments Very limited Moderate Trade-off between reducing the impact of
confounding factors and data requirements
Roles in ATP via strategic transfer pricing Very limited Moderate
Trade-off between reducing the impact of confounding factors and data requirements, difficulty to separate from other tax planning behaviour
Source: Own considerations based on the results in the study

European Commission
Aggressive tax planning indicators
128
5 Conclusions
The aim of this study is to complement existing analysis of ATP by MNEs by providing country-level indicators. We build on the existing analysis of tax rules that facilitate ATP (ATP study), and the analysis of the effects of tax planning on forward looking effective tax burdens by the ZEW study. We group the discussed ATP structures into three main channels: i) ATP via interest payments, ii) ATP via royalty payments and iii) ATP via strategic transfer pricing. For each of these three main channels we extract the basic economic substance and match these characteristics to available data. General indicators are presented which give an overall impression about the extent and exposure to ATP. Further specific indicators provide some insight into certain aspects of the ATP structures. The use of the indicators in this study is twofold. First, we look at the country-level distribution of the indicators to identify the potential overall exposure to ATP of the Member States. Second, we combine the indicators to identify the three main "types" of entities within MNE groups, namely the
target entity where the tax base is reduced because of a deduction from the profits,
the lower tax entity where the tax base is increased but taxed at a lower rate, and
the conduit entities which are in a group with ATP activities but no clear effect on the tax base is observable. The label "conduit entity" may have a broader meaning than is generally understood in tax literature as it does not only encompass entities through which income flows transit.
Counting the relative occurrence of the three types of entities within the Member States sheds some light on the possible use of the legal systems in each of the three main ATP channels.
The derivation of economic indicators is partly driven by data constraints. The most important data shortcomings include: a general lack of firm-level information about the entities in non EU countries, especially zero/no tax countries, no possibility to distinguish between intra-firm and external financial flows, no information about hybrid instruments, no reliable information on permanent establishments, incomplete data about intellectual property and patent ownership, no detailed bilateral information about royalty flows and poor quality of bilateral foreign direct investment flows. The data quality also prevents us from drawing strong conclusions, but considered together, the indicators show a relatively consistent pattern. Some indicators are clearly influenced by other factors (e.g. general economic conditions) than ATP and none of the indicators provides therefore per se an irrefutable causality towards aggressive tax planning. Rather, considered together, the set of indicators shall be seen as a "body of evidence" that are consistent with the possible existence of an ATP structure. Being an outlier country for one (or several) indicators does therefore not suggest that the country is without any doubt used by MNEs in ATP structures. Instead, it indicates that such structure potentially exists.
Nevertheless, we are able to derive some indicators, which shed some light on ATP structures within the Member States. For several indicators, the observed outcome could be due to either ATP or other economic circumstances. To reduce the problem of falsely attributing observed anomalies to ATP, we combine the indicators and classify

European Commission
Aggressive tax planning indicators
129
each entity within an MNE to a role. The requirement for several indicators to be line with the predictions from the ATP structures reduces the likelihood of alternative explanations. However, the stricter we apply the criteria the more likely we exclude some firms engaging ATP behaviour and underestimate the overall extent.
From the overall situation of corporate tax revenues and their decomposition into main macroeconomic aggregates, we start with the first observations that some smaller Member States, like Cyprus, Malta and Luxembourg seem to be able to raise more corporate tax revenues in percent of GDP than others. Ireland in contrast seems able to attract a sizable amount of corporate tax base. For Cyprus, Ireland, Luxembourg, Malta, the Netherlands and Hungary we observe FDI stocks that are unexplained by economic fundamentals in a gravity model.
Equally based on aggregated data, we find a more concentrated market structure in Germany and the United Kingdom, which could translate into a larger tax revenue risk resulting from ATP because larger firms are major tax payers. The high share of foreign controlled firms in Luxembourg and Estonia could reflect some tax driven behaviour. The high share of surplus in foreign controlled firms in Ireland, Hungary, Luxembourg and Romania is also consistent with higher than average corporate tax bases, which in turn are possibly the result of ATP activities. These results shall of course be taken with caution given the level of aggregation of the indicators.
The analysis of the consolidated effective tax burdens for the MNE groups as a whole produces little insight into potential ATP activities, which is most likely due to the limited validity of this indicator if ATP activities also affect the tax base and therefore are not reflected in the ETR measure. The analysis of the consolidated profitability of MNE group suggests that this is the case. MNEs groups tend to have a higher operating profitability which vanishes when comparing the pre-tax profitability. This finding is consistent with ATP activities affecting the tax base, in which case the effective tax burden is not necessarily affected.
The comparison between the unconsolidated accounts of MNE entities to both domestic firms and other entities within MNE groups yields more interesting results. The latter comparison uses the incentives for ATP as the dividing line and compares MNE entities, which are facing a lower tax burden than the rest of the group to the other MNE entities that face a higher tax burden. We find a consistently higher profitability in MNE groups if they are located in a relative low tax country. This holds for the comparison to domestic firms and for the comparison to firms within MNE groups which are not facing a relative low tax burden. This is consistent with all ATP channels. The differences in operating profitability are consistent with ATP structures using royalty payments or strategic transfer pricing. At the same time differences between operating and pre-tax profitability are also suggesting the importance of the ATP channel via interest payments. Patterns in financial profitability measures further indicate that ATP structures using interest payments may be concentrated in a few Member States. Furthermore, the skewed distribution of the profitability measures suggests that ATP is likely to take place (and lucrative to do so) in only a concentrated number of companies.
Aggregate statistics of royalty flows are consistent with the hypothesis of substantial ATP practices using intellectual property. Ireland, Luxembourg, Malta and the Netherlands appear to be affected by ATP structures using royalty payments, which is

European Commission
Aggressive tax planning indicators
130
reflected in statistically large royalty inflows and outflows. Sweden, Finland, Denmark and the United Kingdom are in contrast those Member States which experience the largest net royalty receipts. We also find evidence of distorted bilateral import prices. The abnormally high import prices in high tax countries compared to transactions of the same good with other countries are consistent with the ATP structure using transfer pricing to shift profits out of these countries.
Regarding the importance of Member States on dividend repatriation routes in international treaty shopping practices, we find that treaty shopping is of importance for European firms enabling tax efficient repatriation of dividends to and from countries outside the EU. The United Kingdom, Luxembourg, Estonia and the Netherlands stand out here as being central to many tax optimal repatriation routes.

European Commission
Aggressive tax planning indicators
131
References
Alstadsæter, A., Barrios, S., Nicodeme, G., Skonieczna, A. M. and A. Vezzani (2015), “Patent Boxes Design, Patents Location and Local R&D”, European Commission Taxation paper No. 57.
Avi-Yonah, R. S. and C. H. Panayi (2010), “Rethinking Treaty Shopping: Lessons for the European Union.”, in Tax Treaties: Building Bridges between Law and Economics, pp. 21-50, International Bureau for Fiscal Documentation (IBFD) Amsterdam.
Bartelsman, E., J, and R. M.W.J. Beetsma (2003), “Why pay more? Corporate tax avoidance through transfer pricing in OECD countries”, Journal of Public Economics, Vol. 87, pp. 2225-2252.
Bénassy-Quéré, A., Fontagné, L. and A. Lahrèche-Révil (2005), “How Does FDI React to Corporate Taxation?”, International Tax and Public Finance, Vol. 12, pp. 583–603.
Bernard, A. B., Jensen, J. B. and P. K. Schott (2006), “Transfer Pricing by U.S.-Based Multinational Firms”, NBER Working Papers 12493, National Bureau of Economic Research, Inc.
Blouin, J., H. Huizinga, L. Laeven and G. Nicodeme (2014), “Thin Capitalization Rules and Multinational Firm Capital Structure”, IMF Working Paper No. 14/12
Böhm, T., Karkinsky, T. Knoll, B. and N. Riedel (2015), “Corporate Taxes and Strategic Patent Location within Multinational Firms”, mimeo.
Büttner, T. and G. Wamser (2013), “Internal Debt and Multinationals’ Profit Shifting – Empirical Evidence from Firm-Level Panel Data”, National Tax Journal, Vol. 66, pp. 63-95.
Büttner, T., Overesch, M., Schreiber, U. and G. Wamser (2012), “The impact of thin-capitalization rules on the capital structure of multinational firms”, Journal of Public Economics, Vol. 96, pp. 930-938.
Centre for European Economic Research (ZEW) GMBH (2015), “Effective tax levels using the Devereux/Griffith Methodology” Intermediate Report 2015.
Centre for European Economic Research (ZEW) GMBH (2016), “The Impact of Tax Planning on Forward-Looking Effective Tax Rates”, European Commission Taxation paper No. 64.
Clausing, K. A. (2003), “Tax-motivated transfer pricing and US intrafirm trade prices”, Journal of Public Economics, Vol. 87, pp. 2207–2223.
Clausing, K. A. (2007), “Corporate tax revenues in OECD countries”, International Tax and Public Finance, Vol. 14, pp. 115–133.
Davies, R. B., (2004), “Tax Treaties and Foreign Direct Investment: Potential versus Performance”, International tax and Public Finance, Vol. 11, pp. 775-802.
Davies, R. B., Martin, J., Parenti, M. and F. Toubal (forthcoming), “Knocking on Tax Haven's Door: Multinational Firms and Transfer Pricing” Review of Economics and Statistics.

European Commission
Aggressive tax planning indicators
132
Devereux, M.P. and R. Griffith (1998), “The Taxation of Discrete Investment Choices”, The Institute for Fiscal Studies Working Paper Series No. W98/16.
Devereux, M.P. and S. Loretz (2011), “Corporation Tax in the United Kingdom”, Oxford University Centre for Business Taxation Report.
Devereux, M.P. and S. Loretz (2012), “How would EU corporate tax reform affect US investment in Europe?”, Tax Policy and the Economy, Vol. 26, pp. 59-91.
Dharmapala, D. (2014), “What Do We Know About Base Erosion and Profit Shifting? A Review of the Empirical Literature", Fiscal Studies, Vol. 35, no. 4, pp. 421–448
Dharmapala, D. and N. Riedel (2013), “Earnings shocks and tax-motivated income-shifting: Evidence from European multinationals”, Journal of Public Economics, Vol. 97 (7-8), pp. 95-107.
Dischinger, M., Knoll, B. and N. Riedel (2014), “There's No Place Like Home: The Profitability Gap between Headquarters and their Foreign Subsidiaries”, Journal of Economics & Management Strategy, Vol. 23 (2), pp. 369-395.
Dischinger, M. and N. Riedel (2011), “Corporate Taxes and the Location of Intangible Assets within Multinational Firms”, Journal of Public Economics, Vol. 95 (7-8), pp. 691-707.
Dudar, O., C. Spengel, and J. Voget (2015), “The Impact of Taxes on Bilateral Royalty Flows”, Centre for European Economic Research, Discussion Paper No. 15-052.
Egger, P., W. Eggert and H. Winner (2010), “Saving taxes through foreign plant ownership”, Journal of International Economics, Vol. 81, pp. 99–108.
Ernst, C., Richter, K. und N. Riedel (2014), “Corporate taxation and the quality of research and development”, International Tax and Public Finance, Vol. 21 (4), pp. 694-719.
Ernst, C. and C. Spengel (2011), “Taxation, R&D Tax Incentives and Patent Application in Europe”, ZEW Discussion Paper No. 11-024.
Evers, L., Miller, H. and C. Spengel (2015), “Intellectual property box regimes: effective tax rates and tax policy considerations”, International Tax and Public Finance, Vol. 22, pp. 502-530.
European Commission (2012), Commission recommendation of 6 December 2012 on aggressive tax planning (2012/772/EU)
European Commission (2015a), Communication from the Commission to the European Parliament and to the Council: “A Fair and Efficient Corporate Tax System in the European Union: 5 Key Areas for Action”, COM(2015) 302 final
European Commission (2015b), “Corporate Income Taxation in the European Union”, Staff Working Document SWD (2015) 121 final.
European Commission (2016), “First step towards a new EU list of third country jurisdictions: Scoreboard” , online available at: https://ec.europa.eu/taxation_customs/sites/taxation/files/2016-09-15_scoreboard-indicators.pdf (accessed 7.10.2016)

European Commission
Aggressive tax planning indicators
133
European Commission (2017), “Taxation trends in the European Union: Data for the EU Member States, Iceland and Norway” 2017 edition, Luxembourg: Publications Office of the European Union.
Gravelle, J. (2015), “Tax Havens: International Tax Avoidance and Evasion”, Congressional Research Service 7-5700 R40623.
Griffth, R., Miller, H. and M. O'Connell (2014), “Ownership of intellectual property and corporate taxation”, Journal of Public Economics, Vol. 112, pp. 12-23.
Grubert, H. (2003), “Intangible Income, Intercompany Transactions, Income Shifting, and the Choice of Location”, National Tax Journal, Vol. 56 (1), pp. 221-242.
Grubert, H., and J. H., Mutti (2009), “The Effect of Taxes on Royalties and the Migration of Intangible Assets Abroad”, in International Trade in Services and Intangibles in the Era of Globalization, M. Reinsdorf and M. J. Slaughter, eds.
Grubert, H., and J. Slemrod (1998), “The effect of taxes on investment and income shifting to Puerto Rico”, The Review of Economics and Statistics, Vol. 80 (3), pp. 365-373.
Heckemeyer, J. and M. Overesch (2013), “Multinationals' Profit Response to Tax Differentials: Effect Size and Shifting Channels”, ZEW – Centre for European Economic Research Discussion Paper No. 13-045.
Heckemeyer, J. and M. Overesch (2017), “Multinationals' Profit Response to Tax Differentials: Effect Size and Shifting Channels”, Canadian Journal of Economics, in press.
Hines, J.R. (1997), “Tax policy and the activities of multinational corporations”. In: Auerbach, A.J. (Ed.), Fiscal Policy: Lessons from Economic Research. MIT Press, Cambridge, pp. 401–445.
Huizinga, H., L. Laeven and G. Nicodeme (2008), “Capital structure and international debt shifting”, Journal of Financial Economics, Vol. 88, pp. 80–118.
Jungmann, H. and S. Loretz (2016), “On the measurement of investment types: Heterogeneity in corporate tax elasticities”, University of Salzburg Working Papers in Economics No. 2016-01.
Karkinsky, T. and N. Riedel (2012), “Corporate Taxation and the Location of Patents within Multinational Firms”, Journal of International Economics, Vol. 88(1), pp. 176-185.
Kleinert, J. and F. Toubal (2010), “Gravity for FDI”, Review of International Economics, Vol. 18 (1), pp. 1–13.
Loretz, S. and S. Mokkas (2015), “Evidence for Profit Shifting with Tax-sensitive Capital Stocks”, FinanzArchiv: Public Finance Analysis, Vol. 71 (1), pp. 1-36.
Lipsey, R. E. (2010), “Measuring the Location of Production in a World of Intangible Productive Assets, FDI, and Intra firm Trade”, Review of Income and Wealth, Vol. 56, pp. 1475-4991.

European Commission
Aggressive tax planning indicators
134
Maffini, G. and S. Mokkas (2011), “Profit Shifting and Measured Productivity of Multinational Firms”, Oxford Bulletin of Economics and Statistics, Volume 73 (1), pp. 1–20.
Markusen, J. R. (2002), “Multinational Firms and the Theory of International Trade”, MIT Press, Boston, Massachusetts.
Mayer, T. and S. Zignago (2011), “Notes on CEPII’s distances measures: the GeoDist Database”, CEPII Working Paper 2011-25.
Mintz, J. M. and A. J. Weichenrieder, (2010), “The Indirect Side of Direct Investment - Multinational Company Finance and Taxation”, CESifo Book Series.
OECD (2013), “Addressing BEPS”, OECD/G20 Base Erosion and Profit Shifting Project, OECD Publishing, Paris.
OECD (2015), “Measuring and Monitoring BEPS, Action 11 - 2015 Final Report”, OECD/G20 Base Erosion and Profit Shifting Project, OECD Publishing, Paris.
Overesch, M. (2016), “Steuervermeidung multinationaler Unternehmen: Die Befunde der empirischen Forschung”, Perspektiven der Wirtschaftspolitik. Vol. 17, No. 2, pp. 129–143.
Pak, S. J. and J. S. Zdanowicz (2002), “U.S. Trade With the World, An Estimate of 2001 Lost U.S. Federal Income Tax Revenues Due to Over-Invoiced Imports and Under-Invoiced Exports”, Mimeo.
Piotrowska, J. and W. Vanborren (2008), “The corporate income tax rate-revenue paradox: Evidence in the EU” European Commission Taxation paper No. 14.
Ramboll Management Consulting and Corit Advisory (2015), “Study on Structures of Aggressive Tax Planning and Indicators”, European Commission Taxation paper No. 61.
Reinert, K.A. (2009), “Gravity Models”, in K.A. Reinert, R.S. Rajan, A.J. Glass and L.S. Davis (eds.), Princeton Encyclopedia of the World Economy, Princeton University Press, pp. 567-570.
Santos Silva, J.M.C. and Tenreyro, S. (2006), “The Log of Gravity”, The Review of Economics and Statistics, Vol. 88(4), pp. 641-658.
Sørensen, P.B. (2006), “Can capital income taxes survive? And should they?”, CESifo Economic Studies, Vol. 53 (2), pp. 172-228.
Tinbergen, J. (1962), Shaping the World Economy: Suggestions for an International Economic Policy. New York: Twentieth Century Fund.
van ’t Riet, M. and A. Lejour, (2014), “Ranking the Stars: Network Analysis of Bilateral Tax Treaties”, CPB Discussion Paper 290.
van ’t Riet, M. and A. Lejour, (2017), “Optimal Tax Routing: Network Analysis of FDI diversion”, Mimeo.

European Commission
Aggressive tax planning indicators
135
Vicard, V. (2015), “Transfer pricing of multinational companies and aggregate trade”, Banque de France Working Paper No. 555.
Weyzig, F., (2013), “Tax treaty shopping: structural determinants of Foreign Direct Investment routed through the Netherlands”, International Tax and Public Finance, Vol. 20(6), pp. 910-937.

European Commission
Aggressive tax planning indicators
136
Technical appendix
A Detailed description of ATP structures
A.1. Offshore loan ATP structure
Figure 12 describes the offshore loan ATP structure from the ATP study. While the ZEW study reduces the tax planning strategy to its bare minimum the ATP structure from the ATP study has additional features which highlight important legal aspects. In line with the financing via offshore ATP structure, an offshore (in the sense of being in a country with zero or no corporate taxation) subsidiary is set up and financed by the parent country. The money is lent on to a holding entity in Member State B, which pays interest in return. This holding company lends the money onward to a holding company in Member State C and receives interest for the loan. In sum the transactions largely cancel out in the holding company in Member States B. The holding company in Member State C can deduct the interest costs and achieves tax savings via group consolidation with the target company.
Figure 12: Offshore loan ATP structure
Source: Own illustration based on ZEW study (2016) and ATP study (2015)
In the end, the interest payments are deductible from the profits in the target entity and thereby reduce the tax burden there. The interest income is taxable in the offshore subsidiary, but since the tax rate in this country is zero, the overall tax burden is reduced.
A.2. Hybrid loan ATP structures
Another channel of tax planning, which was described in the ATP study, is the case of mismatches in the tax treatment of transactions between the countries involved. The origin of the potential tax savings here typically stems from the fact that the costs of a transaction are legally seen as tax deductible in one country, while the income in the

European Commission
Aggressive tax planning indicators
137
other country is seen as not taxable. Figure 13 illustrates the hybrid loan ATP structure from the ZEW study.
Figure 13: Hybrid loan ATP structure (ZEW study)
Source: Own illustration based on ZEW study (2016)
The key mechanism to reduce the overall tax burden is the transaction between the subsidiary in the non-Member State B and Member State C. Country B treats the income from the transaction as tax-exempt dividends, while country C allows the deduction of the interest costs.
Figure 14: Hybrid loan ATP structure (ATP study)
Source: Own illustration based on ATP study (2015)
Figure 14 shows the hybrid loan structure from the ATP study, which has the additional feature that an additional holding company is involved. The key mechanism of the tax saving is identical to the hybrid loan structure from the ZEW study. The hybrid loan from the offshore entity is treated as a loan in the holding company in

European Commission
Aggressive tax planning indicators
138
Member State C, which therefore can deduct the interest costs. The receipts in the offshore entity in State B are treated as tax exempt dividends. The final reduction in the overall tax burden is then achieved via group taxation between the holding company and the target entity in Member State C.
A.3. Hybrid entity ATP structure
Figure 15 depicts the hybrid entity ATP structure where the mismatch stems from a different legal qualification on the legal nature of the entity in countries B and A. Treating the hybrid entity as part of a tax-transparent entity in country A will imply that the interest received cancels out with the costs of the loan. The tax saving originates from the fact that the hybrid entity in country B can consolidate the interest costs with another existing subsidiary through group taxation.
Figure 15: Hybrid entity ATP structure
Source: Own illustration based on the ATP study (2015)
A.4. Interest free loan ATP structure
Figure 16 shows the interest free loan ATP structure. While this ATP structure does not involve a hybrid instrument, the main mechanism still depends on a mismatch of treatment of interest payments. The mismatch in this structure lies in the fact that the subsidiary in country B gives an interest free loan to the subsidiary in country D which allows a deduction for deemed interest payments. Hence, there are no interest received to be taxed in country B, and the overall tax burden is reduced. Like the offshore loan ATP structure, the interest-free loan ATP structure involves solely internal debt financing. However, in contrast to the channel described above the tax saving originates from a mismatch between the two countries involved: one country deducts interest costs, which never occurred according to the tax treatment in the other country.

European Commission
Aggressive tax planning indicators
139
Figure 16: Interest free loan ATP structure
Source: Own illustration based on the ATP study (2015)
A.5. Patent box ATP structure
Figure 17 shows the description of the patent box ATP structures presented in the ATP study. Like the patent box ATP structure described in Figure 3, the ATP structure from the ATP study builds on the existence of a patent box in Member State B, which lowers the tax rate on the royalties received. The tax deduction of the royalties paid from the subsidiary in country C lowers the tax burden in the target entity. The lower tax rate offered in the patent box results in a significantly lower tax burden. The only difference to the ATP structure in Figure 3 is that the ATP study includes the transfer of the royalty bearing intellectual property in the structure, while the ZEW study assumes that the intellectual property is already in the country with the patent box.
Figure 17: Patent box ATP structures (ATP study)
Source: Own illustration based on ATP study (2015)

European Commission
Aggressive tax planning indicators
140
A.6. Further ATP structures using intangible assets
The ATP study includes two more ATP structures where the deduction of royalty costs lies at the heart of the tax savings. Figure 18 depicts the two-tiered IP ATP structure. The key channel of the two-tiered ATP structure is that the intellectual property is transferred to a subsidiary, which is incorporated in country E, but is tax-resident outside that country in a jurisdiction where it is tax-exempt. As a result, the royalty payments made by the target company in Member State D are deducted from the tax bases there but are not taxes in the entity in country E. The second tier of the structure sees subsidiaries in Member States B and C with sub-licenses and corresponding royalty flows.
Figure 18: Two-tiered intellectual property ATP structure
Source: Own illustration based on ATP study (2015)
Figure 19 shows the IP and cost-contribution agreement structure from the ATP study. The tax reduction in this ATP structure originates from the allocation of the royalty payments to a tax free company in State B in combination with the deduction of R&D costs in Member State A and royalty costs in Member State C. Both Member States levy higher taxes which results in the overall tax reduction.

European Commission
Aggressive tax planning indicators
141
Figure 19: Cost contribution agreements ATP structure
Source: Own illustration based on ATP study (2015)
A.7. ATP structures and tax rules of Member States
The ATP study identifies for each of the seven ATP structures which tax rules where needed for such structures to exist. In Table 37, we summarise the seven ATP structures and identify which Member States’ tax rules can be used in which role in the respective ATP structures. This is based on the information in Appendix 2 of the ATP study. This implies that we base this part of the analysis on the legal situation in each Member State at the time of the writing of the ATP study.88 Any subsequent law changes are not taken into account. Table 37 distinguishes between four possible roles. The role of the MNE group is shown as non-shaded cells and is always labelled State A in the ATP study. We interpret this as the headquarter country, which amongst others needs to have neither binding CFC rules nor tax obstacles to the repatriation of the profits. The second role, we label target countries, shown as lightly shaded cells, which are the subsidiaries where the tax base is eroded because of the ATP structure. Some of the ATP structures involve a non-EU Member State, typically zero or no corporate tax countries, which we show as black cells. Finally, some of the ATP structures have further conduit entities, shown as darkly shaded cells, which are enabling the ATP structure but not directly gaining significant tax base.
In each cell, we list the EU Member States with all tax rules necessary to be used in a given role in a given ATP structure.89 However, one tax rule is disregarded. It is the
88 The ATP study has been published in December 2015, which implies that cut-off date for the legal situation is approximately mid 2015. 89 Note that indicators 14 and 15 respectively 20 and 21 in the ATP study are the exception to this rule, since the beneficial owner test of withholding taxes is obsolete if no withholding taxes are levied. Therefore, we use either one of these indicators as sufficient for the MS to play the respective role.

European Commission
Aggressive tax planning indicators
142
“Lack of a general or specific anti avoidance rule” (indicator 32 in the ATP study) 90. Since the ATP study (page 147) closes with the qualification that “[…] (t)his should not be taken as a complete overturning or discrediting of the model ATP structures […]”, we disregard this indicator. This results in some more Member States qualifying for the role of the target country as indicated in brackets in Table 37. Furthermore, it should be noted that the ATP study investigates the absence or existence of certain tax rules but does not necessarily look into their effectiveness91. Therefore, the table below provides a conservative view of which Member States' tax rules could be used in which structure.
Table 37: Legal indicators and roles of countries in ATP structures
ATP structure State A State B State C State D State E
1 (Offshore loan)
BE, BG, CY, CZ, EE, LU, LV,
MT, RO, SK no MS no MS no MS
2 (Hybrid loan)
BE, BG, CY, CZ, EE, LU, LV,
MT, RO, SK
no MS no MS
3 (Hybrid entity)
No MS (AT, BE, DE,
DK, EL, ES, FI, FR, HU, IE, LT, LU, LV, MT, NL,
RO, SI, UK)
no MS
4 (Interest-free
loan)
BE, BG, CY, CZ, EE, LU, LV,
MT, RO, SK IE, MT Non MS
(CY, EE, IE) no MS
5 (Patent box) CZ, MT CY, HU,
MT, UK
PL, SI (BE, CY, HU, LU,
LV, NL, RO)
6 (Two-tiered IP) CZ, MT CY
PL, SI (BE, CY, HU, LU,
LV, NL, RO)
PL, SI (BE, CY,
HU, LU, LV, NL, RO)
no MS
7 (IP and cost contribution)
CZ no MS No MS (BE, LU, NL) all MS
Note: State A to State E refers to the labelling in the ATP study, empty cells imply that no such State is mentioned in the ATP structure. Entity D in the IP and cost contribution ATP structure is a manufacturing company, and therefore does not classify as a conduit entity in the spirit of the ATP study. However, it fits the definition of a conduit entity of this study.
Source: Own consideration based on ATP study
The results in Table 37 already suggest that the legal situation in some Member States is more conducive to ATP than in others. However, the legal possibility of a role in a ATP structure does not yet take into account to which extent the MNEs are using the
90 If indicator 32 was taken into account, it quickly becomes evident that the legal indicators from the ATP structure may be too conservative since no EU country scores in all the necessary indicators to be a target country. 91 For example, the ATP study states that the absence of CFC rules "would constitute the absence of a critical anti-avoidance measure which could have prevented an ATP structure. This indicator examines the absence (or existence) of CFC rules, but does not examine their effectiveness". On that basis the results presented in Table 1 may be too restrictive.

European Commission
Aggressive tax planning indicators
143
opportunities. Therefore, it is necessary to link the legal information to information about the ownership structure of the MNEs.

European Commission
Aggressive tax planning indicators
144
B Overview combination of indicators
This section summarises the combination of indicators to classify MNE entities into the types described in Section 2.3. The combinations are first shown for the main channels and subsequently for all ATP structures derived from the ATP study.
B.1. Combination of indicators to identify roles in main ATP channels
The three main channels presented in the main text are i) ATP via interest payments, ii) ATP via royalty payments and iii) ATP via strategic transfer pricing. The combinations for the classification for these three main channels are described in Table 38 for the interest payment channel, Table 39 for the royalty payment channel and Table 40 for the strategic transfer price channel.
The exact description of the combination and how the different classifications differ from each other is found in the next subsection where all ATP structures are described.

European Commission
Aggressive tax planning indicators
145
Table 38: Combination of indicators: ATP via interest payments
ATP channel 1: Tax planning via interest payments usage for classification Role Indicator Description standard strict
General
[5b] The MNE group has at least one subsidiary in a country with a lower tax rate
For at least one entity in MNE [5b]=1
For at least one entity in MNE [5b]=1
[6] The consolidated ETR is lower than the statutory tax rate in the headquarter country
n.a. [6]=1
Headquarter country: [5a] The global owner is in a country
with no CFC rules n.a. [5a]=1
Target country:
[7aEMP] or [7aASSET]
Lower pre-tax profitability in target country compared to rest of MNE group [7a] or
[7b]=1 & [5b]=0
[7a]=1 & [5b]=0
[7bEMP] or [7bASSET]
Lower pre-tax profitability in target country compared to domestic companies
[7b]=1 & [5b]=0
[9aEMP] or [9aASSET]
Lower financial profits in target country compared to rest of MNE group [9a] or
[9b]=1 & [5b]=0
[9a]=1 & [5b]=0
[9bEMP] or [9bASSET]
Lower financial profits in target country compared to domestic companies
[9b]=1 & [5b]=0
[10aEMP] or [10aASSET]
Higher interest payments compared to rest of MNE group
[10a] or [11a]=0 &
[5b]=0
[10a]=0 & [5b]=0
[10bEMP] or [10bASSET]
Higher interest payments compared to domestic companies
[10b]=0 & [5b]=0
[11a] Higher debt share compared to rest of MNE group
[11a]=0 & [5b]=0
[11b] Higher debt share compared to domestic companies
[11b]=0 & [5b]=0
Lower tax country:
[7aEMP] or [7aASSET]
Higher pre-tax profitability in lower tax country compared to rest of MNE group [7a] or
[7b]=0 & [5b]=1
[7a]=0 & [5b]=1
[7bEMP] or [7bASSET]
Higher pre-tax profitability in lower tax country compared to domestic companies
[7b]=0 & [5b]=1
[9aEMP] or [9aASSET]
Higher financial profits in lower tax country compared to rest of MNE group [9a] or
[9b]=0 & [5b]=1
[9a]=0 & [5b]=1
[9bEMP] or [9bASSET]
Higher financial profits in lower tax country compared to domestic companies
[9b]=0 & [5b]=1
[10aEMP] or [10aASSET]
Lower interest payments compared to rest of MNE group
[10a] or [11a]=1 &
[5b]=1
[10a]=1 & [5b]=1
[10bEMP] or [10bASSET]
Lower interest payments compared to domestic companies
[10b]=1 & [5b]=1
[11a] Lower debt share compared to rest of MNE group
[11a]=1 & [5b]=1
[11b] Lower debt share compared to domestic companies
[11b]=1 & [5b]=1
Source: Own consideration based on ATP study and ZEW study

European Commission
Aggressive tax planning indicators
146
Table 39: Combination of indicators: ATP via royalty payments
ATP channel 2: Tax planning via royalty payments usage for classification
Role Indicator Description Standard strict
General
[5b] The MNE group has at least one subsidiary in a country with a lower tax rate
For at least one entity in MNE [5b]=1
For at least one entity in MNE [5b]=1
[6] The consolidated ETR is lower than the statutory tax rate in the headquarter country
n.a. [6]=1
Headquarter country: [5a] The global owner is in a country
with no CFC rules n.a. [5a]=1
Target country:
[7aEMP] or [7aASSET]
Lower pre-tax profitability in target country compared to rest of MNE group [7a] or
[7b]=1 & [5b]=0
[7a]=1 & [5b]=0
[7bEMP] or [7bASSET]
Lower pre-tax profitability in target country compared to domestic companies
[7b]=1 & [5b]=0
[8aEMP] or [8aASSET]
Lower operating profitability in target country compared to rest of MNE group [8a] or
[8b]=1 & [5b]=0
[8a]=1 & [5b]=0
[8bEMP] or [8bASSET]
Lower operating profitability in target country compared to domestic companies
[8b]=1 & [5b]=0
[12a] Lower intangible assets ratio compared to rest of MNE group [12a] or
[12b]=1 & [5b]=0
[12a]=1 & [5b]=0
[12b] Lower intangible assets ratio compared to domestic companies
[12b]=1 & [5b]=0
[15] The net bilateral royalty outflows n.a. [15]=1
Lower tax country:
[7aEMP] or [7aASSET]
Higher pre-tax profitability in lower tax country compared to rest of MNE group [7a] or
[7b]=0 & [5b]=1
[7a]=0 & [5b]=1
[7bEMP] or [7bASSET]
Higher pre-tax profitability in lower tax country compared to domestic companies
[7b]=0 & [5b]=1
[8aEMP] or [8aASSET]
Higher operating profitability in lower tax country compared to rest of MNE group [8a] or
[8b]=0 & [5b]=1
[8a]=0 & [5b]=1
[8bEMP] or [8bASSET]
Higher operating profitability in lower tax country compared to domestic companies
[8b]=0 & [5b]=1
[12a] Higher intangible assets ratio compared to rest of MNE group [12a]or
[12a]=0 & [5b]=1
[12a]=0 & [5b]=1
[12b] Higher intangible assets ratio compared to domestic companies
[12b]=0 & [5b]=1
[15] The net bilateral royalty inflows n.a. [15]=2
Source: Own consideration based on ATP study and ZEW study

European Commission
Aggressive tax planning indicators
147
Table 40: Combination of indicators: ATP via strategic transfer pricing
ATP channel 3: Strategic transfer pricing usage for classification Role Indicator Description standard strict
General
[5b] The MNE group has at least one subsidiary in a country with a lower tax rate
For at least one entity in MNE [5b]=1
For at least one entity in MNE [5b]=1
[6] The consolidated ETR is lower than the statutory tax rate in the headquarter country
n.a. [6]=1
Headquarter country: [5a] The global owner is in a country
with no CFC rules n.a. [5a]=1
Target country:
[7aEMP] or [7aASSET]
Lower pre-tax profitability in target country compared to rest of MNE group [7a] or
[7b]=1 & [5b]=0
[7a]=1 & [5b]=0
[7bEMP] or [7bASSET]
Lower pre-tax profitability in target country compared to domestic companies
[7b]=1 & [5b]=0
[8aEMP] or [8aASSET]
Lower operating profitability in target country compared to rest of MNE group [8a] or
[8b]=1 & [5b]=0
[8a]=1 & [5b]=0
[8bEMP] or [8bASSET]
Lower operating profitability in target country compared to domestic companies
[8b]=1 & [5b]=0
[14]
The bilateral import/export price anomalies reflect profit shifting from target entity to lower tax entity
n.a. [14]=1
Lower tax country:
[7aEMP] or [7aASSET]
Higher pre-tax profitability in lower tax country compared to rest of MNE group [7a] or
[7b]=0 & [5b]=1
[7a]=0 & [5b]=1
[7bEMP] or [7bASSET]
Higher pre-tax profitability in lower tax country compared to domestic companies
[7b]=0 & [5b]=1
[8aEMP] or [8aASSET]
Higher operating profitability in lower tax country compared to rest of MNE group [8a] or
[8b]=0 & [5b]=1
[8a]=0 & [5b]=1
[8bEMP] or [8bASSET]
Higher operating profitability in lower tax country compared to domestic companies
[8b]=0 & [5b]=1
[14]
The bilateral import/export price anomalies reflect profit shifting from target entity to lower tax entity
n.a. [14]=2
Source: Own consideration

European Commission
Aggressive tax planning indicators
148
B.2. Combination of indicators to identify roles in all ATP structures
This short description lays out how we combine the specific indicators to identify the role that an entity may play in an ATP structure. We start with the strict assumptions, which are also summarised in Table 41 and then present how we weaken the assumptions to get to the combinations for the standard use of the indicators in Table 42.
Strict use of indicators: Table 41 summarises how we use the strictest possible combination of indicators to determine the roles of the different countries for each of the ATP structures. As explained in Section 2, we derive five ATP scenarios. i.) The internal debt financing ATP structure, ii.) the hybrid loan ATP structure, iii.) the strategic transfer pricing ATP structure iv.) the intellectual property ATP structure and the vi.) patent box ATP structure. The columns in Table 41 describe the various roles subsidiaries can play in the Member States. We have the target entity which is the entity where the tax base is eroded. Second, there is the lower tax entity which is the entity which receives the tax base.92 Third we have a conduit entity, which is necessary to enable the ATP structure, but not necessarily gaining or losing tax base itself. Since not all MNE groups observed in the dataset are engaged in ATP, and for a number of the firms, the relevant data is missing we have two further categories. There are those firms where the data is inconsistent with the ATP study. It means that, for these observations the available data suggests that ATP is not taking place. And finally, there are observations where the data is unavailable or insufficient to make a clear statement about ATP strategies.
These five categories are additionally split into the headquarter and subsidiary observations. The headquarter is already identified through the ownership structure. Whether this headquarter is part of a MNE which uses ATP structures will depend on the presence of the subsidiaries with indicators highlighting such behaviour. However, for the strict classification, we also require that the headquarter country has the relevant legal indicators. This is first and foremost the absence of a CFC rule (indicator [5a]=1) and more generally an ownership structure consistent with the ATP study structure. This is either (indicator [5b]=1) demanding that at least one subsidiary is in a lower tax country or (indicator [5d]=1) requiring the presence in a country with a patent box in place. Independent from the type of ATP, the strict classification always starts with the indicator [6] which measures a lower effective tax burden for the consolidated MNE account. In its strictest approach, we only would consider the MNE as relevant for the ATP structures, if it has a lower effective tax burden than its domestic counterparts. However, since the coverage for the consolidated accounts is limited, and the effective tax rate indicator is by construction only an imprecise approximation, we use a less strict version of this indicator. Specifically, we re-define the test on indicator [6]. This indicator is not met (i.e. indicator [6]=0) if the consolidated effective tax burden of the MNE group is higher than the statutory tax rate. We treat these cases as inconsistent with any ATP structure. 92 Note that this is not necessarily a zero/no tax entity. We define a country as lower tax if it has an at least 5-percentage-points lower tax rate compared to highest tax rate within the MNE group. For the purpose of this study, we define a country as being a zero/no tax country if it is outside the EU and identified on the EU Scoreboard as having a no or a zero corporate income tax rate. Curacao and the United Arab Emirates are additionally classified as zero/no tax country because of additional information sourced from PWC worldwide tax summaries.

European Commission
Aggressive tax planning indicators
149
Key to the identification of both target and lower tax entities are the profitability measures. Note that we use two definitions of each of the profitability measure. We scale the profit measures by either total assets or by the number of employees. Since we have for neither of these two denominators a particular theoretical argument in favour or against it, we could put equal weight on them. However, since the coverage for employees is clearly less complete, we use the definition using total assets as the default. Additionally, we treat the indicator as fulfilling the criteria, if either one of the two indicators fulfils the criteria. This is reflected in the fact that we drop the superscript by defining [7a]=1 if [7aASSETS]=1 or [7aEMP]=1 & [7aASSETS] ≠ 0. In other words we define the pre-tax profitability as higher (than in the rest of the MNE group) if the pre-tax profitability ratio to total asset is higher or if the pre-tax profitability ratio to total asset is not defined and the pre-tax profitability ratio to the number of employees is higher. The same procedure is done for all the profitability measures.
For the target country, that is the country which loses corporate tax base, there is one common indicator for all five ATP structures, namely the pre-tax profitability measures. In the strict use of the indicators we require that the pre-tax profitability is lower compared to the rest of the MNE [7a]=1 and compared to the domestic comparison group [7b]=1. Equally, we demand the financial profits to be lower in both comparisons, hence we demand that both [9a]=1 and [9b]=1. In sum, for the strict classification we demand the entities of an MNE to have at least one (i.e. either scaled by total assets or employees) of each of the three profitability indicators in line with the prediction. For the target companies in the other three ATP structures we follow the same logic, but use the operating profitability measures instead of the financial profitability. That is we demand [7a]=1 and [7b]=1 and [8a]=1 and [8b]=1 for the classification as a target entity. In addition to the profitability indicators we demand for the internal debt financing ATP structure and the hybrid loan ATP structure that the indicators [10a]=0 and [10b]=0 indicating that the interest payments are higher both in comparison within the MNE and to the domestic companies. And finally indicators [11a]=0 and indicators [11b]=0 look at the debt share which should measure the underlying cause of the interest payments and therefore be higher in both comparisons. Finally, we also require the target country to be a relatively high tax country.
The combination of indicators for the target companies in the ATP channels involving intellectual property and royalties and patent boxes also build on indicator [12a]=1 and [12b]=1 which reflect less intangible assets in the target country. For the patent box ATP structure we use the indicators [13a]=1 and [13b]=1 reflecting the differences in patent holdings. The interpretation is the same for both sets of indicators. A subsidiary in the target country should exhibit lower holdings of the intangible assets/patents compared to either the rest of the MNE group or to domestic counterparts. Both indicators [10] and [11] aim to measure the amount of royalty bearing intellectual property. In principle, they can be used interchangeably, but the patent box regimes we will put more focus on the patent based indicators. In addition to the firm level indicators, we will require the bilateral royalty flows indicator [15]=1 to be in line with the ownership structure. Finally, for the ATP structure based on intellectual property, we also require the target country to be a relatively high tax country, while the target country for the patent box scheme needs to be country without a patent box.

European Commission
Aggressive tax planning indicators
150
For ATP via strategic transfer pricing we have no firm-specific indicator in addition to the pre-tax profitability based indicators. However, indicator [14]=1 denotes too high export prices or too low import prices at the bilateral country-industry level and helps to detect strategic transfer pricing. To attribute the individual subsidiaries to the ATP channel we merge the bilateral information on subsidiary pairs and broad industry classification. Finally, for the ATP structure based on transfer pricing, we also require the target country to be a relatively high tax country.
The second category is the lower lower tax entity. For all ATP structure, except the hybrid loan structure, the lower tax entity is the mirror of the target entity. In consequence, we follow the logic of the indicator combinations of the target. That is, we require the exact opposite in the profitability, interest payments, debt, intangible assets or patent indicators. Note that the bilateral indicators for import price anomalies and royalty flows are defined in a manner that they need to be fulfilled for the lower tax country as well.
The third category is a conduit entity, i.e. an entity, which is important to the mechanism of the ATP structure, even if it could not gain or lose tax base itself. Given that a conduit entity plays an intermediate role in ATP strategies it is difficult to conceive firm specific indicators. In the cases of the offshore loan, the hybrid loan ATP structures and the interest free loan, there are no significant consequences on tax base of the conduit country. For this reason, we reverse the identification process and start with the presence of target entity or a lower tax entity within the group. Given that a target or lower tax entity is in the group and the specific entity is not identified as a target or a lower tax entity, we will treat this entity as a conduit entity. In the strict version we furthermore demand that the entity is in a country which is useful for treaty shopping, measured through indicator [4d]>4. This should reflect the ability of the tax efficient repatriation.
The category inconsistent with the ATP structure is defined by indicators, which are applicable to the whole group. Specifically, for the strict classification we classify all entities within MNE groups with a consolidated ETR higher than the statutory tax rate of the owner country (indicator [6]=0) as inconsistent with ATP. Furthermore, if the headquarter is in a country with CFC rules (indicator [5a]=0) or the MNE group has no subsidiaries in lower tax (patent box) countries (indicators [5b]=0 respectively [5d]=0 for all entities), we also treat these MNE group as inconsistent with the ATP structures requiring these characteristics.
Finally, the remainder of entities are classified into the category insufficient data or data not available. This approach ensures that all entities for which we have only partial information or where the information is contradictory in itself are allocated into the insufficient data category. Strictly speaking, therefore, the insufficient data category also includes observations where the data is partly inconsistent with the ATP structure. To avoid an imprecise distinction with the category of inconsistent with the ATP structure we combine these two categories in the description of the results.

European Commission
Aggressive tax planning indicators
151
Table 41: Combination of indicators and ATP channels – strict classification
Source: Own consideration based on ATP study

European Commission
Aggressive tax planning indicators
152
Table 42: Combination of indicators and ATP channels –standard classification
Source: Own consideration based on ATP study

European Commission
Aggressive tax planning indicators
153
Standard classification:
Table 42 summarises the combination of indicators we use for the standard classification. In comparison to the strict use of the indicators we do not require that the headquarter is in a country with no CFC rules. Furthermore, we do not use the indicator that the consolidated ETR needs to be lower than the statutory tax rates, the bilateral import price indicator, the bilateral royalty flow indicator and the treaty shopping indicator. Additionally, we take either one of the profitability indicators as sufficient, together with either one of the interest or debt indicators for the internal finance or hybrid loan ATP structure or together with the higher tax (transfer pricing ATP) the higher tax and one of the intangible assets indicators (intellectual property ATP) or the patent indicators (patent box ATP).
Note that this standard classification does not allow for any entity being inconsistent with the hybrid loan ATP structure.

European Commission
Aggressive tax planning indicators
154
C Dealing with complex ownership structures
The ownership information provided by Bureau van Dijk includes detailed information about shareholders and subsidiaries of the companies. Typically, the information about the ownership structure is of cross-sectional nature in the sense that the information refers to the latest available information. Previous information is overwritten and only available through downloads at different points in time.
The availability of ownership and shareholder information allows either a bottom up (using subsidiary information) or a top down (using ownership information) approach to identify more complex ownership structures. Since the information about the ownership structure allows for an approach, which results in a non-ambiguous allocation to corporate groups we chose a bottom up approach in this study.
The ownership information contains data about direct and global ultimate owners and their respective shares of ownership, which are held either directly or indirectly. Additionally, the information includes basic information about the type of the shareholder. To end up with an unambiguous ownership structure we use only corporate owners with more than 50 percent direct ownership to build our corporate groups. We start from the individual corporate entities and repeatedly merge the owners with their ownership information until we i.) reach the reported global ultimate owner or ii.) find no further corporate owner. In a next step, we correct those cases where the reported global ultimate owner is a non-corporate entity by using the highest corporate owner. For example, in a case where a corporate group is ultimately owned by the government we will use the highest non-public owner as the alternative global ultimate owner. Similarly, if a corporate group is ultimately owned by an individual, or family, we will treat the highest corporate entity as global ultimate owner.
Figure 20 illustrates a possible ownership structure of a corporate group. The example consists of seven corporate entities in three different Member States (A, B and C) and two non-Member States, where one is considered to be a zero/no tax country. While the example is arbitrary, it highlights the importance of an exact definition of the underlying ownership concept. If we abstract from the third country issues at the moment the example in Figure 20 consists of four subsidiaries in Member States within one corporate group with the global ultimate owner in a Member State.
If we consider the relationship of subsidiaries with their direct owners only, we have the following four dyads: Company 4 owned by Company 3, Company 3 owned by Company 2, Company 7 owned by Company 6 and Company 6 owned by Company 1. While these combinations are representing an adequate description of the direct ownership links, none of the combinations captures the link with the zero/no tax subsidiary Company 5. Similarly, the existing indirect link between Member States A and C is also not captured.

European Commission
Aggressive tax planning indicators
155
Figure 20: Example ownership structure
Source: own illustration
Alternatively, if we only consider the relationship of subsidiaries with their global owners, we have the following four dyads: Companies 3, 4, 6 and 7 are all owned by Company 1. Again, these combinations are representing an adequate description of the links with the global owner, but still none of the combinations captures the link with the zero/no tax subsidiary Company 5. In contrast to the consideration of the direct owner the link between Company 7 and Company 1 is now taken into account. As a downside the link between Company 6 and Company 7 is no longer considered.
Following the logic of Jungmann and Loretz (2016) we can also consider the link to the rest of the group. In this case, Companies 3, 4, 6 and 7 will be linked to all other corporate entities in the corporate group. This increases the number of combinations substantially, but since we are interested in country level indicators as final outcome, we can reduce the complexity by only considering the country combinations. This will result in the combinations MS A to MS A, MS B, MS C, non MS 1 and non MS 2 for Companies 3 and 4, MS B to MS A, MS C, non MS 1 and non MS 2 for Company 6 and MS C to MS A, MS B, non MS 1 and non MS 2 for Company 7. In a nutshell, the result is that for each of the subsidiaries the locations of all the other subsidiaries and the global ultimate owner are relevant. At the same time, the number of possible combinations increases substantially, which will result in a smaller weight when aggregating the information at the country levels.
European Commission
Aggressive tax planning indicators
156
D Gravity equation estimates to control for economic factors
D.1. Using gravity equations for FDI estimates
The decision to expand business abroad and to engage in foreign direct investment depends on numerous economic considerations. The potential to reduce the effective tax burden through ATP is only one of these aspects and a failure to account for other economic aspects will result in effects falsely attributed to the tax environment.
One approach to empirically model the economic determinants of the FDI decision is the gravity approach. The gravity approach builds on Newtons law for the gravitational force, stipulating that the gravitational force (𝐺𝐺𝐺𝐺𝑚𝑚𝑖𝑖) between two masses (𝑀𝑀) in 𝑖𝑖 and 𝑗𝑗 is
(1) 𝐺𝐺𝐺𝐺𝑚𝑚𝑖𝑖 =𝑀𝑀𝑖𝑖𝑀𝑀𝑗𝑗
𝐷𝐷𝑖𝑖𝑗𝑗.
In other words, the gravitational force between two objects is directly proportional to their masses and inversely proportional to their distance. The transfer of using this concept for bilateral trade data has been done already by Tinbergen (1962). Because of its strong empirical support, the gravity equation quickly established as a workhorse model in the international trade literature. Taking the logarithm of the gravity equation in (1) and using the respective GDP as measure for the economic size, the bilateral trade flow can be estimated as follows:
(2) ln (𝐶𝐶𝐿𝐿𝑡𝑡𝑇𝑇𝐿𝐿𝑚𝑚𝑖𝑖) = β1ln(𝐺𝐺𝐺𝐺𝐺𝐺𝑚𝑚) + β2ln�𝐺𝐺𝐺𝐺𝐺𝐺𝑖𝑖� + β3 ln�𝐺𝐺𝐶𝐶𝐷𝐷𝐶𝐶𝑚𝑚𝑖𝑖� + 𝜀𝜀𝑚𝑚𝑖𝑖,
where 𝜀𝜀𝑚𝑚𝑖𝑖 describes the usual error term. One of the main difficulties involved in the estimation of (2) is that the logarithm of zero trade flows is not defined. Furthermore, in the presence of heteroscedasticity results in biased estimates using a (log-)linear estimation technique. Therefore, it has become a standard approach to use the poisson pseudo maximum likelihood (PPML) estimator proposed by Santos Silva and Tenreyro (2006).
The transfer from the estimation of international trade flows to the estimation of investment flows and stocks has been done by several authors. Particularly relevant for the current study is the approach by Bénassy-Quéré et al. (2006) which investigate the impact of international taxation on bilateral FDI. More generally see also Kleinert and Toubal (2010) for a discussion and a theoretical foundation of the use of gravity models for the estimation of FDI.
D.2. Simulation of FDI stocks using a simple gravity approach
In Table 11 we present the results for unexplained FDI stocks. The term unexplained refers to the part of FDI stocks which is not explained by a simple gravity model. Specifically, we use the simple relationship described in equation (1). This implies that we can infer for each country-pair the share of global FDI stocks from the shares of the global GDP and the distances between the country pair. Denote 𝑌𝑌𝑚𝑚 as the GDP of country 𝑖𝑖 and 𝑇𝑇𝑚𝑚𝑖𝑖 we can simulate the share of the world FDI stock as

European Commission
Aggressive tax planning indicators
157
(3) 𝐺𝐺𝐺𝐺𝐶𝐶� 𝑚𝑚𝑖𝑖 =𝑌𝑌𝑖𝑖𝑌𝑌𝑗𝑗𝑑𝑑𝑖𝑖𝑗𝑗
.
In a second step, we scale the sum of the simulated FDI stock by the observed worldwide FDI stock to separate a tax induced distortion in the distribution of the FDI stocks from a general over or underestimation of FDI. Therefore, we have
(4) 𝐺𝐺𝐺𝐺𝐶𝐶� 𝑚𝑚𝑖𝑖 =𝑌𝑌𝑖𝑖𝑌𝑌𝑗𝑗𝑑𝑑𝑖𝑖𝑗𝑗
∑𝐹𝐹𝐷𝐷𝐹𝐹𝑖𝑖𝑗𝑗∑𝐹𝐹𝐷𝐷𝐹𝐹� 𝑖𝑖𝑗𝑗
as our final simulated FDI stock.
D.3. Results gravity equations for geographical distribution of MNE entities and for aggregate FDI stocks
A more data driven approach to the use of the gravity model is to estimate the tax effect directly. We use two different data sources to estimate a tax effect on the location of FDI. First, we use the information from the firm-level data regarding the ownership structure. We count the number of subsidiaries in each country 𝑖𝑖 by country of the global ultimate owner 𝑗𝑗. We use this number of firms variable (𝑁𝑁𝑁𝑁_𝑓𝑓𝑖𝑖𝐿𝐿𝑓𝑓𝐿𝐿𝑚𝑚𝑖𝑖) as dependent variable in two regressions. In the first one we include the effective average tax rate of the parent country and the effective average tax rate of the subsidiary country. In the second regression, we include parent and subsidiary country fixed effects to control for unobservable country characteristics. Due to the cross-sectional nature of our data this fully captures the tax rates. Therefore, we include the bilateral effective average tax rate as our main variable of interest. Additionally, our regressions include a dummy for domestic subsidiaries, i.e. when the parent country and the subsidiary country are identical. Furthermore, we include dummy variables which identify if the parent and subsidiary country have a common official language or if they are contiguous.
The second set of regressions in Table 43 use the bilateral FDI stock as dependent variable. The regression follows the same logic with the third regression including the effective average tax rates for sending and receiving countries and the fourth regression including home and host country fixed effects and the bilateral effective tax rate. Note, that we are not including the domestic investment, therefore no domestic dummy is included.
Overall, we see the expected tax effects. In the case of the regressions explaining the geographical distribution of the subsidiaries we find the expected positive tax coefficient for the headquarter country together with expected negative tax coefficient for the subsidiary country. The bilateral tax burden is also clearly significant negative. For the regressions explaining the FDI stocks, the tax effects in the regression without country fixed effects are insignificant, while the bilateral tax effect in the regression with home and host country fixed effects is very large and highly significant.
In fact, the tax effect in the last regression is extremely large, which hints at some form of misspecification of the regression or data problems. The latter are already evident in the fact that we lose several observations because of negative FDI stocks, which seems not very plausible. Additionally, the bilateral effective average tax rates are only an approximation of the tax burden and include tax burden upon repatriation. This could be misleading in the case of retained earnings.

European Commission
Aggressive tax planning indicators
158
Table 43: Results gravity estimates
No. of subsidiaries FDI stocks
[1] [2] [3] [4]
log (GDP HQ) 0.475*** 0.301**
(0.070) (0.138)
log (GDP subsidiary) 0.583*** 0.249*
(0.064) (0.146)
EATR subsidiary -0.032** 0.045
(0.014) (0.030)
EATR headquarter 0.032*** 0.040
(0.012) (0.028)
Bilateral EATR -7.651*** -26.379***
(2.452) (9.404)
log (Distance) -0.396*** -0.680*** -1.377*** -0.716***
(0.085) (0.071) (0.186) (0.144)
HQ and owner country are contiguous
0.430** 0.603*** -1.216*** 0.300
(0.187) (0.105) (0.370) (0.193)
HQ and owner country have common official language
0.221 0.249 0.583** -0.268
(0.226) (0.158) (0.276) (0.243)
Domestic subsidiary 2.755*** 2.668***
(0.238) (0.142)
HQ and subsidiary country fixed effects included No. of observations 784 784 609 609
R2 0.861 0.993 0.208 0.903
Notes: All regressions use the tax rates for 2013. FDI stocks are average over the period 2010 to 2015. Semi-robust standard errors in brackets. *** denote significance at the 1 % level, ** at the 5 % level and * at the 10 % level. Estimated using the PPML command implemented in Stata.
Source: Orbis (Bureau van Dijk), own calculations

European Commission
Aggressive tax planning indicators
159
E Appendix Tables
Table 44: Comparison FDI stock data
inward FDI stock (IMF data)
outward FDI stock (IMF data)
Difference to Eurostat data
in % Mio. of
Dollars in % Mio. of
Dollars FDI stock in % of GDP
of GDP of GDP inward outward
Austria 44.0 149708 55.7 189209 26.58 28.1
Belgium 103.1 422034 100.9 413106 -0.92 -0.8
Bulgaria 86.0 37982 6.3 2781 -0.06 -2.3
Croatia 54.0 23701 11.2 4895 0.04 0.3
Cyprus 715.3 126152 688.7 121472 189.40 217.8
Czech Republic 62.2 103798 10.2 16967 -0.62 0.0
Denmark 34.2 91019 64.6 172014 4.96 -1.6
Estonia 83.3 16871 26.7 5408 2.92 1.2
Finland 40.2 84089 41.3 86377 -4.75 -0.5
France 31.9 695356 54.3 1183643 -4.08 -3.8
Germany 33.4 1012822 54.0 1637143 -9.56 -12.3
Greece 9.1 15941 13.6 23870 3.07 1.0
Hungary 76.4 83760 31.9 35004 84.22 92.2
Ireland 183.0 468026 333.3 852697 128.07 -14.7
Italy 18.5 303327 25.7 422058 0.38 0.4
Latvia 53.8 13097 4.5 1107 1.84 0.4
Lithuania 35.0 13063 5.4 2022 1.16 1.0
Luxembourg 357.1 186069 295.3 153889 5409.72 6454.0
Malta 1668.3 146621 693.1 60909 63.66 7.3
Netherlands 95.8 647785 145.5 984251 439.14 487.9
Poland 44.9 191913 5.9 25074 -5.61 -0.6
Portugal 57.4 103010 31.9 57326 1.37 -1.5
Romania 39.0 62501 0.3 533 1.21 0.1
Slovakia 55.6 43746 3.0 2327 -4.60 -0.2
Slovenia 27.7 10684 12.8 4935 2.28 1.4
Spain 44.5 478151 39.4 423289 2.28 2.5
Sweden 57.2 255742 70.2 313837 4.95 6.7 United Kingdom 51.1 1318250 54.0 1391267 -0.91 1.6
EU 28 48.3 253758 58.4 306693 14.7 14.5
Average 148.6 102.8
Std. deviation 328.5 184.2
High values MT, CY MT, CY, IE, LU
Low values
Notes: Average refers to the weighted (for the ratios in % of GDP) respectively to the unweighted average.
Source: Eurostat, IMF World Investment Database, own calculations

European Commission
Aggressive tax planning indicators
160
Table 45: Ownership structures MNE groups (by ultimate owner) AT BE BG CY CZ DE DK ES EE FI FR UK EE HR HU
AT 4158 33 1 42 4 1036 34 41 1 31 133 149 1 6 7 BE 41 4656 2 357 54 71 49 1105 256 2 BG 95 27 353 154 22 152 18 42 2 9 63 62 91 3 18 CY 2 2 1 7926 10 3 2 9 31 42 7 CZ 720 125 2 434 1097 1415 66 126 2 58 384 451 10 4 46 DE 997 375 5 128 27 16814 424 297 4 177 1492 1343 21 6 22 DK 23 47 25 292 4322 14 1 84 165 238 2 1 ES 121 235 14 4 1350 158 7929 1 60 1454 873 11 4 EE 24 9 47 1 69 59 4 466 428 32 65 2 FI 22 22 3 155 176 6 21 2428 97 102 FR 202 1866 1 27 10 2326 161 666 3 107 20597 1536 27 2 7 UK 154 348 2 169 11 2242 384 486 169 2223 19203 34 5 EE 19 22 1 299 1 152 20 61 7 122 116 732 HR 247 16 1 21 8 185 26 11 6 49 35 440 34 HU 115 49 1 9 3 242 14 27 22 114 52 4 2 761 IE 7 46 19 3 329 31 52 14 199 786 1 1 IT 282 253 27 89 18 1487 124 491 6 68 1798 1057 25 20 21 LU 11 185 28 206 7 17 1 254 326 6 LT 8 11 17 1 81 73 3 76 62 31 31 2 LV 14 8 1 117 4 53 77 6 114 95 32 100 1 MT 19 4 3 51 3 9 1 3 16 47 6 NL 90 356 2 147 16 822 114 178 2 119 750 1138 16 1 10 PL 308 238 5 340 77 1721 290 267 4 140 779 439 14 2 26 PT 14 57 2 179 24 713 15 330 102 1 1 RO 518 195 81 1843 64 742 134 487 8 32 531 319 197 7 462 SK 192 39 52 255 260 30 21 1 10 127 52 1 2 19 SI 67 3 1 5 1 57 6 2 3 18 9 17 1 SE 44 65 8 338 436 23 3 468 292 261 1 Non EU 1227 663 113 8945 176 5072 1120 899 130 1016 3537 5374 174 230 205 Sum 9741 9955 598 20915 1803 38195 8388 12949 846 5683 36733 34553 1418 743 166
Source: Orbis (Bureau van Dijk) own calculations

European Commission
Aggressive tax planning indicators
161
Table 46: Ownership structures MNE groups (by ultimate owner) continued IE IT LU LT LV MT NL PL PT ROM SK SI SE Non EU Sum
AT 18 233 104 1 93 5 5 3 12 6 58 1052 7267 BE 66 81 336 1 633 1 4 1 148 1437 9301 BG 5 63 49 2 21 78 7 4 4 1 9 16 503 1873 CY 2 2 12 1 1 14 4 2 216 8289 CZ 59 174 370 5 45 500 154 13 4 332 16 155 2006 8773 DE 163 677 1128 1 3 31 1619 76 24 1 10 27 597 7760 34249 DK 19 39 95 1 1 179 6 5 3 833 1258 7653 ES 115 682 705 3 1 19 829 18 415 2 2 8 214 3284 18511 EE 9 8 31 32 69 6 50 8 247 360 2026 FI 15 34 59 2 109 2 1 816 676 4746 FR 157 943 1965 2 1 10 1256 17 105 1 3 6 411 6137 38552 UK 1152 523 1247 2 3 104 1538 24 41 1 1 4 695 20692 51457 EL 14 70 115 1 70 2 1 24 373 2222 HR 5 121 27 1 2 36 8 1 2 6 140 27 327 1782 HU 5 48 36 1 50 10 3 4 3 34 275 1884 IE 944 91 140 1 8 225 1 9 1 1 36 1867 4812 IT 45 11239 1911 4 3 85 680 20 85 56 2 16 173 4426 24511 LU 29 103 4367 1 15 88 2 5 28 1089 6768 LT 3 5 17 392 28 6 31 34 1 2 90 181 1186 LV 5 19 25 78 287 17 32 6 2 1 1 159 345 1599 MT 3 8 6 393 5 1 2 6 31 104 721 NL 181 227 883 4 62 8782 18 72 2 8 4 261 5774 20039 PL 77 334 453 22 3 14 703 1655 49 21 15 388 1860 10244 PT 6 87 99 13 101 1 1928 1 1 29 521 4225 RO 55 943 354 13 3 31 580 96 72 147 44 17 81 2179 10235 SK 12 54 37 1 1 1 71 21 1 491 2 30 307 2090 SI 2 26 6 6 631 8 69 938 SE 29 65 147 3 2 227 6 3 3 7911 1692 12027 Non EU 693 1495 1282 137 115 62 2389 279 191 33 62 414 2836 71741 110610
Sum 3888 18394 16006 701 525 952 20974 2480 3041 263 1002 1332 16338 138511 408590
Source: Orbis (Bureau van Dijk) own calculations

European Commission
Aggressive tax planning indicators
162
Table 47: Ownership structures MNE groups (by direct owner)
AT BE BG CY CZ DE DK ES EE FI FR UK EL HR HU
AT 4158 33 1 42 4 1036 34 41 1 31 133 149 1 6 7 BE 41 4656 2 357 54 71 49 1105 256 2 BG 95 27 353 154 22 152 18 42 2 9 63 62 91 3 18 CY 2 2 1 7926 10 3 2 9 31 42 7 CZ 720 125 2 434 1097 1415 66 126 2 58 384 451 10 4 46 DE 997 375 5 128 27 16814 424 297 4 177 1492 1343 21 6 22 DK 23 47 25 292 4322 14 1 84 165 238 2 1 ES 121 235 14 4 1350 158 7929 1 60 1454 873 11 4 EE 24 9 47 1 69 59 4 466 428 32 65 2 FI 22 22 3 155 176 6 21 2428 97 102 FR 202 1866 1 27 10 2326 161 666 3 107 20597 1536 27 2 7 UK 154 348 2 169 11 2242 384 486 169 2223 19203 34 5 EL 19 22 1 299 1 152 20 61 7 122 116 732 HR 247 16 1 21 8 185 26 11 6 49 35 440 34 HU 115 49 1 9 3 242 14 27 22 114 52 4 2 761 IE 7 46 19 3 329 31 52 14 199 786 1 1 IT 282 253 27 89 18 1487 124 491 6 68 1798 1057 25 20 21 LU 11 185 28 206 7 17 1 254 326 6 LT 8 11 17 1 81 73 3 76 62 31 31 2 LV 14 8 1 117 4 53 77 6 114 95 32 100 1 MT 19 4 3 51 3 9 1 3 16 47 6 NL 90 356 2 147 16 822 114 178 2 119 750 1138 16 1 10 PL 308 238 5 340 77 1721 290 267 4 140 779 439 14 2 26 PT 14 57 2 179 24 713 15 330 102 1 1 RO 518 195 81 1843 64 742 134 487 8 32 531 319 197 7 462 SK 192 39 52 255 260 30 21 1 10 127 52 1 2 19 SI 67 3 1 5 1 57 6 2 3 18 9 17 1 SE 44 65 8 338 436 23 3 468 292 261 1 Non EU 1227 663 113 8945 176 5072 1120 899 130 1016 3537 5374 174 230 205
Sum 9741 9955 598 20915 1803 38195 8388 12949 846 5683 36733 34553 1418 743 1663
Source: Orbis (Bureau van Dijk) own calculations

European Commission
Aggressive tax planning indicators
163
Table 48: Ownership structures MNE groups (by direct owner) continued IE IT LU LT LV ML NL PL PT RO SK SI SE Non EU Sum
AT 18 233 104 1 93 5 5 3 12 6 58 1052 7267 BE 66 81 336 1 633 1 4 1 148 1437 9301 BG 5 63 49 2 21 78 7 4 4 1 9 16 503 1873 CY 2 2 12 1 1 14 4 2 216 8289 CZ 59 174 370 5 45 500 154 13 4 332 16 155 2006 8773 DE 163 677 1128 1 3 31 1619 76 24 1 10 27 597 7760 34249 DK 19 39 95 1 1 179 6 5 3 833 1258 7653 ES 115 682 705 3 1 19 829 18 415 2 2 8 214 3284 18511 EE 9 8 31 32 69 6 50 8 247 360 2026 FI 15 34 59 2 109 2 1 816 676 4746 FR 157 943 1965 2 1 10 1256 17 105 1 3 6 411 6137 38552 UK 1152 523 1247 2 3 104 1538 24 41 1 1 4 695 20692 51457 EL 14 70 115 1 70 2 1 24 373 2222 HR 5 121 27 1 2 36 8 1 2 6 140 27 327 1782 HU 5 48 36 1 50 10 3 4 3 34 275 1884 IE 944 91 140 1 8 225 1 9 1 1 36 1867 4812 IT 45 11239 1911 4 3 85 680 20 85 56 2 16 173 4426 24511 LU 29 103 4367 1 15 88 2 5 28 1089 6768 LT 3 5 17 392 28 6 31 34 1 2 90 181 1186 LV 5 19 25 78 287 17 32 6 2 1 1 159 345 1599 MT 3 8 6 393 5 1 2 6 31 104 721 NL 181 227 883 4 62 8782 18 72 2 8 4 261 5774 20039 PL 77 334 453 22 3 14 703 1655 49 21 15 388 1860 10244 PT 6 87 99 13 101 1 1928 1 1 29 521 4225 RO 55 943 354 13 3 31 580 96 72 147 44 17 81 2179 10235 SK 12 54 37 1 1 1 71 21 1 491 2 30 307 2090 SI 2 26 6 6 631 8 69 938 SE 29 65 147 3 2 227 6 3 3 7911 1692 12027 Non EU 693 1495 1282 137 115 62 2389 279 191 33 62 414 2836 71741 110610 Sum 3888 18394 16006 701 525 952 20974 2480 3041 263 1002 1332 16338 138511 408590
Source: Orbis (Bureau van Dijk) own calculations

European Commission
Aggressive tax planning indicators
164
Table 49: Statutory corporate tax rates Europe and zero/no tax countries
Country Year(s) Statutory tax rate Country Year(s) Statutory tax rate
EU countries EU countries (continued) Austria 2010-2015 25.00 Sweden 2010-2012 26.30 Belgium 2010-2015 33.99 2013-2015 22.00 Bulgaria 2010-2015 10.00 United Kingdom 2010 28.00 Croatia 2010-2015 20.00 2011 26.00 Cyprus 2010-2012 10.00 2012 24.00 2013-2015 12.50 2013 23.00 Czech Republic 2010-2015 19.00 2014 21.00 Denmark 2010-2013 25.00 2015 20.00 2014 24.50 2015 23.50 Estonia 2010-2014 21.00 Other European countries 2015 20.00 Albania 2010-2013 10.00 Finland 2010-2011 26.00 2014-2015 15.00 2012-2013 24.50 Andorra 2010-2015 10.00 2014-2015 20.00 Belarus 2010-2011 24.00 France 2010 34.43 2012-2015 18.00 2011-2012 36.10 Bosnia Herzegovina 2010-2015 10.00 2013-2015 38.00 Liechtenstein 2010 20.00 Germany 2010-2014 30.18 2011-2015 12.50 2015 30.20 Gibraltar 2010-2015 10.00 Greece 2010 24.00 Iceland 2010 18.00 2011-2012 20.00 2011-2015 20.00 2013-2014 26.00 Macedonia 2010-2015 10.00 2015 29.00 Moldova 2012-2015 12.00 Hungary 2010-2015 20.60 Montenegro 2010-2015 9.00 Ireland 2010-2015 12.50 Norway 2010-2013 28.00 Italy 2010-2015 31.40 2014-2015 27.00 Latvia 2010-2015 15.00 San Marino 2010-2015 17.00 Lithuania 2010-2015 15.00 Serbia 2010-2012 10.00 Luxembourg 2010 28.59 2013-2015 15.00 2011-2012 28.80 Switzerland 2010-2012 21.17 2013 29.22 2013-2015 21.15 2014-2015 29.20 Ukraine 2010-2011 25.00 Malta 2010-2015 35.00 2012-2013 21.00 Netherlands 2010 25.50 2014-2015 18.00 2011-2015 25.00 Poland 2010-2015 19.00 zero/ no tax countries Portugal 2010-2011 29.00 Anguilla 2010-2015 0.00 2012-2014 31.50 Bahamas 2010-2015 0.00 2015 29.50 Bahrain 2010-2015 0.00 Romania 2010-2015 16.00 Bermuda 2010-2015 0.00 Slovakia 2010-2012 19.00 British Virgin Islands 2010-2015 0.00 2013 23.00 Cayman Island 2010-2015 0.00 2014-2015 22.00 Curacao 2010-2015 0.00 Slovenia 2010-2011 20.00 Monaco 2010-2015 0.00 2012 18.00 United Arab Emirates 2010-2015 0.00 2013-2015 17.00 Spain 2010-2014 30.00 2015 28.00
Notes: Only those countries with firm-level data available are included. This implies that Turks and Caicos Islands are not included. Further, the firm-level data does not allow to clearly identify firms in Guernsey, Isle of Man and Jersey, Additionally, Curacao and the United Arab Emirates are classified as zero/no tax rates based on competing detailed information from PWC worldwide tax summaries.
Source: ZEW study, KPMG corporate tax rate guides, PWC worldwide tax summaries, Scoreboard

European Commission
Aggressive tax planning indicators
165
Table 50: Statutory corporate tax rates Africa, Americas, Caribbean countries
Country Year(s) Statutory tax rate
Country Year(s) Statutory tax rate
African countries Americas and Caribbean countries Algeria 2010-2013 25.00 Antigua and Barbuda 2010-2015 25.00 2014 19.00 Argentina 2010-2015 35.00 2015 23.00 Aruba 2010-2015 28.00 Angola 2010-2014 35.00 Barbados 2010-2015 25.00 2015 30.00 Belize 2010-2015 25.00 Botswana 2010-2011 25.00 Bolivia 2010-2015 25.00 2012-2015 22.00 Brazil 2010-2015 34.00 Burkina Faso 2010-2015 27.50 Canada 2010 30.00 Cameroon 2010-2015 38.50 2011 28.30 Cape Verde 2010-2015 25.00 2012-2013 26.00 Central African Republic 2010-2015 30.00 2014-2015 26.50 Chad 2010-2015 35.00 Chile 2010 17.00 Congo 2010-2015 35.00 2011 20.00 Congo (Brazzaville) 2010-2015 35.00 2012 18.50 Cote d'Ivoire 2010-2015 25.00 2013 18.50 Egypt 2010-2011 20.00 2014 20.00 2012-2014 25.00 2015 22.50 2015 22.50 Columbia 2010-2013 33.00 Ethiopia 2010-2015 30.00 2014-2015 25.00 Gabon 2010-2015 35.00 Costa Rica 2010-2015 30.00 Ghana 2010-2015 25.00 Cuba 2010-2015 30.00 Kenia 2010-2015 30.00 Dominica 2010-2015 25.00 Lesotho 2010-2015 25.00 Dominican Republic 2010-2011 25.00 Liberia 2010-2015 25.00 2012-2013 29.00 Libya 2010-2015 20.00 2014 28.00 Madagascar 2010-2015 20.00 2015 17.00 Malawi 2010-2015 30.00 Ecuador 2010 25.00 Mauretania 2010-2015 25.00 2011 24.00 Morocco 2010-2015 30.00 2012-2013 23.00 Mozambique 2010-2015 32.00 2014-2015 22.00 Namibia 2010 35.00 El Salvador 2010-2015 30.00 2011-2012 34.00 Grenada 2010-2015 30.00 2013-2015 33.00 Guatemala 2010-2013 31.00 Nigeria 2010-2015 30.00 2014 28.00 Senegal 2010-2013 25.00 2015 25.00
2014-2015 30.00 Guyana 2010-2015 30.00
Sierra Leone 2010-2015 30.00 Haiti 2010-2015 30.00 Somalia 2010-2015 28.00 Honduras 2010 30.00 South Africa 2010 28.00 2011-2013 35.00 2011-2013 34.55 2014-2015 30.00 2014-2015 28.00 Jamaica 2010-2012 33.33 Sudan 2010-2015 15.00 2013-2015 25.00 Swaziland 2010-2015 27.50 Mexico 2010-2015 30.00 Tanzania 2010-2015 30.00 Panama 2010 30.00 Togo 2010-2015 17.50 2011-2015 25.00 Tunisia 2010-2013 30.00 Paraguay 2010-2015 10.00 2014-2015 25.00 Peru 2010-2014 30.00 Uganda 2010-2015 30.00 2015 28.00 Zimbabwe 2010 25.00 Puerto Rico 2010-2015 39.00 2011-2015 25.75 St. Kitts & Nevis 2010-2015 33.00 St. Lucia 2010-2015 33.33
St. Vincent and the Grenadines
2010-2015 32.50
Trinidad and Tobago 2010-2015 25.00 United States 2010 39.40 2011-2015 40.00 Uruguay 2010-2015 25.00 Venezuela 2010-2015 34.00
Source: KPMG corporate tax rate guides, own assumptions

European Commission
Aggressive tax planning indicators
166
Table 51: Statutory corporate tax rates Asian, Australia and Oceania countries
Country Year(s) Statutory tax rate
Country Year(s) Statutory tax rate
Asian countries Australia and Oceania Afghanistan 2010-2015 20.00 Australia 2010-2015 30.00 Armenia 2010-2015 20.00 Marshall Islands 2010-2015 3.00 Azerbaijan 2010 20.00 New Zealand 2010 30.00 2011-2015 30.00 2011-2015 28.00 Bangladesh 2010-2015 27.50 Mauritius 2010-2015 15.00 Brunei 2010-2015 20.00 Sri Lanka 2010 35.18 Cambodia 2010-2015 20.00 2011 35.00 China 2010-2015 25.00 2012-2015 28.00 Fiji 2010-2013 28.00 Western Samoa 2010-2015 27.00 2014-2015 20.00 Georgia 2010-2015 15.00 Hong Kong 2010-2015 16.40 India 2010 33.99 2011 32.44 2012-2013 32.45 2014 33.99 2015 34.61 Indonesia 2010-2015 25.00 Iran 2010-2015 25.00 Iraq 2010-2015 15.00 Israel 2010 25.00 2011 24.00 2012-2013 25.00 2014-2015 26.50 Japan 2010 40.80 2011 40.69 2012-2013 38.01 2014 35.64 2015 33.06 Jordan 2010-2015 14.00 Kazakhstan 2010-2015 20.00 Kuwait 2010-2015 15.00 Kyrgystan 2010-2015 10.00 Lebanon 2010-2015 15.00 Macao 2010-2015 12.00 Malaysia 2010-2015 25.00 Mongolia 2010-2015 10.00 Nepal 2010-2015 20.00 North Korea 2010-2015 28.00 Oman 2010-2015 12.00 Pakistan 2010-2013 35.00 2014 34.00 2015 33.00 Philippines 2010-2015 30.00 Qatar 2010-2015 10.00 Russia 2010-2015 20.00 Saudi Arabia 2010-2015 20.00 Singapore 2010-2015 17.00 South Korea 2010-2015 24.20 Syria 2010-2015 28.00 Taiwan 2010-2015 17.00 Tajikistan 2010-2015 14.00 Thailand 2010-2011 30.00 2012-2013 23.00 2014-2015 20.00 Turkey 2010-2015 20.00 Uzbekistan 2010-2015 8.00 Vietnam 2010-2013 25.00 2014-2015 22.00
Source: KPMG corporate tax rate guides, own assumptions

European Commission
Aggressive tax planning indicators
167
Table 52: Tax rates in Patent boxes (2015)
Country Year of introduction Patent box rate Comment
Belgium 2007 6.8
Cyprus 2012 2.5
France 1971 18.34 15 % plus surcharges and local taxes
Hungary 2003 9.5
Italy 2015 21.9 70% of corporate income tax plus local tax
Luxembourg 2008 5.84
Malta 2010 0
Netherlands 2007 5
Spain 2008 17.86 40% of corporate income tax plus local taxes
Portugal 2014 14.75 50 % of corporate income tax plus local taxes
United Kingdom 2013 10
Source: ZEW study and Alstadsæter et al. (2015)

European Commission
Aggressive tax planning indicators
168
Table 53: Country grouping for comparison groups (part1)
Country Country group 1 Country group 2 Country group3 Country group4
Austria Austria Austria EU EU Belgium Belgium Belgium EU EU Bulgaria Bulgaria Bulgaria EU EU Croatia Croatia Croatia EU EU Cyprus Cyprus Cyprus EU EU Czech Republic Czech Republic Czech Republic EU EU Denmark Denmark Denmark EU EU Estonia Estonia Baltics EU EU Finland Finland Finland EU EU France France France EU EU Germany Germany Germany EU EU Greece Greece Greece EU EU Hungary Hungary Hungary EU EU Ireland Ireland Ireland EU EU Italy Italy Italy EU EU Latvia Latvia Baltics EU EU Lithuania Lithuania Baltics EU EU Luxembourg Luxembourg Luxembourg EU EU Malta Malta Malta EU EU Netherlands Netherlands Netherlands EU EU Poland Poland Poland EU EU Portugal Portugal Portugal EU EU Romania Romania Romania EU EU Slovakia Slovakia Slovakia EU EU Slovenia Slovenia Slovenia EU EU Spain Spain Spain EU EU Sweden Sweden Sweden EU EU United Kingdom United Kingdom United Kingdom EU EU Island Island Other European2 Other European2 non EU Moldova Moldova Other European2 Other European2 non EU Norway Norway Other European2 Other European2 non EU Serbia Serbia Other European2 Other European2 non EU Switzerland Switzerland Other European2 Other European2 non EU Ukraine Ukraine Other European2 Other European2 non EU Albania Other European Other European2 Other European2 non EU Andorra Other European Other European2 Other European2 non EU Belarus Other European Other European2 Other European2 non EU Bosnia Herzegovina Other European Other European2 Other European2 non EU Liechtenstein Other European Other European2 Other European2 non EU Macedonia Other European Other European2 Other European2 non EU San Marino Other European Other European2 Other European2 non EU Gibraltar Other European Other European2 Other European2 non EU Montenegro Other European Other European2 Other European2 non EU Bahamas Zero/no tax country Zero/no tax country Zero/no tax country non EU Bahrain Zero/no tax country Zero/no tax country Zero/no tax country non EU Bermuda Zero/no tax country Zero/no tax country Zero/no tax country non EU British Virgin Islands Zero/no tax country Zero/no tax country Zero/no tax country non EU Cayman Island Zero/no tax country Zero/no tax country Zero/no tax country non EU Curacao Zero/no tax country Zero/no tax country Zero/no tax country non EU Monaco Zero/no tax country Zero/no tax country Zero/no tax country non EU United Arab Emirates Zero/no tax country Zero/no tax country Zero/no tax country non EU Burkina Faso Africa, low income Africa Africa non EU Congo Africa, low income Africa Africa non EU Madagascar Africa, low income Africa Africa non EU Malawi Africa, low income Africa Africa non EU Sierra Leone Africa, low income Africa Africa non EU Togo Africa, low income Africa Africa non EU Uganda Africa, low income Africa Africa non EU Zimbabwe Africa, low income Africa Africa non EU Cote d'Ivoire Africa, mid income Africa Africa non EU Ghana Africa, mid income Africa Africa non EU Kenia Africa, mid income Africa Africa non EU Lesotho Africa, mid income Africa Africa non EU Mauretania Africa, mid income Africa Africa non EU Sudan Africa, mid income Africa Africa non EU Tanzania Africa, mid income Africa Africa non EU Zambia Africa, mid income Africa Africa non EU Angola Africa, upper middle income Africa Africa non EU Botswana Africa, upper middle income Africa Africa non EU Namibia Africa, upper middle income Africa Africa non EU Nigeria Africa, upper middle income Africa Africa non EU South Africa South Africa Africa Africa non EU
Source: Own considerations

European Commission
Aggressive tax planning indicators
169
Table 54: Country grouping for comparison groups (part2)
Country Country group 1 Country group 2 Country group3 Country group4
Algeria Mahgreb Africa Africa non EU Morocco Mahgreb Africa Africa non EU Tunisia Mahgreb Africa Africa non EU Antigua and Barbuda Caribbean Caribbean Americas and Caribbean non EU Aruba Caribbean Caribbean Americas and Caribbean non EU Barbados Caribbean Caribbean Americas and Caribbean non EU Dominican Republic Caribbean Caribbean Americas and Caribbean non EU Grenada Caribbean Caribbean Americas and Caribbean non EU Jamaica Caribbean Caribbean Americas and Caribbean non EU St. Kitts & Nevis Caribbean Caribbean Americas and Caribbean non EU St. Lucia Caribbean Caribbean Americas and Caribbean non EU Argentina Argentina Latin America Americas and Caribbean non EU Brazil Brazil Latin America Americas and Caribbean non EU Chile Chile Latin America Americas and Caribbean non EU Columbia Columbia Latin America Americas and Caribbean non EU Costa Rica Costa Rica Latin America Americas and Caribbean non EU Guatemala Guatemala Latin America Americas and Caribbean non EU Panama Panama Latin America Americas and Caribbean non EU El Salvador El Salvador Latin America Americas and Caribbean non EU Uruguay Uruguay Latin America Americas and Caribbean non EU Bolivia Andean countries Latin America Americas and Caribbean non EU Ecuador Andean countries Latin America Americas and Caribbean non EU Paraguay Andean countries Latin America Americas and Caribbean non EU Peru Andean countries Latin America Americas and Caribbean non EU Guyana The Guyanas and Venezuela Latin America Americas and Caribbean non EU Suriname The Guyanas and Venezuela Latin America Americas and Caribbean non EU Venezuela The Guyanas and Venezuela Latin America Americas and Caribbean non EU Canada Canada NAFTA Americas and Caribbean non EU Mexico Mexico NAFTA Americas and Caribbean non EU United States United States NAFTA Americas and Caribbean non EU Trinidad and Tobago Trinidad and Tobago Trinidad and Tobago Americas and Caribbean non EU Honduras other, mid income other, mid income Americas and Caribbean non EU Nicaragua other, mid income other, mid income Americas and Caribbean non EU Japan Japan Japan Asia non EU South Korea South Korea South Korea Asia non EU Russia Russia Russia Asia non EU Turkey Turkey Turkey Asia non EU China China Chinese territories2 Asia non EU Hong Kong Hong Kong Chinese territories2 Asia non EU Taiwan Chinese territories Chinese territories2 Asia non EU India India Pakistan/India Asia non EU Pakistan Pakistan Pakistan/India Asia non EU Malaysia Malaysia Southeast Asia2 Asia non EU Philippines Philippines Southeast Asia2 Asia non EU Singapore Singapore Southeast Asia2 Asia non EU Thailand Thailand Southeast Asia2 Asia non EU Brunei Southeast Asia Southeast Asia2 Asia non EU Indonesia Southeast Asia Southeast Asia2 Asia non EU Vietnam Southeast Asia Southeast Asia2 Asia non EU Armenia Caucasus Caucasus Asia non EU Azerbaijan Caucasus Caucasus Asia non EU Georgia Caucasus Caucasus Asia non EU Egypt Middle East Middle East Asia non EU Iran Middle East Middle East Asia non EU Iraq Middle East Middle East Asia non EU Israel Middle East Middle East Asia non EU Jordan Middle East Middle East Asia non EU Kuwait Middle East Middle East Asia non EU Lebanon Middle East Middle East Asia non EU Oman Middle East Middle East Asia non EU Palestine Middle East Middle East Asia non EU Qatar Middle East Middle East Asia non EU Saudi Arabia Middle East Middle East Asia non EU Kazakhstan Central Asia Central Asia Asia non EU Kyrgyzstan Central Asia Central Asia Asia non EU Tajikistan Central Asia Central Asia Asia non EU Uzbekistan Central Asia Central Asia Asia non EU
Source: Own considerations

European Commission
Aggressive tax planning indicators
170
Table 55: Country grouping for comparison groups (part3)
Country Country group 1 Country group 2 Country group3 Country group4
Afghanistan Other, low income Other, low income Asia non EU Bangladesh Other, low income Other, low income Asia non EU Mongolia Other, low income Other, low income Asia non EU Nepal Other, low income Other, low income Asia non EU Papua New Guinea Other, low income Other, low income Asia non EU Syria Other, low income Other, low income Asia non EU Yemen Other, low income Other, low income Asia non EU Australia Australia Australasia Australasia2 non EU New Zealand New Zealand Australasia Australasia2 non EU Mauritius Indian Ocean Australasia Australasia2 non EU Sri Lanka Indian Ocean Australasia Australasia2 non EU
Source: Own considerations

European Commission
Aggressive tax planning indicators
171
Table 56: Number of observations with consolidated accounts by MNE status
Number of observations
Country Domestic groups Multinational groups
Austria 235 191 Belgium 396 357 Bulgaria 97 7 Croatia 102 23 Cyprus 103 42 Czech Republic 34 8 Denmark 1556 482 Estonia 5 11 Finland 1095 372 France 2783 650 Germany 2855 1145 Greece 280 75 Hungary 47 19 Ireland 474 153 Italy 3019 784 Latvia 101 26 Lithuania 54 4 Luxembourg 32 58 Malta 69 15 Netherlands 4226 675 Poland 771 107 Portugal 337 92 Romania 91 2 Slovakia 23 7 Slovenia 22 24 Spain 1694 492 Sweden 4208 954 United Kingdom 12367 1142
Weighted 37076 7917 Notes: Based on the consolidated accounts from Orbis. The number of observations refers to the firms with consolidated accounts in Orbis.
Source: Orbis data (Bureau van Dijk), own calculations

European Commission
Aggressive tax planning indicators
172
Table 57: Number of observations in dataset by relative tax rate status
Number of firms in Member States which
Country are domestic companies
are NOT in a lower tax country
are in a lower tax country
Austria 18006 6005 25222 Belgium 93611 29755 17399 Bulgaria 24847 1613 7857 Croatia 190163 4351 5075 Cyprus 823 104 621 Czech Republic 42040 10866 36564 Denmark 208341 16801 22751 Estonia 11931 6074 4861 Finland 46630 11683 13152 France 418395 206190 5833 Germany 184510 65277 81681 Greece 8731 4872 6228 Hungary 1806 856 5987 Ireland 19137 757 23842 Italy 318332 80965 50936 Latvia 10196 2281 6419 Lithuania 2650 1033 4218 Luxembourg 7078 8137 9691 Malta 10516 2784 70 Netherlands 386838 16418 51966 Poland 57278 7895 48303 Portugal 62849 11578 10674 Romania 13416 18490 40794 Slovakia 5149 3695 6709 Slovenia 2330 994 1761 Spain 234403 45234 56820 Sweden 212246 25220 32007 United Kingdom 307524 50058 216234 Total 2899776 639986 793675 Notes: A lower tax entity is defined as having an at least 5 %points lower statutory corporate tax compared to the highest statutory tax rates within the MNE group. Pooled over the period 2010 to 2015. The ownership information is from 2013, while tax rate information is from the respective years 2010 to 2015.
Source: Orbis data (Bureau van Dijk), own calculations

European Commission
Aggressive tax planning indicators
173
Table 58: Profitability (PLBT/EMP), by Member States (2010-2015)
Domestic companies Entities within a MNE group in a
higher tax country lower tax country
PLBT/EMP (1000€) No. obs.
PLBT/EMP (1000€) No. obs.
PLBT/EMP (1000€) No. obs.
Country Mean Median Mean Median Mean Median
Austria 61.6 5.9 5983 60.6 6.8 2073 821.7 13.0 9995
Belgium 35.6 6.0 70501 282.4 9.1 21747 520.6 13.9 13877
Bulgaria 3.1 0.4 19201 -35.5 0.3 1262 -78.2 1.5 6290
Croatia 0.6 0.3 120189 -10.5 0.5 3124 -17.4 2.2 3758
Cyprus 19.6 3.7 173 935.5 28.0 25 649.2 9.4 88
Czech Republic 9.2 1.1 23608 10.4 1.8 5909 47.9 4.0 23050
Denmark 66.3 6.3 43072 110.4 11.7 6303 824.9 14.1 10298
Estonia 26.3 2.1 6093 53.7 2.6 3753 87.0 5.7 3592
Finland 52.2 6.0 26928 1.1 6.7 7126 0.3 11.3 8390
France 15.4 5.0 153060 163.4 6.0 85815 554.5 10.4 2645
Germany 97.3 5.2 56781 81.3 8.3 20027 329.7 13.1 33009
Greece 74.5 -0.3 5636 -0.7 0.4 3176 -5.9 2.3 4683
Hungary -0.8 2.2 1163 1023.9 3.6 624 44.3 4.4 4285
Ireland 61.7 3.1 3166 -1.4 9.6 237 3383.8 12.5 8452
Italy -8.5 3.0 187416 -72.4 4.1 48979 5.8 8.1 35396
Latvia -5.4 0.2 7908 4.5 0.3 1738 47.3 2.3 5218
Lithuania 13.2 1.4 1900 51.8 3.0 680 108.9 4.2 3097
Luxembourg -69.0 5.7 712 40.5 25.1 893 1906.7 25.2 1978
Malta 226.2 5.8 617 3065.9 29.1 348 6940.4 54.1 9
Netherlands 185.3 5.6 16435 852.5 9.0 3142 3190.7 18.2 14758
Poland 11.7 1.3 9239 16.4 1.9 1224 20.7 5.3 8564
Portugal 26.0 1.4 42889 89.5 3.4 8484 277.7 5.8 7936
Romania -10.5 0.4 9121 -26.5 0.0 9006 -36.5 1.0 24855
Slovakia 21.3 1.2 3181 31.6 2.4 2656 32.6 4.9 5069
Slovenia -22.1 1.5 1623 -34.1 1.9 771 -3.4 5.4 1468
Spain -3.1 1.8 137633 -31.2 2.6 29417 36.9 5.7 40630
Sweden 80.0 9.1 84343 131.7 10.0 14706 207.5 12.6 20723
United Kingdom 64.2 6.1 89835 325.4 7.7 20676 539.8 11.5 98609
EU 28 27.4 3.0 1128406 105.6 5.0 303921 445.0 7.8 400722 Average 36.9 3.3 254.3 7.0 729.9 10.1
Std. deviation 60.0 2.5 624.1 8.0 1508.4 10.3
High values MT, NL SE, DK, UK, FI, BE, AT
MT, HU, CY MT, CY, LU
MT, IE, NL
MT, LU
Low values LU EL, LV, HR, BG, RO
Notes: Based on the unconsolidated accounts from Orbis. No. obs. refers to firms serving as base for the mean and medians. Higher tax country is defined as not being a lower tax entity, hence includes also companies in MNE groups without a 5 percentage points tax differential within the MNE group.
Source: Orbis data (Bureau van Dijk), own calculations

European Commission
Aggressive tax planning indicators
174
Table 59: Profitability (EBIT/EMP), by Member States (2010-2015)
Domestic companies Entities within a MNE group in a
higher tax country lower tax country
EBIT/EMP (1000€) No. obs.
EBIT/EMP (1000€) No. obs.
EBIT/EMP (1000€) No. obs.
Country Mean Median Mean Median Mean Median
Austria 86.6 6.1 6159 97.0 5.8 2067 288.8 11.5 10071
Belgium 23.1 7.6 70888 33.2 8.7 22114 35.5 11.8 13991
Bulgaria 9.3 0.6 19832 -23.7 0.3 1271 52.2 1.8 6330
Croatia 2.2 0.5 120153 -1.5 1.1 3088 -3.4 3.2 3704
Cyprus 28.7 8.8 172 1214.5 38.0 23 303.6 17.5 82
Czech Republic 6.4 1.4 23663 8.9 2.5 5923 21.6 4.7 23308
Denmark 33.4 7.0 43280 65.9 9.3 6398 145.2 11.8 10422
Estonia 25.4 2.4 6142 55.0 2.7 3759 24.4 5.7 3580
Finland 43.7 6.0 26922 34.3 6.6 7138 46.4 10.8 8468
France 10.0 4.7 155558 31.4 5.4 86999 0.5 8.8 2611
Germany 90.3 5.6 55896 95.4 8.6 20435 148.7 12.2 33617
Greece 85.6 2.1 5734 37.2 3.0 3206 1.7 3.9 4760
Hungary -4.7 2.3 1150 -0.7 2.7 617 90.9 4.7 4327
Ireland 136.1 3.9 3320 169.0 10.9 237 3297.5 13.5 8476
Italy 4.7 5.0 188816 -3.1 5.7 49605 14.0 8.9 35402
Latvia 6.1 0.4 6193 2.4 0.6 1483 28.2 3.3 4469
Lithuania 9.3 1.6 1913 23.0 3.1 691 62.9 4.7 3124
Luxembourg 54.7 5.5 702 951.2 10.8 793 305.8 12.5 1830
Malta 220.3 6.2 609 2492.8 16.5 321 892.5 5.1 7
Netherlands -62.8 4.8 16739 336.8 4.4 3263 343.2 10.3 15612
Poland 12.9 1.5 9363 4.3 1.9 1232 22.3 6.0 8867
Portugal 42.6 2.7 43159 166.4 5.0 8508 307.0 7.1 8143
Romania -1.6 0.6 9314 5.0 0.5 9016 -5.8 1.7 24951
Slovakia 9.6 1.6 3164 9.5 3.0 2646 28.7 5.4 5071
Slovenia 2.6 2.6 1597 -0.3 2.7 744 7.7 5.9 1450
Spain 14.5 3.0 140243 80.7 3.8 30109 114.1 6.5 41465
Sweden 33.2 9.1 85033 45.9 8.1 14955 48.1 11.0 21137
United Kingdom 65.2 6.6 92636 26.0 7.7 20472 114.6 9.5 95560
Total 22.9 3.8 1138350 46.7 5.4 307113 164.0 7.6 400835
Average 35.3 3.9 212.7 6.4 240.6 7.9
Std. deviation 52.8 2.6 528.4 7.3 627.3 4.0 High values MT, IE,
DE SE, CY,
BE, DK, UK MT CY, MT IE, MT CY, IE,
LU, DE
Low values NL LV, HR, BG, RO
RO, BG
Notes: Based on the unconsolidated accounts from Orbis. No. obs. refers to firms serving as base for the mean and medians. Higher tax country is defined as not being a lower tax entity, hence includes also companies in MNE groups without a 5 percentage points tax differential within the MNE group. Total refers to the overall number of observations, respectively the unweighted average and overall median.
Source: Orbis data (Bureau van Dijk), own calculations
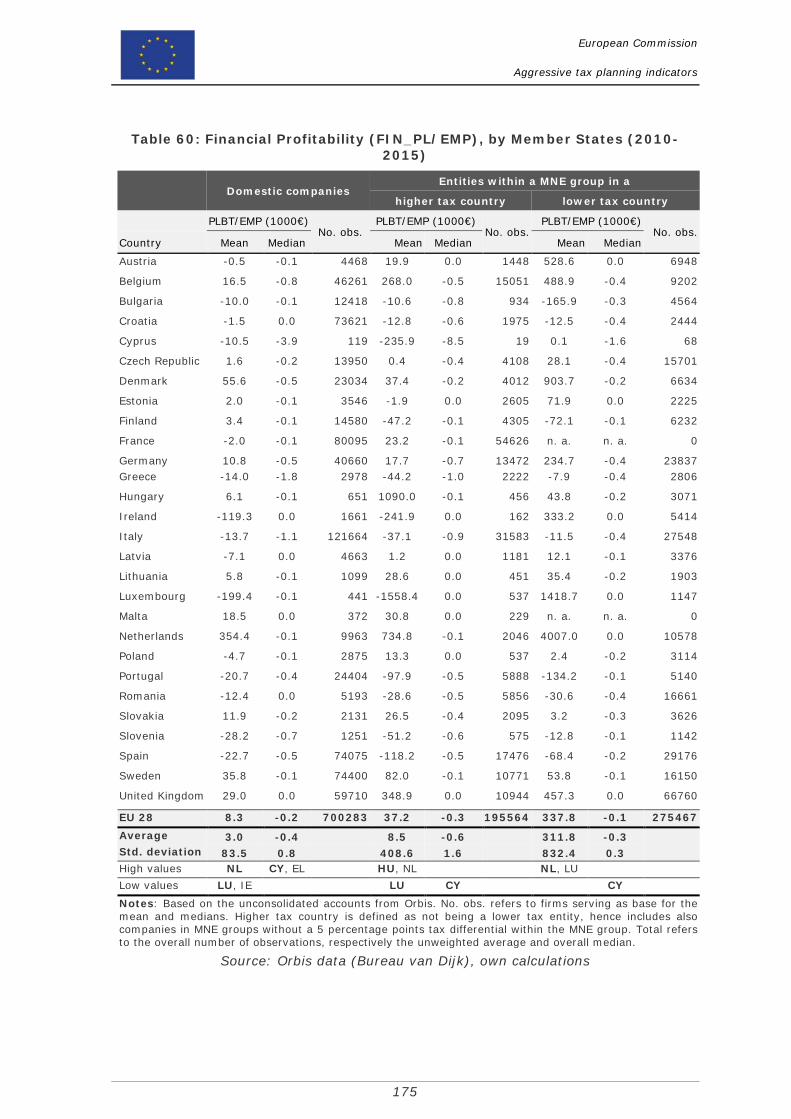
European Commission
Aggressive tax planning indicators
175
Table 60: Financial Profitability (FIN_PL/EMP), by Member States (2010-2015)
Domestic companies Entities within a MNE group in a
higher tax country lower tax country
PLBT/EMP (1000€) No. obs.
PLBT/EMP (1000€) No. obs.
PLBT/EMP (1000€) No. obs.
Country Mean Median Mean Median Mean Median
Austria -0.5 -0.1 4468 19.9 0.0 1448 528.6 0.0 6948
Belgium 16.5 -0.8 46261 268.0 -0.5 15051 488.9 -0.4 9202
Bulgaria -10.0 -0.1 12418 -10.6 -0.8 934 -165.9 -0.3 4564
Croatia -1.5 0.0 73621 -12.8 -0.6 1975 -12.5 -0.4 2444
Cyprus -10.5 -3.9 119 -235.9 -8.5 19 0.1 -1.6 68
Czech Republic 1.6 -0.2 13950 0.4 -0.4 4108 28.1 -0.4 15701
Denmark 55.6 -0.5 23034 37.4 -0.2 4012 903.7 -0.2 6634
Estonia 2.0 -0.1 3546 -1.9 0.0 2605 71.9 0.0 2225
Finland 3.4 -0.1 14580 -47.2 -0.1 4305 -72.1 -0.1 6232
France -2.0 -0.1 80095 23.2 -0.1 54626 n. a. n. a. 0
Germany 10.8 -0.5 40660 17.7 -0.7 13472 234.7 -0.4 23837 Greece -14.0 -1.8 2978 -44.2 -1.0 2222 -7.9 -0.4 2806
Hungary 6.1 -0.1 651 1090.0 -0.1 456 43.8 -0.2 3071
Ireland -119.3 0.0 1661 -241.9 0.0 162 333.2 0.0 5414
Italy -13.7 -1.1 121664 -37.1 -0.9 31583 -11.5 -0.4 27548
Latvia -7.1 0.0 4663 1.2 0.0 1181 12.1 -0.1 3376
Lithuania 5.8 -0.1 1099 28.6 0.0 451 35.4 -0.2 1903
Luxembourg -199.4 -0.1 441 -1558.4 0.0 537 1418.7 0.0 1147
Malta 18.5 0.0 372 30.8 0.0 229 n. a. n. a. 0
Netherlands 354.4 -0.1 9963 734.8 -0.1 2046 4007.0 0.0 10578
Poland -4.7 -0.1 2875 13.3 0.0 537 2.4 -0.2 3114
Portugal -20.7 -0.4 24404 -97.9 -0.5 5888 -134.2 -0.1 5140
Romania -12.4 0.0 5193 -28.6 -0.5 5856 -30.6 -0.4 16661
Slovakia 11.9 -0.2 2131 26.5 -0.4 2095 3.2 -0.3 3626
Slovenia -28.2 -0.7 1251 -51.2 -0.6 575 -12.8 -0.1 1142
Spain -22.7 -0.5 74075 -118.2 -0.5 17476 -68.4 -0.2 29176
Sweden 35.8 -0.1 74400 82.0 -0.1 10771 53.8 -0.1 16150
United Kingdom 29.0 0.0 59710 348.9 0.0 10944 457.3 0.0 66760
EU 28 8.3 -0.2 700283 37.2 -0.3 195564 337.8 -0.1 275467 Average 3.0 -0.4 8.5 -0.6 311.8 -0.3 Std. deviation 83.5 0.8 408.6 1.6 832.4 0.3 High values NL CY, EL HU, NL NL, LU Low values LU, IE LU CY CY
Notes: Based on the unconsolidated accounts from Orbis. No. obs. refers to firms serving as base for the mean and medians. Higher tax country is defined as not being a lower tax entity, hence includes also companies in MNE groups without a 5 percentage points tax differential within the MNE group. Total refers to the overall number of observations, respectively the unweighted average and overall median.
Source: Orbis data (Bureau van Dijk), own calculations

European Commission
Aggressive tax planning indicators
176
Table 61: Number of observations in dataset, by Member States (2010-2015)
Observations in final dataset Country Subsidiaries Owner Total
Austria 29255 1972 31227 Belgium 43946 3208 47154 Bulgaria 9369 98 9467 Croatia 9044 382 9426 Cyprus 541 127 668 Czech Republic 46642 785 47427 Denmark 36609 2928 39537 Estonia 10314 381 10695 Finland 22290 2544 24834 France 207014 5005 212019 Germany 139514 7440 146954 Greece 10885 215 11100 Hungary 6481 362 6843 Ireland 23530 966 24496 Italy 125589 6282 131871 Latvia 8281 402 8683 Lithuania 5043 208 5251 Luxembourg 15472 2334 17806 Malta 2313 481 2794 Netherlands 63557 4823 68380 Poland 55697 501 56198 Portugal 21322 930 22252 Romania 58788 77 58865 Slovakia 9818 585 10403 Slovenia 2562 191 2753 Spain 96928 5126 102054 Sweden 49882 7276 57158 United Kingdom 261777 3942 265719
Total 1372463 59571 1432034 Notes: Based on the unconsolidated accounts in ORBIS and pooled over the years 2010 to 2015. A total of 251,744 firms in 55,373 corporate groups.
Source: Orbis data (Bureau van Dijk), own calculations

European Commission
Aggressive tax planning indicators
177
Table 62: Roles ATP structures using interest payments, by Member States
Subsidiaries Headquarter Country target lower tax conduit target lower tax conduit Austria 300 2762 12762 41 126 523 Belgium 5551 2025 15293 281 36 687 Bulgaria 0 1632 2510 0 15 17 Croatia 133 291 2817 5 0 60 Cyprus 0 5 178 0 4 22 Czech Republic 78 4314 12924 9 17 41 Denmark 369 1979 12817 66 54 691 Estonia 196 187 2573 4 0 36 Finland 583 1295 8054 35 64 263 France 43153 0 65552 374 0 1243 Germany 3362 6004 53204 161 286 1922 Greece 235 843 3373 8 1 27 Hungary 61 679 3330 4 1 23 Ireland 0 2008 10795 0 43 105 Italy 6954 9996 37336 302 298 1349 Latvia 4 860 2058 0 31 16 Lithuania 0 235 1464 0 1 22 Luxembourg 255 894 5075 37 38 411 Malta 153 0 814 9 0 54 Netherlands 142 2511 30233 17 13 718 Poland 97 6991 18702 1 32 47 Portugal 1112 1319 6606 36 7 113 Romania 84 5134 10184 3 2 8 Slovakia 140 806 2992 9 2 22 Slovenia 107 350 989 9 8 57 Spain 3203 6831 33801 161 196 755 Sweden 2005 4083 20309 129 284 1012 United Kingdom 1828 20274 112431 12 101 537 Total 70105 84308 489176 1713 1660 10781
Strict classification: Entities (subsidiaries and headquarters) classified as Country target entity lower tax entity conduit entity Austria 10 47 0 Belgium 89 34 0 Bulgaria 0 4 0 Cyprus 0 1 0 Czech Republic 0 5 0 Estonia 0 0 3 Ireland 0 2 50 Latvia 0 2 0 Luxembourg 1 6 138 Malta 0 0 2 Slovenia 1 3 0 Total 101 104 193
Notes: Based on the unconsolidated accounts in Orbis, pooled over the years 2010-2015. Entries refer to the number of entities, i.e. the sum of subsidiaries and owners.
Source: Orbis data (Bureau van Dijk), own calculations

European Commission
Aggressive tax planning indicators
178
Table 63: Roles hybrid loan ATP structure, by Member States
Strict classification Standard classification Country target lower tax conduit target lower tax conduit
Austria 11 n.a. 0 534 n.a. 10472 Belgium 111 n.a. 0 7807 n.a. 17385 Bulgaria 0 n.a. 0 239 n.a. 2008 Croatia 0 n.a. 0 211 n.a. 2442 Cyprus 0 n.a. 0 0 n.a. 143 Czech Republic 0 n.a. 0 1086 n.a. 10620 Denmark 0 n.a. 0 1203 n.a. 12987 Estonia 0 n.a. 0 511 n.a. 2651 Finland 0 n.a. 0 1883 n.a. 8987 France 0 n.a. 0 47237 n.a. 64684 Germany 0 n.a. 0 4424 n.a. 44473 Greece 0 n.a. 0 351 n.a. 3232 Hungary 0 n.a. 0 122 n.a. 3142 Ireland 0 n.a. 7 54 n.a. 8067 Italy 0 n.a. 0 10503 n.a. 40651 Latvia 0 n.a. 0 159 n.a. 1919 Lithuania 0 n.a. 0 64 n.a. 1426 Luxembourg 1 n.a. 61 513 n.a. 5101 Malta 0 n.a. 0 176 n.a. 562 Netherlands 0 n.a. 0 409 n.a. 24023 Poland 0 n.a. 0 637 n.a. 16634 Portugal 0 n.a. 0 2328 n.a. 7569 Romania 0 n.a. 0 948 n.a. 8661 Slovakia 0 n.a. 0 531 n.a. 3002 Slovenia 1 n.a. 0 187 n.a. 935 Spain 0 n.a. 0 6677 n.a. 33604 Sweden 0 n.a. 0 5580 n.a. 23404 United Kingdom 0 n.a. 0 4423 n.a. 84439
Total 124 n.a. 68 98797 n.a. 443223 Notes: Based on the unconsolidated accounts in Orbis, pooled over the years 2010-2015. Entries refer to the number of entities, i.e. the sum of subsidiaries and owners.
Source: Orbis data (Bureau van Dijk), own calculations

European Commission
Aggressive tax planning indicators
179
Table 64: Roles transfer pricing ATP structure, by Member States
Strict classification Standard classification Country target lower tax conduit target lower tax conduit
Austria 0 0 0 1023 7498 17456 Belgium 0 7 0 13149 7658 16549 Bulgaria 0 0 0 0 4327 2793 Croatia 0 0 0 944 2616 2846 Cyprus 0 0 0 0 78 350 Czech Republic 0 0 0 250 19211 13346 Denmark 0 0 0 2916 10689 13712 Estonia 0 0 0 1102 2673 2494 Finland 0 0 0 2339 6278 8173 France 0 0 0 89166 2339 76975 Germany 0 0 0 9629 17909 80886 Greece 0 0 0 748 2825 3916 Hungary 0 0 0 210 2690 3324 Ireland 0 0 8 0 8476 13384 Italy 0 0 0 22519 24887 40450 Latvia 0 0 0 8 3396 2270 Lithuania 0 0 0 9 2100 1727 Luxembourg 0 0 0 763 2675 7709 Malta 0 0 0 683 30 1226 Netherlands 0 0 0 995 10101 41301 Poland 0 0 0 285 25216 19832 Portugal 0 0 0 2326 5440 6322 Romania 0 0 0 342 25019 11742 Slovakia 0 0 0 283 3570 2945 Slovenia 0 0 0 319 963 950 Spain 0 0 0 9126 25884 36305 Sweden 0 0 0 4618 12192 22814 United Kingdom 0 0 0 7637 67858 146452
Total 0 7 8 171389 304598 598249 Notes: Based on the unconsolidated accounts in Orbis, pooled over the years 2010-2015. Entries refer to the number of entities, i.e. the sum of subsidiaries and owners.
Source: Orbis data (Bureau van Dijk), own calculations

European Commission
Aggressive tax planning indicators
180
Table 65: Roles intellectual property ATP structure, by Member States
Strict classification Standard classification Country target lower tax conduit target lower tax conduit
Austria 0 62 0 445 4449 16916 Belgium 2 3 0 7386 2627 21976 Bulgaria 0 0 0 0 1908 2942 Croatia 0 4 0 392 1077 3202 Cyprus 0 0 0 0 26 260 Czech Republic 0 4 0 102 6594 14943 Denmark 0 0 0 1211 2056 17182 Estonia 0 0 0 418 651 3163 Finland 0 0 0 882 2943 10622 France 0 0 0 57501 778 94995 Germany 0 0 0 4018 11353 73107 Greece 0 0 0 492 1287 4701 Hungary 0 0 0 97 1410 4186 Ireland 0 3 10 0 1132 14835 Italy 0 0 0 10222 15750 49970 Latvia 0 0 0 8 1011 2416 Lithuania 0 0 0 4 1063 1870 Luxembourg 0 3 154 368 602 7285 Malta 0 0 5 353 0 964 Netherlands 0 0 0 336 1771 38808 Poland 0 0 0 161 11040 22608 Portugal 0 0 0 1526 1758 9102 Romania 0 0 0 158 9015 11662 Slovakia 0 0 0 164 1373 3813 Slovenia 0 5 0 158 620 1017 Spain 0 0 0 4539 12667 43806 Sweden 0 0 0 2529 3314 28146 United Kingdom 0 0 0 2539 11537 155806
Total 2 84 169 96009 109812 660303 Notes: Based on the unconsolidated accounts in Orbis, pooled over the years 2010-2015. Entries refer to the number of entities, i.e. the sum of subsidiaries and owners.
Source: Orbis data (Bureau van Dijk), own calculations

European Commission
Aggressive tax planning indicators
181
Table 66: Roles in patent box ATP structure, by Member States
Strict classification Standard classification Country target lower tax conduit target lower tax conduit
Austria 0 0 0 181 0 3241 Belgium 0 0 0 0 247 5569 Bulgaria 0 0 0 0 0 503 Croatia 0 0 0 0 0 681 Cyprus 0 0 0 0 0 15 Czech Republic 0 0 0 19 0 3610 Denmark 0 0 0 98 0 3045 Estonia 0 0 0 0 0 406 Finland 0 0 0 130 0 2050 France 0 0 0 0 819 35206 Germany 0 0 0 1162 0 17275 Greece 0 0 0 1 0 786 Hungary 0 0 0 0 6 1403 Ireland 0 0 0 19 0 2546 Italy 0 0 0 0 0 7748 Latvia 0 0 0 0 0 432 Lithuania 0 0 0 0 0 289 Luxembourg 0 0 62 0 26 1304 Malta 0 0 0 0 1 237 Netherlands 0 0 0 0 118 7208 Poland 0 0 0 11 0 4919 Portugal 0 0 0 3 4 1824 Romania 0 0 0 0 0 2144 Slovakia 0 0 0 1 0 1182 Slovenia 0 0 0 0 0 208 Spain 0 0 0 0 241 9557 Sweden 0 0 0 239 0 5489 United Kingdom 0 0 0 352 381 28266
Total 0 0 62 2216 1843 147143
Notes: Based on the unconsolidated accounts in Orbis, pooled over the years 2010-2015. Entries refer to the number of entities, i.e. the sum of subsidiaries and owners.
Source: Orbis data (Bureau van Dijk), own calculations

TAXATION PAPERS
Taxation Papers can be accessed and downloaded free of charge at the following address: http://ec.europa.eu/taxation_customs/taxation/gen_info/economic_analysis/tax_papers/index_en.htm The following papers have been issued. Taxation paper No 70 (2017): Literature review on taxation, entrepreneurship and collaborative economy. Written by Dondena (project leader), CASE - Center for Social and Economic Research, Warsaw, IEB, PwC Taxation paper No 69 (2017): Towards a European R&D Incentive? An assessment of R&D Provisions under a Common Corporate Tax Base Final Report. Written by Diego D'Andria, Dimitris Pontikakis, Agnieszka Skonieczna Taxation paper No 68 (2017): Effectiveness of tax incentives for venture capital and business angels to foster the investment of SMEs and start-ups. Final Report. Written by PWC, HIS, CASE Taxation paper No 67 (2017): Tax Uncertainty: Economic Evidence and Policy Responses. Written by Ernesto Zangari, Antonella Caiumi, Thomas Hemmelgarn Taxation paper No 66 (2016): Modelling corporate tax reform in the EU: New calibration and simulations with the CORTAX model. Written by Joint Research Center of the European Commission - IPTS Taxation paper No 65 (2016): The Effects of Tax Reforms to Address the Debt-Equity Bias on the Cost of Capital and on Effective Tax Rates. Written by Centre For European Economic Research (ZEW) Gmbh Taxation paper No 64 (2016): The Impact of Tax Planning on Forward-Looking Effective Tax Rates. Written by Centre For European Economic Research (ZEW) Gmbh Taxation paper No 63 (2016): Study on The Effect of Inflation and Interest Rates on Forward-Looking Effective Tax Rates. Written by Centre For European Economic Research (ZEW) Gmbh Taxation paper No 62 (2016): Financial Transaction Taxes in the European Union. Written by Thomas Hemmelgarn, Gaëtan Nicodème, Bogdan Tasnadi and Pol Vermote Taxation paper No 61 (2016): Study on Structures of Aggressive Tax Planning and Indicators. Final report. Written by Ramboll Management Consulting and Corit Advisory Taxation paper No 60 (2015): Wealth distribution and taxation in EU Members. Written by Anna Iara Taxation paper No 59 (2015): Tax Shifts. Written by Milena Mathé, Gaëtan Nicodème and Savino Ruà Taxation paper No 58 (2015): Tax Reforms in EU Member States: 2015 Report. Written by Directorate General for Taxation and Customs Union and Directorate General for Economic and Financial Affairs Taxation Paper No 57 (2015): Patent Boxes Design, Patents Location and Local R&D Written by Annette Alstadsæter, Salvador Barrios, Gaetan Nicodeme, Agnieszka Maria Skonieczna and Antonio Vezzani Taxation Paper No 56 (2015): Study on the effects and incidence of labour taxation. Final Report. Written by CPB in consortium with: CAPP, CASE, CEPII, ETLA, IFO, IFS, IHS. Taxation Paper No 55 (2015): Experiences with cash-flow taxation and prospects. Final report. Written by Ernst & Young

Taxation Paper No 54 (2015): Revenue for EMU: a contribution to the debate on fiscal union. Written by Anna Iara Taxation Paper No 53 (2015): An Assessment of the Performance of the Italian Tax Debt Collection System. Written by Margherita Ebraico and Savino Ruà Taxation Paper No 52 (2014): A Study on R&D Tax Incentives. Final report. Written by CPB in consortium with: CAPP, CASE, CEPII, ETLA, IFO, IFS, IHS. Taxation Paper No 51 (2014): Improving VAT compliance – random awards for tax compliance. Written by Jonas Fooken, Thomas Hemmelgarn, Benedikt Herrmann Taxation Paper No 50 (2014): Debt Bias in Corporate Taxation and the Costs of Banking Crises in the EU. Written by Sven Langedijk, Gaëtan Nicodème,
Andrea Pagano, Alessandro Rossi
Taxation Paper No 49 (2014): A wind of change? Reforms of Tax Systems since the launch of Europe 2020. Written by Gaëlle Garnier , Endre György, Kees Heineken, Milena Mathé, Laura Puglisi, Savino Ruà, Agnieszka Skonieczna and Astrid Van Mierlo Taxation Paper No 48 (2014): Tax reforms in EU Member States: 2014 Report. Written by Directorate-General for Taxation and Customs Union and Directorate-General for Economic and Financial Affairs, European Commission Taxation Paper No 47 (2014): Fiscal Devaluations in the Euro Area: What has been done since the crisis? Written by Laura Puglisi Taxation Paper No 46 (2014): Tax Compliance Social Norms and Institutional Quality: An Evolutionary Theory of Public Good Provision. Written by Panayiotis Nicolaides Taxation Paper No 45 (2014): Effective Corporate Taxation, Tax Incidence and Tax Reforms: Evidence from OECD Countries. Written by Salvador Barrios, Gaëtan Nicodème, Antonio Jesus Sanchez Fuentes Taxation Paper No 44 (2014): Addressing the Debt Bias: A Comparison between the Belgian and the Italian ACE Systems. Written by Ernesto Zangari Taxation Paper No 43 (2014): Financial Activities Taxes, Bank Levies and Systemic Risk. Written by Giuseppina Cannas, Jessica Cariboni, Massimo Marchesi, Gaëtan Nicodème, Marco Petracco Giudici, Stefano Zedda Taxation Paper No 42 (2014): Thin Capitalization Rules and Multinational Firm Capital Structure. Written by Jennifer Blouin, Harry Huizinga, Luc Laeven and Gaëtan Nicodème Taxation Paper No 41 (2014): Behavioural Economics and Taxation. Written by Till Olaf Weber, Jonas Fooken and Benedikt Herrmann. Taxation Paper No 40 (2013): A Review and Evaluation of Methodologies to Calculate Tax Compliance Costs. Written by The Consortium consisting of Ramboll Management Consulting, The Evaluation Partnership and Europe Economic Research Taxation Paper No 39 (2013): Recent Reforms of Tax Systems in the EU: Good and Bad News. Written by Gaëlle Garnier, Aleksandra Gburzynska, Endre György, Milena Mathé, Doris Prammer, Savino Ruà, Agnieszka Skonieczna. Taxation Paper No 38 (2013): Tax reforms in EU Member States: Tax policy challenges for economic growth and fiscal sustainability, 2013 Report. Written by Directorate-General for Taxation and Customs Union and Directorate-General for Economic and Financial Affairs, European Commission Taxation Paper No 37 (2013): Tax Reforms and Capital Structure of Banks. Written by Thomas Hemmelgarn and Daniel Teichmann

Taxation Paper No 36 (2013): Study on the impacts of fiscal devaluation. Written by a consortium under the leader CPB Taxation Paper No 35 (2013): The marginal cost of public funds in the EU: the case of labour versus green taxes Written by Salvador Barrios, Jonathan Pycroft and Bert Saveyn Taxation Paper No 34 (2012): Tax reforms in EU Member States: Tax policy challenges for economic growth and fiscal sustainability. Written by Directorate-General for Taxation and Customs Union and Directorate-General for Economic and Financial Affairs, European Commission. Taxation Paper No 33 (2012): The Debt-Equity Tax Bias: consequences and solutions. Written by Serena Fatica, Thomas Hemmelgarn and Gaëtan Nicodème Taxation Paper No 32 (2012): Regressivity of environmental taxation: myth or reality? Written by Katri Kosonen Taxation Paper No 31 (2012): Review of Current Practices for Taxation of Financial Instruments, Profits and Remuneration of the Financial Sector. Written by PWC Taxation Paper No 30 (2012): Tax Elasticities of Financial Instruments, Profits and Remuneration. Written by Copenhagen Economics. Taxation Paper No 29 (2011): Quality of Taxation and the Crisis: Tax shifts from a growth perspective. Written by Doris Prammer. Taxation Paper No 28 (2011): Tax reforms in EU Member States. Written by European Commission Taxation Paper No 27 (2011): The Role of Housing Tax Provisions in the 2008 Financial Crisis. Written by Thomas Hemmelgarn, Gaetan Nicodeme, and Ernesto Zangari Taxation Paper No 26 (2010): Financing Bologna Students' Mobility. Written by Marcel Gérard. Taxation Paper No 25 (2010): Financial Sector Taxation. Written by European Commission. Taxation Paper No 24 (2010): Tax Policy after the Crisis – Monitoring Tax Revenues and Tax Reforms in EU Member States – 2010 Report. Written by European Commission. Taxation Paper No 23 (2010): Innovative Financing at a Global Level. Written by European Commission. Taxation Paper No 22 (2010): Company Car Taxation. Written by Copenhagen Economics. Taxation Paper No 21 (2010): Taxation and the Quality of Institutions: Asymmetric Effects on FDI. Written by Serena Fatica. Taxation Paper No 20 (2010): The 2008 Financial Crisis and Taxation Policy. Written by Thomas Hemmelgarn and Gaëtan Nicodème. Taxation Paper No 19 (2009): The role of fiscal instruments in environmental policy.' Written by Katri Kosonen and Gaëtan Nicodème. Taxation Paper No 18 (2009): Tax Co-ordination in Europe: Assessing the First Years of the EU-Savings Taxation Directive. Written by Thomas Hemmelgarn and Gaëtan Nicodème. Taxation Paper No 17 (2009): Alternative Systems of Business Tax in Europe: An applied analysis of ACE and CBIT Reforms. Written by Ruud A. de Mooij and Michael P. Devereux. Taxation Paper No 16 (2009): International Taxation and multinational firm location decisions. Written by Salvador Barrios, Harry Huizinga, Luc Laeven and Gaëtan Nicodème.

Taxation Paper No 15 (2009): Corporate income tax and economic distortions. Written by Gaëtan Nicodème. Taxation Paper No 14 (2009): Corporate tax rates in an enlarged European Union. Written by Christina Elschner and Werner Vanborren. Taxation Paper No 13 (2008): Study on reduced VAT applied to goods and services in the Member States of the European Union. Final report written by Copenhagen Economics. Taxation Paper No 12 (2008): The corporate income tax rate-revenue paradox: evidence in the EU. Written by Joanna Piotrowska and Werner Vanborren. Taxation Paper No 11 (2007): Corporate tax policy and incorporation in the EU. Written by Ruud A. de Mooij and Gaëtan Nicodème. Taxation Paper No 10 (2007): A history of the 'Tax Package': The principles and issues underlying the Community approach. Written by Philippe Cattoir. Taxation Paper No 9 (2006): The Delineation and Apportionment of an EU Consolidated Tax Base for Multi-jurisdictional Corporate Income Taxation: a Review of Issues and Options. Written by Ana Agúndez-García. Taxation Paper No 8 (2005): Formulary Apportionment and Group Taxation in the European Union: Insights from the United States and Canada. Written by Joann Martens Weiner. Taxation Paper No 7 (2005): Measuring the effective levels of company taxation in the new member States : A quantitative analysis. Written by Martin Finkenzeller and Christoph Spengel. Taxation Paper No 6 (2005): Corporate income tax and the taxation of income from capital. Some evidence from the past reforms and the present debate on corporate income taxation in Belgium. Written by Christian Valenduc. Taxation Paper No 5 (2005): An implicit tax rate for non-financial corporations: Definition and comparison with other tax indicators. Written by Claudius Schmidt-Faber. Taxation Paper No 4 (2005): Examination of the macroeconomic implicit tax rate on labour derived by the European Commission. Written by Peter Heijmans and Paolo Acciari. Taxation Paper No 3 (2005): European Commission Staff Working Paper. Taxation Paper No 2 (2004): VAT indicators. Written by Alexandre Mathis. Taxation Paper No 1 (2004): Tax-based EU own resources: an assessment. Written by Philippe Cattoir.

HOW TO OBTAIN EU PUBLICATIONS
Free publications: • one copy:
via EU Bookshop (http://bookshop.europa.eu);
• more than one copy or posters/maps: from the European Union’s representations (http://ec.europa.eu/represent_en.htm); from the delegations in non-EU countries (http://eeas.europa.eu/delegations/index_en.htm); by contacting the Europe Direct service (http://europa.eu/contact/index_en.htm) or calling 00 800 6 7 8 9 10 11 (freephone number from anywhere in the EU) (*). (*) The information given is free, as are most calls (though some operators, phone boxes or hotels may charge you).
Priced publications: • via EU Bookshop (http://bookshop.europa.eu).

KP-A
C-17-071-EN-C
ISBN 978-92-79-75355-8 doi:10.2778/822243