taxi mystery shopping/media/busind/taxiandlimousine/pdfmystery... · taxi mystery shopping summary...
TRANSCRIPT

Taxi Mystery ShoppingSummary Report
December 2011
Please direct any queries to [email protected] Morgan Research – Level 2, 26 Wharf St., Brisbane QLD 4000
Telephone: (07)3318 7003© Roy Morgan Research

© 2011 Roy Morgan Research 1
Index
10Overall Performance
11Taxi Company Service
9Key Performance Indicators (KPIs)
10Results
2Introduction
6Breakdown of Journeys
Taxi Characteristics 14
Driver Service/ Characteristics 21
Safety 37
Fares 43
Processing of Fares 49
Journey Experience 55
Summary 58

© 2011 Roy Morgan Research 2
INTRODUCTION
Background
Taxi services are an integral part of Queensland’s public transport network. There were 82 million passenger journeys taken in Queensland taxis in 2010, making taxi travel one of the most frequently used public transport services in Queensland.
The Department of Transport and Main Roads acts as a regulator for the taxi industry. The Department’s Queensland Taxi Strategic Plan 2010-2015 (TSP) aims to address standards in the Queensland taxi system.
The aims of the TSP are to ensure that the Queensland taxi system is Safe, Reliable, Accountable, Customer Focused, Commercially Viable and Green. This research focuses on the safety, reliability and customer focus of Queensland taxis.
Research Objectives
This research aims to assess the customer service performance of the QLD taxi industry. The data presented in this report provides valuable insight into the effectiveness of actions implemented as part of the TSP. The use of Key Performance Indicators (KPIs) provides baseline measures to allow the Department to easily track changes in the performance of the taxi industry over time.

© 2011 Roy Morgan Research 3
Introduction
Methodology
The performance of the Queensland Taxi Industry was evaluated using a mystery shopping methodology. The mystery shops were conducted over a one month period from the 8th of September to the 9th of October 2011. Mystery shoppers completed a checklist style questionnaire which assessed details of the journey including customer service, appearance and presentation, fares and overcharging, and the overall experience.
The questions were designed to capture information about the following aspects of the typical passenger journey:
• Journey Details• Customer Service• Appearance of Vehicle and Driver• Fares and Overcharging• Overall Experience
Mystery shoppers took trips in taxis between various origins and destinations (categorised as home, work, hotel, venue, appointment, transport hub, business, shop or attraction). Once the journey was completed the passenger filled out the questionnaire away from the taxi and out of sight of the driver.
Quotas were set for the number of mystery shops to be conducted at different times of day. This ensured that the results would be representative of the performance of taxis across all 24 hours of operation per day.
Some mystery shops were conducted by people with a disability recruited through the Queenslanders with Disability Network (QDN).

© 2011 Roy Morgan Research 4
1265 mystery shops were conducted overall across Brisbane, Ipswich, Redcliffe, Gold Coast, Sunshine Coast, Toowoomba, Mackay, Townsville, Cairns and Rockhampton. 68 of these mystery shops were conducted by mystery shoppers with disability (QDN members).
Mystery shopping quotas were based on the number of taxis licensed in each taxi service area and on obtaining a sufficient sample size in each area to provide statistically reliable results. Because of uncertainty in the number of mystery shops conducted by people with disability that would be achieved in each area, some quotas were exceeded, while others were not met (albeit by only a small number of shops in each).
Introduction
12651202Total Sample
8375Rockhampton
123125Cairns
111125Townsville
8775Mackay
100100Toowoomba
140126Sunshine Coast
162176Gold Coast
95100Redcliffe
102100Ipswich
262200Brisbane
SampleObtained
QuotaSetREGION

© 2011 Roy Morgan Research 5
The maximum margin of error for results from a sample of n=1265 is ± 2.74 (95% confidence interval). The margins of error for each region evaluated are shown below. These margins are based on the estimated number of trips taken in each region per month, derived from total journeys per month in QLD and number of taxis operating in each region.
Significant differences in results between variables used for analysis are represented as follows:• Percentage is significantly higher than the total percentage for all journeys (at 95% confidence interval) = • Percentage is significantly lower than the total percentage for all journeys (at 95% confidence interval) =
Comparisons between regions and taxis types have been included in graphical format only if a significant difference exists between sub-groups. Figures reported throughout may not sum to 100% due to rounding.
Introduction
±2.74%Total QLD
±10.82%Rockhampton
±8.87%Cairns
±9.34%Townsville
±10.56%Mackay
±9.84%Toowoomba
±8.31%Sunshine Coast
±7.72%Gold Coast
±10.1%Redcliffe
±9.75%Ipswich
±6.06%Brisbane
Margin of ErrorREGION

© 2011 Roy Morgan Research 6
BREAKDOWN OF JOURNEYS
• Mystery shops were conducted by people with disability (QDN members) in Brisbane (29 trips), Sunshine Coast (11 trips), Toowoomba (5 trips), Mackay (7 trips) and Cairns (16 trips).
• 50% of journeys were evaluated with shoppers posing as locals using the taxi for recreational or everyday use; 18% were evaluated as a local business person; 18% as a recreational visitor; and 12% as a business visitor.
• The road conditions were normal for 70% of the journeys evaluated; low traffic for 21%; high traffic for 7%; and wet/raining for 2% of journeys.
• A spread of various origin and destination points were included in the project. The most common origins assessed were from home (25%), shop (22%) and venue (15%). Home (24%), shop (19%) and venue (14%) were also the most frequently visited destinations.
• Journeys were spread across the days of the week with 75% of trips taken on weekdays, and 25% on weekends.• Starting time of the trip was distributed across all time frames, with the majority of trips taken between 7am and
11pm (83%).• Overall 64% of trips were booked (51% for immediate pick-up; 13% booked in advance) and 36% were hailed
(from a rank – 29%; or the road – 7%).• Approximately a fifth of taxi journeys were with Black & White cabs (20%) and almost one quarter with Yellow
cabs (23%). Over half of journeys were with cabs defined as “Other” (55%). This “Other” category includes any taxi company that is not Black & White or Yellow (including Gold Coast Cabs, Suncoast Cabs etc.).

© 2011 Roy Morgan Research 7
Breakdown of Journeys
• The majority of journeys were taken in standard taxis (75%) with a further 20% taken with Wheelchair accessible/high occupancy taxis. The proportion of journeys taken in luxury/ premium taxis was small (3%) due to the smaller incidence of use of these taxis. 2% of journeys were taken in “other” taxi types (e.g. people movers which are not wheelchair accessible).
• In the majority of journeys a flag fall was showing on the meter at the start of the journey (94%).• The average duration of a taxi journey was 16.2 minutes.• 37% of trips were short (1-10 minutes), 48% were average (11-25 minutes) and 15% were long (over
26 minutes).• The majority of trips were charged at Tariff 1 (53%) and Tariff 2 (37%).• Different payment methods were used to pay fares - 45% of payments were made with cash, 39% with
a credit/debit card, 15% with a Cabcharge voucher and 5% with a TSS Card (please note that the TSS card was used in combination with a cash, credit/debit, or Cabcharge voucher payment). Journeys of varying distances and costs were included in the research.
• The majority of journeys cost less than $25 (60%).• At least one legitimate fee was charged for 74% of the journeys evaluated. The most commonly
charged fees were the merchant fee (for customers making an electronic payment) and booking fee.

© 2011 Roy Morgan Research 8
Breakdown of Journeys
Duration n=12651-5mins 10%6-10 mins 26%11-15 mins 19%16-20 mins 19%21-25 mins 10%26-30 mins 7%31-40 mins 6%More than 40 mins 2%Mean 16%Origin n=1265Home 25%Shop 22%Venue 15%Hotel 9%Transport Hub 9%Appointment 8%Business 6%Attraction 4%Work 3%Destination n=1265Home 24%Shop 19%Venue 14%Hotel 9%Appointment 9%Transport Hub 8%Business 7%Work 5%Attraction 5%
Region n=1265Brisbane 21%Ipswich 8%Redcliffe 8%Gold Coast 13%Sunshine Coast 11%Toowoomba 8%Mackay 7%Townsville 9%Cairns 10%Rockhampton 7%Day n=1265Monday 12%Tuesday 17%Wednesday 16%Thursday 15%Friday 14%Saturday 12%Sunday 13%Week days 75%Weekends 25%Time n=12653:01-7:00am 9%7:01-11:00am 19%11:01am-3:00pm 21%3:01-7:00pm 24%7:01-11:00pm 19%11:01pm-3:00pm 8%
A1 - Passenger Scenario n=1265Recreational/Everyday Local 50%Business Local 18%Recreational Visitor 18%Business Visitor 12%A5 - How Taxi Obtained n=1265Booked 64%Hailed 36%A2 - Taxi Company n=1265Black & White 20%Yellow 23%Other 55%No Answer 2%A4 - Taxi Type n=1265Standard 75%Wheelchair Accessible/ High O 20%Luxury/ Premium 3%Other 1%No Answer 2%C3 - Payment Method Used n=1265Cash 45%Credit/ Debit Card 39%Cabcharge Voucher 15%TSS Card 5%Total Cost of Journey n=1265Mean $27B15 - Road Conditions n=1265Normal 70%Low Traffic 21%High Traffic 7%Wet/Raining 2%
• The following tables provide a breakdown of journeys for the study by selected characteristics.
© 2011 Roy Morgan Research 9
KEY PERFORMANCE INDICATORS (KPIs)
• In order to provide a consistent and comparable measure of performance of taxi services in Queensland Key Performance Indicators (KPIs) have been designed. KPI scores have been calculated for 7 categories of service:• Taxi Company Service – arrival times and presence/absence of tariff stickers• Taxi Characteristics – cleanliness, odour, temperature, volume of music etc.• Driver Service Characteristics – assistance, greeting, presentation, knowledge, conversation, compliance with
requests, attitude etc.• Safety – operating seatbelts, using non-taxi related devices while driving, driving to suit road conditions,
following road rules and incidence of dangerous driving• Fares – correct tariff applied, offering off-meter travel, charging the correct fare, using a cost efficient route• Processing of Fares – acceptance of intended payment method, explaining fees and toll charges, offering a
receipt without prompting, returning a TSS card without prompting• Journey Experience – satisfaction with the journey
• These seven KPIs are then combined to create an overall KPI score.• KPIs are calculated on the basis of good or poor service against the above attributes. Good service is rewarded by
receiving a positive score, whilst bad service is down-graded by receiving a negative score. Absence of any specific attribute (e.g. the driver did not adjust the air conditioning because it was not needed or requested) is removed from the KPI calculation.
• Answer weights for good or poor service were applied to each response on the mystery shopping questionnaire. The weights were determined in close consultation with the Department of Transport to ensure the relative importance of different questions was accurately applied and measureable. *
* Further information regarding the method of KPI calculation is available from the Department of Transport and Main Roads on request.

© 2011 Roy Morgan Research 10
OVERALL PERFORMANCE
• In general the QLD taxi industry is performing quite well at this point in time with an overall KPI
score of 77% attained.
Overall KPI ScoreBase: Total QLD (n=1265), Brisbane (n=262), Ipswich (n=102), Redcliffe (n=95), Gold Coast (n=162), Sunshine Coast (n=140), Toowoomba (n=100),
Mackay (n=87), Townsville (n=111), Cairns (n=123), Rockhampton (n=83); Standard (n=952), Wheelchair Accessible/ High Occupancy (n=248), Luxury/ Premium (n=33), Other (n=8).
Overall KPI Score by Region & Taxi Type
787776
7773
7881
7977
8180
7874
81
0 10 20 30 40 50 60 70 80 90 100
Total QLD
Brisbane
Ipswich
Redcliffe
Gold Coast
Sunshine Coast
Toowoomba
Mackay
Townsville
Cairns
Rockhampton
Standard
Wheelchair Accessible/ High Occupancy
Luxury/ Premium
Reg
ion
Taxi
Typ
e
Percentage

© 2011 Roy Morgan Research 11
TAXI COMPANY SERVICE
• In terms of taxi company service, performance was generally high (KPI score of 90%). Waiting times for booked taxis were acceptable and tariff stickers were clearly displayed in vehicles.
Taxi Company Service KPI ScoreBase: Total QLD (n=1265), Brisbane (n=262), Ipswich (n=102), Redcliffe (n=95), Gold Coast (n=162), Sunshine Coast (n=140), Toowoomba (n=100),
Mackay (n=87), Townsville (n=111), Cairns (n=123), Rockhampton (n=83); Standard (n=952), Wheelchair Accessible/ High Occupancy (n=248), Luxury/ Premium (n=33).
Taxi Company Service KPI Score by Region & Taxi Type
9090
93
9092
9597
7790
8391
9292
97
0 10 20 30 40 50 60 70 80 90 100
Total QLD
Brisbane
Ipswich
Redcliffe
Gold Coast
Sunshine Coast
Toowoomba
Mackay
Townsville
Cairns
Rockhampton
Standard
Wheelchair Accessible/ High Occupancy
Luxury/ Premium
Reg
ion
Taxi
Typ
e
Percentage

© 2011 Roy Morgan Research 12
How Early/ Late Taxi Arrived for Advance Booking
15
60
5
1
1
76
24
1
1
16
0 20 40 60 80 100
11-15 mins Early
6-10 mins Early
0-5 mins Early
0-5 mins Late
6-10 mins Late
11-15 mins Late
16-20 mins Late
21-25 mins Late
More than 25 mins Late
TOTAL Early
TOTAL Late
Percentage
Waiting Time for Taxi Booked in Advance
A6. Booked taxi arrival timeBase: Total Booked in Advance and provided booked taxi arrival time (n=116)Note: Includes taxis booked in advance the day before, and taxis booked in
advance for pick up later the same day at a specified time.
• Three quarters of all taxis booked in advance arrived on time or early (76%).• The majority of taxis arrived within 5 minutes of the booked time (60%, 0-5 mins early; 16%, 0-5 mins late).• Three quarters of taxis booked for immediate pick up arrived within 10 minutes (74%).• Only 2 % of taxis booked for immediate pick up took longer than 30 minutes to arrive.
Mean3.7 mins
7.9 mins
A6. Booked taxi arrival timeBase: Total Booked for Immediate Pick Up (n=643)Note: Only includes taxis booked for immediate pick up.
How Long Waited for Taxi (Booked for Immediate Pick Up)
74
12
7
3
2
2
2
0 20 40 60 80 100
0-10mins
11-15mins
16-20mins
21-25mins
26-30mins
More than 30mins
No Answer
Percentage

© 2011 Roy Morgan Research 13
Tariff Sticker VisibleBy Region
• In 95% of all journeys taken, the tariff sticker was clearly visible in the taxi. • In taxis on the Gold Coast (78%) and in Toowoomba (89%) a significantly lower proportion of taxis had the tariff
sticker visible.
Tariff Sticker Visible by Region
95
98
100
100
78
96
89
100
98
99
100
0 10 20 30 40 50 60 70 80 90 100
TOTAL
Brisbane
Ipswich
Redcliffe
Gold Coast
Sunshine Coast
Toowoomba
Mackay
Townsville
Cairns
Rockhampton
Percentage
A15. Tariff sticker visibleBase: Total (n=1265), Brisbane (n=262), Ipswich (n=102), Redcliffe (n=95), Gold Coast (n=162), Sunshine Coast (n=140), Toowoomba (n=100), Mackay
(n=87), Townsville (n=111), Cairns (n=123), Rockhampton (n=83).

© 2011 Roy Morgan Research 14
TAXI CHARACTERISTICS
• Taxi characteristics were also rated highly, achieving a KPI score of 88%.
Taxi Characteristics KPI ScoreBase: Total QLD (n=1265), Brisbane (n=262), Ipswich (n=102), Redcliffe (n=95), Gold Coast (n=162), Sunshine Coast (n=140), Toowoomba (n=100),
Mackay (n=87), Townsville (n=111), Cairns (n=123), Rockhampton (n=83); Standard (n=952), Wheelchair Accessible/ High Occupancy (n=248), Luxury/ Premium (n=33).
Taxi Characteristics KPI Score by Region & Taxi Type
8985
92
9580
919394
858989
9286
88
0 10 20 30 40 50 60 70 80 90 100
Total QLD
Brisbane
Ipswich
Redcliffe
Gold Coast
Sunshine Coast
Toowoomba
Mackay
Townsville
Cairns
Rockhampton
Standard
Wheelchair Accessible/ High Occupancy
Luxury/ Premium
Reg
ion
Taxi
Typ
e
Percentage

© 2011 Roy Morgan Research 15
Taxi Characteristics
• Almost all taxis were clean inside and out across all regions. • 9 in 10 taxis had their temperatures set at comfortable levels and with the music/radio volume at
satisfactory levels.• The odour or smell in taxis was acceptable in 94% of taxis.
Taxi Characteristics
98 95 9191 94
0
10
20
30
40
50
60
70
80
90
100
Exterior Clean Interior Clean Temperature in TaxiComfortable
Volume of Music/ RadioSatisfactory
Pleasant Odour or No Smellin Taxi
Perc
enta
ge
B1. Exterior clean, B2. Interior Clean, B9. Temperature in Taxi, B7. Odour in TaxiBase: Total (n=1265).
B11. Volume of music/radioBase: Total with music playing in the taxi (n=495).

© 2011 Roy Morgan Research 16
Exterior Clean by Region
98
100
100
98
96
96
100
98
98
93
98
0 20 40 60 80 100
TOTAL
Brisbane
Ipswich
Redcliffe
Gold Coast
Sunshine Coast
Toowoomba
Mackay
Townsville
Cairns
Rockhampton
Percentage
Exterior of Taxi CleanBy Region & Taxi Type
B1. Exterior cleanBase: Total (n=1265), Brisbane (n=262), Ipswich (n=102), Redcliffe (n=95), Gold Coast (n=162), Sunshine Coast (n=140), Toowoomba (n=100),
Mackay (n=87), Townsville (n=111), Cairns (n=123), Rockhampton (n=83).
• 98% of the taxis mystery shopped had a clean exterior. This figure was relatively consistent across all regions (ranging from 93% in Cairns to 100% in Brisbane, Ipswich and Toowoomba).
• Luxury/ premium taxis had a 100% record for clean exteriors.• Comments about the cleanliness of the taxi generally indicated that when the exterior was rated as not clean, it was
due to road grime or a dirty windscreen.
Exterior Clean by Taxi Type
98
98
96
100
0 20 40 60 80 100
TOTAL
Standard
WheelchairAccessible/
HighOccupancy
Luxury/Premium
Percentage
© 2011 Roy Morgan Research 17
Interior Clean by Taxi Type
95
96
90
97
0 20 40 60 80 100
TOTAL
Standard
WheelchairAccessible/ High
Occupancy
Luxury/ Premium
Percentage
Interior Clean by Region
95
94
91
96
98
93
97
95
99
92
98
0 20 40 60 80 100
TOTAL
Brisbane
Ipswich
Redcliffe
Gold Coast
Sunshine Coast
Toowoomba
Mackay
Townsville
Cairns
Rockhampton
Percentage
Interior of Taxi CleanBy Region & Taxi Type
B2. Interior cleanBase: Total (n=1265), Brisbane (n=262), Ipswich (n=102), Redcliffe (n=95), Gold Coast (n=162), Sunshine Coast (n=140), Toowoomba (n=100),
Mackay (n=87), Townsville (n=111), Cairns (n=123), Rockhampton (n=83); Standard (n=952), Wheelchair Accessible/High Occupancy (n=248), Luxury/Premium (n=33).
Note: Taxi Type excludes journeys with no answer for type of taxi (n=24) or other (n=8).
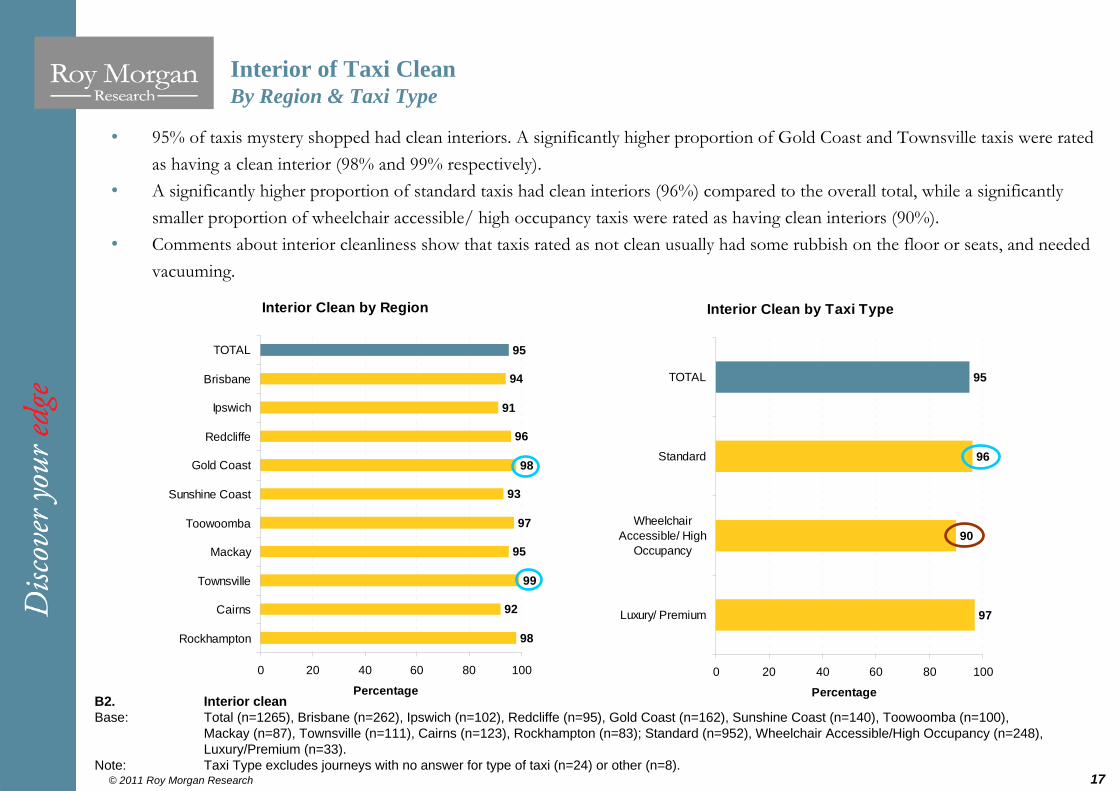
• 95% of taxis mystery shopped had clean interiors. A significantly higher proportion of Gold Coast and Townsville taxis were rated as having a clean interior (98% and 99% respectively).
• A significantly higher proportion of standard taxis had clean interiors (96%) compared to the overall total, while a significantly smaller proportion of wheelchair accessible/ high occupancy taxis were rated as having clean interiors (90%).
• Comments about interior cleanliness show that taxis rated as not clean usually had some rubbish on the floor or seats, and needed vacuuming.

© 2011 Roy Morgan Research 18
Temperature in TaxiBy Region
Temperature in Taxi
91
5
4
0 20 40 60 80 100
Comfortable
Too Hot
Too Cold
Percentage
B9. Temperature in taxiBase: Total (n=1265), Brisbane (n=262), Ipswich (n=102), Redcliffe (n=95), Gold Coast (n=162), Sunshine Coast (n=140), Toowoomba (n=100),
Mackay (n=87), Townsville (n=111), Cairns (n=123), Rockhampton (n=83).
• In 91% of QLD taxis the temperature was rated as comfortable.• Significantly higher proportions of Ipswich, Redcliffe, Toowoomba, Mackay and Rockhampton taxis were rated as
having a comfortable temperature (95%, 96%, 96%, 97% and 99% respectively), while Cairns had significantly lower proportions with a comfortable temperature (83%).
• While passengers generally found the temperature in the taxi to be comfortable, air conditioning too high or not on was the primary reason for it being too hot or cold in the vehicle.
Temperature Comfortable in Taxi by Region
91
90
95
96
86
90
96
97
86
83
99
0 20 40 60 80 100
TOTAL
Brisbane
Ipswich
Redcliffe
Gold Coast
Sunshine Coast
Toowoomba
Mackay
Townsville
Cairns
Rockhampton
Percentage

© 2011 Roy Morgan Research 19
Volume of Music/RadioBy Region
Volume of Music/Radio
91
9
0 20 40 60 80 100
Satisfactory
Too Loud
Percentage
B11. Volume of music/radioBase: Total with music playing in the taxi (n=495), Brisbane (n=91), Ipswich (n=21), Redcliffe (n=36), Gold Coast (n=54), Sunshine Coast (n=59),
Toowoomba (n=36), Mackay (n=26), Townsville (n=43), Cairns (n=71), Rockhampton (n=58).
• In 91% of mystery shopping journeys the volume of music/radio was rated as satisfactory by the passenger.• In Townsville and Cairns a significantly higher proportion of taxis with music playing were rated as having the music too loud (19%
and 17% respectively).• While generally passengers rated the volume of music in the taxi as satisfactory, those who said it was too loud usually indicated that
it was louder if they were sitting in the back seat of the taxi (or the back of a wheelchair accessible/ high occupancy vehicle).
Music/Radio Too Loud by Region
9
12
9
3
3
8
19
17
5
0 5 10 15 20 25 30
TOTAL
Brisbane
Ipswich
Redcliffe
Gold Coast
Sunshine Coast
Toowoomba
Mackay
Townsville
Cairns
Rockhampton
Percentage

© 2011 Roy Morgan Research 20
Pleasant Odour/ No Smell in Taxi by Region
93
89
98
91
94
90
95
98
97
91
99
0 20 40 60 80 100
TOTAL
Brisbane
Ipswich
Redcliffe
Gold Coast
Sunshine Coast
Toowoomba
Mackay
Townsville
Cairns
Rockhampton
Percentage
Odour in TaxiBy Region
Odour in Taxi
30
6
64
0 20 40 60 80 100
Pleasant
Unpleasant
No Smell
Percentage
B7. Odour in taxiBase: Total (n=1265), Brisbane (n=262), Ipswich (n=102), Redcliffe (n=95), Gold Coast (n=162), Sunshine Coast (n=140), Toowoomba (n=100),
Mackay (n=87), Townsville (n=111), Cairns (n=123), Rockhampton (n=83).
• 30% of the taxis mystery shopped were rated as having a pleasant odour and 64% were rated as having no smell.• A significantly lower proportion of taxis in Brisbane were rated as having a pleasant smell or no smell at all (89%),
with ratings significantly higher for Ipswich (98%), Mackay (98%), Townsville (97%) and Rockhampton (99%).• Frequently cited reasons for unpleasant odours in taxis were body odour of the driver, cigarette smells, or food
odours.

© 2011 Roy Morgan Research 21
DRIVER SERVICE/ CHARACTERISTICS
• The KPI score for driver service/characteristics was of a satisfactory level (76%).
Driver Service/ Characteristics Service KPI ScoreBase: Total QLD (n=1265), Brisbane (n=262), Ipswich (n=102), Redcliffe (n=95), Gold Coast (n=162), Sunshine Coast (n=140), Toowoomba (n=100),
Mackay (n=87), Townsville (n=111), Cairns (n=123), Rockhampton (n=83); Standard (n=952), Wheelchair Accessible/ High Occupancy (n=248), Luxury/ Premium (n=33).
Driver Service/ Characteristics KPI Score by Region & Taxi Type
7676
81
7672
7777
8278
7777
7174
80
0 10 20 30 40 50 60 70 80 90 100
Total QLD
Brisbane
Ipswich
Redcliffe
Gold Coast
Sunshine Coast
Toowoomba
Mackay
Townsville
Cairns
Rockhampton
Standard
Wheelchair Accessible/ High Occupancy
Luxury/ Premium
Reg
ion
Taxi
Typ
e
Percentage

© 2011 Roy Morgan Research 22
Driver Service/ Characteristics
• There is some room for improvement in the service offered by drivers, particularly in relation to assistance with luggage and the level of professionalism shown by drivers.
Driver Service/ Characteristics
8596
7717
7542
9224
9491
9795
9998
86
0 10 20 30 40 50 60 70 80 90 100
Offered Reasonable Assistance with Luggage
Offered Other Assistance
Driver Greeted Passenger
Driver Asked Passenger for Particular Route
Driver Asked Passenger for Only Minor Directions or Knew the Best Route
Driver Wearing Uniform
Driver Well Presented/Groomed
Driver Could be Clearly Understood
Driver Understood Passenger
Conversation of Driver Appropriate
Driver Adjusted Air Conditioning if Requested
Driver Adjusted Music if Requested
Drop Off Point Acceptable
Driver Attitude Pleasant/Friendly
Driver Attitude Professional
PercentageA10. Driver greeted you, A11. Driver asked you for a particular route, A13. Driver asked you for directions, B3. Driver wearing uniform, B4. Driver well presented/groomed, B5. Driver could be clearly understood, B6. Driver understood you, C12. Drop off point acceptable, D1. General driver attitude throughout journey.Base: Total QLD (n=1265).
A9. Offered other assistanceBase: Total Passengers Requiring Assistance (n=287). B10. Driver adjusted air conditioning if requestedBase: Total passengers requested air conditioning adjusted (n=148).B12. Adjusted musicBase: Total passengers requested music adjusted (n=82).
A8. Reasonable assistance with luggageBase: Total Passengers with Luggage (n=175).
B13. Conversation of driverBase: Total driver made conversation (n=1092).

© 2011 Roy Morgan Research 23
Reasonable Assistance with LuggageBy Region & Taxi Type
A8. Reasonable assistance with luggageBase: Total Passengers with Luggage (n=175), Brisbane (n=36), Ipswich (n=19), Redcliffe (n=22), Gold Coast (n=28), Sunshine Coast (n=23),
Toowoomba (n=7), Mackay (n=15), Townsville (n=1), Cairns (n=20), Rockhampton (n=4); Standard (n=137), Wheelchair Accessible/HighOccupancy (n=28), Luxury/Premium (n=4).
Note: * Denotes small sample size
• 14% of journeys were undertaken with luggage that should have required the driver to offer assistance. Luggage taken by mystery shoppers included suitcases and grocery shopping bags.
• The driver offered reasonable assistance in 75% of journeys where the passenger required help with luggage.• While the majority of drivers did provide assistance with luggage, in some cases the driver did not get out of the vehicle to help
passengers struggling with luggage, sometimes simply “popping the boot” for the passenger without getting out to assist.
Reasonable Assistance With Luggage by Taxi Type
75
79
64
100
0 20 40 60 80 100
TOTAL
Standard
WheelchairAccessible/
HighOccupancy *
Luxury/Premium *
Percentage
Reasonable Assistance With Luggage by Region
75
64
47
82
96
87
86
67
100
65
100
0 20 40 60 80 100
TOTAL
Brisbane
Ipswich
Redcliffe
Gold Coast
Sunshine Coast
Toowoomba
Mackay
Townsville
Cairns
Rockhampton
Percentage

© 2011 Roy Morgan Research 24
Offered Other Assistance by Taxi Type
42
24
72
100
0 20 40 60 80 100
TOTAL
Standard
WheelchairAccessible/
HighOccupancy
Luxury/Premium*
Percentage
Driver Offered Other AssistanceBy Region & Taxi Type
A9. Offered other assistanceBase: Total Passengers Requiring Assistance (n=287), Brisbane (n=59), Ipswich (n=19), Redcliffe (n=5), Gold Coast (n=13), Sunshine Coast (n=16),
Toowoomba (n=24), Mackay (n=10), Townsville (n=80), Cairns (n=39), Rockhampton (n=3); Standard (n=177), Wheelchair Accessible/High Occupancy (n=96), Luxury/Premium (n=2).
Note: * Denotes small sample size
• The driver offered the passenger other assistance (such as aiding an elderly passenger in entering the vehicle, opening the door, or securing a wheelchair) in 42% of cases where the passenger felt they required assistance. In some cases passengers clearly required assistance and asked for it before the driver took action.
• A significantly higher proportion of drivers offered other assistance for passengers travelling in wheelchair accessible/ high occupancy taxis (72%).
Offered Other Assistance by Region
42
69
45
20
85
50
50
70
4
44
100
0 20 40 60 80 100
TOTAL
Brisbane
Ipswich
Redcliffe
Gold Coast
Sunshine Coast
Toowoomba
Mackay
Townsville
Cairns
Rockhampton
Percentage

© 2011 Roy Morgan Research 25
Driver Greeted You & Driver Asked for Particular Route By Region
Driver Greeted You by Region
92
86
95
94
96
98
90
99
86
89
98
0 20 40 60 80 100
TOTAL
Brisbane
Ipswich
Redcliffe
Gold Coast
Sunshine Coast
Toowoomba
Mackay
Townsville
Cairns
Rockhampton
Percentage
A10. Driver greeted youBase: Total (n=1265), Brisbane (n=262), Ipswich (n=102), Redcliffe
(n=95), Gold Coast (n=162), Sunshine Coast (n=140), Toowoomba (n=100), Mackay (n=87), Townsville (n=111), Cairns (n=123), Rockhampton (n=83).
• The driver greeted the passenger in 92% of mystery shopping journeys. • The driver asked the passenger if there was a particular route they would like to take to their destination in 24% of
the total journeys taken. Passengers used the comments section for this question to describe the routes offered or to explain why the driver did or did not ask. In most cases when the driver did not ask for a particular route the passenger explained that it was because the driver knew the best route.
Driver Asked Passenger for Particular Route by Region
24
34
23
7
32
17
10
33
21
24
17
0 20 40 60 80 100
TOTAL
Brisbane
Ipswich
Redcliffe
Gold Coast
Sunshine Coast
Toowoomba
Mackay
Townsville
Cairns
Rockhampton
PercentageA11. Driver asked you for a particular routeBase: Total (n=1265), Brisbane (n=262), Ipswich (n=102), Redcliffe
(n=95), Gold Coast (n=162), Sunshine Coast (n=140), Toowoomba (n=100), Mackay (n=87), Townsville (n=111), Cairns (n=123), Rockhampton (n=83).

© 2011 Roy Morgan Research 26
Driver Asked Passenger for DirectionsBy Region
Driver Asked Passenger for Directions
4
26
68
1
0 20 40 60 80 100
Completedirections
Confirmatoryquestions
None
No Answer
PercentageA13. Driver asked you for directionsBase: Total (n=1265), Brisbane (n=262), Ipswich (n=102), Redcliffe (n=95), Gold Coast (n=162), Sunshine Coast (n=140), Toowoomba (n=100),
Mackay (n=87), Townsville (n=111), Cairns (n=123), Rockhampton (n=83).
• Confirmatory questions (such as “do I turn here”) were asked of the passenger in 26% of journeys. Complete directions were asked for on just 4% of trips. Comments regarding drivers asking for complete directions show that in these cases the driver asked because they did not know they way.
• For significantly higher proportions of journeys in Ipswich (85%), Redcliffe (80%), Townsville (81%) and Rockhampton taxis (87%), the driver did not ask for any directions.
Driver Did Not Ask Passenger for Directions by Region
68
55
85
80
60
74
69
68
81
56
87
0 20 40 60 80 100
TOTAL
Brisbane
Ipswich
Redcliffe
Gold Coast
Sunshine Coast
Toowoomba
Mackay
Townsville
Cairns
Rockhampton
Percentage

© 2011 Roy Morgan Research 27
Driver Wearing UniformBy Region & Taxi Type
Driver Wearing Uniform by Region
91
84
98
98
96
89
97
76
88
93
98
0 20 40 60 80 100
TOTAL
Brisbane
Ipswich
Redcliffe
Gold Coast
Sunshine Coast
Toowoomba
Mackay
Townsville
Cairns
Rockhampton
PercentageB3. Driver wearing uniformBase: Total (n=1265), Brisbane (n=262), Ipswich (n=102), Redcliffe (n=95), Gold Coast (n=162), Sunshine Coast (n=140), Toowoomba (n=100),
Mackay (n=87), Townsville (n=111), Cairns (n=123), Rockhampton (n=83); Standard (n=952), Wheelchair Accessible/High Occupancy (n=248), Luxury/Premium (n=33).
• The driver was wearing a uniform in 91% of the journeys evaluated.• Higher proportions of passengers in Ipswich (98%), Redcliffe (98%), Gold Coast (96%), Toowoomba (97%), Cairns
(93%) and Rockhampton taxis (98%) indicated that the driver was wearing a uniform.• On 95% of trips in wheelchair accessible/ high occupancy taxis the driver was wearing a uniform.
Driver Wearing Uniform by Taxi Type
91
90
95
91
0 20 40 60 80 100
TOTAL
Standard
WheelchairAccessible/
HighOccupancy
Luxury/Premium
Percentage

© 2011 Roy Morgan Research 28
Driver Well Presented & GroomedBy Region & Taxi Type
Driver Well Presented/ Groomed by Region
97
92
98
100
99
99
98
98
96
95
99
0 20 40 60 80 100
TOTAL
Brisbane
Ipswich
Redcliffe
Gold Coast
Sunshine Coast
Toowoomba
Mackay
Townsville
Cairns
Rockhampton
Percentage
B4. Driver well presented/groomedBase: Total (n=1265), Brisbane (n=262), Ipswich (n=102), Redcliffe (n=95), Gold Coast (n=162), Sunshine Coast (n=140), Toowoomba (n=100),
Mackay (n=87), Townsville (n=111), Cairns (n=123), Rockhampton (n=83); Standard (n=952), Wheelchair Accessible/High Occupancy (n=248), Luxury/Premium (n=33).
• Almost all drivers evaluated were rated as being well presented and groomed (97%).• Of the 3% not considered to be well presented/ groomed, passenger comments indicated that some drivers were
wearing casual clothes, had dirty clothing or scruffy, untidy hair.• 100% of Redcliffe drivers evaluated were rated as well presented/groomed, as were drivers of luxury/ premium
taxis.
Driver Well Presented/ Groomed by Taxi Type
97
97
96
100
0 20 40 60 80 100
TOTAL
Standard
WheelchairAccessible/
HighOccupancy
Luxury/Premium
Percentage

© 2011 Roy Morgan Research 29
Driver Could be Clearly UnderstoodBy Region
B5. Driver could be clearly understoodBase: Total (n=1265), Brisbane (n=262), Ipswich (n=102), Redcliffe (n=95), Gold Coast (n=162), Sunshine Coast (n=140), Toowoomba (n=100),
Mackay (n=87), Townsville (n=111), Cairns (n=123), Rockhampton (n=83).
• In 95% of taxi journeys the driver could be clearly understood by the passenger.• In Brisbane, the driver could be clearly understood in a significantly lower proportion of journeys (89%).• In most cases the difficulty with understanding was due to the driver’s accent or English language ability.• It should also be noted that some drivers spoke very softly or mumbled, causing the passenger to have to ask the
driver to repeat themselves.
Driver Could be Clearly Understood by Region
95
89
97
99
98
95
97
94
97
96
96
0 10 20 30 40 50 60 70 80 90 100
TOTAL
Brisbane
Ipswich
Redcliffe
Gold Coast
Sunshine Coast
Toowoomba
Mackay
Townsville
Cairns
Rockhampton
Percentage

© 2011 Roy Morgan Research 30
Driver Understood YouBy Region & Taxi Type
Driver Understood Passenger by Region
99
99
100
100
98
99
99
99
99
98
99
0 20 40 60 80 100
TOTAL
Brisbane
Ipswich
Redcliffe
Gold Coast
Sunshine Coast
Toowoomba
Mackay
Townsville
Cairns
Rockhampton
Percentage
B6. Driver understood youBase: Total (n=1265), Brisbane (n=262), Ipswich (n=102), Redcliffe (n=95), Gold Coast (n=162), Sunshine Coast (n=140), Toowoomba (n=100),
Mackay (n=87), Townsville (n=111), Cairns (n=123), Rockhampton (n=83); Standard (n=952), Wheelchair Accessible/High Occupancy (n=248), Luxury/Premium (n=33).
• The driver was able to understand the passenger in 99% of journeys taken.• While proportions are quite stable across regions, it should be noted that drivers understood the passenger in 100%
of the journeys taken at Ipswich and Redcliffe, and for those trips taken in luxury/ premium taxis.
Driver Understood Passenger by Taxi Type
99
99
99
100
0 20 40 60 80 100
TOTAL
Standard
WheelchairAccessible/
HighOccupancy
Luxury/Premium
Percentage

© 2011 Roy Morgan Research 31
Driver Conversation AppropriateBy Region & Taxi Type
B13. Conversation of driverBase: Total driver made conversation (n=1092), Brisbane (n=187), Ipswich (n=96), Redcliffe (n=82), Gold Coast (n=149), Sunshine Coast (n=132), Toowoomba
(n=100), Mackay (n=80), Townsville (n=108), Cairns (n=109), Rockhampton (n=60); Standard (n=833), Wheelchair Accessible/High Occupancy (n=203), Luxury/Premium (n=31).
• Of those journeys which involved conversation, the conversation of the driver was rated as appropriate in 98% of taxi journeys.• 100% of journeys with conversation in Redcliffe, Gold Coast and Toowoomba and in luxury/ premium taxis were rated as
appropriate. • Passengers’ comments regarding driver conversation were generally positive. Drivers talked about the weather, local news or other
appropriate small talk.• Generally, comments about inappropriate driver conversation were due to swearing/coarse language.
Conversation of Driver Appropriate by Region
98
97
98
100
100
98
100
95
97
97
97
0 20 40 60 80 100
TOTAL
Brisbane
Ipswich
Redcliffe
Gold Coast
Sunshine Coast
Toowoomba
Mackay
Townsville
Cairns
Rockhampton
Percentage
Conversation of Driver Appropriate by Taxi Type
98
98
99
100
0 20 40 60 80 100
TOTAL
Standard
WheelchairAccessible/
HighOccupancy
Luxury/Premium
Percentage
© 2011 Roy Morgan Research 32
Driver Adjusted Air Conditioning and Music if Requested
Driver Adjusted Air Conditioning if Requested
86
14
0 20 40 60 80 100
Yes
No
Percentage
Driver Adjusted Music if Requested
85
15
0 20 40 60 80 100
Yes
No
Percentage
B10. Driver adjusted air conditioning if requestedBase: Total passengers requested air conditioning adjusted (n=148).Note: May include adjustments such as putting the windows down
as well as air conditioning changes.
B12. Adjusted musicBase: Total passengers requested music adjusted (n=82).
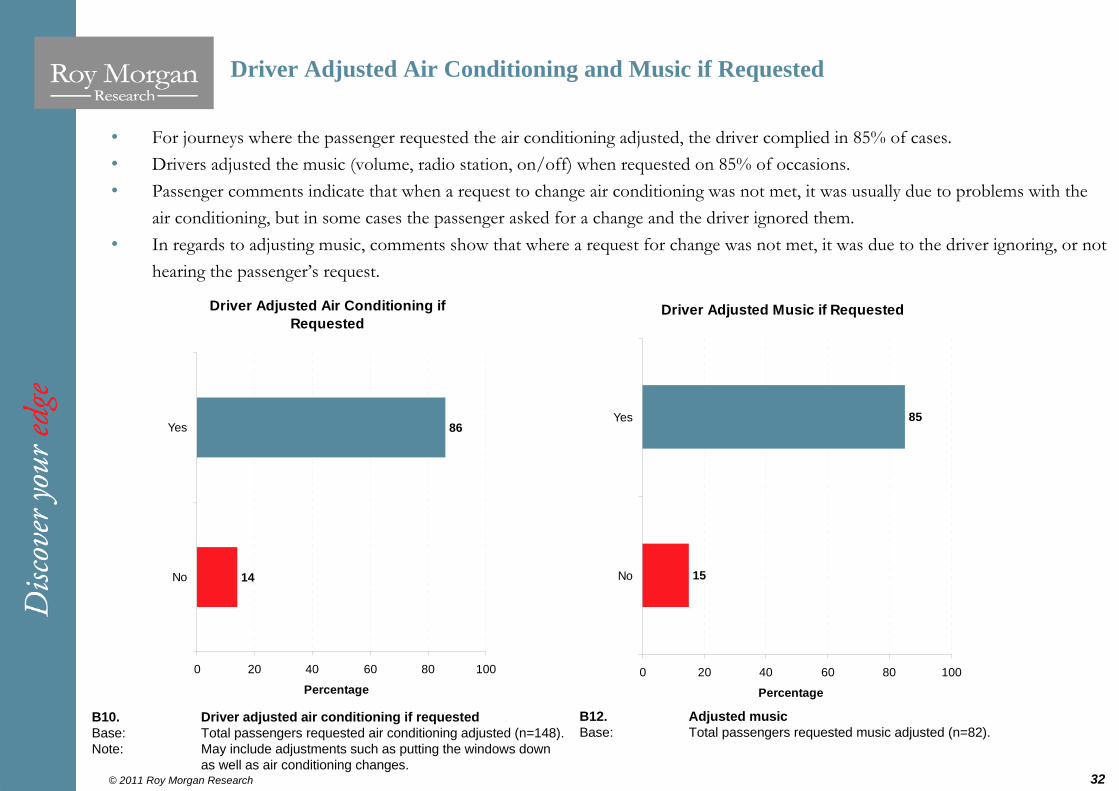
• For journeys where the passenger requested the air conditioning adjusted, the driver complied in 85% of cases.• Drivers adjusted the music (volume, radio station, on/off) when requested on 85% of occasions.• Passenger comments indicate that when a request to change air conditioning was not met, it was usually due to problems with the
air conditioning, but in some cases the passenger asked for a change and the driver ignored them.• In regards to adjusting music, comments show that where a request for change was not met, it was due to the driver ignoring, or not
hearing the passenger’s request.

© 2011 Roy Morgan Research 33
Drop Off Point Acceptable By Region & Taxi Type
C12. Drop off point acceptableBase: Total (n=1265), Brisbane (n=262), Ipswich (n=102), Redcliffe (n=95), Gold Coast (n=162), Sunshine Coast (n=140), Toowoomba (n=100), Mackay
(n=87), Townsville (n=111), Cairns (n=123), Rockhampton (n=83); Standard (n=952), Wheelchair Accessible/High Occupancy (n=248), Luxury/Premium (n=33).
• The drop off point was acceptable to the passenger in 96% of journeys taken.• A significantly higher proportion of journeys in Mackay ended with an appropriate drop off point (99%), while a lower proportion
of Cairns taxi drivers dropped passengers in an appropriate place (91%). The drop off point was acceptable in a significantly lower proportion of standard taxis (95%).
• Comments about acceptable drop off points show that drivers generally check with the passenger about where is most convenient for them to be dropped, while unacceptable drop off points generally involved drivers stopping in illegal places, or double parking on main roads.
Drop Off Point Acceptable by Region
96
95
98
98
98
96
97
99
98
91
94
0 20 40 60 80 100
TOTAL
Brisbane
Ipswich
Redcliffe
Gold Coast
Sunshine Coast
Toowoomba
Mackay
Townsville
Cairns
Rockhampton
Percentage
Drop Off Point Acceptable by Taxi Type
96
95
99
100
0 20 40 60 80 100
TOTAL
Standard
WheelchairAccessible/
HighOccupancy
Luxury/Premium
Percentage

© 2011 Roy Morgan Research 34
General Driver Attitude Throughout the Journey
D1. General driver attitude throughout journeyBase: Total (n=1265).Note: Multiple responses allowed for “Pleasant/friendly” and “Professional”.
• Drivers were rated as pleasant/friendly in 77% of journeys evaluated, and as professional in 17% of journeys.• Only 1% of drivers evaluated were rated as being bad tempered.• Passengers generally made positive comments about the driver’s attitude.• Comments regarding negative driver attitudes indicated that some drivers were rude to passengers, or grumbled
about providing services to the passenger.
General Driver Attitude Throughout Journey
77
17
11
1
1
0 10 20 30 40 50 60 70 80 90 100
Pleasant/ Friendly
Professional
No Emotion
Bad Tempered
No Answer
Percentage

© 2011 Roy Morgan Research 35
Driver Pleasant/Friendly Throughout the JourneyBy Region
D1. General driver attitude throughout journeyBase: Total (n=1265), Brisbane (n=262), Ipswich (n=102), Redcliffe (n=95), Gold Coast (n=162), Sunshine Coast (n=140), Toowoomba (n=100), Mackay
(n=87), Townsville (n=111), Cairns (n=123), Rockhampton (n=83).Note: Multiple responses allowed for “Pleasant/friendly” and “Professional”.
• A significantly lower proportion of drivers were rated as pleasant/friendly in Brisbane (63%), while a higher proportion of drivers were rated as pleasant/friendly in Gold Coast (87%), Sunshine Coast (84%), Mackay (85%) and Townsville taxis (85%).
Driver Pleasant/ Friendly Throughout Journey by Region
77
63
75
73
87
84
78
85
85
71
80
0 10 20 30 40 50 60 70 80 90 100
TOTAL
Brisbane
Ipswich
Redcliffe
Gold Coast
Sunshine Coast
Toowoomba
Mackay
Townsville
Cairns
Rockhampton
Percentage

© 2011 Roy Morgan Research 36
Driver Professional Throughout the Journey By Region & Taxi Type
D1. General driver attitude throughout journeyBase: Total (n=1265), Brisbane (n=262), Ipswich (n=102), Redcliffe (n=95), Gold Coast (n=162), Sunshine Coast (n=140), Toowoomba (n=100), Mackay
(n=87), Townsville (n=111), Cairns (n=123), Rockhampton (n=83); Standard (n=952), Wheelchair Accessible/High Occupancy (n=248), Luxury/Premium (n=33).
Note: Multiple responses allowed for “Pleasant/friendly” and “Professional”.
• Drivers in Cairns and Rockhampton were more frequently rated as professional (34% and 48% respectively) while significantly lower proportions of those in Gold Coast (8%), Sunshine Coast (5%), Mackay (8%) and Townsville (10%) were rated as professional.
• A significantly lower proportion of drivers of wheelchair accessible/ high occupancy taxis were rated as professional (13%).
Driver Professional Throughout Journey by Region
17
15
17
20
8
5
16
8
10
34
48
0 20 40 60 80 100
TOTAL
Brisbane
Ipswich
Redcliffe
Gold Coast
Sunshine Coast
Toowoomba
Mackay
Townsville
Cairns
Rockhampton
Percentage
Driver Professional Throughout Journey by Taxi Type
17
17
13
21
0 20 40 60 80 100
TOTAL
Standard
WheelchairAccessible/
HighOccupancy
Luxury/Premium
Percentage
© 2011 Roy Morgan Research 37
SAFETY
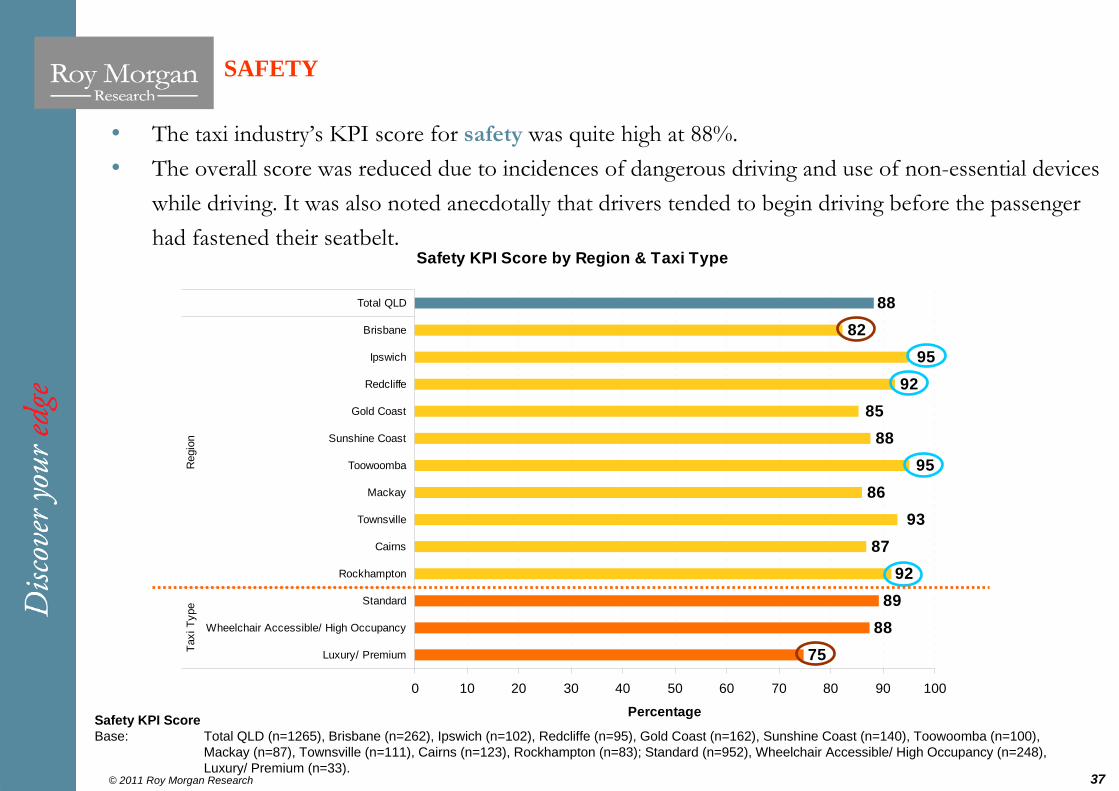
• The taxi industry’s KPI score for safety was quite high at 88%. • The overall score was reduced due to incidences of dangerous driving and use of non-essential devices
while driving. It was also noted anecdotally that drivers tended to begin driving before the passenger had fastened their seatbelt.
Safety KPI ScoreBase: Total QLD (n=1265), Brisbane (n=262), Ipswich (n=102), Redcliffe (n=95), Gold Coast (n=162), Sunshine Coast (n=140), Toowoomba (n=100),
Mackay (n=87), Townsville (n=111), Cairns (n=123), Rockhampton (n=83); Standard (n=952), Wheelchair Accessible/ High Occupancy (n=248), Luxury/ Premium (n=33).
Safety KPI Score by Region & Taxi Type
8988
75
9287
9386
9588
8592
9582
88
0 10 20 30 40 50 60 70 80 90 100
Total QLD
Brisbane
Ipswich
Redcliffe
Gold Coast
Sunshine Coast
Toowoomba
Mackay
Townsville
Cairns
Rockhampton
Standard
Wheelchair Accessible/ High Occupancy
Luxury/ Premium
Reg
ion
Taxi
Typ
e
Percentage
© 2011 Roy Morgan Research 38
Safety
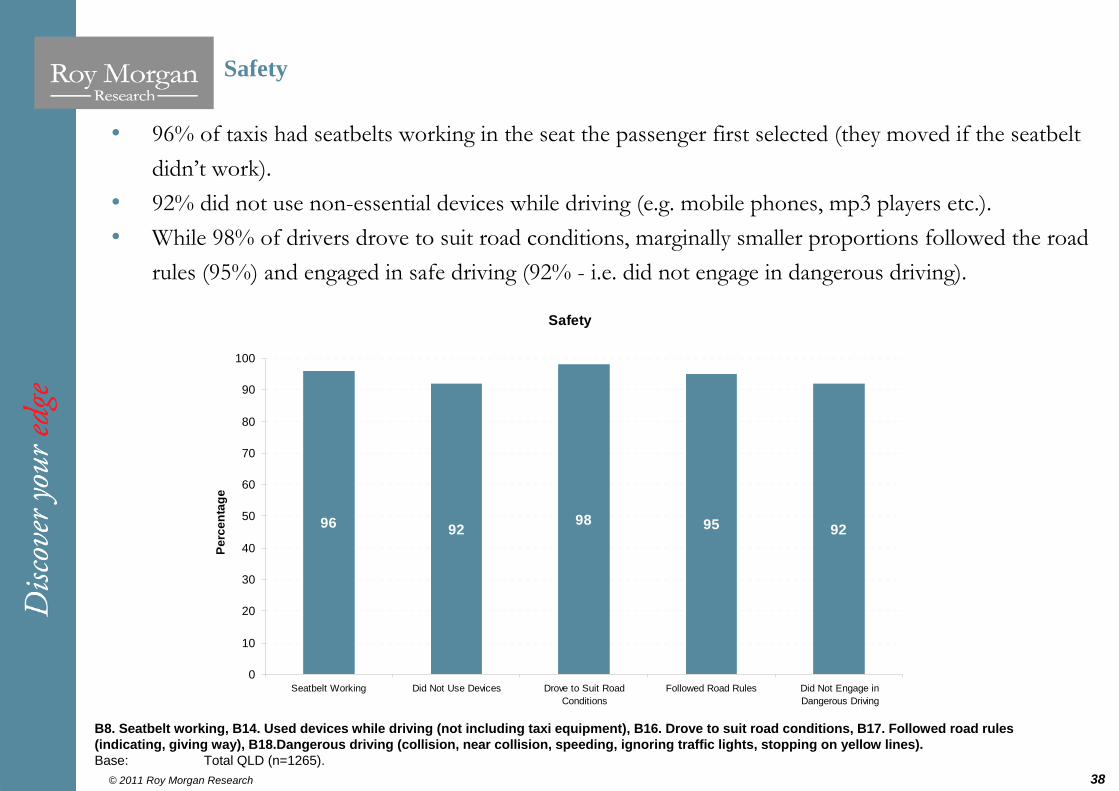
• 96% of taxis had seatbelts working in the seat the passenger first selected (they moved if the seatbelt didn’t work).
• 92% did not use non-essential devices while driving (e.g. mobile phones, mp3 players etc.).• While 98% of drivers drove to suit road conditions, marginally smaller proportions followed the road
rules (95%) and engaged in safe driving (92% - i.e. did not engage in dangerous driving).
Safety
96 92 98 95 92
0
10
20
30
40
50
60
70
80
90
100
Seatbelt Working Did Not Use Devices Drove to Suit RoadConditions
Followed Road Rules Did Not Engage inDangerous Driving
Perc
enta
ge
B8. Seatbelt working, B14. Used devices while driving (not including taxi equipment), B16. Drove to suit road conditions, B17. Followed road rules (indicating, giving way), B18.Dangerous driving (collision, near collision, speeding, ignoring traffic lights, stopping on yellow lines).Base: Total QLD (n=1265).
© 2011 Roy Morgan Research 39
Seatbelt Working by Taxi Type
96
98
90
100
0 20 40 60 80 100
TOTAL
Standard
WheelchairAccessible/ High
Occupancy
Luxury/ Premium
Percentage
Seatbelt WorkingBy Region & Taxi Type
B8. Seatbelt workingBase: Total (n=1265), Brisbane (n=262), Ipswich (n=102), Redcliffe (n=95), Gold Coast (n=162), Sunshine Coast (n=140), Toowoomba (n=100), Mackay
(n=87), Townsville (n=111), Cairns (n=123), Rockhampton (n=83); Standard (n=952), Wheelchair Accessible/ High Occupancy (n=248),Luxury/ Premium (n=33).
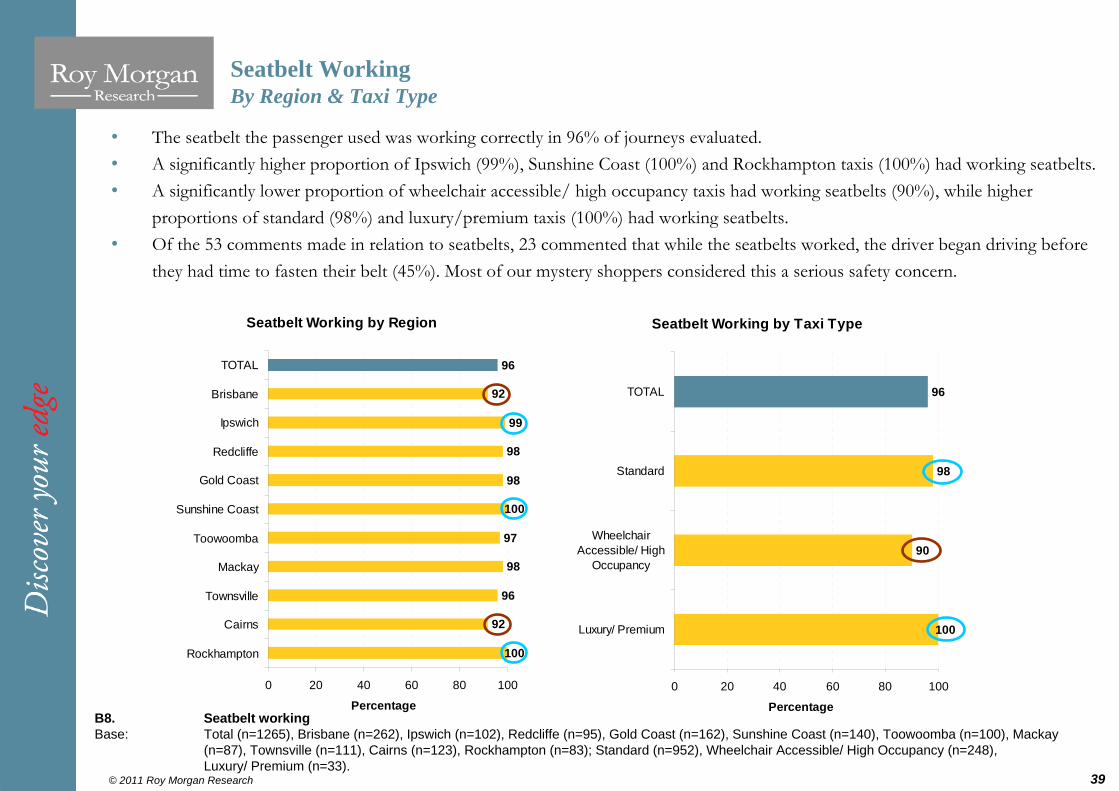
• The seatbelt the passenger used was working correctly in 96% of journeys evaluated.• A significantly higher proportion of Ipswich (99%), Sunshine Coast (100%) and Rockhampton taxis (100%) had working seatbelts.• A significantly lower proportion of wheelchair accessible/ high occupancy taxis had working seatbelts (90%), while higher
proportions of standard (98%) and luxury/premium taxis (100%) had working seatbelts.• Of the 53 comments made in relation to seatbelts, 23 commented that while the seatbelts worked, the driver began driving before
they had time to fasten their belt (45%). Most of our mystery shoppers considered this a serious safety concern.
Seatbelt Working by Region
96
92
99
98
98
100
97
98
96
92
100
0 20 40 60 80 100
TOTAL
Brisbane
Ipswich
Redcliffe
Gold Coast
Sunshine Coast
Toowoomba
Mackay
Townsville
Cairns
Rockhampton
Percentage

© 2011 Roy Morgan Research 40
Devices Used While DrivingBy Region & Taxi Type
B14. Used devices while driving (not including taxi equipment)Base: Total (n=1265), Brisbane (n=262), Ipswich (n=102), Redcliffe (n=95), Gold Coast (n=162), Sunshine Coast (n=140), Toowoomba (n=100), Mackay
(n=87), Townsville (n=111), Cairns (n=123), Rockhampton (n=83); Standard (n=952), Wheelchair Accessible/ High Occupancy (n=248),Luxury/ Premium (n=33).
• In 92% of the journeys evaluated the driver did not use any devices while driving (excluding taxi equipment). Passengers indicated that drivers who used devices were often talking on a mobile phone (in some cases with hands free through headphones), messaging/checking text messages, or listening to music.
• A significantly lower proportion of Brisbane drivers refrained from using devices while driving (83%).• In standard taxis, drivers avoided using devices during a significantly higher proportion of journeys (93%), while a significantly
lower proportion of drivers used no devices while driving in luxury/premium taxis (85%).
Total Did Not Use Devices While Driving by Region
92
83
99
94
95
94
98
87
95
90
96
0 20 40 60 80 100
TOTAL
Brisbane
Ipswich
Redcliffe
Gold Coast
Sunshine Coast
Toowoomba
Mackay
Townsville
Cairns
Rockhampton
Percentage
Total Did Not Use Devices While Driving by Taxi Type
92
93
89
85
0 20 40 60 80 100
TOTAL
Standard
WheelchairAccessible/ High
Occupancy
Luxury/ Premium
Percentage

© 2011 Roy Morgan Research 41
Drove to Suit Road ConditionsBy Region & Taxi Type
B16. Drove to suit road conditionsBase: Total (n=1265), Brisbane (n=262), Ipswich (n=102), Redcliffe (n=95), Gold Coast (n=162), Sunshine Coast (n=140), Toowoomba (n=100), Mackay
(n=87), Townsville (n=111), Cairns (n=123), Rockhampton (n=83); Standard (n=952), Wheelchair Accessible/ High Occupancy (n=248), Luxury/ Premium (n=33).
• Road conditions were normal for 70% of trips, low traffic for 21%, high traffic for 7% and wet/raining for 2% (not shown on graph).
• In 98% of journeys the taxi driver drove to suit road conditions. This was consistent across various road conditions.• Comments were generally positive, giving praise to the driver for their careful and safe driving.• Speeding through road works was regularly cited as the reason for not driving to suit road conditions, as was weaving through heavy
traffic or tailgating.
Drove to Suit Road Conditions by Taxi Type
98
98
97
100
0 20 40 60 80 100
TOTAL
Standard
WheelchairAccessible/
HighOccupancy
Luxury/Premium
Percentage
Drove to Suit Road Conditions by Region
98
97
98
100
96
98
100
95
99
98
99
0 20 40 60 80 100
TOTAL
Brisbane
Ipswich
Redcliffe
Gold Coast
Sunshine Coast
Toowoomba
Mackay
Townsville
Cairns
Rockhampton
Percentage

© 2011 Roy Morgan Research 42
Followed Road Rules & Did Not Engage in Dangerous DrivingBy Region
B17. Followed road rules (indicating, giving way)Base: Total (n=1265), Brisbane (n=262), Ipswich (n=102), Redcliffe
(n=95), Gold Coast (n=162), Sunshine Coast (n=140), Toowoomba (n=100), Mackay (n=87), Townsville (n=111), Cairns (n=123), Rockhampton (n=83).
• Road rules were followed in 95% of journeys evaluated.• A significantly lower proportion of Brisbane taxis evaluated followed general road rules (92%), while higher proportions of Ipswich
(100%), Redcliffe (99%) and Mackay taxis (99%) followed road rules.• In 92% of the journeys evaluated, the driver did not engage in dangerous driving. This proportion was significantly higher for
Toowoomba taxis (99%).
Followed Road Rules by Region
95
92
100
99
96
94
91
99
97
93
95
0 20 40 60 80 100
TOTAL
Brisbane
Ipswich
Redcliffe
Gold Coast
Sunshine Coast
Toowoomba
Mackay
Townsville
Cairns
Rockhampton
Percentage
B18. Dangerous driving (collision, near collision, speeding, ignoring traffic lights, stopping on yellow lines)
Base: Total (n=1265), Brisbane (n=262), Ipswich (n=102), Redcliffe (n=95), Gold Coast (n=162), Sunshine Coast (n=140), Toowoomba (n=100), Mackay (n=87), Townsville (n=111), Cairns (n=123), Rockhampton (n=83).
Did Not Engage in Dangerous Driving by Region
92
90
95
95
88
91
99
91
95
93
94
0 20 40 60 80 100
TOTAL
Brisbane
Ipswich
Redcliffe
Gold Coast
Sunshine Coast
Toowoomba
Mackay
Townsville
Cairns
Rockhampton
Percentage

© 2011 Roy Morgan Research 43
FARES
• The overall score for the fares KPI was very high at 96%. Passengers were generally charged a correct/reasonable fare, were taken via a cost efficient route, and were rarely charged illegitimate fees.
Fares KPI ScoreBase: Total QLD (n=1265), Brisbane (n=262), Ipswich (n=102), Redcliffe (n=95), Gold Coast (n=162), Sunshine Coast (n=140), Toowoomba (n=100),
Mackay (n=87), Townsville (n=111), Cairns (n=123), Rockhampton (n=83); Standard (n=952), Wheelchair Accessible/ High Occupancy (n=248), Luxury/ Premium (n=33).
Fares KPI Score by Region & Taxi Type
9696
98
9695
979697
9095
100979799
0 10 20 30 40 50 60 70 80 90 100
Total QLD
Brisbane
Ipswich
Redcliffe
Gold Coast
Sunshine Coast
Toowoomba
Mackay
Townsville
Cairns
Rockhampton
Standard
Wheelchair Accessible/ High Occupancy
Luxury/ Premium
Reg
ion
Taxi
Typ
e
Percentage

© 2011 Roy Morgan Research 44
Fares
• In 94% of trips the tariff applied was correct and on very few trips did the driver offer a cash or non-metered trip (1%).
• Passengers considered that the correct fare was charged and that the most cost efficient route was taken in 9 of 10 trips.
Fares
94 9889 90
0
10
20
30
40
50
60
70
80
90
100
Tariff Correct Driver Did Not Offer Cash or Non-Meter
Correct Fare Charged Cost Efficient Route Taken
Perc
enta
ge
C2. Correct tariff?, A12. Driver offered “cash or non-meter” travel, C6. Correct fare charged?, C11. Used a cost efficient route.Base: Total QLD (n=1265).

© 2011 Roy Morgan Research 45
Was the Applied Tariff Correct? By Region & Taxi Type
C2. Correct tariff?Base: Total (n=1265), Brisbane (n=262), Ipswich (n=102), Redcliffe (n=95), Gold Coast (n=162), Sunshine Coast (n=140), Toowoomba (n=100), Mackay
(n=87), Townsville (n=111), Cairns (n=123), Rockhampton (n=83); Standard (n=952), Wheelchair Accessible/ High Occupancy (n=248), Luxury/ Premium (n=33).
• Passengers indicated that the correct tariff was applied for 94% of journeys taken. For 3% of journeys the passenger was unsure whether the correct tariff was applied or not.
• The correct tariff was applied in a significantly lower proportion of journeys taken in Sunshine Coast (89%) and Toowoomba taxis(85%).
• Comments generally indicated that the passengers were unsure about which tariff had been applied due to the position or visibility of the meter.
Correct Tariff Applied by Region
94
94
98
92
98
89
85
98
95
98
100
0 20 40 60 80 100
TOTAL
Brisbane
Ipswich
Redcliffe
Gold Coast
Sunshine Coast
Toowoomba
Mackay
Townsville
Cairns
Rockhampton
Percentage
Correct Tariff Applied by Taxi Type
94
95
94
100
0 20 40 60 80 100
TOTAL
Standard
WheelchairAccessible/
HighOccupancy
Luxury/Premium
Percentage

© 2011 Roy Morgan Research 46
Cash or Non-Meter TravelBy Region & Taxi Type
Driver Did Not Offer "Cash or Non-Meter" Travel by Region
98
97
99
100
98
99
96
100
100
97
99
0 20 40 60 80 100
TOTAL
Brisbane
Ipswich
Redcliffe
Gold Coast
Sunshine Coast
Toowoomba
Mackay
Townsville
Cairns
Rockhampton
Percentage
A12. Driver offered “cash or non-meter” travelBase: Total (n=1265), Brisbane (n=262), Ipswich (n=102), Redcliffe (n=95), Gold Coast (n=162), Sunshine Coast (n=140), Toowoomba (n=100), Mackay
(n=87), Townsville (n=111), Cairns (n=123), Rockhampton (n=83); Standard (n=952), Wheelchair Accessible/ High Occupancy (n=248), Luxury/ Premium (n=33).
• Passengers were only offered “Cash or Non-Meter Travel” in 1% of the journeys taken.• This proportion was relatively consistent across regions, although it should be noted that in 100% of journeys taken
the driver did not offer non-meter travel in Redcliffe, Mackay and Townsville or in wheelchair accessible/ high occupancy taxis.
Driver Did Not Offer Cash or Non-Meter Travel by Taxi Type
98
98
100
97
0 20 40 60 80 100
TOTAL
Standard
WheelchairAccessible/
HighOccupancy
Luxury/Premium
Percentage

© 2011 Roy Morgan Research 47
Total Correct Fare Charged (Standard and TSS Fare) by Region
89
87
93
83
93
84
83
100
94
87
93
0 20 40 60 80 100
TOTAL
Brisbane
Ipswich
Redcliffe
Gold Coast
Sunshine Coast
Toowoomba
Mackay
Townsville
Cairns
Rockhampton
Percentage
Passenger Thought Correct Fare Was Charged By Region & Taxi Type
C6. Correct fare charged?Base: Total (n=1265), Brisbane (n=262), Ipswich (n=102), Redcliffe (n=95), Gold Coast (n=162), Sunshine Coast (n=140), Toowoomba (n=100), Mackay
(n=87), Townsville (n=111), Cairns (n=123), Rockhampton (n=83); Standard (n=952), Wheelchair Accessible/ High Occupancy (n=248), Luxury/ Premium (n=33).
• The correct fare was charged in a significantly higher proportion of Gold Coast (93%), Mackay (100%) and Townsville taxis (94%),as well as amongst standard taxis (88%).
• It was perceived that the correct fare was charged in a significantly lower proportion of trips in wheelchair accessible/ high occupancy taxis (69%).
• Comments regarding incorrect charges indicated that drivers “rounded up” fares, or that the passenger was unsure about why they had been charged more than was shown on the meter.
Total Correct Fare Charged by Taxi Type
84
88
69
85
0 20 40 60 80 100
TOTAL
Standard
WheelchairAccessible/
HighOccupancy
Luxury/Premium
Percentage

© 2011 Roy Morgan Research 48
Cost Efficient RouteBy Region & Taxi Type
C11. Used a cost efficient routeBase: Total (n=1265), Brisbane (n=262), Ipswich (n=102), Redcliffe (n=95), Gold Coast (n=162), Sunshine Coast (n=140), Toowoomba (n=100), Mackay
(n=87), Townsville (n=111), Cairns (n=123), Rockhampton (n=83); Standard (n=952), Wheelchair Accessible/ High Occupancy (n=248), Luxury/ Premium (n=33).
• In 90% of journeys the passenger indicated that the driver took a cost efficient route (to the best of their knowledge). • For only 3% of journeys did the passenger indicate that the route taken by the driver was not cost efficient.• A significantly higher proportion of Toowoomba (97%), Mackay (100%) and standard taxis (94%) took a cost efficient route, while
significantly lower proportions in Ipswich (82%) and in wheelchair accessible/ high occupancy taxis (89%) did so.• Comments about cost efficient route generally indicated that the driver went the best way, or took a short cut to miss traffic or
other obstacles.
Driver Took a Cost Efficient Route by Region
87
87
82
90
90
97
100
90
93
94
0 20 40 60 80 100
Brisbane
Ipswich
Redcliffe
Gold Coast
Sunshine Coast
Toowoomba
Mackay
Townsville
Cairns
Rockhampton
Percentage
Driver Took a Cost Efficient Route by Taxi Type
90
89
94
94
0 20 40 60 80 100
TOTAL
Standard
WheelchairAccessible/
HighOccupancy
Luxury/Premium
Percentage

© 2011 Roy Morgan Research 49
PROCESSING OF FARES
• The area which requires the most improvement to boost KPI scores is in the processing of fares at 31%. This end of trip service was generally poor, with drivers failing to offer receipts or explain extra fees or charges.
Processing of Fares KPI ScoreBase: Total QLD (n=1265), Brisbane (n=262), Ipswich (n=102), Redcliffe (n=95), Gold Coast (n=162), Sunshine Coast (n=140), Toowoomba (n=100),
Mackay (n=87), Townsville (n=111), Cairns (n=123), Rockhampton (n=83); Standard (n=952), Wheelchair Accessible/ High Occupancy (n=248), Luxury/ Premium (n=33).
Processing of Fares KPI Score by Region & Taxi Type
3132
30
3134
1531
4125
2958
3220
17
0 10 20 30 40 50 60 70 80 90 100
Total QLD
Brisbane
Ipswich
Redcliffe
Gold Coast
Sunshine Coast
Toowoomba
Mackay
Townsville
Cairns
Rockhampton
Standard
Wheelchair Accessible/ High Occupancy
Luxury/ Premium
Reg
ion
Taxi
Typ
e
Percentage

© 2011 Roy Morgan Research 50
Processing of Fares
• While 94% of drivers servicing people with disability returned the TSS card without being prompted and 98% of drivers accepted the payment method offered by passengers, just 9% of drivers explained the fees or tolls charged and 45% offered a receipt.
Processing of Fares
94
9
98
45
0
10
20
30
40
50
60
70
80
90
100
Returned TSS Card Fee/toll Charges Explained Driver Accepted Payment Method Driver Offered Receipt
Perc
enta
ge
C4. Returned TSS card without promptingBase: Total QLD (n=1265).
C5. Driver accepted intended payment method, C10. Driver offered a receiptBase: Total QLD (n=1265).
C9.Were fee/toll charges explained?Base: Total QLD (n=1265).

© 2011 Roy Morgan Research 51
Returned TSS Card Without PromptingBy Region & Taxi Type
C4. Returned TSS card without promptingBase: Total used TSS card (n=68), Brisbane (n=29), Ipswich (n=0), Redcliffe (n=0), Gold Coast (n=0), Sunshine Coast (n=11), Toowoomba
(n=5), Mackay (n=7), Townsville (n=0), Cairns (n=16), Rockhampton (n=0); Standard (n=8), Wheelchair Accessible/ High Occupancy (n=54), Luxury/ Premium (n=0).
Note: * Denotes small sample size.
• The driver returned passengers’ TSS cards without prompting in 94% of journeys where a TSS card was used (5% of all journeys). In 4% of cases the passenger had to request the return of the card.
Driver Returned TSS Card Without Prompting by Taxi Type
94
75
100
0 20 40 60 80 100
TOTAL
Standard*
WheelchairAccessible/
HighOccupancy
Luxury/Premium
Percentage
Driver Returned TSS Card Without Prompting by Region
94
100
91
100
100
81
0 20 40 60 80 100
TOTAL
Brisbane*
Ipswich
Redcliffe
Gold Coast
Sunshine Coast*
Toowoomba*
Mackay*
Townsville
Cairns*
Rockhampton
Percentage

© 2011 Roy Morgan Research 52
Illegitimate Fees & Were Fee/Toll Charges Explained
Were Fee/Toll Charges Explained
9
91
0 20 40 60 80 100
Yes
No
Percentage
Illegitimate Fees
98
2
0 20 40 60 80 100
No IllegitimateFees Charged
Total Charged atLeast One
Illegitimate Fee
Percentage
C8. Illegitimate fees chargedBase: Total (n=1265).
C9. Were fee/toll charges explained?Base: Total paid at least one fee (n=1073).
• In only 2% of the journeys evaluated was a passenger charged an illegitimate fee.• Out of all trips where at least one fee was charged (including legitimate fees), only 9% of drivers explained what the
fees were for (either unprompted or at the passengers’ request). The remaining 91% of drivers did not explain what the fees charged were for.
• Negative comments regarding the explanation of fees and charges generally show that passengers were unsure about what fees they had been charged and why.

© 2011 Roy Morgan Research 53
Were Fee/Toll Charges Explained & Driver Offered a Receipt By Region
C9. Were fee/toll charges explained?Base: Total paid at least one fee (n=1073), Brisbane (n=239), Ipswich
(n=101), Redcliffe (n=85), Gold Coast (n=133), Sunshine Coast (n=119), Toowoomba (n=54), Mackay (n=73), Townsville (n=82), Cairns (n=104), Rockhampton (n=83).
• Fees charged were explained in a significantly lower proportion of Ipswich (4%) and Toowoomba (2%) taxis.• In 45% of the journeys evaluated the driver offered a receipt without having to be asked.• A receipt was offered for significantly higher proportions of journeys in Brisbane (52%), Gold Coast (68%) and
Mackay taxis (77%).
Were Fee/Toll Charges Explained by Region
10
4
6
5
13
2
27
10
6
6
0 10 20 30 40 50
Brisbane
Ipswich
Redcliffe
Gold Coast
Sunshine Coast
Toowoomba
Mackay
Townsville
Cairns
Rockhampton
Percentage
Driver Offered a Receipt by Region
52
26
52
68
30
31
77
41
33
28
0 20 40 60 80 100
Brisbane
Ipswich
Redcliffe
Gold Coast
Sunshine Coast
Toowoomba
Mackay
Townsville
Cairns
Rockhampton
PercentageC10. Driver Offered a ReceiptBase: Total (n=1265), Brisbane (n=262), Ipswich (n=102), Redcliffe
(n=95), Gold Coast (n=162), Sunshine Coast (n=140), Toowoomba (n=100), Mackay (n=87), Townsville (n=111), Cairns (n=123), Rockhampton (n=83); Standard (n=952), Wheelchair Accessible/ High Occupancy (n=248), Luxury/ Premium (n=33).

© 2011 Roy Morgan Research 54
Driver Accepted Intended Payment MethodBy Region & Taxi Type
C5. Driver accepted intended payment methodBase: Total (n=1265), Brisbane (n=262), Ipswich (n=102), Redcliffe (n=95), Gold Coast (n=162), Sunshine Coast (n=140), Toowoomba (n=100),
Mackay (n=87), Townsville (n=111), Cairns (n=123), Rockhampton (n=83); Standard (n=952), Wheelchair Accessible/ High Occupancy (n=248), Luxury/ Premium (n=33).
• The driver accepted the passengers’ intended payment method in 98% of all journeys taken. • Comments regarding the acceptance of the intended payment method generally showed that the drivers were happy
to accept various form of payment. In some cases the drivers specifically requested cash or were reluctant to process an electronic payment.
Driver Accepted Intended Payment Method by Region
98
97
99
99
98
99
98
100
100
95
100
0 20 40 60 80 100
TOTAL
Brisbane
Ipswich
Redcliffe
Gold Coast
Sunshine Coast
Toowoomba
Mackay
Townsville
Cairns
Rockhampton
Percentage
Driver Accepted Intended Payment Method by Taxi Type
98
98
98
100
0 20 40 60 80 100
TOTAL
Standard
WheelchairAccessible/
HighOccupancy
Luxury/Premium
Percentage

© 2011 Roy Morgan Research 55
JOURNEY EXPERIENCE
• The KPI score for journey experience was 58%. This score may appear low due to the fact that double the weight is given to ratings of “Very satisfactory” than to ratings of “Satisfactory”. Overall 89% of journeys were rated as satisfactory or higher.
• Journey experience KPI scores were significantly lower in Brisbane (39%), Cairns (48%) and Mackay (48%).
Journey Experience KPI ScoreBase: Total QLD (n=1265), Brisbane (n=262), Ipswich (n=102), Redcliffe (n=95), Gold Coast (n=162), Sunshine Coast (n=140), Toowoomba (n=100),
Mackay (n=87), Townsville (n=111), Cairns (n=123), Rockhampton (n=83); Standard (n=952), Wheelchair Accessible/ High Occupancy (n=248), Luxury/ Premium (n=33).
Journey Experience KPI Score by Region & Taxi Type
5956
53
5839
5672
6070
7852
6448
70
0 10 20 30 40 50 60 70 80 90 100
Total QLD
Brisbane
Ipswich
Redcliffe
Gold Coast
Sunshine Coast
Toowoomba
Mackay
Townsville
Cairns
Rockhampton
Standard
Wheelchair Accessible/ High Occupancy
Luxury/ Premium
Reg
ion
Taxi
Typ
e
Percentage

© 2011 Roy Morgan Research 56
Overall Journey Experience
• Almost 4 in 10 taxis trips (38%) were evaluated as being very satisfactory with more than half rated as satisfactory (52%).• The objective for the Department is to encourage the taxi industry to work on moving the majority of journey experience ratings
from “Satisfactory” to “Very satisfactory”.• Passengers generally used the comments to praise the driver for providing a satisfactory journey experience.• Comments regarding unsatisfactory ratings tended to explain why the journey was not satisfactory, such as errors with destinations
or speeding and dangerous driving.Overall Journey Experience
52 7 2138
0% 10% 20% 30% 40% 50% 60% 70% 80% 90% 100%
Total
Percentage
Very Satisfactory (4) Satisfactory (3) Unsatisfactory (2) Very Unsatisfactory (1) No Answer
Total Satisfactory
Mean (Out of 4)
89% 3.3
D2. Overall Journey ExperienceBase: Total QLD (n=1265).

© 2011 Roy Morgan Research 57
Overall Journey ExperienceBy Region
D2. Overall journey experienceBase: Total QLD (n=1265), Brisbane (n=262), Ipswich (n=102), Redcliffe (n=95), Gold Coast (n=162), Sunshine Coast (n=140), Toowoomba (n=100),
Mackay (n=87), Townsville (n=111), Cairns (n=123), Rockhampton (n=83).
• For 89% of the journeys evaluated, the passenger indicated that they were satisfied with the trip overall. The mean satisfaction score was 3.3 (where 4 is very satisfactory and 1 is very unsatisfactory).
• The total proportion of satisfied passengers was significantly lower for Brisbane (79%), and significantly higher for Ipswich (95%), Redcliffe (98%), Toowoomba (96%) and Townsville (95%).
Total Satisfied Mean (out of 4)Overall Journey Experience by Region
38
21
22
47
34
55
61
34
38
27
65
52
58
74
51
59
36
35
53
57
57
27
7
19
4
1
5
7
7
5
7
2
2
1
1
6
3
8
1
1
1
1
1
3
6
0% 10% 20% 30% 40% 50% 60% 70% 80% 90% 100%
TOTAL
Brisbane
Ipswich
Redcliffe
Gold Coast
Sunshine Coast
Toowoomba
Mackay
Townsville
Cairns
Rockhampton
PercentageVery Satisfactory (4) Satisfactory (3) Unsatisfactory (2) Very Unsatisfactory (1) No Answer
89% 3.3
79% 3.0
95% 3.2
98% 3.5
93% 3.3
91% 3.5
96% 3.6
87% 3.2
95% 3.3
84% 3.1
92% 3.5

© 2011 Roy Morgan Research 58
SUMMARY
• In summary, the QLD taxi industry is performing quite well at this point in time with an overall KPI
score of 77% achieved. While a KPI score over 70% is generally considered to be satisfactory, there is still room for improvement in the taxi industry’s performance, particularly in the areas of processing of fares, driver service/characteristics and journey experience.
• Performance was consistent across regions, times of day, and most other journey attributes. No stand out areas of concern were observed that have not already been noted at the overall state level.
• To summarise, performance is generally high across KPI measures. To improve performance it is recommended that the Department focus on:• Making the processing of fares more transparent by providing detailed itemised receipts;• Addressing customer service standards of drivers, in particular offering passengers receipts and
behaving in a professional manner; and• Addressing incidences of dangerous driving such as speeding or weaving in and out of lanes
through further driver training.

© 2011 Roy Morgan Research 59
Overall KPI Score Breakdown by Region
9 9 9 99 9 10 10 10 9 10
22 20 22 22 24 23 22 22 22 2121
1716
19 18 17 17 20 16 18 1718
1515
15 14 16 1314
17 16 1616
34
1 3 42
2 2 21
35 7 5
68 4
63
6
6 5 6 7 5 6 5 6 5 6 8
55
0
10
20
30
40
50
60
70
80
90
100
Total QLD Brisbane Ipswich Redcliffe Gold Coast SunshineCoast
Toowoomba Mackay Townsville Cairns Rockhampton
Perc
enta
ge
Taxi Company Service Taxi Characteristics Driver Service/Characteristics Safety Fares Processing of Fares Journey Experience
Summary
Overall KPI ScoreBase: Total QLD (n=1265), Brisbane (n=262), Ipswich (n=102), Redcliffe (n=95), Gold Coast (n=162), Sunshine Coast (n=140), Toowoomba (n=100),
Mackay (n=87), Townsville (n=111), Cairns (n=123), Rockhampton (n=83).
• The graph below shows the contribution of each individual KPI to the Overall KPI score, broken down by region. There were no significant differences in the overall KPI score between regions.
• In general, the areas of service that require improvement when compared to the Ideal KPI score are Processing of
Fares (achieving 33% of the ideal), Journey Experience (achieving 50% of the ideal) and Driver Service/
Characteristics (achieving 76% of the ideal).
77%73%
78% 81% 79% 77%81% 80% 78%
74%81%
100%
Ideal KPI Score Breakdown
11
29
19
15
9
7
10
0
10
20
30
40
50
60
70
80
90
100
Perc
enta
ge
Journey ExperienceProcessing of FaresFaresSafetyDriver Service/CharacteristicsTaxi CharacteristicsTaxi Company Service