taxometric evidence for the dimensional structure … · taxometric evidence for the dimensional...
TRANSCRIPT
Journal of Personality Disorders, 23(6), 606–628, 2009 2009 The Guilford Press
TAXOMETRIC EVIDENCE FORTHE DIMENSIONAL STRUCTUREOF CLUSTER-C, PARANOID, ANDBORDERLINE PERSONALITY DISORDERS
Arnoud Arntz, �, David Bernstein, �, Dominique Gielen, �,Myrthe van Nieuwenhuyzen, �, Krystle Penders, �,
�Au: Degrees?Nick Haslam, �, and John Ruscio�
Despite a lively debate about the dimensional vs. categorical nature ofPersonality Disorders (PDs), direct empirical tests of the underlyingstructure are missing for most PDs. Taxometrics can be used to investi-gate whether latent structures are categorical or dimensional. We inves-tigated the latent structure underlying Avoidant, Dependent, Obses-sive-Compulsive, Depressive, Paranoid, and Borderline PD by means ofthree types of taxometric analyses. SCID-II based DSM-IV PD criterionscores from 1,816 patients from Mental Health and Forensic Institutes,and 63 nonpatients, were analyzed with three types of taxometric anal-yses. MAMBAC, MAXEIG, and L-MODE taxometric analyses were ap-plied on multiple criteria sets, constituted both on theoretical groundsand randomly. Assumptions for taxometric analyses were generallymet. All but two of the 78 taxometric analyses indicated greater evi-dence for a latent dimensional structure, with better fit of empiricaldata to dimensional than to taxonic simulations; mean ComparativeCurve Fit Index (CCFI) = .23, SD = .09. Only two analyses yielded am-biguous evidence (CCFI in the .40–.60 range) and none indicated taxo-nic structure.
Following the classification of Personality Disorders (PDs) on a separateaxis in the DSM-III (American Psychiatric Association, 1980), a central de-bate on the conceptualization of PDs has focused upon whether or not PDsare extreme positions on underlying dimensions, or qualitatively differentfrom normal personality (Haslam, 2003; Widiger & Clark, 2000). It hasbeen argued that categorical approaches are more suitable for clinicians
From the Department of Clinical Psychological Science, University of Maastricht, The Nether-lands (A. A., D. B., D. G., M.V.N., K. P.); Department of Psychology, University of Melbourne,Australia (N. A.); Psychology Department, The College of New Jersey (J. R.).
We thank Erik Schouten, BSc, for his help with computations.
Address correspondence to Arnoud Arntz, Department of Clinical Psychological Science,University of Maastricht, PO Box 616, NL-6200 MD Maastricht, The Netherlands; E-mail:[email protected]
606

PERSONALITY DISORDERS ARE DIMENSIONAL 607
(Haslam, 2003; Rounsaville et al., 2002; First et al., 2002; Livesley, 2003;Widiger & Clark, 2000; Widiger & Mullins-Sweatt, 2005). Categories canbe used in a pragmatic sense whether the underlying structure is dimen-sional or not. But, the use of categorical diagnoses in the DSM has createdthe impression that the underlying structure of PDs is categorical; i.e., thatthere is a qualitative, and not just a quantitative difference between peoplewith a specific PD and those without it. Categories assume the existenceof boundaries, discrete or fuzzy, between normality and abnormality. Thiscategorical thinking influences both the theoretical and the clinical viewswe have about PDs. For instance, the idea that people with a PD cannotprofit from psychological treatments because of a fundamental flaw intheir character was until recently very common. Moreover, whether weview PDs as essentially dimensional or categorical, influences our researchmethodologies and how we interpret empirical findings. For example, if theunderlying construct is dimensional, diagnostic thresholds are essentiallyarbitrary. If so, a small change can have a great impact on prevalenceestimates. Moreover, according to some authors, defining PDs as catego-ries with arbitrary boundaries leads to the idea that the large numbers ofcomorbid diagnoses indicate that patients have many discrete psychiatricdiseases, whereas a dimensional understanding of psychopathology wouldsuggest that patients differ in their profiles (Haslam, 2003; Widiger & Sam-uel, 2005).
Conceptual problems, as well as practical and ideological argumentshave dominated the debate. There has been a lack of direct empirical testscomparing categorical and dimensional models, although results from fac-tor-analytic, longitudinal, and validity studies have been interpreted asgenerally more supportive of dimensional than of categorical conceptual-izations (Blackburn, Logan, Renwick, & Donnelly, 2005; Durbin & Klein,2006; Hong et al., 2005; Pukrop & Krischer, 2005; Saulsman & Page,2004; Skodol et al., 2005; Ullrich, Borkenan, & Morneros, 2001). Thestructure of PDs has therefore been considered as perhaps the most cru-cial unresolved issue in the study of PDs (Endler & Kocovski, 2002). Untilrecently statistical procedures for such comparisons, known as taxome-trics, were difficult to apply and had to rely on subjective judgementsabout the shape of curves (Waller & Meehl, 1998). Recent advancementshave solved these problems (Ruscio, Ruscio, & Meron, 2007). In brief, tax-ometrics refers to a group of statistical procedures developed to testwhether empirical data indicate that a construct should be viewed as adimension or as a taxon (i.e., a latent class differing in kind from its com-plement class). A number of procedures is available to check datasets forthe distribution of latent constructs underlying observed manifestationson characteristics that indicate dimensionality vs. taxonicity. By simula-tion methods and application of fit indices, objective tests of taxonicityversus dimensionality are now available (Ruscio et al., 2007). In general itis recommended to use several methods to check for consistency. If allmethods yield the same outcome, the evidence is much stronger than the

608 ARNTZ ET AL.
outcome of one method, because different methods are based on differentassumptions and procedures.
Previous studies found evidence for dimensionality in Borderline PD(Ayers, 2000; Rothschild, Cleland, Haslam, & Zimmerman, 2003;1 Simp-son, 1994; Trull, Widiger, & Guthrie, 1990). Meehl (2001) commented thatthe evidence in the Trull et al. study was not unequivocal as the lack of acentral peak might have been caused by low base rate of Borderline PDand inchworm tests lacked. Evidence for taxonicity of schizotypy andschizotypal PD was found in many studies (Haslam, 2003; Blanchard,Gangestad, Brown, & Horan, 2000; Horan, Blanchard, Gangestad, &Kwapil, 2004; Korfine & Lenzenweger, 1995; Lenzenweger, 1999; Lenzen-weger & Korfine, 1992; Tyrka et al. 1995). Evidence for taxonicity of Anti-social PD and psychopathy was mixed, with four studies reporting taxonicstructure (Ayers, 2000; Harris, Rice, & Quinsey, 1994; Skilling, Harris,Rice, & Quinsey, 2002; Vasey, Kotov, Frick, & Loney, 2005; Edens, Mar-cus, Lilienfeld, & Poythress, 2006) and three studies dimensional struc-ture (Edens et al., 2006; Marcus, John, & Edens, 2004; Marcus, Lilienfeld,Edens, & Poythress, 2006). Most PDs have not been investigated at all inthis respect. Given the discussion whether the PD construct in the DSM-V should remain categorical or become dimensional, (Rounsaville et al.,2002; First et al., 2002; Widiger & Simonsen, 2005), there is an urgentneed to investigate the latent structure of most PDs.
The aim of the present study was to investigate the underlying structureof six common PDs in a large mixed sample of nonpatients, and patientswith and without PDs who were assessed with the SCID-II for DSM-IV(First, Gibbon, Spitzer, Williams, & Benjamin, 1997). The PDs investigatedby us were Avoidant, Dependent, Obsessive-compulsive, Depressive, Para-noid, and Borderline PD. These PDs were sufficiently common in our sam-ple to allow using taxometric procedures.
METHODPARTICIPANTS
Data were available for 1,879 people (1,245 women). Sixty-three were non-patients, who participated in various studies. Of the 1,816 patients, 1,803sought treatment at mental health centers in the Netherlands (RIAGG-Maastricht; Psychiatric Hospital Vijverdal, & Dr. Poelsoord, Maastricht;GGzE, Eindhoven; Psychiatric Hospital Valerius, Amsterdam; Parnassia,The Hague; Vincent van Gogh Institute, Venray) and Belgium (CGG-Has-selt, CGG-Munster, Medical Centre St. Jozef Kortenhoef, Psychiatric Hos-pital Rekem, Psychiatric Hospital Ziekeren). Thirteen patients were incar-
1. A review by Haslam (2003) concluded that the Rothschild et al. (2003) data supportedtaxonicity of BPD. This was based on preliminary analyses. The final analyses supported adimensional structure, as published by Rothschild et al. (2003).
PERSONALITY DISORDERS ARE DIMENSIONAL 609
cerated in prisons or forensic hospitals in Belgium (Antwerpen, Brugge,Gent, Rekem). The mean age was 33.03 (SD 10.75). Based on SCID-IIscores, there were 400 Avoidant, 74 Dependent, 222 Obsessive-Compul-sive, 40 Passive-Aggressive, 175 Depressive, 95 Paranoid, 11 Schizotypal,11 Schizoid, 7 Histrionic, 7 Narcissistic, 169 Borderline, and 33 Anti-SocialPDs diagnosed in the sample; 1,142 (60.8%) of the sample did not meet aPD diagnosis. None of the nonpatients received a PD diagnosis. Data wascollected as part of standard assessment or as part of specific researchprojects. In the latter case, participants gave written consent after full ex-planation of the study.
MATERIALS
We used the Dutch version of the Structured Clinical Interview for DSM-IV Axis-II Personality Disorders (SCID-II; First et al., 1997; Weertman, Arntz,& Kerkhofs, 2000). For research purposes, cut-off points were not usedand all criteria of all PDs were assessed. The very few “inadequate informa-tion” (?) ratings were recoded to “absent or false” (1) ratings. Axis-2 criteriawere assessed by 46 interviewers, trained by our research group. In a test-retest study with two different interviewers we found adequate ICC’s (md =.76) for PD trait scores (Weertman, Arntz, Dreessen, Van Velzen, & Ver-tommen, 2003). In a second study 151 taped SCID-II interviews were ratedtwice by independent raters from our pool of raters. ICC’s were excellentfor sumscores of the six pertinent PDs: Avoidant PD .90, Dependent PD.92, Obsessive-Compulsive PD .89, Depressive PD .95, Paranoid PD .85,Borderline PD .95 (median .91, range .85&ndash.95; Lobbestael, Arntz, &Bernstein, 2008). Of five of these PDs cell sizes allowed to estimate Cohen’sKappa for diagnostic interrater agreement: Avoidant PD .83, DependentPD .83, Obsessive-Compulsive PD .87, Depressive PD .94, Borderline PD.91. Cronbach alpha’s of the PD sumscores in the present study indicatesufficient homogeneity of the scales, Avoidant .82, Dependent .70, Obses-sive-Compulsive .70, Depressive .77, Paranoid .71, Borderline .87, with allcriteria having adequate item-rest correlations. We checked the factorialvalidity by confirmatory factor analysis using structural equation model-ing (Joreskog & Sorbom, 2002). The fit of the criteria to the 6 pertinent PDswas good, Comparative Fit Index = .94, Standardized Root Mean SquareResidual = .053. Correlations corrected for attenuation between latent fac-tors varied from .22 to .71, between raw sumscores from .21 to .55. PDsumscores were therefore sufficiently independent.
STATISTICAL ANALYSES
The following three taxometric methods were used, so that consistencyover methods could be checked.
First, Mean Above Minus Below A Cut (MAMBAC; Meehl & Yonce, 1994)is a procedure that is based on the idea that if taxa exist, there must be

610 ARNTZ ET AL.
an optimal cutting score on a quantitative property of these taxa. Thiscutting score minimizes the number of false-positive and false-negativeclassifications. In absence of taxonic structure, an optimal cutting scoredoes not exist. The procedure uses one input indicator of the construct,and one output indicator. The mean difference on the output indicatorbetween subsamples left and right to scores of the input indicator is plot-ted as function of the latter. If the data are taxonic a peaked curve is ex-pected, whereas no peak is expected for dimensional data. We performedMAMBAC using 50 equally-spaced cuts located 25 cases from each end ofthe input indicator; variables served in all pairwise input/output indicatorcombinations.
Second, MAXimum EIGenvalue (MAXEIG; Waller & Meehl, 1998) exam-ines inter-indicator association within ordered subsamples of cases to testwhether the indicators covary due to a mixture of latent taxa or due to theindicators’ shared loadings on a latent dimension. Within a subsamplethat contains a relatively pure group of either taxon or complement mem-bers, there is little association between indicators. In contrast, associa-tions among indicators is high in subsamples that contain a mixture ofgroups because taxon members tend to score high and complement mem-bers score low on the indicators. MAXEIG uses an input indicator of theconstruct, and two or more output indicators. The approach is multivari-ate: the largest eigenvalue of the covariances of the output indicators isused as association parameter. As for MAMBAC, taxonic data are expectedto yield a peaked curve and dimensional data are not. We performed MAXEIGusing 50 windows that overlapped 90% with one another; each variableserved once as input indicator, with all other variables serving as outputindicator.
Third, Latent Mode (L-MODE; Waller & Meehl, 1998) is based on factoranalysis. By plotting the distribution of individuals’ scores on a single la-tent factor calculated through factor analysis L-MODE seeks to differenti-ate taxonic and dimensional latent structure. Taxonic data are expectedto yield bimodal score distributions, whereas dimensional data are ex-pected to yield unimodal score distributions.
Calculations were done in R (R Foundation for Statistical Computing,Vienna, Austria; http://www.r-project.org/) with Ruscio’s taxometric pro-grams (http://www.taxometricmethod.com/). To interpret results, 10 sam-ples of dimensional and 10 samples of taxonic comparison data were gen-erated using an approach grounded in the bootstrap; for the latter, caseswere assigned to groups using a base-rate classification method (Ruscio,
�Au: Any up-in press�; Ruscio et al., 2007). For these procedures indicator sets have to date?
be constructed. For MAMBAC the minimum number of indicators is two,for MAXEIG it is three, L-MODE needs multiple indicators. Ruscio, Has-lam, & Ruscio (2006) suggest constructing criterion sets based on empiri-cal, theoretical, or content-related arguments. For each PD we thereforeconstituted two sets of three or four indicators each by combining criteriaon the basis of the criteria’s content. Themes of the theoretical indicator

PERSONALITY DISORDERS ARE DIMENSIONAL 611
sets are described in the Appendix. The two theoretical sets for ParanoidPD were based on Bernstein and Useda (2006). For Borderline PD, empiri-cally derived factor models constituted the basis for the sets (Sanislow etal., 2002; Clarkin, Hull, & Hurt, 1993; Hurt et al., 1990; Morey, 1991; Lives-ley & Schroder, 1991; Zanarini, Gunderson, Frankenburg, & Chauncey,1989). We also constructed three sets per PD by randomly assigning thecriteria to indicators. The minimum number of variables per indicator wasset at 2. The 1–2-3 SCID-II criterion ratings were used to approach conti-nuity better than with dichotomous scores. Table 1 presents the indicatorsets. For MAMBAC, each indicator served as output variable, with the sumof the other two as input variable. For MAMBAC and MAXEIG, we alsoused each of the PD criteria (for MAXEIG, all pairs of criteria) as outputindicator(s), with the remaining criteria scores summed as input indicator,to get a more continuous input indicator. For MAMBAC and MAXEIG, all
TABLE 1. Overview of the Indicator Sets
Indicator 1 Indicator 2 Indicator 3 Indicator 41
Avoidant PDTheoretical 1 1, 2 3, 6 4, 5, 7Theoretical 2 2, 7 1, 3 4, 5, 6Random 1 6, 3 7, 4 1, 2, 5Random 2 2, 4 1, 3 5, 6, 7Random 3 2, 6 5, 7 1, 3, 4
Dependent PDTheoretical 1 1, 2 3, 5 4, 6 7, 8Theoretical 2 1, 2, 4 3, 5 6, 7, 8Random 1 1, 7 2, 8, 6 3, 4, 5Random 2 3, 4 1, 7, 8 2, 5, 6Random 3 2, 5, 6 1, 3, 8 4, 7
Obsessive-Compulsive PDTheoretical 1 1, 2 3, 5 4, 6, 7, 8Theoretical 2 1, 6 3, 5, 7 2, 4, 8Random 1 1, 6, 3 7, 2, 4 5, 8Random 2 4, 8 6, 7, 2 1, 3, 5Random 3 1, 6, 2 3, 8, 7 4, 5
Depressive PDTheoretical 1 2, 7 3, 5 1, 4, 6Theoretical 2 1, 2, 7 3, 5 4, 6Random 1 4, 5 2, 7 1, 3, 6Random 2 2, 4 1, 6 3, 5, 7Random 3 6, 7 2, 5 1, 3, 4
Paranoid PDTheoretical 1 1, 2 3, 4, 7 5, 6Theoretical 2 2, 7 1, 3 4, 5, 6Random 1 2, 7 1, 5, 3 4, 6Random 2 4, 3, 7 6, 2 1, 5Random 3 5, 3 2, 4, 7 6, 1
Borderline PDTheoretical 1 2, 3, 7, 9 4, 5 1, 6, 8Theoretical 2 1, 2, 3 4, 5, 8 6, 7, 9Random 1 1, 3, 9 5, 6, 8 2, 4, 7Random 2 3, 4, 8 1, 2, 9 5, 6, 7Random 3 1, 6, 9 2, 3, 5 4, 7, 8
Note. Numbers indicate the DSM-IV number of the specific PD criterion.1Only for Dependent PD one of the sets consisted of four indicators because of theoreti-cal (content) reasons.
612 ARNTZ ET AL.
permutations were analyzed. Ruscio’s programs yield aggregated output ofthe results of all permutations. For L-MODE, computations were done onthe separate DSM-IV PD criterion scores.
The number of 10 bootstraps seems small, but a recent study (Ruscio &Kaczetow, under review) indicates that this suffices. In the first place, itshould be noted that the number of bootstrap samples (B) needed, de-pends on the nature of the application. For example, to construct a CI, it’snot unusual to use B = 1,000 or more so that the tails of an empiricalsampling distribution can be defined well. On the other hand, to estimatethe SE of a statistic, it’s not unusual to use B = 25 to 200. To the extentthat the statistic in question is fairly stable from sample to sample, forexample if N is large, low values of B suffice to estimate its variability. Inthe context of taxometrics, multiple bootstrap samples are used only tocalculate a series of M values that constitute an averaged curve. Also, eachof the B curves is itself an averaged curve across a series of analyses gener-ated by using indicators in all possible configurations. In sum, becausetaxometric studies usually have fairly large N (and the present study hascertainly a large N) and what’s being obtained is an average of alreadyaveraged curves, it should not be too surprising that a small value of Bsuffices.
�Au: Add toSecondly, the results from the Ruscio and Kaczetow (under review)� refs.
study for different levels of B underscores the fact that it makes little dif-ference how large B is. Across all 25,000 target data sets in the simulationstudy, an increase in B from 10 to 25 or 50 did not yield a statisticallysignificant increase in the accuracy of the CCFI as calculated for MAXEIGanalyses: At B = 10, the CCFI threshold of .50 correctly identifed taxonicvs. dimensional structure 92.4% of the time, and at B = 50 accuracy was93.0%.
Third, if one uses too small a value of B in any bootstrap application,the results would be affected to a greater extent by sampling error. Thiswould not introduce a systematic bias, but it would make it more difficultto obtain consistent results across any series of analyses. Thus, if thepresent results turn out to be consistent, it indicates that B could not havebeen problematically low.
The following checks were done to assess whether the data were ade-quate for taxometric analyses (Meehl, 1995; Ruscio et al., 2006). (1) Theputative taxon sample sizes should be large enough. In the case of N = 300(the suggested minimum for taxometrics) it is recommended to have atleast 10% (n = 30) of the sample to be putative taxon members. For largerN’s not the relative but the absolute sample size is important (Ruscio et al.2006). We restricted our analyses to PDs with >n ≥ 70; (2) The (nuisance)correlations between indicators within putative taxon and complementgroups should be lower than .30. As can be seen in Table 2, this require-ment was met in most sets. Only 14 (9%) of the 156 correlations were >.30,most of them very near .30; (3) The indicator validities should be largeenough, i.e. Cohen’s d > 1.25 when putative taxon and complement groups

PERSONALITY DISORDERS ARE DIMENSIONAL 613
are compared on the indicator. Table 2 shows this is the case for 76(97.4%) of the 78 indicator sets. The two lower d ’s (1.11, 1.17) were verynear 1.25; (4) The sample should not be specifically selected on the puta-tive taxon membership, as this may lead to pseudotaxonicity. E.g., a mixedsample of BPD patients and controls not meeting any BPD criterion mightyield invalid conclusions, as bimodality is built in. We used an unselectedpatient sample, with 63 nonpatients added, in which distributions of num-ber of PD criteria were not affected by biased sampling. Inspection of crite-rion sumscores frequency plots did not indicate obvious bimodality; (5)The indicators should be quasi-continuous. We analysed composite scoresof PD criteria (MAMBAC and MAXEIG); (6) The choice of indicators shouldbe valid. By using SCID-II PD criteria scores we stayed as close as possibleto the constructs as defined by the DSM-IV. Semi-structured clinical inter-views like the SCID-II are more valid than questionnaires or clinical im-pressions; (7) Indicators should be nonoverlapping. Because we usedDSM-IV criteria, content overlap between the observed variables was mini-mal; in constructing the theory-based indicator sets, we attempted toavoid higher order content overlap between the sets; (8) Simulationsshould demonstrate that taxonic and dimensional latent constructs canbe distinguished given the characteristics of each data set. All parallelanalyses of taxonic and dimensional comparison data yielded distinguish-able results.
Results were evaluated as follows. First, by visual inspection of plotsyielded by the original data, and visual comparison of them with simulatedtaxonic and dimensional plots. Parallel analyses of comparison data canbe informative because the expected curve shapes for taxonic and dimen-sional data are ideals that can be influenced by many data characteristics.Second, results were evaluated by checking consistency of base rate esti-mates within and across methods. Lack of consistency may indicate di-mensional structure, and high consistency may indicate taxonic structure(Waller & Meehl, 1998; Ruscio et al., 2006; see Ruscio, 2007, for empiricalstudy of this consistency test). Third, results were evaluated by calculatingthe Comparison Curve Fit Index (CCFI), an objective measure that quanti-fies the relative similarity of results for the empirical data to those of taxo-nic and dimensional comparison data (Ruscio et al., 2007). The CCFI givesan indication to what degree the observed distribution fits more with di-mensional simulation (<.5), with CCFI = 0 as perfect dimensional fit, ormore with taxonic simulation (>.5), with CCFI = 1 as perfect taxonic fit.CCFI = .50 denotes equivalent evidence. In a Monte Carlo study, Ruscioand Kaczetow (under review) found evidence for high accuracy (larger than.95 in most of the data conditions they investigated) of the CCFI whenoutside the .40–.60 region. Thus, in the present study we interpreted aCCFI <.40 as indicating dimensionality; a CCFI >.60 as taxonicity; and aCCFI in the .40–.60 range as ambiguous. Several rigorous studies showthat the use of comparison data, when quantified using the CCFI, identifytaxonic and dimensional data with an impressive degree of validity that

TABLE 2. Author: Please Provide Table Title
Indicator Correlations within: Base Rates of:Fit of Data with Simulation of:
Indicator Taxon Complement Taxon AveragedValidity (d) Group Group Group Curve Taxon Dimension Comparison
M SD M SD M SD M SD M RMSR RMSR CCFI
Avoidant PDMAMBAC
Model 1 (th1) 2.41 0.43 −0.11 0.22 0.39 0.14 0.11 0.14 0.05 0.19 0.03 0.15Model 2 (th2) 2.40 0.27 0.06 0.04 0.08 0.11 0.32 0.03 0.31 0.20 0.03 0.12Model 3 (r1) 2.40 0.17 −0.12 0.12 0.34 0.11 0.15 0.13 0.15 0.15 0.03 0.17Model 4 (r2) 2.45 0.25 0.04 0.05 0.11 0.11 0.30 0.06 0.29 0.43 0.04 0.08Model 5 (r3) 2.30 0.15 0.13 0.05 0.04 0.06 0.39 0.09 0.38 0.41 0.05 0.11Summed criteria 1.67 0.19 0.02 0.09 0.06 0.07 0.30 0.08 0.29 0.26 0.03 0.11
MAXEIGModel 1 (th1) 2.18 1.30 0.36 0.11 0.12 0.20 0.23 0.11 0.21 0.11 0.02 0.15Model 2 (th2) 2.37 0.40 0.11 0.04 0.14 0.22 0.24 0.09 0.23 0.12 0.03 0.20Model 3 (r1) 2.24 0.08 0.15 0.14 0.13 0.21 0.26 0.07 0.24 0.12 0.02 0.16Model 4 (r2) 2.40 0.13 0.03 0.02 0.21 0.14 0.24 0.02 0.24 0.10 0.03 0.20Model 5 (r3) 2.34 0.30 0.14 0.05 0.13 0.12 0.26 0.05 0.25 0.10 0.03 0.25Summed criteria 1.71 0.19 0.01 0.09 0.07 0.08 0.27 0.12 0.23 0.07 0.03 0.27
L-MODEAll criteria 1.59 0.24 0.06 0.08 0.02 0.05 0.43 NA NA NA NA NA
Dependent PDMAMBAC
Model 1 (th1) 1.84 0.15 −0.04 0.21 0.03 0.05 0.22 0.05 0.20 0.27 0.05 0.15Model 2 (th2) 1.97 0.24 −0.16 0.16 0.01 0.04 0.22 0.16 0.21 0.44 0.04 0.08Model 3 (r1) 2.31 0.48 −0.04 0.11 0.07 0.05 0.19 0.01 0.19 0.32 0.04 0.10Model 4 (r2) 2.57 0.36 −0.13 0.13 0.20 0.07 0.10 0.09 0.03 0.19 0.06 0.23Model 5 (r3) 2.23 0.09 0.03 0.05 0.07 0.04 0.22 0.03 0.22 0.34 0.02 0.06Summed criteria 1.45 0.31 −0.01 0.13 0.04 0.05 0.18 0.03 0.18 0.23 0.07 0.24
MAXEIGModel 1 (th1) 2.27 0.53 −0.09 0.20 0.13 0.06 0.10 0.04 0.08 0.10 0.04 0.30Model 2 (th2) 1.85 1.82 0.12 0.31 0.14 0.07 0.17 0.01 0.16 0.10 0.05 0.35Model 3 (r1) 2.00 0.83 0.01 0.52 0.27 0.01 0.13 0.03 0.12 0.12 0.06 0.33Model 4 (r2) 2.01 1.73 0.31 0.07 0.21 0.02 0.15 0.04 0.13 0.14 0.04 0.24Model 5 (r3) 2.16 0.86 0.10 0.25 0.27 0.08 0.12 0.02 0.12 0.12 0.04 0.26Summed criteria 1.48 0.30 −0.02 0.14 0.04 0.06 0.17 0.20 0.08 0.08 0.02 0.20
L-MODEAll criteria 1.17 0.15 0.02 0.12 −0.02 0.02 0.50 NA NA NA NA NA

Obsessive-Compulsive PDMAMBAC
Model 1 (th1) 2.21 0.04 −0.12 0.16 0.19 0.13 0.17 0.16 0.11 0.32 0.06 0.16Model 2 (th2) 2.23 0.03 −0.16 0.16 0.22 0.12 0.15 0.14 0.11 0.34 0.07 0.16Model 3 (r1) 2.04 0.33 −0.06 0.13 0.05 0.13 0.25 0.02 0.25 0.19 0.05 0.20Model 4 (r2) 1.86 0.27 −0.04 0.14 −0.001 0.09 0.33 0.02 0.33 0.22 0.04 0.15Model 5 (r3) 1.97 0.22 −0.10 0.08 0.04 0.09 0.25 0.07 0.24 0.26 0.03 0.10Summed criteria 1.11 0.36 0.02 0.09 −0.01 0.04 0.41 0.38 0.00 0.17 0.06 0.26
MAXEIGModel 1 (th1) 1.90 0.19 −0.003 0.03 0.05 0.10 0.28 0.04 0.29 0.09 0.04 0.31Model 2 (th2) 1.82 0.16 0.12 0.14 0.10 0.23 0.33 0.11 0.37 0.08 0.04 0.35Model 3 (r1) 2.10 0.13 −0.08 0.08 0.18 0.13 0.19 0.08 0.19 0.07 0.02 0.23Model 4 (r2) 1.99 1.33 0.03 0.13 0.23 0.12 0.20 0.10 0.19 0.11 0.04 0.28Model 5 (r3) 1.90 0.85 −0.08 0.33 0.24 0.10 0.21 0.10 0.20 0.09 0.03 0.24Summed criteria 1.28 0.33 −0.03 0.10 0.04 0.07 0.23 0.16 0.16 0.07 0.02 0.20
L-MODEAll criteria 1.31 0.52 0.03 0.07 −0.002 0.06 0.499 NA NA NA NA NA
Depressive PDMAMBAC
Model 1 (th1) 2.17 0.12 −0.08 0.05 0.07 0.08 0.30 0.02 0.30 0.25 0.06 0.19Model 2 (th2) 2.12 0.14 −0.08 0.07 0.06 0.09 0.31 0.05 0.32 0.18 0.06 0.25Model 3 (r1) 2.24 0.31 −0.08 0.13 0.18 0.14 0.23 0.04 0.23 0.22 0.04 0.17Model 4 (r2) 2.24 0.09 0.01 0.11 0.06 0.06 0.32 0.07 0.32 0.16 0.03 0.17Model 5 (r3) 2.32 0.18 −0.19 0.36 0.39 0.13 0.08 0.14 0.00 0.21 0.04 0.17Summed criteria 1.52 0.29 0.31 0.10 −0.03 0.10 0.24 0.11 0.25 0.13 0.04 0.24
MAXEIGModel 1 (th1) 2.06 1.50 0.18 0.17 0.23 0.10 0.25 0.06 0.26 0.12 0.04 0.25Model 2 (th2) 1.95 0.39 0.05 0.14 0.11 0.14 0.32 0.11 0.30 0.12 0.04 0.27Model 3 (r1) 1.95 1.51 0.25 0.22 0.31 0.19 0.22 0.08 0.23 0.13 0.03 0.21Model 4 (r2) 2.11 0.17 0.04 0.27 0.25 0.10 0.24 0.11 0.20 0.12 0.02 0.12Model 5 (r3) 2.16 1.15 0.19 0.04 0.25 0.13 0.25 0.06 0.24 0.09 0.02 0.21Summed criteria 1.48 0.23 −0.02 0.12 0.05 0.11 0.28 0.15 0.33 0.06 0.04 0.37
L-MODEAll criteria 1.33 0.38 0.05 0.12 −0.01 0.04 0.499 NA NA NA NA NA
Paranoid PDMAMBAC
Model 1 (th1) 2.30 0.63 −0.03 0.25 0.05 0.08 0.19 0.05 0.18 0.39 0.05 0.12Model 2 (th2) 1.47 0.42 0.13 0.12 −0.06 0.02 0.44 0.49 0.00 0.31 0.07 0.18Model 3 (r1) 2.27 0.34 −0.08 0.29 0.06 0.12 0.17 0.05 0.17 0.36 0.06 0.15Model 4 (r2) 2.55 0.38 −0.04 0.14 0.10 0.10 0.14 0.04 0.14 0.18 0.05 0.21Model 5 (r3) 1.60 0.39 0.03 0.24 −0.06 0.01 0.38 0.55 0.00 0.38 0.08 0.17Summed criteria 1.94 0.77 −0.03 0.11 0.08 0.10 0.09 0.09 0.00 0.16 0.05 0.25
(continued)

TABLE 2. Continued
Indicator Correlations within: Base Rates of:Fit of Data with Simulation of:
Indicator Taxon Complement Taxon AveragedValidity (d) Group Group Group Curve Taxon Dimension Comparison
M SD M SD M SD M SD M RMSR RMSR CCFI
MAXEIGModel 1 (th1) 2.39 1.08 0.07 0.18 0.17 0.20 0.11 0.04 0.11 0.09 0.04 0.31Model 2 (th2) 2.47 1.41 0.01 0.41 0.16 0.09 0.09 0.02 0.09 0.07 0.05 0.43Model 3 (r1) 2.08 1.64 0.19 0.06 0.18 0.03 0.11 0.04 0.12 0.11 0.04 0.29Model 4 (r2) 2.44 0.76 0.05 0.18 0.19 0.15 0.10 0.03 0.10 0.13 0.05 0.29Model 5 (r3) 2.27 1.29 0.05 0.24 0.14 0.14 0.09 0.03 0.09 0.09 0.04 0.31Summed criteria 1.78 0.64 −0.03 0.13 0.05 0.09 0.12 0.11 0.08 0.07 0.02 0.22
L-MODEAll criteria 1.32 0.50 0.04 0.11 −0.02 0.03 0.498 NA NA NA NA NA
Borderline PDMAMBAC
Model 1 (th1) 3.24 0.12 0.14 0.14 0.22 0.07 0.18 0.02 0.18 0.21 0.03 0.14Model 2 (th2) 3.08 0.10 0.18 0.07 0.13 0.04 0.20 0.02 0.20 0.12 0.08 0.396Model 3 (r1) 3.52 0.26 0.02 0.12 0.41 0.05 0.11 0.09 0.11 0.13 0.05 0.29Model 4 (r2) 3.25 0.23 0.16 0.06 0.18 0.03 0.18 0.02 0.18 0.12 0.04 0.24Model 5 (r3) 3.60 0.81 −0.03 0.09 0.53 0.03 0.07 0.12 0.00 0.14 0.06 0.31Summed criteria 2.08 0.33 0.07 0.09 0.09 0.06 0.18 0.06 0.18 0.10 0.04 0.27
MAXEIGModel 1 (th1) 3.26 0.19 0.13 0.06 0.36 0.07 0.11 0.01 0.11 0.09 0.04 0.29Model 2 (th2) 3.11 1.41 0.25 0.19 0.36 0.02 0.10 0.01 0.10 0.07 0.04 0.36Model 3 (r1) 3.36 0.91 0.16 0.11 0.43 0.05 0.11 0.01 0.11 0.08 0.04 0.31Model 4 (r2) 3.31 0.07 0.08 0.07 0.36 0.01 0.10 0.01 0.10 0.08 0.05 0.396Model 5 (r3) 3.28 0.91 0.26 0.22 0.42 0.05 0.10 0.02 0.10 0.05 0.05 0.50Summed criteria 2.38 0.44 0.01 0.09 0.20 0.07 0.10 0.05 0.08 0.07 0.02 0.22
L-MODEAll criteria 1.67 0.26 0.15 0.09 0.01 0.03 0.499 NA NA NA NA NA
Note. Results aggregated for all permutations (MAMBAC, MAXEIG). For each PD five models with 3 or 4 indicators consisting of summedPD criterion scores were run with MAMBAC and MAXEIG procedures. The first two models (th1, th2) were based on content considerations;the other three were based on randomly derived criteria groupings (r1-r3). MAMBAC and MAXEIG were also run with each (pair) of thecriteria as output indicator(s), and the other criterion scores summed as input indicator (“Summed criteria”). The L-MODE procedure wasrun on all available criteria of each PD. If applicable, weighted fit indices are reported.Abbreviations: PD, personality disorder; NA, not applicable; RMSR, root mean square residual; CCFI, comparative curve fit index.

PERSONALITY DISORDERS ARE DIMENSIONAL 617
surpasses that of several commonly used taxometric consistency tests(Ruscio, 2007; Ruscio & Marcus, 2007; Ruscio et al., 2007). Because theremay be small taxa among the PDs, it is important to note that each studyof the CCFI showed that it performed at least as well with the lowest taxonbase rates studied as with higher values. L-MODE output was only evalu-ated qualitatively by inspecting curves and comparing them to simulatedcurves, and interpreting base rate estimates, as no reliable fit indices havebeen identified so far for L-MODE. When maxima could be located at eitherend of the MAXEIG graphs, but were not visually detectable, we executedinchworm consistency tests (Waller & Meehl, 1998).
The L-Mode procedure provides several estimates of the taxon base rate(Waller & Meehl, 1998). For the present study one estimate was derivedfollowing the guidelines of Waller and Meehl (1998). When the two baserate estimates derived from the location of the two modes in the distribu-tion of estimated factor scores were close to .50, their average was used.When the base rate was less than .50, the estimate from the upper modewas used; when the base rate was greater than .50, the estimate from thelower mode was used.
RESULTS
The results are presented in Table 2. For each PD, MAMBAC, and MAXEIGsummary graphs of all first theoretical sets and L-Mode summary graphsof all criteria are presented in Figures 1 and 2.2 Observed patterns can becompared to taxonic and dimensional simulations.
Avoidant PD. Visual inspection of the graphs favored dimensional struc-ture. Inchworm tests gave no evidence for a hidden taxonic structure. Fig-ure 1, left column, shows graphs of MAMBAC and MAXEIG analyses withtaxonic and dimensional simulations of the first theoretical set, and L-Mode graphs of all criteria. MAMBAC analyses yielded divergent meantaxon base rate estimates, range .11–.39 (Table 1). The base rate estimatesfrom the MAXEIG procedure were more consistent across the different sets(mean .25, range .23–.27), overlapping with the base mean base rate esti-mate of all MAMBAC analyses (.26). Note that DSM-IV defined avoidantPD was present in 21.3% of the cases. L-MODE yielded a much higherbase rate estimate however (.43). RMSRs and CCFIs (range .08–.27) pointedunequivocally to dimensional structure. None of the indices favored a taxo-nic structure.
Dependent PD. The graphs suggested dimensional structure. Inchwormtests gave no evidence for hidden taxonicity. Figure 1, mid column, showsgraphs of MAMBAC and MAXEIG analyses with taxonic and dimensionalsimulations of the first theoretical set, and L-Mode graphs of all criteria.MAMBAC analyses yielded somewhat divergent mean taxon base rate esti-
2. All graphs can be inspected at http://www.epp.unimaas.nl

FIGURE 1. Observed (bold) and simulated curve ranges of MAMBAC and MAXEIG procedures for the first theoretical indicator sets and of L-Mode for allcriteria of Avoidant PD (left column), Dependent PD (middle column) and Obsessive-Compulsive PD (right column). Observed curves are averaged acrossresults of all permutations of indicator sets (MAMBAC, MAXEIG). For both taxonic and dimensional structures, 10 simulations were done. Observedcurves resemble simulated dimensional curves better than simulated taxonic curves.
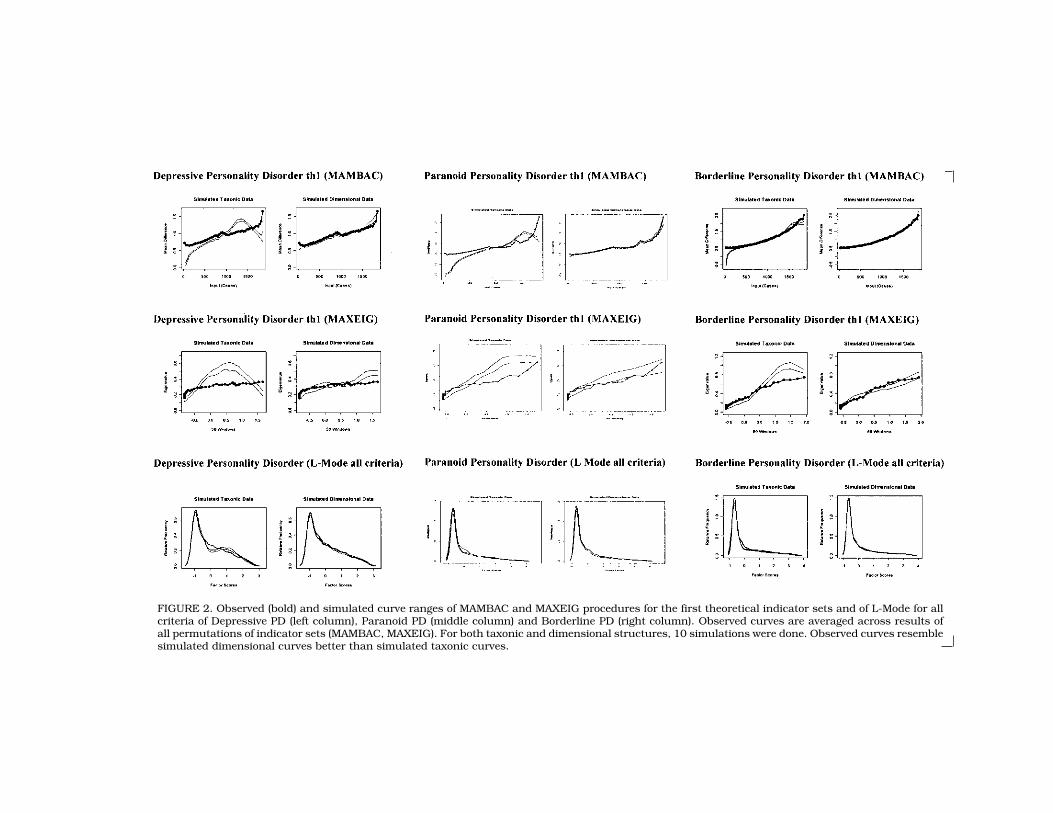
FIGURE 2. Observed (bold) and simulated curve ranges of MAMBAC and MAXEIG procedures for the first theoretical indicator sets and of L-Mode for allcriteria of Depressive PD (left column), Paranoid PD (middle column) and Borderline PD (right column). Observed curves are averaged across results ofall permutations of indicator sets (MAMBAC, MAXEIG). For both taxonic and dimensional structures, 10 simulations were done. Observed curves resemblesimulated dimensional curves better than simulated taxonic curves.

620 ARNTZ ET AL.
mates, range .10–.22 (Table 1). The base rate estimates from the MAXEIGprocedure were more consistent (mean .14, range .10–.17). L-MODE yieldeda much higher base rate estimate (.50). All RMSRs and CCFIs (range .06–.35) favoured dimensional structure.
Obsessive-Compulsive PD. The graphs suggested stronger fit with dimen-sional than with taxonic simulations. Inchworm tests gave no evidence fora hidden taxonic structure. Figure 1, right panel, shows graphs of MAMBACand MAXEIG analyses with taxonic and dimensional simulations of thefirst theoretical set, and L-Mode graphs of all criteria. MAMBAC analysesyielded highly divergent mean taxon base rate estimates, range .15–.41(mean = .26; Table 1). The base rate estimates from the MAXEIG procedurewere a bit more consistent (mean .24, range .19–.33). DSM-IV defined Ob-sessive-Compulsive PD was present in 11.8% of the cases, much less thanthe estimates of these analyses. L-MODE yielded a much higher base rateestimate however (.499). RMSRs and CCFIs (range .10–.27) suggest di-mensional structures.
Depressive PD. Visual inspection of the graphs unequivocally favoureddimensional structure. Inchworm tests gave no evidence for a hidden taxo-nic structure. Figure 2, left panel, shows graphs of MAMBAC and MAXEIGanalyses with taxonic and dimensional simulations of the first theoreticalset, and L-Mode graphs of all criteria. MAMBAC analyses yielded divergentmean taxon base rate estimates, range .08–.32 (Table 1). Again, base rateestimates from the MAXEIG procedure were more consistent (range .22–.32), the mean (.26) consistent with the mean of 6 MAMBAC analyses (.25).Depressive PD according to DSM-IV was present in much less cases(9.3%). L-MODE yielded a much higher base rate estimate (.499). RMSRsand CCFIs (range .12–.37) all indicated dimensional structures.
Paranoid PD. Visual inspection of simulation output graphs indicatedgood discrimination of taxonic and dimensional structures, and higher re-semblance of observed data results with dimensional than with taxonicsimulations. Inchworms tests did not indicate hidden taxonicity. Figure2, mid column, shows examples. Estimated base rates within and acrossprocedures diverged (Table 1). MAMBAC estimates ranged from .09 to .44,MAXEIG estimates were much lower (mean = .10) and consistent, range.09–.12, whilst L-Mode had a much higher estimate, .498. All but one fitindex indicated greater evidence for dimensional than for taxonic struc-ture (CCFI: .12–.31). One CCFI was in the ambiguous range (.43).
Borderline PD. The graphs indicated higher fit with simulated dimen-sional than with simulated taxonic distributions (Figure 2, right column).Estimated taxon base rates were relatively consistent (MAMBAC mean =.15, range .07–.20; MAXEIG mean = .10, range .10–.11). But, L-Mode hada divergent base rate estimate, .499. DSM-IV defined BPD was present in9% of the cases. All CCFIs (range .14–.50) favored dimensionality however,with one exception (MAXEIG, random set 3), which pointed at equivocalevidence for taxonic and dimensional structure. Borderline PD sets were abit hampered by too high within complement group correlations (perhaps

PERSONALITY DISORDERS ARE DIMENSIONAL 621
related to the strong internal consistency of the Borderline scale). Thoseanalyses not suffering from this nuisance correlation all supported dimen-sional structure. In sum, Borderline PD was the only PD where in oneanalysis equal evidence for taxonicity and dimensionality was found, butthe rest of the evidence was in favor of a dimensional structure.
Overall summary. All but two of the 78 analyses yielded greater evidencefor underlying dimensional than for taxonic structure. Two analysesyielded indecisive results. The CCFI’s had an average (and median) of .23(SD .09; SE .011), indicating latent dimensional structure. In sum, thedata quite consistently fitted dimensional simulations better than taxonicsimulations.
DISCUSSIONOur data were suitable for taxometric analyses, as indicated by indicator-validity, nuisance correlations, and simulations of taxonic and dimen-sional structures, which yielded distinguishable graphs. Based on visualinspection, variability in base rate estimates, and most importantly on fitwith simulations, all but two taxometric analyses indicated that each ofthe 6 PDs investigated should be viewed more as dimensional than as tax-onic. The only two exceptions were one of the 12 CCFIs of BPD, and one ofthe 12 CCFIs of Paranoid PD, who were in the range of CCFIs that indicateambiguity with regard to evidence for dimensional vs. taxonic structure.Thus, our results suggest that the six studied PDs should be conceptual-ized as extreme positions on an underlying dimensional construct. Thefindings on Borderline PD are in line with findings in four previous studies(Ayers, 2000; Rothschild et al., 2003; Simpson, 1994; Trull et al., 1990).To the best of our knowledge, there have been no earlier taxometric studiesinvestigating the underlying structure of the other five PDs
It is noteworthy that taxometric studies so far have suggested that somePDs are taxonic, whereas others seem dimensional (Haslam, 2003; Roths-child et al., 2003). Taxometric studies quite consistently suggested thatschizotypy or Schizotypal PD is taxonic; but divergence about AntisocialPD and psychopathy is reported (Ayers, 2000; Edens et al., 2006; Harriset al., 1994; Haslam, 2003; Marcus et al., 2004, 2006; Skilling et al., 2002;Vasey et al., 2005). The PDs we investigated appear to be dimensional.Perhaps Axis-II in the DSM-V should not be uniform in its use of dimen-sional or categorical approach, the choice depending on empirical evidencefor each PD (Haslam, 2003; Rothschild et al., 2003).
Evidence that a PD has a dimensional nature does not necessarily implythat it can be adequately understood and described by dimensional mod-els of normal personality, although some tend to conclude so (Haslam,2003; Rothschild et al., 2003; Edens et al., 2006). This is because the PDcriteria may not have been incorporated in studies of normal personality,or may be so infrequently reported in samples from normal population,that derived personality models don’t adequately represent specific mal-

622 ARNTZ ET AL.
adaptive features of PDs (Pukrop & Krischer, 2005; Shedler & Westen,2004). Furthermore, in normal samples more general factors, like neuroti-cism, might overshadow more subtle dimensions that are informative forclinicians. Sampling strategies strongly influence the degree to which gen-eral differences in psychpathology dominate factor analytic studies, orwhether more subtle factors in types of psychopathology can be found.Thus, although PDs may be dimensional, PD dimensions might be onlydetectable in samples with high rates of pathological behaviors. The degreeto which normal personality models, like the 5-factor model (Costa & Widi-ger, 2001; Lynam & Widiger, 2001) can sufficiently cover the type of per-sonality problems clinicians deal with should in our view be a researchissue in itself, and not be solely decided on the basis of evidence for dimen-sionality of PDs. Thus, in our view the present findings should not betaken as direct evidence that PDs represent the extremes of normal per-sonality dimensions.
Confirmatory factor analysis demonstrated that criteria of the 6 PDs weinvestigated fitted very well with a model with each PD representing a sep-arate factor. This is in line with a model in which each PD is representedas a separate dimension (or taxon), and replicates an earlier study withDSM-III-R based SCID-II data (Arntz, 1999). Further studies are needed totest this issue over the full range of DSM-IV PDs.
One limitation of the present study is that the proportion of putativetaxon members was rather low when we base the proportions on the usualDSM-IV diagnoses (except for Avoidant PD). There is lack of fundamentalresearch into the issue to what degree taxometric procedures can detecttaxa when present in small proportions. Nevertheless, one Monte Carlodemonstration suggests that especially MAXEIG is capable to detect verysmall taxon proportions (up to .0025) when the taxon sample size is n =100, and the other conditions are favorable (good indicator validity, lownuisance correlations, no indicator skew; Waller & Ross, 1997). Note thatfive of the six PDs investigated in the present study had sample sizes fromvery near 100 (Paranoid, n = 95) up to 400 (Avoidant, n = 400); and four ofthe six PDs were present in 9% or more of the cases (Avoidant, 21.3%;Obsessive-Compulsive, 11.8%; Depressive, 9.3%; Borderline, 9.0%), sothat we should have been capable of detecting taxonicity in at least 5 ofthe 6 PDs. Only Dependent PD was perhaps problematic in this respect (n =74, 3.9%). Furthermore, not arbitrarily defined taxon boundaries, as DSM-IV thresholds are more or less, but “true” boundaries influence the validityof the analyses. Base rate estimates from the taxometric analyses for allsix PDs were well above 10%. In further support of high enough putativetaxon sample sizes, the graphs of dimensional and taxonic simulationswere clearly distinguishable. Lastly, one empirical study demonstratedthat taxometric procedures were capable to detect a taxon with a samplesize as low as n = 35 in a total sample of N = 1,055 (Waller & Ross, 1997).
A similar issue is the sample size of the complement class. If not largeenough, failure to detect taxa might result. The present data set contained

PERSONALITY DISORDERS ARE DIMENSIONAL 623
data from 63 nonpatients and 1,079 patients without PD. Furthermore,the sample sizes of subjects not meeting any (subthreshold) criterion ofthe 6 PDs were: Avoidant PD: 596; Dependent PD 772; Obsessive-Compul-sive PD 522; Depressive PD 553; Paranoid PD 882: Borderline PD: 910. Atotal of 111 participants did not meet any (subthreshold) criteria of these6 PDs. Taken together, these figures indicate that the complement classeswere large enough to detect taxa.
Another limitation is that taxon studies are only as good as the indica-tors that are used in the study. Some have questioned whether PDs arewell-represented by the DSM-IV criteria. Other criteria might have pro-duced other results.
A third limitation is that taxometrics represent only one means of invest-igating the latent structure of PDs. Evidence from taxometric studiesshould be combined with results from other types of studies. Nevertheless,our results converge with results from a wide variety of approaches, in-cluding factor analysis (Blackburn et al., 2005), stability studies (Durbin& Klein, 2006), and validity studies (Pukrop & Krischer, 2005; Saulsman& Page, 2004; Skodol et al., 2005; Ullrich et al., 2001).
A fourth limitation is related to the statistical methods we used. Al-though there is increasing evidence for the robustness and validity of themethods we used, and especially for the use of bootstrap methods to createcomparison samples and to calculate the CCFI, these methods are rela-tively new, and therefore our conclusions are accordingly tentative. Morespecifically, higher number of bootstrap samples might have lead to some-what more precise estimates, although a recent study indicated that theincrease in accuracy of the CCFI was negligible when the number of boot-strap samples was increased from 10 to 50 (Ruscio & Kaczetow, underreview). Future fundamental studies should determine to what degreemore drastic increases in number of bootstrap samples result in increasedaccuracy. On the other hand, Ruscio and Kaczetow (under review) demon-strated that CCFIs outside the .40–.60 range have very high accuracies,above 95% for a variety of sample distribution conditions. As 70 of the 72CCFIs in the present study were smaller than .40, 2 were in the ambiguousrange, and none was larger than .60, our results seem robust in indicatingthat the underlying constructs are dimensional.
Strong points of our study include the use of clinical interview-basedcriterion scores, which reduce nuisance correlation caused by responsebias (Rothschild et al., 2003) and relate the findings to the DSM-IV con-struct of PDs. We had a very large sample, varying from nonpatients, toaxis-1 patients with none to some PD features, to patients with differentkinds and severities of PDs. Care was taken to avoid pseudotaxonicity,which can result when two extreme samples (e.g., nonpatients and PD pa-tients) are combined in the dataset. Furthermore, we assessed both ran-domly grouped indicator sets and sets constructed on theoretical contentconsiderations, and results were consistent. We also used multiple taxo-metric procedures to test for consistency. The use of simulations and the

624 ARNTZ ET AL.
recently developed CCFI, made our analyses more objective as we did nothave to rely on subjective decisions about graphs.
A treatment implication of dimensional views on PDs might be that it isnot wise to view these PDs as completely different from axis-1 disorders,not amenable, for instance, to psychotherapy. Recent findings indicatethat specialized forms of psychotherapy that build upon methods andtechniques with demonstrated effectiveness for axis-1 disorders are indeedeffective for many PDs (Giesen-Bloo et al., 2006; Leichsenring & Leibing,2003; Perry, Banon, & Ianni, 1999).
In conclusion, we found strong and consistent evidence for latent di-mensions underlying borderline, paranoid, depressive, and cluster-CPDs. Replications are needed, especially for the five PDs that we were thefirst to taxometrically analyze. More important, the PDs that were not yettaxometrically investigated (Schizoid, Passive-Aggressive, Narcissistic,and Histrionic PD) should be tested. These studies will help to better un-derstand personality pathology, aid diagnoses, and case conceptualiza-tions, and hopefully help to base the DSM-V PD constructs on empiricalgrounds.
APPENDIX. RATIONALE OF THEORETICAL CRITERIA SETS
AVOIDANT PD
The first theoretical indicator set consisted of indicator 1 = social avoidance (1, 2);indicator 2 = inferiority (3, 6); indicator 3 = embarrassment (4, 5, 7). The secondtheoretical set of indicator 1 = risk avoidance (2, 7); indicator 2 = contact avoid-ance (1, 3); indicator 3 = (self)criticism (4, 5, 6).
DEPENDENT PD
The first theoretical indicator set consisted of indicator 1 = decision making (1, 2);indicator 2 = subjugation/self-sacrifice (3, 5); indicator 3 = cannot be alone (4, 6);indicator 4 = abandonment (7, 8). The second theoretical set of indicator 1 = makesothers responsible (1, 2, 4); indicator 2 = subjugation/self-sacrifice (3, 5); indicator3 = needs others for care (6, 7, 8).
OBSESSIVE COMPULSIVE PD
The first theoretical indicator set consisted of indicator 1 = details & perfectionism(1, 2); indicator 2 = productivity (3, 5); indicator 3 = rigidity and norms (4, 6, 7, 8).The second theoretical set of indicator 1 = control (1, 6); indicator 2 = economy (3,5, 7); indicator 3 = high standards (2, 4, 8).
DEPRESSIVE PD
The first theoretical indicator set consisted of indicator 1 = worthlessness (2, 7);indicator 2 = criticism (3, 5); indicator 3 = pessimism (1, 4, 6). The second theoreti-cal set of indicator 1 = negative mood & self-view (1, 2, 7); indicator 2 = criticism(3, 5); indicator 3 = worry (4, 6).

PERSONALITY DISORDERS ARE DIMENSIONAL 625
PARANOID PD
The first theoretical indicator set consisted of indicator 1 = preoccupation with ideathat others have bad intentions (criteria 1, 2); indicator 2 = trusting issues (criteria3, 4, 7); and indicator 3 = anger and grudge (criteria 5, 6). The second theoreticalset consisted of indicator 1 = suspiciousness (criteria 2, 7); indicator 2 = abuse ex-pectation (1, 3); indicator 3 = hypersensitivity (4, 5, 6).
BORDERLINE PD
The first theoretical indicator set (see Sanislow et al. 2002;) consisted of indicator1 = disturbed relatedness (2, 3, 7, 9); indicator 2 = behavioral dysregulation (4, 5);indicator 3 = affective dysregulation (1, 6, 8). The second theoretical set (derivedfrom Clarkin et al., 1993; Hurt et al., 1990; Morey, 1991; Livesley & Schroder,1991; Zanarini et al., 1989) of indicator 1 = unstable self/relationships (1, 2, 3);indicator 2 = impulsive (self-) damaging behavior (4, 5, 8); indicator 3 = affectiveproblems (6, 7, 9).
REFERENCES
American Psychiatric Association. (1980). Di- interpersonal circle, and psychopathy.Journal of Personality Disorders, 19,agnostic and statistical manual of men-
tal disorders, third edition. Washing- 597–623.Clarkin, J. F., Hull, J. W., & Hurt, S. W.ton, DC: American Psychiatric Press.
�Au: Not cited inAmerican Psychiatric Association. (1994)�. (1993). Factor structure of borderlinetext. Please cite
Diagnostic and statistical manual of personality disorder criteria. Journal or remove.
mental disorders, fourth edition. Wash- of Personality Disorders, 7, 137–143.Costa, P. T., & Widiger, T. A. (Eds.) (2001).ington, DC: American Psychiatric Press.
Arntz, A. (1999). Do personality disorders ex- Personality disorders and the five-fac-tor model of personality. (2nd ed.).ist? On the validity of the concept and
it’s cognitive-behavioural formulation Washington, DC: American Psycholog-ical Association.and treatment. Behaviour Research
and Therapy, 37, S97–S134. Durbin, C. E., & Klein, D. N. (2006). Ten-yearstability of personality disorders amongAyers, W. A. (2000). Taxometric analysis of
borderline and antisocial personality outpatients with mood disorders. Jour-nal of Abnormal Psychology, 115, 75–84.disorders in a drug and alcohol depen-
dent population. Dissertation Abstracts Edens, J. F., Marcus, D. K., Lilienfeld, S. O.,& Poythress, N. G. (2006). Psycho-International: Section-B: The Sciences
and Engineering, 61, 1684. pathic, not psychopath: Taxometricevidence for the dimensional structureBernstein, D. P., & Useda, J. D. (2006). Para-
noid personality disorder. In K. Fowler, of psychopathy. Journal of AbnormalPsychology, 115, 131–144.S. Lilienfeld, W. O’Donohue, (Eds.).
Handbook of personality disorders. Endler, N. S., & Kocovski, N. L. (2002). Per-�Au: City?�Sage Publications. sonality disorders at the crossroads.
Journal of Personality Disorders, 16,Blanchard, J. J., Gangestad, S. W., Brown,S. A., & Horan, W. P. (2000). Hedonic 487–502.
First, M. B., Bell, C. B., Cuthbert, B., Krys-capacity and schizotypy revisited: Ataxometric analysis of social anhedo- tal, J. H., Malison, R., Offord, D. R., et
al. (2002). Personality disorders andnia. Journal of Abnormal Psychology,109, 87–95. relational disorders: A research agenda
for addressing crucial gaps in DSM. InBlackburn, R., Logan C., Renwick, S.J.D., &Donnelly J. P. (2005). Higher-order D. J. Kupfer, M. B. First, D. E. Regier,
eds. A research agenda for DSM-V. (pp.dimensions of personality disorder:Hierarchical structure and relation- 123–199). Washington, DC: American
Psychiatric Association.ships with the five-factor model, the

626 ARNTZ ET AL.
First, M. B., Gibbon, M., Spitzer, R. L., Wil- ture of maximum covariance analysis.Journal of Abnormal Psychology, 108,liams, J.B.W., & Benjamin, L. S.
(1997). User’s guide for the structured 182–187.Lenzenweger, M. F., & Korfine, L. (1992).clinical interview for DSM-IV axis II per-
sonality disorders (SCID-II). Washing- Confirming the latent structure andbase rate of schizotypy: A taxometricton, DC: American Psychiatric Press.
Giesen-Bloo, J., Van Dyck, R., Spinhoven, analysis. Journal of Abnormal Psychol-ogy, 101, 567–571.P., Van Tilburg, W., Dirksen, C., Van
Asselt, T., et al. (2006). Outpatient Livesley, W. J. (2003). Diagnostic dilemmasin classifying personality disorder. Inpsychotherapy for borderline person-
ality disorder: Randomized trial of K. A. Phillips, M. B. First, & H. A. Pin-cus (Eds.). Advancing DSM: Dilemmasschema-focused therapy vs transfer-
ence-focused psychotherapy. Archives in psychiatric diagnosis. (pp. 53–90).Washington, DC: American Psychiat-of General Psychiatry, 63, 649–658.
Harris, G. T., Rice, M. E., & Quinsey, V. L. ric Association.Livesley, W. J., & Schroder, M. L. (1991). Di-(1994). Psychopathy as a taxon: Evi-
dence that psychopaths are a discrete mensions of personality disorder: TheDSM-III-R cluster B diagnoses. Jour-class. Journal of Consultıng and Clini-
cal Psychology, 62, 387–397. nal of Nervous and Mental Disease,179, 320–328.Haslam, N. (2003). The dimensional view of
personality disorders: A review of the Lobbestael, J., Arntz, A., & Bernstein, D.(2008). Disentangling the relationshiptaxometric evidence. Clinical Psycho-
logical Review, 23, 75–93. between different types of childhoodtrauma and personality disorders.Hong, J. P., Samuels, J., Bienvenu, O. J., Hsu,
F. C., Eaton, W. W., Costa, P. T., & Nes- Submitted for publication.Lynam, D. R., & Widiger, T. A. (2001). Usingtadt, G. (2005). The longitudinal rela-
tionship between personality disorder the five factor model dimensions torepresent the DSM-IV personality dis-dimensions and global functioning in a
community-residing population. Psy- orders: An expert consensus approach.Journal of Abnormal Psychology, 110,chological Medicine, 35, 891–895.
Horan, W. P., Blanchard, J. J., Gangestad, 401–412.Marcus, D. K, John, S., & Edens, J. F.S. W., & Kwapil, T. R. (2004). The psy-
chometric detection of schizotypy: Do (2004). A taxometric analysis of psy-chopathic personality. Journal of Ab-putative schizotypy indicators identify
the same latent class? Journal of Ab- normal Psychology, 113, 626–635.Marcus, D. K., Lilienfeld, S. C., Edens, J. F.,normal Psychology, 113, 339–357.
Hurt, S. W., Clarkin, J. F., Widiger, T. A., & Poythress, N. G. (2006). Is antisocialpersonality disorder continuous or cat-Fyer, M. R., Sullivan, T., Stone, M. H.
et al. (1990). Evaluation of DSM III de- egorical? A taxometric analysis. Psy-chological Medicine, 36, 1571–1581.cision rules for case detection using
joint conditional probability struc- Meehl, P. E. (1995). Bootstraps taxometrics:Solving the classification problem intures. Journal of Personality Disorders,
4, 121–130. psychopathology. American Psycholo-gist, 50, 266–274.Joreskog, K. G., & Sorbom, D. (2002). Lisrel
8.54. Lincolnwood, IL: Scientific Soft- Meehl, P. E. (2001). Comorbidity and taxo-metrics. Clinical Psychology: Scienceware International Inc.
Korfine, L., & Lenzenweger, M. F. (1995). The and Practice, 8, 507–519.Meehl, P. E., & Yonce, L. J. (1994). Taxome-taxonicity of schizotypy: A replication.
Journal of Abnormal Psychology, 104, tric analysis: I. Detecting taxonicitywith two quantitative indicators using26–31.
Leichsenring, F., & Leibing, E. (2003). The ef- means above and below a sliding cut(MAMBAC procedure). Psychologicalfectiveness of psychodynamic therapy
and cognitive behavior therapy in the Reports, 74, 1059–1274.�Au: Not cited intreatment of personality disorders: A Millon, T. (1991).� Classification in psycho-text. Please cite
meta-analysis. American Journal of pathology: Rationale, alternatives, and or remove.
Psychiatry, 160, 1223–1232. standards. Journal of Abnormal Psy-chology, 100, 245–261.Lenzenweger, M. F. (1999). Deeper into the
schizotypy taxon: On the robust na- Morey, L. C. (1991). Personality assessment

PERSONALITY DISORDERS ARE DIMENSIONAL 627
inventory: Professional manual. Ode- factor analysis of DSM-IV criteria forborderline personality disorder: Find-ssa, FL: Psychological Assessment Re-
sources. ings from the collaborative longitudinalpersonality disorders study. AmericanNestadt, G., Hsu, F. C., Samuels, J., Bien-
venu, O. J., Reti, I., Costa, P. T., & Journal of Psychiatry, 159, 284–290.Saulsman, L. M., & Page, A. C. (2004). TheEaton, W. W. (2006). Latent structure
of the diagnostic and statistical man- five-factor model and personality dis-order empirical literature: A meta-ana-ual of mental disorders, fourth edition
personality disorder criteria. Compre- lytic review. Clinical Psychological Re-view, 23, 1055–1085.hensive Psychiatry, 47, 54–62.
Perry, J. C, Banon, E., & Ianni, F. (1999). Ef- Shedler, J., & Westen, D. (2004). Dimen-sions of personality pathology: An al-fectiveness of psychotherapy for per-
sonality disorders. American Journal of ternative to the five-factor model.American Journal of Psychiatry, 161,Psychiatry, 156, 1312–1321.
Pukrop, R., & Krischer, M. (2005). Changing 1743–1754.Simpson, W. B. (1994). Borderline personal-views about personality disorders:
Comment about the prospective stud- ity disorder: Dimension or category? Amaximum covariance analysis. Disser-ies CIC, CLPS, and MSAD. Journal of
Personality Disorders, 19, 563–572. tation Abstracts International: Section-B: The Sciences and Engineering, 55,Rothschild, L., Cleland, C., Haslam, N., &
Zimmerman, M. (2003). A taxometric 1194.Skilling, T. A, Harris, G. T., Rice, M. E., &study of borderline personality disor-
der. Journal of Abnormal Psychology, Quinsey, V. L. (2002). Identifying per-sistently antisocial offenders using the112, 657–666.
Rounsaville, B. J., Alarcon, R. D., Andrews, Hare psychopathy checklist and DSMantisocial personality disorder criteria.G., Jackson, J. S., Kendell, R. E., &
Kendler, K. (2002). Basic nomencla- Psychological Assessment, 14, 27–38.Skodol, A. E., Oldham, J. M., Bender, D. S.,ture issues for DSM-V. In D. J. Kupfer,
M. B. First, D. E. Regier, (Eds.). A re- Dyck, I. R., Stout, R. L., Morey, L. C. etal. (2005). Dimensional representa-search agenda for DSM-V. (pp. 1–29).
Washington, DC: American Psychiat- tions of DSM-IV personality disorders:Relationships to functional impair-ric Association.
Ruscio, J. (2007). Taxometric analysis: An ment. American Journal of Psychiatry,162, 1919–1925.empirically-grounded approach to im-
plementing the method. Criminal Jus- Trull, T. J., Widiger, T. A., & Guthrie, P.(1990). Categorical versus dimen-tice and Behavior, 34, 1588–1622.
�Au: Any up-Ruscio, J. (in press)�. Assigning cases to sional status of borderline personalitydate?
groups using taxometric results: An disorder. Journal of Abnormal Psychol-ogy, 99, 40–48.empirical comparison of classification
techniques. Assessment. Tyrka, A. R., Cannon, T. D., Haslam, N.,Mednick, S. A., Schulsinger, F., Schul-Ruscio, J., Haslam, N., & Ruscio, A. M.
(2006). Introduction to the taxometric singer, H., & Parnas, J. (1995). The la-tent structure of schizotypy: I. Premor-method: A practical guide. Mahwah,
NJ: Lawrence Erlbaum Associates. bid indicators of a taxon of individuals�Au: Add Rus-�Ruscio, J., & Marcus, D. K. (2007). Detect- at risk for schizophrenia-spectrumcio & Kaczetow.
ing small taxa using simulated com- disorders. Journal of Abnormal Psy-chology, 104, 173–183.parison data: A reanalysis of Beach,
Amir, and Bau’s (2005) data. Psycho- Ullrich, S., Borkenau, P. B., & Marneros, A.(2001). Personality disorders in offend-logical Assessment, 19, 241–246.
Ruscio, J., Ruscio, A. M., & Meron, M. (2007). ers: Categorical versus dimensionalapproaches. Journal of Personality Dis-Applying the bootstrap to taxometric
analysis: Generating empirical sam- orders 15, 442–449.Vasey, M. W., Kotov, R., Frick, P. J., & Loney,pling distributions to help interpret re-
sults. Multivariate Behavioral Research, B. R. (2005). The latent structure ofpsychopathy in youth: a taxometric in-42, 349–386.
Sanislow, C. A., Grilo, C. M., Morey, L. C., vestigation. Journal of Abnormal ChildPsychology, 3, 411–429.Bender, D. S., Skodol, A. E., Gunder-
son, J. G. et al. (2002). Confirmatory Waller, N. G., & Meehl, P. E. (1998). Multivar-
628 ARNTZ ET AL.
iate taxometric procedures: Distinguish- Widiger, T. A., & Mullins-Sweatt, S. N.(2005). Categorical and dimensionaling types from continua. Thousand
Oaks, London & New Dehli: Sage. models of personality disorders. In J. M.Oldham, A. E. Skodol, D. S. BenderWaller, N. G., & Ross, C. A. (1997). The prev-
alence and biometric structure of (Eds). The american psychiatric pub-lishing textbook of personality disor-pathological dissociation in the gen-
eral population: Taxometric and be- ders. (pp. 35–53). Washington, DC:American Psychiatric Publishing, Inc.havior genetic findings. Journal of Ab-
normal Psychology, 106, 499–510. Widiger, T. A., & Samuel, D. B. (2005). Diag-nostic categories or dimensions? AWeertman, A., Arntz, A., Dreessen, L., Van
Velzen, C., & Vertommen, S. (2003). question for the diagnostic and statis-tical manual of mental disorders-fifthShort-interval test-retest interrater re-
liability of the Dutch version of the edition. Journal of Abnormal Psychol-ogy, 114, 494–504.structured clinical interview for DSM-
IV personality disorders (SCID-II). Jour- Widiger, T. A., & Simonsen, E. (2005). Intro-duction to the special section: Thenal of Personality Disorders, 17, 562–
567. American psychiatric association’s re-search agenda for the DSM-V. JournalWeertman, A., Arntz, A., & Kerkhofs, M.L.M.
(2000). Gestructureerd klinisch inter- of Personality Disorders, 19, 103–109.Zanarini, M., Gunderson, J., Frankenburg,view voor DSM-IV persoonlijkheidss-
toornissen (SCID-II). (Structured clinical F. R., & Chauncey, D. L. (1989). Therevised diagnostic interview for bor-interview for DSM-IV axis II personality
disorders). Lisse: Swets & Zeitlinger. derlines: Discriminating BPD fromother axis II disorders. Journal of Per-Widiger, T. A., & Clark, L. A. (2000). Toward
DSM-V and the classification of psy- sonality Disorders, 3, 10–18.chopathology. Psychological Bulletin,126, 946–963.