taxonomic identification of biological samples collected ... · taxonomic identification of...
TRANSCRIPT
Taxonomic Identification of Biological Samples Collected by the District of Columbia
FINAL Technical Report Prepared for
District of Columbia Department of Health
Environmental Health Administration
Water Quality Division and Water Protection Division
51 N. Street, NE, 5th FloorWashington, D.C. 20002
byClaire Buchanan and LeAnne Astin
Interstate Commission on the Potomac River Basin51 Monroe Street, PE-08
Rockville, Maryland 20850
May 31, 2005
In completion of Water Protection Division Grant 01G-01-S319-WPD09
andBureau of Environmental Quality, Water Quality Division
Grant 01A-02-WQD02 (APPR01)

-i-
ICPRB Report 05-4
Acknow ledgements
This effort was supported by the District of Columbia Department of Health, Environmental Health Administration
(DC DOH/EHA) and specifically the Water Protection Division (01G-01-S319-WPD09) and Bureau of
Environmental Quality, Water Quality Division (01A-02-WQD02 (APPR01)). The authors thank Jacqueline Johnson
(ICPRB staff serving as Living Resources Data Manager at the Chesapeake Bay Program Office in Annapolis, MD)
for her assistance in calculating the phytoplankton Index of Biotic Integrity, and Shiela Besse, Peter May, Kerry
Manire, Jeff Zahn, and Joanne Goodwin for their assistance in transporting samples to ICPRB, and answering
questions about field sample collection and storage.
Disclaimer
This report was produced by the Interstate Commission on the Potomac River Basin. The opinions expressed are
those of the authors and should not be construed as representing the opinions or policies of the U. S. Government,
the U. S. Environmental Protection Agency, the several states, or the signatories or Commissioners to the Interstate
Commission on the Potomac River Basin: Maryland, Pennsylvania, Virginia, West Virginia, and the District of
Columbia.

-ii-
Table of Contents
Acknowledgements . . . . . . . . . . . . . . . . . . . . . . . . . . . . . . . . . . . . . . . . . . . . . . . . . . . . . . . . . . . -i-
Table of Contents . . . . . . . . . . . . . . . . . . . . . . . . . . . . . . . . . . . . . . . . . . . . . . . . . . . . . . . . . . . . -ii-
Summary . . . . . . . . . . . . . . . . . . . . . . . . . . . . . . . . . . . . . . . . . . . . . . . . . . . . . . . . . . . . . . . . . . -1-
Project Tasks . . . . . . . . . . . . . . . . . . . . . . . . . . . . . . . . . . . . . . . . . . . . . . . . . . . . . . . . . . . . . . . -3-TASK 1: Quality Assurance Project Plan and Counting Protocols . . . . . . . . . . . . . . . . -3-TASK 2: Acquire Samples from DC DOH/EHA . . . . . . . . . . . . . . . . . . . . . . . . . . . . . -3-TASK 3: Taxonomic Identification of Samples . . . . . . . . . . . . . . . . . . . . . . . . . . . . . . -4-
Subtask 3A: Obtain Bids . . . . . . . . . . . . . . . . . . . . . . . . . . . . . . . . . . . . . . . . -4-Subtask 3B: Manage Subcontracts . . . . . . . . . . . . . . . . . . . . . . . . . . . . . . . . . -4-Subtask 3C: Submit Progress Reports to DC DOH/EHA . . . . . . . . . . . . . . . -4-
TASK 4: Receive Data and Transmit Data to DC DOH/EHA . . . . . . . . . . . . . . . . . . . -5-Subtask 4A: Receive Data from Subcontractors and Quality Check Data for
Accuracy and Thoroughness . . . . . . . . . . . . . . . . . . . . . . . . . . . -5-Subtask 4B: Submit Data to DC DOH/EHA in Electronic Formats . . . . . . . -5-Subtask 4C: Data Analysis . . . . . . . . . . . . . . . . . . . . . . . . . . . . . . . . . . . . . . . -5-
TASK 5: Prepare and Submit Draft Technical Report . . . . . . . . . . . . . . . . . . . . . . . . . -5-TASK 6: Return Sample Bottles to DC DOH/EHA . . . . . . . . . . . . . . . . . . . . . . . . . . . -5-
Phytoplankton Analysis . . . . . . . . . . . . . . . . . . . . . . . . . . . . . . . . . . . . . . . . . . . . . . . . . . . . . . . -7-Spring and Summer Phytoplankton Indexes of Biotic Integrity . . . . . . . . . . . . . . . . . . -7-
Method Description . . . . . . . . . . . . . . . . . . . . . . . . . . . . . . . . . . . . . . . . . . . . . . -7-Kingman Lake . . . . . . . . . . . . . . . . . . . . . . . . . . . . . . . . . . . . . . . . . . . . . . . . . . -8-
Autumn and Winter Phytoplankton Blooms . . . . . . . . . . . . . . . . . . . . . . . . . . . . . . . . -14-Kingman Lake . . . . . . . . . . . . . . . . . . . . . . . . . . . . . . . . . . . . . . . . . . . . . . . . . -14-Potomac River . . . . . . . . . . . . . . . . . . . . . . . . . . . . . . . . . . . . . . . . . . . . . . . . . -14-
Zooplankton Analysis . . . . . . . . . . . . . . . . . . . . . . . . . . . . . . . . . . . . . . . . . . . . . . . . . . . . . . . -15-Spring Food Availability Index . . . . . . . . . . . . . . . . . . . . . . . . . . . . . . . . . . . . . . . . . . -15-
Anacostia and Potomac Rivers . . . . . . . . . . . . . . . . . . . . . . . . . . . . . . . . . . . . -15-Summer Mesozooplankton Densities . . . . . . . . . . . . . . . . . . . . . . . . . . . . . . . . . . . . . -18-
Anacostia and Potomac Rivers . . . . . . . . . . . . . . . . . . . . . . . . . . . . . . . . . . . . -18-
Stream Benthic Macroinvertebrate Analysis . . . . . . . . . . . . . . . . . . . . . . . . . . . . . . . . . . . . . . -20-Biological Metrics . . . . . . . . . . . . . . . . . . . . . . . . . . . . . . . . . . . . . . . . . . . . . . . . . . . . -20-
Method Description . . . . . . . . . . . . . . . . . . . . . . . . . . . . . . . . . . . . . . . . . . . . . -20-District of Columbia Streams . . . . . . . . . . . . . . . . . . . . . . . . . . . . . . . . . . . . . . -20-
Data Files . . . . . . . . . . . . . . . . . . . . . . . . . . . . . . . . . . . . . . . . . . . . . . . . . . . . . . . . . . . . . . . . . -23-Phytoplankton . . . . . . . . . . . . . . . . . . . . . . . . . . . . . . . . . . . . . . . . . . . . . . . . . . . . . . . -23-Zooplankton . . . . . . . . . . . . . . . . . . . . . . . . . . . . . . . . . . . . . . . . . . . . . . . . . . . . . . . . . -23-Stream Benthic Macroinvertebrates . . . . . . . . . . . . . . . . . . . . . . . . . . . . . . . . . . . . . . . -23-

-iii-
Literature Cited . . . . . . . . . . . . . . . . . . . . . . . . . . . . . . . . . . . . . . . . . . . . . . . . . . . . . . . . . . . . -24-
Supporting Details . . . . . . . . . . . . . . . . . . . . . . . . . . . . . . . . . . . . . . . . . . . . . . . . . . . . . . . . . . -26-
Appendix A: Phytoplankton Sample Chain of Custody
Appendix B: Zooplankton Sample Chain of Custody
Appendix C: Spring and Summer Phytoplankton Indexes of Biotic Integrity, Station Summaries
Appendix D: Spring and Summer Zooplankton Indexes, Station Summaries
Appendix F: Quality Assurance Plan for Stream Macrobenthic Invertebrate Counts
Appendix G: Phytoplankton Index of Biotic Integrity for Chesapeake Bay and Its TidalTributaries

-1-
Taxonomic Identification of Biological Samples Collected by the District of Columbia
Project Summary
This project coordinated the analysis of phytoplankton, zooplankton, and stream benthossamples collected by the District of Columbia water quality monitoring program between 1998and 2001, and provided the results to the District in electronic formats.
In November 2001, staff of the Interstate Commission on the Potomac River Basin (ICPRB)acquired from DC DOH/EHA through a documented chain of custody process 917 samplescollected by District monitoring program staff between the years 1998 and 2001. There were 20benthic macroinvertebrates samples collected from free-flowing streams, and 661 phytoplankton,119 microzooplankton, and 117 mesozooplankton samples collected from tidal waters. The costof just analyzing all of the samples would have been over $140,000, however the Commission’stwo contracts were for a total of $80,000. The surplus of samples was delivered to ICPRBbecause not all were expected to be in good condition due to the lack of periodic re-preservationof the phytoplankton samples.
All of the 20 stream benthic macroinvertebrate samples were examined by ICPRB staff. Manywere poorly preserved, and only 16 samples could be counted. The benthic data were enteredinto EDAS (Ecological Data Application System) and can be found in the Access file<DCStreamBenthos_Tables.mdb>. Indicator metrics used in bioassessment protocols by theEPA and/or the District were calculated by ICPRB from the data.
The subcontractor responsible for enumerating the phytoplankton samples had completed 77counts when the draft of this report was submitted to DC DOH/EHA July 2004. Most of thecounted samples were from Kingman Lake (Yrs 1998-2000). ICPRB staff examined 219 of theremaining 584 (~37.5%) uncounted phytoplankton samples in the spring of 2004 and found thefollowing: 78.5% are in good or excellent condition, 13.2% are in marginal condition, and 8.2%are in poor (decomposed) condition and not worth enumerating. Samples from Yr 2000 have thehighest frequency of decomposition, with 38.7% of the samples in poor condition. Samples from1998, 1999, and 2001 have the lowest frequency of decomposition, with approximately 0%,3.2%, and 4.0% in poor condition, respectively. Preservative strength in all uncountedphytoplankton samples was bolstered with 2 mls of 37% or 18.5% buffered formaldehyde onJune 28, 2004. A second subcontract with ANS was implemented, and 82 spring and summersamples for spring and summer of the Yr 2001 were enumerated. The primary data for the 159counted samples can be found in the Excel file <Phytoplankton_I-II.xls>. There remains atICPRB 125 uncounted samples for Yr 1998, 156 for Yr 1999, and 152 for Yr 2000. An updatedchain of custody for the phytoplankton samples is provided in Appendix A.
A total of 46 mesozooplankton samples were enumerated by the subcontractors. All of theKingman Lake mesozooplankton samples (Yr 1999) are counted. All of the Yr 2000 and 2001mesozooplankton samples from the Anacostia and Potomac rivers are counted. The data can befound in the Excel file <Mesozooplankton I.xls>. Information provided by DC staff about theplankton tow lengths for each sampling event can be found in <Plankton Tow Lengths.xls>. Seventy-one (71) mesozooplankton samples from Yr 1998 and 1999 remain to be counted: 24

-2-
from ANA14 in the Anacostia, and 47 from PMS10 and PMS37 in the Potomac mainstem. Atotal of 46 microzooplankton samples were evaluated by the subcontractors. A preservationproblem was discovered, and some of the 46 samples and the remaining 73 samples were judgedto be insufficiently preserved and not worth enumerating and identifying. Due to the suspecteddegradation of many samples, the data were not analyzed. An updated chain of custody for thezooplankton is provided in Appendix B.
Plankton indicator metrics currently used in Chesapeake Bay Program bioassessments werecalculated from the available phytoplankton (Appendix C) and mesozooplankton (Appendix D)count data. Metrics for microzooplankton were not calculated due to poor sample preservation.Indicator metrics recommended by District of Columbia staff and/or used in the U. S.Environmental Protection Agency rapid bioassessment protocols (RBP) were calculated from theavailable stream benthic macroinvertebrate data (Appendix E). The CBP mesozooplanktonmetrics may be inappropriate to apply to the zooplankton populations of the fast-flowing upperPotomac mainstem since this reach is more riverine than estuarine. Benthic epifauna or night-time drift samplers rather than zooplankton nets may more accurately sample the invertebratefood web available to fish in this reach.
The plankton and stream benthos analysis results suggest that biological communities in thevariety of District waters generally exhibit Poor status, however there are exceptions. Thestream macroinvertebrate community sampled at Ft. Stanton exhibited a Fair condition, and thecommunity sampled at Klingle Valley exhibited a Good-Fair condition. The phytoplanktonIndex of Biotic Integrity (IBI) exhibited a Good status at the upper Potomac and upper Anacostiastations during periods of low flow, probably reflecting a reduction in nutrient and sedimentloadings to these areas. The zooplankton food availability index met the Minimal requirementsfor larval anadromous fish twice during the 2000-2001 period, at station ANA14 in theAnacostia River (near Pennsylvania Ave). The plankton results indicate that the District ofColumbia’s tidal plankton community will respond rapidly and positively to management-relatednutrient and sediment reductions.
-3-
Project Tasks
Tasks identified in the completed Water Protection Division grant (01G-01-S319-WPD09) andBureau of Environmental Quality, Water Quality Division grant (01A-02-WQD02 (APPR01))are combined below, and discussed jointly.
TASK 1: Quality Assurance Project Plan and Counting Protocols (Completed)
Develop Quality Assurance Project Plans in accordance with US EPA guidelines (EPA QA/R-5)for phytoplankton, zooplankton, and benthic invertebrate sample counting and data entryprocedures, and submit to DC DOH/EHA for approval prior to the start of these activities. Theseprotocols may be refined in cooperation with the qualifying subcontractors and DC DOH/EHAstaff:
Quality Assurance Plans were provided by the contractors selected to identify andenumerate the phytoplankton and zooplankton samples. These QA Plans were submittedto the District during the DC/ICPRB proposal review process, and were identical to thoseused by the Chesapeake Bay Program at the time. A QA Plan for counting the 20 streambenthic macroinvertebrate samples is included in this report in Appendix F. The ICPRBstaff who counted the samples (Jim Cummins) has received formal training in taxonomicidentification of stream benthic macroinvertebrates from both the Maryland andPennsylvania state agencies.
Phytoplankton samples were subsampled and settled in a gridded settling chamber. Theywere first assessed as to whether the preservative was still effective. If the sample haddeteriorated (i.e. active bacteria and/or decomposing algal cells are noted), the countingprocedure was stopped and the sample recorded as not counted due to deterioration. If thesample was in good condition, the count proceeded. A minimum of 200 cells wereidentified to the lowest taxonomic level and counted. Cells in algal colonies andfilaments were individually enumerated. The entire subsample was scanned for large,rare species. A 10% sample recount was performed for QA/QC purposes.
Zooplankton samples were identified and counted using a hierarchical countingtechnique. At least 60 individuals of the most dominant forms were counted in a smallsubsample (usually 1-2 milliliters), followed by 5 and 10 milliliter subsamples fromwhich all species that had counts less than 60 in the previous subsample were counted.Instead of a 10% sample recount for QA/QC purposes, additional samples were countedas part of a small study to determine if the low microzooplankton numbers were due tofield collection .
Stream benthic invertebrates were identified to at least family taxonomic level and allorganisms in each sample were counted. A 10% sample recount was not required forQA/QC purposes since each sample was counted entirely. No marsh benthicmacroinvertebrate samples were delivered to ICPRB.
TASK 2: Acquire Samples from DC DOH/EHA (Completed)
-4-
This was done between November 19 and 30, 2001, at DC DOH/EHA offices and ICPRBoffices through a documented chain of custody process.
TASK 3: Taxonomic Identification of Samples
Subtask 3A: Obtain Bids (Completed)
Qualified organizations and/or individuals to perform phytoplankton and zooplanktontaxonomic identifications and counts were identify through a bidding process. Bids fromseveral vendors were reviewed during the January - March 2002 time period. Inconsultation with the District of Columbia, the Academy of Natural Sciences EstuarineResearch Laboratory was selected to count the microzooplankton and phytoplanktonsamples, and Versar, Inc. was selected to count the mesozooplankton samples. Contractswere signed with each of these vendors. Due to the small number (20) of stream benthicmacroinvertebrate samples acquired from the District of Columbia, it was decided thatICPRB personnel (Jim Cummins) would counted these samples.
Subtask 3B: Manage Subcontracts (Completed)
Subcontracts with the two vendors, Versar, Inc. and the Academy of Natural Sciences(ANS), were implemented. The subcontract with the ANS was ended before all assignedmonies were spent due to ANS personnel problems that have since been resolved. Asecond subcontract was established with ANS to perform additional phytoplanktoncounts. Results were delivered to ICPRB before in the fall of 2004.
Subtask 3C: Submit Progress Reports to DC DOH/EHA (Completed)
Progress reports and emailed updates/requests for approval occurred on • January 14, 2002• March 28, 2002 • August 9, 2002• December 31, 2002• January 27, 2003• April 30, 2003• July 23, 2003• September 26, 2003• June 2, 2004
The zooplankton taxonomists at Versar, Inc. and the Academy of Natural SciencesEstuarine Research Center raised at number of issues in the summer of 2002 that neededto be addressed before the zooplankton counts could be completely entered into adatabase. They discussed some of these issues with DC staff directly. Their concernsand questions were summarized in ICPRB’s August 9, 2002, progress report to theDistrict. With DC staff help, ANS staff Ms. Stella Sellner determined themicrozooplankton samples were being under-preserved in the field. She compared theconditions and densities of organisms in Potomac samples freshly collected by DC staffwith those of samples collected in the late 1990s. She also tested the formalin strengthsin the older samples. She concluded that many of the samples had some degree of
-5-
decomposition. Preservative strengths recommended in Harris et al. (2000) weresummarized in a April 30, 2003 email to District staff Jeffery Zahn (see SupportingDetails).
TASK 4: Receive Data and Transmit Data to DC DOH/EHA
Subtask 4A: Receive Data from Subcontractors and Quality Check Data for Accuracy andThoroughness (Completed)
Data quality was checked by the subcontractors in the normal course of their data entryprocedures. Data quality was also checked by ICPRB staff during the data analyses.
Subtask 4B: Submit Data to DC DOH/EHA in Electronic Formats (Completed)
Benthic data were entered in EPA's Ecological Data Application System (EDAS).
Plankton data were entered into formats uploadable to the U. S. EPA Chesapeake BayProgram databases.
The data files provide the identifications and densities of benthic and plankton organismsby station and date.
Subtask 4C: Data Analysis (Completed)
Benthic invertebrate metrics agreed upon by DC DOH/EHA staff were calculated.
The suite of phytoplankton indicators and the indexes of biotic integrity developed forthe Chesapeake Bay Program to assess the health of tidal waters were calculated.
The index developed for the Chesapeake Bay Program to evaluate mesozooplankton fooddensities available for anadromous fish larvae was calculated. Correlations betweenmicrozooplankton and eutrophication parameters could not be done because preservationproblems with the microzooplankton samples prevented them from being counted.
The data analysis was updated after the phytoplankton sample enumerations for springand summer of Yr 2001 were delivered by ANS and water quality data (includeschlorophyll a and pheophytin concentrations) were available on the ChesapeakeInformation Management System (CIMS) web site, or www.chesapeakebay.net. Theresults are included in this updated technical report.
TASK 5: Prepare and Submit Draft Technical Report (Completed)
The draft technical report was submitted to DC DOH/EHA. Their review commentshave been incorporated into this updated and final technical report.
TASK 6: Return Sample Bottles to DC DOH/EHA (Completed)

-6-
Forty-six (46) mesozooplankton sample bottles were returned to DC via District staffperson, Khin Sann.
One hundred and nineteen (119) microzooplankton sample bottles and ninety-three (93)phytoplankton sample bottles have been washed and dried, and have been shipped viaground transportation to the District, c/o Lucretia Brown.

-7-
Phytoplankton Analysis
Spring and Summer Phytoplankton Indexes of Biotic Integrity
Season- and salinity-specific indexes of biotic integrity (IBI) were recently developed forestuarine phytoplankton communities in Chesapeake Bay and its tidal tributaries (Lacouture etal. Submitted., see Appendix G). The indexes represent phytoplankton community health as itrelates to water quality, or habitat, conditions. “Good” index scores reflect an unstressedphytoplankton community with no blooms and a desirable mixture of species. The indexes wereapplied to the available District of Columbia 1998-2000 phytoplankton monitoring data and allof the 2001 data.
Method DescriptionThe spring and summer IBIs for tidal fresh waters are composed of several phytoplankton orphytoplankton-related metrics (Table 1, Appendix G). The metrics all discriminate betweenleast-impaired and impaired water quality (Wilcoxon Sign Rank Test, p<0.05). Least-impairedhabitat conditions have dissolved inorganic nitrogen (DIN) and orthophosphate (PO4)concentrations at or approaching the phytoplankton growth-limiting thresholds and relativelygood water clarity, as measured by Secchi depth. Impaired water quality conditions have excessDIN, excess PO4, and shallow Secchi depths (Buchanan et al. 2005). Metrics were identified forspring (March - May) and summer (July - September), for each of the four salinity zones.Season- and salinity specific scoring criteria which produced approximately equal classificationefficiencies in both impaired and least-impaired conditions were empirically determined for eachmetric using the Maryland and Virginia Chesapeake Bay Program (CBP) database. Metrics werescored on a scale of 1 - 3 - 5, with 1 representing the most degraded condition and 5 representingthe least degraded condition. Some metrics with low values received no score (“null”) becauseonly high scores were indicative of impairment and low scores did not distinguish betweenimpaired and least-impaired conditions. Numeric scores for the individual metrics were averagedto obtain a final phytoplankton IBI score for each sampling event. Classification efficienciesindicate the final IBI correctly identifies impaired and least-impaired habitat conditions 69% ofthe time in tidal fresh spring and 78% of the time in tidal fresh summer. The lower efficiency inspring is thought to reflect the seasonally higher freshwater inflow rates.
Two calculation methods were established because of past differences in the laboratory countingprotocols of the Maryland and Virginia CBP monitoring programs. Method A is used whencalculating IBIs for bay-wide comparison purposes. Method B includes more metrics, whichproduces a more robust index. Method B can presently be applied to the Maryland CBP andDistrict of Columbia monitoring data. Evaluations produced by the two methods are typicallyvery comparable.
The IBI score for a station sampling event is calculated only if sufficient numbers of scoredmetrics are available. In this analysis, four or more metrics were required to calculate an IBIscore. Some metrics are naturally highly variable, and consequently have low classificationefficiencies (high error rates) as individual metrics. They are kept in the suite of IBI metrics,however, because their presence serves to enhance the classification efficiency of the overall IBIscore. Metrics for the IBI were selected because they can discriminate better than 50-50(sometimes better than 80-20) between impaired and unimpaired conditions. Hence, metricscores tend to reenforce each other, and the error introduced by a single metric that mis-classifies
-8-
the conditions is minimized. The IBI is a more accurate environmental tool than its individualmetrics. IBI scores of 4 - 5 are "Good," scores of 3.3 - 4 are "Fair-Good," scores of 2.67 - 3.33are "Fair," scores 2 - 2.67 of are "Fair-Poor," and scores of 1 - 2 are "Poor."
IBI scores can be used to quantify phytoplankton community status and characterize waterbodies in different phases of recovery. Individual stations usually exhibit a range of IBI scoresover the course of a year which relates to changes in water quality conditions. Health of openwater communities can differ markedly from that of bottom layer communities. For example,CB5.2 in the Bay mainstem near the mouth of the Potomac River has some of the best surfacewater conditions in the Bay and corresponding high phytoplankton IBI scores (median = 3.4,“Fair-Good”). Waters below the pycnocline in this segment regularly experience summer anoxiaand low benthic IBI scores (median = 2.0, “Severely Degraded”).
ResultsThe phytoplankton IBI results indicate phytoplankton communities at District of Columbiamonitoring stations are in Poor condition overall, but at times can rank Fair-Good or Good. Thephytoplankton IBI results for 1998 - 2001 District of Columbia monitoring data are presentedand discussed on a station-by-station basis in Appendix C. IBI metrics measured as part of thewater quality monitoring program were obtained from the CBP web site and merged with thephytoplankton count-based metrics. “ND” indicates the IBI score could not be determined dueto insufficient numbers of metrics - most frequently this was the lack of chlorophyll a andpheophytin data corresponding to the phytoplankton count data. For comparison purposes, thelong-term average IBI scores for the Virginia and Maryland Chesapeake Bay phytoplanktonmonitoring stations are shown in Table 6 of Appendix G. Both sets of indicators were calculatedwith Method A.
Analysis results for 1998 - 2000 were focused primarily on Kingman Lake. Overall, KingmanLake ranked Fair-Poor or Poor at this time, but showed occasional Fair-Good and Good rankingsduring the drought period of 1999 and early 2000. Spring blooms were often biomass-dominated by greens (Ankistrodesmus, Sphaerocystis), cryptomonads (Cryptomonas) andeuglenoids (Phacus) rather than diatoms. Bluegreen taxa that normally appear in summer (Agmenellum, Oscillatoria, Microcystis) were commonly seen in spring as well in Kingman. The primary spring diatom taxa were an unidentified pennales and Melosira sp. Summer bloomswere mostly biomass-dominated by bluegreens (Agmenellum, Chroococcus, Oscillatoria,Anabaena), euglenoids (Euglena, Phacus), greens (Gloeocystis, Sphaerocystis), anddinoflagellates (Ceratium). The primary summer diatom taxa were unidentified pennales,unidentified centrics, Melosira, Cyclotella, and Aulacoseira granulata. In 2001, Kingman Lakeexperienced a massive, diverse summer bloom event, culminating in a Microcystis aeruginosabloom in September.
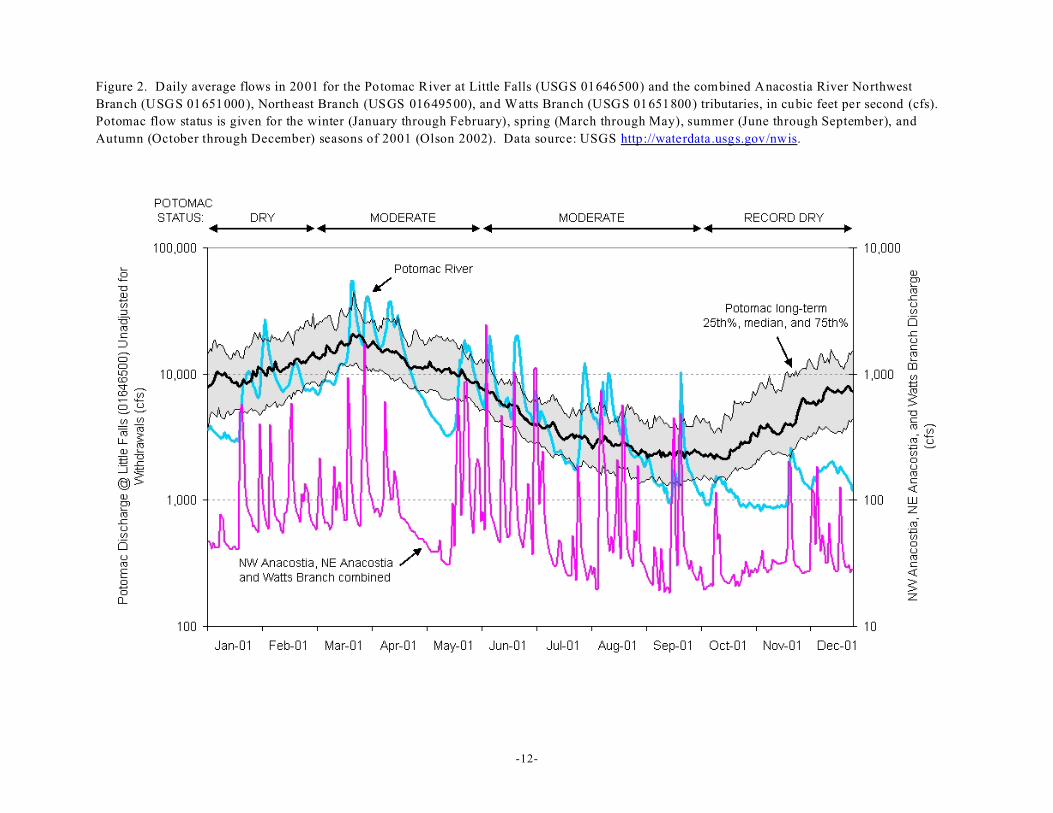
Phytoplankton IBIs were calculated for all the District monitoring stations for spring andsummer 2001. The results are shown in Figure 1. Phytoplankton IBIs scores were generallyPoor but Fair, Fair-Good, and Good scores were found at most monitoring stations in thePotomac and Anacostia (excludes Kingman) in August 2001. The phytoplankton metricsincluded in the IBIs are sensitive to water quality conditions (Buchanan et al. 2005, Lacouture etal. Submitted), which in turn are strongly affected by inputs delivered to the system by point andnon-point sources. Spring and summer 2001 river flows were generally moderate in thePotomac and Anacostia, however the region experienced very dry conditions in 1999 and dry
-9-
conditions in 2000 (M. Olson, pers. communication) as well as a dry January, February, April-May, and August in 2001 (Figure2) which could be expected to lower overall nutrient andsediment inputs. Average taxa biomasses of the spring and summer phytoplankton communities(Figure 3) demonstrate that bluegreen algal biomasses were low except in Kingman Lake and theWashington Tidal Basin. Biomasses of the often-dominant green (chlorophytes) and diatomtaxonomic groups were high, but total biomass only scored “1,” or poor, in 24 of the 43 springsamples (56%) and 19 of the 42 summer samples (45%). Cryptomonads, dinoflagellates andeuglenoids, which are taxonomic groups that are indicative of or tolerant of eutrophic conditionsor organic enrichment in freshwater, were very abundant in Kingman Lake during the summerand had substantial presences in the summer Anacostia, and spring Tidal Basin and TCOstations. Elsewhere, they were present in moderate-low densities. The August 2001phytoplankton IBIs in the Potomac and Anacostia rivers indicate that the District tidalphytoplankton communities can respond quickly to changing water quality conditions, andachieve desirable statuses. This quick response capability could have an intermittent beneficialeffect on organisms that graze on the phytoplankton.

-10-
Table 1. List of phytoplankton and phytoplankton-related metrics used in calculating theindex of biotic integrity for spring (March - May) and summer (July - September) tidal freshwaters. Method A is used when calculating IBIs for bay-wide comparison purposes. MethodB includes more metrics, and is used to calculate IBIs for the Maryland CBP and District ofColumbia monitoring data (from Lacouture et al. in prep.). Phytoplankton metrics are derivedfrom count data (P). Phytoplankton-related metrics are parameters measured in water qualitymonitoring (WQ).
Spring Summer
Method A (for Bay-wide comparisons)
Carbon:Chlorophyll a Ratio (P, WQ) Surface Chlorophyll a (WQ)
Surface Chlorophyll a (WQ) Cyanophyte Biomass (P)
Cyanophyte Biomass (P) Diatom Biomass (P)
Dissolved Organic Carbon (WQ) Dissolved Organic Carbon (WQ)
Pheophytin (WQ) Pheophytin (WQ)
Total Nano-Micro Phytoplankton Biomass (P) Total Nano-Micro Phytoplankton Biomass (P)
Microcystis aeruginosa Abundance (P)
Method B (can be applied to Maryland CBP and District monitoring data)
Includes all of the above metrics plus the following:
Diatom Abundance (P) Chlorophyte Abundance (P)
Total Abundance (P) Total Abundance (P)

-11-
SPRING
SUMMER
Figure 1. District of Columbia phytoplankton Indexes of Biotic Integrity (IBIs) for spring and summer,
2001. Key: red, IBI = 1 - 2 (Poor); red/yellow, IBI= >2 - 2.67 (Fair-Poor); yellow, IBI = >2.67 - <3.33
(Fair); yellow/green, IBI = 3.33 - <4 (Fair-Good); green, IBI = 4 - 5 (Good); circle, IBI calculated with
Method A (Lacouture et al. Submitted); circle within brackets, IBI calculated with Method B (chlorophyll
and pheophytin data not available); square, evaluation is based only on chlorophyll and pheophytin scores
(phytoplankton count data not available).
-12-
Figure 2. Daily average flows in 2001 for the Potomac River at Little Falls (USGS 01646500) and the combined Anacostia River Northwest
Branch (USGS 01651000), Northeast Branch (USGS 01649500), and Watts Branch (USGS 01651800) tributaries, in cubic feet per second (cfs).
Potomac flow status is given for the winter (January through February), spring (March through May), summer (June through September), and
Autumn (October through December) seasons of 2001 (Olson 2002). Data source: USGS http://waterdata.usgs.gov/nwis.

-13-
Figure 3. Average biomass (:g C liter-1) of each of the six major taxonomic groups in theAnacostia River (ANA##), Kingman Lake (KNG##), Potomac River mainstem (PMS##),Washington, D.C. tidal basin (PTB01), Washington Channel (PWC04), and two tributarystations (TCO##). Seasons: spring = March-May; summer = July-September.

-14-
Figure 4. Frequency of winter algal blooms in the tidal fresh andoligohaline Potomac River estuary.
Autumn and Winter Phytoplankton Blooms
Kingman LakeA total of 10 autumn and 12 winter samples from Kingman Lake from 1998-2000 wereanalyzed. A prolonged, extensive bloom was evident in Kingman Lake during the autumn andearly winter of 1998, with total phytoplankton biomass averaging 2044 ug carbon liter-1. Thebloom was biomass-dominated by bluegreens (Oscillatoris, Agmenellum) and a mixture ofdiatom taxa in autumn, and by the centric diatoms Leptocylindrus danicus and Melosira sp. inwinter. A shorter-lived bloom, biomass-dominated by the dinoflagellate Protoperidiniumcrassipes and several diatom taxa, was evident at KNG01 on November 6, 2000. Based on thesefew years of data, it would appear that Kingman Lake is prone to phytoplankton blooms inautumn and winter, and the blooms are composed of bluegreen and dinoflagellate taxa that couldpotentially disrupt the aquatic food web.
Potomac RiverNo IBIs have been developed yet for autumn (October-November) and winter (December-February) phytoplankton populations. Chlorophyll a in Chesapeake reference communities intidal fresh waters (U.S. Environmental Protection Agency 2003, Buchanan et al. 2005) typicallydoes not exceed the following concentrations: Autumn: 18.2 ug liter-1 (tidal fresh), 25.0 ug liter-1 (oligohaline) Winter: 8.0 ug liter-1 (tidal fresh), 16.1 ug liter-1 (oligohaline)
If these concentrations are applied as benchmarks to the 1837 District and Maryland Potomacchlorophyll a records from tidal fresh and oligohaline waters, for winters between 1984 and2001, it appears that the frequency of winter algal blooms can be as high as 30% (Figure 4). Anadditional 1709 Potomac records indicate bloom frequencies are lower during autumn, especiallyin oligohaline waters. Autumn and winter chlorophyll a data for the Anacostia mainstem weresparse, and no conclusions can be drawn about their frequency at this time. The relatively highfrequency of winter algal blooms in the Potomac suggest food web disruptions may be an issuein this season, and may impact the later development of spring zooplankton populations neededto support anadromous fish.

-15-
Zooplankton Analysis
Spring Food Availability Index
Spring mesozooplankton densities in the Potomac and Anacostia mainstems represent theamount of food available to larvae of anadromous fish that spawn in these waters. Mesozooplankton are free-floating organisms 20:m - 2cm long, comprised mostly of copepods,cladocerans, and larvae of benthic macroinvertebrates. Positive relationships betweenmesozooplankton food and larval fish survival and growth rates have been found in laboratoryexperiments (Cushing 1972; Houde 1978; Miller 1978; Beaven and Mihursky 1980; Hunter1981; Kernehen et al. 1981; Setzler-Hamilton et al. 1981; Hjorth 1988; Uphoff 1989: Chesney1989; Tsai 1991). As mesozooplankton density increases, larval growth improves andrecruitment to juvenile life stages increases. This reflects “bottom-up” control of fish larvaesurvival by their mesozooplankton prey. In situ, this positive relationship is influenced by theeffects of other factors such as temperature, turbidity, size of the spawning female population(brood stock), and predation losses. It also appears to be influenced by negative impacts ofeutrophication on zooplankton.
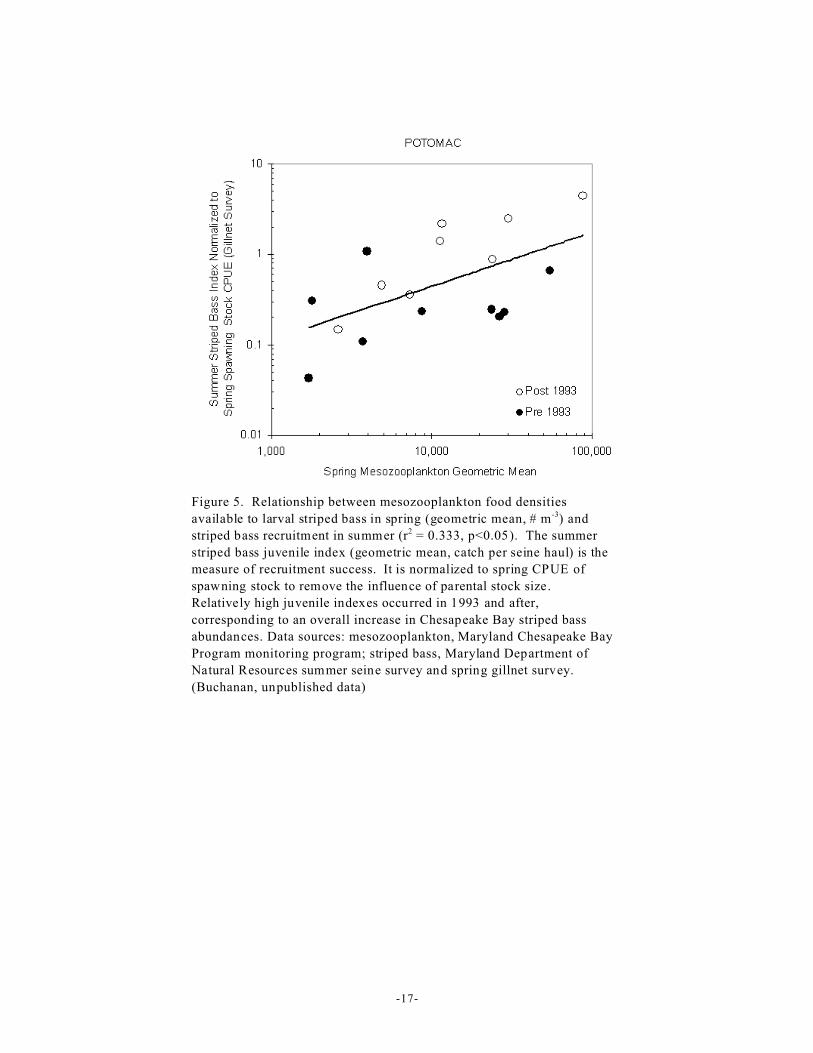
The geometric mean of mesozooplankton densities in April, May and June can be used as a foodavailability index for larval striped bass and white perch during their critical first-feedingperiods, as they drift in the water column. While clearly recognizing that other environmentalfactors greatly affect larval feeding rates, Versar, Inc. and PBS&J, Inc. (1999) derived scoringcriteria from the literature and establish distinct feeding categories. The "optimal" category wasa geometric mean density of greater than 25 organisms per liter. A "minimum" requirement ofzooplankton fell between 15 and 25 organisms liter-1; "below minimum" ranged from 5 to 15liter-1; and "poor" was less than 5 liter-1. The geometric mean density for each year is calculatedusing the mesozooplankton densities at monitoring stations overlapping striped bass early lifestage nursery areas. These typically are tidal fresh and oligohaline areas (<5.0 ppt salinity). Inthe Potomac River below the District, a significant (p<0.05) positive predator-prey correlation isfound when the striped bass summer juvenile index (geometric mean catch per seine haul) isnormalized by CPUE of the adult spawning stock in spring (average # caught per hour per 1000square yard gill net) and regressed against spring food availability index (MDDNR dataavailable at http://www.dnr.state.md.us/fisheries/). The relationship holds before and after 1993,when a striped bass resurgence began in the river (Figure 5).
Anacostia and Potomac RiversThe average values and ranges of the food availability index for 2000 - 2001 District ofColumbia monitoring data are presented in the following Station Summaries. There areinsufficient numbers of counted samples at this time to make a broad evaluation of springzooplankton food availability for larval striped bass and white perch in tidal waters of theDistrict. The results suggest this area currently has a Poor status, however index values at theAnacostia station reached Minimal status in June 2000 and May 2001.
The mesozooplankton-based food availability index for larval striped bass and white perch maybe inappropriate to use in the fast flowing upper Potomac River mainstem, above the Anacostiaconfluence. The riverine nature of the Potomac River below Great Falls rapidly flushespopulations of free-floating zooplankton, which can require days to weeks to reproduce. Meanresidence time is less than one day between Georgetown Reservoir and the Anacostia

-16-
confluence. Residence time is about 1.4 days between the Anacostia confluence and Fort Foote,MD near the southeast border of the District (Table 2). Historically, the residence times in boththese river reaches were significantly longer because the river was much deeper (e.g., Gottschalk1945). Sediment and biological characteristics have also changed in the last century (e.g.,Benedict Estuarine Research Laboratory 1976, DeFries 1980). The physical environment of theupper Potomac River mainstem in the District of Columbia may now be more likely to producepopulations of benthic macroinvertebrate “collectors” than free-floating zooplankton, assuggested by the River Continuum Concept (Vannote et al. 1980). Collectors include insect andamphipod taxa, but are more commonly represented by tubificid worms in organically enrichedareas. Collectors consume fine and ultra-fine particulate organic carbon (and their associatedmicrobial biomass) that are transported from upstream sources. Estimates of these populationsare best made with benthic epifaunal samplers or night-time drift samplers.
The mesozooplankton-based food availability index for larval striped bass and white perch isappropriate to use in the slower moving Anacostia River mainstem, where the average residencetime is ~27 days. Residence times in other Chesapeake Bay tributaries supporting striped bassand white perch populations bracket the Anacostia residence time, e.g., ~5.4 days in the upperBay tidal fresh segment and ~180 days in the Patuxent tidal fresh segment (Table 2). TheAnacostia food availability index is significantly lower than index values for Indian Head andPossum Pt., MD, which reached Optimal levels several times during 2000-2002.
Table 2. Approximate mean residence time (days) in Potomac and Anacostia tidal fresh sub-segments
approximately 9.26 km (5 nautical miles, 5.76 statute miles) long. Residence times were calculated by
dividing segment volume by median freshwater inflow rate. The median long-term flow rate of 23.85 x
106 m3 day-1 was used for the Potomac segments (USGS Little Falls gaging station) and 0.37 x 10⁶ m3
day-1 was used for the Anacostia tidal river (Behm et al. 2003). Potomac River segment volumes (circa
1970) were obtained from the Environmental Atlas of the Potomac Estuary (Lippson et al. 1979). The
volume of the tidal Anacostia (1999-2000) was obtained from Behm et al. (2003). Residence times
derived from long-term median daily flow rates (USGS) and the Chesapeake Bay Program 3-D
Interpolator Model estimates of tidal fresh volume are shown for other Chesapeake Bay tributaries.
Mean
Residence
Time
(Days)
Estimated
Volume of
Segment
(million m3)
Represent-
ative
Monitoring
Station River River Segment
Potomac River tidal fresh sub-segments
27.0 10.0 ANA14 Anacostia District NE border to Potomac R.
0.8 20.0 PMS10 Potomac Georgetown Reservoir to Anacostia confluence
1.4 32.9 PMS37 Potomac Anacostia confluence to Fort Foote, MD
5.1 121.4 TF2.3 Potomac Indian Head, MD
6.6 157.0 TF2.4 Potomac Possum Pt., MD
Entire tidal fresh segments (CBP 1998 segmentation scheme)
14 331.3 Potomac CBP segment POTTF (excludes Anacostia R.)
5.4 360.0 upper Bay CBP segment CB1TF
180 11.0 Patuxent CBP segment PAXTF
85 15.3 Choptank CBP segment CHOTF
22 28.6 Pamunkey CBP segment PMKTF (in York R. system)
29 286.2 James CBP segment JMSTF (excludes Appomatox R.)
-17-
Figure 5. Relationship between mesozooplankton food densities
available to larval striped bass in spring (geometric mean, # m-3) and
striped bass recruitment in summer (r2 = 0.333, p<0.05). The summer
striped bass juvenile index (geometric mean, catch per seine haul) is the
measure of recruitment success. It is normalized to spring CPUE of
spawning stock to remove the influence of parental stock size.
Relatively high juvenile indexes occurred in 1993 and after,
corresponding to an overall increase in Chesapeake Bay striped bass
abundances. Data sources: mesozooplankton, Maryland Chesapeake Bay
Program monitoring program; striped bass, Maryland Department of
Natural Resources summer seine survey and spring gillnet survey.
(Buchanan, unpublished data)

-18-
Summer Mesozooplankton Densities
A mesozooplankton-based index of food availability for summer has not been developed forlarval fish and juvenile and adult plantivorous (plankton-eating) fish inhabiting Chesapeake tidalfresh and oligohaline waters. Fish data from MDDNR summer seine surveys and Gunston CoveEcosystem Study seine and trawl surveys show that planktivorous species (Table 3) as a wholeare common in the Potomac River and its tributaries downstream of the District of Columbia. Significant, inverse correlations are found in the tidal fresh Potomac River when the finfishplanktivores indexes from these surveys are correlated with mesozooplankton densities obtainedfrom the CBP monitoring program (C. Buchanan, unpublished data). As planktivore (predator)abundance increases, mesozooplankton (prey) abundance decreases (Figure 6). This suggestssummer planktivorous fish as a whole are currently exerting strong “top-down” controls on theirfood organisms. Summer fish populations are comprised mostly of juveniles and adults, but alsoinclude larvae of resident species (e.g., bay anchovy, killifish, shiners). As water qualityimproves, the “bottom-up” impacts of poor water and phytoplankton food quality onzooplankton populations are expected to ease, resulting in higher zooplankton productivity anddiversity. Hypothetically, this could allow the inverse relationship to shift up and to the right inFigure 6, i.e. more fish will be supported on somewhat higher abundances of mesozooplankton.
Anacostia and Potomac RiversMean mesozooplankton summer abundances in the Anacostia (ANA14) are lower than those atIndian Head (TF2.3). Densities ranged from 161 m-3 - 14,321 m-3 in 2000 and 2001. Given thelong residence times of the Anacostia (Table 2), higher mesozooplankton abundances could beexpected. It is not known if these low levels are due to particularly strong top-down controls byplanktivorous fish, or eutrophication impacts, or both. The generally Poor status of the KingmanLake phytoplankton populations adjacent to the Anacostia (above) suggests eutrophication is theprincipal cause.
Six mesozooplankton samples were collected in Kingman Lake during the summer of 1999. Allhad low densities (15 m-3 - 3,787 m-3).
Mesozooplankton population densities at PMS37 during the summers of 2000 and 2001 wereapproximately the same as those in Kingman Lake in 1999, ranging from 105 m-3 - 1,552 m-3. Densities were lower than those in the Anacostia River during 2000 and 2001.
Summer mesozooplankton densities at PMS10 are extremely low (5 m-3 - 74 m-3), which againsuggests mesozooplankton may not be a significant component of the District’s upper Potomacmainstem due to the riverine nature of this reach. Bottom fauna that migrate at night into thewater column may be more important as food sources for fish. Sampling would need to be doneto confirm this community shift predicted by the River Continuum Concept (Vannote et al.1980).

-19-
Figure 6. Inverse relationship between average planktivore and
mesozooplankton abundances in summer at Indian Head
(TF2.3), Potomac River (r2 = 0.71, p < 0.01, n = 16). As
planktivore predators increase, meso-zooplankton prey decrease,
indicating “top-down” controls are strong. An outlier associated
with the 1985 return of SAV to the Potomac is excluded. (C.
Buchanan, unpublished data).
Table 3: Obligate planktivore finfish species currently found in
Potomac tidal fresh waters. Key: *, more common; A, anadromous;
R, resident).
Latin Name Common Name Life cycle
Alosa aestivalis Blueback herring* A
Alosa pseudoharengus Alewife A
Alosa sp. Unidentified herring A
Alosa sapidissima American shad A
Anchoa mitchilli Bay anchovy* R
Brevoortia tyrannus Atlantic menhaden A
Dorosoma cepedianum Gizzard shad* A
Fundulus diaphanus Banded killifish* R
Notemigonus crysoleucas Golden shiner R
Notropis hudsonius Spottail shiner* R

-20-
Stream Benthic Macroinvertebrate Analysis
Biological Metrics
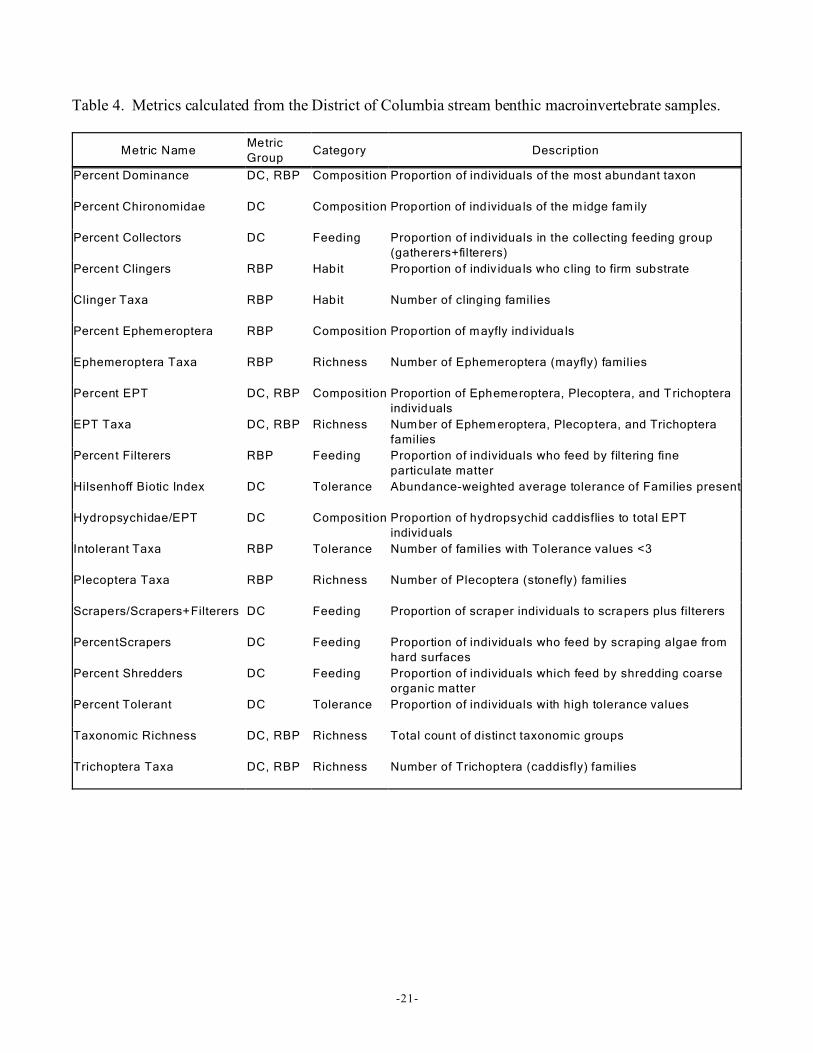
Twenty biological metrics representing specific attributes of the benthic community werecalculated for the available District of Columbia stream monitoring data for 1997-1998. Themetrics are used in bioassessments because they change in some predictable way in response toincreasing habitat impairment. Metric values suggest that macroinvertebrate communities atmost sites were in Poor or Very Poor condition at the time of sampling, although some sitesranked Fair-Poor or Fair. It was difficult to evaluate whether these metrics accurately reflectedhealth of benthic macroinvertebrates in District streams due to inadequate preservation of mostsamples.
Method DescriptionBenthic macroinvertebrate data (taxa identification and counts) from each station were used tocalculate two sets of biological metrics. One metric set ("DC") consisted of measures specifiedby the District of Columbia for bioassessments. The second set ("RBP") was composed of thosemeasures identified by Barbour et al. (1999) as the "best candidate metrics" for bioassessments. Some metrics (e.g. Taxa Richness) were common to both sets. The 20 metrics calculated fromthe District data are shown in Table 4. The taxonomic, trophic, habit, and tolerance informationused in this analysis are contained in the table “Benthics_Master_Taxa” in the<DCStreamBenthos_Tables.mdb> database. Functional feeding group and mode-of-existencedesignations and tolerance values for calculating feeding and habit metrics and the HisenhoffBiotic Index (HBI) were largely based on those drafted by the Data Management Committee ofthe Maryland Water Monitoring Council (MWMC) (available: http://mddnr.chesapeakebay.net/MWMC/MT_proposal.cfm). Information from the US EPA'sRapid Bioassessment Protocols (Barbour et al. 1999) was used for cases where these attributeswere not recorded in the MWMC database. The "Crawler" habit designation developed by Smithand Voshell (1997) was also applied to the relevent taxa.
District of Columbia StreamsDC and RBP metric values for 1997-1998 District of Columbia macroinvertebrate data are
presented in the following Station Summaries. Information on the specific scoring procedureused by the District of Columbia for achieving a single numeric assessment value was notavailable. Communities were evaluated based on metrics' "expected responses" to perturbation;i.e. high values for some metrics indicated an increasing level of disturbance (PercentDominance, Percent Chironomidae, Hilsenhoff Biotic Index), while for other metrics high valuesindicated improving water quality (Percent EPT, Scrapers/ Scrapers + Filterers). Therefore thenarrative descriptions of overall condition are not based upon numeric criteria, but onlycharacterize general observed trends.
-21-
Table 4. Metrics calculated from the District of Columbia stream benthic macroinvertebrate samples.
Metric NameMetric
GroupCategory Description
Percent Dominance DC, RBP Composition Proportion of individuals of the most abundant taxon
Percent Chironomidae DC Composition Proportion of individuals of the midge fam ily
Percent Collectors DC Feeding Proportion of individuals in the collecting feeding group
(gatherers+filterers)
Percent Clingers RBP Habit Proportion of indiv iduals who cling to firm substrate
Clinger Taxa RBP Habit Number of clinging families
Percent Ephemeroptera RBP Composition Proportion of mayfly ind ividuals
Ephemeroptera Taxa RBP Richness Number of Ephemeroptera (mayfly) families
Percent EPT DC, RBP Composition Proportion of Ephemeroptera, Plecoptera, and Trichoptera
individuals
EPT Taxa DC, RBP Richness Number of Ephem eroptera, Plecoptera, and Trichoptera
families
Percent Filterers RBP Feeding Proportion of individuals who feed by filtering fine
particulate matter
Hilsenhoff Biotic Index DC Tolerance Abundance-weighted average tolerance of Families present
Hydropsychidae/EPT DC Composition Proportion of hydropsychid caddisflies to total EPT
individuals
Intolerant Taxa RBP Tolerance Number of families with Tolerance values <3
Plecoptera Taxa RBP Richness Number of Plecoptera (stonefly) families
Scrapers/Scrapers+Filterers DC Feeding Proportion of scraper individuals to scrapers plus filterers
PercentScrapers DC Feeding Proportion of individuals who feed by scraping algae from
hard surfaces
Percent Shredders DC Feeding Proportion of individuals which feed by shredding coarse
organic matter
Percent Tolerant DC Tolerance Proportion of individuals with high tolerance values
Taxonomic Richness DC, RBP Richness Total count of distinct taxonomic groups
Trichoptera Taxa DC, RBP Richness Number of Trichoptera (caddisfly) families

-22-

-23-
Data Files
Phytoplankton
Phytoplankton taxonomic counts and calculated metrics for 77 samples are in <Phytoplankton_I-II.xls>. Taxonomic serial numbers for each taxon are included. The data can be readily uploaded to theChesapeake Bay Program database.
Zooplankton
Mesozooplankton taxonomic counts and calculated metrics for 46 samples are in <Zooplankton I.xls>. Taxonomic serial numbers for each taxon are included. The data can be readily uploaded to theChesapeake Bay Program database.
Stream Benthic Macroinvertebrates
Five tables located in the Access database <DCStreamBenthos_Tables.mdb> contain the streammacrobenthic invertebrate data in a format uploadable to US EPA’s EDAS. The tables are Stations,BenSamps, Benthics, BenReps and Benthic_Master_Taxa. They were generated by EDAS v3.02 duringdata entry, and the records in the tables can be directly appended to the corresponding tables in an emptyEDAS v3.02 database structure. The Benthic_Master_Taxa table in the database contains informationentered by ICPRB that is not in an empty EDAS database structure. Specifically, we have selected andentered feeding group (FFG), habit, and tolerance values assignments for each taxa, and we haveincorporated the ITIS (Integrated Taxonomic Information System) Taxon Serial Number, Parent TaxonSerial Number, Phylum, Class, Order, and Family of each taxa. This information is needed to calculatedthe various biological metrics. The feeding group, habit, and tolerance assignments we have enteredmay differ from assignments used by the District, and they should be reviewed by District staff andmanually changed if the District chooses different assignments.
These five data tables should not be directly appended onto their corresponding tables in an EDASdatabase which already contains data. The reason for this is numeric codes are arbitrarily assigned toeach taxa during data entry and stored in both the Benthic_Master_Taxa and Benthics tables (field nameBenTaxaID). Code differences with the existing database will need to be reconciled before the newrecords are appended.
The Access database <DCStreamBenthos_Tables.mdb> also includes a table with the metrics requestedby the District (DCMetrics) with their calculated values for each site, a table with “best candidate”metrics as identified in the EPA Rapid Bioassessment Protocols (RBPBestCandidateMetrics) with theircalculated values for each site, and a table of metric names and descriptions (AllMetricNames).

-24-
Literature Cited
Barbour, M. T., J. Gerritsen, B. Snyder, and J. Stribling. 1999. Rapid Bioassessment Protocols for Usein Streams and Wadeable Rivers: Periphyton, Benthic macroinvertebrates and Fish, Second Edition.EPA 841-B-99-002. U.S. Environmental Protection Agency; Office of Water; Washington, D.C.
Beaven, M. and J.A. Mihursky. 1980. Food and feeding habits of larval striped bass: An analysis oflarval striped bass stomachs from the 1976 Potomac estuary collection. Final Rep. to Maryland PowerPlant Siting Program, University of Maryland, Solomons, MD. UMCEES 79-45 CBL.
Behm, P., A. Buckley, and C. L. Schultz. 2003. TAM/WASP toxics screening level model for the tidalportion of the Anacostia River, Final Draft. Prepared for the DC DOH/EHA.165p.
Buchanan, C., R. V. Lacouture, H. G. Marshall, M. Olson, and J. M. Johnson. 2005. PhytoplanktonReference Communities for Chesapeake Bay and its Tidal Tributaries. Estuaries 28(1):138-159.
Chesney, E.J. 1989. Estimating the food requirements of striped bass larvae Morone saxatilis: effectsof light, turbidity and turbulence. Mar. Ecol. Prog. Ser. 53:191-200.
Cushing, D.H. 1972. The production cycle and the numbers of marine fish. Symp. Zool. Soc. Lond.29:213-232.
DeFries, R. S. 1980. Sedimentation patterns in the Potomac Estuary since European settlement: apalynological approach. Doctor of Philosophy Dissertation for Johns Hopkins University. 164p.
Gottschalk, L. C. 1945. Effects of soil erosion on navigation in upper Chesapeake Bay. GeographicalReview 35:219-238.
Hjorth, D.A. 1988. Feeding selectivity of larval striped bass and white perch in the Hudson RiverEstuary. In: C. Lavett Smith (Ed.). Fisheries Research in the Hudson River. State Univ. of New YorkPress. 407p.
Houde, E. 1978. Critical food concentrations for larvae of three species of subtropical marine fishes. Bull. of Mar. Sci. 28:395-411.
Hunter, J.R. 1981. Feeding ecology and predation of marine fish larvae. In: Lasker, R. (ed.) Marinefish larvae. Univ. Washington Press, Seattle, p.33-77.
Kernehan, R.L., M.R. Headrick, and R.E. Smith. 1981. Early life history of striped bass in theChesapeake and Delaware Canal and vicinity. Trans. Am. Fish. Soc. 110:137-150.
Lacouture, R.V., S. Sellner, A. Hartsig and A. Imirie. 1999. Long term trends and current status ofphytoplankton and microzooplankton - Chesapeake Bay and Potomac, Patuxent and Choptank Rivers.Level 1 Report for Phytoplankton and Microzooplankton Component of the Chesapeake Bay WaterQuality Monitoring Program. 40 p.
-25-
Lacouture, R. V., J. M. Johnson, C. Buchanan, and H. G. Marshall. Submitted. Phytoplankton Index ofBiotic Integrity for Chesapeake Bay and its Tidal Tributaries.
Lippson, A., M. S. Haire, A. F. Holland, F. Jacobs, J. Jensen, R. L. Moran-Johnson, T. T. Polgar, and W.A. Richkus. 1979. Environmental Atlas of the Potomac Estuary. 280p. The Johns Hopkins UniversityPress, Baltimore, Maryland.
Miller, P.E. 1978. Food habit study of striped bass post yolk sac larvae. Prepared for MarylandDepartment of Energy and Coastal Zone Administration, Power Plant Siting Program. Johns HopkinsUniversity, Chesapeake Bay Institute Special Report No. 68.
Olson, M. 2002. Seasonal Flow Characterizations for the Principal Tributaries of Chesapeake Bay1984-2001 (including winter 2002). Report prepared for the Tidal Monitoring and Analysis Workgroup,Chesapeake Bay Program, Anapolis, MD.
Setzler-Hamilton, E.M., W.R. Boynton, J.A. Mihursky, T.T. Polgar, and K.V. Wood. 1981. Spatial andtemporal distribution of striped bass eggs, larvae, and juveniles in the Potomac estuary. Trans. Am.Fish. Soc. 110:121-136.
Smith, E. P. and R. Voshell. 1997. Studies of Benthic Macroinvertebrates and Fish in Streams WithinEPA Region 3 for Development of Biological Indicators of Ecological Condition. Part I: BenthicMacroinvertebrates. Virginia Tech, Blacksburg, Virginia.
Tsai, C.F., M.Wiley, and A.L. Chai. 1991. Rise and fall of the Potomac River striped bass tock: Ahypothesis of the role of sewage. Trans. Am. Fish. Soc.120:1-22.
U. S. Environmental Protection Agency. 2003. Ambient Water Quality Criteria for Dissolved Oxygen,Water Clarity and Chlorophyll a for Chesapeake Bay and tidal tributaries. Office of Water,Washington, D.C. Environmental Protection Agency 903
Uphoff, J.H. 1989. Environmental effects on survival of eggs, larvae, and juveniles, of striped bass inthe Choptank River, Maryland. Trans. Am. Fish. Soc.118:251-263.
Vannote, R., G. W. Minshall, K. W. Cummins, J. R. Sedell, and C. E. Cushing. 1980. The rivercontinuum concept. Can. J. Fish. Aquat. Sci. 37:130-137.
Versar, Inc., and PBS&J, Inc. 1999. Chesapeake Bay Water Quality Monitoring Program: 1998Mesozooplankton Component. Prepared for Maryland Department of Natural Resources ResourceAssessment Service. 84p.

-26-
Supporting Details
Email re: Formaline Preservative Strength
---------------------------------------------------------------------------- Date Sent: Wednesday, April 30, 2003 1:15 PM From: [email protected] (Claire Buchanan) To: Jeffrey Zahn <[email protected]> Cc: Stella Sellner <[email protected]> Subject: formalin preservative strength needed for zooplankton samples----------------------------------------------------------------------------
Jeffery - here are the formalin preservative strengths recommended for meso and micro zooplanktonsamples by Harris et al (2000) in their zooplankton methods manual:
Mesozooplankton:A formalin solution of 4% formaldehyde is recommended in Harris et al (2000). The formalinconcentration in stocks purchased from supply companies is typically 40% formaldehyde. If this is thecase, then 12.5 ml of the stock solution in a 125 ml sample jar will produce the recommended formalinsolution of 4% formaldehyde when the sample material is added to the jar in the field. Lower formalinconcentrations will adequately preserve organisms if the sample is sparse and does not contain a lot ofdetritus.
Microzooplankton:A formalin solution of 1% - 1.5% formaldehyde is recommended in Harris et al (2000). If the stockformalin solution is 40% formaldehyde, then 4 ml (3.2 - 4.7 ml) of the stock 40% formaldehyde solutionin a 125 ml sample jar will produce the recommended formalin solution of 1% - 1.5% when the samplematerial is added to the jar in the field.
Formaldehyde is a known carcinogen, and the stock formalin solution of 40% formaldehyde is oftendiluted in the laboratory if the formalin preservative is to be added to samples in the field after they havebeen collected. If the stock has been diluted, then more formalin solution needs to be added to samplesin the field. For example, if the diluted formalin solution is 10% formaldehyde, then 1 part solutionneeds to be added to 9 parts sample to make the final formaldehyde concentration equal to 1%(sufficient for microzooplankton).
I spoke with Stella about your question re the affect of cold temperatures on preserved samples. Shesays temperatures around freezing can sometimes affect the formaldehyde molecule, i.e. polymerize itand take it out of solution, thereby making it useless as a preservative. So you are probably wise to tryand keep the samples in away from freezing temperatures.
I'd be very interested to know if you think either the formalin strength or temperature could beunderlying the preservation problems Stella has been seeing in the microzooplankton samples. Thesooner we can correct the problem, the better the samples will be.
Enjoy your upcoming sampling day on the river - hope this good weather holds for you!

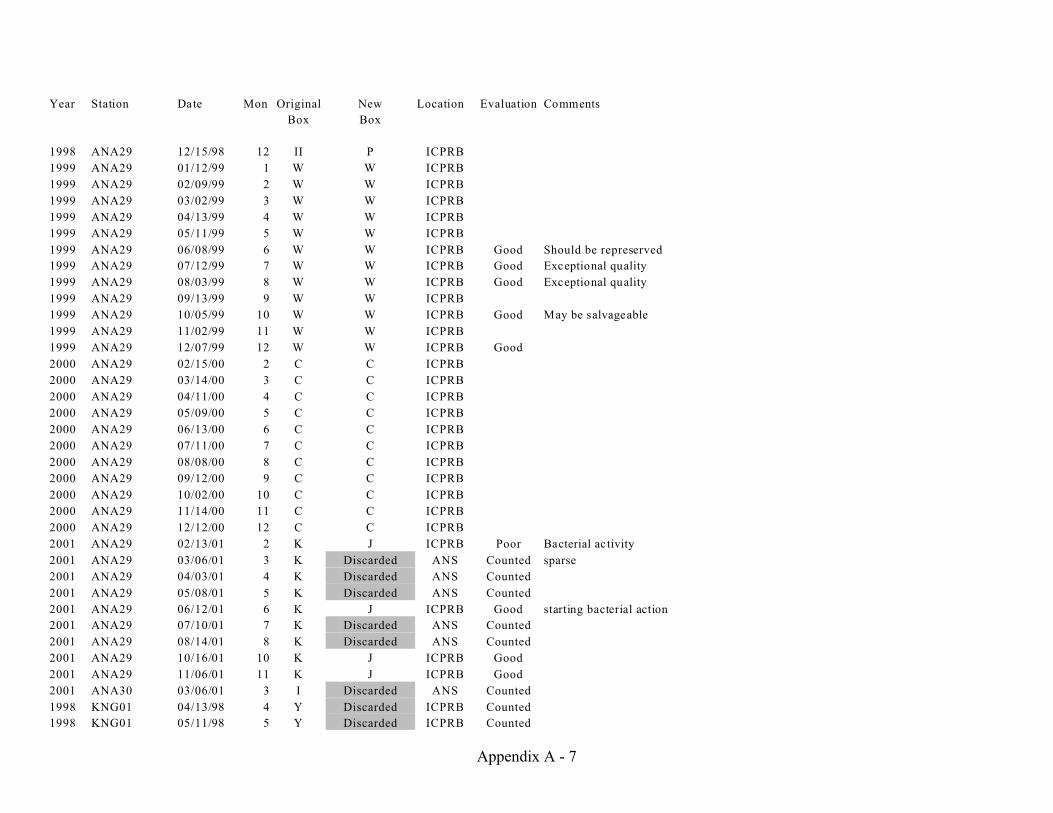
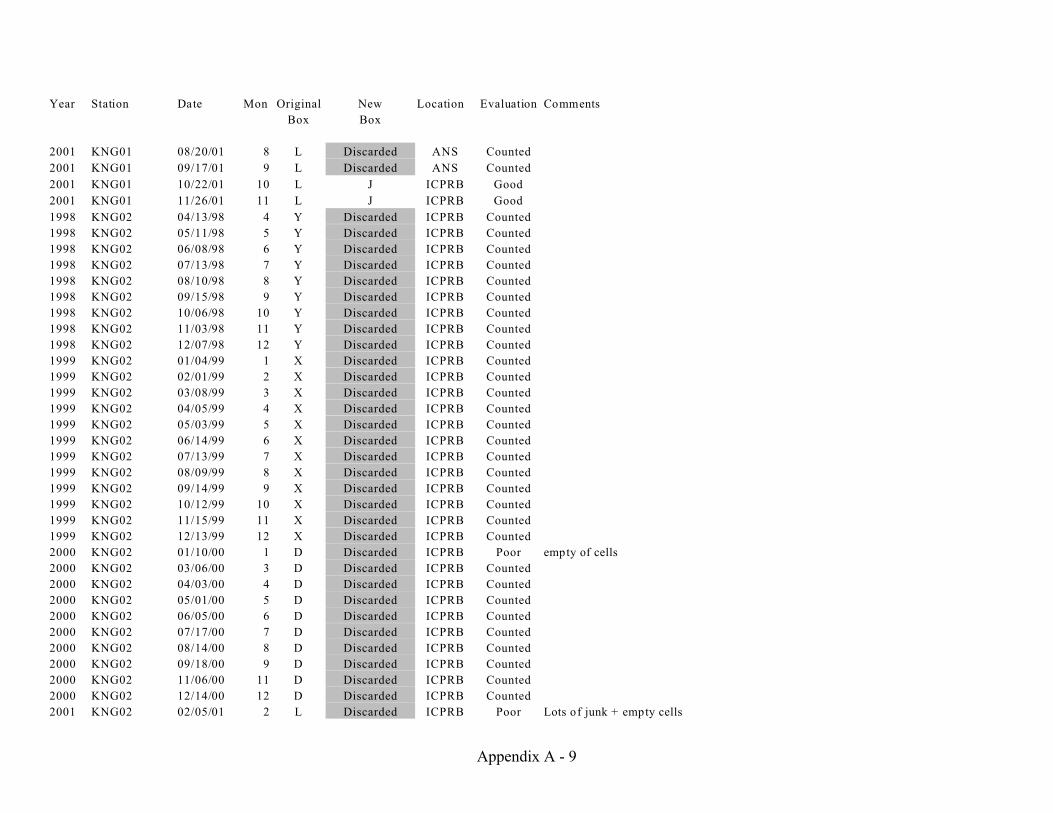
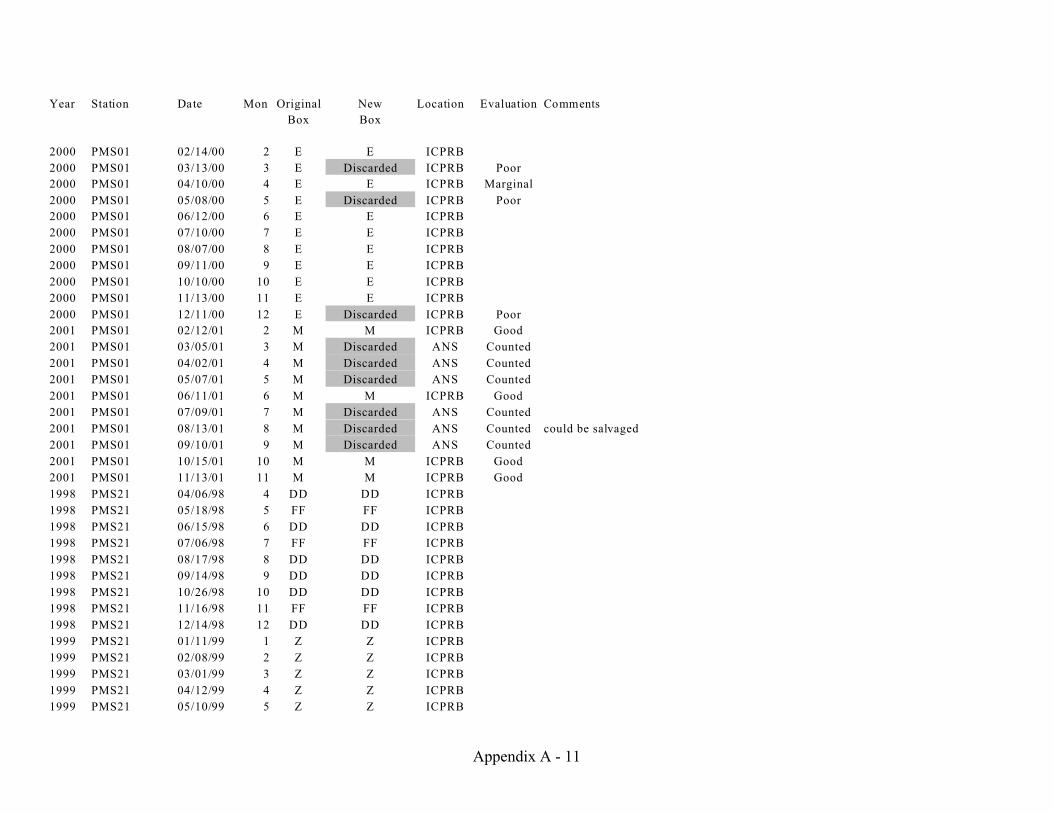
Appendix A - 1
Appendix A
Phytoplankton Sample Chain of Custody
May 31, 2005
Location Codes: ICPRB, Interstate Commission on the Potomac River BasinANS, Academy of Natural Sciences Estuarine Research Center
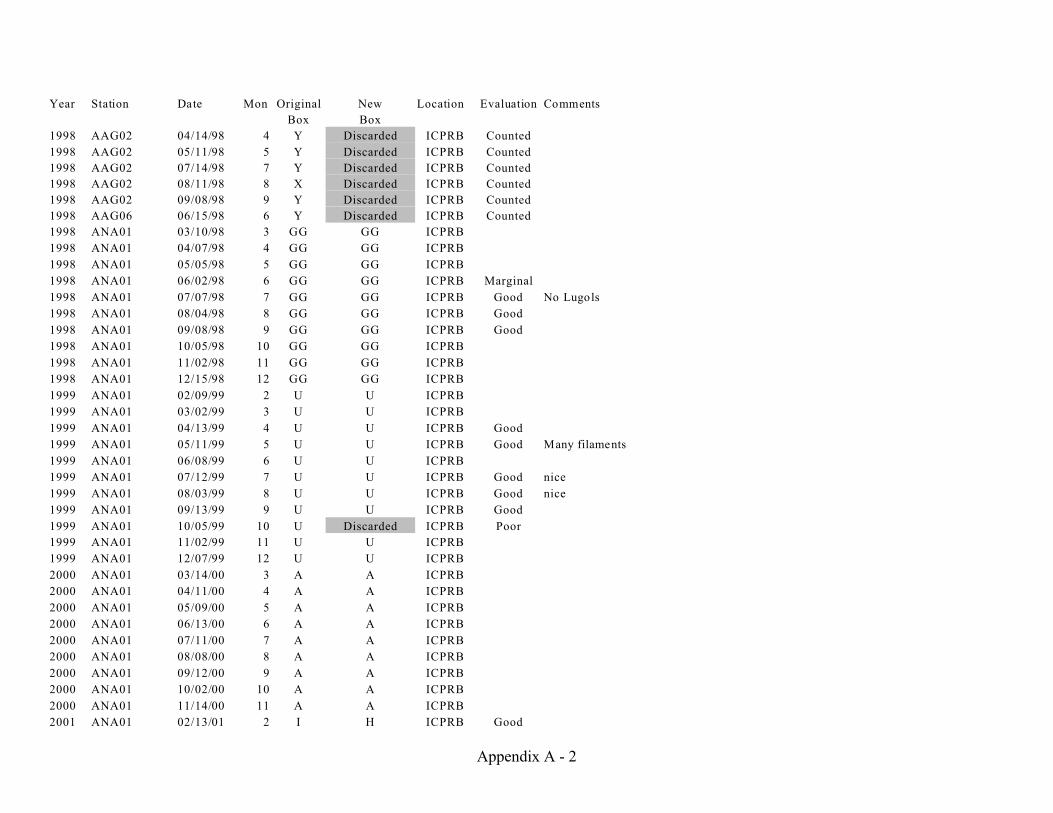
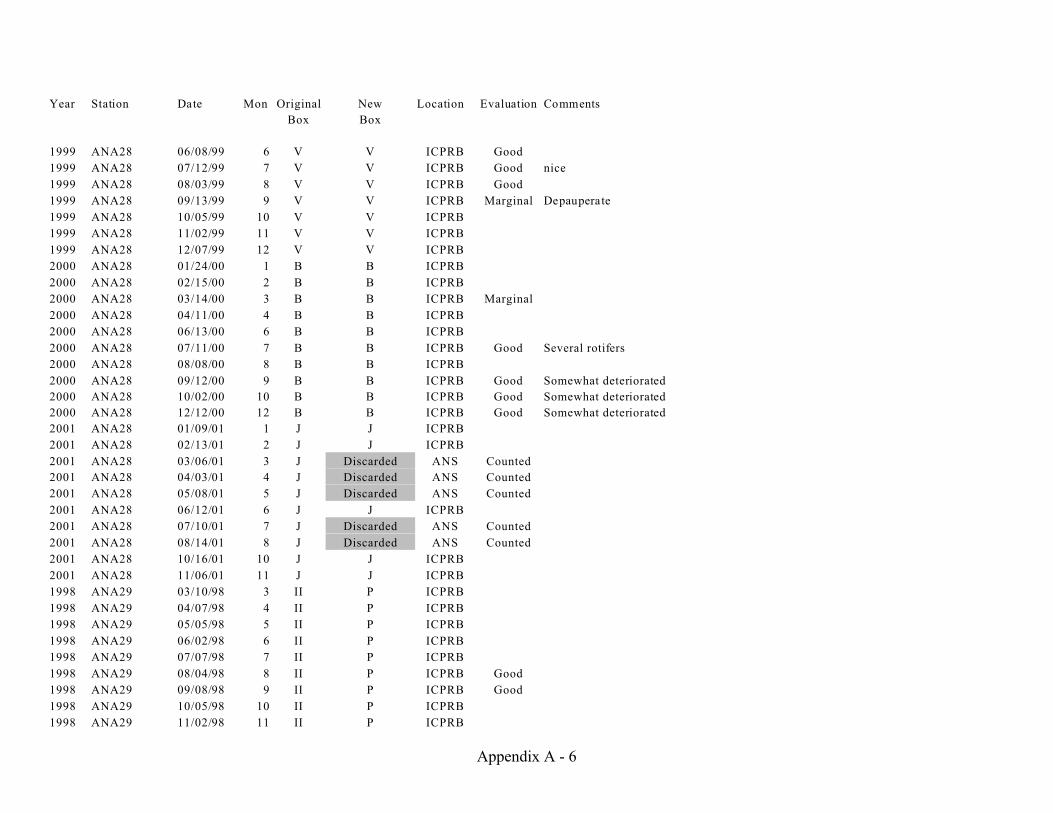
All remaining samples were reboxed in June 2004. Old and New box letters are recordedin the chain of custody. All remaining uncounted samples are located at ICPRB.
Appendix A - 2
Year Station Date Mon Original
Box
New
Box
Location Evaluation Comments
1998 AAG02 04/14/98 4 Y Discarded ICPRB Counted
1998 AAG02 05/11/98 5 Y Discarded ICPRB Counted
1998 AAG02 07/14/98 7 Y Discarded ICPRB Counted
1998 AAG02 08/11/98 8 X Discarded ICPRB Counted
1998 AAG02 09/08/98 9 Y Discarded ICPRB Counted
1998 AAG06 06/15/98 6 Y Discarded ICPRB Counted
1998 ANA01 03/10/98 3 GG GG ICPRB
1998 ANA01 04/07/98 4 GG GG ICPRB
1998 ANA01 05/05/98 5 GG GG ICPRB
1998 ANA01 06/02/98 6 GG GG ICPRB Marginal
1998 ANA01 07/07/98 7 GG GG ICPRB Good No Lugols
1998 ANA01 08/04/98 8 GG GG ICPRB Good
1998 ANA01 09/08/98 9 GG GG ICPRB Good
1998 ANA01 10/05/98 10 GG GG ICPRB
1998 ANA01 11/02/98 11 GG GG ICPRB
1998 ANA01 12/15/98 12 GG GG ICPRB
1999 ANA01 02/09/99 2 U U ICPRB
1999 ANA01 03/02/99 3 U U ICPRB
1999 ANA01 04/13/99 4 U U ICPRB Good
1999 ANA01 05/11/99 5 U U ICPRB Good Many filaments
1999 ANA01 06/08/99 6 U U ICPRB
1999 ANA01 07/12/99 7 U U ICPRB Good nice
1999 ANA01 08/03/99 8 U U ICPRB Good nice
1999 ANA01 09/13/99 9 U U ICPRB Good
1999 ANA01 10/05/99 10 U Discarded ICPRB Poor
1999 ANA01 11/02/99 11 U U ICPRB
1999 ANA01 12/07/99 12 U U ICPRB
2000 ANA01 03/14/00 3 A A ICPRB
2000 ANA01 04/11/00 4 A A ICPRB
2000 ANA01 05/09/00 5 A A ICPRB
2000 ANA01 06/13/00 6 A A ICPRB
2000 ANA01 07/11/00 7 A A ICPRB
2000 ANA01 08/08/00 8 A A ICPRB
2000 ANA01 09/12/00 9 A A ICPRB
2000 ANA01 10/02/00 10 A A ICPRB
2000 ANA01 11/14/00 11 A A ICPRB
2001 ANA01 02/13/01 2 I H ICPRB Good

Year Station Date Mon Original
Box
New
Box
Location Evaluation Comments
Appendix A - 3
2001 ANA01 04/03/01 4 I Discarded ANS Counted
2001 ANA01 05/08/01 5 I Discarded ANS Counted Bacterial
2001 ANA01 06/12/01 6 I Discarded ICPRB Poor Bacterial
2001 ANA01 07/10/01 7 I Discarded ANS Counted
2001 ANA01 08/14/01 8 I Discarded ANS Counted
2001 ANA01 10/16/01 10 I H ICPRB Good
2001 ANA01 11/06/01 11 I H ICPRB Good
1998 ANA14 03/10/98 3 GG GG ICPRB
1998 ANA14 04/07/98 4 GG GG ICPRB
1998 ANA14 05/05/98 5 GG GG ICPRB
1998 ANA14 06/02/98 6 GG GG ICPRB Good chloroplasts well maintained, sparse
1998 ANA14 07/07/98 7 GG GG ICPRB
1998 ANA14 08/04/98 8 GG GG ICPRB Good
1998 ANA14 09/08/98 9 GG GG ICPRB Good
1998 ANA14 10/05/98 10 GG GG ICPRB Good some deterioration
1998 ANA14 11/02/98 11 GG GG ICPRB
1998 ANA14 12/15/98 12 GG GG ICPRB
1999 ANA14 01/12/99 1 U U ICPRB
1999 ANA14 02/09/99 2 U U ICPRB
1999 ANA14 03/02/99 3 U U ICPRB
1999 ANA14 04/13/99 4 U U ICPRB
1999 ANA14 05/11/99 5 U U ICPRB
1999 ANA14 06/08/99 6 U U ICPRB Good Many filaments
1999 ANA14 07/12/99 7 U U ICPRB Good
1999 ANA14 08/03/99 8 U U ICPRB Marginal Few filaments
1999 ANA14 09/13/99 9 U U ICPRB Good Many filaments
1999 ANA14 10/05/99 10 U U ICPRB
1999 ANA14 11/02/99 11 U U ICPRB
1999 ANA14 12/07/99 12 U U ICPRB
2000 ANA14 02/15/00 2 B B ICPRB
2000 ANA14 03/14/00 3 B Discarded ICPRB Poor Some bacteria, many empties, no good chloroplasts
2000 ANA14 04/11/00 4 B B ICPRB Good ++euglenoids, good chloroplasts, flagella, colonies, no bacteria
2000 ANA14 05/09/00 5 B B ICPRB Good ++euglenoids, good chloroplasts, flagella, colonies, no bacteria
2000 ANA14 06/13/00 6 B B ICPRB Good chloroplasts, colonies, flagella, organelles, pyrenoids, Phacus, rotifers
2000 ANA14 07/11/00 7 B B ICPRB Good chloroplasts, colonies, flagella, organelles, pyrenoids, Phacus, rotifers
2000 ANA14 08/08/00 8 B B ICPRB Good Deteriorated; may be some identifiable cells

Year Station Date Mon Original
Box
New
Box
Location Evaluation Comments
Appendix A - 4
2000 ANA14 09/12/00 9 B B ICPRB Good Good chloroplasts, co lonies, flagella, organelles, pyrenoids, no bacteria
2000 ANA14 10/02/00 10 B B ICPRB Good
2000 ANA14 11/14/00 11 B B ICPRB Good
2000 ANA14 12/12/00 12 B B ICPRB Marginal
2001 ANA14 01/09/01 1 I H ICPRB Good
2001 ANA14 02/13/01 2 I H ICPRB Good
2001 ANA14 03/06/01 3 I Discarded ANS Counted Sparse
2001 ANA14 04/03/01 4 I Discarded ANS Counted Lots of empty frustules
2001 ANA14 05/08/01 5 I Discarded ANS Counted Sparse
2001 ANA14 06/12/01 6 I Discarded ICPRB Counted
2001 ANA14 07/10/01 7 I Discarded ANS Counted
2001 ANA14 08/14/01 8 I Discarded ANS Counted
2001 ANA14 10/16/01 10 I H ICPRB Good
2001 ANA14 11/06/01 11 I H ICPRB Good Dense
1998 ANA21 03/10/98 3 HH HH ICPRB Marginal
1998 ANA21 04/07/98 4 HH HH ICPRB Good sparse
1998 ANA21 05/05/98 5 HH HH ICPRB Good sparse
1998 ANA21 06/02/98 6 HH HH ICPRB
1998 ANA21 07/07/98 7 HH HH ICPRB Good
1998 ANA21 08/04/98 8 HH HH ICPRB Good
1998 ANA21 09/08/98 9 HH HH ICPRB Good
1998 ANA21 10/05/98 10 HH HH ICPRB Good
1998 ANA21 11/02/98 11 HH HH ICPRB Good
1998 ANA21 12/15/98 12 HH HH ICPRB Good
1999 ANA21 01/12/99 1 V V ICPRB Marginal Possibly salvageable
1999 ANA21 02/09/99 2 V V ICPRB
1999 ANA21 03/02/99 3 V V ICPRB
1999 ANA21 04/13/99 4 V V ICPRB
1999 ANA21 05/11/99 5 V V ICPRB Good Many empty frustules
1999 ANA21 06/07/99 6 V V ICPRB Good
1999 ANA21 07/12/99 7 V V ICPRB Good nice
1999 ANA21 08/03/99 8 V V ICPRB Good Many filaments
1999 ANA21 09/13/99 9 V V ICPRB Good
1999 ANA21 10/05/99 10 V V ICPRB
1999 ANA21 11/02/99 11 V V ICPRB Good
1999 ANA21 12/07/99 12 V V ICPRB

Year Station Date Mon Original
Box
New
Box
Location Evaluation Comments
Appendix A - 5
2000 ANA21 01/24/00 1 A A ICPRB
2000 ANA21 02/15/00 2 A A ICPRB
2000 ANA21 03/14/00 3 A A ICPRB
2000 ANA21 04/11/00 4 A A ICPRB
2000 ANA21 05/09/00 5 A A ICPRB
2000 ANA21 06/13/00 6 A A ICPRB
2000 ANA21 07/11/00 7 A A ICPRB
2000 ANA21 08/08/00 8 A A ICPRB
2000 ANA21 09/12/00 9 A A ICPRB
2000 ANA21 10/02/00 10 A A ICPRB
2000 ANA21 11/15/00 11 A A ICPRB
2000 ANA21 12/12/00 12 A A ICPRB
2001 ANA21 01/09/01 1 J J ICPRB
2001 ANA21 03/06/01 3 J Discarded ANS Counted very junky
2001 ANA21 04/03/01 4 J Discarded ANS Counted very junky
2001 ANA21 05/08/01 5 J Discarded ANS Counted sparse
2001 ANA21 07/10/01 7 J Discarded ANS Counted
2001 ANA21 08/14/01 8 J Discarded ANS Counted sparse
2001 ANA21 10/16/01 10 J J ICPRB Good
2001 ANA21 11/06/01 11 J J ICPRB
1998 ANA28 03/10/98 3 HH HH ICPRB Good sparse
1998 ANA28 04/07/98 4 HH HH ICPRB Good sparse
1998 ANA28 05/05/98 5 HH HH ICPRB Good sparse
1998 ANA28 06/02/98 6 HH HH ICPRB
1998 ANA28 07/07/98 7 HH HH ICPRB
1998 ANA28 08/04/98 8 HH HH ICPRB Marginal
1998 ANA28 09/08/98 9 HH HH ICPRB Good
1998 ANA28 10/05/98 10 HH HH ICPRB Good
1998 ANA28 11/02/98 11 HH HH ICPRB Good
1998 ANA28 12/15/98 12 HH HH ICPRB Good
1999 ANA28 01/12/99 1 V V ICPRB
1999 ANA28 02/09/99 2 V V ICPRB
1999 ANA28 03/02/99 3 V V ICPRB
1999 ANA28 04/13/99 4 V V ICPRB
1999 ANA28 05/11/99 5 V V ICPRB Marginal Very depauperate
Year Station Date Mon Original
Box
New
Box
Location Evaluation Comments
Appendix A - 6
1999 ANA28 06/08/99 6 V V ICPRB Good
1999 ANA28 07/12/99 7 V V ICPRB Good nice
1999 ANA28 08/03/99 8 V V ICPRB Good
1999 ANA28 09/13/99 9 V V ICPRB Marginal Depauperate
1999 ANA28 10/05/99 10 V V ICPRB
1999 ANA28 11/02/99 11 V V ICPRB
1999 ANA28 12/07/99 12 V V ICPRB
2000 ANA28 01/24/00 1 B B ICPRB
2000 ANA28 02/15/00 2 B B ICPRB
2000 ANA28 03/14/00 3 B B ICPRB Marginal
2000 ANA28 04/11/00 4 B B ICPRB
2000 ANA28 06/13/00 6 B B ICPRB
2000 ANA28 07/11/00 7 B B ICPRB Good Several rotifers
2000 ANA28 08/08/00 8 B B ICPRB
2000 ANA28 09/12/00 9 B B ICPRB Good Somewhat deteriorated
2000 ANA28 10/02/00 10 B B ICPRB Good Somewhat deteriorated
2000 ANA28 12/12/00 12 B B ICPRB Good Somewhat deteriorated
2001 ANA28 01/09/01 1 J J ICPRB
2001 ANA28 02/13/01 2 J J ICPRB
2001 ANA28 03/06/01 3 J Discarded ANS Counted
2001 ANA28 04/03/01 4 J Discarded ANS Counted
2001 ANA28 05/08/01 5 J Discarded ANS Counted
2001 ANA28 06/12/01 6 J J ICPRB
2001 ANA28 07/10/01 7 J Discarded ANS Counted
2001 ANA28 08/14/01 8 J Discarded ANS Counted
2001 ANA28 10/16/01 10 J J ICPRB
2001 ANA28 11/06/01 11 J J ICPRB
1998 ANA29 03/10/98 3 II P ICPRB
1998 ANA29 04/07/98 4 II P ICPRB
1998 ANA29 05/05/98 5 II P ICPRB
1998 ANA29 06/02/98 6 II P ICPRB
1998 ANA29 07/07/98 7 II P ICPRB
1998 ANA29 08/04/98 8 II P ICPRB Good
1998 ANA29 09/08/98 9 II P ICPRB Good
1998 ANA29 10/05/98 10 II P ICPRB
1998 ANA29 11/02/98 11 II P ICPRB
Year Station Date Mon Original
Box
New
Box
Location Evaluation Comments
Appendix A - 7
1998 ANA29 12/15/98 12 II P ICPRB
1999 ANA29 01/12/99 1 W W ICPRB
1999 ANA29 02/09/99 2 W W ICPRB
1999 ANA29 03/02/99 3 W W ICPRB
1999 ANA29 04/13/99 4 W W ICPRB
1999 ANA29 05/11/99 5 W W ICPRB
1999 ANA29 06/08/99 6 W W ICPRB Good Should be represerved
1999 ANA29 07/12/99 7 W W ICPRB Good Exceptional quality
1999 ANA29 08/03/99 8 W W ICPRB Good Exceptional quality
1999 ANA29 09/13/99 9 W W ICPRB
1999 ANA29 10/05/99 10 W W ICPRB Good May be salvageable
1999 ANA29 11/02/99 11 W W ICPRB
1999 ANA29 12/07/99 12 W W ICPRB Good
2000 ANA29 02/15/00 2 C C ICPRB
2000 ANA29 03/14/00 3 C C ICPRB
2000 ANA29 04/11/00 4 C C ICPRB
2000 ANA29 05/09/00 5 C C ICPRB
2000 ANA29 06/13/00 6 C C ICPRB
2000 ANA29 07/11/00 7 C C ICPRB
2000 ANA29 08/08/00 8 C C ICPRB
2000 ANA29 09/12/00 9 C C ICPRB
2000 ANA29 10/02/00 10 C C ICPRB
2000 ANA29 11/14/00 11 C C ICPRB
2000 ANA29 12/12/00 12 C C ICPRB
2001 ANA29 02/13/01 2 K J ICPRB Poor Bacterial ac tivity
2001 ANA29 03/06/01 3 K Discarded ANS Counted sparse
2001 ANA29 04/03/01 4 K Discarded ANS Counted
2001 ANA29 05/08/01 5 K Discarded ANS Counted
2001 ANA29 06/12/01 6 K J ICPRB Good starting bacterial action
2001 ANA29 07/10/01 7 K Discarded ANS Counted
2001 ANA29 08/14/01 8 K Discarded ANS Counted
2001 ANA29 10/16/01 10 K J ICPRB Good
2001 ANA29 11/06/01 11 K J ICPRB Good
2001 ANA30 03/06/01 3 I Discarded ANS Counted
1998 KNG01 04/13/98 4 Y Discarded ICPRB Counted
1998 KNG01 05/11/98 5 Y Discarded ICPRB Counted

Year Station Date Mon Original
Box
New
Box
Location Evaluation Comments
Appendix A - 8
1998 KNG01 06/08/98 6 Y Discarded ICPRB Counted
1998 KNG01 07/13/98 7 Y Discarded ICPRB Counted
1998 KNG01 08/10/98 8 Y Discarded ICPRB Counted
1998 KNG01 09/15/98 9 Y Discarded ICPRB Counted
1998 KNG01 10/06/98 10 Y Discarded ICPRB Counted
1998 KNG01 11/03/98 11 Y Discarded ICPRB Counted
1998 KNG01 12/07/98 12 Y Discarded ICPRB Counted
1999 KNG01 01/04/99 1 X Discarded ICPRB Counted
1999 KNG01 02/01/99 2 X Discarded ICPRB Counted
1999 KNG01 03/08/99 3 X Discarded ICPRB Counted
1999 KNG01 04/05/99 4 X Discarded ICPRB Counted
1999 KNG01 05/03/99 5 X Discarded ICPRB Counted
1999 KNG01 06/14/99 6 X Discarded ICPRB Counted
1999 KNG01 07/13/99 7 X Discarded ICPRB Counted
1999 KNG01 07/14/99 7 X Discarded ICPRB Counted
1999 KNG01 08/09/99 8 X Discarded ICPRB Counted
1999 KNG01 10/12/99 10 X Discarded ICPRB Counted
1999 KNG01 11/15/99 11 X Discarded ICPRB Counted
1999 KNG01 12/13/99 12 X Discarded ICPRB Counted
2000 KNG01 01/10/00 1 D Discarded ICPRB Counted
2000 KNG01 02/07/00 2 D Discarded ICPRB Counted
2000 KNG01 03/06/00 3 D Discarded ICPRB Counted
2000 KNG01 04/03/00 4 D Discarded ICPRB Counted
2000 KNG01 05/01/00 5 D Discarded ICPRB Counted
2000 KNG01 06/05/00 6 D Discarded ICPRB Counted
2000 KNG01 07/17/00 7 D Discarded ICPRB Counted
2000 KNG01 08/14/00 8 D Discarded ICPRB Counted
2000 KNG01 09/18/00 9 D Discarded ICPRB Counted
2000 KNG01 11/06/00 11 D Discarded ICPRB Counted
2000 KNG01 12/14/00 12 D Discarded ICPRB Counted
2001 KNG01 02/05/01 2 L J ICPRB Marginal Dense
2001 KNG01 03/12/01 3 L Discarded ANS Counted
2001 KNG01 04/09/01 4 L Discarded ANS Counted
2001 KNG01 05/14/01 5 L Discarded ANS Counted
2001 KNG01 06/18/01 6 L J ICPRB Marginal Lots of junk
2001 KNG01 07/16/01 7 L Discarded ANS Counted
Year Station Date Mon Original
Box
New
Box
Location Evaluation Comments
Appendix A - 9
2001 KNG01 08/20/01 8 L Discarded ANS Counted
2001 KNG01 09/17/01 9 L Discarded ANS Counted
2001 KNG01 10/22/01 10 L J ICPRB Good
2001 KNG01 11/26/01 11 L J ICPRB Good
1998 KNG02 04/13/98 4 Y Discarded ICPRB Counted
1998 KNG02 05/11/98 5 Y Discarded ICPRB Counted
1998 KNG02 06/08/98 6 Y Discarded ICPRB Counted
1998 KNG02 07/13/98 7 Y Discarded ICPRB Counted
1998 KNG02 08/10/98 8 Y Discarded ICPRB Counted
1998 KNG02 09/15/98 9 Y Discarded ICPRB Counted
1998 KNG02 10/06/98 10 Y Discarded ICPRB Counted
1998 KNG02 11/03/98 11 Y Discarded ICPRB Counted
1998 KNG02 12/07/98 12 Y Discarded ICPRB Counted
1999 KNG02 01/04/99 1 X Discarded ICPRB Counted
1999 KNG02 02/01/99 2 X Discarded ICPRB Counted
1999 KNG02 03/08/99 3 X Discarded ICPRB Counted
1999 KNG02 04/05/99 4 X Discarded ICPRB Counted
1999 KNG02 05/03/99 5 X Discarded ICPRB Counted
1999 KNG02 06/14/99 6 X Discarded ICPRB Counted
1999 KNG02 07/13/99 7 X Discarded ICPRB Counted
1999 KNG02 08/09/99 8 X Discarded ICPRB Counted
1999 KNG02 09/14/99 9 X Discarded ICPRB Counted
1999 KNG02 10/12/99 10 X Discarded ICPRB Counted
1999 KNG02 11/15/99 11 X Discarded ICPRB Counted
1999 KNG02 12/13/99 12 X Discarded ICPRB Counted
2000 KNG02 01/10/00 1 D Discarded ICPRB Poor empty of cells
2000 KNG02 03/06/00 3 D Discarded ICPRB Counted
2000 KNG02 04/03/00 4 D Discarded ICPRB Counted
2000 KNG02 05/01/00 5 D Discarded ICPRB Counted
2000 KNG02 06/05/00 6 D Discarded ICPRB Counted
2000 KNG02 07/17/00 7 D Discarded ICPRB Counted
2000 KNG02 08/14/00 8 D Discarded ICPRB Counted
2000 KNG02 09/18/00 9 D Discarded ICPRB Counted
2000 KNG02 11/06/00 11 D Discarded ICPRB Counted
2000 KNG02 12/14/00 12 D Discarded ICPRB Counted
2001 KNG02 02/05/01 2 L Discarded ICPRB Poor Lots of junk + empty cells

Year Station Date Mon Original
Box
New
Box
Location Evaluation Comments
Appendix A - 10
2001 KNG02 03/12/01 3 L Discarded ANS Counted sparse
2001 KNG02 04/09/01 4 L Discarded ANS Counted beginning to deteriorate
2001 KNG02 05/14/01 5 L Discarded ICPRB Counted
2001 KNG02 06/18/01 6 L Discarded ICPRB Counted
2001 KNG02 07/16/01 7 L Discarded ANS Counted +++Dinos!!
2001 KNG02 08/20/01 8 L Discarded ANS Counted
2001 KNG02 09/17/01 9 L Discarded ANS Counted ++++Microcystis
2001 KNG02 10/22/01 10 L J ICPRB Good ++++Diatoms
2001 KNG02 11/26/01 11 L J ICPRB Good
1999 KNGLOWER 07/16/99 7 Y Discarded ICPRB Counted
1999 KNGLOWER 08/16/99 8 Y Discarded ICPRB Counted
1999 KNGLOWER 09/15/99 9 Y Discarded ICPRB Counted
1999 KNGUPPER 07/16/99 7 X Discarded ICPRB Counted
1999 KNGUPPER 08/16/99 8 Y Discarded ICPRB Counted
1999 KNGUPPER 09/15/99 9 X Discarded ICPRB Counted
1998 PMS01 04/06/98 4 DD DD ICPRB
1998 PMS01 05/18/98 5 DD DD ICPRB
1998 PMS01 06/15/98 6 DD DD ICPRB
1998 PMS01 07/06/98 7 FF FF ICPRB
1998 PMS01 08/17/98 8 DD DD ICPRB
1998 PMS01 09/14/98 9 DD DD ICPRB
1998 PMS01 10/26/98 10 DD DD ICPRB
1998 PMS01 11/16/98 11 FF FF ICPRB
1998 PMS01 12/14/98 12 DD DD ICPRB
1999 PMS01 02/08/99 2 Z Z ICPRB
1999 PMS01 03/01/99 3 Z Z ICPRB Good
1999 PMS01 04/12/99 4 Z Z ICPRB
1999 PMS01 05/10/99 5 Z Z ICPRB
1999 PMS01 06/07/99 6 Z Z ICPRB
1999 PMS01 07/06/99 7 Z Z ICPRB Marginal Very depauperate
1999 PMS01 08/02/99 8 Z Z ICPRB Marginal May be salvageable
1999 PMS01 09/07/99 9 Z Z ICPRB
1999 PMS01 10/04/99 10 Z Z ICPRB
1999 PMS01 11/01/99 11 Z Z ICPRB
1999 PMS01 12/06/99 12 Z Z ICPRB Good
2000 PMS01 01/18/00 1 E E ICPRB
Year Station Date Mon Original
Box
New
Box
Location Evaluation Comments
Appendix A - 11
2000 PMS01 02/14/00 2 E E ICPRB
2000 PMS01 03/13/00 3 E Discarded ICPRB Poor
2000 PMS01 04/10/00 4 E E ICPRB Marginal
2000 PMS01 05/08/00 5 E Discarded ICPRB Poor
2000 PMS01 06/12/00 6 E E ICPRB
2000 PMS01 07/10/00 7 E E ICPRB
2000 PMS01 08/07/00 8 E E ICPRB
2000 PMS01 09/11/00 9 E E ICPRB
2000 PMS01 10/10/00 10 E E ICPRB
2000 PMS01 11/13/00 11 E E ICPRB
2000 PMS01 12/11/00 12 E Discarded ICPRB Poor
2001 PMS01 02/12/01 2 M M ICPRB Good
2001 PMS01 03/05/01 3 M Discarded ANS Counted
2001 PMS01 04/02/01 4 M Discarded ANS Counted
2001 PMS01 05/07/01 5 M Discarded ANS Counted
2001 PMS01 06/11/01 6 M M ICPRB Good
2001 PMS01 07/09/01 7 M Discarded ANS Counted
2001 PMS01 08/13/01 8 M Discarded ANS Counted could be salvaged
2001 PMS01 09/10/01 9 M Discarded ANS Counted
2001 PMS01 10/15/01 10 M M ICPRB Good
2001 PMS01 11/13/01 11 M M ICPRB Good
1998 PMS21 04/06/98 4 DD DD ICPRB
1998 PMS21 05/18/98 5 FF FF ICPRB
1998 PMS21 06/15/98 6 DD DD ICPRB
1998 PMS21 07/06/98 7 FF FF ICPRB
1998 PMS21 08/17/98 8 DD DD ICPRB
1998 PMS21 09/14/98 9 DD DD ICPRB
1998 PMS21 10/26/98 10 DD DD ICPRB
1998 PMS21 11/16/98 11 FF FF ICPRB
1998 PMS21 12/14/98 12 DD DD ICPRB
1999 PMS21 01/11/99 1 Z Z ICPRB
1999 PMS21 02/08/99 2 Z Z ICPRB
1999 PMS21 03/01/99 3 Z Z ICPRB
1999 PMS21 04/12/99 4 Z Z ICPRB
1999 PMS21 05/10/99 5 Z Z ICPRB

Year Station Date Mon Original
Box
New
Box
Location Evaluation Comments
Appendix A - 12
1999 PMS21 06/07/99 6 Z Z ICPRB
1999 PMS21 07/06/99 7 Z Z ICPRB
1999 PMS21 08/02/99 8 Z Z ICPRB
1999 PMS21 09/07/99 9 Z Z ICPRB
1999 PMS21 10/04/99 10 Z Z ICPRB
1999 PMS21 11/01/99 11 Z Z ICPRB
1999 PMS21 12/06/99 12 Z Z ICPRB
2000 PMS21 01/18/00 1 E E ICPRB
2000 PMS21 02/14/00 2 E E ICPRB
2000 PMS21 03/13/00 3 E E ICPRB
2000 PMS21 04/10/00 4 E Discarded ICPRB Poor Somewhat deteriorated
2000 PMS21 05/08/00 5 E E ICPRB Marginal Extremely sparse, some good chloroplasts, may be okay
2000 PMS21 06/12/00 6 E Discarded ICPRB Poor Bacteria
2000 PMS21 07/10/00 7 E Discarded ICPRB Poor Very sparse - some chloroplasts, flagella, colonies, no bacteria - for this month and
year (drought) this doesn't jive
2000 PMS21 08/07/00 8 E Discarded ICPRB Poor Very sparse - some chloroplasts, flagella, colonies, no bacteria - for this month and
year (drought) this doesn't jive
2000 PMS21 09/11/00 9 E E ICPRB Marginal Very Depauperate; many ciliates
2000 PMS21 10/10/00 10 E E ICPRB
2000 PMS21 11/13/00 11 E E ICPRB
2000 PMS21 12/11/00 12 E E ICPRB
2001 PMS21 01/08/01 1 M M ICPRB Good sparse
2001 PMS21 02/12/01 2 M M ICPRB Good sparse
2001 PMS21 03/05/01 3 M Discarded ANS Counted sparse
2001 PMS21 04/02/01 4 M Discarded ANS Counted sparse
2001 PMS21 05/07/01 5 M Discarded ANS Counted
2001 PMS21 06/11/01 6 M M ICPRB Good
2001 PMS21 07/09/01 7 M Discarded ANS Counted
2001 PMS21 08/13/01 8 M Discarded ANS Counted
2001 PMS21 09/10/01 9 M Discarded ANS Counted junky, sparse
2001 PMS21 10/15/01 10 M M ICPRB Good
2001 PMS21 11/13/01 11 M M ICPRB Good
1998 PMS37 04/06/98 4 EE EE ICPRB
1998 PMS37 05/18/98 5 EE EE ICPRB
1998 PMS37 06/15/98 6 EE EE ICPRB
1998 PMS37 07/06/98 7 EE EE ICPRB

Year Station Date Mon Original
Box
New
Box
Location Evaluation Comments
Appendix A - 13
1998 PMS37 08/17/98 8 EE EE ICPRB
1998 PMS37 09/14/98 9 EE EE ICPRB
1998 PMS37 10/26/98 10 EE EE ICPRB
1998 PMS37 11/16/98 11 EE EE ICPRB
1998 PMS37 12/14/98 12 EE EE ICPRB
1999 PMS37 01/11/99 1 AA AA ICPRB
1999 PMS37 02/08/99 2 AA AA ICPRB
1999 PMS37 03/01/99 3 AA AA ICPRB Good good chloroplasts, flagella, pyrenoids, ++junk
1999 PMS37 04/12/99 4 AA AA ICPRB Marginal ++empty frustules and ++junk, but good chloroplasts
1999 PMS37 05/10/99 5 AA AA ICPRB Good very sparse, good chloroplasts, flagella
1999 PMS37 06/07/99 6 AA AA ICPRB Good good chloroplasts, flagella, colonies, pyrenoids
1999 PMS37 07/06/99 7 AA AA ICPRB Good good chloroplasts, flagella, colonies, pyrenoids - some decomposition
1999 PMS37 08/02/99 8 AA AA ICPRB Good good chloroplasts, flagella, colonies, pyrenoids, no bacteria
1999 PMS37 09/07/99 9 AA AA ICPRB Good good chloroplasts, flagella, colonies
1999 PMS37 10/04/99 10 AA AA ICPRB
1999 PMS37 11/01/99 11 AA AA ICPRB
1999 PMS37 12/06/99 12 AA AA ICPRB
2000 PMS37 01/18/00 1 F F ICPRB
2000 PMS37 02/14/00 2 F F ICPRB
2000 PMS37 03/13/00 3 F F ICPRB Good chloroplasts, flagella, organelles, no bacteria
2000 PMS37 04/10/00 4 F Discarded ICPRB Poor diatom chloroplasts okay but soft-bodied cells missing - no bacteria
2000 PMS37 05/08/00 5 F Discarded ICPRB Poor diatom chloroplasts okay but soft-bodied cells missing - no bacteria
2000 PMS37 06/12/00 6 F Discarded ICPRB Poor diatom chloroplasts okay but soft-bodied cells missing - no bacteria
2000 PMS37 07/10/00 7 F F ICPRB
2000 PMS37 08/07/00 8 F F ICPRB
2000 PMS37 09/11/00 9 F F ICPRB
2000 PMS37 10/10/00 10 F F ICPRB
2000 PMS37 11/13/00 11 F F ICPRB
2000 PMS37 12/11/00 12 F F ICPRB
2001 PMS37 01/08/01 1 N M ICPRB
2001 PMS37 02/12/01 2 N M ICPRB
2001 PMS37 03/05/01 3 N Discarded ANS Counted
2001 PMS37 04/02/01 4 N Discarded ANS Counted
2001 PMS37 05/07/01 5 N Discarded ANS Counted
2001 PMS37 06/11/01 6 N M ICPRB
2001 PMS37 07/09/01 7 N Discarded ANS Counted

Year Station Date Mon Original
Box
New
Box
Location Evaluation Comments
Appendix A - 14
2001 PMS37 08/13/01 8 N Discarded ANS Counted
2001 PMS37 09/10/01 9 N Discarded ANS Counted
2001 PMS37 10/15/01 10 N M ICPRB
2001 PMS37 11/13/01 11 N M ICPRB
1998 PMS51 04/06/98 4 EE EE ICPRB
1998 PMS51 05/18/98 5 EE EE ICPRB
1998 PMS51 06/15/98 6 EE EE ICPRB
1998 PMS51 07/06/98 7 EE EE ICPRB
1998 PMS51 08/17/98 8 EE EE ICPRB
1998 PMS51 09/14/98 9 EE EE ICPRB
1998 PMS51 11/16/98 11 EE EE ICPRB
1998 PMS51 12/14/98 12 EE EE ICPRB
1998 PMS51 12/26/98 12 EE EE ICPRB
1999 PMS51 02/08/99 2 AA AA ICPRB
1999 PMS51 03/01/99 3 AA AA ICPRB
1999 PMS51 04/12/99 4 AA AA ICPRB
1999 PMS51 05/10/99 5 AA AA ICPRB
1999 PMS51 07/06/99 7 AA AA ICPRB
1999 PMS51 08/02/99 8 AA AA ICPRB
1999 PMS51 09/07/99 9 AA AA ICPRB
1999 PMS51 10/04/99 10 AA AA ICPRB
1999 PMS51 11/01/99 11 AA AA ICPRB
1999 PMS51 12/06/99 12 AA AA ICPRB
2000 PMS51 03/14/00 3 C C ICPRB
2000 PMS51 04/10/00 4 C C ICPRB
2000 PMS51 05/08/00 5 C C ICPRB
2000 PMS51 06/12/00 6 C C ICPRB
2000 PMS51 07/10/00 7 C C ICPRB
2000 PMS51 08/07/00 8 C C ICPRB
2000 PMS51 09/11/00 9 C C ICPRB
2000 PMS51 10/10/00 10 C C ICPRB
2000 PMS51 11/13/00 11 C C ICPRB
2000 PMS51 12/11/00 12 C C ICPRB
2001 PMS51 02/12/01 2 N M ICPRB
2001 PMS51 04/02/01 4 N Discarded ANS Counted
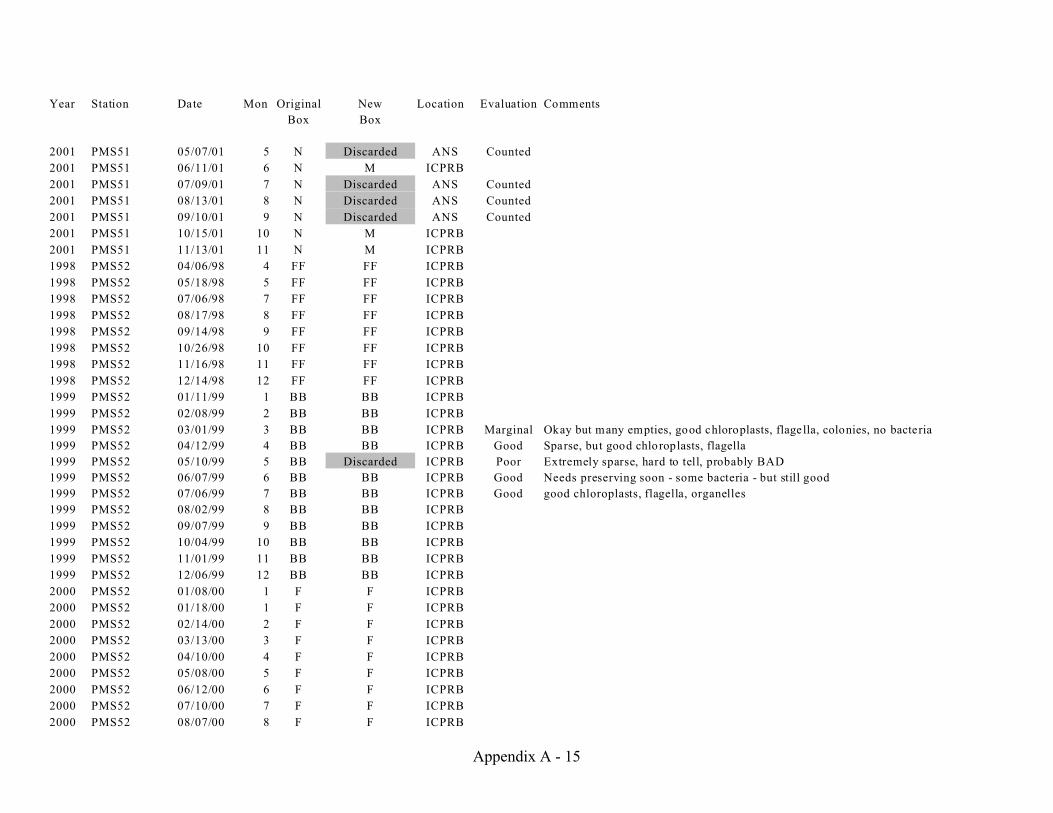
Year Station Date Mon Original
Box
New
Box
Location Evaluation Comments
Appendix A - 15
2001 PMS51 05/07/01 5 N Discarded ANS Counted
2001 PMS51 06/11/01 6 N M ICPRB
2001 PMS51 07/09/01 7 N Discarded ANS Counted
2001 PMS51 08/13/01 8 N Discarded ANS Counted
2001 PMS51 09/10/01 9 N Discarded ANS Counted
2001 PMS51 10/15/01 10 N M ICPRB
2001 PMS51 11/13/01 11 N M ICPRB
1998 PMS52 04/06/98 4 FF FF ICPRB
1998 PMS52 05/18/98 5 FF FF ICPRB
1998 PMS52 07/06/98 7 FF FF ICPRB
1998 PMS52 08/17/98 8 FF FF ICPRB
1998 PMS52 09/14/98 9 FF FF ICPRB
1998 PMS52 10/26/98 10 FF FF ICPRB
1998 PMS52 11/16/98 11 FF FF ICPRB
1998 PMS52 12/14/98 12 FF FF ICPRB
1999 PMS52 01/11/99 1 BB BB ICPRB
1999 PMS52 02/08/99 2 BB BB ICPRB
1999 PMS52 03/01/99 3 BB BB ICPRB Marginal Okay but many empties, good chloroplasts, flagella, colonies, no bacteria
1999 PMS52 04/12/99 4 BB BB ICPRB Good Sparse, but good chloroplasts, flagella
1999 PMS52 05/10/99 5 BB Discarded ICPRB Poor Extremely sparse, hard to tell, probably BAD
1999 PMS52 06/07/99 6 BB BB ICPRB Good Needs preserving soon - some bacteria - but still good
1999 PMS52 07/06/99 7 BB BB ICPRB Good good chloroplasts, flagella, organelles
1999 PMS52 08/02/99 8 BB BB ICPRB
1999 PMS52 09/07/99 9 BB BB ICPRB
1999 PMS52 10/04/99 10 BB BB ICPRB
1999 PMS52 11/01/99 11 BB BB ICPRB
1999 PMS52 12/06/99 12 BB BB ICPRB
2000 PMS52 01/08/00 1 F F ICPRB
2000 PMS52 01/18/00 1 F F ICPRB
2000 PMS52 02/14/00 2 F F ICPRB
2000 PMS52 03/13/00 3 F F ICPRB
2000 PMS52 04/10/00 4 F F ICPRB
2000 PMS52 05/08/00 5 F F ICPRB
2000 PMS52 06/12/00 6 F F ICPRB
2000 PMS52 07/10/00 7 F F ICPRB
2000 PMS52 08/07/00 8 F F ICPRB
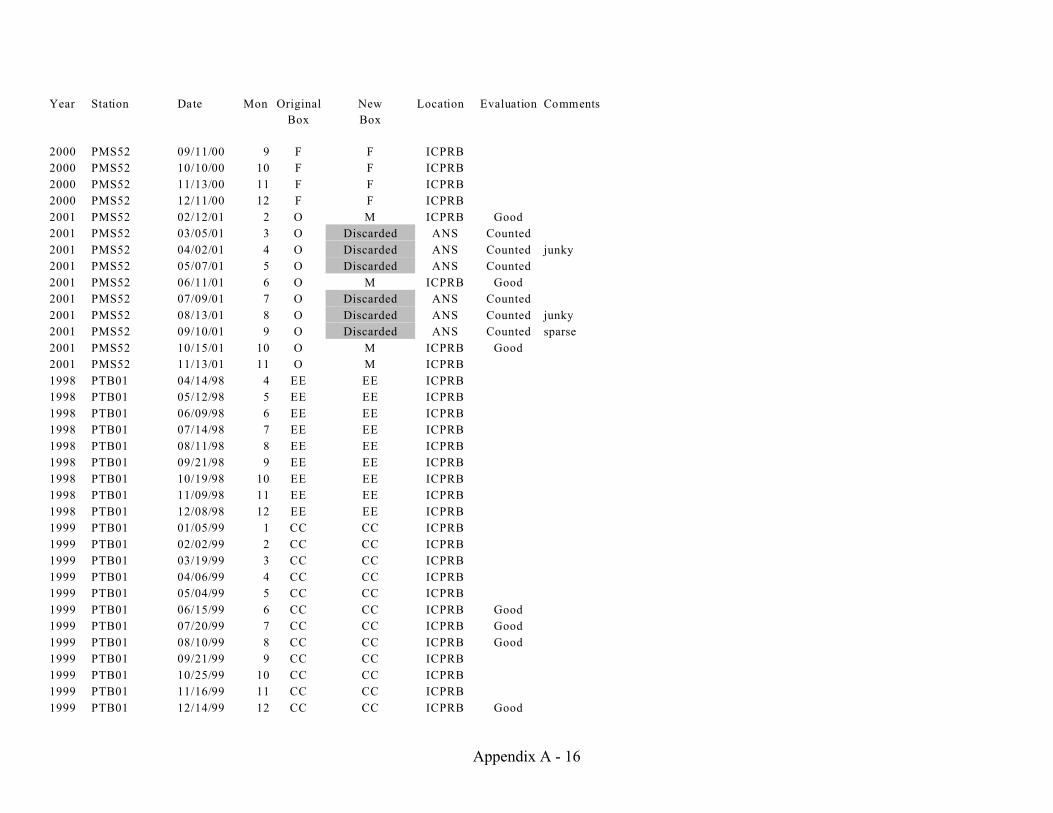
Year Station Date Mon Original
Box
New
Box
Location Evaluation Comments
Appendix A - 16
2000 PMS52 09/11/00 9 F F ICPRB
2000 PMS52 10/10/00 10 F F ICPRB
2000 PMS52 11/13/00 11 F F ICPRB
2000 PMS52 12/11/00 12 F F ICPRB
2001 PMS52 02/12/01 2 O M ICPRB Good
2001 PMS52 03/05/01 3 O Discarded ANS Counted
2001 PMS52 04/02/01 4 O Discarded ANS Counted junky
2001 PMS52 05/07/01 5 O Discarded ANS Counted
2001 PMS52 06/11/01 6 O M ICPRB Good
2001 PMS52 07/09/01 7 O Discarded ANS Counted
2001 PMS52 08/13/01 8 O Discarded ANS Counted junky
2001 PMS52 09/10/01 9 O Discarded ANS Counted sparse
2001 PMS52 10/15/01 10 O M ICPRB Good
2001 PMS52 11/13/01 11 O M ICPRB
1998 PTB01 04/14/98 4 EE EE ICPRB
1998 PTB01 05/12/98 5 EE EE ICPRB
1998 PTB01 06/09/98 6 EE EE ICPRB
1998 PTB01 07/14/98 7 EE EE ICPRB
1998 PTB01 08/11/98 8 EE EE ICPRB
1998 PTB01 09/21/98 9 EE EE ICPRB
1998 PTB01 10/19/98 10 EE EE ICPRB
1998 PTB01 11/09/98 11 EE EE ICPRB
1998 PTB01 12/08/98 12 EE EE ICPRB
1999 PTB01 01/05/99 1 CC CC ICPRB
1999 PTB01 02/02/99 2 CC CC ICPRB
1999 PTB01 03/19/99 3 CC CC ICPRB
1999 PTB01 04/06/99 4 CC CC ICPRB
1999 PTB01 05/04/99 5 CC CC ICPRB
1999 PTB01 06/15/99 6 CC CC ICPRB Good
1999 PTB01 07/20/99 7 CC CC ICPRB Good
1999 PTB01 08/10/99 8 CC CC ICPRB Good
1999 PTB01 09/21/99 9 CC CC ICPRB
1999 PTB01 10/25/99 10 CC CC ICPRB
1999 PTB01 11/16/99 11 CC CC ICPRB
1999 PTB01 12/14/99 12 CC CC ICPRB Good
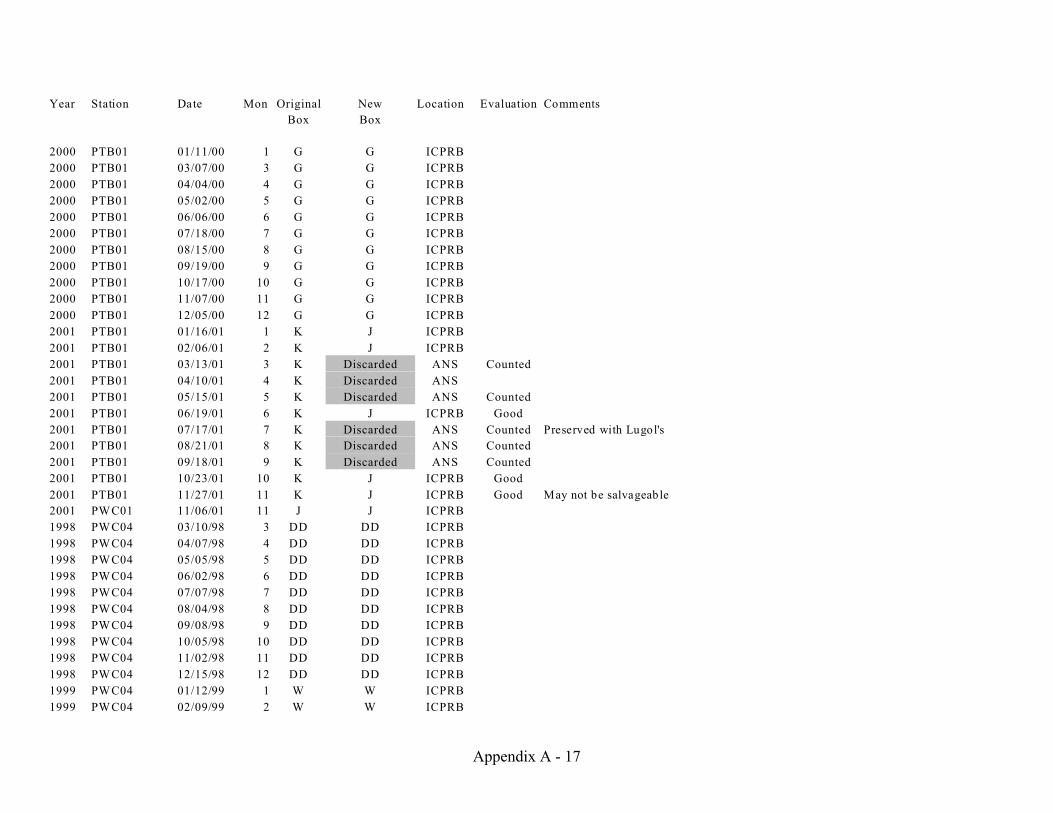
Year Station Date Mon Original
Box
New
Box
Location Evaluation Comments
Appendix A - 17
2000 PTB01 01/11/00 1 G G ICPRB
2000 PTB01 03/07/00 3 G G ICPRB
2000 PTB01 04/04/00 4 G G ICPRB
2000 PTB01 05/02/00 5 G G ICPRB
2000 PTB01 06/06/00 6 G G ICPRB
2000 PTB01 07/18/00 7 G G ICPRB
2000 PTB01 08/15/00 8 G G ICPRB
2000 PTB01 09/19/00 9 G G ICPRB
2000 PTB01 10/17/00 10 G G ICPRB
2000 PTB01 11/07/00 11 G G ICPRB
2000 PTB01 12/05/00 12 G G ICPRB
2001 PTB01 01/16/01 1 K J ICPRB
2001 PTB01 02/06/01 2 K J ICPRB
2001 PTB01 03/13/01 3 K Discarded ANS Counted
2001 PTB01 04/10/01 4 K Discarded ANS
2001 PTB01 05/15/01 5 K Discarded ANS Counted
2001 PTB01 06/19/01 6 K J ICPRB Good
2001 PTB01 07/17/01 7 K Discarded ANS Counted Preserved with Lugol's
2001 PTB01 08/21/01 8 K Discarded ANS Counted
2001 PTB01 09/18/01 9 K Discarded ANS Counted
2001 PTB01 10/23/01 10 K J ICPRB Good
2001 PTB01 11/27/01 11 K J ICPRB Good May not be salvageable
2001 PWC01 11/06/01 11 J J ICPRB
1998 PWC04 03/10/98 3 DD DD ICPRB
1998 PWC04 04/07/98 4 DD DD ICPRB
1998 PWC04 05/05/98 5 DD DD ICPRB
1998 PWC04 06/02/98 6 DD DD ICPRB
1998 PWC04 07/07/98 7 DD DD ICPRB
1998 PWC04 08/04/98 8 DD DD ICPRB
1998 PWC04 09/08/98 9 DD DD ICPRB
1998 PWC04 10/05/98 10 DD DD ICPRB
1998 PWC04 11/02/98 11 DD DD ICPRB
1998 PWC04 12/15/98 12 DD DD ICPRB
1999 PWC04 01/12/99 1 W W ICPRB
1999 PWC04 02/09/99 2 W W ICPRB
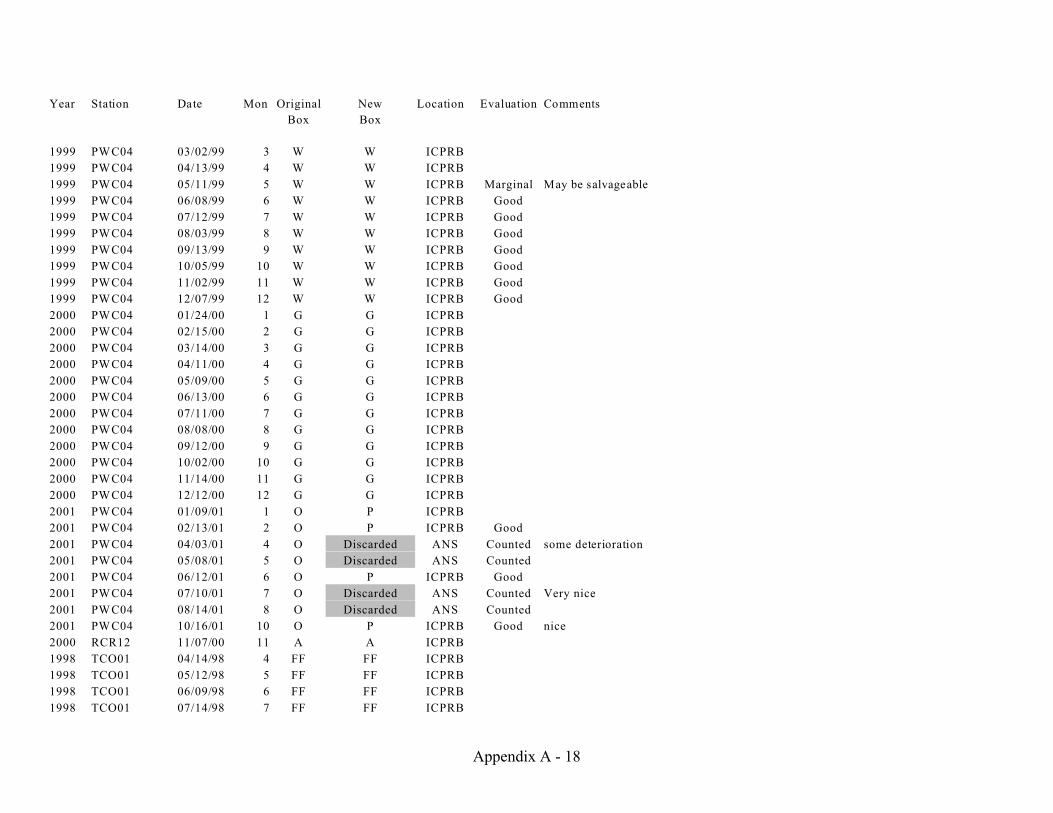
Year Station Date Mon Original
Box
New
Box
Location Evaluation Comments
Appendix A - 18
1999 PWC04 03/02/99 3 W W ICPRB
1999 PWC04 04/13/99 4 W W ICPRB
1999 PWC04 05/11/99 5 W W ICPRB Marginal May be salvageable
1999 PWC04 06/08/99 6 W W ICPRB Good
1999 PWC04 07/12/99 7 W W ICPRB Good
1999 PWC04 08/03/99 8 W W ICPRB Good
1999 PWC04 09/13/99 9 W W ICPRB Good
1999 PWC04 10/05/99 10 W W ICPRB Good
1999 PWC04 11/02/99 11 W W ICPRB Good
1999 PWC04 12/07/99 12 W W ICPRB Good
2000 PWC04 01/24/00 1 G G ICPRB
2000 PWC04 02/15/00 2 G G ICPRB
2000 PWC04 03/14/00 3 G G ICPRB
2000 PWC04 04/11/00 4 G G ICPRB
2000 PWC04 05/09/00 5 G G ICPRB
2000 PWC04 06/13/00 6 G G ICPRB
2000 PWC04 07/11/00 7 G G ICPRB
2000 PWC04 08/08/00 8 G G ICPRB
2000 PWC04 09/12/00 9 G G ICPRB
2000 PWC04 10/02/00 10 G G ICPRB
2000 PWC04 11/14/00 11 G G ICPRB
2000 PWC04 12/12/00 12 G G ICPRB
2001 PWC04 01/09/01 1 O P ICPRB
2001 PWC04 02/13/01 2 O P ICPRB Good
2001 PWC04 04/03/01 4 O Discarded ANS Counted some deterioration
2001 PWC04 05/08/01 5 O Discarded ANS Counted
2001 PWC04 06/12/01 6 O P ICPRB Good
2001 PWC04 07/10/01 7 O Discarded ANS Counted Very nice
2001 PWC04 08/14/01 8 O Discarded ANS Counted
2001 PWC04 10/16/01 10 O P ICPRB Good nice
2000 RCR12 11/07/00 11 A A ICPRB
1998 TCO01 04/14/98 4 FF FF ICPRB
1998 TCO01 05/12/98 5 FF FF ICPRB
1998 TCO01 06/09/98 6 FF FF ICPRB
1998 TCO01 07/14/98 7 FF FF ICPRB

Year Station Date Mon Original
Box
New
Box
Location Evaluation Comments
Appendix A - 19
1998 TCO01 08/11/98 8 FF FF ICPRB
1998 TCO01 10/19/98 10 FF FF ICPRB
1999 TCO01 05/04/99 5 CC CC ICPRB
1999 TCO01 06/15/99 6 CC CC ICPRB Good
1999 TCO01 07/20/99 7 CC CC ICPRB Good
1999 TCO01 08/10/99 8 CC CC ICPRB Good
1999 TCO01 09/21/99 9 CC CC ICPRB
1999 TCO01 10/25/99 10 CC CC ICPRB
1999 TCO01 11/16/99 11 CC CC ICPRB
1999 TCO01 12/14/99 12 CC CC ICPRB Good
2000 TCO01 04/04/00 4 H H ICPRB
2000 TCO01 05/02/00 5 H H ICPRB
2000 TCO01 07/18/00 7 H H ICPRB
2000 TCO01 08/15/00 8 H H ICPRB
2000 TCO01 09/19/00 9 H H ICPRB Marginal
2000 TCO01 11/07/00 11 H H ICPRB
2000 TCO01 12/05/00 12 H H ICPRB
2001 TCO01 01/16/01 1 P P ICPRB
2001 TCO01 02/06/01 2 P P ICPRB
2001 TCO01 04/10/01 4 P Discarded ANS Counted
2001 TCO01 05/15/01 5 P Discarded ANS Counted
2001 TCO01 06/19/01 6 P P ICPRB
2001 TCO01 07/17/01 7 P Discarded ANS Counted
2001 TCO01 08/21/01 8 P Discarded ANS Counted
2001 TCO01 10/23/01 10 P P ICPRB
2001 TCO01 11/27/01 11 P P ICPRB
1998 TCO06 04/14/98 4 FF FF ICPRB
1998 TCO06 05/12/98 5 FF FF ICPRB
1998 TCO06 06/09/98 6 FF FF ICPRB
1998 TCO06 07/14/98 7 FF FF ICPRB
1998 TCO06 08/11/98 8 FF FF ICPRB
1998 TCO06 10/19/98 10 FF FF ICPRB
1999 TCO06 06/15/99 6 BB BB ICPRB
1999 TCO06 07/20/99 7 BB BB ICPRB
1999 TCO06 08/04/99 8 BB BB ICPRB

Year Station Date Mon Original
Box
New
Box
Location Evaluation Comments
Appendix A - 20
1999 TCO06 08/10/99 8 BB BB ICPRB
1999 TCO06 09/21/99 9 BB BB ICPRB Marginal Depauperate
1999 TCO06 10/25/99 10 BB BB ICPRB Marginal Depauperate
1999 TCO06 11/16/99 11 BB BB ICPRB
1999 TCO06 12/14/99 12 BB BB ICPRB Good
2000 TCO06 04/04/00 4 H H ICPRB
2000 TCO06 05/02/00 5 H H ICPRB
2000 TCO06 06/06/00 6 H H ICPRB
2000 TCO06 07/18/00 7 H H ICPRB
2000 TCO06 09/19/00 9 H H ICPRB
2000 TCO06 11/07/00 11 H H ICPRB
2000 TCO06 12/05/00 12 H H ICPRB
2001 TCO06 02/06/01 2 P P ICPRB
2001 TCO06 04/10/01 4 P Discarded ANS Counted
2001 TCO06 05/15/01 5 P Discarded ANS Counted
2001 TCO06 06/19/01 6 P P ICPRB
2001 TCO06 07/17/01 7 P Discarded ANS Counted
2001 TCO06 08/21/01 8 P Discarded ANS Counted
2001 TCO06 10/23/01 10 P P ICPRB
2001 TCO06 11/27/01 11 P P ICPRB
2000 TCO06(2) 06/06/00 6 H H ICPRB

Appendix B - 1
Appendix B
Zooplankton Sample Chain of Custody
May 31, 2005
Key: MI = microzooplanktonMZ = mesozooplankton
All remaining, uncounted samples are at the Interstate Commission on the Potomac RiverBasin.
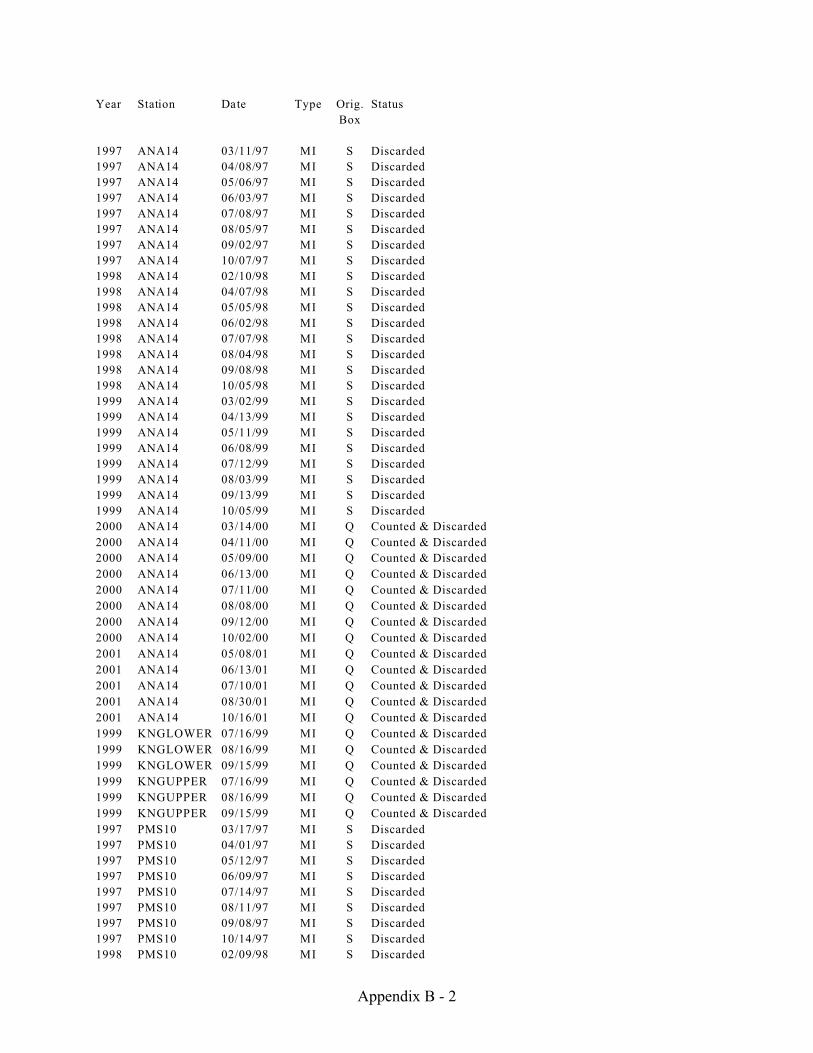
Year Station Date Type Orig.
Box
Status
Appendix B - 2
1997 ANA14 03/11/97 MI S Discarded
1997 ANA14 04/08/97 MI S Discarded
1997 ANA14 05/06/97 MI S Discarded
1997 ANA14 06/03/97 MI S Discarded
1997 ANA14 07/08/97 MI S Discarded
1997 ANA14 08/05/97 MI S Discarded
1997 ANA14 09/02/97 MI S Discarded
1997 ANA14 10/07/97 MI S Discarded
1998 ANA14 02/10/98 MI S Discarded
1998 ANA14 04/07/98 MI S Discarded
1998 ANA14 05/05/98 MI S Discarded
1998 ANA14 06/02/98 MI S Discarded
1998 ANA14 07/07/98 MI S Discarded
1998 ANA14 08/04/98 MI S Discarded
1998 ANA14 09/08/98 MI S Discarded
1998 ANA14 10/05/98 MI S Discarded
1999 ANA14 03/02/99 MI S Discarded
1999 ANA14 04/13/99 MI S Discarded
1999 ANA14 05/11/99 MI S Discarded
1999 ANA14 06/08/99 MI S Discarded
1999 ANA14 07/12/99 MI S Discarded
1999 ANA14 08/03/99 MI S Discarded
1999 ANA14 09/13/99 MI S Discarded
1999 ANA14 10/05/99 MI S Discarded
2000 ANA14 03/14/00 MI Q Counted & Discarded
2000 ANA14 04/11/00 MI Q Counted & Discarded
2000 ANA14 05/09/00 MI Q Counted & Discarded
2000 ANA14 06/13/00 MI Q Counted & Discarded
2000 ANA14 07/11/00 MI Q Counted & Discarded
2000 ANA14 08/08/00 MI Q Counted & Discarded
2000 ANA14 09/12/00 MI Q Counted & Discarded
2000 ANA14 10/02/00 MI Q Counted & Discarded
2001 ANA14 05/08/01 MI Q Counted & Discarded
2001 ANA14 06/13/01 MI Q Counted & Discarded
2001 ANA14 07/10/01 MI Q Counted & Discarded
2001 ANA14 08/30/01 MI Q Counted & Discarded
2001 ANA14 10/16/01 MI Q Counted & Discarded
1999 KNGLOWER 07/16/99 MI Q Counted & Discarded
1999 KNGLOWER 08/16/99 MI Q Counted & Discarded
1999 KNGLOWER 09/15/99 MI Q Counted & Discarded
1999 KNGUPPER 07/16/99 MI Q Counted & Discarded
1999 KNGUPPER 08/16/99 MI Q Counted & Discarded
1999 KNGUPPER 09/15/99 MI Q Counted & Discarded
1997 PMS10 03/17/97 MI S Discarded
1997 PMS10 04/01/97 MI S Discarded
1997 PMS10 05/12/97 MI S Discarded
1997 PMS10 06/09/97 MI S Discarded
1997 PMS10 07/14/97 MI S Discarded
1997 PMS10 08/11/97 MI S Discarded
1997 PMS10 09/08/97 MI S Discarded
1997 PMS10 10/14/97 MI S Discarded
1998 PMS10 02/09/98 MI S Discarded

Year Station Date Type Orig.
Box
Status
Appendix B - 3
1998 PMS10 03/09/98 MI S Discarded
1998 PMS10 04/06/98 MI S Discarded
1998 PMS10 06/15/98 MI S Discarded
1998 PMS10 07/06/98 MI S Discarded
1998 PMS10 08/17/98 MI S Discarded
1998 PMS10 09/14/98 MI S Discarded
1998 PMS10 10/27/98 MI S Discarded
1999 PMS10 03/01/99 MI S Discarded
1999 PMS10 04/12/99 MI S Discarded
1999 PMS10 05/10/99 MI S Discarded
1999 PMS10 06/07/99 MI S Discarded
1999 PMS10 07/06/99 MI S Discarded
1999 PMS10 08/02/99 MI S Discarded
1999 PMS10 09/07/99 MI S Discarded
1996 PMS10 10/22/99 MI S Discarded
2000 PMS10 03/13/00 MI Q Counted & Discarded
2000 PMS10 04/10/00 MI Q Counted & Discarded
2000 PMS10 05/08/00 MI Q Counted & Discarded
2000 PMS10 06/12/00 MI Q Counted & Discarded
2000 PMS10 07/10/00 MI Q Counted & Discarded
2000 PMS10 08/07/00 MI Q Counted & Discarded
2000 PMS10 09/11/00 MI Q Counted & Discarded
2000 PMS10 10/10/00 MI Q Counted & Discarded
2001 PMS10 05/07/01 MI Q Counted & Discarded
2001 PMS10 06/11/01 MI Q Counted & Discarded
2001 PMS10 07/09/01 MI Q Counted & Discarded
2001 PMS10 08/30/01 MI Q Counted & Discarded
2001 PMS10 09/10/01 MI Q Counted & Discarded
2001 PMS10 10/15/01 MI Q Counted & Discarded
1996 PMS37 08/19/96 MI S Discarded
1997 PMS37 04/01/97 MI S Discarded
1997 PMS37 05/12/97 MI S Discarded
1997 PMS37 06/09/97 MI S Discarded
1997 PMS37 07/14/97 MI S Discarded
1997 PMS37 08/11/97 MI S Discarded
1997 PMS37 09/08/97 MI S Discarded
1997 PMS37 10/14/97 MI S Discarded
1998 PMS37 02/09/98 MI S Discarded
1998 PMS37 03/09/98 MI S Discarded
1998 PMS37 04/06/98 MI S Discarded
1998 PMS37 05/18/98 MI S Discarded
1998 PMS37 06/15/98 MI S Discarded
1998 PMS37 07/06/98 MI S Discarded
1998 PMS37 08/17/98 MI S Discarded
1998 PMS37 09/14/98 MI S Discarded
1998 PMS37 10/27/98 MI S Discarded
1999 PMS37 03/01/99 MI S Discarded
1999 PMS37 05/10/99 MI S Discarded
1999 PMS37 06/07/99 MI S Discarded
1999 PMS37 07/06/99 MI S Discarded
1999 PMS37 08/02/99 MI S Discarded
1999 PMS37 09/07/99 MI S Discarded

Year Station Date Type Orig.
Box
Status
Appendix B - 4
1999 PMS37 10/22/99 MI S Discarded
2000 PMS37 03/13/00 MI Q Counted & Discarded
2000 PMS37 04/10/00 MI Q Discarded
2000 PMS37 05/08/00 MI Q Counted & Discarded
2000 PMS37 06/12/00 MI Q Counted & Discarded
2000 PMS37 07/10/00 MI Q Counted & Discarded
2000 PMS37 08/07/00 MI Q Counted & Discarded
2000 PMS37 09/11/00 MI Q Counted & Discarded
2000 PMS37 10/10/00 MI Q Counted & Discarded
2001 PMS37 05/07/01 MI Q Counted & Discarded
2001 PMS37 07/09/01 MI Q Counted & Discarded
2001 PMS37 08/30/01 MI Q Counted & Discarded
2001 PMS37 09/10/01 MI Q Counted & Discarded
2001 PMS37 10/15/01 MI Q Counted & Discarded
1997 PMS37(2) 04/01/97 MI S Discarded
1997 ANA14 03/11/97 MZ T
1997 ANA14 04/08/97 MZ T
1997 ANA14 05/06/97 MZ T
1997 ANA14 06/03/97 MZ T
1997 ANA14 07/08/97 MZ T
1997 ANA14 08/05/97 MZ T
1997 ANA14 09/02/97 MZ T
1997 ANA14 10/07/97 MZ T
1998 ANA14 02/10/98 MZ T
1998 ANA14 04/07/98 MZ T
1998 ANA14 05/05/98 MZ T
1998 ANA14 06/02/98 MZ T
1998 ANA14 07/07/98 MZ T
1998 ANA14 08/04/98 MZ T
1998 ANA14 09/08/98 MZ T
1998 ANA14 10/05/98 MZ T
1999 ANA14 03/02/99 MZ T
1999 ANA14 04/13/99 MZ T
1999 ANA14 05/11/99 MZ T
1999 ANA14 06/08/99 MZ T
1999 ANA14 07/12/99 MZ T
1999 ANA14 08/03/99 MZ T
1999 ANA14 09/13/99 MZ T
1999 ANA14 10/08/99 MZ T
2000 ANA14 03/14/00 MZ R Counted & Discarded
2000 ANA14 04/11/00 MZ R Counted & Discarded
2000 ANA14 05/09/00 MZ R Counted & Discarded
2000 ANA14 06/13/00 MZ R Counted & Discarded
2000 ANA14 07/11/00 MZ R Counted & Discarded
2000 ANA14 08/08/00 MZ R Counted & Discarded
2000 ANA14 09/12/00 MZ R Counted & Discarded
2000 ANA14 10/02/00 MZ R Counted & Discarded
2001 ANA14 05/08/01 MZ R Counted & Discarded
2001 ANA14 06/13/01 MZ R Counted & Discarded
2001 ANA14 07/10/01 MZ R Counted & Discarded
2001 ANA14 08/30/01 MZ R Counted & Discarded

Year Station Date Type Orig.
Box
Status
Appendix B - 5
2001 ANA14 10/16/01 MZ R Counted & Discarded
1999 KNGLOWER 07/16/99 MZ R
1999 KNGLOWER 08/16/99 MZ R
1999 KNGLOWER 09/15/99 MZ R Counted & Discarded
1999 KNGUPPER 07/16/99 MZ R Counted & Discarded
1999 KNGUPPER 08/16/99 MZ R Counted & Discarded
1999 KNGUPPER 09/15/99 MZ R Counted & Discarded
1997 PMS10 03/17/97 MZ T
1997 PMS10 04/01/97 MZ T
1997 PMS10 05/12/97 MZ T
1997 PMS10 06/09/97 MZ T
1997 PMS10 07/14/97 MZ T
1997 PMS10 08/11/97 MZ T
1997 PMS10 09/08/97 MZ T
1997 PMS10 10/14/97 MZ T
1998 PMS10 02/09/98 MZ T
1998 PMS10 03/09/98 MZ T
1998 PMS10 04/06/98 MZ T
1998 PMS10 06/15/98 MZ T
1998 PMS10 07/06/98 MZ T
1998 PMS10 08/17/98 MZ T
1998 PMS10 09/14/98 MZ T
1998 PMS10 10/27/98 MZ T
1999 PMS10 03/01/99 MZ T
1999 PMS10 04/12/99 MZ T
1999 PMS10 05/10/99 MZ T
1999 PMS10 06/07/99 MZ T
1999 PMS10 07/06/99 MZ T
1999 PMS10 08/02/99 MZ T
1999 PMS10 09/07/99 MZ T
1999 PMS10 10/22/99 MZ T
2000 PMS10 03/13/00 MZ R Counted & Discarded
2000 PMS10 04/10/00 MZ R Counted & Discarded
2000 PMS10 05/08/00 MZ R Counted & Discarded
2000 PMS10 06/12/00 MZ R Counted & Discarded
2000 PMS10 07/10/00 MZ R Counted & Discarded
2000 PMS10 08/07/00 MZ R Counted & Discarded
2000 PMS10 09/11/00 MZ R Counted & Discarded
2000 PMS10 10/10/00 MZ R Counted & Discarded
2001 PMS10 05/07/01 MZ R Counted & Discarded
2001 PMS10 06/11/01 MZ R Counted & Discarded
2001 PMS10 07/09/01 MZ R Counted & Discarded
2001 PMS10 08/30/01 MZ R Counted & Discarded
2001 PMS10 09/10/01 MZ R Counted & Discarded
2001 PMS10 10/15/01 MZ R Counted & Discarded
1997 PMS37 03/17/97 MZ T
1997 PMS37 05/12/97 MZ T
1997 PMS37 06/09/97 MZ T
1997 PMS37 07/14/97 MZ T
1997 PMS37 08/11/97 MZ T
1997 PMS37 09/08/97 MZ T

Year Station Date Type Orig.
Box
Status
Appendix B - 6
1997 PMS37 10/14/97 MZ T
1998 PMS37 02/09/98 MZ T
1998 PMS37 03/09/98 MZ T
1998 PMS37 04/06/98 MZ T
1998 PMS37 05/18/98 MZ T
1998 PMS37 06/15/98 MZ T
1998 PMS37 07/06/98 MZ T
1998 PMS37 08/17/98 MZ T
1998 PMS37 09/14/98 MZ T
1998 PMS37 10/27/98 MZ T
1999 PMS37 03/01/99 MZ T
1999 PMS37 05/10/99 MZ T
1999 PMS37 06/07/99 MZ T
1999 PMS37 07/06/99 MZ T
1999 PMS37 08/02/99 MZ T
1999 PMS37 09/07/99 MZ T
1997 PMS37 10/22/99 MZ T
2000 PMS37 03/13/00 MZ R Counted & Discarded
2000 PMS37 04/10/00 MZ R Counted & Discarded
2000 PMS37 05/08/00 MZ R Counted & Discarded
2000 PMS37 06/12/00 MZ R Counted & Discarded
2000 PMS37 07/10/00 MZ R Counted & Discarded
2000 PMS37 08/07/00 MZ R Counted & Discarded
2000 PMS37 09/11/00 MZ R Counted & Discarded
2000 PMS37 10/10/00 MZ R Counted & Discarded
2001 PMS37 05/07/01 MZ R Counted & Discarded
2001 PMS37 07/09/01 MZ R Counted & Discarded
2001 PMS37 08/30/01 MZ R Counted & Discarded
2001 PMS37 09/10/01 MZ R Counted & Discarded
2001 PMS37 10/15/01 MZ R Counted & Discarded

Appendix C - 1
Appendix C
Spring and Summer Phytoplankton Indexes of Biotic IntegrityStation Summaries
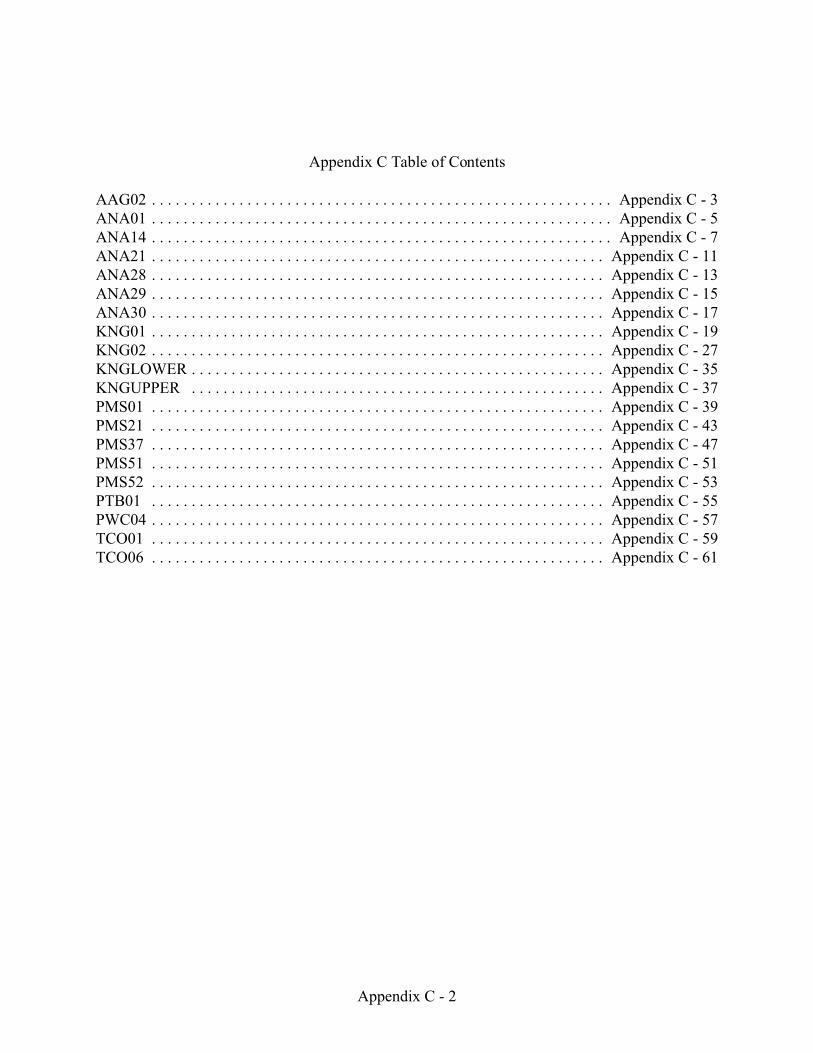
Appendix C - 2
Appendix C Table of Contents
AAG02 . . . . . . . . . . . . . . . . . . . . . . . . . . . . . . . . . . . . . . . . . . . . . . . . . . . . . . . . . . Appendix C - 3ANA01 . . . . . . . . . . . . . . . . . . . . . . . . . . . . . . . . . . . . . . . . . . . . . . . . . . . . . . . . . . Appendix C - 5ANA14 . . . . . . . . . . . . . . . . . . . . . . . . . . . . . . . . . . . . . . . . . . . . . . . . . . . . . . . . . . Appendix C - 7ANA21 . . . . . . . . . . . . . . . . . . . . . . . . . . . . . . . . . . . . . . . . . . . . . . . . . . . . . . . . . Appendix C - 11ANA28 . . . . . . . . . . . . . . . . . . . . . . . . . . . . . . . . . . . . . . . . . . . . . . . . . . . . . . . . . Appendix C - 13ANA29 . . . . . . . . . . . . . . . . . . . . . . . . . . . . . . . . . . . . . . . . . . . . . . . . . . . . . . . . . Appendix C - 15ANA30 . . . . . . . . . . . . . . . . . . . . . . . . . . . . . . . . . . . . . . . . . . . . . . . . . . . . . . . . . Appendix C - 17KNG01 . . . . . . . . . . . . . . . . . . . . . . . . . . . . . . . . . . . . . . . . . . . . . . . . . . . . . . . . . Appendix C - 19KNG02 . . . . . . . . . . . . . . . . . . . . . . . . . . . . . . . . . . . . . . . . . . . . . . . . . . . . . . . . . Appendix C - 27KNGLOWER . . . . . . . . . . . . . . . . . . . . . . . . . . . . . . . . . . . . . . . . . . . . . . . . . . . . Appendix C - 35KNGUPPER . . . . . . . . . . . . . . . . . . . . . . . . . . . . . . . . . . . . . . . . . . . . . . . . . . . . Appendix C - 37PMS01 . . . . . . . . . . . . . . . . . . . . . . . . . . . . . . . . . . . . . . . . . . . . . . . . . . . . . . . . . Appendix C - 39PMS21 . . . . . . . . . . . . . . . . . . . . . . . . . . . . . . . . . . . . . . . . . . . . . . . . . . . . . . . . . Appendix C - 43PMS37 . . . . . . . . . . . . . . . . . . . . . . . . . . . . . . . . . . . . . . . . . . . . . . . . . . . . . . . . . Appendix C - 47PMS51 . . . . . . . . . . . . . . . . . . . . . . . . . . . . . . . . . . . . . . . . . . . . . . . . . . . . . . . . . Appendix C - 51PMS52 . . . . . . . . . . . . . . . . . . . . . . . . . . . . . . . . . . . . . . . . . . . . . . . . . . . . . . . . . Appendix C - 53PTB01 . . . . . . . . . . . . . . . . . . . . . . . . . . . . . . . . . . . . . . . . . . . . . . . . . . . . . . . . . Appendix C - 55PWC04 . . . . . . . . . . . . . . . . . . . . . . . . . . . . . . . . . . . . . . . . . . . . . . . . . . . . . . . . . Appendix C - 57TCO01 . . . . . . . . . . . . . . . . . . . . . . . . . . . . . . . . . . . . . . . . . . . . . . . . . . . . . . . . . Appendix C - 59TCO06 . . . . . . . . . . . . . . . . . . . . . . . . . . . . . . . . . . . . . . . . . . . . . . . . . . . . . . . . . Appendix C - 61

Appendix C - 3
STATION AAG02
Location: A high marsh station location within Mass Fill I approximately 5 meters beyond the canoelaunch area at the end of the dredged tidal gut (Anacostia River).Latitude: 38.914; Longitude: -76.9422
Summary: Five (5) data records are available for Spring and Summer 1998. The three (3) summerrecords have sufficient data to calculate the phytoplankton IBIs. The indicators chlorophyll a,pheophytin, C:Chl a ratio, and dissolved organic carbon were not available to score. On average, thesummer 1998 phytoplankton community was in Poor condition, indicated by excessive levels ofchlorophytes, diatoms, and/or bluegreens. The nuisance bluegreen species, Microcystis aeruginosa, wasnot evident in July and August, and present in low levels in September.
Sample Status: Counted and discarded.
Sample Dates:
4/14/1998 SpringIBI_Method Evaluation IBI ScoreMethod A Too Few Data ND
Method B Too Few Data ND
Available Metrics Metric Values Metric Scores Cyanophyte Biomass 9 ug C liter-1 null
Diatom Abundance 0.56 million cells liter-1 1
Total Abundance 3.03 million cells liter-1 null
Total Biomass 167 ug C liter-1 1
5/11/1998 Spring
IBI_Method Evaluation IBI ScoreMethod A Too Few Data ND
Method B Too Few Data ND
Available Metrics Metric Values Metric Scores Cyanophyte Biomass 59 ug C liter-1 1
Diatom Abundance 0.71 million cells liter-1 1
Total Abundance 12.61 million cells liter-1 null
Total Biomass 261 ug C liter-1 5
7/14/1998 SummerIBI_Method Evaluation IBI ScoreMethod A Fair-Poor IBI Score = 2.3
Method B Poor IBI Score = 1.7
Available Metrics Metric Values Metric Scores Chlorophyte Abundance 22.73 million cells liter-1 1
Cyanophyte Biomass 9 ug C liter-1 5
Diatom Abundance 8.22 million cells liter-1 1
Diatom Biomass 406 ug C liter-1 1
Microcystis aeruginosa 0 million cells liter-1 null
Total Abundance 36.36 million cells liter-1 1
Total Biomass 2,080 ug C liter-1 1
8/11/1998
Summer
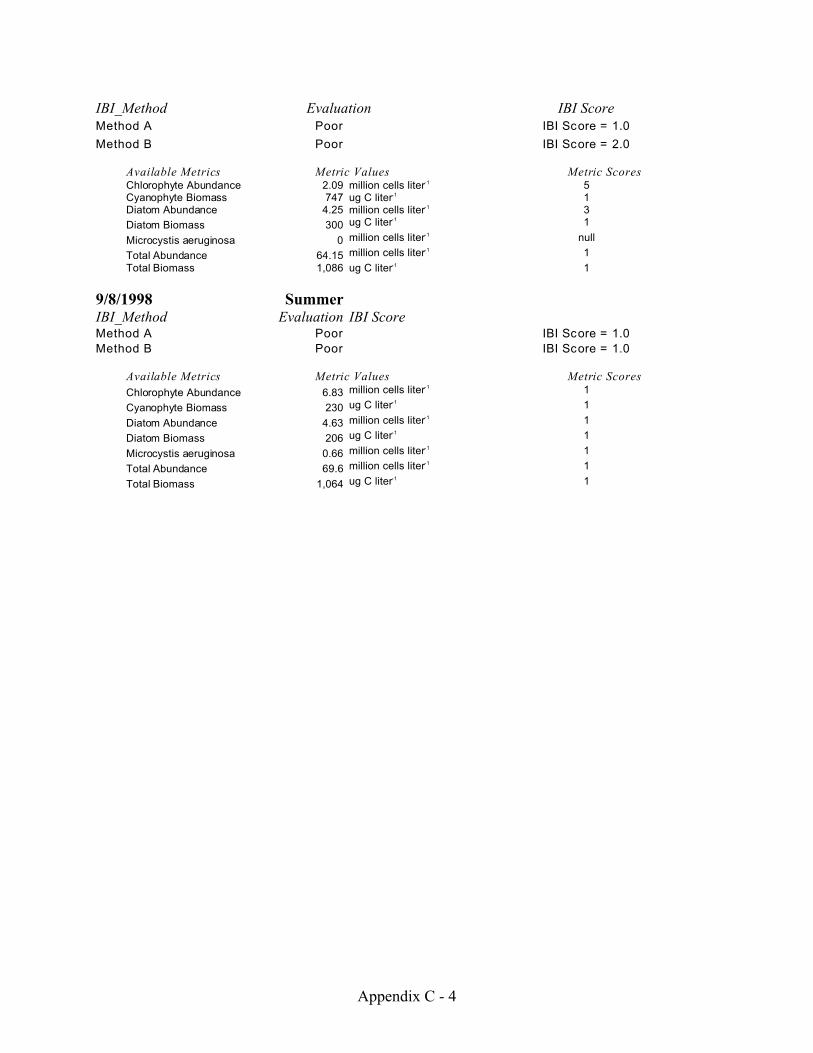
Appendix C - 4
IBI_Method Evaluation IBI ScoreMethod A Poor IBI Score = 1.0
Method B Poor IBI Score = 2.0
Available Metrics Metric Values Metric Scores Chlorophyte Abundance 2.09 million cells liter-1 5 Cyanophyte Biomass 747 ug C liter-1 1 Diatom Abundance 4.25 million cells liter-1 3
Diatom Biomass 300 ug C liter-1 1
Microcystis aeruginosa 0 million cells liter-1 null
Total Abundance 64.15 million cells liter-1 1
Total Biomass 1,086 ug C liter-1 1
9/8/1998 SummerIBI_Method Evaluation IBI ScoreMethod A Poor IBI Score = 1.0
Method B Poor IBI Score = 1.0
Available Metrics Metric Values Metric Scores
Chlorophyte Abundance 6.83 million cells liter-1 1
Cyanophyte Biomass 230 ug C liter-1 1
Diatom Abundance 4.63 million cells liter-1 1
Diatom Biomass 206 ug C liter-1 1
Microcystis aeruginosa 0.66 million cells liter-1 1
Total Abundance 69.6 million cells liter-1 1
Total Biomass 1,064 ug C liter-1 1

Appendix C - 5
STATION ANA01
Location: Head of the Anacostia River, 50 m upstream of the westbound New York Avenue Bridge.Latitude: 38.918167; Longitude:-76.94164
2001 Summary: Two (2) Spring and two (2) Summer records from 2001 were available to calculatephytoplankton IBIs for this station. Status of the phytoplankton community was highly variable in 2001,ranging from Poor (May) to Good (August). Total biomass of the community was dominated by thediatom taxa as a group in April, the green and diatom taxonomic groups in May, the dinoflagellate groupin July, and the green group in August. A very low C:Chl ratio, high pheophytin, and contrasting statusesfor chlorophyll a and total biomass in May suggest the spring phytoplankton community wasstressed/inhibited by poor light caused by high turbidity. (Spring TSS concentrations averaged 20.3 mgliter-1 and Secchi depth averaged 0.45 m). Bluegreens (Oscillatoria, Agmenellum), diatoms (unid.pennate, unid. centric, Fragilaria), and a green (Ankistrodesmus) were the numerically-dominant taxa. The summer phytoplankton community status was Fair-Good on 7/10 and Good on 8/14, as indicated byhigh scores for chlorophyll a, pheophytin, and many taxa indicators. Cyanophyte (bluegreen) biomasswas high on 7/10, but the nuisance bluegreen species, Microcystis aeruginosa, was not evident any timeduring the summer. Summer 2001 may not have been Good overall, however. On 4 of the 5 othersummer sampling dates (6/12 7/23, 8/27, 9/24), chlorophyll a levels were excessive and scored “1," andpheophytin levels scored “3" or “1.”
Status of Samples: Counted and discarded.
Sample Dates:4/3/2001 Spring
IBI_Method Evaluation IBI Score
Method A Fair-Poor IBI Score = 2.5
Method B Fair IBI Score = 3.0
Available Metrics Metric Values Metric ScoreCarbon:Chlorophyll a Ratio 51.6 ratio 5
Surface Chlorophyll a 1.9 ug liter-1 1
Cyanophyte Biomass 23 ug C liter-1 Null
Pheophytin 1.7 ug liter-1 3
Total Biomass 98 ug C liter-1 1
Diatom Abundance 2.27 million cells liter-1 5
Total Abundance 6.27 million cells liter-1 Null
5/8/2001 Spring
IBI_Method Evaluation IBI ScoreMethod A Poor IBI Score = 2.0
Method B Poor IBI Score = 1.8
Available Metrics Metric Values Metric ScoreCarbon:Chlorophyll a Ratio 12.3 ratio 1
Surface Chlorophyll a 31.4 ug liter-1 1
Cyanophyte Biomass 4 ug C liter Null
Pheophytin 5.9 ug liter 1
Total Biomass 385 ug C liter-1 5
Diatom Abundance 10.13 million cells liter-1 1

Appendix C - 6
Total Abundance 16.31 million cells liter-1 Null
7/10/2001 Summer
IBI_Method Evaluation IBI ScoreMethod A Fair-Good IBI Score = 3.8
Method B Good IBI Score = 4.1
Available Metrics Metric Values Metric ScoreSurface Chlorophyll a 6.5 ug liter-1 5
Cyanophyte Biomass 77 ug C liter-1 1
Diatom Biomass 35 ug C liter-1 5
Pheophytin 3.1 ug liter-1 3
Total Biomass 335 ug C liter-1 5
Microcystis aeruginosa 0 million cells liter-1 Null
Chlorophyte Abundance 1.99 million cells liter-1 5
Total Abundance 17.52 million cells liter-1 5
8/14/2001 Summer
IBI_Method Evaluation IBI ScoreMethod A Good IBI Score = 4.5
Method B Good IBI Score = 4.3
Available Metrics Metric Values Metric ScoreSurface Chlorophyll a 5.6 ug liter-1 5
Cyanophyte Biomass 20 ug C liter-1 5
Diatom Biomass 31 ug C liter-1 5
Total Biomass 174 ug C liter-1 3
Microcystis aeruginosa 0 million cells liter-1 Null
Chlorophyte Abundance 0.21 million cells liter-1 5
Total Abundance 7.28 million cells liter-1 3

Appendix C - 7
STATION ANA14
Location: Anacostia River at Pennsylvania Avenue; Marina South DockLatitude: 38.877335; Longitude: -76.97553
2001 Summary: Three (3) Spring and three (3) Summer records from 2001 were available to calculatethe IBIs. Status of the phytoplankton community was highly variable in 2001, ranging from Poor(March, May) to Good (August). Total biomass of the community was dominated by the diatom andbluegreen taxonomic groups in March, the diatom group in April, May, and July, and the green group inAugust. The phytoplankton community was depauperate in March and then dominated by a large diatombloom (small unid. centric) in May. The C:Chl ratios and pheophytin levels indicate some light stresscaused by turbidity. (Spring TSS concentrations averaged 22.8 mg liter-1 and Secchi depth averaged 0.38m). Moderate-to-low levels of chlorophyll a, cyanophyte (bluegreen), diatoms, and chlorophytes(greens) resulted in a Fair-Good status in June and a Good status in August. However, status in July wasFair-Poor due to a diverse bloom of centric diatoms. Scores for chlorophyll a and pheophytin on 3 of 4other summer sampling dates (7/23, 8/27, 9/24) were “1" and “3,” suggesting the overall summercondition of the phytoplankton community was Fair-Poor. Bluegreens were sometimes common, but thenuisance bluegreen species, Microcystis aeruginosa, was not evident.
Status of Samples: Counted and discarded.
Sample Dates:3/6/2001 Spring
IBI_Method Evaluation IBI ScoreMethod A Poor IBI Score = 1.4
Method B Poor IBI Score = 2.0
Available Metrics Metric Values Metric ScoreCarbon:Chlorophyll a Ratio 37.3 ratio 1
Surface Chlorophyll a 2.1 ug liter-1 1
Cyanophyte Biomass 28 ug C liter-1 1
Pheophytin 2.1 ug liter-1 3
Total Biomass 78 ug C liter-1 1
Diatom Abundance 2.88 million cells liter-1 5
Total Abundance 7.95 million cells liter-1 Null
4/3/2001 Spring
IBI_Method Evaluation IBI ScoreMethod A Fair-Poor IBI Score = 2.2
Method B Fair IBI Score = 2.7
Available Metrics Metric Values Metric ScoreCarbon:Chlorophyll a Ratio 45.0 ratio 5
Surface Chlorophyll a 3.6 ug liter-1 3
Cyanophyte Biomass 41 ug C liter-1 1
Pheophytin 3.8 ug liter-1 1
Total Biomass 162 ug C liter-1 1
Diatom Abundance 2.97 million cells liter-1 5
Total Abundance 10.36 million cells liter-1 Null
5/8/2001 Spring

Appendix C - 8
IBI_Method Evaluation IBI ScoreMethod A Poor IBI Score = 2.0
Method B Poor IBI Score = 1.7
Available Metrics Metric Values Metric ScoreCarbon:Chlorophyll a Ratio 13.0 ratio 1
Surface Chlorophyll a 30.4 ug liter-1 1
Cyanophyte Biomass 7 ug C liter-1 Null
Pheophytin 3.4 ug liter-1 1
Total Biomass 394 ug C liter-1 5
Diatom Abundance 26.99 million cells liter-1 1
Total Abundance 33.31 million cells liter-1 1
6/12/2001 Summer
IBI_Method Evaluation IBI ScoreMethod A Fair-Good IBI Score = 3.4
Method B Fair-Good IBI Score = 3.9
Available Metrics Metric Values Metric ScoreSurface Chlorophyll a 5.3 ug liter-1 3
Cyanophyte Biomass 36 ug C liter-1 5
Diatom Biomass 47 ug C liter-1 5
Pheophytin 6.6 ug liter-1 1
Total Biomass 152 ug C liter-1 3
Microcystis aeruginosa 0 million cells liter-1 Null
Chlorophyte Abundance 2 million cells liter-1 5
Total Abundance 3.94 million cells liter-1 5
7/10/2001 Summer
IBI_Method Evaluation IBI ScoreMethod A Fair-Poor IBI Score = 2.2
Method B Fair IBI Score = 3.0
Available Metrics Metric Values Metric ScoreSurface Chlorophyll a 16.1 ug liter-1 1
Cyanophyte Biomass 64 ug C liter-1 3
Diatom Biomass 235 ug C liter-1 1
Pheophytin 5.3 ug liter-1 1
Total Biomass 474 ug C liter-1 5
Microcystis aeruginosa 0 million cells liter-1 Null
Chlorophyte Abundance 2 million cells liter-1 5
Total Abundance 16.26 million cells liter-1 5
8/14/2001 Summer
IBI_Method Evaluation IBI ScoreMethod A Good IBI Score = 4.6
Method B Good IBI Score = 4.4
Available Metrics Metric Values Metric ScoreSurface Chlorophyll a 9.4 ug liter-1 5
Cyanophyte Biomass 22 ug C liter-1 5
Diatom Biomass 36 ug C liter-1 5

Appendix C - 9
Pheophytin 2.4 ug liter-1 3
Total Biomass 283 ug C liter-1 5
Microcystis aeruginosa 0 million cells liter-1 Null
Chlorophyte Abundance 3.50 million cells liter-1 3
Total Abundance 12.00 million cells liter-1 5

Appendix C - 10
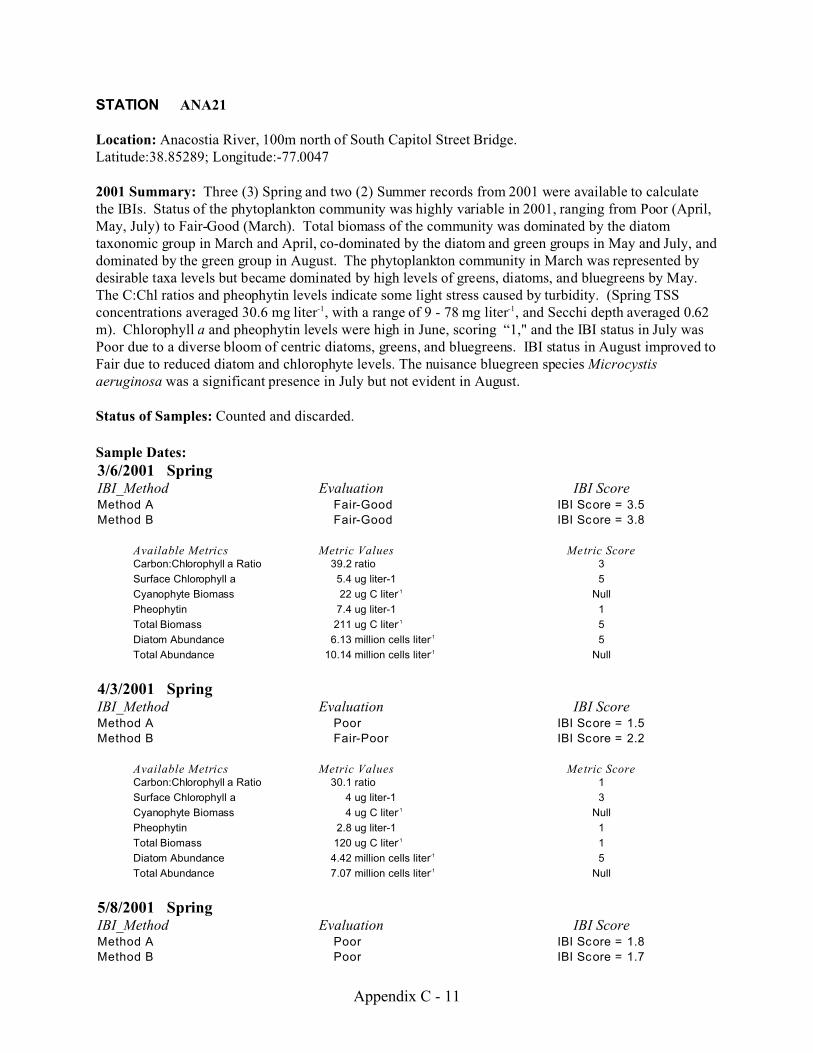
Appendix C - 11
STATION ANA21
Location: Anacostia River, 100m north of South Capitol Street Bridge.Latitude:38.85289; Longitude:-77.0047
2001 Summary: Three (3) Spring and two (2) Summer records from 2001 were available to calculatethe IBIs. Status of the phytoplankton community was highly variable in 2001, ranging from Poor (April,May, July) to Fair-Good (March). Total biomass of the community was dominated by the diatomtaxonomic group in March and April, co-dominated by the diatom and green groups in May and July, anddominated by the green group in August. The phytoplankton community in March was represented bydesirable taxa levels but became dominated by high levels of greens, diatoms, and bluegreens by May.The C:Chl ratios and pheophytin levels indicate some light stress caused by turbidity. (Spring TSSconcentrations averaged 30.6 mg liter-1, with a range of 9 - 78 mg liter-1, and Secchi depth averaged 0.62m). Chlorophyll a and pheophytin levels were high in June, scoring “1," and the IBI status in July wasPoor due to a diverse bloom of centric diatoms, greens, and bluegreens. IBI status in August improved toFair due to reduced diatom and chlorophyte levels. The nuisance bluegreen species Microcystisaeruginosa was a significant presence in July but not evident in August.
Status of Samples: Counted and discarded.
Sample Dates:
3/6/2001 SpringIBI_Method Evaluation IBI ScoreMethod A Fair-Good IBI Score = 3.5
Method B Fair-Good IBI Score = 3.8
Available Metrics Metric Values Metric ScoreCarbon:Chlorophyll a Ratio 39.2 ratio 3
Surface Chlorophyll a 5.4 ug liter-1 5
Cyanophyte Biomass 22 ug C liter-1 Null
Pheophytin 7.4 ug liter-1 1
Total Biomass 211 ug C liter-1 5
Diatom Abundance 6.13 million cells liter-1 5
Total Abundance 10.14 million cells liter-1 Null
4/3/2001 SpringIBI_Method Evaluation IBI ScoreMethod A Poor IBI Score = 1.5
Method B Fair-Poor IBI Score = 2.2
Available Metrics Metric Values Metric ScoreCarbon:Chlorophyll a Ratio 30.1 ratio 1
Surface Chlorophyll a 4 ug liter-1 3
Cyanophyte Biomass 4 ug C liter-1 Null
Pheophytin 2.8 ug liter-1 1
Total Biomass 120 ug C liter-1 1
Diatom Abundance 4.42 million cells liter-1 5
Total Abundance 7.07 million cells liter-1 Null
5/8/2001 SpringIBI_Method Evaluation IBI ScoreMethod A Poor IBI Score = 1.8
Method B Poor IBI Score = 1.7
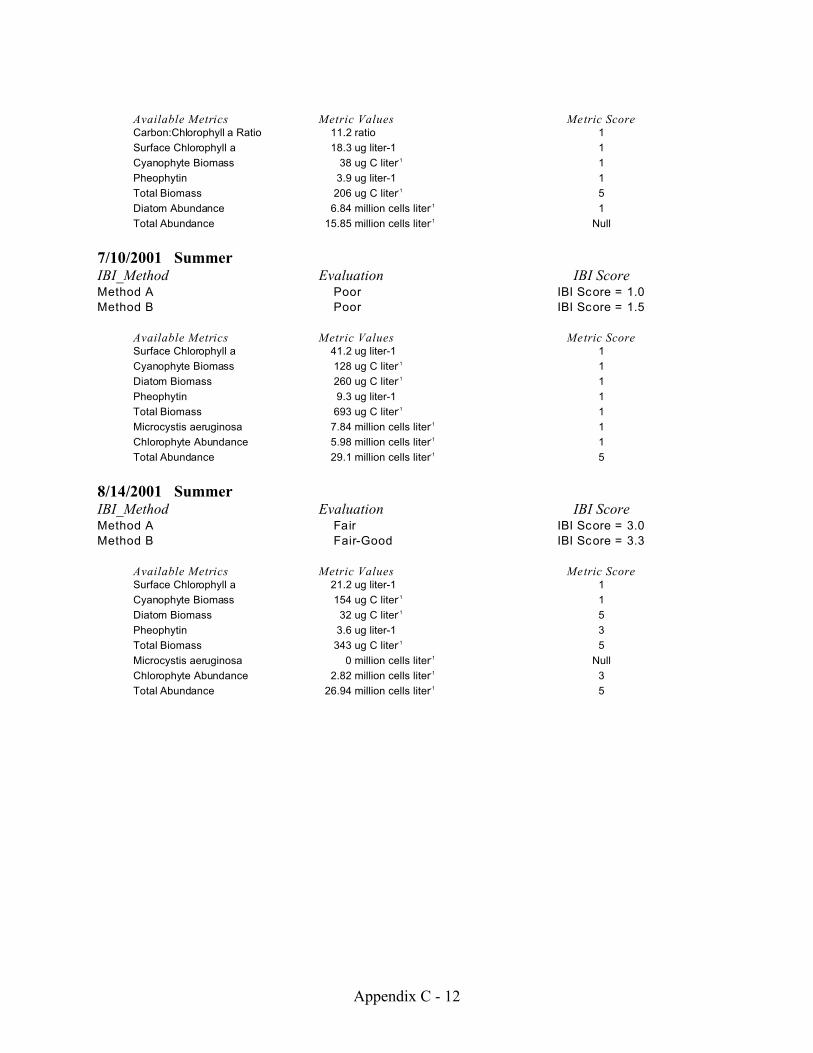
Appendix C - 12
Available Metrics Metric Values Metric ScoreCarbon:Chlorophyll a Ratio 11.2 ratio 1
Surface Chlorophyll a 18.3 ug liter-1 1
Cyanophyte Biomass 38 ug C liter-1 1
Pheophytin 3.9 ug liter-1 1
Total Biomass 206 ug C liter-1 5
Diatom Abundance 6.84 million cells liter-1 1
Total Abundance 15.85 million cells liter-1 Null
7/10/2001 SummerIBI_Method Evaluation IBI ScoreMethod A Poor IBI Score = 1.0
Method B Poor IBI Score = 1.5
Available Metrics Metric Values Metric ScoreSurface Chlorophyll a 41.2 ug liter-1 1
Cyanophyte Biomass 128 ug C liter-1 1
Diatom Biomass 260 ug C liter-1 1
Pheophytin 9.3 ug liter-1 1
Total Biomass 693 ug C liter-1 1
Microcystis aeruginosa 7.84 million cells liter-1 1
Chlorophyte Abundance 5.98 million cells liter-1 1
Total Abundance 29.1 million cells liter-1 5
8/14/2001 SummerIBI_Method Evaluation IBI ScoreMethod A Fair IBI Score = 3.0
Method B Fair-Good IBI Score = 3.3
Available Metrics Metric Values Metric ScoreSurface Chlorophyll a 21.2 ug liter-1 1
Cyanophyte Biomass 154 ug C liter-1 1
Diatom Biomass 32 ug C liter-1 5
Pheophytin 3.6 ug liter-1 3
Total Biomass 343 ug C liter-1 5
Microcystis aeruginosa 0 million cells liter-1 Null
Chlorophyte Abundance 2.82 million cells liter-1 3
Total Abundance 26.94 million cells liter-1 5

Appendix C - 13
STATION ANA28
Location: Anacostia RiverLatitude: UNKNOWN; Longitude: UNKNOWN
2001 Summary: The overall status of this station was probably Fair-Poor during spring and summer2001, but the data are insufficient. Total biomass of the community was dominated by the diatomtaxonomic group in March, co-dominated by the diatom and green groups in April and May, dominatedby the diatom group in July, and by the green group in August. Total biomass was very low in Marchand April, and excessive in July and August. Numerically-dominant taxa were diatoms (small, unid.centrics and pennates), bluegreens (Oscillatoria, Agmenellum, Raphidiopsis), and greens (Coelastrum,Scenedesmus, Sphaerocystis). Bluegreens levels were high in July and August, scoring “1.” Thenuisance bluegreen species, Microcystis aeruginosa, was not evident.
Status of Samples: Counted and discarded.
Sample Dates:3/6/2001 Spring
IBI_Method Evaluation IBI ScoreMethod A Too Few Data ND
Method B Too Few Data ND
Available Metrics Metric Values Metric ScoreCyanophyte Biomass 12 ug C liter-1 Null
Total Biomass 50 ug C liter-1 1
Diatom Abundance 1.14 million cells liter-1 1
Total Abundance 3.33 million cells liter-1 Null
4/3/2001 Spring
IBI_Method Evaluation IBI ScoreMethod A Too Few Data ND
Method B Too Few Data ND
Available Metrics Metric Values Metric ScoreCyanophyte Biomass 0 ug C liter-1 Null
Total Biomass 130 ug C liter-1 1
Diatom Abundance 3.5 million cells liter-1 5
Total Abundance 5.05 million cells liter-1 Null
5/8/2001 Spring
IBI_Method Evaluation IBI ScoreMethod A Too Few Data ND
Method B Too Few Data ND
Available Metrics Metric Values Metric ScoreCyanophyte Biomass 5 ug C liter-1 Null
Total Biomass 254 ug C liter-1 5
Diatom Abundance 9.88 million cells liter-1 1
Total Abundance 14.87 million cells liter-1 Null
7/10/2001 Summer

Appendix C - 14
IBI_Method Evaluation IBI ScoreMethod A Too Few Data ND
Method B Poor IBI Score = 1.0
Available Metrics Metric Values Metric ScoreCyanophyte Biomass 135 ug C liter-1 1
Diatom Biomass 575 ug C liter-1 1
Total Biomass 1,114 ug C liter-1 1
Microcystis aeruginosa 0 million cells liter-1 Null
Chlorophyte Abundance 12.4 million cells liter-1 1
Total Abundance 40.26 million cells liter-1 1
8/14/2001 Summer
IBI_Method Evaluation IBI ScoreMethod A Too Few Data ND
Method B Poor IBI Score = 1.8
Available Metrics Metric Values Metric ScoreCyanophyte Biomass 227 ug C liter-1 1
Diatom Biomass 104 ug C liter-1 5
Total Biomass 690 ug C liter-1 1
Microcystis aeruginosa 0 million cells liter-1 Null
Chlorophyte Abundance 6.04 million cells liter-1 1
Total Abundance 43.3 million cells liter-1 1

Appendix C - 15
STATION ANA29
Location: At the mouth of the Anacostia River, at red and green flasher near Potomac confluence.Latitude:38.85067; Longitude: -77.0222
2001 Summary: Three (3) Spring and two (2) Summer records from 2001 were available to calculate theIBIs. Status of the phytoplankton community was variable in 2001, ranging from Poor (April, May, July)to Fair (March), and an algal bloom was evident in July. Total biomass of the community was dominatedby the diatom taxonomic group in March and April, and the green group in May, July, and August. Thephytoplankton community in March was represented by desirable levels but eventually becamedominated by high levels of greens, diatoms, and cryptomonads in May. The C:Chl ratios and pheophytinlevels indicate some light stress caused by turbidity. (Spring TSS concentrations averaged 9.0 mg liter-1
and Secchi depth averaged 0.68 m). Chlorophyll a and pheophytin levels were high in July and August,scoring “1." July had a diverse bloom of centric diatom (unid. centric, Cyclotella, Skeletonemapotomas), green (Scenedesmus, Actinastrum), and bluegreen (Agmenellum) taxa; August was numericallydominated by bluegreen taxa (Oscillatoria, Agmenellum, Microcystis sp.). The greens Scenedesmus andClosterium, the small centric diatom, and Oscillatoria were the biomass-dominant taxa in summer. IBIstatus in August improved to Fair-Poor due to reduced diatom and chlorophyte levels and the nuisancebluegreen species Microcystis aeruginosa was not evident.
Status of Samples: Counted and discarded.
Sample Dates:3/6/2001 Spring
IBI_Method Evaluation IBI ScoreMethod A Fair IBI Score = 3.0
Method B Fair-Poor IBI Score = 2.6
Available Metrics Metric Values Metric ScoreCarbon:Chlorophyll a Ratio 32.7 ratio 1
Surface Chlorophyll a 11.6 ug liter-1 5
Cyanophyte Biomass 8 ug C liter-1 Null
Pheophytin 6.2 ug liter-1 1
Total Biomass 379 ug C liter-1 5
Diatom Abundance 9.16 million cells liter-1 1
Total Abundance 10.89 million cells liter-1 Null
4/3/2001 Spring
IBI_Method Evaluation IBI ScoreMethod A Poor IBI Score = 2.0
Method B Fair-Poor IBI Score = 2.6
Available Metrics Metric Values Metric ScoreCarbon:Chlorophyll a Ratio 15.1 ratio 1
Surface Chlorophyll a 4.9 ug liter-1 5
Cyanophyte Biomass 2 ug C liter-1 Null
Pheophytin 3.5 ug liter-1 1
Total Biomass 74 ug C liter-1 1
Diatom Abundance 4.84 million cells liter-1 5
Total Abundance 8.08 million cells liter-1 Null

Appendix C - 16
5/8/2001 Spring
IBI_Method Evaluation IBI ScoreMethod A Poor IBI Score = 1.5
Method B Poor IBI Score = 2.0
Available Metrics Metric Values Metric ScoreCarbon:Chlorophyll a Ratio 19.2 ratio 1
Surface Chlorophyll a 32.5 ug liter-1 1
Cyanophyte Biomass 16 ug C liter-1 Null
Pheophytin 7.5 ug liter-1 1
Total Biomass 623 ug C liter-1 3
Diatom Abundance 3.65 million cells liter-1 5
Total Abundance 20.73 million cells liter-1 1
7/10/2001 Summer
IBI_Method Evaluation IBI ScoreMethod A Poor IBI Score = 1.4
Method B Poor IBI Score = 1.3
Available Metrics Metric Values Metric ScoreSurface Chlorophyll a 31.2 ug liter-1 1
Cyanophyte Biomass 62 ug C liter-1 3
Diatom Biomass 202 ug C liter-1 1
Pheophytin 11.9 ug liter-1 1
Total Biomass 704 ug C liter-1 1
Microcystis aeruginosa 0 million cells liter-1 Null
Chlorophyte Abundance 9.12 million cells liter-1 1
Total Abundance 36.09 million cells liter-1 1
8/14/2001 Summer
IBI_Method Evaluation IBI ScoreMethod A Fair-Poor IBI Score = 2.6
Method B Fair IBI Score = 2.7
Available Metrics Metric Values Metric ScoreSurface Chlorophyll a 19 ug liter-1 1
Cyanophyte Biomass 81 ug C liter-1 1
Diatom Biomass 57 ug C liter-1 5
Pheophytin 5.5 ug liter-1 1
Total Biomass 526 ug C liter-1 5
Microcystis aeruginosa 0 million cells liter-1 Null
Chlorophyte Abundance 3.9 million cells liter-1 1
Total Abundance 22.35 million cells liter-1 5

Appendix C - 17
STATION ANA30
Location: Anacostia River across the main navigational channel and the most downstream dock of theBladenburg MarinaLatitude: 38.93388; Longitude: -76.9381
2001 Summary: Only one sample was collected at this station. Small-sized diatoms were numericallydominant (Cyclotella sp#1 diam <10 microns, unid. centric diatom diam <10 microns, unid. pennatediatom <10 microns length, unid. pennate diatom 10-30 microns length), followed by small-sizedbluegreens (Oscillatoria cells #1 diam <5 microns, unid. bluegreen trichome (cell) small). The biomass-dominant taxa were the pennate diatoms unid. pennate 10-30 microns length, Synedra, and Fragilaria.The juxtaposition of pheophytin and diatom abundance scoring 5 and chlorophyll a, total biomass, andC:Chl ratio scoring 3 or 1 suggests ANA30 was an unproductive site at this time. Water quality data forthis date at ANA30 indicates TSS was 10 mg liter-1 (no Secchi depth data are available).
Status of Samples: Counted and discarded.
Sample Dates:3/6/2001 Spring
IBI_Method Evaluation IBI ScoreMethod A Fair-Poor IBI Score = 2.5
Method B Fair IBI Score = 3.0
Available Metrics Metric Values Metric ScoreCarbon:Chlorophyll a Ratio 20.9 ratio 1
Surface Chlorophyll a 3.7 ug liter-1 3
Cyanophyte Biomass 5 ug C liter-1 Null
Pheophytin 0.7 ug liter-1 5
Total Biomass 77 ug C liter-1 1
Diatom Abundance 2.43 million cells liter-1 5
Total Abundance 4.02 million cells liter-1 Null

Appendix C - 18
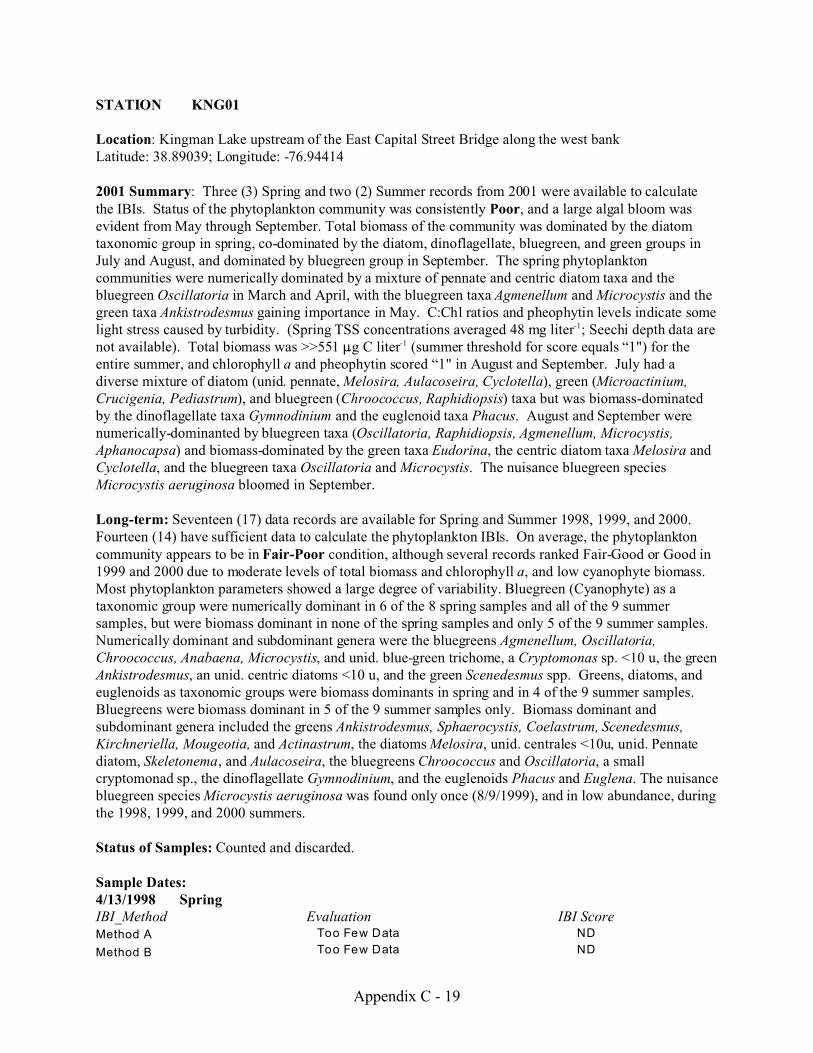
Appendix C - 19
STATION KNG01
Location: Kingman Lake upstream of the East Capital Street Bridge along the west bankLatitude: 38.89039; Longitude: -76.94414
2001 Summary: Three (3) Spring and two (2) Summer records from 2001 were available to calculatethe IBIs. Status of the phytoplankton community was consistently Poor, and a large algal bloom wasevident from May through September. Total biomass of the community was dominated by the diatomtaxonomic group in spring, co-dominated by the diatom, dinoflagellate, bluegreen, and green groups inJuly and August, and dominated by bluegreen group in September. The spring phytoplanktoncommunities were numerically dominated by a mixture of pennate and centric diatom taxa and thebluegreen Oscillatoria in March and April, with the bluegreen taxa Agmenellum and Microcystis and thegreen taxa Ankistrodesmus gaining importance in May. C:Chl ratios and pheophytin levels indicate somelight stress caused by turbidity. (Spring TSS concentrations averaged 48 mg liter-1; Seechi depth data arenot available). Total biomass was >>551 :g C liter-1 (summer threshold for score equals “1") for theentire summer, and chlorophyll a and pheophytin scored “1" in August and September. July had adiverse mixture of diatom (unid. pennate, Melosira, Aulacoseira, Cyclotella), green (Microactinium,Crucigenia, Pediastrum), and bluegreen (Chroococcus, Raphidiopsis) taxa but was biomass-dominatedby the dinoflagellate taxa Gymnodinium and the euglenoid taxa Phacus. August and September werenumerically-dominanted by bluegreen taxa (Oscillatoria, Raphidiopsis, Agmenellum, Microcystis,Aphanocapsa) and biomass-dominated by the green taxa Eudorina, the centric diatom taxa Melosira andCyclotella, and the bluegreen taxa Oscillatoria and Microcystis. The nuisance bluegreen speciesMicrocystis aeruginosa bloomed in September.
Long-term: Seventeen (17) data records are available for Spring and Summer 1998, 1999, and 2000.Fourteen (14) have sufficient data to calculate the phytoplankton IBIs. On average, the phytoplanktoncommunity appears to be in Fair-Poor condition, although several records ranked Fair-Good or Good in1999 and 2000 due to moderate levels of total biomass and chlorophyll a, and low cyanophyte biomass.Most phytoplankton parameters showed a large degree of variability. Bluegreen (Cyanophyte) as ataxonomic group were numerically dominant in 6 of the 8 spring samples and all of the 9 summersamples, but were biomass dominant in none of the spring samples and only 5 of the 9 summer samples. Numerically dominant and subdominant genera were the bluegreens Agmenellum, Oscillatoria,Chroococcus, Anabaena, Microcystis, and unid. blue-green trichome, a Cryptomonas sp. <10 u, the greenAnkistrodesmus, an unid. centric diatoms <10 u, and the green Scenedesmus spp. Greens, diatoms, andeuglenoids as taxonomic groups were biomass dominants in spring and in 4 of the 9 summer samples. Bluegreens were biomass dominant in 5 of the 9 summer samples only. Biomass dominant andsubdominant genera included the greens Ankistrodesmus, Sphaerocystis, Coelastrum, Scenedesmus,Kirchneriella, Mougeotia, and Actinastrum, the diatoms Melosira, unid. centrales <10u, unid. Pennatediatom, Skeletonema, and Aulacoseira, the bluegreens Chroococcus and Oscillatoria, a smallcryptomonad sp., the dinoflagellate Gymnodinium, and the euglenoids Phacus and Euglena. The nuisancebluegreen species Microcystis aeruginosa was found only once (8/9/1999), and in low abundance, duringthe 1998, 1999, and 2000 summers.
Status of Samples: Counted and discarded.
Sample Dates:4/13/1998 SpringIBI_Method Evaluation IBI ScoreMethod A Too Few Data ND
Method B Too Few Data ND

Appendix C - 20
Available M etrics Metric Values Metric Score
Cyanophyte Biomass 7 ug C liter-1 null
Diatom Abundance 0.34 million cells liter-1 1
Total Abundance 3.8 million cells liter-1 null
Total Biomass 117 ug C liter-1 1
5/11/1998 SpringIBI_Method Evaluation IBI Score
Method A Too Few Data ND
Method B Too Few Data ND
Available M etrics Metric Values Metric Scores
Cyanophyte Biomass 69 ug C liter-1 1
Diatom Abundance 1.02 million cells liter-1 1
Total Abundance 12.43 million cells liter-1 null
Total Biomass 295 ug C liter-1 5
7/13/1998 Summer
IBI_Method Evaluation IBI ScoreMethod A Poor IBI Score = 1.7
Method B Fair IBI Score = 2.7
Available Metrics Metric Values Metric Scores
Chlorophyte Abundance 1.89 million cells liter-1 5
Cyanophyte Biomass 305 ug C liter-1 1
Diatom Abundance 1.69 million cells liter-1 5
Diatom Biomass 183 ug C liter-1 3
Microcystis aeruginosa 0 million cells liter-1 null
Total Abundance 51.67 million cells liter-1 1
Total Biomass 923 ug C liter-1 1
8/10/1998 Summer
IBI_Method Evaluation IBI ScoreMethod A Poor IBI Score = 1.0
Method B Poor IBI Score = 1.0
Available Metrics Metric Values Metric Scores
Chlorophyte Abundance 7.33 million cells liter-1 1
Cyanophyte Biomass 478 ug C liter-1 1
Diatom Abundance 8.8 million cells liter-1 1
Diatom Biomass 484 ug C liter-1 1
Microcystis aeruginosa 0 million cells liter-1 null
Total Abundance 93.12 million cells liter-1 1
Total Biomass 1475 ug C liter-1 1
9/15/1998 Summer
IBI_Method Evaluation IBI ScoreMethod A Poor IBI Score = 1.0
Method B Poor IBI Score = 1.0
Available Metrics Metric Values Metric Scores
Chlorophyte Abundance 27.17 million cells liter-1 1
Cyanophyte Biomass 810 ug C liter-1 1
Appendix C - 21
Diatom Abundance 5.97 million cells liter-1 1
Diatom Biomass 637 ug C liter-1 1
Microcystis aeruginosa 0 million cells liter-1 null
Total Abundance 195.81 million cells liter-1 1
Total Biomass 2935 ug C liter-1 1
3/8/1999 Spring
IBI_Method Evaluation IBI ScoreMethod A Too Few Data ND
Method B Too Few Data ND
Available Metrics Metric Values Metric Scores
Cyanophyte Biomass 23 ug C liter-1 1
Diatom Abundance 3.13 million cells liter-1 5
Total Abundance 10.67 million cells liter-1 null
Total Biomass 190 ug C liter-1 5
4/5/1999 Spring
IBI_Method Evaluation IBI ScoreMethod A Fair IBI Score = 3.0
Method B Fair-Good IBI Score = 3.4
Available Metrics Metric Values Metric Scores
Carbon:Chlorophyll Ratio 35.5 ratio 1
Cyanophyte Biomass 13 ug C liter-1 null
Diatom Abundance 4.31 million cells liter-1 5
Pheophytin 14 ug liter-1 1
Surface Chlorophyll a 10 ug liter-1 5
Total Abundance 16.55 million cells liter-1 null
Total Biomass 356 ug C liter-1 5
5/3/1999 Spring
IBI_Method Evaluation IBI ScoreMethod A Poor IBI Score = 1.8
Method B Fair-Poor IBI Score = 2.1
Available Metrics Metric Values Metric Scores
Carbon:Chlorophyll Ratio 70.4 ratio 5
Cyanophyte Biomass 161 ug C liter-1 1
Diatom Abundance 2.73 million cells liter-1 5
Pheophytin 21 ug liter-1 1
Surface Chlorophyll a 16 ug liter-1 1
Total Abundance 17.79 million cells liter-1 1
Total Biomass 1127 ug C liter-1 1
7/13/1999 Summer
IBI_Method Evaluation IBI ScoreMethod A Poor IBI Score = 1.0
Method B Poor IBI Score = 1.0
Available Metrics Metric Values Metric Scores
Chlorophyte Abundance 26.7 million cells liter-1 1
Cyanophyte Biomass 994 ug C liter-1 1
Diatom Abundance 5.18 million cells liter-1 1
Diatom Biomass 293 ug C liter-1 1

Appendix C - 22
Microcystis aeruginosa 0 million cells liter-1 null
Pheophytin 26 ug liter-1 1
Surface Chlorophyll a 66 ug liter-1 1
Total Abundance 146.04 million cells liter-1 1
Total Biomass 2134 ug C liter-1 1
7/14/1999 Summer
IBI_Method Evaluation IBI ScoreMethod A Fair-Good IBI Score = 3.7
Method B Good IBI Score = 4.3
Available Metrics Metric Values Metric Scores
Chlorophyte Abundance 2.03 million cells liter-1 5
Cyanophyte Biomass 94 ug C liter-1 1
Diatom Abundance 2.11 million cells liter-1 5
Diatom Biomass 84 ug C liter-1 5
Microcystis aeruginosa 0 million cells liter-1 null
Total Abundance 20.54 million cells liter-1 5
Total Biomass 376 ug C liter-1 5
8/9/1999 Summer
IBI_Method Evaluation IBI ScoreMethod A Poor IBI Score = 1.0
Method B Poor IBI Score = 1.0
Available Metrics Metric Values Metric Scores Chlorophyte Abundance 22.83 million cells liter-1 1
Cyanophyte Biomass 3048 ug C liter-1 1
Diatom Abundance 10.8 million cells liter-1 1
Diatom Biomass 377 ug C liter-1 1
Microcystis aeruginosa 0.91 million cells liter-1 1
Pheophytin 12 ug liter-1 1
Surface Chlorophyll a 83 ug liter-1 1
Total Abundance 527.03 million cells liter-1 1
Total Biomass 4597 ug C liter-1 1
3/6/2000 Spring
IBI_Method Evaluation IBI ScoreMethod A Good IBI Score = 4.0
Method B Fair-Good IBI Score = 3.4
Available Metrics Metric Values Metric Scores
Carbon:Chlorophyll Ratio 50.1 ratio 5
Cyanophyte Biomass 20 ug C liter-1 null
Diatom Abundance 0.76 million cells liter-1 1
Pheophytin 3 ug liter-1 1
Surface Chlorophyll a 5 ug liter-1 5
Total Abundance 3.93 million cells liter-1 null
Total Biomass 250 ug C liter-1 5
4/3/2000 Spring
IBI_Method Evaluation IBI ScoreMethod A Poor IBI Score = 1.4
Method B Poor IBI Score = 1.3

Appendix C - 23
Available Metrics Metric Values Metric Scores Carbon:Chlorophyll Ratio 34.5 ratio 1
Cyanophyte Biomass 39 ug C liter-1 1
Diatom Abundance 0.25 million cells liter-1 1
Pheophytin 6 ug liter-1 1
Surface Chlorophyll a 4 ug liter-1 3
Total Abundance 6.34 million cells liter-1 null
Total Biomass 138 ug C liter-1 1
5/1/2000 Spring
IBI_Method Evaluation IBI ScoreMethod A Fair-Good IBI Score = 3.5
Method B Fair IBI Score = 3.0
Available Metrics Metric Values Metric Scores
Carbon:Chlorophyll Ratio 48.9 ratio 5
Cyanophyte Biomass 0 ug C liter-1 null
Diatom Abundance 1.34 million cells liter-1 1
Pheophytin 4 ug liter-1 1
Surface Chlorophyll a 12 ug liter-1 5
Total Abundance 12.33 million cells liter-1 null
Total Biomass 587 ug C liter-1 3
7/17/2000 Summer
IBI_Method Evaluation IBI ScoreMethod A Fair-Poor IBI Score = 2.6
Method B Fair-Good IBI Score = 3.5
Available Metrics Metric Values Metric Scores
Chlorophyte Abundance 1.7 million cells liter-1 5
Cyanophyte Biomass 72 ug C liter-1 1
Diatom Abundance 0.89 million cells liter-1 5
Diatom Biomass 89 ug C liter-1 5
Microcystis aeruginosa 0 million cells liter-1 null
Pheophytin 6 ug liter-1 1
Surface Chlorophyll a 16 ug liter-1 1
Total Abundance 22.69 million cells liter-1 5
Total Biomass 404 ug C liter-1 5
8/14/2000 Summer
IBI_Method Evaluation IBI ScoreMethod A Poor IBI Score = 1.0
Method B Poor IBI Score = 1.3
Available Metrics Metric Values Metric Scores
Chlorophyte Abundance 3.37 million cells liter-1 3
Cyanophyte Biomass 182 ug C liter-1 1
Diatom Abundance 9.24 million cells liter-1 1
Diatom Biomass 330 ug C liter-1 1
Microcystis aeruginosa 0 million cells liter-1 null
Pheophytin 9 ug liter-1 1
Surface Chlorophyll a 32 ug liter-1 1
Total Abundance 37.79 million cells liter-1 1
Total Biomass 960 ug C liter-1 1

Appendix C - 24
9/18/2000 Summer
IBI_Method Evaluation IBI ScoreMethod A Poor IBI Score = 1.0
Method B Poor IBI Score = 1.0
Available Metrics Metric Values Metric Scores
Chlorophyte Abundance 7.56 million cells liter-1 1
Cyanophyte Biomass 105 ug C liter-1 1
Diatom Abundance 4.93 million cells liter-1 1
Diatom Biomass 263 ug C liter-1 1
Microcystis aeruginosa 0 million cells liter-1 null
Pheophytin 11 ug liter-1 1
Surface Chlorophyll a 38 ug liter-1 1
Total Abundance 34.79 million cells liter-1 1
Total Biomass 767 ug C liter-1 1
3/12/2001 Spring
IBI_Method Evaluation IBI ScoreMethod A Poor IBI Score = 1.4
Method B Poor IBI Score = 1.3
Available Metrics Metric Values Metric ScoreCarbon:Chlorophyll a Ratio 9.6 ratio 1
Surface Chlorophyll a 15.7 ug liter-1 1
Cyanophyte Biomass 29 ug C liter-1 1
Pheophytin 2.1 ug liter-1 3
Total Biomass 150 ug C liter-1 1
Diatom Abundance 7.24 million cells liter-1 1
Total Abundance 10.69 million cells liter-1 null
4/9/2001 Spring
IBI_Method Evaluation IBI ScoreMethod A Poor IBI Score = 2.0
Method B Fair-Poor IBI Score = 2.6
Available Metrics Metric Values Metric ScoreCarbon:Chlorophyll a Ratio 25.3 ratio 1
Surface Chlorophyll a 5.3 ug liter-1 5
Cyanophyte Biomass 18 ug C liter-1 Null
Pheophytin 4.4 ug liter-1 1
Total Biomass 134 ug C liter-1 1
Diatom Abundance 2.71 million cells liter-1 5
Total Abundance 5.6 million cells liter-1 Null
5/14/2001 Spring
IBI_Method Evaluation IBI ScoreMethod A Poor IBI Score = 2.0
Method B Poor IBI Score = 1.7
Available Metrics Metric Values Metric ScoreCarbon:Chlorophyll a Ratio 83.0 ratio 5

Appendix C - 25
Surface Chlorophyll a 25.2 ug liter-1 1
Cyanophyte Biomass 22 ug C liter-1 Null
Pheophytin 16.5 ug liter-1 1
Total Biomass 2,092 ug C liter-1 1
Diatom Abundance 130.5 million cells liter-1 1
Total Abundance 146.5 million cells liter-1 1
7/16/2001 Summer
IBI_Method Evaluation IBI ScoreMethod A Too Few Data ND
Method B Poor IBI Score = 1.8
Available Metrics Metric Values Metric ScoreCyanophyte Biomass 151 ug C liter-1 1
Diatom Biomass 966 ug C liter-1 1
Total Biomass 1,860 ug C liter-1 1
Microcystis aeruginosa 0 million cells liter-1 Null
Chlorophyte Abundance 8.68 million cells liter-1 1
Total Abundance 28.87 million cells liter-1 5
8/20/2001 Summer
IBI_Method Evaluation IBI ScoreMethod A Poor IBI Score = 1.0
Method B Poor IBI Score = 1.3
Available Metrics Metric Values Metric ScoreSurface Chlorophyll a 19.1 ug liter-1 1
Cyanophyte Biomass 208 ug C liter-1 1
Diatom Biomass 927 ug C liter-1 1
Pheophytin 4.9 ug liter-1 1
Total Biomass 1,533 ug C liter-1 1
Microcystis aeruginosa 0 million cells liter-1 Null
Chlorophyte Abundance 3.00 million cells liter-1 3
Total Abundance 44.42 million cells liter-1 1
9/17/2001 Summer
IBI_Method Evaluation IBI ScoreMethod A Poor IBI Score = 1.0
Method B Poor IBI Score = 1.0
Available Metrics Metric Values Metric ScoreSurface Chlorophyll a 37.4 ug liter-1 1
Cyanophyte Biomass 467 ug C liter-1 1
Diatom Biomass 831 ug C liter-1 1
Pheophytin 7.0 ug liter-1 1
Total Biomass 1,480 ug C liter-1 1
Microcystis aeruginosa 28.39 million cells liter-1 1
Chlorophyte Abundance 4.17 million cells liter-1 1
Total Abundance 87.01 million cells liter-1 1

Appendix C - 26
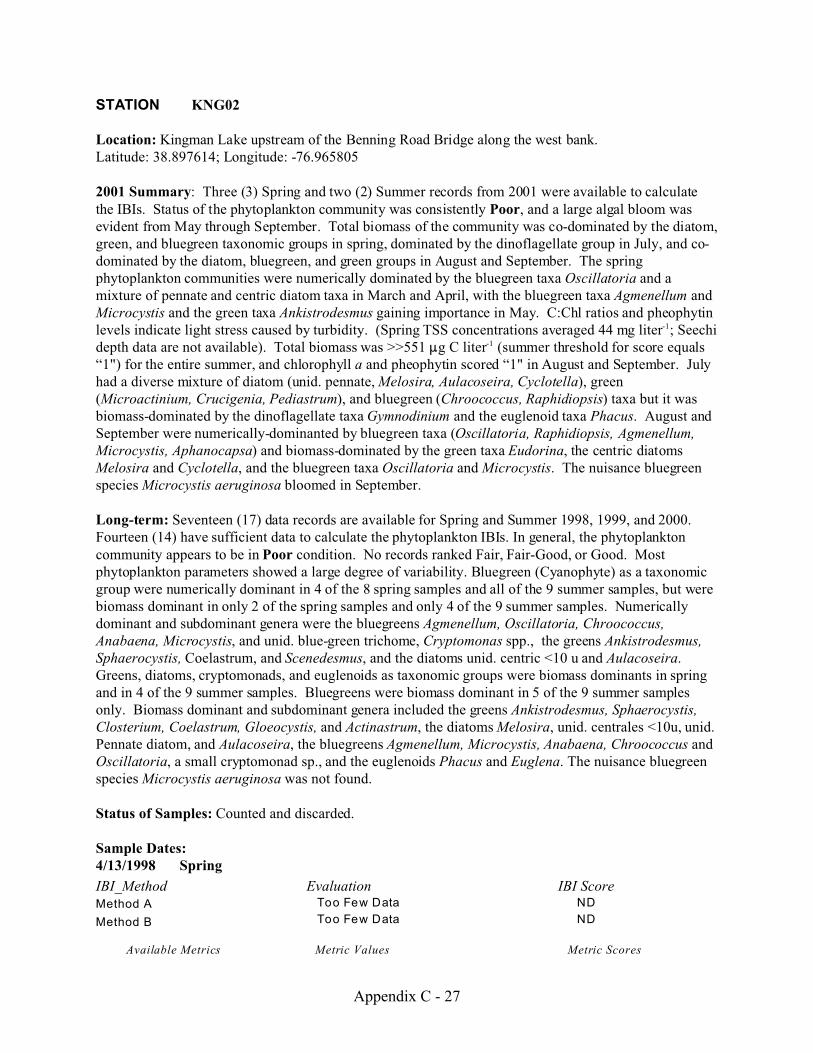
Appendix C - 27
STATION KNG02
Location: Kingman Lake upstream of the Benning Road Bridge along the west bank.Latitude: 38.897614; Longitude: -76.965805
2001 Summary: Three (3) Spring and two (2) Summer records from 2001 were available to calculatethe IBIs. Status of the phytoplankton community was consistently Poor, and a large algal bloom wasevident from May through September. Total biomass of the community was co-dominated by the diatom,green, and bluegreen taxonomic groups in spring, dominated by the dinoflagellate group in July, and co-dominated by the diatom, bluegreen, and green groups in August and September. The springphytoplankton communities were numerically dominated by the bluegreen taxa Oscillatoria and amixture of pennate and centric diatom taxa in March and April, with the bluegreen taxa Agmenellum andMicrocystis and the green taxa Ankistrodesmus gaining importance in May. C:Chl ratios and pheophytinlevels indicate light stress caused by turbidity. (Spring TSS concentrations averaged 44 mg liter-1; Seechidepth data are not available). Total biomass was >>551 :g C liter-1 (summer threshold for score equals“1") for the entire summer, and chlorophyll a and pheophytin scored “1" in August and September. Julyhad a diverse mixture of diatom (unid. pennate, Melosira, Aulacoseira, Cyclotella), green(Microactinium, Crucigenia, Pediastrum), and bluegreen (Chroococcus, Raphidiopsis) taxa but it wasbiomass-dominated by the dinoflagellate taxa Gymnodinium and the euglenoid taxa Phacus. August andSeptember were numerically-dominanted by bluegreen taxa (Oscillatoria, Raphidiopsis, Agmenellum,Microcystis, Aphanocapsa) and biomass-dominated by the green taxa Eudorina, the centric diatomsMelosira and Cyclotella, and the bluegreen taxa Oscillatoria and Microcystis. The nuisance bluegreenspecies Microcystis aeruginosa bloomed in September.
Long-term: Seventeen (17) data records are available for Spring and Summer 1998, 1999, and 2000.Fourteen (14) have sufficient data to calculate the phytoplankton IBIs. In general, the phytoplanktoncommunity appears to be in Poor condition. No records ranked Fair, Fair-Good, or Good. Mostphytoplankton parameters showed a large degree of variability. Bluegreen (Cyanophyte) as a taxonomicgroup were numerically dominant in 4 of the 8 spring samples and all of the 9 summer samples, but werebiomass dominant in only 2 of the spring samples and only 4 of the 9 summer samples. Numericallydominant and subdominant genera were the bluegreens Agmenellum, Oscillatoria, Chroococcus,Anabaena, Microcystis, and unid. blue-green trichome, Cryptomonas spp., the greens Ankistrodesmus,Sphaerocystis, Coelastrum, and Scenedesmus, and the diatoms unid. centric <10 u and Aulacoseira. Greens, diatoms, cryptomonads, and euglenoids as taxonomic groups were biomass dominants in springand in 4 of the 9 summer samples. Bluegreens were biomass dominant in 5 of the 9 summer samplesonly. Biomass dominant and subdominant genera included the greens Ankistrodesmus, Sphaerocystis,Closterium, Coelastrum, Gloeocystis, and Actinastrum, the diatoms Melosira, unid. centrales <10u, unid.Pennate diatom, and Aulacoseira, the bluegreens Agmenellum, Microcystis, Anabaena, Chroococcus andOscillatoria, a small cryptomonad sp., and the euglenoids Phacus and Euglena. The nuisance bluegreenspecies Microcystis aeruginosa was not found.
Status of Samples: Counted and discarded.
Sample Dates:4/13/1998 Spring
IBI_Method Evaluation IBI ScoreMethod A Too Few Data ND
Method B Too Few Data ND
Available Metrics Metric Values Metric Scores

Appendix C - 28
Cyanophyte Biomass 1 ug C liter-1 null
Diatom Abundance 1.42 million cells liter-1 1
Total Abundance 4.62 million cells liter-1 null
Total Biomass 390 ug C liter-1 5
5/11/1998
Spring
IBI_Method Evaluation IBI ScoreMethod A Too Few Data ND
Method B Too Few Data ND
Available Metrics Metric Values Metric Scores
Cyanophyte Biomass 11 ug C liter-1 null
Diatom Abundance 0.2 million cells liter-1 1
Total Abundance 3.1 million cells liter-1 null
Total Biomass 47 ug C liter-1 1
7/13/1998
Summer
IBI_Method Evaluation IBI ScoreMethod A Poor IBI Score = 1.7
Method B Poor IBI Score = 2.0
Available Metrics Metric Values Metric Scores
Chlorophyte Abundance 5.43 million cells liter-1 1
Cyanophyte Biomass 49 ug C liter-1 3
Diatom Abundance 7.12 million cells liter-1 1
Diatom Biomass 353 ug C liter-1 1
Microcystis aeruginosa 0 million cells liter-1 null
Total Abundance 28.3 million cells liter-1 5
Total Biomass 711 ug C liter-1 1
8/10/1998
Summer
IBI_Method Evaluation IBI ScoreMethod A Poor IBI Score = 1.5
Method B Poor IBI Score = 1.6
Available Metrics Metric Values Metric Scores
Chlorophyte Abundance 4.05 million cells liter-1 1
Cyanophyte Biomass 542 ug C liter-1 1
Diatom Abundance 3.78 million cells liter-1 3
Diatom Biomass 169 ug C liter-1 3
Microcystis aeruginosa 19.27 million cells liter-1 1
Total Abundance 103.52 million cells liter-1 1
Total Biomass 943 ug C liter-1 1
9/15/1998
Summer
IBI_Method Evaluation IBI ScoreMethod A Poor IBI Score = 1.0
Method B Poor IBI Score = 1.7
Available Metrics Metric Values Metric Scores
Chlorophyte Abundance 7.25 million cells liter-1 1
Cyanophyte Biomass 522 ug C liter-1 1
Diatom Abundance 3.03 million cells liter-1 5

Appendix C - 29
Diatom Biomass 248 ug C liter-1 1
Microcystis aeruginosa 0 million cells liter-1 null
Total Abundance 156.39 million cells liter-1 1
Total Biomass 1482 ug C liter-1 1
3/8/1999
Spring
IBI_Method Evaluation IBI ScoreMethod A Too Few Data ND
Method B Too Few Data ND
Available Metrics Metric Values Metric Scores
Cyanophyte Biomass 54 ug C liter-1 1
Diatom AbuInsufficient Dataance 1.44 million cells liter-1 1
Total Abundance 15.83 million cells liter-1 null
Total Biomass 267 ug C liter-1 5
4/5/1999
Spring
IBI_Method Evaluation IBI ScoreMethod A Poor IBI Score = 1.8
Method B Fair-Poor IBI Score = 2.1
Available Metrics Metric Values Metric Scores
Carbon:Chlorophyll Ratio 26.2 ratio 1
Cyanophyte Biomass 72 ug C liter-1 1
Diatom Abundance 5.29 million cells liter-1 5
* Pheophytin 31 ug liter-1 1
* Surface Chlorophyll a 16 ug liter-1 1
Total Abundance 21.76 million cells liter-1 1
Total Biomass 419 ug C liter-1 5
5/3/1999
Spring
IBI_Method Evaluation IBI ScoreMethod A Poor IBI Score = 2
Method B Fair-Poor IBI Score = 2.3
Available Metrics Metric Values Metric Scores
Carbon:Chlorophyll Ratio 41.2 ratio 3
Cyanophyte Biomass 21 ug C liter-1 null
Diatom Abundance 2.8 million cells liter-1 5
* Pheophytin 26 ug liter-1 1
* Surface Chlorophyll a 20 ug liter-1 1
Total Abundance 20.52 million cells liter-1 1
Total Biomass 824 ug C liter-1 3
7/13/1999
Summer
IBI_Method Evaluation IBI ScoreMethod A Poor IBI Score = 1.0
Method B Poor IBI Score = 1.0
Available Metrics Metric Values Metric Scores
Chlorophyte Abundance 10.56 million cells liter-1 1
Cyanophyte Biomass 928 ug C liter-1 1
Diatom Abundance 4.77 million cells liter-1 1
Appendix C - 30
Diatom Biomass 409 ug C liter-1 1
Microcystis aeruginosa 0 million cells liter-1 null
* Pheophytin 12 ug liter-1 1
* Surface Chlorophyll a 60 ug liter-1 1
Total Abundance 176.73 million cells liter-1 1
Total Biomass 1988 ug C liter-1 1
8/9/1999
Summer
IBI_Method Evaluation IBI ScoreMethod A Poor IBI Score = 1.0
Method B Poor IBI Score = 1.0
Available Metrics Metric Values Metric Scores
Chlorophyte Abundance 19.77 million cells liter-1 1
Cyanophyte Biomass 2575 ug C liter-1 1
Diatom Abundance 11.24 million cells liter-1 1
Diatom Biomass 529 ug C liter-1 1
Microcystis aeruginosa 0 million cells liter-1 null
* Pheophytin 22 ug liter-1 1
* Surface Chlorophyll a 81 ug liter-1 1
Total Abundance 393.16 million cells liter-1 1
Total Biomass 4829 ug C liter-1 1
9/14/1999
Summer
IBI_Method Evaluation IBI ScoreMethod A Poor IBI Score = 1.8
Method B Poor IBI Score = 2
Available Metrics Metric Values Metric Scores
Chlorophyte Abundance 6.93 million cells liter-1 1
Cyanophyte Biomass 132 ug C liter-1 1
Diatom Abundance 2.33 million cells liter-1 5
Diatom Biomass 70 ug C liter-1 5
Microcystis aeruginosa 0 million cells liter-1 null
* Pheophytin 10 ug liter-1 1
* Surface Chlorophyll a 18 ug liter-1 1
Total Abundance 59.31 million cells liter-1 1
Total Biomass 705 ug C liter-1 1
3/6/2000
Spring
IBI_Method Evaluation IBI ScoreMethod A Poor IBI Score = 1.8
Method B Poor IBI Score = 1.7
Available Metrics Metric Values Metric Scores
Carbon:Chlorophyll Ratio 14.6 ratio 1
Cyanophyte Biomass 56 ug C liter-1 1
Diatom Abundance 0.2 million cells liter-1 1
* Pheophytin 8 ug liter-1 1
* Surface Chlorophyll a 7 ug liter-1 5
Total Abundance 8.43 million cells liter-1 null
Total Biomass 102 ug C liter-1 1

Appendix C - 31
4/3/2000
Spring
IBI_Method Evaluation IBI ScoreMethod A Poor IBI Score = 1.8
Method B Poor IBI Score = 1.7
Available Metrics Metric Values Metric Scores
Carbon:Chlorophyll Ratio 17.9 ratio 1
Cyanophyte Biomass 67 ug C liter-1 1
Diatom Abundance 0.19 million cells liter-1 1
* Pheophytin 28 ug liter-1 1
* Surface Chlorophyll a 6 ug liter-1 5
Total Abundance 9.16 million cells liter-1 null
Total Biomass 107 ug C liter-1 1
5/1/2000
Spring
IBI_Method Evaluation IBI ScoreMethod A Poor IBI Score = 1.5
Method B Poor IBI Score = 1.4
Available Metrics Metric Values Metric Scores
Carbon:Chlorophyll Ratio 19 ratio 1
Cyanophyte Biomass 13 ug C liter-1 null
Diatom Abundance 0.86 million cells liter-1 1
* Pheophytin 4 ug liter-1 1
* Surface Chlorophyll a 36 ug liter-1 1
Total Abundance 13.34 million cells liter-1 null
Total Biomass 683 ug C liter-1 3
7/17/2000
Summer
IBI_Method Evaluation IBI ScoreMethod A Poor IBI Score = 1.4
Method B Fair-Poor IBI Score = 2.3
Available Metrics Metric Values Metric Scores
Chlorophyte Abundance 2.44 million cells liter-1 5
Cyanophyte Biomass 65 ug C liter-1 3
Diatom Abundance 4.56 million cells liter-1 1
Diatom Biomass 258 ug C liter-1 1
Microcystis aeruginosa 0 million cells liter-1 null
* Pheophytin 9 ug liter-1 1
* Surface Chlorophyll a 45 ug liter-1 1
Total Abundance 27.1 million cells liter-1 5
Total Biomass 1114 ug C liter-1 1
8/14/2000
Summer
IBI_Method Evaluation IBI ScoreMethod A Poor IBI Score = 1
Method B Poor IBI Score = 2
Available Metrics Metric Values Metric Scores
Chlorophyte Abundance 1.55 million cells liter-1 5
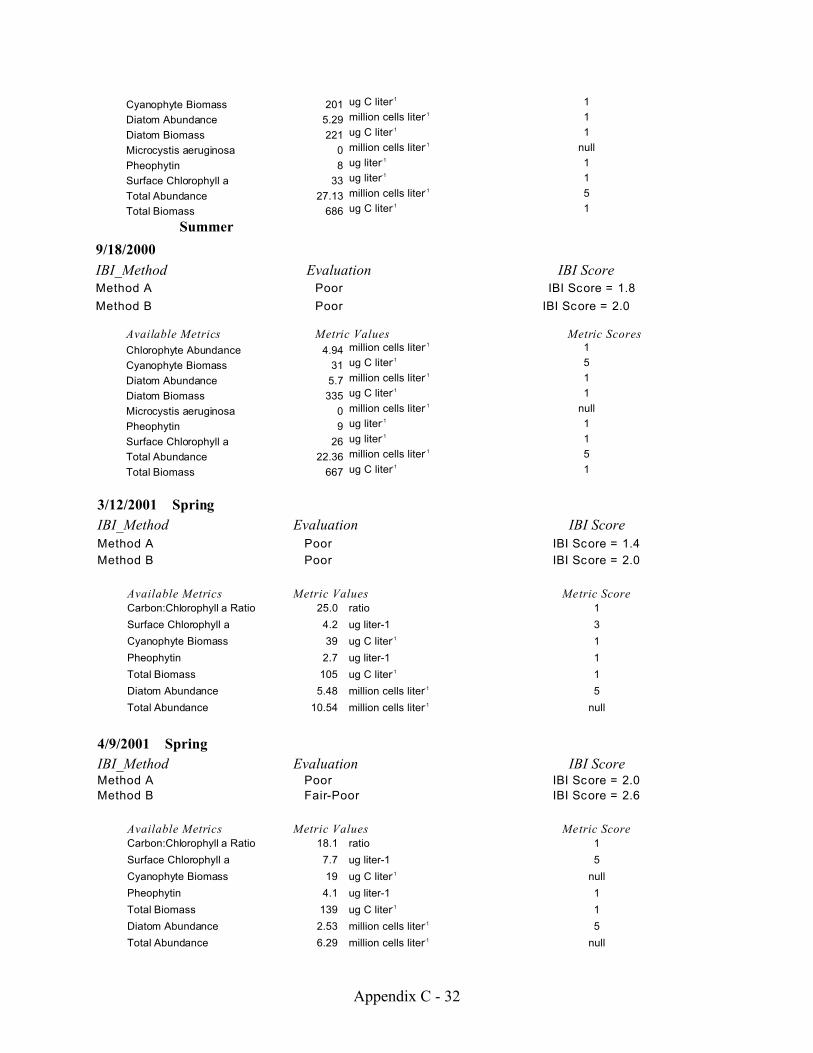
Appendix C - 32
Cyanophyte Biomass 201 ug C liter-1 1
Diatom Abundance 5.29 million cells liter-1 1
Diatom Biomass 221 ug C liter-1 1
Microcystis aeruginosa 0 million cells liter-1 null
Pheophytin 8 ug liter-1 1
Surface Chlorophyll a 33 ug liter-1 1
Total Abundance 27.13 million cells liter-1 5
Total Biomass 686 ug C liter-1 1
9/18/2000
Summer
IBI_Method Evaluation IBI ScoreMethod A Poor IBI Score = 1.8
Method B Poor IBI Score = 2.0
Available Metrics Metric Values Metric Scores
Chlorophyte Abundance 4.94 million cells liter-1 1
Cyanophyte Biomass 31 ug C liter-1 5
Diatom Abundance 5.7 million cells liter-1 1
Diatom Biomass 335 ug C liter-1 1
Microcystis aeruginosa 0 million cells liter-1 null
Pheophytin 9 ug liter-1 1
Surface Chlorophyll a 26 ug liter-1 1
Total Abundance 22.36 million cells liter-1 5
Total Biomass 667 ug C liter-1 1
3/12/2001 Spring
IBI_Method Evaluation IBI ScoreMethod A Poor IBI Score = 1.4
Method B Poor IBI Score = 2.0
Available Metrics Metric Values Metric ScoreCarbon:Chlorophyll a Ratio 25.0 ratio 1
Surface Chlorophyll a 4.2 ug liter-1 3
Cyanophyte Biomass 39 ug C liter-1 1
Pheophytin 2.7 ug liter-1 1
Total Biomass 105 ug C liter-1 1
Diatom Abundance 5.48 million cells liter-1 5
Total Abundance 10.54 million cells liter-1 null
4/9/2001 Spring
IBI_Method Evaluation IBI ScoreMethod A Poor IBI Score = 2.0
Method B Fair-Poor IBI Score = 2.6
Available Metrics Metric Values Metric ScoreCarbon:Chlorophyll a Ratio 18.1 ratio 1
Surface Chlorophyll a 7.7 ug liter-1 5
Cyanophyte Biomass 19 ug C liter-1 null
Pheophytin 4.1 ug liter-1 1
Total Biomass 139 ug C liter-1 1
Diatom Abundance 2.53 million cells liter-1 5
Total Abundance 6.29 million cells liter-1 null
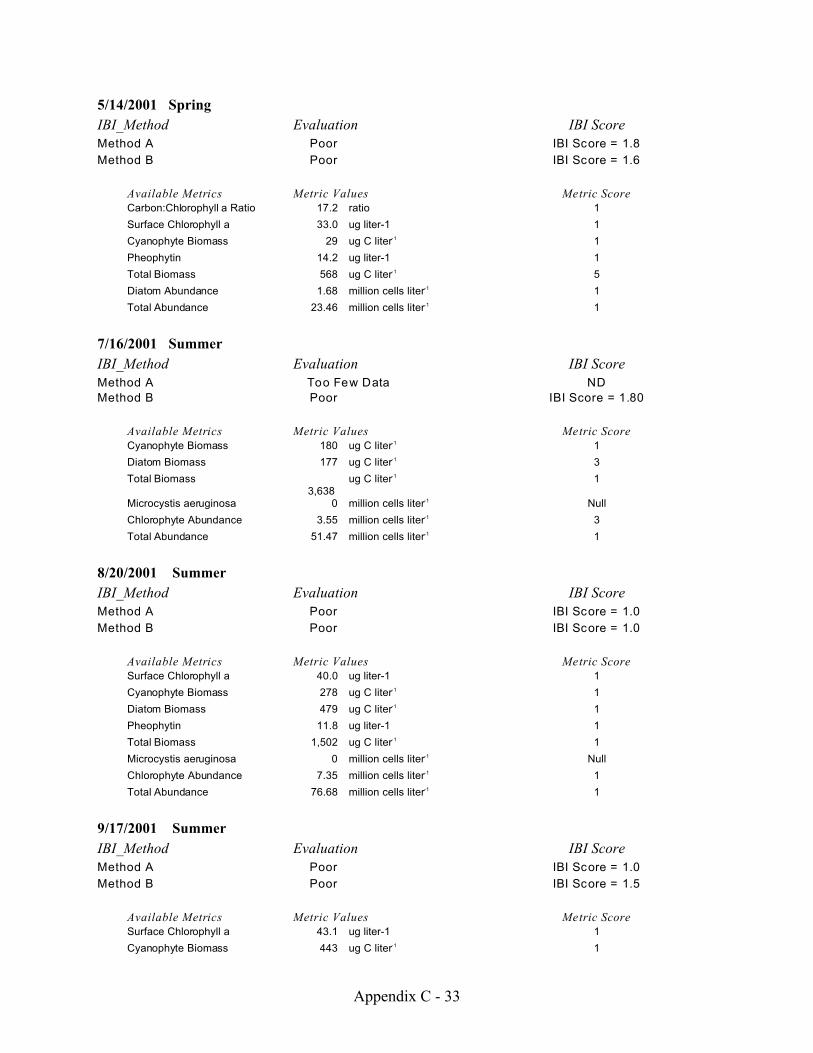
Appendix C - 33
5/14/2001 Spring
IBI_Method Evaluation IBI ScoreMethod A Poor IBI Score = 1.8
Method B Poor IBI Score = 1.6
Available Metrics Metric Values Metric ScoreCarbon:Chlorophyll a Ratio 17.2 ratio 1
Surface Chlorophyll a 33.0 ug liter-1 1
Cyanophyte Biomass 29 ug C liter-1 1
Pheophytin 14.2 ug liter-1 1
Total Biomass 568 ug C liter-1 5
Diatom Abundance 1.68 million cells liter-1 1
Total Abundance 23.46 million cells liter-1 1
7/16/2001 Summer
IBI_Method Evaluation IBI ScoreMethod A Too Few Data ND
Method B Poor IBI Score = 1.80
Available Metrics Metric Values Metric ScoreCyanophyte Biomass 180 ug C liter-1 1
Diatom Biomass 177 ug C liter-1 3
Total Biomass 3,638
ug C liter-1 1
Microcystis aeruginosa 0 million cells liter-1 Null
Chlorophyte Abundance 3.55 million cells liter-1 3
Total Abundance 51.47 million cells liter-1 1
8/20/2001 Summer
IBI_Method Evaluation IBI ScoreMethod A Poor IBI Score = 1.0
Method B Poor IBI Score = 1.0
Available Metrics Metric Values Metric ScoreSurface Chlorophyll a 40.0 ug liter-1 1
Cyanophyte Biomass 278 ug C liter-1 1
Diatom Biomass 479 ug C liter-1 1
Pheophytin 11.8 ug liter-1 1
Total Biomass 1,502 ug C liter-1 1
Microcystis aeruginosa 0 million cells liter-1 Null
Chlorophyte Abundance 7.35 million cells liter-1 1
Total Abundance 76.68 million cells liter-1 1
9/17/2001 Summer
IBI_Method Evaluation IBI ScoreMethod A Poor IBI Score = 1.0
Method B Poor IBI Score = 1.5
Available Metrics Metric Values Metric ScoreSurface Chlorophyll a 43.1 ug liter-1 1
Cyanophyte Biomass 443 ug C liter-1 1

Appendix C - 34
Diatom Biomass 334 ug C liter-1 1
Pheophytin 8.4 ug liter-1 1
Total Biomass 812
ug C liter-1 1
Microcystis aeruginosa 22.56 million cells liter-1 1
Chlorophyte Abundance 0.58 million cells liter-1 5
Total Abundance 95.32 million cells liter-1 1

Appendix C - 35
STATION KNGLOWER
Location: Kingman LakeLatitude: UNKNOWN; Longitude: UNKNOWN
Summary: Three (3) data records are available for Summer 1999. All have sufficient data to calculatethe phytoplankton IBIs. On average, the phytoplankton community appears to be in Fair-Poor condition. Total biomass of the community is dominated by the green taxonomic group in July, the bluegreen groupin August, and the dinoflagellate and euglenoid groups in September. The numerically-dominant taxawere the bluegreen taxa Agmenellum, Oscillatoria, and Chroococcus in July and August, andAgmenellum and Anabaena, and the green taxa Sphaerocystis in September. The biomass-dominant taxawere several large unidentified centric and pennate diatoms, the euglenoids Phacus and Euglena, and thedinoflagellates Ceratium and Gymnodinium.
Status of Samples: Counted and discarded.
Sample Dates:7/16/1999 Summer
IBI_Method Evaluation IBI ScoreMethod A Poor IBI Score = 1.0
Method B Poor IBI Score = 1.3
Available Metrics Metric Values Metric Scores
Chlorophyte Abundance 9.21 million cells liter-1 1
Cyanophyte Biomass 230 ug C liter-1 1
Diatom Abundance 4.34 million cells liter-1 3
Diatom Biomass 312 ug C liter-1 1
Microcystis aeruginosa 0 million cells liter-1 null
Total Abundance 44.55 million cells liter-1 1
Total Biomass 1151 ug C liter-1 1
8/16/1999
Summer
IBI_Method Evaluation IBI ScoreMethod A Poor IBI Score = 1.0
Method B Poor IBI Score = 1.0
Available Metrics Metric Values Metric Scores
Chlorophyte Abundance 19.91 million cells liter-1 1
Cyanophyte Biomass 1962 ug C liter-1 1
Diatom Abundance 10.46 million cells liter-1 1
Diatom Biomass 310 ug C liter-1 1
Microcystis aeruginosa 0 million cells liter-1 null
Total Abundance 282.24 million cells liter-1 1
Total Biomass 3248 ug C liter-1 1
9/15/1999 SummerIBI_Method Evaluation IBI ScoreMethod A Fair-Good IBI Score = 3.7
Method B Fair-Good IBI Score = 3.7
Available Metrics Metric Values Metric Scores Chlorophyte Abundance 4.08 million cells liter-1 1 Cyanophyte Biomass 38 ug C liter-1 5

Appendix C - 36
Diatom Abundance 1.32 million cells liter-1 5 Diatom Biomass 93 ug C liter-1 5 Microcystis aeruginosa 0 million cells liter-1 null Total Abundance 16.86 million cells liter-1 5 Total Biomass 1079 ug C liter-1 1

Appendix C - 37
STATION KNGUPPER
Location: Kingman LakeLatitude: UNKNOWN; Longitude: UNKNOWN
Summary: Three (3) data records are available for Summer 1999. All have sufficient data to calculatethe phytoplankton IBIs. On average, the phytoplankton community appears to be in Fair-Poor condition. Total biomass of the community is dominated by the green taxonomic group in July, the bluegreen groupin August, and the dinoflagellate and euglenoid groups in September. The numerically-dominant taxawere the bluegreen taxa Agmenellum and Oscillatoria in all three months. The biomass-dominant taxawere several large unidentified centric and pennate diatoms, Melosira, and the euglenoid Phacus.
Status of Samples: Counted and discarded.
Sample Dates:7/16/1999 Summer
IBI_Method Evaluation IBI ScoreMethod A Poor IBI Score = 1.0
Method B Poor IBI Score = 1.0
Available Metrics Metric Values Metric Scores
Chlorophyte Abundance 10.82 million cells liter-1 1
Cyanophyte Biomass 486 ug C liter-1 1
Diatom Abundance 10.12 million cells liter-1 1
Diatom Biomass 455 ug C liter-1 1
Microcystis aeruginosa 0 million cells liter-1 null
Total Abundance 114.54 million cells liter-1 1
Total Biomass 1365 ug C liter-1 1
8/16/1999
Summer
IBI_Method Evaluation IBI ScoreMethod A Poor IBI Score = 1.0
Method B Poor IBI Score = 1.0
Available Metrics Metric Values Metric Scores
Chlorophyte Abundance 18.77 million cells liter-1 1
Cyanophyte Biomass 658 ug C liter-1 1
Diatom Abundance 9.13 million cells liter-1 1
Diatom Biomass 726 ug C liter-1 1
Microcystis aeruginosa 0 million cells liter-1 null
Total Abundance 121.26 million cells liter-1 1
Total Biomass 2997 ug C liter-1 1
9/15/1999
Summer
IBI_Method Evaluation IBI ScoreMethod A Fair-Good IBI Score = 3.7
Method B Fair-Good IBI Score = 3.7
Available Metrics Metric Values Metric Scores
Chlorophyte Abundance 0.99 million cells liter-1 5
Cyanophyte Biomass 218 ug C liter-1 1
Diatom Abundance 1.46 million cells liter-1 5

Appendix C - 38
Diatom Biomass 46 ug C liter-1 5
Microcystis aeruginosa 0 million cells liter-1 null
Total Abundance 54.77 million cells liter-1 1
Total Biomass 552 ug C liter-1 5

Appendix C - 39
STATION PMS01Location: Fletcher’s boathouse.Latitude: 38.91789; Longitude: -77.1047
2001 Summary: Three (3) Spring and three (3) Summer records from 2001 were available to calculatethe IBIs. Status of the phytoplankton community was highly variable, ranging from Poor to Good. Analgal bloom was evident in May and July. Total biomass of the community was dominated by the diatomtaxonomic group in March and April, by the green group in May, July, and September, and co-dominatedby the diatom and green groups in August. Bluegreens were never biomass-dominant as a group. Thespring phytoplankton communities were numerically dominated by a mixture of pennate and centricdiatom taxa and the bluegreen Oscillatoria, with several green taxa (Scenedesmus, Actinastrum) gainingimportance in May. C:Chl ratios and pheophytin levels indicate some light stress caused by turbidity. (Spring TSS concentrations averaged 28.7 mg liter-1; sufficient Seechi depth data are not available). Total biomass was only >551 :g C liter-1 (summer threshold for score equals “1") in July. July had anumerically diverse mixture of bluegreen, green, and diatom taxa but was biomass-dominated by thegreen taxa (Actinastrum, Coelastrum, Scenedesmus). August and September were numerically-dominanted by bluegreen taxa (Anabaena, Oscillatoria) and biomass-dominated by the green taxaScenedesmus and Ankistrodesmus. The nuisance bluegreen species Microcystis aeruginosa was neverevident.
Status of Samples: Counted and discarded.
Sample Dates:3/5/2001 Spring
IBI_Method Evaluation IBI ScoreMethod A Fair-Poor IBI Score = 2.5
Method B Fair IBI Score = 3.0
Available Metrics Metric Values Metric ScoreCarbon:Chlorophyll a Ratio 14.1 ratio 1
Surface Chlorophyll a 7.0 ug liter-1 5
Cyanophyte Biomass 10 ug C liter-1 Null
Pheophytin 1.6 ug liter-1 3
Total Biomass 99 ug C liter-1 1
Diatom Abundance 5.56 million cells liter-1 5
Total Abundance 7.19 million cells liter-1 Null
4/2/2001 Spring
IBI_Method Evaluation IBI ScoreMethod A Poor IBI Score = 1.8
Method B Fair-Poor IBI Score = 2.3
Available Metrics Metric Values Metric ScoreCarbon:Chlorophyll a Ratio 8.7 ratio 1
Surface Chlorophyll a 8.1 ug liter-1 5
Cyanophyte Biomass 26 ug C liter-1 1
Pheophytin 6.4 ug liter-1 1
Total Biomass 70 ug C liter-1 1
Diatom Abundance 2.39 million cells liter-1 5
Total Abundance 4.89 million cells liter-1 Null

Appendix C - 40
5/7/2001 Spring
IBI_Method Evaluation IBI ScoreMethod A Poor IBI Score = 2.0
Method B Fair-Poor IBI Score = 2.6
Available Metrics Metric Values Metric ScoreCarbon:Chlorophyll a Ratio 16.7 ratio 1
Surface Chlorophyll a 25.4 ug liter-1 1
Cyanophyte Biomass 0 ug C liter-1 Null
Pheophytin 7.2 ug liter-1 1
Total Biomass 424 ug C liter-1 5
Diatom Abundance 5.31 million cells liter-1 5
Total Abundance 15.27 million cells liter-1 Null
7/9/2001 Summer
IBI_Method Evaluation IBI ScoreMethod A Poor IBI Score = 1.0
Method B Poor IBI Score = 1.0
Available Metrics Metric Values Metric ScoreSurface Chlorophyll a 38.8 ug liter-1 1
Cyanophyte Biomass 143 ug C liter-1 1
Diatom Biomass 328 ug C liter-1 1
Pheophytin 19.8 ug liter-1 1
Total Biomass 1754 ug C liter-1 1
Microcystis aeruginosa 0 million cells liter-1 Null
Chlorophyte Abundance 37.52 million cells liter-1 1
Total Abundance 75.57 million cells liter-1 1
8/13/2001 Summer
IBI_Method Evaluation IBI ScoreMethod A Good IBI Score = 4.2
Method B Good IBI Score = 4.1
Available Metrics Metric Values Metric ScoreSurface Chlorophyll a 7.2 ug liter-1 5
Cyanophyte Biomass 24 ug C liter-1 5
Diatom Biomass 102 ug C liter-1 5
Pheophytin 7.3 ug liter-1 1
Total Biomass 240 ug C liter-1 5
Microcystis aeruginosa 0 million cells liter-1 Null
Chlorophyte Abundance 3.52 million cells liter-1 3
Total Abundance 20.03 million cells liter-1 5
9/10/2001 Summer
IBI_Method Evaluation IBI ScoreMethod A Fair-Good IBI Score = 3.8
Method B Fair-Good IBI Score = 3.9
Available Metrics Metric Values Metric ScoreSurface Chlorophyll a 2.7 ug liter-1 3
Cyanophyte Biomass 16 ug C liter-1 5

Appendix C - 41
Diatom Biomass 28 ug C liter-1 5
Pheophytin 3.3 ug liter-1 3
Total Biomass 133 ug C liter-1 3
Microcystis aeruginosa 0 million cells liter-1 Null
Chlorophyte Abundance 2.79 million cells liter-1 5
Total Abundance 9.1 million cells liter-1 3

Appendix C - 42
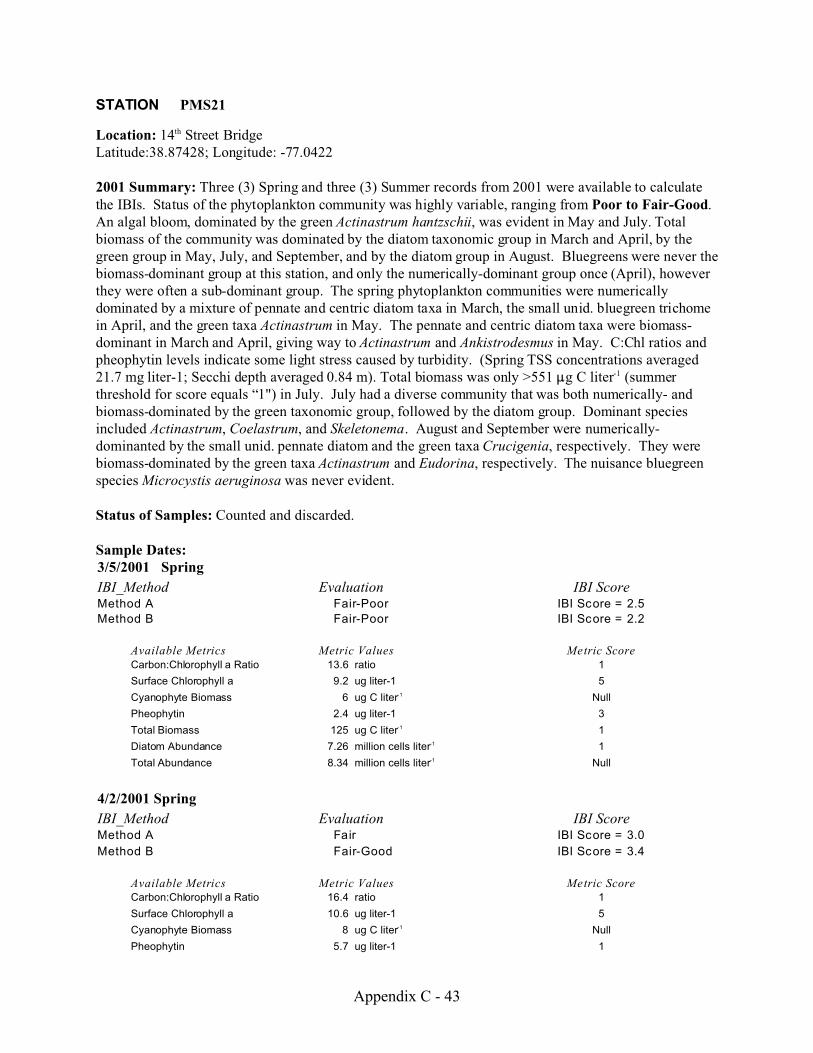
Appendix C - 43
STATION PMS21
Location: 14th Street BridgeLatitude:38.87428; Longitude: -77.0422
2001 Summary: Three (3) Spring and three (3) Summer records from 2001 were available to calculatethe IBIs. Status of the phytoplankton community was highly variable, ranging from Poor to Fair-Good. An algal bloom, dominated by the green Actinastrum hantzschii, was evident in May and July. Totalbiomass of the community was dominated by the diatom taxonomic group in March and April, by thegreen group in May, July, and September, and by the diatom group in August. Bluegreens were never thebiomass-dominant group at this station, and only the numerically-dominant group once (April), howeverthey were often a sub-dominant group. The spring phytoplankton communities were numericallydominated by a mixture of pennate and centric diatom taxa in March, the small unid. bluegreen trichomein April, and the green taxa Actinastrum in May. The pennate and centric diatom taxa were biomass-dominant in March and April, giving way to Actinastrum and Ankistrodesmus in May. C:Chl ratios andpheophytin levels indicate some light stress caused by turbidity. (Spring TSS concentrations averaged21.7 mg liter-1; Secchi depth averaged 0.84 m). Total biomass was only >551 :g C liter-1 (summerthreshold for score equals “1") in July. July had a diverse community that was both numerically- andbiomass-dominated by the green taxonomic group, followed by the diatom group. Dominant speciesincluded Actinastrum, Coelastrum, and Skeletonema. August and September were numerically-dominanted by the small unid. pennate diatom and the green taxa Crucigenia, respectively. They werebiomass-dominated by the green taxa Actinastrum and Eudorina, respectively. The nuisance bluegreenspecies Microcystis aeruginosa was never evident.
Status of Samples: Counted and discarded.
Sample Dates:3/5/2001 Spring
IBI_Method Evaluation IBI ScoreMethod A Fair-Poor IBI Score = 2.5
Method B Fair-Poor IBI Score = 2.2
Available Metrics Metric Values Metric ScoreCarbon:Chlorophyll a Ratio 13.6 ratio 1
Surface Chlorophyll a 9.2 ug liter-1 5
Cyanophyte Biomass 6 ug C liter-1 Null
Pheophytin 2.4 ug liter-1 3
Total Biomass 125 ug C liter-1 1
Diatom Abundance 7.26 million cells liter-1 1
Total Abundance 8.34 million cells liter-1 Null
4/2/2001 Spring
IBI_Method Evaluation IBI ScoreMethod A Fair IBI Score = 3.0
Method B Fair-Good IBI Score = 3.4
Available Metrics Metric Values Metric ScoreCarbon:Chlorophyll a Ratio 16.4 ratio 1
Surface Chlorophyll a 10.6 ug liter-1 5
Cyanophyte Biomass 8 ug C liter-1 Null
Pheophytin 5.7 ug liter-1 1

Appendix C - 44
Total Biomass 174 ug C liter-1 5
Diatom Abundance 2.58 million cells liter-1 5
Total Abundance 5.54 million cells liter-1 Null
5/7/2001 Spring
IBI_Method Evaluation IBI ScoreMethod A Poor IBI Score = 2.0
Method B Poor IBI Score = 1.8
Available Metrics Metric Values Metric ScoreCarbon:Chlorophyll a Ratio 19.6 ratio 1
Surface Chlorophyll a 25.8 ug liter-1 1
Cyanophyte Biomass 18 ug C liter-1 Null
Pheophytin 8.1 ug liter-1 1
Total Biomass 506 ug C liter-1 5
Diatom Abundance 0.82 million cells liter-1 1
Total Abundance 14.09 million cells liter-1 Null
7/9/2001 Summer
IBI_Method Evaluation IBI ScoreMethod A Poor IBI Score = 1.8
Method B Poor IBI Score = 1.6
Available Metrics Metric Values Metric ScoreSurface Chlorophyll a 40.4 ug liter-1 1
Cyanophyte Biomass 32 ug C liter-1 5
Diatom Biomass 500 ug C liter-1 1
Pheophytin 17.3 ug liter-1 1
Total Biomass 1,895 ug C liter-1 1
Microcystis aeruginosa 0 million cells liter-1 Null
Chlorophyte Abundance 32.18 million cells liter-1 1
Total Abundance 63.65 million cells liter-1 1
8/13/2001 Summer
IBI_Method Evaluation IBI ScoreMethod A Fair-Good IBI Score = 3.4
Method B Fair-Good IBI Score = 3.9
Available Metrics Metric Values Metric ScoreSurface Chlorophyll a 6.1 ug liter-1 5
Cyanophyte Biomass 52 ug C liter-1 3
Diatom Biomass 168 ug C liter-1 3
Pheophytin 4.9 ug liter-1 1
Total Biomass 322 ug C liter-1 5
Microcystis aeruginosa 0 million cells liter-1 Null
Chlorophyte Abundance 2.61 million cells liter-1 5
Total Abundance 22.79 million cells liter-1 5
9/10/2001 Summer
IBI_Method Evaluation IBI ScoreMethod A Fair IBI Score = 3.0
Method B Fair IBI Score = 3.0

Appendix C - 45
Available Metrics Metric Values Metric ScoreSurface Chlorophyll a 12.9 ug liter-1 1
Cyanophyte Biomass 10 ug C liter-1 5
Diatom Biomass 52 ug C liter-1 5
Pheophytin 6.4 ug liter-1 1
Total Biomass 227 ug C liter-1 3
Microcystis aeruginosa 0 million cells liter-1 Null
Chlorophyte Abundance 4 million cells liter-1 1
Total Abundance 13 million cells liter-1 5

Appendix C - 46

Appendix C - 47
STATION PMS37Location: 100m south of the Naval Research Lab pierLatitude: 38.82178; Longitude: -77.03109
2001 Summary: Three (3) Spring and three (3) Summer records from 2001 were available to calculatethe IBIs. Status of the phytoplankton community was highly variable, ranging from Poor to Fair-Good. An modest algal bloom composed of a diverse community dominated by the unidentified small centricdiatom was evident in July. Total biomass of the community was dominated by the diatom taxonomicgroup in March and April, co-dominated by the diatom and green groups in May and July, dominated bythe green group in August, and by diatoms again in September. Bluegreens were never the biomass-dominant group at this station, however they were numerically-dominant in August and September. Thespring phytoplankton communities were numerically- and biomass-dominated by a mixture of pennateand centric diatom taxa, with the green taxa Microactinium gaining importance in May. The smallcentric and pennate diatoms were the biomass-dominants in March and April; the diatom Synedra wasbiomass-dominant in May. C:Chl ratios and pheophytin levels indicate some light stress caused byturbidity. (Spring TSS concentrations averaged 33 mg liter-1; Secchi depth averaged 0.72 m). Totalbiomass was only >551 :g C liter-1 (summer threshold for score equals “1") in July. July had a diversecommunity that was both numerically- and biomass-dominated by the diatom taxonomic group. Thenumerical- and biomass-dominant taxa was the unidentified small centric diatom. August and Septemberwere numerically-dominanted by the bluegreen taxa Oscillatoria and Gloeothece, respectively. Themonths were biomass-dominated by the green taxa Ankistrodesmus and a large unidentified centricdiatom, respectively. The nuisance bluegreen species Microcystis aeruginosa was never evident.
Status of Samples: Counted and discarded.
Sample Dates:3/5/2001 Spring
IBI_Method Evaluation IBI ScoreMethod A Poor IBI Score = 2.0
Method B Fair-Poor IBI Score = 2.6
Available Metrics Metric Values Metric ScoreCarbon:Chlorophyll a Ratio 11.6 ratio 1
Surface Chlorophyll a 10.1 ug liter-1 5
Cyanophyte Biomass 0 ug C liter-1 Null
Pheophytin 4.7 ug liter-1 1
Total Biomass 117 ug C liter-1 1
Diatom Abundance 4.23 million cells liter-1 5
Total Abundance 4.7 million cells liter-1 Null
4/2/2001 Spring
IBI_Method Evaluation IBI ScoreMethod A Poor IBI Score = 1.5
Method B Fair-Poor IBI Score = 2.2
Available Metrics Metric Values Metric ScoreCarbon:Chlorophyll a Ratio 23.4 ratio 1
Surface Chlorophyll a 4.3 ug liter-1 3
Cyanophyte Biomass 1 ug C liter-1 Null
Pheophytin 4.7 ug liter-1 1
Total Biomass 101 ug C liter-1 1

Appendix C - 48
Diatom Abundance 3.95 million cells liter-1 5
Total Abundance 5.55 million cells liter-1 Null
5/7/2001 Spring
IBI_Method Evaluation IBI ScoreMethod A Fair-Poor IBI Score = 2.6
Method B Fair IBI Score = 3.0
Available Metrics Metric Values Metric ScoreCarbon:Chlorophyll a Ratio 30.5 ratio 1
Surface Chlorophyll a 11.0 ug liter-1 5
Cyanophyte Biomass 31 ug C liter-1 1
Pheophytin 10.7 ug liter-1 1
Total Biomass 336 ug C liter-1 5
Diatom Abundance 5.02 million cells liter-1 5
Total Abundance 13.51 million cells liter-1 Null
7/9/2001 Summer
IBI_Method Evaluation IBI ScoreMethod A Poor IBI Score = 1.4
Method B Poor IBI Score = 1.9
Available Metrics Metric Values Metric ScoreSurface Chlorophyll a 31.0 ug liter-1 1
Cyanophyte Biomass 59 ug C liter-1 3
Diatom Biomass 216 ug C liter-1 1
Pheophytin 16.4 ug liter-1 1
Total Biomass 599 ug C liter-1 1
Microcystis aeruginosa 0 million cells liter-1 Null
Chlorophyte Abundance 9.28 million cells liter-1 1
Total Abundance 25.25 million cells liter-1 5
8/13/2001 Summer
IBI_Method Evaluation IBI ScoreMethod A Fair-Good IBI Score = 3.8
Method B Good IBI Score = 4.1
Available Metrics Metric Values Metric ScoreSurface Chlorophyll a 5.9 ug liter-1 5
Cyanophyte Biomass 31 ug C liter-1 5
Diatom Biomass 36 ug C liter-1 5
Pheophytin 6.6 ug liter-1 1
Total Biomass 180 ug C liter-1 3
Microcystis aeruginosa 0 million cells liter-1 Null
Chlorophyte Abundance 2.31 million cells liter-1 5
Total Abundance 9.88 million cells liter-1 5
9/10/2001 Summer
IBI_Method Evaluation IBI ScoreMethod A Fair-Poor IBI Score = 2.2
Method B Fair IBI Score = 3.0

Appendix C - 49
Available Metrics Metric Values Metric ScoreSurface Chlorophyll a 20.4 ug liter-1 1
Cyanophyte Biomass 56 ug C liter-1 3
Diatom Biomass 139 ug C liter-1 3
Pheophytin 9.0 ug liter-1 1
Total Biomass 223 ug C liter-1 3
Microcystis aeruginosa 0 million cells liter-1 Null
Chlorophyte Abundance 0.33 million cells liter-1 5
Total Abundance 17.16 million cells liter-1 5

Appendix C - 50
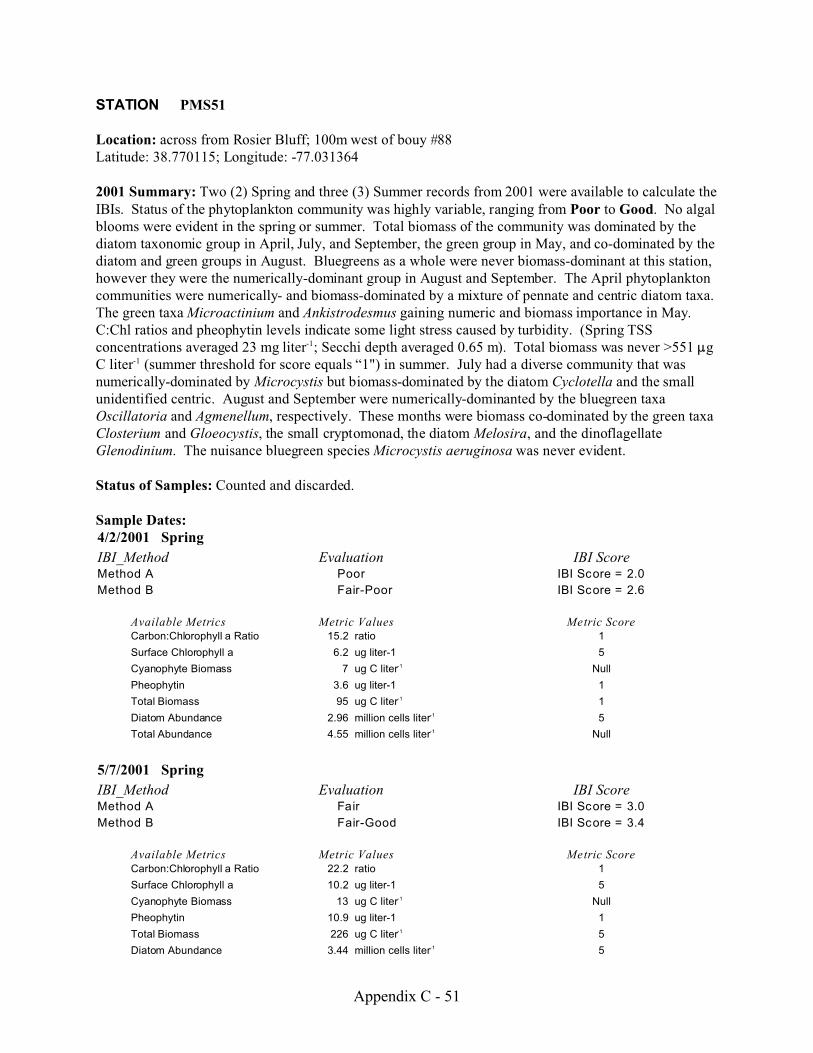
Appendix C - 51
STATION PMS51
Location: across from Rosier Bluff; 100m west of bouy #88Latitude: 38.770115; Longitude: -77.031364
2001 Summary: Two (2) Spring and three (3) Summer records from 2001 were available to calculate theIBIs. Status of the phytoplankton community was highly variable, ranging from Poor to Good. No algalblooms were evident in the spring or summer. Total biomass of the community was dominated by thediatom taxonomic group in April, July, and September, the green group in May, and co-dominated by thediatom and green groups in August. Bluegreens as a whole were never biomass-dominant at this station,however they were the numerically-dominant group in August and September. The April phytoplanktoncommunities were numerically- and biomass-dominated by a mixture of pennate and centric diatom taxa. The green taxa Microactinium and Ankistrodesmus gaining numeric and biomass importance in May. C:Chl ratios and pheophytin levels indicate some light stress caused by turbidity. (Spring TSSconcentrations averaged 23 mg liter-1; Secchi depth averaged 0.65 m). Total biomass was never >551 :gC liter-1 (summer threshold for score equals “1") in summer. July had a diverse community that wasnumerically-dominated by Microcystis but biomass-dominated by the diatom Cyclotella and the smallunidentified centric. August and September were numerically-dominanted by the bluegreen taxaOscillatoria and Agmenellum, respectively. These months were biomass co-dominated by the green taxaClosterium and Gloeocystis, the small cryptomonad, the diatom Melosira, and the dinoflagellateGlenodinium. The nuisance bluegreen species Microcystis aeruginosa was never evident.
Status of Samples: Counted and discarded.
Sample Dates:4/2/2001 Spring
IBI_Method Evaluation IBI ScoreMethod A Poor IBI Score = 2.0
Method B Fair-Poor IBI Score = 2.6
Available Metrics Metric Values Metric ScoreCarbon:Chlorophyll a Ratio 15.2 ratio 1
Surface Chlorophyll a 6.2 ug liter-1 5
Cyanophyte Biomass 7 ug C liter-1 Null
Pheophytin 3.6 ug liter-1 1
Total Biomass 95 ug C liter-1 1
Diatom Abundance 2.96 million cells liter-1 5
Total Abundance 4.55 million cells liter-1 Null
5/7/2001 Spring
IBI_Method Evaluation IBI ScoreMethod A Fair IBI Score = 3.0
Method B Fair-Good IBI Score = 3.4
Available Metrics Metric Values Metric ScoreCarbon:Chlorophyll a Ratio 22.2 ratio 1
Surface Chlorophyll a 10.2 ug liter-1 5
Cyanophyte Biomass 13 ug C liter-1 Null
Pheophytin 10.9 ug liter-1 1
Total Biomass 226 ug C liter-1 5
Diatom Abundance 3.44 million cells liter-1 5

Appendix C - 52
Total Abundance 10.55 million cells liter-1 Null
7/9/2001 Summer
IBI_Method Evaluation IBI ScoreMethod A Fair-Poor IBI Score = 2.6
Method B Fair IBI Score = 2.7
Available Metrics Metric Values Metric ScoreSurface Chlorophyll a 14.8 ug liter-1 1
Cyanophyte Biomass 7 ug C liter-1 5
Diatom Biomass 198 ug C liter-1 1
Pheophytin 12.8 ug liter-1 1
Total Biomass 362 ug C liter-1 5
Microcystis aeruginosa 0 million cells liter-1 Null
Chlorophyte Abundance 4.51 million cells liter-1 1
Total Abundance 11.86 million cells liter-1 5
8/13/2001 Summer
IBI_Method Evaluation IBI ScoreMethod A Good IBI Score = 4.2
Method B Good IBI Score = 4.4
Available Metrics Metric Values Metric ScoreSurface Chlorophyll a 8.5 ug liter-1 5
Cyanophyte Biomass 38 ug C liter-1 5
Diatom Biomass 113 ug C liter-1 5
Pheophytin 6.4 ug liter-1 1
Total Biomass 322 ug C liter-1 5
Microcystis aeruginosa 0 million cells liter-1 Null
Chlorophyte Abundance 1.79 million cells liter-1 5
Total Abundance 3.01 million cells liter-1 5
9/10/2001 Summer
IBI_Method Evaluation IBI ScoreMethod A Fair-Good IBI Score = 3.8
Method B Fair-Good IBI Score = 3.9
Available Metrics Metric Values Metric ScoreSurface Chlorophyll a 9.6 ug liter-1 5
Cyanophyte Biomass 16 ug C liter-1 5
Diatom Biomass 65 ug C liter-1 5
Pheophytin 5.8 ug liter-1 1
Total Biomass 119 ug C liter-1 3
Microcystis aeruginosa 0 million cells liter-1 Null
Chlorophyte Abundance 0.54 million cells liter-1 5
Total Abundance 8.46 million cells liter-1 3

Appendix C - 53
STATION PMS52Location: UNKNOWNLatitude: UNKNOWN; Longitude: UNKNOWN
2001 Summary: No records from 2001 were available to calculate the IBIs because of a lack ofcorresponding chlorophyll a and pheophytin data. Status of the phytoplankton community appeared to befairly Good based on the phytoplankton count information. No algal blooms were evident in the springor summer. Total biomass of the community was dominated by the diatom taxonomic group in March,April, and September, and by the green group in May, July, and August. Bluegreens as a group werenever biomass-dominant at this station, however they were a numerically co-dominant group in May andSeptember, and they and the cryptomonads were usually a significant presence. The March and Aprilphytoplankton communities were numerically- and biomass-dominated by a mixture of small unidentifiedpennate and centric diatom taxa. They were replaced by the numeric-dominant Agmenellum (bluegreen)and the biomass-dominants Ankistrodesmus and Actinastrum (greens) in May. No C:Chl ratios orpheophytin data are available. Total biomass was never >551 :g C liter-1 (summer threshold for scoreequals “1") in summer. July was numerically- and biomass-dominated by the green taxa Actinastrum. August was numerically-dominated by the small unidentified centric diatom, but biomass dominated bythe green Ankistrodesmus. Similarly, September was numerically-dominated by the bluegreen taxaOscillatoria but biomass-dominated by the small unidentified centric diatom. The nuisance bluegreenspecies Microcystis aeruginosa was never evident.
Status of Samples: Counted and discarded.
Sample Dates:3/5/2001 Spring
IBI_Method Evaluation IBI ScoreMethod A Too Few Data ND
Method B Too Few Data ND
Available Metrics Metric Values Metric ScoreCyanophyte Biomass 0 ug C liter-1 Null
Total Biomass 194 ug C liter-1 5
Diatom Abundance 4.92 million cells liter-1 5
Total Abundance 5.85 million cells liter-1 Null
4/2/2001 Spring
IBI_Method Evaluation IBI ScoreMethod A Too Few Data ND
Method B Too Few Data ND
Available Metrics Metric Values Metric ScoreCyanophyte Biomass 4 ug C liter-1 Null
Total Biomass 82 ug C liter-1 1
Diatom Abundance 3.85 million cells liter-1 5
Total Abundance 5.01 million cells liter-1 Null
5/7/2001 Spring
IBI_Method Evaluation IBI ScoreMethod A Too Few Data ND
Method B Too Few Data ND
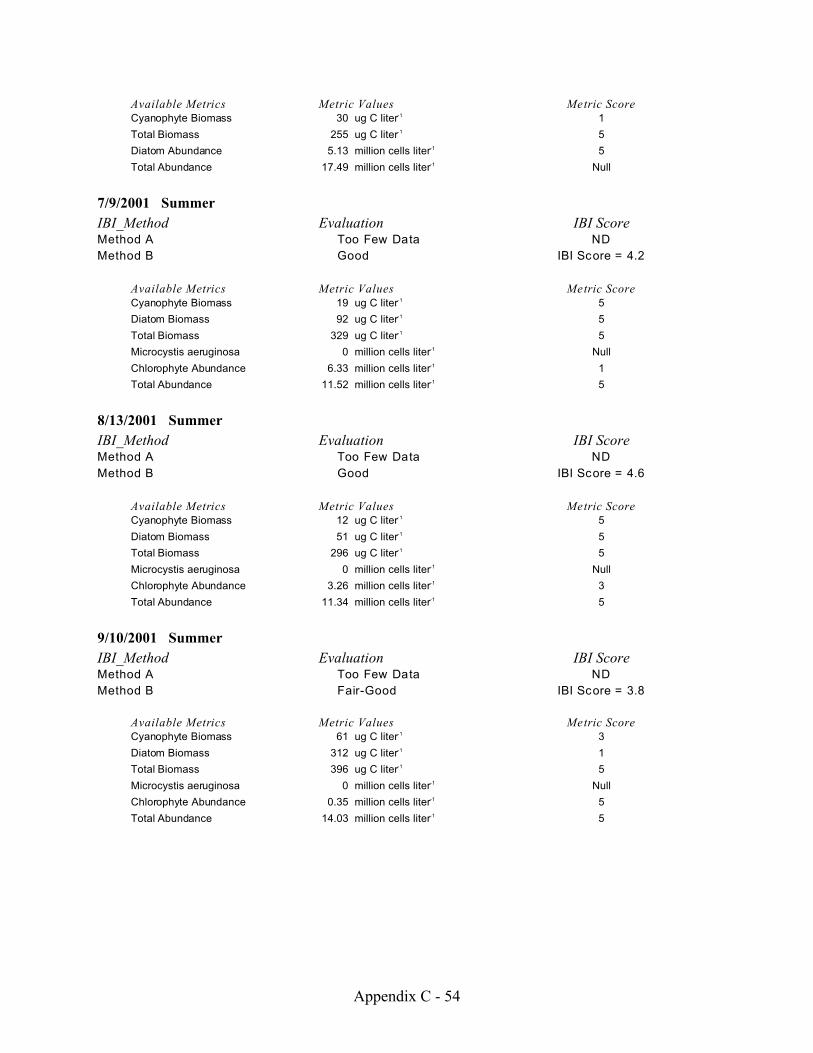
Appendix C - 54
Available Metrics Metric Values Metric ScoreCyanophyte Biomass 30 ug C liter-1 1
Total Biomass 255 ug C liter-1 5
Diatom Abundance 5.13 million cells liter-1 5
Total Abundance 17.49 million cells liter-1 Null
7/9/2001 Summer
IBI_Method Evaluation IBI ScoreMethod A Too Few Data ND
Method B Good IBI Score = 4.2
Available Metrics Metric Values Metric ScoreCyanophyte Biomass 19 ug C liter-1 5
Diatom Biomass 92 ug C liter-1 5
Total Biomass 329 ug C liter-1 5
Microcystis aeruginosa 0 million cells liter-1 Null
Chlorophyte Abundance 6.33 million cells liter-1 1
Total Abundance 11.52 million cells liter-1 5
8/13/2001 Summer
IBI_Method Evaluation IBI ScoreMethod A Too Few Data ND
Method B Good IBI Score = 4.6
Available Metrics Metric Values Metric ScoreCyanophyte Biomass 12 ug C liter-1 5
Diatom Biomass 51 ug C liter-1 5
Total Biomass 296 ug C liter-1 5
Microcystis aeruginosa 0 million cells liter-1 Null
Chlorophyte Abundance 3.26 million cells liter-1 3
Total Abundance 11.34 million cells liter-1 5
9/10/2001 Summer
IBI_Method Evaluation IBI ScoreMethod A Too Few Data ND
Method B Fair-Good IBI Score = 3.8
Available Metrics Metric Values Metric ScoreCyanophyte Biomass 61 ug C liter-1 3
Diatom Biomass 312 ug C liter-1 1
Total Biomass 396 ug C liter-1 5
Microcystis aeruginosa 0 million cells liter-1 Null
Chlorophyte Abundance 0.35 million cells liter-1 5
Total Abundance 14.03 million cells liter-1 5

Appendix C - 55
STATION PTB01
Location: Potomac tidal basin, off center of Constitution Avenue BridgeLatitude: 38.88706, Longitude: -77.03942
2001 Summary: Two (2) Spring and three (3) Summer records from 2001 were available to calculate theIBIs. Status of the phytoplankton community began as Fair-Good in March, but was Poor the rest of thespring and summer. A large algal bloom persisted from May through September, with total biomass>>551 :g C liter-1 (summer threshold for score equals “1") . Total biomass of the community wasdominated by the diatom taxonomic group in March, May, July and August, and shifted to the bluegreengroup by September. The March phytoplankton community was numerically- and biomass-dominated bya mixture of centric and pennate diatom taxa. The May and July communities were biomass-dominatedby the diatom taxa Cyclotella and the small unidentified centric but the months were numerically-dominated by the bluegreen taxa Oscillatoria and eventually Agmenellum and Microcystis. In August,Oscillatoria was both numerically- and biomass-dominant while Cyclotella and the small unidentifiedcentric were reduced to a sub-dominant role. September was completely dominated by bluegreen taxa,including Oscillatoria, Microcystis, Agmenellum, and Chroococcus. The nuisance bluegreen speciesMicrocystis aeruginosa was evident in August and was the numeric-dominant in September.
Status of Samples: Counted and discarded.
Sample Dates:3/13/2001 Spring
IBI_Method Evaluation IBI ScoreMethod A Fair-Good IBI Score = 3.5
Method B Fair IBI Score = 3.0
Available Metrics Metric Values Metric ScoreCarbon:Chlorophyll a Ratio 22.7 ratio 1
Surface Chlorophyll a 10.8 ug liter-1 5
Cyanophyte Biomass 1.4 ug C liter-1 Null
Pheophytin 2.5 ug liter-1 3
Total Biomass 245 ug C liter-1 5
Diatom Abundance 12.76 million cells liter-1 1
Total Abundance 14.4 million cells liter-1 Null
5/15/2001 Spring
IBI_Method Evaluation IBI ScoreMethod A Poor IBI Score = 1.4
Method B Poor IBI Score = 1.3
Available Metrics Metric Values Metric ScoreCarbon:Chlorophyll a Ratio 39.9 ratio 3
Surface Chlorophyll a 65.2 ug liter-1 1
Cyanophyte Biomass 214 ug C liter-1 1
Pheophytin 19.9 ug liter-1 1
Total Biomass 1,901 ug C liter-1 1
Diatom Abundance 26.78 million cells liter-1 1
Total Abundance 63.88 million cells liter-1 1
7/17/2001 Summer
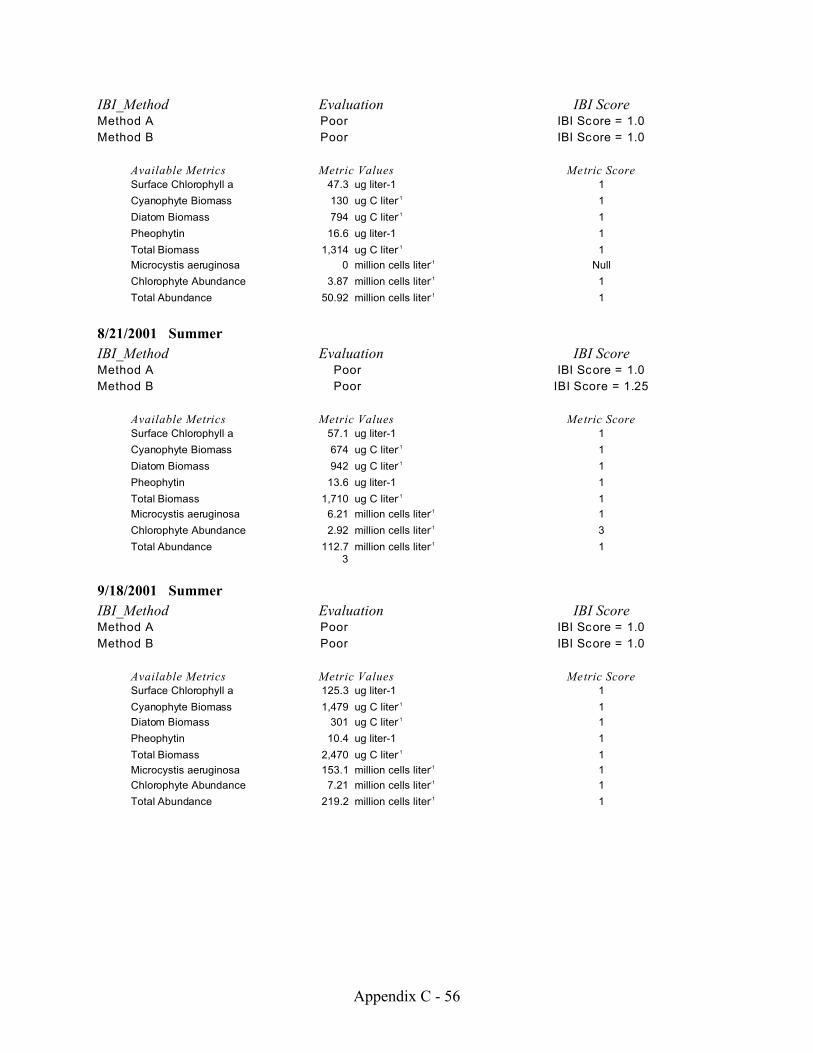
Appendix C - 56
IBI_Method Evaluation IBI ScoreMethod A Poor IBI Score = 1.0
Method B Poor IBI Score = 1.0
Available Metrics Metric Values Metric ScoreSurface Chlorophyll a 47.3 ug liter-1 1
Cyanophyte Biomass 130 ug C liter-1 1
Diatom Biomass 794 ug C liter-1 1
Pheophytin 16.6 ug liter-1 1
Total Biomass 1,314 ug C liter-1 1
Microcystis aeruginosa 0 million cells liter-1 Null
Chlorophyte Abundance 3.87 million cells liter-1 1
Total Abundance 50.92 million cells liter-1 1
8/21/2001 Summer
IBI_Method Evaluation IBI ScoreMethod A Poor IBI Score = 1.0
Method B Poor IBI Score = 1.25
Available Metrics Metric Values Metric ScoreSurface Chlorophyll a 57.1 ug liter-1 1
Cyanophyte Biomass 674 ug C liter-1 1
Diatom Biomass 942 ug C liter-1 1
Pheophytin 13.6 ug liter-1 1
Total Biomass 1,710 ug C liter-1 1
Microcystis aeruginosa 6.21 million cells liter-1 1
Chlorophyte Abundance 2.92 million cells liter-1 3
Total Abundance 112.73
million cells liter-1 1
9/18/2001 Summer
IBI_Method Evaluation IBI ScoreMethod A Poor IBI Score = 1.0
Method B Poor IBI Score = 1.0
Available Metrics Metric Values Metric ScoreSurface Chlorophyll a 125.3 ug liter-1 1
Cyanophyte Biomass 1,479 ug C liter-1 1
Diatom Biomass 301 ug C liter-1 1
Pheophytin 10.4 ug liter-1 1
Total Biomass 2,470 ug C liter-1 1
Microcystis aeruginosa 153.1 million cells liter-1 1
Chlorophyte Abundance 7.21 million cells liter-1 1
Total Abundance 219.2 million cells liter-1 1

Appendix C - 57
STATION PWC04
Location: Washington Channel off the Potomac and Anacostia riversLatitude: UNKNOWN; Longitude: UNKNOWN
2001 Summary: Two (2) Spring and two (2) Summer records from 2001 were available to calculate theIBIs. Status of the phytoplankton community began as Poor in spring and early summer, but was Fair-Good in August despite a high bluegreen biomass. A large algal bloom occurred in July but was gone byAugust. Total biomass of the community was co-dominated by the diatom and green taxonomic groups inApril and May, and dominated by the green group in July and the bluegreen group in August. The Apriland May phytoplankton communities were numerically-dominated by a mixture of centric and pennatediatom taxa and biomass-dominated by the green taxa Ankistrodesmus. In July, the community wasnumerically-dominated by the bluegreen taxa Coelosphaerium and Agmenellum and numerically-dominated by the diatom taxa Cyclotella, the small centric, and Aulacoseira granulata. In August,Oscillatoria was both numerically- and biomass-dominant. The nuisance bluegreen species Microcystisaeruginosa was evident in July but not in August.
Status of Samples: Counted and discarded.
Sample Dates:4/3/2001 Spring
IBI_Method Evaluation IBI ScoreMethod A Poor IBI Score = 2.0
Method B Fair-Poor IBI Score = 2.6
Available Metrics Metric Values Metric ScoreCarbon:Chlorophyll a Ratio 22.4 ratio 1
Surface Chlorophyll a 4.0 ug liter-1 3
Cyanophyte Biomass 0 ug C liter-1 Null
Pheophytin 1.7 ug liter-1 3
Total Biomass 90 ug C liter-1 1
Diatom Abundance 3 million cells liter-1 5
Total Abundance 4.56 million cells liter-1 Null
5/8/2001 Spring
IBI_Method Evaluation IBI ScoreMethod A Poor IBI Score = 2.0
Method B Fair-Poor IBI Score = 2.6
Available Metrics Metric Values Metric ScoreCarbon:Chlorophyll a Ratio 20.8 ratio 1
Surface Chlorophyll a 16.2 ug liter-1 1
Cyanophyte Biomass 8 ug C liter-1 Null
Pheophytin 7.8 ug liter-1 1
Total Biomass 338 ug C liter-1 5
Diatom Abundance 6.05 million cells liter-1 5
Total Abundance 13.12 million cells liter-1 Null
7/10/2001 Summer
IBI_Method Evaluation IBI ScoreMethod A Poor IBI Score = 1.0
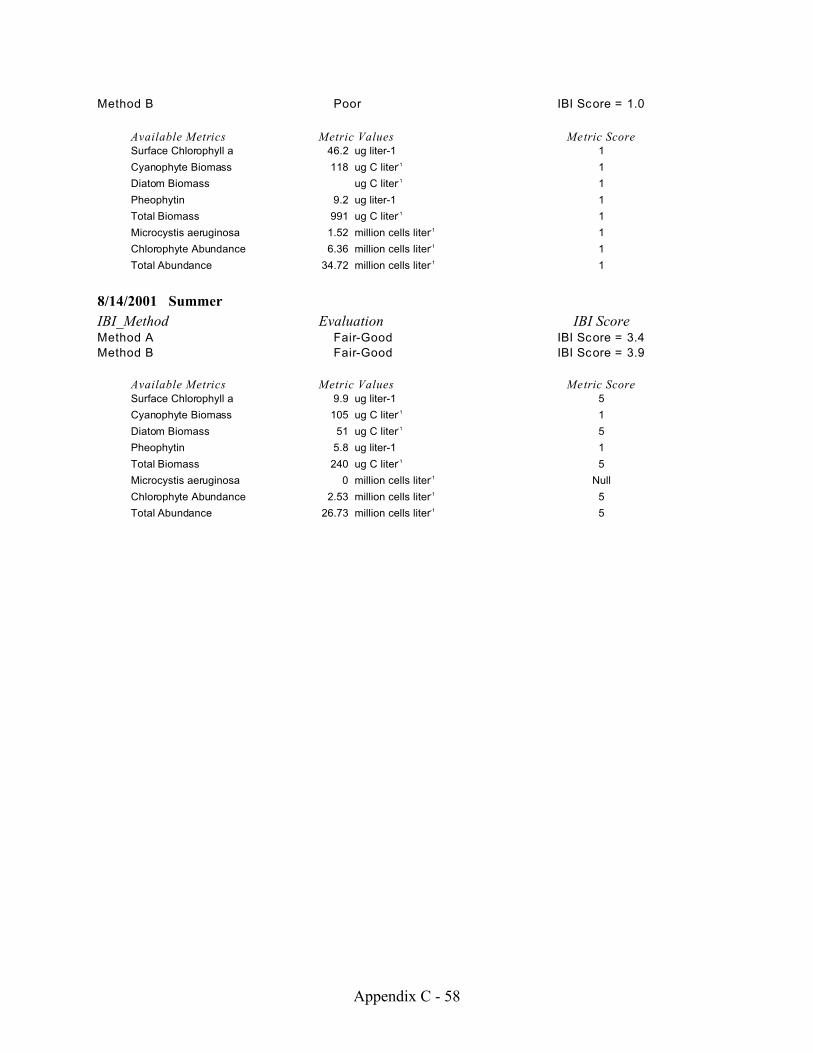
Appendix C - 58
Method B Poor IBI Score = 1.0
Available Metrics Metric Values Metric ScoreSurface Chlorophyll a 46.2 ug liter-1 1
Cyanophyte Biomass 118 ug C liter-1 1
Diatom Biomass ug C liter-1 1
Pheophytin 9.2 ug liter-1 1
Total Biomass 991 ug C liter-1 1
Microcystis aeruginosa 1.52 million cells liter-1 1
Chlorophyte Abundance 6.36 million cells liter-1 1
Total Abundance 34.72 million cells liter-1 1
8/14/2001 Summer
IBI_Method Evaluation IBI ScoreMethod A Fair-Good IBI Score = 3.4
Method B Fair-Good IBI Score = 3.9
Available Metrics Metric Values Metric ScoreSurface Chlorophyll a 9.9 ug liter-1 5
Cyanophyte Biomass 105 ug C liter-1 1
Diatom Biomass 51 ug C liter-1 5
Pheophytin 5.8 ug liter-1 1
Total Biomass 240 ug C liter-1 5
Microcystis aeruginosa 0 million cells liter-1 Null
Chlorophyte Abundance 2.53 million cells liter-1 5
Total Abundance 26.73 million cells liter-1 5
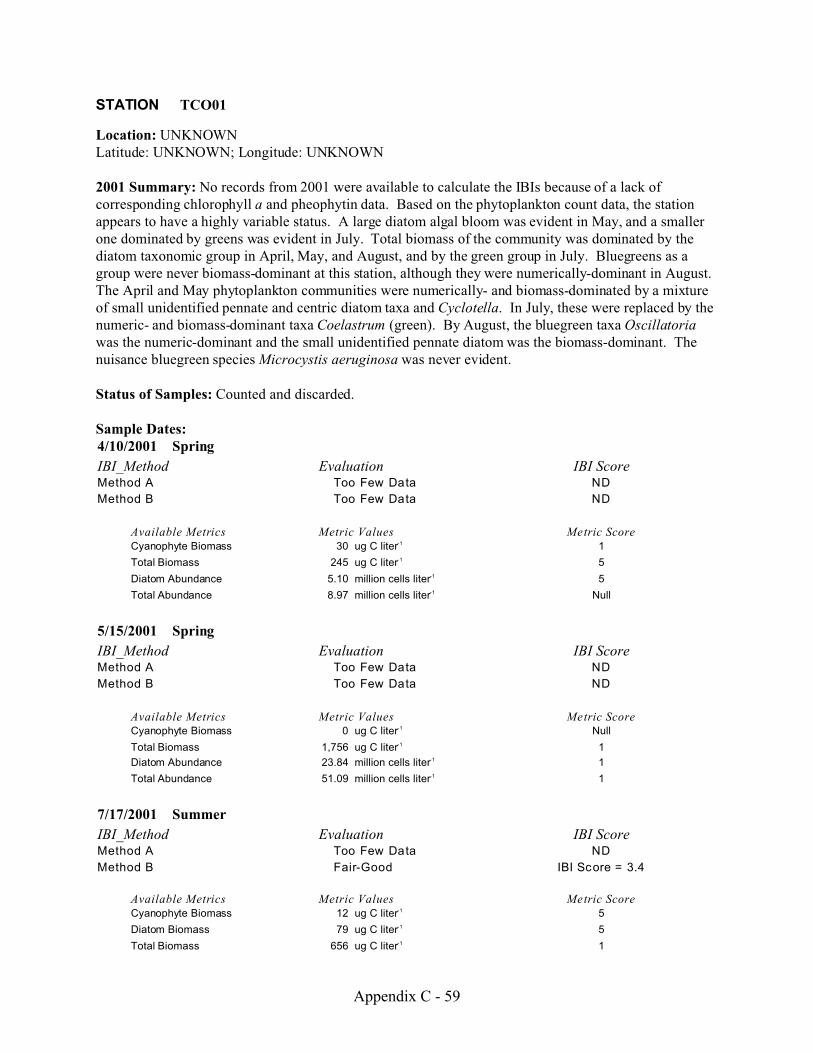
Appendix C - 59
STATION TCO01
Location: UNKNOWNLatitude: UNKNOWN; Longitude: UNKNOWN
2001 Summary: No records from 2001 were available to calculate the IBIs because of a lack ofcorresponding chlorophyll a and pheophytin data. Based on the phytoplankton count data, the stationappears to have a highly variable status. A large diatom algal bloom was evident in May, and a smallerone dominated by greens was evident in July. Total biomass of the community was dominated by thediatom taxonomic group in April, May, and August, and by the green group in July. Bluegreens as agroup were never biomass-dominant at this station, although they were numerically-dominant in August. The April and May phytoplankton communities were numerically- and biomass-dominated by a mixtureof small unidentified pennate and centric diatom taxa and Cyclotella. In July, these were replaced by thenumeric- and biomass-dominant taxa Coelastrum (green). By August, the bluegreen taxa Oscillatoriawas the numeric-dominant and the small unidentified pennate diatom was the biomass-dominant. Thenuisance bluegreen species Microcystis aeruginosa was never evident.
Status of Samples: Counted and discarded.
Sample Dates:4/10/2001 Spring
IBI_Method Evaluation IBI ScoreMethod A Too Few Data ND
Method B Too Few Data ND
Available Metrics Metric Values Metric ScoreCyanophyte Biomass 30 ug C liter-1 1
Total Biomass 245 ug C liter-1 5
Diatom Abundance 5.10 million cells liter-1 5
Total Abundance 8.97 million cells liter-1 Null
5/15/2001 Spring
IBI_Method Evaluation IBI ScoreMethod A Too Few Data ND
Method B Too Few Data ND
Available Metrics Metric Values Metric ScoreCyanophyte Biomass 0 ug C liter-1 Null
Total Biomass 1,756 ug C liter-1 1
Diatom Abundance 23.84 million cells liter-1 1
Total Abundance 51.09 million cells liter-1 1
7/17/2001 Summer
IBI_Method Evaluation IBI ScoreMethod A Too Few Data ND
Method B Fair-Good IBI Score = 3.4
Available Metrics Metric Values Metric ScoreCyanophyte Biomass 12 ug C liter-1 5
Diatom Biomass 79 ug C liter-1 5
Total Biomass 656 ug C liter-1 1

Appendix C - 60
Microcystis aeruginosa 0 million cells liter-1 Null
Chlorophyte Abundance 10.25 million cells liter-1 1
Total Abundance 22.70 million cells liter-1 5
8/21/2001 Summer
IBI_Method Evaluation IBI ScoreMethod A Too Few Data ND
Method B Fair-Good IBI Score = 3.8
Available Metrics Metric Values Metric ScoreCyanophyte Biomass 51 ug C liter-1 3
Diatom Biomass 237 ug C liter-1 1
Total Biomass 347 ug C liter-1 5
Microcystis aeruginosa 0 million cells liter-1 Null
Chlorophyte Abundance 1.00 million cells liter-1 5
Total Abundance 17.17 million cells liter-1 5

Appendix C - 61
STATION TCO06
Location: UNKNOWNLatitude: UNKNOWN; Longitude: UNKNOWN
2001 Summary: No records from 2001 were available to calculate the IBIs because of a lack ofcorresponding chlorophyll a and pheophytin data. Based on the phytoplankton count data, the stationappears to have a highly variable status. A large algal bloom was evident in May, and a smaller one wasevident in July. Total biomass of the community was dominated by the diatom taxonomic group in Apriland August, co-dominated by the diatom and green groups in May, and dominated by the greens in July. Bluegreens as a group were never biomass-dominant at this station, although they were numerically-dominant in August. The April phytoplankton community was numerically- and biomass-dominated bythe small unidentified centric diatom taxa and Cyclotella. The May community was numerically-dominated by Micractinium pusillum but biomass-dominated by the small unidentified centric diatomtaxa and Cyclotella. In July, these were replaced by the numeric- and biomass-dominant taxa Coelastrum(green). By August, the bluegreen taxa Agmenellum and Aphanocapsa were the numeric-dominants andthe diatom taxa Melosira was the biomass-dominant. The nuisance bluegreen species Microcystisaeruginosa was never evident.
Status of Samples: Counted and discarded.
Sample Dates:4/10/2001 Spring
IBI_Method Evaluation IBI ScoreMethod A Too Few Data ND
Method B Too Few Data ND
Available Metrics Metric Values Metric ScoreCyanophyte Biomass 0 ug C liter-1 Null
Total Biomass 205 ug C liter-1 5
Diatom Abundance 7.17 million cells liter-1 1
Total Abundance 7.88 million cells liter-1 Null
5/15/2001 Spring
IBI_Method Evaluation IBI ScoreMethod A Too Few Data ND
Method B Poor IBI Score = 1.0
Available Metrics Metric Values Metric ScoreCyanophyte Biomass 99 ug C liter-1 1
Total Biomass 2,449 ug C liter-1 1
Diatom Abundance 22.37 million cells liter-1 1
Total Abundance 70.60 million cells liter-1 1
7/17/2001 Summer
IBI_Method Evaluation IBI ScoreMethod A Too Few Data ND
Method B Fair IBI Score = 3.0
Available Metrics Metric Values Metric ScoreCyanophyte Biomass 16 ug C liter-1 5
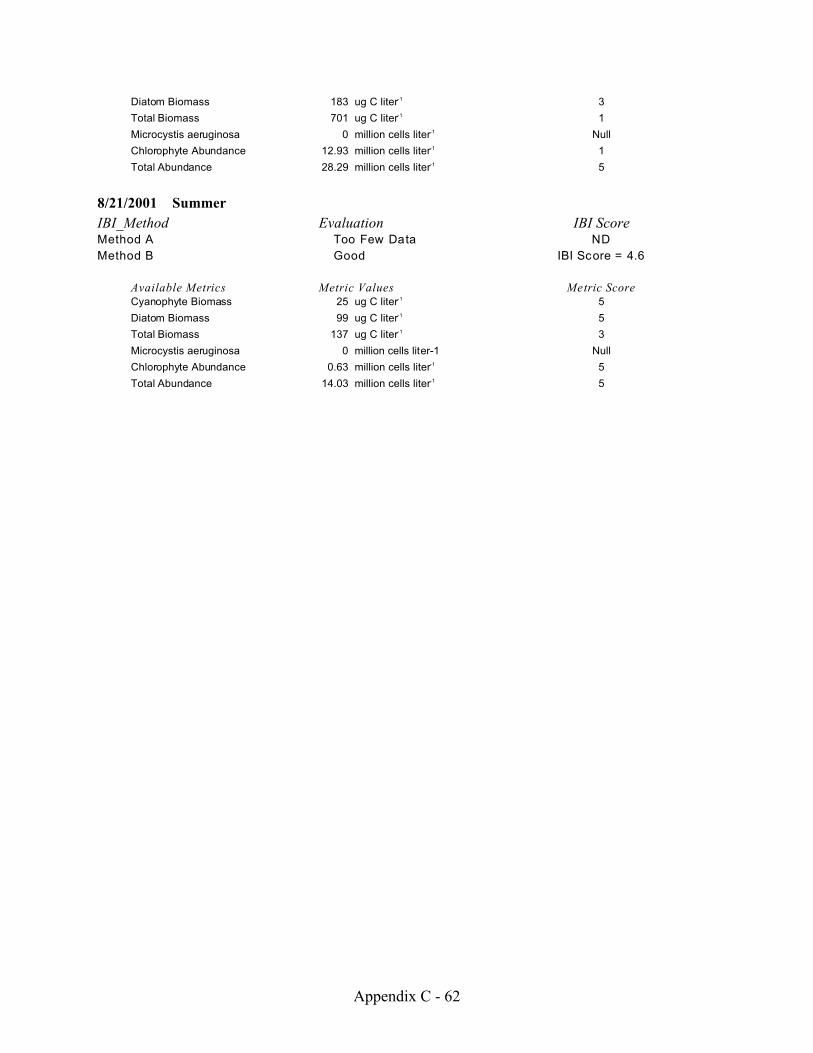
Appendix C - 62
Diatom Biomass 183 ug C liter-1 3
Total Biomass 701 ug C liter-1 1
Microcystis aeruginosa 0 million cells liter-1 Null
Chlorophyte Abundance 12.93 million cells liter-1 1
Total Abundance 28.29 million cells liter-1 5
8/21/2001 Summer
IBI_Method Evaluation IBI ScoreMethod A Too Few Data ND
Method B Good IBI Score = 4.6
Available Metrics Metric Values Metric ScoreCyanophyte Biomass 25 ug C liter-1 5
Diatom Biomass 99 ug C liter-1 5
Total Biomass 137 ug C liter-1 3
Microcystis aeruginosa 0 million cells liter-1 Null
Chlorophyte Abundance 0.63 million cells liter-1 5
Total Abundance 14.03 million cells liter-1 5

Appendix D - 1
Appendix D
Spring and Summer Zooplankton IndexesStation Summaries

Appendix D - 2
Appendix D Table of Contents
Spring Food Availability Indexes . . . . . . . . . . . . . . . . . . . . . . . . . . . . . . . . . . . . . Appendix D - 3
Summer Zooplankton Abundances . . . . . . . . . . . . . . . . . . . . . . . . . . . . . . . . . . . . Appendix D - 4

Appendix D - 3
Spring Food Availability Indexes
Station ANA 14Location: Pennsylvania Ave, Marina South Dock, District of Columbia Latitude: 38.877335, Longitude: -76.97553geometric mean: 3,146 m-3 (Poor)range: 111 m-3 (Poor) - 21,706 m-3 (Minimal)(n = 6)
Station PMS 10Location: upstream of Key Bridge, District of ColumbiaLatitude: 38.902332; Longitude: -77.06942geometric mean: 93 m-3 (Poor) range: 12 m-3 (Poor) - 214 m-3 (Poor)(n = 6)
Station PMS 37Location: 100 m south of Naval Research Laboratory pier, District of ColumbiaLatitude: 38.82178; Longitude: -77.03109geometric mean: 481 m-3 (Poor) range: 135 m-3 (Poor) - 1,027 m-3 (Poor)(n = 5)
For comparison purposes, food availability index values in the Potomac River downstream of the Districtare presented. The values are calculated from 2000 - 2001 spring mesozooplankton samples collected forthe Maryland Department of Natural Resources.
Station TF2.3Location: bouy N 54 in midchannel off Indian Head, MarylandLatitude: 38.608173; Longitude: -77.17387geometric mean: 23,131 m-3 (Minimal)range: 3,505 m-3 (Poor) - 549,679 m-3 (Optimal)(n = 12)
Station TF2.4Location: bouy 44 between Possum Pt. and Moss Pt.Latitude: 38.529842; Longitude: -77.26526geometric mean: 14,702 m-3 (Below-Minimal)range: 3,163 m-3 (Poor) - 337,231 m-3 (Optimal)(n = 10)

Appendix D - 4
Summer Zooplankton AbundancesStation Summaries
Station ANA 14Location: Pennsylvania Ave, Marina South Dock, District of Columbia Latitude: 38.877335, Longitude: -76.97553geometric mean: 618 m-3
range: 161 m-3 - 14,321 m-3
(n = 5, Yr: 2000, 2001)
Stations King Lower and King UpperLocation: unknown (Kingman Lake)Latitude: unknown; Longitude: unknowngeometric mean: 249 m-3
range: 15 m-3 - 3,787 m-3
(n=6, Yr: 1999)
Station PMS 10Location: upstream of Key Bridge, District of ColumbiaLatitude: 38.902332; Longitude: -77.06942geometric mean: 37 m-3
range: 5 m-3 - 74 m-3 (n = 6, Yr: 2000, 2001)
Station PMS 37Location: 100 m south of Naval Research Laboratory pier, District of ColumbiaLatitude: 38.82178; Longitude: -77.03109geometric mean: 296 m-3
range: 105 m-3 - 1,552 m-3
(n = 6, Yr: 2000, 2001)
For comparison purposes, food availability index values in the Potomac River downstream of the Districtare presented. The values are calculated from 2000 - 2001 summer mesozooplankton samples collectedfor the Maryland Department of Natural Resources.
Station TF2.3Location: bouy N 54 in midchannel off Indian Head, MarylandLatitude: 38.608173; Longitude: -77.17387geometric mean: 26,871 m-3
range: 9,248 m-3 - 67,054 m-3
(n = 6, Yr: 2000, 2001)

Appendix E - 1
Appendix E
Stream Macrobenthic Invertebrate Indexes of Biotic IntegrityStation Summaries
Appendix E - 2
Appendix E Table of Contents
Broad Branch . . . . . . . . . . . . . . . . . . . . . . . . . . . . . . . . . . . . . . . . . . . . . . . . . . . . . . . . . . . . Appendix E - 3Dunbarton Oaks . . . . . . . . . . . . . . . . . . . . . . . . . . . . . . . . . . . . . . . . . . . . . . . . . . . . . . . . . . Appendix E - 4Klingle Valley . . . . . . . . . . . . . . . . . . . . . . . . . . . . . . . . . . . . . . . . . . . . . . . . . . . . . . . . . . . Appendix E - 5Popes (3 of 4) . . . . . . . . . . . . . . . . . . . . . . . . . . . . . . . . . . . . . . . . . . . . . . . . . . . . . . . . . . . . Appendix E - 6Sheila’s Lost Stream . . . . . . . . . . . . . . . . . . . . . . . . . . . . . . . . . . . . . . . . . . . . . . . . . . . . . . Appendix E - 7TPB01 . . . . . . . . . . . . . . . . . . . . . . . . . . . . . . . . . . . . . . . . . . . . . . . . . . . . . . . . . . . . . . . . . Appendix E - 8TDA01 . . . . . . . . . . . . . . . . . . . . . . . . . . . . . . . . . . . . . . . . . . . . . . . . . . . . . . . . . . . . . . . . . Appendix E - 9TDU01 . . . . . . . . . . . . . . . . . . . . . . . . . . . . . . . . . . . . . . . . . . . . . . . . . . . . . . . . . . . . . . . . Appendix E - 10TFC01 . . . . . . . . . . . . . . . . . . . . . . . . . . . . . . . . . . . . . . . . . . . . . . . . . . . . . . . . . . . . . . . . Appendix E - 11TFD01 . . . . . . . . . . . . . . . . . . . . . . . . . . . . . . . . . . . . . . . . . . . . . . . . . . . . . . . . . . . . . . . . Appendix E - 12TFE01 . . . . . . . . . . . . . . . . . . . . . . . . . . . . . . . . . . . . . . . . . . . . . . . . . . . . . . . . . . . . . . . . Appendix E - 13TFS01 . . . . . . . . . . . . . . . . . . . . . . . . . . . . . . . . . . . . . . . . . . . . . . . . . . . . . . . . . . . . . . . . . Appendix E - 14THR02 . . . . . . . . . . . . . . . . . . . . . . . . . . . . . . . . . . . . . . . . . . . . . . . . . . . . . . . . . . . . . . . . Appendix E - 15TNA01 . . . . . . . . . . . . . . . . . . . . . . . . . . . . . . . . . . . . . . . . . . . . . . . . . . . . . . . . . . . . . . . . Appendix E - 16TNS01 . . . . . . . . . . . . . . . . . . . . . . . . . . . . . . . . . . . . . . . . . . . . . . . . . . . . . . . . . . . . . . . . Appendix E - 17TPB01 . . . . . . . . . . . . . . . . . . . . . . . . . . . . . . . . . . . . . . . . . . . . . . . . . . . . . . . . . . . . . . . . Appendix E - 18TPB01 (1 of 4) . . . . . . . . . . . . . . . . . . . . . . . . . . . . . . . . . . . . . . . . . . . . . . . . . . . . . . . . . . Appendix E - 19TPB01 (4 of 4) . . . . . . . . . . . . . . . . . . . . . . . . . . . . . . . . . . . . . . . . . . . . . . . . . . . . . . . . . . Appendix E - 20TPI01 . . . . . . . . . . . . . . . . . . . . . . . . . . . . . . . . . . . . . . . . . . . . . . . . . . . . . . . . . . . . . . . . . Appendix E - 21Upper Watts . . . . . . . . . . . . . . . . . . . . . . . . . . . . . . . . . . . . . . . . . . . . . . . . . . . . . . . . . . . . Appendix E - 22Watts Branch (Lower) . . . . . . . . . . . . . . . . . . . . . . . . . . . . . . . . . . . . . . . . . . . . . . . . . . . . Appendix E - 23
Note: Where possible, waterbody name was determined from the station name provided by the District ofColumbia.

Appendix E - 3
STATION Broad BranchWaterbody Name/Location Broad Branch
Latitude: 38.94563; Longitude: -77.051183
Collection Date 10/21/1998
Metric Group Metric Name Metric Value
DC EPT Taxa 1
DC Hilsenhoff Biotic Index 5DC Hydropsychidae/EPT 100DC Percent Chironomidae 14.29DC Percent Collectors 14.29DC Percent Dominance 57.14DC Percent EPT 57.14DC Percent Shredders 28.57DC Scrapers/Scrapers+Filterers 0DC Taxonomic Richness 3DC Trichoptera Taxa 1RBP Clinger Taxa 1
RBP EPT Taxa 1RBP Intolerant Taxa 0RBP Percent Clingers 57.14RBP Percent Dominance 57.14RBP Percent Ephemeroptera 0RBP Percent EPT 57.14RBP Percent Filterers 57.14RBP Percent Tolerant 14.29RBP PercentScrapers 0RBP Plecoptera Taxa 0RBP Taxonomic Richness 3RBP Trichoptera Taxa 1
Taxonomist Comments:Sample was in very poor shape, mostly disintegrated. The few specimens that could be identified were.
Analyst Comments: Metric values from this site suggest that the benthic community may be in Fair-Poor condition. While Percent Dominance andPercent Chironomidae were low, Percent EPT was moderately high, and Percent Tolerant organisms was low, the Hilsenhoff BioticIndex was moderately high. and Taxonomic Richness was extremely low. More data are needed to confirm this evaluation.

Appendix E - 4
STATION Dumbarton OaksWaterbody Name/Location
Latitude: 38.91547; Longitude: -77.06098
Collection Date 11/4/1998
Taxonomist Comments:The sample was in an extremely poor state of preservation; a soup of stinky brown goo. The sample was in too poor a shape toidentify any taxa.
Analyst Comments:Benthic community condition could not be evaluated for this site.

Appendix E - 5
STATION Klingle ValleyWaterbody Name/Location
Latitude: 38.93352; Longitude: -77.05307
Collection Date 10/22/1998
Metric Group Metric Name Metric Value
DC EPT Taxa 1
DC Hilsenhoff Biotic Index 6DC Hydropsychidae/EPT 100DC Percent Chironomidae 25DC Percent Collectors 45DC Percent Dominance 35DC Percent EPT 10DC Percent Shredders 35DC Scrapers/Scrapers+Filterers 0DC Taxonomic Richness 7DC Trichoptera Taxa 1RBP Clinger Taxa 2
RBP EPT Taxa 1RBP Intolerant Taxa 0RBP Percent Clingers 15RBP Percent Dominance 35RBP Percent Ephemeroptera 0RBP Percent EPT 10RBP Percent Filterers 15RBP Percent Tolerant 45RBP PercentScrapers 0RBP Plecoptera Taxa 0RBP Taxonomic Richness 7RBP Trichoptera Taxa 1
Taxonomist Comments: Sample was in fair preservation condition. One Oligochaeta was missing head and left uncounted.
Analyst Comments: Metric values from this site suggest that the benthic community may be in Good-Fair condition. Taxonomic Richness was high andboth Percent Chironomidae and Percent Dominance were low. The presence of 2 Clinger taxa may indicate good-quality instreamconditions. More data are needed to confirm this evaluation.

Appendix E - 6
STATION Popes (3 of 4)Waterbody Name/Location Popes Branch (3 of 4)
Latitude: unknown; Longitude: unknown
Collection Date 10/29/1998
Metric Group Metric Name Metric Value
DC EPT Taxa 0
DC Hilsenhoff Biotic Index 7.67DC Hydropsychidae/EPT 0DC Percent Chironomidae 77.14DC Percent Collectors 99.4DC Percent Dominance 77.14DC Percent EPT 0DC Percent Shredders 0.2DC Scrapers/Scrapers+Filterers 0DC Taxonomic Richness 4DC Trichoptera Taxa 0RBP Clinger Taxa 0
RBP EPT Taxa 0RBP Intolerant Taxa 0RBP Percent Clingers 0RBP Percent Dominance 77.14RBP Percent Ephemeroptera 0RBP Percent EPT 0RBP Percent Filterers 0RBP Percent Tolerant 99.8RBP PercentScrapers 0.4RBP Plecoptera Taxa 0RBP Taxonomic Richness 4RBP Trichoptera Taxa 0
Taxonomist Comments:This is one of the group of four samples that make up Popes Branch collection on 10-29-98. The bottle had "Popes 3 of 4" affixedto it, but the sample also had a paper label inside with "tpb01" written on it. The sample was so full of Tubificidae/Chironomidaethat it was quartered, by eye, and these two families were counted from that subsample.
Analyst Comments: Metric values from this site suggest that the benthic community may be in Very Poor condition. Taxonomic Richness was low,while Percent Dominance and Percent Tolerant organisms were extremely high. More data are needed to confirm this evaluation.
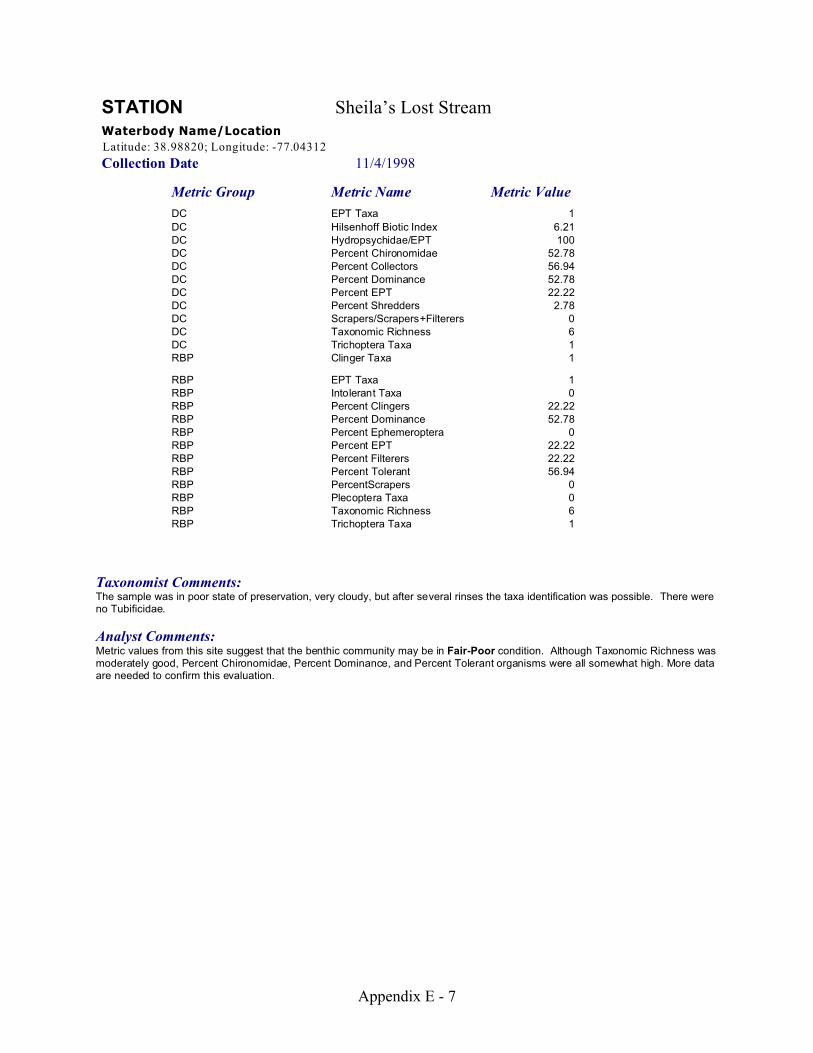
Appendix E - 7
STATION Sheila’s Lost StreamWaterbody Name/Location
Latitude: 38.98820; Longitude: -77.04312
Collection Date 11/4/1998
Metric Group Metric Name Metric Value
DC EPT Taxa 1
DC Hilsenhoff Biotic Index 6.21DC Hydropsychidae/EPT 100DC Percent Chironomidae 52.78DC Percent Collectors 56.94DC Percent Dominance 52.78DC Percent EPT 22.22DC Percent Shredders 2.78DC Scrapers/Scrapers+Filterers 0DC Taxonomic Richness 6DC Trichoptera Taxa 1RBP Clinger Taxa 1
RBP EPT Taxa 1RBP Intolerant Taxa 0RBP Percent Clingers 22.22RBP Percent Dominance 52.78RBP Percent Ephemeroptera 0RBP Percent EPT 22.22RBP Percent Filterers 22.22RBP Percent Tolerant 56.94RBP PercentScrapers 0RBP Plecoptera Taxa 0RBP Taxonomic Richness 6RBP Trichoptera Taxa 1
Taxonomist Comments: The sample was in poor state of preservation, very cloudy, but after several rinses the taxa identification was possible. There wereno Tubificidae.
Analyst Comments: Metric values from this site suggest that the benthic community may be in Fair-Poor condition. Although Taxonomic Richness wasmoderately good, Percent Chironomidae, Percent Dominance, and Percent Tolerant organisms were all somewhat high. More dataare needed to confirm this evaluation.

Appendix E - 8
STATION TPB011
Waterbody Name/Location Popes Branch (2 of 4)
Latitude: 38.87743; Longitude: -76.96617
Collection Date 10/29/1998
Metric Group Metric Name Metric Value
DC EPT Taxa 0
DC Hilsenhoff Biotic Index 9.65DC Hydropsychidae/EPT 0DC Percent Chironomidae 9.68DC Percent Collectors 98.39DC Percent Dominance 88.71DC Percent EPT 0DC Percent Shredders 0.81DC Scrapers/Scrapers+Filterers 0DC Taxonomic Richness 4DC Trichoptera Taxa 0RBP Clinger Taxa 0
RBP EPT Taxa 0RBP Intolerant Taxa 0RBP Percent Clingers 0RBP Percent Dominance 88.71RBP Percent Ephemeroptera 0RBP Percent EPT 0RBP Percent Filterers 0RBP Percent Tolerant 99.19RBP PercentScrapers 0RBP Plecoptera Taxa 0RBP Taxonomic Richness 4RBP Trichoptera Taxa 0
Taxonomist Comments:
The sample was in fair-poor preservation condition. The Tubificida colony's number of individuals was estimated due to
fragmention/disintegration of sample. There were fragments of Cambaridae which were not included in the count.
Analyst Comments: Metric values from this site suggest that the benthic community may be in Very Poor condition. Taxonomic Richness was low, andPercent Dominance, Percent Tolerant organisms, and the Hilsenhoff Biotic Index were extremely high. More data are needed toconfirm this evaluation.
1 Label on bottle read tbp01.

Appendix E - 9
STATION TDA01Waterbody Name Dalecarlia
Latitude: 38.94667; Longitude: -77.10650
Collection Date 11/12/1998
Taxonomist Comments: Sample was in very poor state of preservation, taxa could not be sufficiently identified.
Analyst Comments: Benthic community condition could not be evaluated for this site.
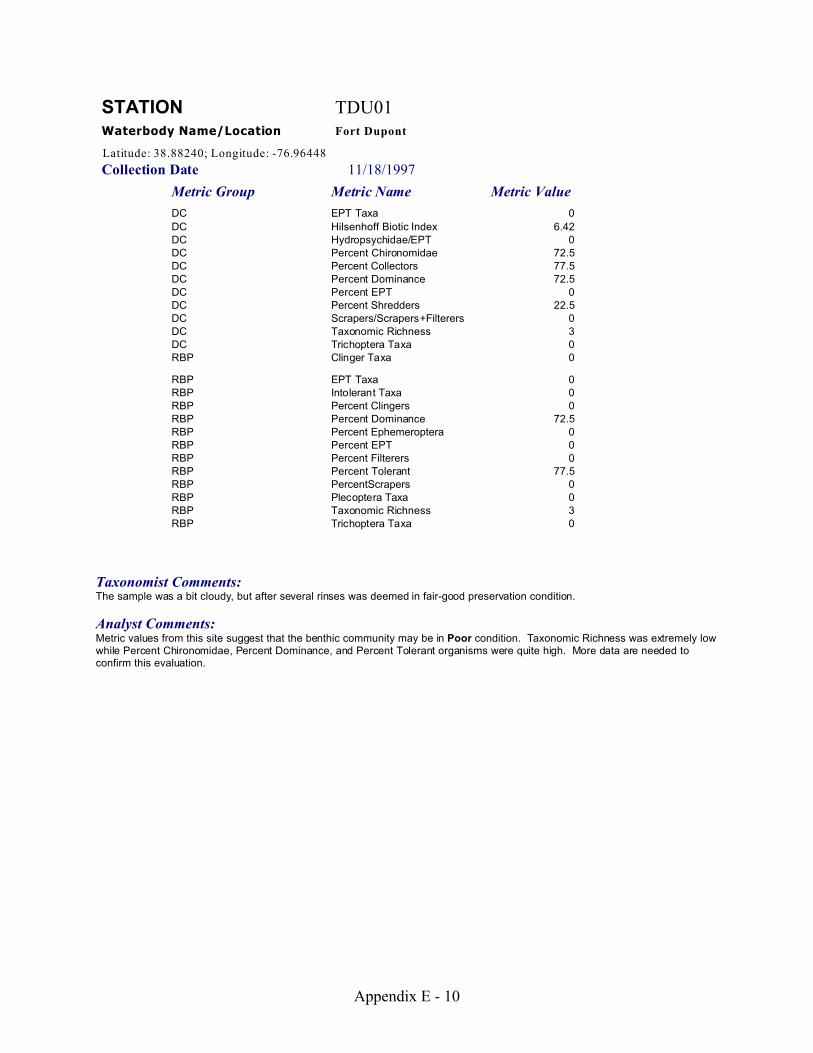
Appendix E - 10
STATION TDU01Waterbody Name/Location Fort Dupont
Latitude: 38.88240; Longitude: -76.96448
Collection Date 11/18/1997
Metric Group Metric Name Metric Value
DC EPT Taxa 0
DC Hilsenhoff Biotic Index 6.42DC Hydropsychidae/EPT 0DC Percent Chironomidae 72.5DC Percent Collectors 77.5DC Percent Dominance 72.5DC Percent EPT 0DC Percent Shredders 22.5DC Scrapers/Scrapers+Filterers 0DC Taxonomic Richness 3DC Trichoptera Taxa 0RBP Clinger Taxa 0
RBP EPT Taxa 0RBP Intolerant Taxa 0RBP Percent Clingers 0RBP Percent Dominance 72.5RBP Percent Ephemeroptera 0RBP Percent EPT 0RBP Percent Filterers 0RBP Percent Tolerant 77.5RBP PercentScrapers 0RBP Plecoptera Taxa 0RBP Taxonomic Richness 3RBP Trichoptera Taxa 0
Taxonomist Comments: The sample was a bit cloudy, but after several rinses was deemed in fair-good preservation condition.
Analyst Comments: Metric values from this site suggest that the benthic community may be in Poor condition. Taxonomic Richness was extremely lowwhile Percent Chironomidae, Percent Dominance, and Percent Tolerant organisms were quite high. More data are needed toconfirm this evaluation.

Appendix E - 11
STATION TFC01Waterbody Name/Location Fort Chaplin
Latitude: 38.86807; Longitude: -76.95875
Collection Date 11/19/1997
Taxonomist Comments:Sample was not preserved well, had completely spoiled, no identifications possible due to deterioration of sample.
Analyst Comments:Benthic community condition could not be evaluated for this site.

Appendix E - 12
STATION TFD01Waterbody Name/Location Ft. Davis
Latitude: 38.86832; Longitude: -76.95825
Collection Date 11/19/1997
Metric Group Metric Name Metric Value
DC EPT Taxa 1
DC Hilsenhoff Biotic Index 6.64DC Hydropsychidae/EPT 100DC Percent Chironomidae 80.41DC Percent Collectors 83.51DC Percent Dominance 80.41DC Percent EPT 7.22DC Percent Shredders 5.15DC Scrapers/Scrapers+Filterers 0DC Taxonomic Richness 5DC Trichoptera Taxa 1RBP Clinger Taxa 1
RBP EPT Taxa 1RBP Intolerant Taxa 0RBP Percent Clingers 7.22RBP Percent Dominance 80.41RBP Percent Ephemeroptera 0RBP Percent EPT 7.22RBP Percent Filterers 7.22RBP Percent Tolerant 83.51RBP PercentScrapers 0RBP Plecoptera Taxa 0RBP Taxonomic Richness 5RBP Trichoptera Taxa 1
Taxonomist Comments:The sample was in a poor state of preservation and specimens were very fragemented. The Chironomidae were counted by heads. There was a piece of rotted white paper inside the jar, but no writing was discernible.
Analyst Comments: Metric values from this site suggest that the benthic community may be in Poor condition. Taxonomic Richness was fair, althoughPercent Dominance, Percent Tolerant organisms, and Percent Chironomidae were quite high. More data are needed to confirm thisevaluation.

Appendix E - 13
STATION TFE01Waterbody Name/Location
Latitude: 38.98845; Longitude: -77.04280
Collection Date 11/21/1998
Metric Group Metric Name Metric Value
DC EPT Taxa 1
DC Hilsenhoff Biotic Index 5.26DC Hydropsychidae/EPT 100DC Percent Chironomidae 1.72DC Percent Collectors 4.31DC Percent Dominance 90.52DC Percent EPT 90.52DC Percent Shredders 0.86DC Scrapers/Scrapers+Filterers 0DC Taxonomic Richness 5DC Trichoptera Taxa 1RBP Clinger Taxa 1
RBP EPT Taxa 1RBP Intolerant Taxa 0RBP Percent Clingers 90.52RBP Percent Dominance 90.52RBP Percent Ephemeroptera 0RBP Percent EPT 90.52RBP Percent Filterers 90.52RBP Percent Tolerant 8.62RBP PercentScrapers 0RBP Plecoptera Taxa 0RBP Taxonomic Richness 5RBP Trichoptera Taxa 1
Taxonomist Comments:Sample was in very poor condition, mostly fragments, apparently due to sample preparation. Smell was very bad. Hydropsychidaecounted by heads only. .
Analyst Comments: Metric values from this site suggest that the benthic community may be in Fair-Poor condition. Taxonomic Richness was fair andPercent Dominance was very high. However, Percent EPT was high and the Hilsenhoff Biotic Index Percent Tolerant organismswas quite low. More data are needed to confirm this evaluation.

Appendix E - 14
STATION TFS01Waterbody Name/Location Ft. Stanton
Latitude: 38.86402; Longitude: -76.97675
Collection Date 10/29/1998
Metric Group Metric Name Metric Value
DC EPT Taxa 0
DC Hilsenhoff Biotic Index 6.97DC Hydropsychidae/EPT 0DC Percent Chironomidae 32.35DC Percent Collectors 52.94DC Percent Dominance 32.35DC Percent EPT 0DC Percent Shredders 8.82DC Scrapers/Scrapers+Filterers 0DC Taxonomic Richness 9DC Trichoptera Taxa 0RBP Clinger Taxa 0
RBP EPT Taxa 0RBP Intolerant Taxa 0RBP Percent Clingers 0RBP Percent Dominance 32.35RBP Percent Ephemeroptera 0RBP Percent EPT 0RBP Percent Filterers 11.76RBP Percent Tolerant 64.71RBP PercentScrapers 0RBP Plecoptera Taxa 0RBP Taxonomic Richness 9RBP Trichoptera Taxa 0
Taxonomist Comments:The sample was very cloudy but was able to evaluate after rinsing several times. The paper label that was inside the sample jarwas deteriorated but readible. There were no Trichoptera, which seemed odd. The sample also included three terrestrial ants.
Analyst Comments: Metric values from this site suggest that the benthic community may be in Fair condition. Taxonomic Richness was good andPercent Chironomidae and Percent Dominance were low. More data are needed to confirm this evaluation.
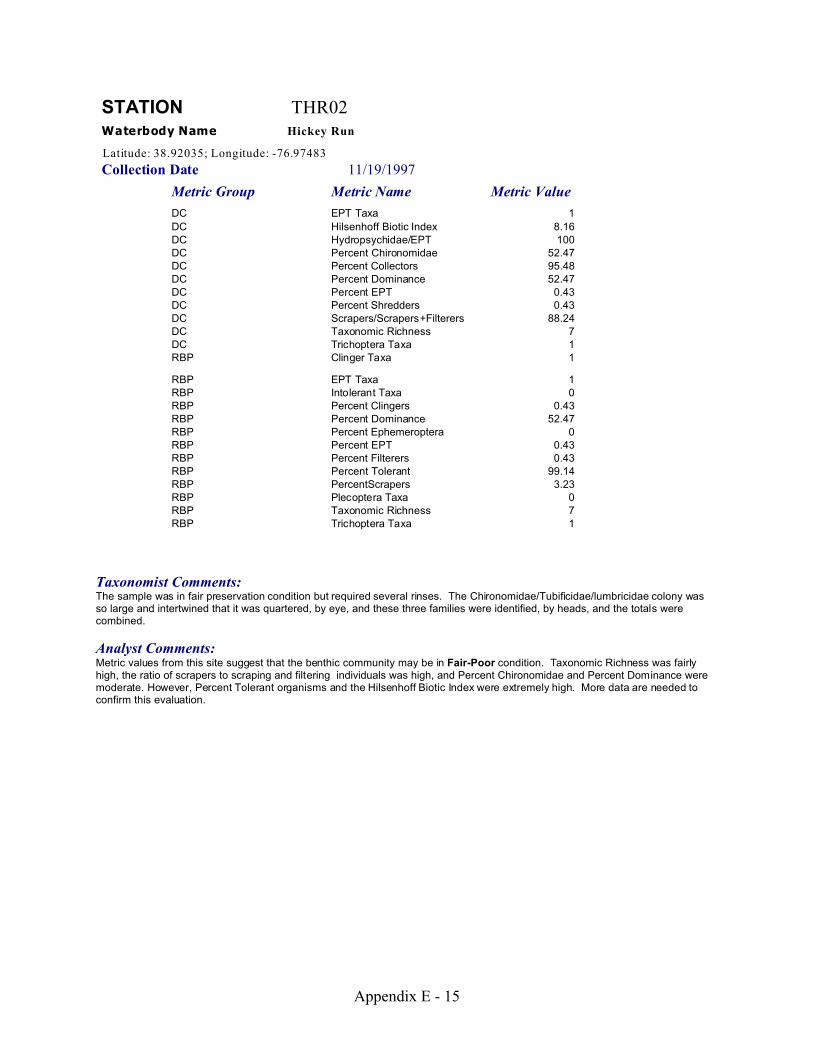
Appendix E - 15
STATION THR02Waterbody Name Hickey Run
Latitude: 38.92035; Longitude: -76.97483
Collection Date 11/19/1997
Metric Group Metric Name Metric Value
DC EPT Taxa 1
DC Hilsenhoff Biotic Index 8.16DC Hydropsychidae/EPT 100DC Percent Chironomidae 52.47DC Percent Collectors 95.48DC Percent Dominance 52.47DC Percent EPT 0.43DC Percent Shredders 0.43DC Scrapers/Scrapers+Filterers 88.24DC Taxonomic Richness 7DC Trichoptera Taxa 1RBP Clinger Taxa 1
RBP EPT Taxa 1RBP Intolerant Taxa 0RBP Percent Clingers 0.43RBP Percent Dominance 52.47RBP Percent Ephemeroptera 0RBP Percent EPT 0.43RBP Percent Filterers 0.43RBP Percent Tolerant 99.14RBP PercentScrapers 3.23RBP Plecoptera Taxa 0RBP Taxonomic Richness 7RBP Trichoptera Taxa 1
Taxonomist Comments:The sample was in fair preservation condition but required several rinses. The Chironomidae/Tubificidae/lumbricidae colony wasso large and intertwined that it was quartered, by eye, and these three families were identified, by heads, and the totals werecombined.
Analyst Comments: Metric values from this site suggest that the benthic community may be in Fair-Poor condition. Taxonomic Richness was fairlyhigh, the ratio of scrapers to scraping and filtering individuals was high, and Percent Chironomidae and Percent Dominance weremoderate. However, Percent Tolerant organisms and the Hilsenhoff Biotic Index were extremely high. More data are needed toconfirm this evaluation.

Appendix E - 16
STATION TNA01Waterbody Name/Location Tributary Nosh
Latitude: 38.91005; Longitude: -76.94117
Collection Date 10/28/1998
Taxonomist Comments:The sample was in very poor shape, had deteriorated too greatly to identify taxa.
Analyst Comments: Benthic community condition could not be evaluated for this site.

Appendix E - 17
STATION TNS01Waterbody Name/Location Norman Stone
Latitude: 38.92020; Longitude: -77.05672
Collection Date 10/22/1998
Metric Group Metric Name Metric Value
DC EPT Taxa 1
DC Hilsenhoff Biotic Index 8.05DC Hydropsychidae/EPT 100DC Percent Chironomidae 10.53DC Percent Collectors 84.21DC Percent Dominance 73.68DC Percent EPT 5.26DC Percent Shredders 10.53DC Scrapers/Scrapers+Filterers 0DC Taxonomic Richness 4DC Trichoptera Taxa 1RBP Clinger Taxa 1
RBP EPT Taxa 1RBP Intolerant Taxa 0RBP Percent Clingers 5.26RBP Percent Dominance 73.68RBP Percent Ephemeroptera 0RBP Percent EPT 5.26RBP Percent Filterers 5.26RBP Percent Tolerant 84.21RBP PercentScrapers 0RBP Plecoptera Taxa 0RBP Taxonomic Richness 4RBP Trichoptera Taxa 1
Taxonomist Comments:Sample was in a fair state of preservation.
Analyst Comments: Metric values from this site suggest that the benthic community may be in Very Poor condition. Taxonomic richness was low, andPercent Dominance, Percent Tolerant organisms, and the Hilsenhoff Biotic Index were quite high. More data are needed to confirmthis evaluation.

Appendix E - 18
STATION TPB01Waterbody Name/Location Popes Branch (2 of 4)
Latitude: 38.87743; Longitude: -76.96617
Collection Date 10/29/1998
Metric Group Metric Name Metric Value
DC EPT Taxa 0
DC Hilsenhoff Biotic Index 9.65DC Hydropsychidae/EPT 0DC Percent Chironomidae 9.68DC Percent Collectors 98.39DC Percent Dominance 88.71DC Percent EPT 0DC Percent Shredders 0.81DC Scrapers/Scrapers+Filterers 0DC Taxonomic Richness 4DC Trichoptera Taxa 0RBP Clinger Taxa 0
RBP EPT Taxa 0RBP Intolerant Taxa 0RBP Percent Clingers 0RBP Percent Dominance 88.71RBP Percent Ephemeroptera 0RBP Percent EPT 0RBP Percent Filterers 0RBP Percent Tolerant 99.19RBP PercentScrapers 0RBP Plecoptera Taxa 0RBP Taxonomic Richness 4RBP Trichoptera Taxa 0
Taxonomist Comments:Sample was in fair-poor shape. Tubificidae's number of individuals was estimated due to fragmentation/disintegration of sample.
Analyst Comments: Metric values from this site suggest that the benthic community may be in Very Poor condition. Taxonomic Richness was low, andPercent Dominance, Percent Tolerant organisms, and the Hilsenhoff Biotic Index were extremely high. More data are needed toconfirm this evaluation.

Appendix E - 19
STATION TPB01 (1 of 4)Waterbody Name/Location Popes Branch (1 of 4)
Latitude: 38.87743; Longitude: -76.96617
Collection Date 10/29/1998
Taxonomist Comments:Sample was in very poor state of preservation. Could only roughly identify two taxa, Oligochaeta and Tubificidae, but all were sofragmented and dissolved that individuals could not be identified/counted with any degree of certainty.
Analyst Comments: Benthic community condition could not be evaluated for this site.

Appendix E - 20
STATION TPB01 (4 of 4)Waterbody Name/Location Popes Branch (4 of 4)
Latitude: 38.87743; Longitude: -76.96617
Collection Date 10/29/1998
Metric Group Metric Name Metric Value
DC EPT Taxa 0
DC Hilsenhoff Biotic Index 8.04DC Hydropsychidae/EPT 0DC Percent Chironomidae 61.6DC Percent Collectors 94.35DC Percent Dominance 61.6DC Percent EPT 0DC Percent Shredders 0DC Scrapers/Scrapers+Filterers 92.86DC Taxonomic Richness 5DC Trichoptera Taxa 0RBP Clinger Taxa 0
RBP EPT Taxa 0RBP Intolerant Taxa 0RBP Percent Clingers 0RBP Percent Dominance 61.6RBP Percent Ephemeroptera 0RBP Percent EPT 0RBP Percent Filterers 0.39RBP Percent Tolerant 99.81RBP PercentScrapers 5.07RBP Plecoptera Taxa 0RBP Taxonomic Richness 5RBP Trichoptera Taxa 0
Taxonomist Comments:The sample was in a fair state of preservation. The Chironomidae/Tubificidae were so large an intertwined colony that they werequartered, by eye, and these two families were identified and counted from that subsample and their total numbers were derived.
Analyst Comments: Metric values from this site suggest that the benthic community may be in Fair-Poor condition. Taxonomic Richness was fair andPercent Dominance was moderate. There was a high ratio of scapers to scraping and filtering individuals. However, PercentTolerant organisms and the Hilsenhoff Biotic Index were extremely high. More data are needed to confirm this evaluation.

Appendix E - 21
STATION TPI01Waterbody Name/Location Pinehurst Tributary
Latitude: 38.97137; Longitude: -77.04412
Collection Date 10/21/1998
Metric Group Metric Name Metric Value
DC EPT Taxa 1
DC Hilsenhoff Biotic Index 5DC Hydropsychidae/EPT 100DC Percent Chironomidae 0DC Percent Collectors 0DC Percent Dominance 50DC Percent EPT 50DC Percent Shredders 0DC Scrapers/Scrapers+Filterers 0DC Taxonomic Richness 2DC Trichoptera Taxa 1RBP Clinger Taxa 1
RBP EPT Taxa 1RBP Intolerant Taxa 0RBP Percent Clingers 50RBP Percent Dominance 50RBP Percent Ephemeroptera 0RBP Percent EPT 50RBP Percent Filterers 50RBP Percent Tolerant 0RBP PercentScrapers 0RBP Plecoptera Taxa 0RBP Taxonomic Richness 2RBP Trichoptera Taxa 1
Taxonomist Comments:There were only two specimens in the sample.
Analyst Comments: Benthic community condition could not be evaluated for this site due to extremely low organism abundance and Taxa Richness.

Appendix E - 22
STATION Upper WattsWaterbody Name/Location Upper W atts Branch
Latitude: 38.89255; Longitude: -76.91562
Collection Date 10/28/1998
Metric Group Metric Name Metric Value
DC EPT Taxa 1
DC Hilsenhoff Biotic Index 7.38DC Hydropsychidae/EPT 100DC Percent Chironomidae 79.17DC Percent Collectors 95.83DC Percent Dominance 79.17DC Percent EPT 4.17DC Percent Shredders 0DC Scrapers/Scrapers+Filterers 0DC Taxonomic Richness 4DC Trichoptera Taxa 1RBP Clinger Taxa 1
RBP EPT Taxa 1RBP Intolerant Taxa 0RBP Percent Clingers 4.17RBP Percent Dominance 79.17RBP Percent Ephemeroptera 0RBP Percent EPT 4.17RBP Percent Filterers 4.17RBP Percent Tolerant 95.83RBP PercentScrapers 0RBP Plecoptera Taxa 0RBP Taxonomic Richness 4RBP Trichoptera Taxa 1
Taxonomist Comments:The paper label inside the sample jar had deteriorated so badly that the site/sample name could not be determined with 100%certainty by the taxa identifier. There was what appeared to be a 1 cm by 2.5 cm piece of cotton in the sample jar. A terrestrialspider was also in the sample.
Analyst Comments: Metric values from this site suggest that the benthic community may be in Poor condition. Taxonomic Richness was low, andPercent Dominance, Percent Tolerant organisms, and the Hilsenhoff Biotic Index were high. More data are needed to confirm thisevaluation.

Appendix E - 23
STATION Watts Branch (Lower)Waterbody Name/Location Lower Watts Branch
Latitude: 38.90768; Longitude: -76.95297
Collection Date 10/7/1998
Metric Group Metric Name Metric Value
DC EPT Taxa 1
DC Hilsenhoff Biotic Index 7.71DC Hydropsychidae/EPT 0DC Percent Chironomidae 64.29DC Percent Collectors 95.24DC Percent Dominance 64.29DC Percent EPT 2.38DC Percent Shredders 0DC Scrapers/Scrapers+Filterers 0DC Taxonomic Richness 6DC Trichoptera Taxa 0RBP Clinger Taxa 0
RBP EPT Taxa 1RBP Intolerant Taxa 1RBP Percent Clingers 0RBP Percent Dominance 64.29RBP Percent Ephemeroptera 2.38RBP Percent EPT 2.38RBP Percent Filterers 0RBP Percent Tolerant 95.24RBP PercentScrapers 0RBP Plecoptera Taxa 0RBP Taxonomic Richness 6RBP Trichoptera Taxa 0
Taxonomist Comments:The sample was in poor-fair shape. Many specimens were in fragments, identifications were often based upon heads. ALeptophlebiidae mayfly was in very poor shape but was able to be identified. The Empididae dance fly was kept by taxa identifier.
Analyst Comments: Metric values from this site suggest that the benthic community may be in Fair-Poor condition. Taxonomic Richness wasmoderate and 1 Intolerant Taxon was identified. However, Percent Dominance and the Hilsenhoff Biotic Index were rather high, andPercent Tolerant organisms was quite high. More data are needed to confirm this evaluation.


Appendix F
Quality Assurance Plan for Stream Macrobenthic Invertebrate Counts
This QA Plan describes the procedures followed by Interstate Commission on the Potomac RiverBasin staff for identifying and enumerating the District of Columbia stream macrobenthicinvertebrate samples collected in 1997 and 1998. The preserved samples were obtain fromDistrict of Columbia staff. Samples were emptied into an 8" x 10" white enamel dish, and allindividuals in each sample were enumerated. All taxa were identified to the lowest possibletaxonomic level. Identifications were made at 40x magnification with a dissecting scope. Counts and identifications were performed by a trained ICPRB staff member, Jim Cummins. Mr.Cummins’ skill in identifying stream macrobenthic invertebrates has been periodically retested inprograms offered by the Maryland Biological Stream Survey and the Pennsylvania Department ofEnvironmental Quality.


Appendix G
Manuscript submitted to the journal “Estuaries,” May 2005
Phytoplankton Index of Biotic Integrity for Chesapeake Bay and its Tidal Tributariesby Richard V. Lacouture, Jacqueline M. Johnson, Claire Buchanan, and Harold G. Marshall