tb. - apps.dtic.mil
TRANSCRIPT
AFGL-TR-82-011.7otb.
INTERFEROMETRIC OBSERVATIONS OFSOLAR FLARE PRECURSORS AT 10.6 GHZ
G.J. HurfordH. Zirin
California Institute of Technology1201 E. California Blvd.Pasadena, California 91125
Final ReportOctober 1980 - January 1982
March 1982
Approved for public release; distribution unlimited
0-DTIC* AIR FORCE GEOPHYSICS LABORATORY
AIR FORCE SYSTEMS COMMANDCt UNITED STATES AIR FORCE iELECTEI_ HANSCOM AFB, MASSACHUSETTS 01731 JUN 2 21982
C.-O.

]a
Qualified requestors may obtain additional copies from theDefense Technical Information Center. All others shouldapply to the National Technical Information Service.
UnclassifiedSECURITY CLASSIFICATION OF THIS PAGE (1
43,en ltFntrd
REPORT DOCUMENTATION PAGE 1FFR OPEI( -RI. REPORT NUMBIER IGOVT ACCESSION NO. 3Rt IPIFNT'S (:A7 ALOG NUMBER
AFGL-TR-82-0117 b- A J-1 0.25__________14. TITLE (and Subtlfle) 5 YPE OF REPORT & PERIOD COVEREC
Interferometric Observations of Solar Flare Final ReportPrecursors at 10.6 GHz Oct 1980 - Jan 1982
6 PERFORMING O' G. REPORT NUMBER
7. AUTOR(.)8. CONTRACT OR GRANT NUMER/SI)
G. J HufordandH. ZrinP19628-81-YK-a028
9 PERFORMING ORGANIZATION NAME AND ADDRESS 10 PROGRAM ELEMENT PROJECT TASKAREA & WORK UNiT NUMBERSCalifornia Institute of Technology 61102F
1201 E. California Blvd. 21GBPasadena, CA 911252313B
11. CONTROLLING OFFICE NAME AND ADDRESS 12. REPORT DATE
Air Force Geophysics Laboratory March 1982 _______
Hanscom APB, Massachusetts 01731 13. NUMBER OF PAGES
Monitor/Donald A. Guidice PHK 4214. MONITORING AGENCY N AME 8 ADDRESS(il different from, ('o,,rollin$ Office) IS. SECURITY CLASS. (0f tis,, r,pot0
Unclassified
15a. DECLASSIFICATION DOWNGRADINGSCHlEDU LE
16. DISTRIBUTION STATEMENT (of thi.- Report)
Approved for public release; distribution unlimited.
17. DISTRIBUTION STATEMENT (of the abstract entered io Block 20. if dffteront from, Repo~rt)
IS. SUPPLEMENTARY NOTES
19. K~EY WORDS (Continue on fevervne side it necessary and identify hl, block rtimber)
Interferometric microwave polarimetry Preflare microwave activitySolarflare prediction 10.6 GHz interferonetricOwens Valley Radio Observatory observations
20. ABSTRACT (Contiue on reverse side Of necessary and identify by block number)
The purpose of this study was to examiine a data base of interferometricsolar microwave data in order to identify, evaluate and interpret preflaremicrowave signatures, with reference to their possible role for the short-term prediction of solar flares. The data base used was acquired by theOwens Valley solar interferometer at 10.6 GHz between February 19, 1980and March 31, 1981. Twenty-seven major flares which occurred betweenFebruary 19 and August 31, 1901 and for which good quality interferometric -
DD I AN7 1473 EDITION OF I NOV 65 IS OBSOLETE Unclassified
SECURITY CLASSIrICA'ION OF THIS PAGE tI7-n Data Ftnlred)
SECURITY CLASSIFICATION OF THIS PAGE(Wh,, 0t t.red
data were available, were sluctud using optical, soft x-ray OR micruwav,
- flux criteria. These events were analysed in detail; very similar preflaresignatures noted in four (15%) of the cases. Otner unusual preflare behaviorwas noted in four additional cases. The most common signature was a step-like increase in signal amplitude, accompanied by a decrease or reversalin the degree of polarization. Such a signature occurred between a fewminutes to a few tens of minutes before the start of the impulsive phase.Optical data, available in three cases, showed the microwave changes weresimultaneous with either small brightenings or small-scale filamentdisruptions.
Physically, tnis precursive signature may be iuentified with the onsetphase of solar flares, when slow heating in the metastable magnetic loopsdestabilize the system, leading to rapid energy release in the impulsivephase. The reason for the distinctive polarization signature is notunderstood at present, but may be related to the site of the heating withinthe magnetic loops. ,
This signature was quantified in terms of a computer program, ONSET,which was used to review the second half of the data base. It succeededin 'predicting' a comparable percentage (5 out of 54) of major flaresobserved between September 1, 1980 and March 31, 1981. The false alarmrate was evaluated using the first half of the data base and was foundto average 3 per week. The false alarms can be attributed to foursources: (1) Signal variations caused by the effect of the earth'srotation on the interferometer's response to spatially complex activeregions. (2) Predictions which led to smaller flares than the majorflare identified using the adopted criteria. (3) The crudeness of theadopted algorithm. (4) Real fluctuations in the solar radio emissionwhich did not lead to flares. The false alarm rate was sufficiently lowto eliminate random coincidences as a factor. It was far too high,however, to make single-frequency interferometric polarimetry a practicalstand-alone tool for short term flare prediciton, except in the mostfalse-alarm tolerant situations.
If qyrore.onance opacity plays a significant role in the microwaveemission at 10.6 GHz during the onset phase, then it would be expectedthat multiple-frequency interferometry would be able to significantlyreduce the false alarm rate as well as increase the fraction of flareswith distinctive preflare microwave signatures.
Accession For
NTIS G7A&IDTIC TABUaiLnounced LiJustificftim_
ByDistribution/
Availability Codes
Avail and/or
Dist Special
Unclassifi(,4
(.ofiJ SECURITY CL ASSIFICATiOw OF T-1, 4GEeWlf?- DafArF,,

INTERFEROMETRIC OBSERVATIONS OF SOLAR FLARE PRECURSORS AT 10.6 GHZ
G. J. Hurford and H. Zirin
California Institute of Technology
ABSTRACT
The purpose of this study was to examine a data base
of interferometric solar microwave data in order to
identify, evaluate and interpret preflare microwave
signatures, with reference to their possible role for the
short-term prediction of solar flares. The data base used
was acquired by the Owens Valley solar interferometer at
10.6 GHz between February 19, 1980 and March 31, 1981.
Twenty-seven major flares which occurred between February 19
and August 31, 1980 and for which good quality
interferometric data were available, were selected using
optical, soft x-ray OR microwave flux criteria. These
events were analysed in detail; very similar preflare
signatures noted in four (15%) of the cases. Other unusual
preflare behavior was noted in four additional cases. The
most common signature was a step-like increase in signal
amplitude, accompanied by a decrease or reversal in the
degree of polarization. Such a signature occurred between a
few minutes to a few tens of minutes before the start of the
impulsive phase. Optical data, available in three cases,
showed the microwave changes were simultaneous with either
small brightenings or small-scale filament disruptions.

Physically, this precursive signature may be identified
with the onset phase of solar flares, when slow heating in
the metastable magnetic loops destabilize the system,
leading to rapid energy release in the impulsive phase. The
reason for the distinctive polarization signature is not
understood at present, but may be related to the site of the
heating within the magnetic loops.
This signature was quantified in terms of a computer
program, ONSET, which was used to review the second half of
the data base. It succeeded in 'predicting' a comparable
percentage (5 out of 54) of major flares observed between
September 1, 1980 and March 31, 1981. The false alarm rate
was eva±uated using the first half of the data base and was
found to average 3 per week. The false alarms can be
attributed to four sources: (1) Signal variations caused by
the etfect ot the earth's rotation on the interferometer's
response to spatially complex active regions.
(2) Predictions which led to smaller flares than the major
flare identified using the adopted criteria. (3) The
crudeness or the adopted algorithm. (4) Real fluctuations
in the solar radio emission which did not lead to flares.
The faise alarm rate was sufficiently low to eliminate
random coincidences as a factor. It was far too high,
however, to make single-frequency intcrferometric
polarimetry a practical stand-alone tool for short term
flare prediction, except in the most false-alarm tolerant
situations.
2

If gyroresonance opacity plays a significant role in
the microwave emission at 10.6 GHz during the onset phase,
then it would be expected that multiple-frequency
interferometry would be able to significantly reduce the
false alarm rate as well as increase the fraction of flares
with distinctive preflare microwave signatures.
3
I. INTRODUCTION
The purpose of this study was to examine a moderate
size data base of interferometric solar microwave data in
order to identify, evaluate and interpret preflare microwave
signatures with reference to their possible role for the
short-term prediction of solar flares. In terms of Martin's
(1980) terminology, this study is dealing with "distinct"
preflare events -- that is, events which are characterized
by irreversible, continuous changes culminating in the
occurrence of a flare, as opposed to evolutionary or
statistical association of active region characteristics
with the general level of solar activity. In this context,
we define preflare events as those events occurring before
the start of the impulsive phase.
II. MICROWAVE OBSERVATIONS
The study is based on observations obtained with the
Owens Valley Solar Interferometer (Zirin, Hurford and Marsh
1978) which obtained solar observations at 10.6 GHz up to 8
hours per day almost daily from February 19, 1980 until
March 31, 1981. The instrumentation consisted of a pair of
27-m fully-steerable parabolic antennas (half power beam
width ot 4.4 arc-min at 10.6 GHz) deployed on either a 700-
foot east-west baseline (until June 29, 1980) or a 450 foot
northwest to southeast baseline. The fringe spacing on the
sun varied between 0.5 and 2 arc-minutes, depending on date
and time of day. Occasionally, a 40-m antenna was added to
4
the system to enable 3-element interferometry with fringe
spacing as short as 4.6 arc-seconds.
The original data was acquired with 50 msec time
resolution (occasionally 25 or 100 msec), recorded and
archived on magnetic tape. Appropriate time averaging was
introduced during the data analysis. The system observed
alternately in left and right circular polarization, with
all active signal processing paths common to both
polarizations. Therefore, the system sensitivity to small
polarization changes was exceptionally good.
The normal observing routine consisted of brief
observations of a cosmic source (for amplitude and phase
calibration) alternating with 60 to 90 minute observations
of an active region. The choice of active region was
generally based on the Solar Maximum Mission observing
program or a region likely to produce flares, as determined
by optical evaluation at Big Bear Solar Observatory.
The overall methodology of the study was to identify a
set of major flares for which we had interferometric
observations both of the impulsive phase and of the preflare
situation. The preflare microwave activity was then
examined in detail to identify any potentially unusual
behavior; that is, changes in any aspect of the microwave
signal that could not be attributed to the normal change in
amplitude, phase or apparent degree of polarization due to
the rotation of the earth and consequent change in the
5

fringe spacing or orientation. (As discussed by Kundu and
Alissandrakis(1975), such effects can cause a stable source
to display a variable interferometric signature.) Changes
attributable to instrumental effects, such as pointing,
tracking or atmospheric effects were also disregarded. The
sensitivity of the system to preflare changes varied
markedly from event to event. In some cases, where the
active region structure was simple, a very stable
interferometric response was observed and relatively subtle
preflare signatures would have been readily apparent. In
other cases, the interferometric output varied significantly
through much of the day, due to a more complex distribution
of microwave sources within the field of view and/or
frequent (but minor) flaring activity. In such cases, only
relatively gross preflare signatures changes could be
identified.
The criterion chosen to define major flares for this
purpose was that a flare had to have either optical
importance 1 or greater, soft X-ray class Ml or greater, or
10.6 GHz flux density of 50 sfu or greater. Such a
criterion was adopted so that an adequate number of events
would be available for careful study and so that no
preference would be given to one type of flare over another.
The time period examined at this stage was limited to Feb
19, 1980 to August 31, 1980, thus leaving a comparable
period (September 1, 1980 to March 31, 1981) available for a
subsequent test of any preflare signatures identified.
6

Initially, an overcomplete list of 46 flares was
identified as possibly meeting such criteria. These events
were then studied in detail and, in some cases, deleted from
further study on the basis of data quality, inadequate
preflare coverage, etc. The presence or absence of preflare
activity was not a consideration in such rejection. The
final list of 27 'major' flares occurring in this time
period and for which satisfactory OVRO data was available is
shown in Table 1. The data for these flares was reduced and
plotted, first with 10-second averages in Stokes R and L, on
logarithmic scales. Such plots effectively display small
variations in circular polarization, since the linear
separation of the amplitudes corresponds to the degree of
polarization. Additional displays, optimized for each
event, were generated as needed and examined in detail.
Since the purpose of this work was to identify distinct
preflare events rather than those of a more evolutionary
character, each day was analyzed independently, and no
formal attempt was made to compare the interferometric
signatures from day to day.
Examination of the preflare microwave data for the 27
major flares identified in Table 1 showed very similar
preflare microwave signatures in four cases, with other
microwave changes in four others. Optical data from Big
Bear Solar Observatory was also examined and will be
referred to below.
71

III. DISCUSSION OF INDIVIDUAL EVENTS
In this section we will discuss the prefiart; microwave
behavior for the eight events that showed some type of
preflare changes not attributable to the instrumental
causes.
A/ March 23, 1980.
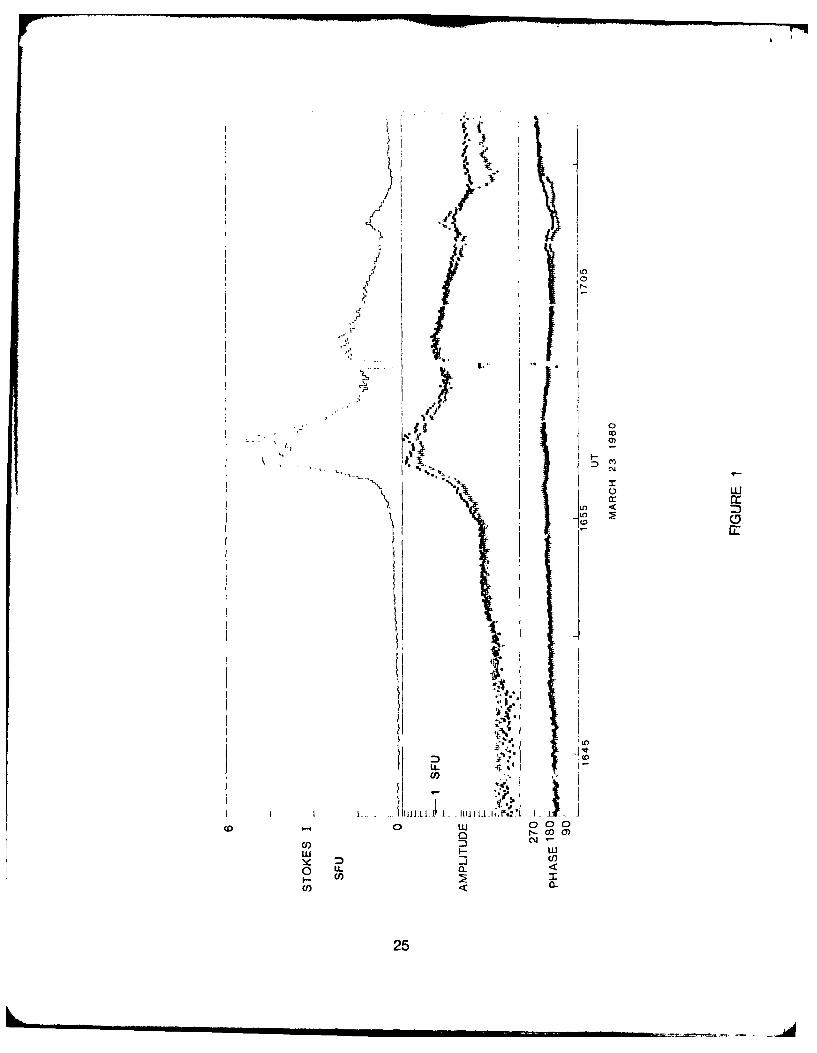
The beginning of the impulsive phase of this event at
1655 was preceeded by a pair of step-like increases in the
left circularly polarized (LCP) signal at 1648 and 1651,
accompanied by smaller increases in the right circularly
polarized (RCP) amplitude (Figure 1). The result was that
the polarization had reversed from RCP to LCP four minutes
before the impulsive phase began, and that the overall
amplitude in Stokes I more than doubled. Optically, the
first step coincided with the lifting off of one leg of a
Y-shaped filament (Figure 2). The second step coincided
with the disintegration of the other leg, leaving only the
base. The impulsive phase began about 4 minutes later. The
impulsive and decay phases of this microwave event are
discussed in detail elsewhere (Marsh et al., 1981).
B/ May 15, 1980.
The M2 event at 2047 (Figure 3) was preceeded in this
case by evolution of the active region polarization
beginning at about 1935. This was qualitatively similar to
the preceeding case, except on a much slower time-scale.
8

Note the dramatic reduction and reversal in the sense of
polarization starting at 1935, which followed a relatively
stable morning. It is important to note that the sun was at
the local meridian at about this time. With the stable
meridian fringe spacing associated with an east-west
baseline at the local meridian, it is therefore very
unlikely that the polarization change that occurred
following 1935 represented anything other than a real
temporal change in the source. Note also the return of the
polarization to its preflare state following the event.
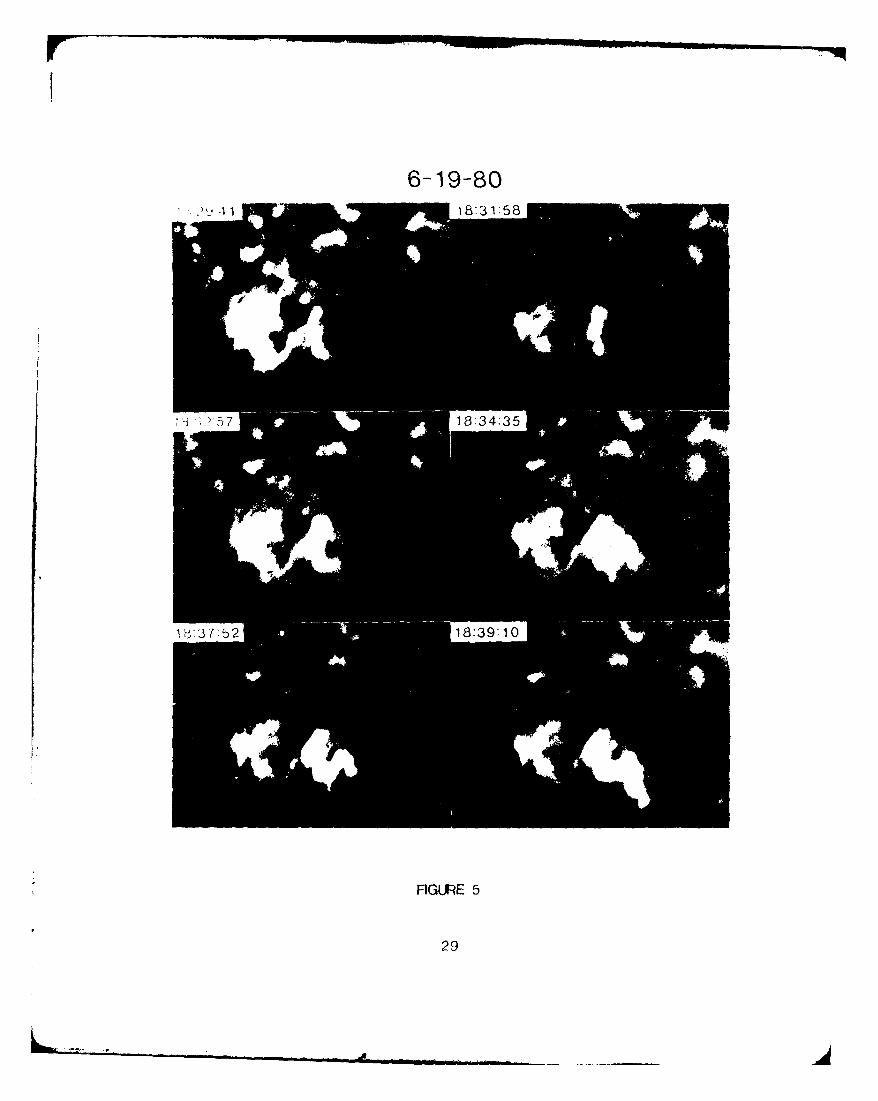
C/ June 19, 1980.
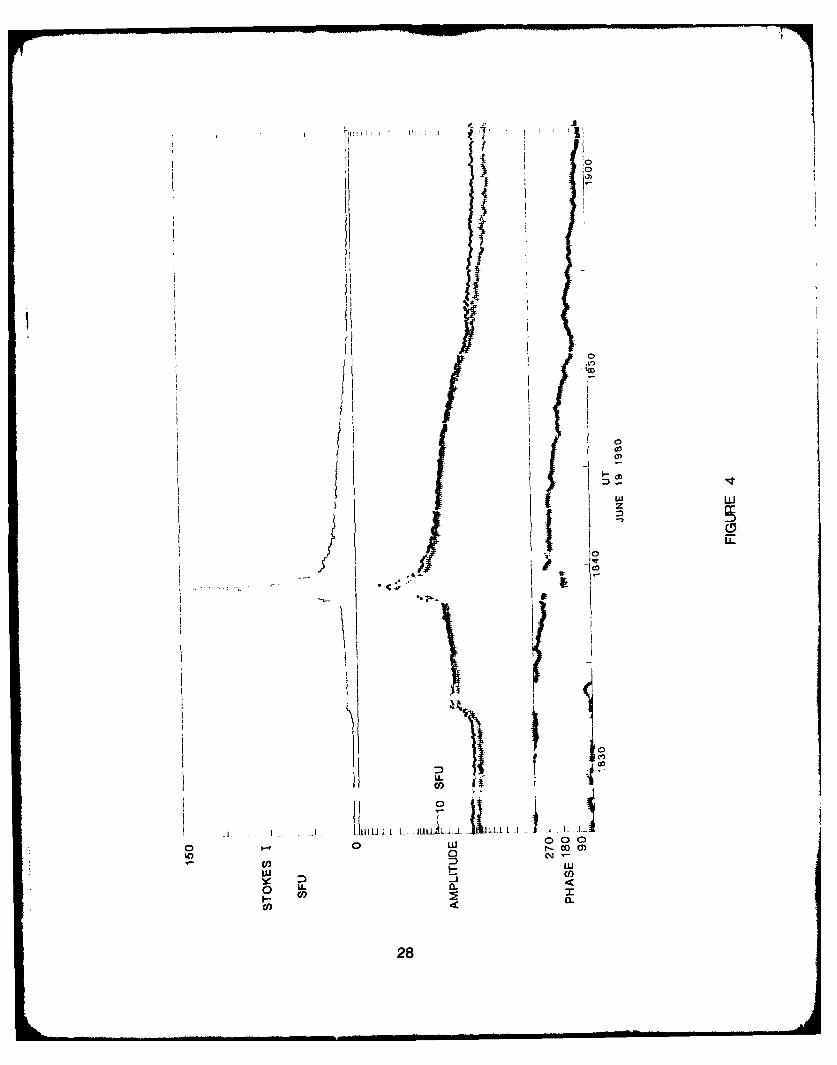
The event at 1839, shown in Figure 4, was clearly
preceeded by a steplike increase at 1832, with some
reduction in degree of polarization. Amplitudes before and
after this event were very stable. Optical data, shown in
Figure 5, show that this step was associated with a
continuing development of a small optical brightening.
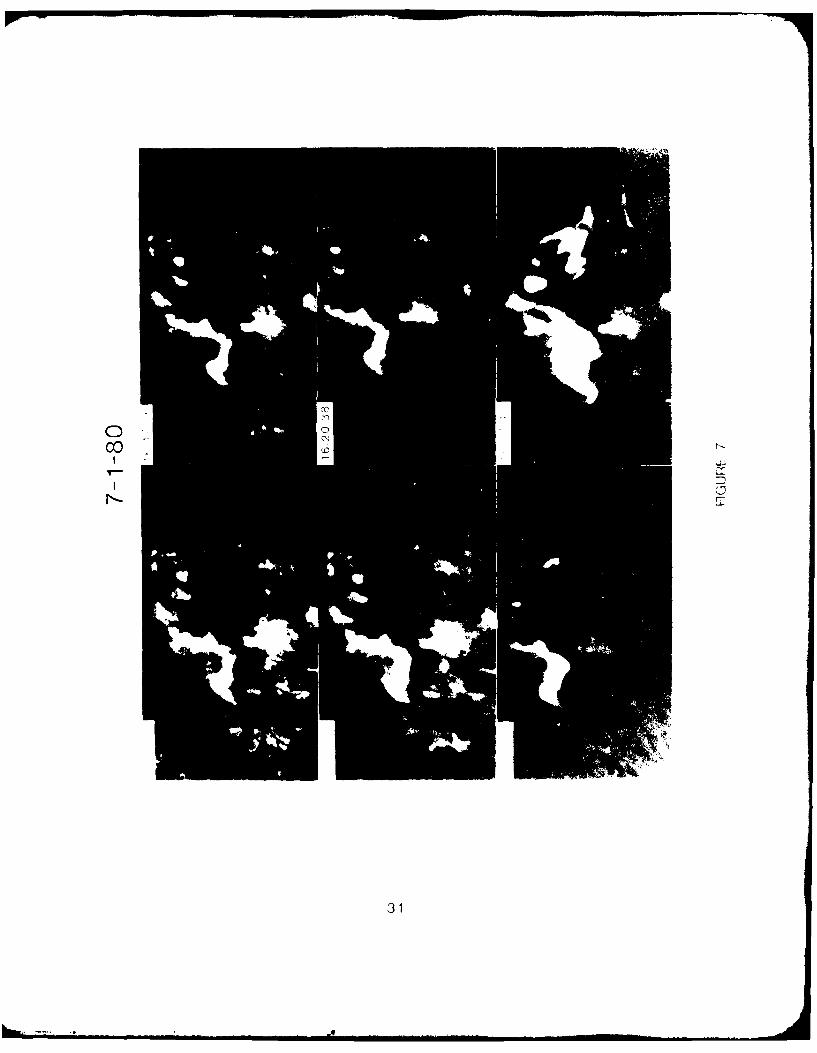
D/ July 1, 1980.
This X2 event was indeed a major flare featuring not
only gamma-ray and white-light emission, but also magnetic
transients (Zirin and Neidig,1981; Zirin and Tanaka, 1981).
The impulsive phase of this event began at 1626 UT, early in
the day at OVRO, but after a significant decrease in
polarization at 1619 with the same character as the events
discussed above. This preflare microwave signature
coincided with optical brightening in a well defined compact
9

loop as shown in Figure 7.
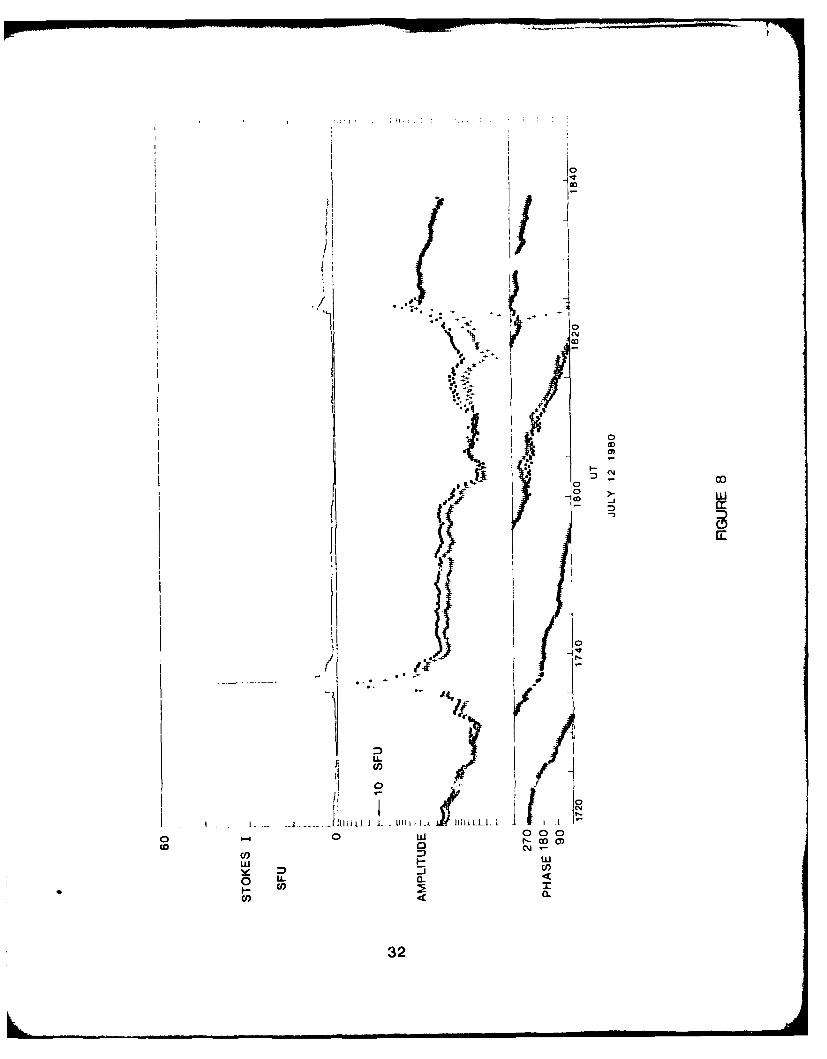
E/ July 12, 1980
The two events on July 12, 1980 (Figure 8) each showed
a striking decrease in their signal amplitudes, accompanied
by a decrease in polarization. In noting the contrast to
the previous cases, it should be recalled that the presence
of a new microwave source in the field of view of an
interferometer can result in a decrease in the resulting
amplitude. (This occurs because the contributing sources
add vectorially, not as scalars, in determining the final
amplitudes.) Thus, it is possible that the decrease was due
to the addition of a new source. Optically, there was
almost continual low level activity during this time.
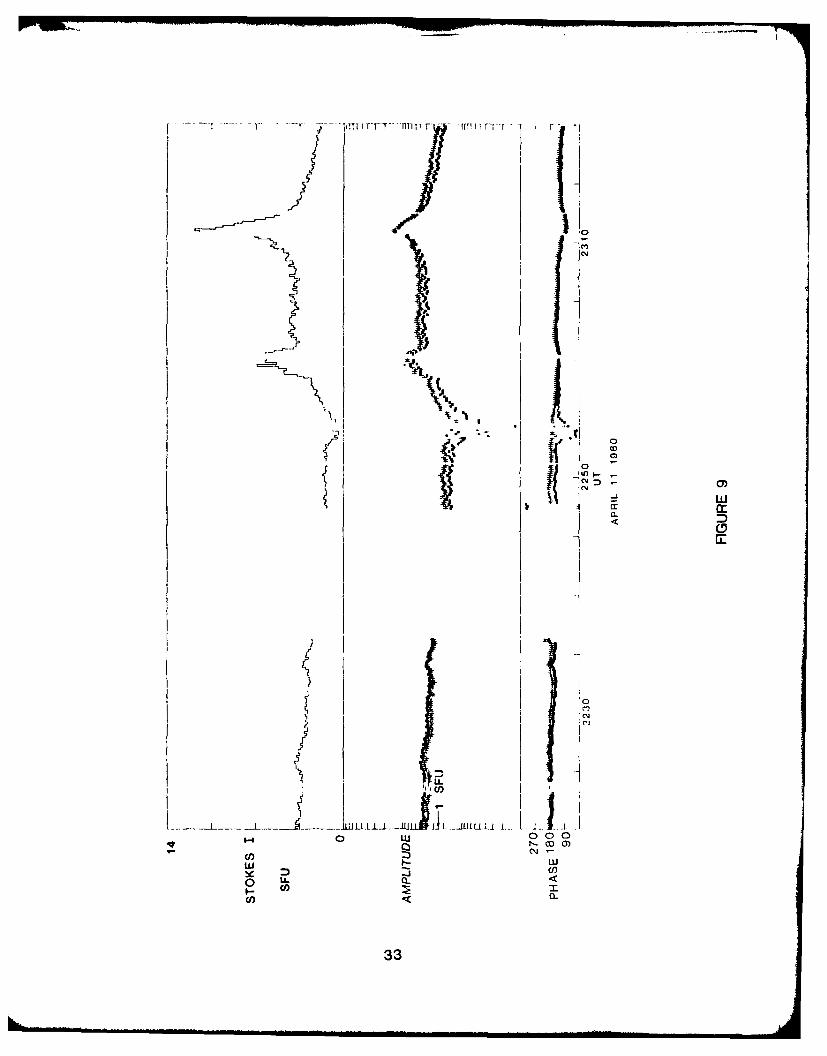
F1 April 11, 1980
The event at 2312 on April 11 occurred on an
otherwise-quiet day which featured a relatively stable
microwave profile until a small event occurred at 2259
UT(Figure 9). The feature of note, however, is not the
occurrence of this event, but rather the failure of the
microwave profile to return to its previous level after this
event was over. Instead, it remained at a stable, enhanced
level until the major flare began at 2310. Note also the
reversal in polarization between 2336 and 2348.
10
G/ May 16, 1980.
The impulsive flares at 2205 and 2210 (Figure 10)
occurred in AR2456 and left the active region amplitudes in
an enhanced, stable state. The major flare in terms of soft
x-rays occurred at 2232 following this enhancement. In this
case the correlation may be deceptive, however, for
optically the event at 2232 occurred in what appeared to be
a magnetically separate part of the active region.
Furthermore, close examination of Figure 10 shows that the
preflare enhancement remained after the event at 2232. The
decrease at 2240 is a remarkable case, discussed elsewhere
(Hurford and Tang 1981), in which a surge, originating in
the event at 2232, occulted the compact source of emission
of the active region.
IV. PRE-FLARE MICROWAVE SIGNATURE
Four of the cases discussed above display a common
characteristic. A few minutes or tens of minutes before a
major flare, a step-like increase in fringe amplitude
occurs, accompanied by a decrease or reversal in the degree
of polarization. It then remains at an enhanced state until
the occurrence of the major flare. In some cases, the
increases were accompanied by small brightenings in H-alpha,
brightenings which otherwise might not be exceptional.
11
To objectively evaluate the significance of this
preflare behavior and its potential usefulness for real-time
short-term flare prediction, the signature was quantified
into a computer-compatible form which could then be applied
to a real-time data stream.
The algorithm adopted can be formally stated in the
following procedure.
1. Calculate 30-second averages of amplitude in right
and left circular polarization.
2. Calculate their sum and difference, I = R + L, V =
R - L, and the degree of polarization, P = V / I. (Note
that this definition of I and V is slightly non-standard in
that the phases are not taken into account.)
3. Verify that the following stability requirements
are met: a. The value of I should not differ from either of
the previous two values of I by more than 20%. b. The value
of V should not differ from either of the previous two
values of V by more than 20% of I. The purpose of this
requirement was to eliminate many flare-associated changes.
4. Compare the 'new' sample with each 'old' sample
acquired over the previous 30 minutes as follows: a. Does
the value of I in the new sample represent an increase of
50% or more over the value of I in the old sample? b. Does
the value of V in the new sample represent a decrease of 50%
of more or a reversal in sign compared to the old sample?
12
c. Was IPI in the old sample at least 10%?
5. If the answer to all three questions is YES for any
single old sample, then a positive 'prediction' of an
imminent solar flare is issued.
The foregoing algorithm represents an attempt to define
an objective algorithm which could be applied to a real-time
data stream. In practice, its application to the data was
modified in two minor respects. In cases where inspection
of the existing data displays clearly and unamibiguously
showed that the criteria would or would not be satisfied,
this state was accepted without confirmation by ONSET.
Cases with any potential ambiguity were analysed by ONSET.
The second modification was that in cases where the criteria
were marginally satisfied, so that predictions were
successively made and withdrawn as the signal fluctuated
around the threshold, the resulting multiple predictions
were counted as one prediction.
The algorithm was used to test the significance of the
preflare signature by applying it to the second half of the
data base (September 1, 1980 to March 31, 1981). Using the
same criteria as defined above, 54 major flares were
observed during this period. These are listed in Table 2.
The same preflare signature was found in 5 of the 54, a
fraction that is statistically consistent with expectations
based on the first half of the data base. Figures 11 to 15
show the time profiles of these five events. Overall, the

signature was found in 11% (9 of 81) major flares observed
over a 58 week period at the maximum of the solar cycle.
The false alarm rate of such a signature was determined
by applying it to the entire first half of the data base,
irrespective of the occurrence of major flares. The number
of false 'predictions' varied significantly from month to
month with an average of 3 per week. Such a false alarm
rate is significant in two respects. First, noting an
average duration of 15 minutes for each prediction and 40
hours per week of active region observations, this implies
that the number of chance predictions of the 27 major flares
occurring in this period is 0.5 compared to the 4 actually
predicted. Thus, it is highly unlikely that the predictions
were due to chance coincidences. Second, it is clear that
such microwave data by itself could not serve as a practical
flare alarm, except in false-alarm tolerant situations.
The causes of the false alarms are basically fourfold.
1. The most frequent cause was the effect of the earth's
rotation on the interferometer's response to a spatially
complex source. This arose because at any one time, an
interferometer measures a specific Fourier component of the
spatial distribution of the source. The specific Fourier
component depends on the separation of the antennas (in
units of wavelength), the orientation of the baseline
joining the antennas and the location of the source in the
sky. As the earth rotates, the interferometer therefore
successively measures different Fourier components of the
14

source distribution so that stable sources can exhibit a
time variable signal. In the algorithm above, the
requirement that the comparison of 'old' and 'new'
amplitudes be made over a time difference of less than 30
minutes eliminated most of such effects. The most common
residual effect, termed a 'structural null' and illustrated
in Figure 16, often exhibits significant polarization
changes over a time scale of only a few minutes. Such
structural nulls were a major source of false alarms.
2. In a number of occasions, predictions led to flares
which did not qualify as 'major' under the criteria adopted
above or the prediction occurred too late into a real flare
to be 3ignificant.
3. The algorithm adopted above was crude in the sense
that it could have been refined to eliminate several false
alarms without seriously affecting its success rate. Such
complications were not felt to be justified at this time.
4. There were some cases of apparently real solar
variations satisfying the signature requirements which did
not result in flaring activity.
V PHYSICAL SIGNIFICANCE OF THE PREFLARE MICROWAVE SIGNATURE
The impulsive or flash phase of solar flares represents
the most rapid conversion of stored magnetic energy into
energetic particles, thermal and mechanical energy. Thus
for many processes (including those of solar-terrestrial
15

interest), it defines the 'start' of the flare. It has been
known for some time, however, (cf. Svestka, 1976; Martin,
1980; van Hoven et al., 1980) that there sometimes is
energy release on a much slower time-scale preceeding the
beginning of the impulsive phase. This onset phase of
flares has been observed as H-alpha brightenings, EUV and
soft X-ray emission. We interpret the present results to
show that the onset phase often has detectable microwave
emission as well.
In retrospect, such microwave emission is not
surprising. The preflare active region emits microwave
emission through thermal bremsstrahlung (free-free) and the
gyroresonance process. Thus depending on whether the source
is optically thin (free-free) or thick (gyroresonance), its
emission is sensitive to temperature, electron density
and/or the magnetic field strength, so that any significant
change in these quantities is likely to be reflected in the
microwave emission. The intensity of these changes in
microwave emission as found here (often just a few tenths of
a solar flux unit) would often render them below or just at
the thresholo of detectability of typical radio patrol
systems. There are observable here because of the
sensitivity of the interferometer to small-scale sources.
Physically, the most interesting feature of the onset
phase microwave emission is the polarization. Since I
increases and V decreases, the additional emission must have
the opposite sense of polarization from that which dominates
16
the active region emission. Although the present work
cannot definitively address this point, it does suggest that
the sources (and, hence, the preheating of the active region
plasma in the onset phase) may be occurring preferentially
in the weaker, rather than the stronger magnetic field
polarity.
VI CONCLUSIONS AND PROSPECTS
A distinctive signature, observable at 10.6 GHz with
inteferometric polarimetry, has been found to occur a few
minutes to tens of minutes before the beginning of the
impulsive phase of 11% of major solar flares. Physically,
this signature is identified with the onset phase of flare
in which slow preheating of the active region plasma may
lead to the rapid release of magnetic energy in the
impulsive phase. Although the signature can be quantified
so as to permit its automated identification in real-time,
the false alarm rate of 3 per week seriously compromises its
suitability for practical flare prediction.
It is possible that some of these limitations may be
overcome by the use of multiple-frequency interferometry.
In particular, it should be possible to significantly reduce
the false alarm rate since the 'structural nulls' discussed
in Section V above, and which provided most of the false
alarms, can be readily distinguished from real solar changes
when observed at more than one frequency (or with more than
one baseline at a single frequency). With multiple-
17

frequency observations, they are expected to occur
successively at different frequencies while real solar
changes would occur simultaneously. Furthermore, if
gyroresonance opacity is playing a significant role in the
onset-phase microwave emission, then the pollrization
signature observed would be expected to be an intrinsically
narrow band phenomenon, occurring in any one situation only
over a limited frequency range (typically between the second
and third harmonic of the local gyrofrequency). Thus, if
the flare to flare variation of local gyrofrequency (i.e.,
magnetic field strength) varied over a factor of ~10 range,
the polarization signature would be expected to be
observable at a fixed frequency in only log(l.5) / log (10)
or -18% of the cases. Thus multiple frequency observations,
expected to be available soon, might be expected to both
observe such signatures in a higher fraction of flares, as
well as have a significantly lower false alarm rate.
VI. ACKNOWLEDGEMENTS
We wish to thank Dr. Kenneth Topka for compiling the
first list of major flares, Frances Tang for her analysis of
the optical data, Margaret Liggett, Shawn Larsen and Dan
Zirin for their assistance with the analysis of the radio
data, Jeff Nenow for preparation of the photographs, and Dr.
Fred Erskine of University of Maryland for permission to use
his observations of the May 15 event.
18
The analysis performed under this effort (Contract
F19628-81-K-0028) makes use of OVRO observations funded by
the National Science Foundation under Grant AST79-16149-AO1.
19
VII. REFERENCES
Hurford, G. J., and Tang, F., 1981, B.AAA.S., 13, 860.
Kundu, M. R., and Alissandrakis, C. E., 1975,M7N.R-A-S- . 23, 65.
Marsh, K. A., Hurford, G. J., Zirin, H., Dulk, G. A.,Dennis, B. R., Frost, K. J., and Orwig, L. E., 1981,AstrQphys J., 2-5, 797.
Martin, S. F., 1981, Solar Physic, La, 217.
van Hoven et al., 1980, Solar Flares (ed P. Sturrock), p 17.
Svestka, Z., 1976, Ioar Flares, (D. Reidel).
Zirin, H., Hurford, G. J., and Marsh, K. A., 1978,J., 22A, 1043.
Zirin, H., and Neidig, D. F., 1981, BBSO, 2k2, preprint.
Zirin, H., and Tanaka, K., 1981, ]Rp 191, preprint.
20

TABLE 1 -- LIST OF 'MAJOR' FLARES WELL-OBSERVED BY OVROFEBRUARY 19,1980 - AUGUST 31, 1980
---DATE---- -UT- OPTICAL SOFT X-RAY LOCATION REGION
1980 FEB 20 2016 IB C7 S08E28 AR2261980 FEB 25 2005 IB NIOE901980 MAR 23 1658 18 C7 S28W49 AR23391980 APR 10 1925 IN N19W361980 APR 11 2312 IN M1 NlOW70 AR23721980 APR 30 2026 SN M2 S13W90 AR23961980 MAY 01 1840 IB C5 S24W61 AR24201980 MAY 02 2343 IN N26E57 AR24231980 MAY 05 1932 IF C3 $26E14 AR24181980 MAY 07 2048 SN C3 S22W16 AR24181980 MAY 15 2047 IB M2 S12E65 AR24561980 MAY 16 2233 IB M2 S14E48 AR24561980 MAY 28 1952 1B Xl S18W35 AR24701980 MAY 28 2207 IB M3 $24W33 AR24701980 MAY 28 2344 1B M7 S16W38 AR24701980 JUN 04' 2301 1B X2 S14W69 AR24781980 JUN 19 1839 IB Ml S27E42 AR25221980 JUN 24 2003 lB Ml S23W131980 JUN 29 1824 2B M4 S25W90 AR25221980 JUN 30 1828 M1 AR25441980 JUL 01 1628 lB X2 S12W37 AR25441980 JUL 11 1904 2B X1 SlOE72 AR25621980 JUL 12 1737 SB C7 S09E59 AR25621980 JUL 12 1828 IB M2 S12E66 AR25621980 JUL 13 1719 SB M2 SIIE46 AR25621980 JUL 20 1927 1B M1 S19W44 AR25621980 AUG 23 2129 IB M2 N16W39 AR2629
21

TABLE 2 -- LIST OF 'MAJOR' FLARES OBSERVED BY OVRO
SEPTEMBER 1, 1980 - MARCH 31, 1981
--- DATE---- -UT- OPTICAL SOFT X-RAY LOCATION REGION
1980 SEP 22 1619 lB C3 N05W09 AR26911980 OCT 08 2034 M3 AR27251980 OCT 11 1748 1B C7 S08E31 AR27251980 OCT 25 1843 IN C3 S20W32 AR27441980 OCT 27 2203 IN C4 S19W60 AR27441980 OCT 28 2226 IN M1 $21W72 AR27441980 NOV 05 1641 lB M2 N08Ell AR27761980 NOV 07 2231 M21980 NOV 08 2007 1B M1 S08E43 AR27791980 NOV 11 1725 lB M1 S13E03 AR27791980 NOV 11 2054 lB M3 S13W03 AR27791980 NOV 12 1702 lB M1 S14W11 AR27791980 NOV 12 2243 lB M3 S13W18 AR27791980 NOV 13 1744 SN M1 SlOW30 AR27791980 NOV 13 1924 2B M4 S16W32 AR27791980 NOV 15 2007 M2 AR27791980 NOV 15 2114 lB C8 S11W58 AR27791980 NOV 15 2148 IN MI SlOW54 AR27791980 NOV 16 1742 IN C4 S18W60 AR27791980 NOV 23 1755 lB C2 NIIW23 AR27931980 NOV 23 1845 SF M2 N13W23 AR27931980 DEC 11 2225 SB M1 NI5EI0 AR28261980 DEC 12 1703 lB M2 N13E03 AR28261980 DEC 12 2113 SB M1 N13W09 AR28261980 DEC 15 1840 IN M1 N15E35 AR28411980 DEC 15 1927 2B M5 NIIE28 AR28401980 DEC 19 2014 IN C5 N05W25 AR28401980 DEC 28 1908 SB M1 $22W04 AR28551981 JAN 03 2202 IN Cl S05W67 AR28571981 JAN 10 2057 IN C2 S12W49 AR28741981 JAN 25 1647 SB M2 S13E75 AR29111981 JAN 25 1911 SF M1 S13E90 AR29111981 JAN 25 2249 M11981 JAN 25 2349 SF M1 S15E85 AR29111981 JAN 31 2401 IB S14E06 AR29111981 FEB 02 1711 2B M1 S08W04 AR29181981 FEB 15 1905 M1 AR29301981 FEB 17 1846 IN N21W15 AR29411981 FEB 17 1913 IB Ml N12W06 AR29471981 FEB 17 2150 2B X1 N20W20 AR29411981 FEB 26 1953 3B X4 S15E50 AR29581981 FEB 26 2333 lB M1 S14E44 AR29581981 FEB 27 2309 SN M1 S18E39 AR29581981 MAR 09 1853 lB M1 N13E28 AR29711981 MAR 13 2101 IB M1 N12W25 AR29711981 MAR 13 2330 M2 AR29711981 MAR 14 2348 lB M1 N09W38 AR29711981 MAR 22 1950 IB M1 NlOW45 AR29841981 MAR 22 2353 2B M8 N08W47 AR29841981 MAR 23 1737 IB M1 N07W57 AR29841981 MAR 23 2118 IN M1 N09W61 AR29841981 MAR 26 1815 SB M1 N17W21 AR29931981 MAR 26 1940 lB C5 NIIW46 AR2993
22
FIGURE CAPTIONS
Figure 1. Microwave time profile for March 23, 1980 event.The top panel shows the amplitude in Stokes I on a linearscale. The center panel shows the RCP and LCP behavior on alogarithmic scale to illustrate the preimpulsive phasechanges at 1648 and 1651. The dropout at 1702 isinstrumental. The lower panel shows the phase behavior inRCP and LCP.
Figure 2. H-alpha observations of the March 23, 1980 event.Note the disappearance of the upper leg of the dark filament(left center) at between 1647 and 1648, (coincident with thefirst change in the microwave polarization in Figure 1) andthe disintegration of the lower leg by 1650.
Figure 3. Microwave time profile for the May 15, 1980 event.The format is the same as Figure 1. Note the samepolarization behavior as in Figure 1, but with a
considerably slower time scale.
Figure 4. Microwave time profile for the June 19, 1980event. The format is the same as Figure 1. The preimpulsive-phase step-like increase in amplitude and decrease inpolarization is clear.
Figure 5. H-alpha observations for the June 19, 1980 event.The steplike increase in microwave amplitude at 1832coincided with a continuing development of a small opticalbrightening.
Figure 6. Microwave time profile for the July 1, 1980 event.The format is the same as in Figure 1. Note the now-familiarpolarization signature at around 1620.
Figure 7. H-alpha observations for the July 1, 1980 event.Note the intensification of the H-alpha brightness in thelower right bright loop at 1620.
Figure 8. Microwave time profiles for the two major flareson July 12, 1980. The format is the same as Figure 1. Notethe amplitude decreases before the impulsive phase. (Seetext for a discussion of their possible significance.)
Figure 9. Microwave time profile leading up to the majorflare at 2311 on April 11, 1980. The format is the same as
23
in Figure 1. Note the polarization reversal during thecalibration gap at 2240 and the failure of the microwaveamplitude to return to its previous level after the smallerevent at 2259.
Figure 10. Microwave time profile leading up to the majorflare at 2232 on May 16, 1980. The format is the same as inFigure 1. Note the failure of the microwave amplitude toreturn to its previous level after the smaller events (insoft X-rays) at 2205 and 2210.
Figure 11. Microwave time profile for the November 7, 1980event.
Figure 12. Microwave time profile for the November 11, 1980event.
Figure 13. Microwave time profile for the November 13, 1980event.
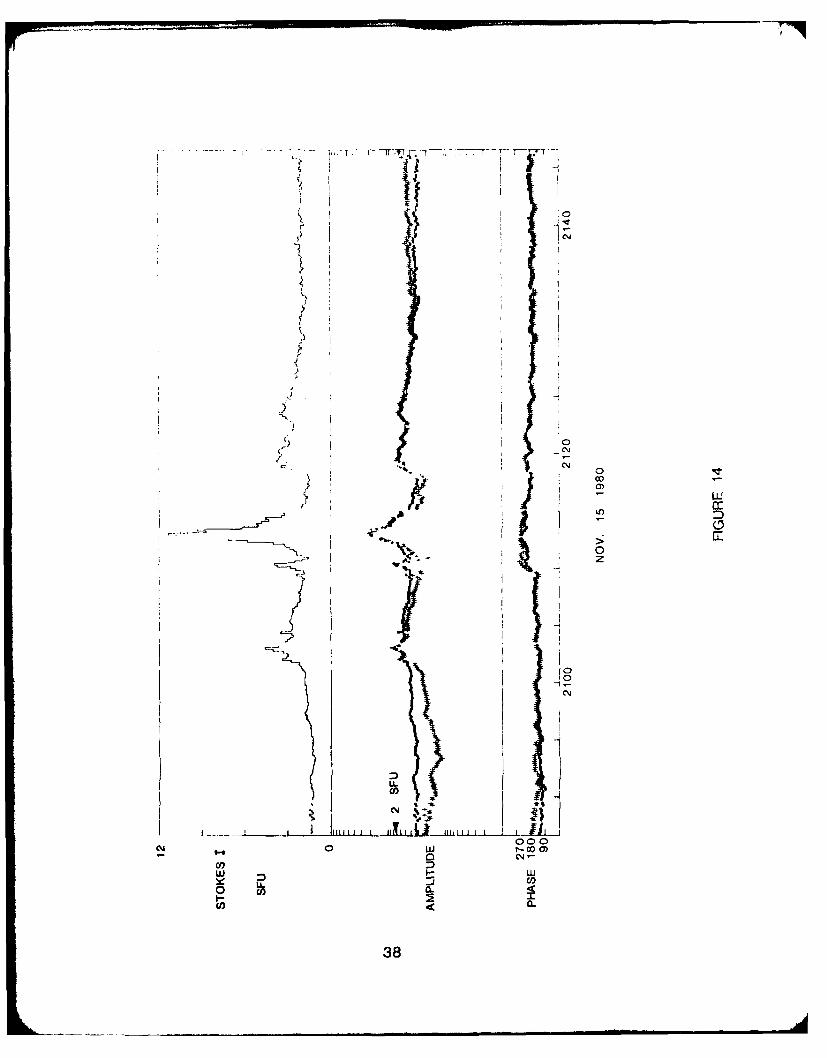
Figure 14. Microwave time profile for the November 15, 1980event.
Figure 15. Microwave time profile for the November 23, 1980event.
Figure 16. Microwave profile of a typical structural nullcaused by the effect of the earth's rotation on theinterferometer's response to a spatially complex source.
24
LeF
ILLL 1111b .
CD 1 0 0 00
wl I- WoCF
I- F-I
ct)
25

3-23-80
11
. ... ,'16: 55:0 2
FIGURE 2
26

ki/0
100
LLj
x~ IL
0 co a-I-0-
27
'IIL
0~
00
ClCD
0 LL.clICOI 1
28I
6-19-80
FIGURE 5
29

4*1
- 1.-0 7
-t-
300
pp0
co
..... .....
31
0m
00
CO D
w itw- ,-0 U...
32
LL
0
A, U. I
Ix 4 I.-il L .ILLIL- 1. llU.LJ
t- I- w )-Jj
oz
33

-i-- 7T . T ii. -- -.,Ai
~j0
Ic
w IS
0m
0 Igcot(349

1!4
'04
OD w
00H ft
000-Y 0 w 100
w I- w
35

C'; C'4
Srv
C,4
C~
'1. k.(0' -
* co-.
36.'

-)) U '
C)
J. I I
w w0
COC
37
si li
S . 0 :
.10N~
0 N 0
F- IJ
0y K j 0)u-
38'

I C' -I I
* 0
I 1k4
I--U
39 I

TTT r -T F
C Il
IIoco
j
10
000~
In en
U))
40.0