tb test performance - usaha
TRANSCRIPT
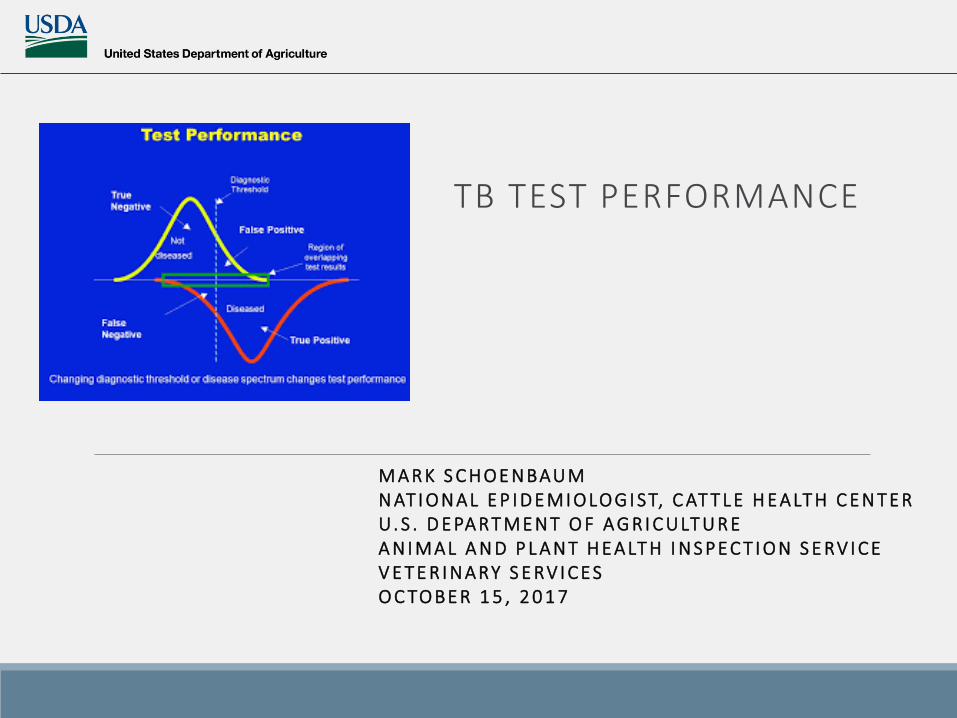
TB TEST PERFORMANCE
M A R K S C H O E N BAU MN AT I O N A L E P I D E M I O LO G I S T, C AT T L E H E A LT H C E N T E RU . S . D E PA R T M E N T O F A G R I C U LT U R EA N I M A L A N D P L A N T H E A LT H I N S P E C T I O N S E RV I C EV E T E R I N A RY S E RV I C E SO C TO B E R 1 5 , 2 0 1 7
11/15/2017 2
Performance measures for diagnostic testsSensitivity
Specificity
Predictive value positive
Predictive value negative
Likelihood estimates
Accuracy
Precision
ROC analysis
Examples showing variability and complexity of testing
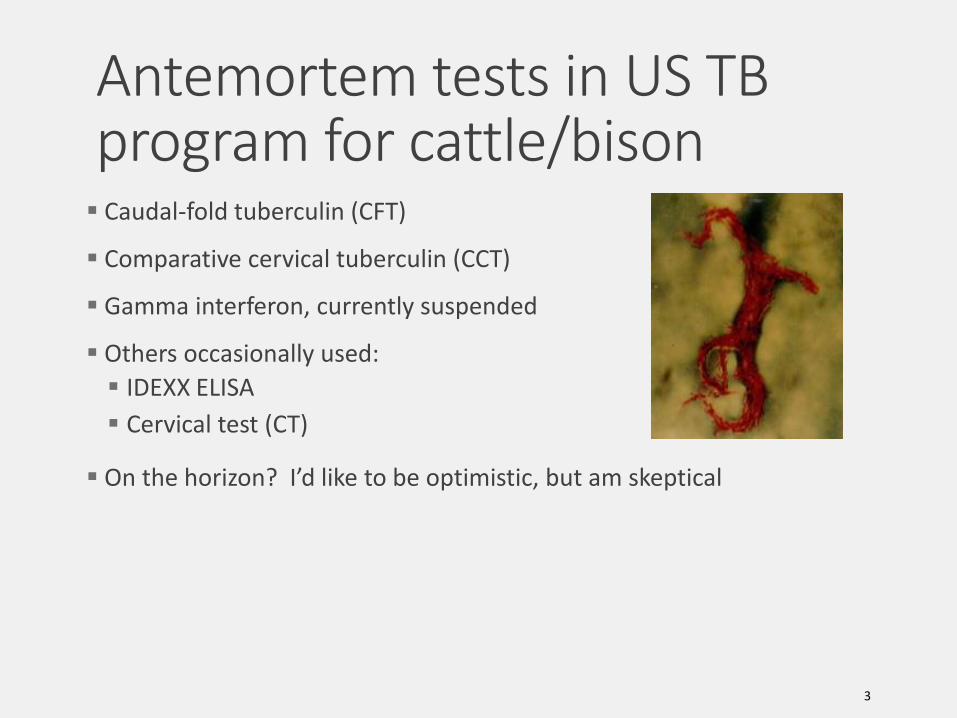
▪ Caudal-fold tuberculin (CFT)
▪ Comparative cervical tuberculin (CCT)
▪ Gamma interferon, currently suspended
▪ Others occasionally used:
▪ IDEXX ELISA
▪ Cervical test (CT)
▪ On the horizon? I’d like to be optimistic, but am skeptical
3
Antemortem tests in US TB program for cattle/bison
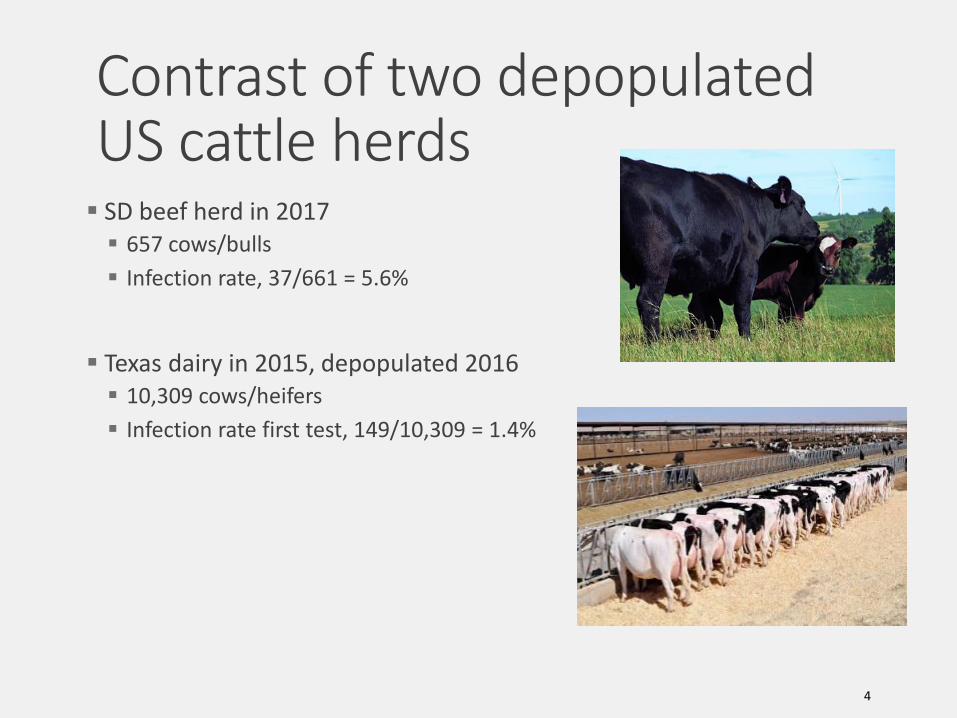
▪ SD beef herd in 2017▪ 657 cows/bulls
▪ Infection rate, 37/661 = 5.6%
▪ Texas dairy in 2015, depopulated 2016▪ 10,309 cows/heifers
▪ Infection rate first test, 149/10,309 = 1.4%
4
Contrast of two depopulated US cattle herds
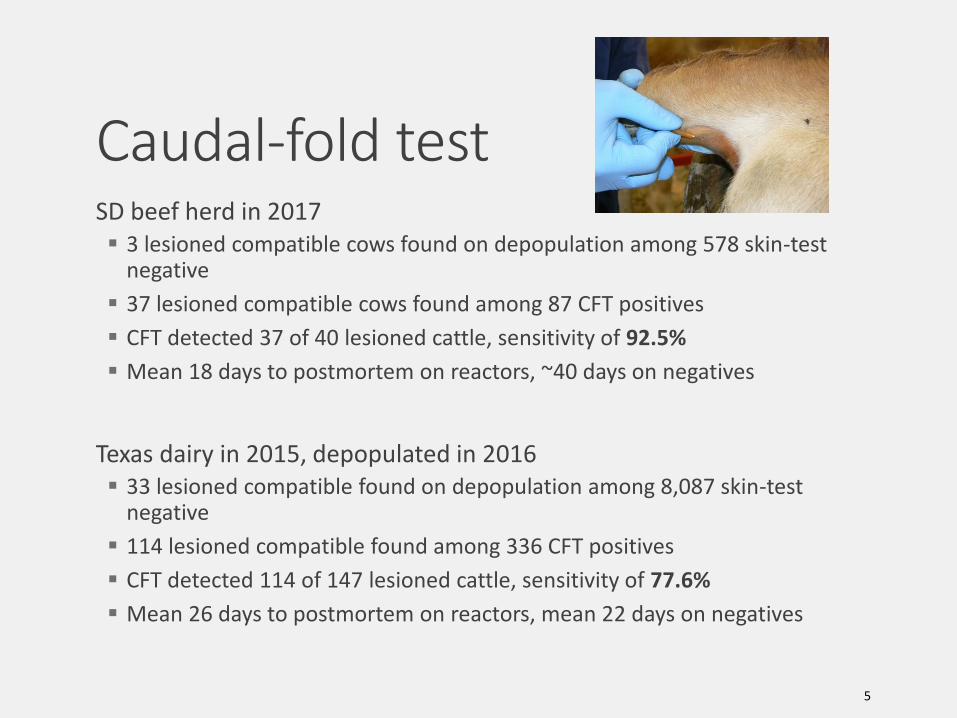
SD beef herd in 2017▪ 3 lesioned compatible cows found on depopulation among 578 skin-test
negative
▪ 37 lesioned compatible cows found among 87 CFT positives
▪ CFT detected 37 of 40 lesioned cattle, sensitivity of 92.5%
▪ Mean 18 days to postmortem on reactors, ~40 days on negatives
Texas dairy in 2015, depopulated in 2016▪ 33 lesioned compatible found on depopulation among 8,087 skin-test
negative
▪ 114 lesioned compatible found among 336 CFT positives
▪ CFT detected 114 of 147 lesioned cattle, sensitivity of 77.6%
▪ Mean 26 days to postmortem on reactors, mean 22 days on negatives
5
Caudal-fold test
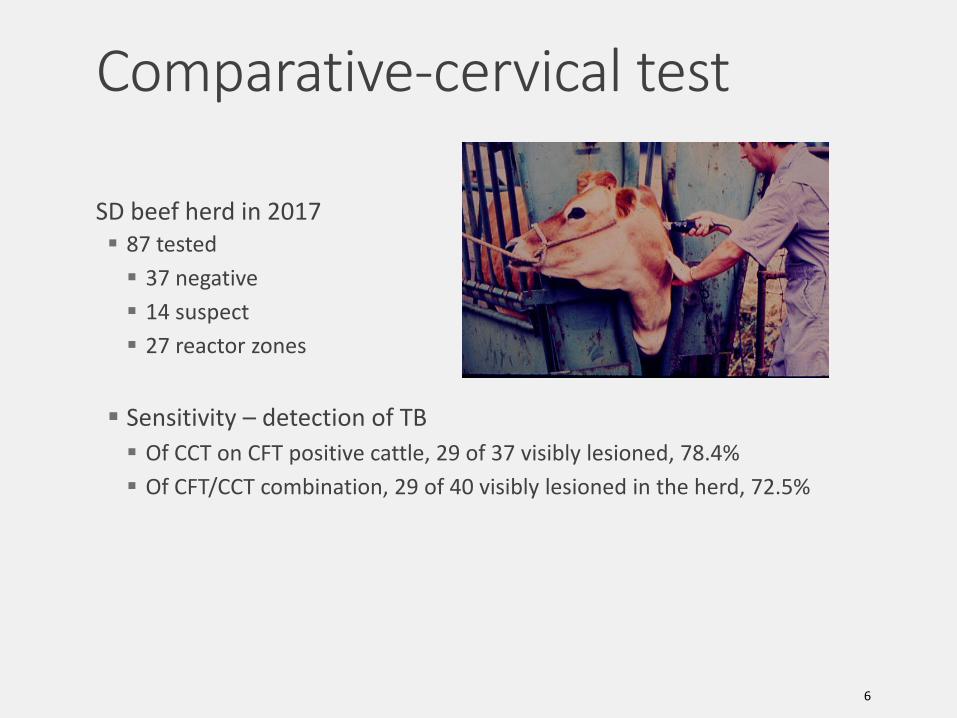
SD beef herd in 2017▪ 87 tested
▪ 37 negative
▪ 14 suspect
▪ 27 reactor zones
▪ Sensitivity – detection of TB
▪ Of CCT on CFT positive cattle, 29 of 37 visibly lesioned, 78.4%
▪ Of CFT/CCT combination, 29 of 40 visibly lesioned in the herd, 72.5%
6
Comparative-cervical test
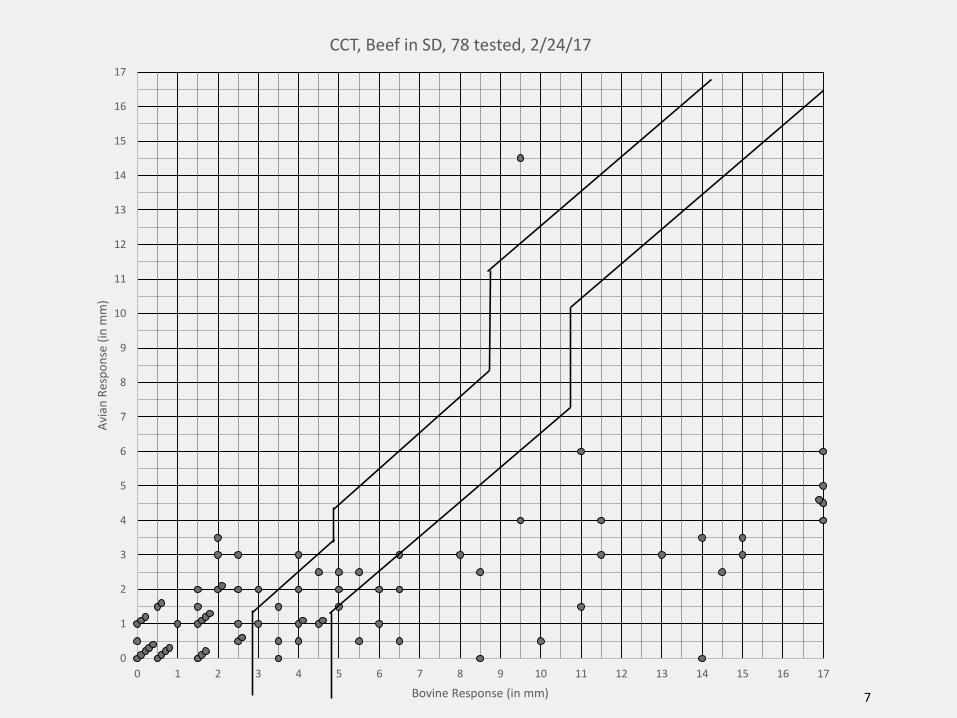
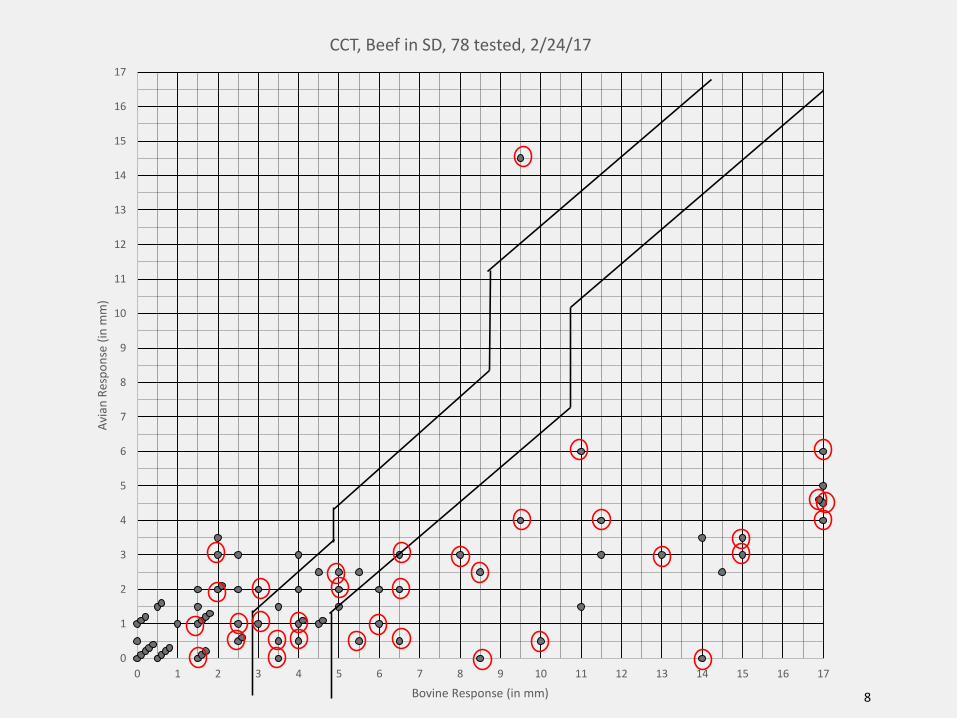
7
0
1
2
3
4
5
6
7
8
9
10
11
12
13
14
15
16
17
0 1 2 3 4 5 6 7 8 9 10 11 12 13 14 15 16 17
Avi
an R
esp
on
se (
in m
m)
Bovine Response (in mm)
CCT, Beef in SD, 78 tested, 2/24/17
8
0
1
2
3
4
5
6
7
8
9
10
11
12
13
14
15
16
17
0 1 2 3 4 5 6 7 8 9 10 11 12 13 14 15 16 17
Avi
an R
esp
on
se (
in m
m)
Bovine Response (in mm)
CCT, Beef in SD, 78 tested, 2/24/17
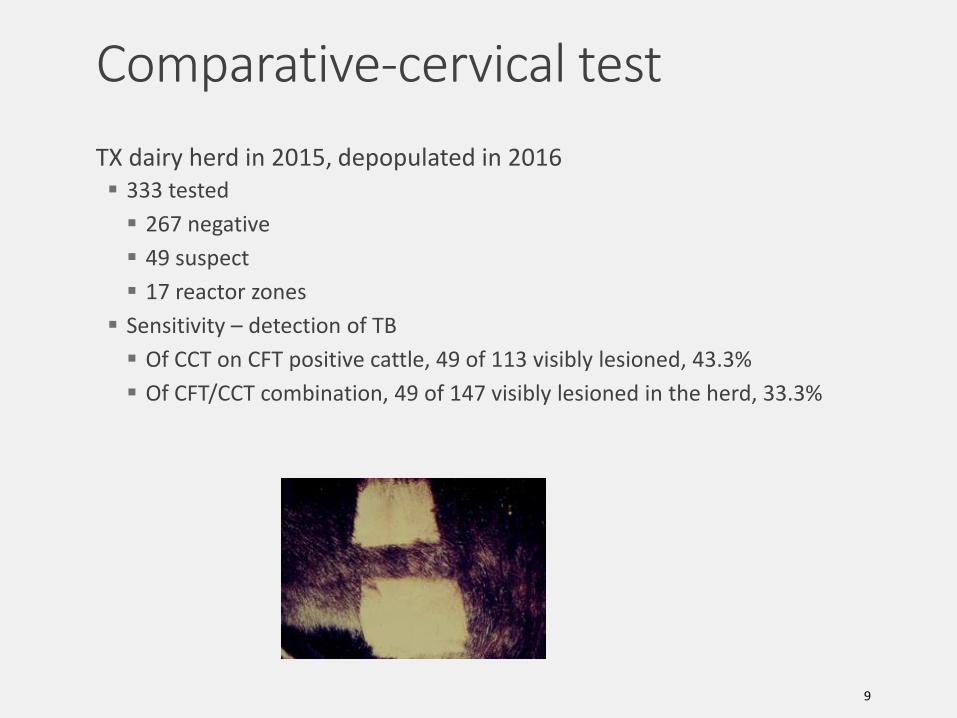
TX dairy herd in 2015, depopulated in 2016▪ 333 tested
▪ 267 negative
▪ 49 suspect
▪ 17 reactor zones
▪ Sensitivity – detection of TB
▪ Of CCT on CFT positive cattle, 49 of 113 visibly lesioned, 43.3%
▪ Of CFT/CCT combination, 49 of 147 visibly lesioned in the herd, 33.3%
9
Comparative-cervical test
10
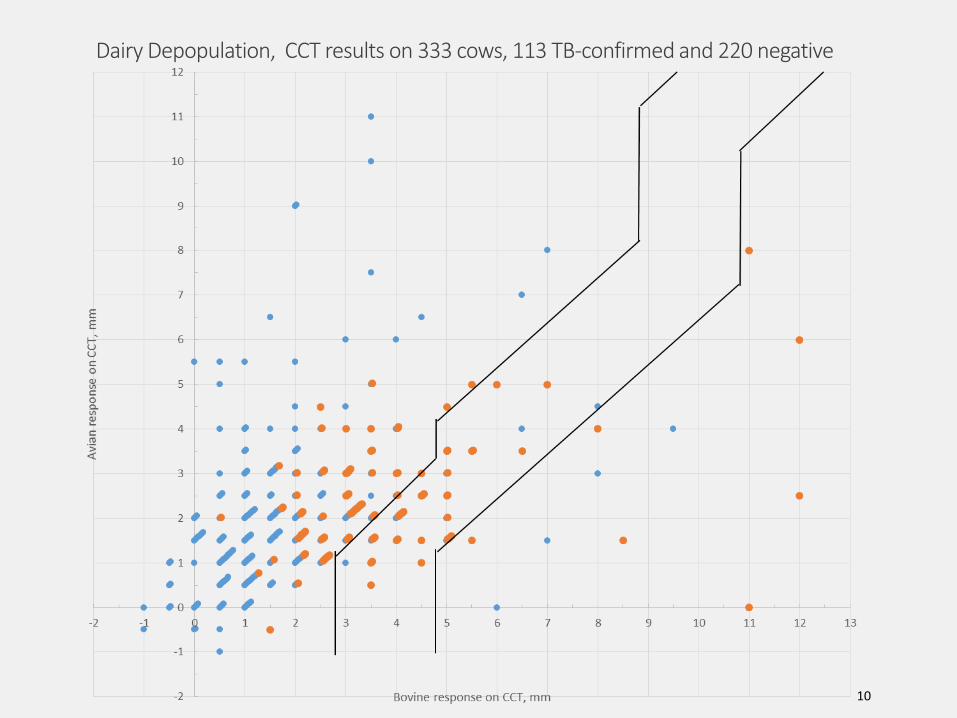
Dairy Depopulation, CCT results on 333 cows, 113 TB-confirmed and 220 negative
Major interest is sensitivity in detecting TB in skin-test negative cattle
SD beef herd in 2017▪ 3 lesioned compatible cows found on depopulation among 578 skin-test
negative
▪ All 3 negative to IDEXX ELISA (0% sensitivity)
Texas dairy in 2015▪ 33 lesioned compatible found on depopulation among 8,087 skin-test
negative
▪ 27 had IDEXX ELISA results
▪ 19 positive (19/27 = 70% sensitivity), 7 of these were CFT positive 6 months earlier
▪ 8 negative, 1 of these was CFT positive 6 months earlier
▪ 19, Removing positives from earlier tests
▪ 12 positive (12/19 = 63% sensitivity)
▪ 7 negative
11
IDEXX ELISA test
0.00%
10.00%
20.00%
30.00%
40.00%
50.00%
60.00%
70.00%
80.00%
90.00%
100.00%
SD beef TX dairy
Sen
siti
vity
fo
r vi
sib
le c
om
pat
ible
lesi
on
s
CFT CCT IDEXX ELISA*
12
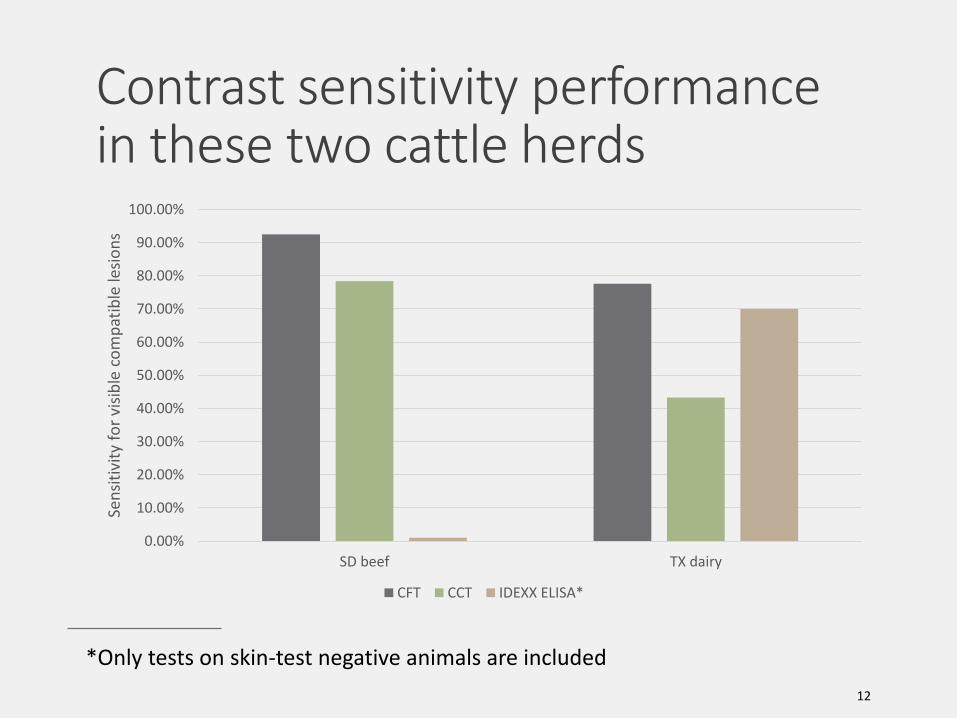
Contrast sensitivity performance in these two cattle herds
*Only tests on skin-test negative animals are included
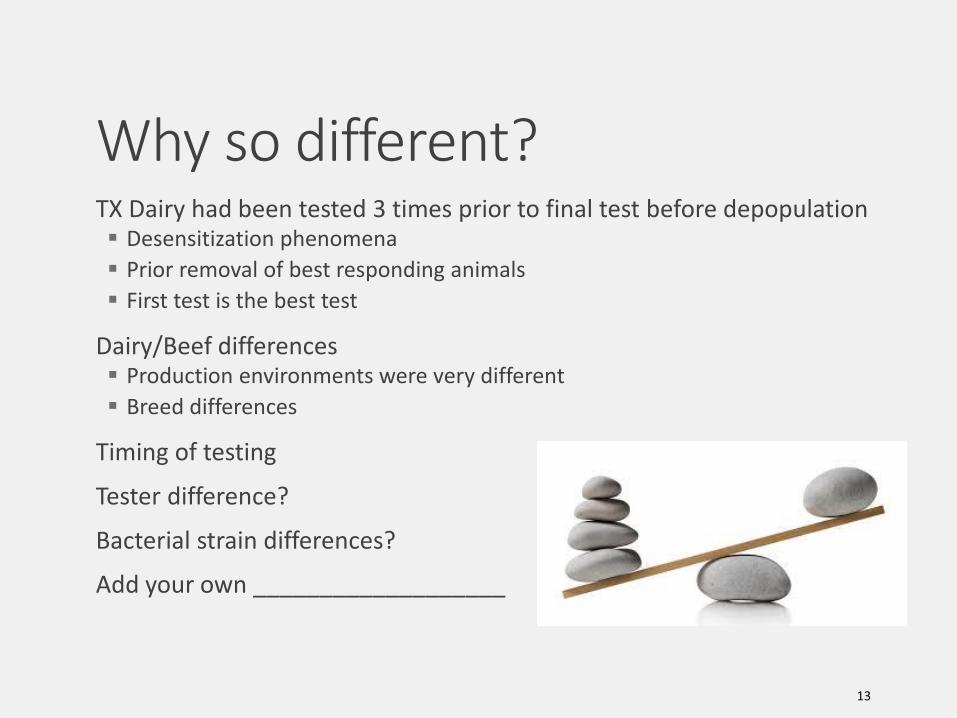
TX Dairy had been tested 3 times prior to final test before depopulation▪ Desensitization phenomena
▪ Prior removal of best responding animals
▪ First test is the best test
Dairy/Beef differences▪ Production environments were very different
▪ Breed differences
Timing of testing
Tester difference?
Bacterial strain differences?
Add your own ___________________
13
Why so different?
Mark SchoenbaumNational Epidemiologist, Cattle Health CenterU.S. Department of AgricultureAnimal and Plant Health Inspection ServiceVeterinary [email protected]