tb87: delivery costs per package on wholesale milk routes
TRANSCRIPT

The University of MaineDigitalCommons@UMaine
Technical Bulletins Maine Agricultural and Forest Experiment Station
10-1-1977
TB87: Delivery Costs per Package on WholesaleMilk Routes: A Comparison of Two Methods ofCost AllocationNicholas E. Flanders
Homer B. Metzger
Follow this and additional works at: https://digitalcommons.library.umaine.edu/aes_techbulletin
Part of the Agricultural Economics Commons
This Article is brought to you for free and open access by DigitalCommons@UMaine. It has been accepted for inclusion in Technical Bulletins by anauthorized administrator of DigitalCommons@UMaine. For more information, please contact [email protected].
Recommended CitationFlanders, N.E., and H.B. Metzger. 1977. Delivery costs per package on wholesale milk routes: A comparison of two methods of costallocation. Life Sciences and Agriculture Experiment Station Technical Bulletin 87.

DELIVERY COSTS PER PACKAGE ON WHOLESALE MILK ROUTES
A Comparison of Two Methods of Cost Allocation
by
Nicholas E. Flanders and Homer B. Metzger
LIFE SCIENCES AND AGRICULTURE EXPERIMENT STATION
UNIVERSITY OF MAINE AT ORONO
TECHNICAL BULLETIN 87 OCTOBER 1977

ACKNOWLEDGMENT
The cooperation of numerous milk dealers and their employees made this study possible and we acknowledge it with appreciation. The authors are also indebted to Cathy Pollis, work study student, for assistance in data processing and to Gilberte Violette, secretary, for typing drafts of the manuscript. Also acknowledged is the consulting support provided by colleagues on analytical procedures.
This research was supported by funds made available through the Hatch Act. The preparation of the report was financially assisted by the State of Maine, Department of Agriculture—Maine Milk Commission Appropriation Account Number 4105-1001.

CONTENTS Page
SUMMARY 3
CONCLUSIONS 5
INTRODUCTION 6
REVIEW OF LITERATURE . . . . 7
METHOD AND SCOPE OF STUDY 8
Dealer and Route Selection 8
Dealers Included in Study 9
Route Timing Procedures . . . 9
Analytical Procedures 10
Labor Unit System 10
Case Unit System 11
Costing Procedures 12
Data Processing Methods 13
LABOR USED PER PACKAGE 13
Labor Unit System 13
Minutes per Package 13
Labor Relatives . . . 14
Case Unit System . . 16
Minutes per Package 16
Labor Relatives 17
Direct Delivery Time Per Labor Unit (Half Gallon Equivalent) By Size and Type of Stop 17
Delivery Time 17
Half Gallon Equivalents Per Stop 17
Delivery Time Per Half Gallon Equivalent 19
TOTAL DELIVERY COSTS PER PACKAGE 21
Labor Unit System 21
Case Unit System 23
Comparison of Costs Under the Two Allocation Systems 25
Discussion . . 2 6
REFERENCES CITED 27
APPENDIX 28

ACKNOWLEDGMENT
The cooperation of numerous milk dealers and their employees made this study possible and we acknowledge it with appreciation. The authors are also indebted to Cathy Pollis, work study student, for assistance in data processing and to Gilberte Violette, secretary, for typing drafts of the manuscript. Also acknowledged is the consulting support provided by colleagues on analytical procedures.
This research was supported by funds made available through the Hatch Act. The preparation of the report was financially assisted by the State of Maine, Department of Agriculture—Maine Milk Commission Appropriation Account Number 4105-1001.
FOREWORD
Metric measures are now printed in parentheses after the English measure on some milk packages. Very few changes have occurred in package sizes at this stage in the conversion to metric measurements. Changes in the size of package to even units in the metric system (litre) will be influenced by the cost of needed changes in both filling machines and packages.
The metric measures of the principal milk packages in current use are as follows:
English Metric
Liquid Volume
Half Pint .237 litre Pint .473 litre Quart .946 litre Half Gallon 1.893 litre Gallon 3.786 litre 1.5 Gallon 5.679 litre 3 Gallon 11.358 litre 5 Gallon 18.930 litre 6 Gallon 22.716 litre
Weight
8 ounce 227 grams 12 ounce 340 grams
I pound 454 grams 2 pounds 907 grams 5 pounds 2.3 kilograms
30 pounds 13.6 kilograms

DELIVERY COSTS PER PACKAGE ON WHOLESALE MILK ROUTES
A comparison of two methods of cost allocation
Nicholas E. Flanders1 and Homer B. Metzger2
SUMMARY
Wholesale delivery costs per package were derived using two methods of cost allocation—labor units and case units. Data from time studies on 14 wholesale milk routes and financial data from 14 processor-distributors in the State of Maine were used in the analyses.
Labor relatives were developed for each package under each cost allocation method. The relatives equated all other package sizes to a half gallon package in terms of the relative amount of direct delivery time used on it. The labor unit method equated packages to half gallons on the basis of relative variable direct delivery time, the case unit method equated packages by the relative total (fixed and variable) direct de-
1 Research Assistant in Agricultural and Resource Economics. 2 Professor of Agricultural and Resource Economics.
4 LSA EXPERIMENT STATION TECHNICAL BULLETIN 87
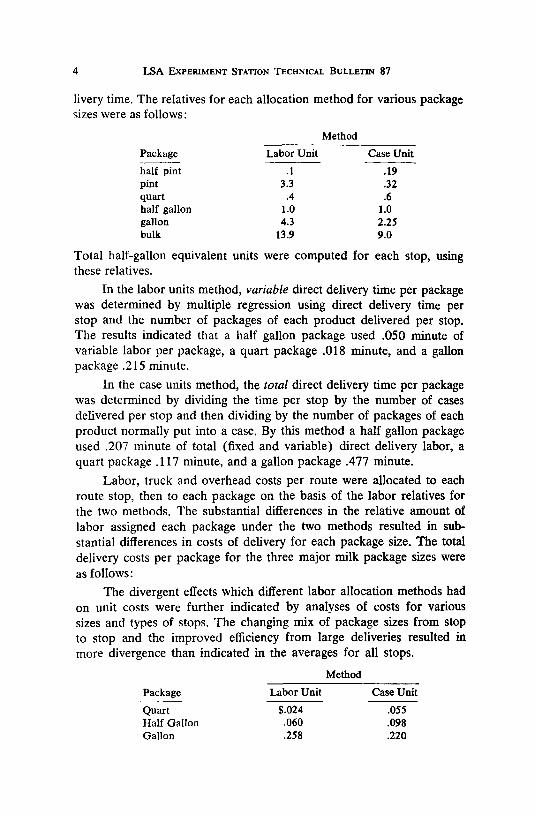
livery time. The relatives for each allocation method for various package sizes were as follows:
Method
Package Labor Unit Case Unit
half pint .1 .19 pint 3.3 .32 quart .4 .6 half gallon 1.0 1.0 gallon 4.3 2.25 bulk 13.9 9.0
Total half-gallon equivalent units were computed for each stop, using these relatives.
In the labor units method, variable direct delivery time per package was determined by multiple regression using direct delivery time per stop and the number of packages of each product delivered per stop. The results indicated that a half gallon package used .050 minute of variable labor per package, a quart package .018 minute, and a gallon package .215 minute.
In the case units method, the total direct delivery time per package was determined by dividing the time per stop by the number of cases delivered per stop and then dividing by the number of packages of each product normally put into a case. By this method a half gallon package used .207 minute of total (fixed and variable) direct delivery labor, a quart package .117 minute, and a gallon package .477 minute.
Labor, truck and overhead costs per route were allocated to each route stop, then to each package on the basis of the labor relatives for the two methods. The substantial differences in the relative amount of labor assigned each package under the two methods resulted in substantial differences in costs of delivery for each package size. The total delivery costs per package for the three major milk package sizes were as follows:
The divergent effects which different labor allocation methods had on unit costs were further indicated by analyses of costs for various sizes and types of stops. The changing mix of package sizes from stop to stop and the improved efficiency from large deliveries resulted in more divergence than indicated in the averages for all stops.
Method
Package Labor Unit Case Unit
Quart Half Gallon Gallon
$.024 .060 .258
.055
.098
.220

LSA EXPERIMENT STATION TECHNICAL BULLETIN 87 5
The total delivery costs per half gallon package for small stores, restaurants, and other stops were as follows for each method:
Type of Stop Method
Labor Unit Case Unit
Small Store $.073 $.113 Large Store .044 .076 Restaurant .094 .121 Other .089 .115
Total direct labor used per half gallon package varied from .19 minute for large stores to .13 minute for restaurants using the labor unit method and from .40 minute to .17 minute for store and restaurant, respectively, using the case unit method.
The total delivery costs per half gallon package for various size-of-stop categories were as follows for each method:
Method
Cases per Stop Labor Unit Case Unit
Under 3 $.120 $.176 5 9.9 .075 .118 40 or over .038 .064
Total direct labor used per half gallon package varied from .34 minute for delivery of less than three cases to .07 minute for delivery of 40 or more cases (average 52 cases), using the labor unit method and from .48 minute to .12 minute for less than three and 40 or more cases, respectively, using the case unit method.
CONCLUSIONS
The regression technique used to determine relative amounts of labor used per package in wholesale milk delivery resulted in substantial differences between the more conventional time per case and the number of packages per case approach. The former method understated quart and half gallon package delivery costs and overstated gallon package delivery costs relative to the latter method. Either method accounts for all costs of delivery when all packages are considered. Where delivery costs per package are used as a basis for establishing minimum retail and wholesale milk prices, and prices are fixed on principal packages only, the case method of allocating costs is the preferred method in view of the results of this study.

6 LSA EXPERIMENT STATION TECHNICAL BULLETIN 87
INTRODUCTION
Under the Maine Milk Commission Law (Title 7, Chapter 603) which became effective October 1, 1975, the commission is vested with power to establish and change minimum wholesale and retail prices. "The minimum wholesale prices paid to dealers shall be established to reflect the lowest prices at which milk purchased from Maine producers at Maine minimum prices can be received, processed, packaged, and distributed within the State of Maine at a just and reasonable return." The law further requires that the commission conduct independent studies of the economics and practices of the milk industry at least every three years, in order to assist the commission in establishing minimum prices.
The current law, through commission mandate, places on milk processor distributors an obligation to provide more detailed accounting of expenditures than previously required. It also necessitates the establishment of acceptable methods for allocation of expenditures to various products and packages. In recognition of this, a joint industry—university—commission effort was made in 1976 to establish accounting and allocation procedures which ultimately should provide the detailed unit costs needed to administer the law. An independent investigation of milk processing and distribution costs was undertaken late in 1976 which incorporated uniform accounting and allocation of expenditure methods. (9)
While financial information was collected and procedures established for allocating operating expenses to cost centers and to packages, the methodology used is subject to refinement or change. For cost centers with multi-products or multi-packages the allocation of costs is complicated. The principal issue is whether or not operating costs should be allocated on the basis of (1) relative volume (quarts equivalent) (2) relative number of cases (and packages per case) or (3) by the relative amount of labor expended on each package. In packaging operations, each product is handled separately by size and type of container and comparative amounts of labor used may be readily ascertained. In delivery operations, a bundle of various packages and products is usually delivered simultaneously, and comparative amounts of labor may be obtained only with difficulty. As a result, in allocating delivery costs to packages often the quart equivalent volume handled, or the cases handled have been used as a means of allocating costs. In view of the importance

LSA EXPERIMENT STATION TECHNICAL BULLETIN 87 7
of labor in delivery expenses, a procedure for allocating costs which reflects more precisely the labor used per package would be preferred.
This study of milk delivery operations was undertaken to develop labor relatives for different packages and to compare unit costs of delivery computed by using these relatives. A principal issue was whether or not variable direct labor was a better measure than total direct labor for allocating costs to various packages. Delivery operations on milk routes were timed to determine the amount of labor used in performing various functions in serving wholesale customers. This route information and the financial information on dealer delivery operations comprised the data base for the analyses.
REVIEW OF LITERATURE Three methods of allocating costs to diverse package sizes and
types were found in a review of the literature. These were: relative volume (quart equivalents), relative number of cases delivered, and the labor expended on each package.
Purcell and Elrod: Purcell, Goodwin and Elrod; and Goodwin, Purcell and Elrod (10, 11, 6) used quart equivalents, i.e., volume, to determine the labor time standards for efficient wholesale delivery systems. Hallberg and Kriebel (7) also used quart equivalencies towards similar ends.
Devino and Aplin (4) used cases as a standard unit for setting delivery time standards to perform some delivery functions on wholesale stops, but used 'units' for developing labor time standards for the actual delivery to and servicing of a stop. A "unit" was defined by them as a "quart of any product except cream. A half pint of cream was considered to be a unit. A pound of butter or a dozen eggs was also one unit." (p. 5). McDaniel and Wilson (8) used a similar system. Quart equivalents (volume) were used for all milk units, pint equivalents were used for cream, and all other products were counted by the actual number of container units.
Cook, Halvorson and Robinson (2); Courtney and Brooks (3); and Fletcher and McKinney (5) used the California Bureau of Milk Control Stabilization's labor units to analyze labor costs in their distribution cost studies. This system equated different package sizes and products on the basis of the relative amount of labor used to deliver each package. "Each labor unit is theoretically equivalent—in terms of its labor requirement in wholesale delivery—to a single quart of milk" (Courtney and Brooks, p. 6). The studies made adjustments in the California system for local differences. One changed the common denominator and incorporated the use of equipment as well as labor in arriv-

8 LSA EXPERIMENT STATION TECHNICAL BULLETIN 87
ing at units. "A quart of homogenized milk in a paper or plastic carton was used as the common denominator for weighting products for wholesaling. Time and equipment required to deliver a quart of homogenized milk compared to those requirements for dairy products were the basis upon which the cost factors were determined." (Fletcher and McKin-ney,p. 10.)
Christensen, Palmer and Davis (1) found previous systems of labor units, point systems and quart equivalencies inadequate for their study of distribution costs. Instead, they developed a labor unit system from "time and motion study data using multiple regression and analysis of variance. One labor unit was set equivalent to the amount of variable driver time required at the customer stop to deliver one unit of the most common size and type of product at the most common types of customer stops." (p. 2) The basic unit was a half gallon of whole milk in a paper container.
METHOD AND SCOPE OF STUDY
Dealer and Route Selection
Fourteen wholesale and eight mixed (wholesale and retail) milk delivery routes operating within the State of Maine were studied during July and August of 1976. These routes were drawn from the milk delivery operations of 28 milk dealers licensed by the Maine Milk Commission. A sample of 16 dealers was drawn for the study. Of these, eight were selected for operating wholesale routes exclusively, while the other eight represented a 40 percent sample of all those who operated mixed (wholesale and retail) routes in the state. These mixed route dealers were chosen randomly—four from the southern part of the state and four from the northern portion. In all, 9 wholesale and 4 mixed routes were studied in the southern part of the state and 5 wholesale and 4 mixed routes in the northern portion. However, data from only the 14 wholesale routes were used in this report. In all, 329 stops were analyzed on these routes of which 296 involved delivery of products.
Two routes of milk dealers who delivered more than 10,000 quarts of Class I milk per day and one route of dealers who delivered less than that amount were included in the sample. Where two routes of one dealer were included in the sample, one route was an "out-of-town" route and the other an "in-town" route. An in-town route was defined as one on which the milk truck traveled fewer than 50 miles round trip in a single day, or as one on which deliveries were made entirely within the urban area where the processing plant was located. With dealers among whom a single delivery route was selected, in-town and out-of-town

LSA EXPERIMENT STATION TECHNICAL BULLETIN 87 9
routes were alternated between dealers. Three in-town and five out-of-town mixed routes and seven out-of-town and seven in-town wholesale routes were studied.
The route(s) of any particular dealer studied was randomly selected from a list of all routes to be operated on the day of the route study, divided into two groups: in-town and out-of-town. When only one route of a particular milk processor was selected the determination as to whether it was to be an in-town or out-of-town route was made by flipping a coin for the first such processor and then alternating types of routes from that point on. For those milk dealers among whom two routes were selected, the day on which a particular route was ridden was determined by a flip of a coin.
Dealers Included in Study
The dealers who participated in the route studies were: Clark's Southwest Dairy, Cote's Dairy, Footman's Dairy, Gonneville's Dairy, Grant's Dairy, H. P. Hood, Houlton Farms Dairy, Hunt's Dairy, Locust Farm Dairy, Macomber's Dairy, Oakhurst Dairy, Old Tavern Farm, Schoppee's Dairy, Smiley's Dairy, Third Hill Farm and H. S. White and Sons. The nine dealers whose wholesale routes were studied for this report are indicated by italics.
Route Timing Procedures
The field investigator rode with the driver for one complete route day and recorded segments of time for the entire route by stopwatch. Time on the route was broken down into categories. First, for the time spent by the driver in the plant, separate timings were made on (1) the loading of the truck; (2) the unloading of the truck after the driver had returned from his deliveries; (3) the check-out of the driver's load, receipts and cash; (4) the servicing of the truck by the driver, and (5) miscellaneous time, such as coffee breaks. Secondly, on the route, the time was broken down for each stop into (1) the time used to drive to the stop; (2) the time used to park the truck and get the order; (3) the time used to put up the order in the truck and to deliver it to the delivery area in the store, and to return empty cases to the truck; (4) the time used to service the stop which included arranging the packages in the case, pricing, cleaning the case, taking milk from the cooler to the display case, pulling out-of-date milk, and other services; (5) the time used to write up a receipt or bill, to have the receipt checked by the recipient and to collect the bill; (6) other time spent in the stop, usually in customer relations; (7) the time spent to account, i.e. maintain

10 LSA EXPERIMENT STATION TECHNICAL BULLETIN 87
customer records, beyond the actual collection process; (8) the time spent to arrange the load in the truck; (9) personal time; and (10) miscellaneous time on the route, such as in delivery vehicle breakdown. Recalls, or returning to a stop a second time in one day were treated as separate stops.
Wholesale stops, whether on wholesale or mixed routes, were distinguished by four categories: small stores, large stores, restaurants and others, (such as nursing homes and hospitals). Small stores were defined as having two or less cash registers. Retail stops were divided among single family dwellings, two family dwellings, and apartment houses, i.e., three or more family dwellings.
Data were also collected on the type and length of the truck, the miles driven to each stop, the total miles driven, and the total time, measured by a separate clock, spent by the driver from the time he arrived at the plant or depot in the morning until he completed work for the day.
The quantities of milk delivered were recorded upon returning to the plant by the field investigator from the receipts prepared for the wholesale stops and the route book for the retail stops. This was usually done with the driver present to answer any questions.
Analytical Procedures
Two systems of analyzing the labor expended per package were developed and used to measure total volume handled and to allocate costs to individual packages. The first system, labor units, used the variable direct labor expended on each package to determine labor relatives for each package, with the half gallon package equal to a value of one.3 These relatives were used to compile total labor units handled and to allocate labor, truck and overhead costs to the various packages. The second system, case units, used the total direct labor per case and the number of packages per case to determine labor relatives. The procedure assumed each case delivered used the same amount of labor regardless of the type of product or size of package it contained.
Labor Unit System. The variable delivery time used to deliver a package was determined by regression analysis using route time study data. The number of packages, for seven package-size variables, and five dummy variables for stop and route characteristics, were regressed with the total time spent by the driver delivering at a stop as the dependent variable. A multiple linear regression equation was formulated:
8 The procedure was that used by Christensen, Palmer and Davis [1].
LSA EXPERIMENT STATION TECHNICAL BULLETIN 87 11
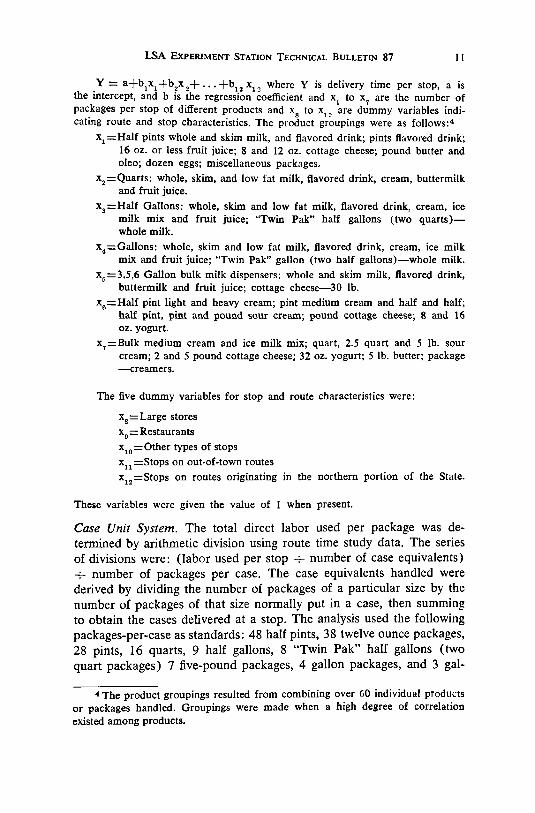
Y = a+b 1 x 1 +b 2 x 2 +. . .+b 1 2 x12 where Y is delivery time per stop, a is the intercept, and b is the regression coefficient and xt to x7 are the number of packages per stop of different products and xg to x^ are dummy variables indicating route and stop characteristics. The product groupings were as follows:4
x^Half pints whole and skim milk, and flavored drink; pints flavored drink; 16 oz. or less fruit juice; 8 and 12 oz. cottage cheese; pound butter and oleo; dozen eggs; miscellaneous packages.
x2=:Quarts: whole, skim, and low fat milk, flavored drink, cream, buttermilk and fruit juice.
x3=Half Gallons: whole, skim and low fat milk, flavored drink, cream, ice milk mix and fruit juice; "Twin Pak" half gallons (two quarts)— whole milk.
xt=Gallons: whole, skim and low fat milk, flavored drink, cream, ice milk mix and fruit juice; "Twin Pak" gallon (two half gallons)—whole milk.
xf=3,5,6 Gallon bulk milk dispensers: whole and skim milk, flavored drink, buttermilk and fruit juice; cottage cheese—30 lb.
xB=Half pint light and heavy cream; pint medium cream and half and half; half pint, pint and pound sour cream; pound cottage cheese; 8 and 16 oz. yogurt.
x7=Bulk medium cream and ice milk mix; quart, 2.5 quart and 5 lb. sour cream; 2 and 5 pound cottage cheese; 32 oz. yogurt; 5 lb. butter; package —creamers.
The five dummy variables for stop and route characteristics were:
xg=Large stores x9=Restaurants x10=: Other types of stops x l l=Stops on out-of-town routes x12=Stops on routes originating in the northern portion of the State.
These variables were given the value of 1 when present.
Case Unit System. The total direct labor used per package was determined by arithmetic division using route time study data. The series of divisions were: (labor used per stop -+- number of case equivalents) -— number of packages per case. The case equivalents handled were derived by dividing the number of packages of a particular size by the number of packages of that size normally put in a case, then summing to obtain the cases delivered at a stop. The analysis used the following packages-per-case as standards: 48 half pints, 38 twelve ounce packages, 28 pints, 16 quarts, 9 half gallons, 8 "Twin Pak" half gallons (two quart packages) 7 five-pound packages, 4 gallon packages, and 3 gal-
4 The product groupings resulted from combining over 60 individual products or packages handled. Groupings were made when a high degree of correlation existed among products.

12 LSA EXPERIMENT STATION TECHNICAL BULLETIN 87
lon-and-half packages. Large bulk packages, such as 3,5, and 6 gallon bulk milk dispensers and boxes of creamers were assumed to be the equivalent of one case.
Costing Procedures
Annual operating costs for 14 Maine milk dealers with mixed (retail and wholesale) route and wholesale route operations, obtained from data provided the Maine Milk Commission in a December 1976 survey, were used as a cost base. The annual costs were adjusted to costs per labor minute, per truck mile and per overhead unit, then applied to the physical data obtained from route observations to determine route delivery costs per stop and per package for various sizes and types of stops.
Annual costs per firm for labor, truck, and overhead were converted to costs per route using number of routes reported in the December survey. Costs per route were converted to costs per route day assuming routes were operated 260 days per year (5 days per week). Labor costs per day were divided by the average number of minutes of route men's time per route day (591 minutes) and the truck costs per day were divided by the average miles per route day (59 miles) to obtain costs per labor minute and per truck mile. Overhead route costs per day were divided by the number of labor units or case units handled per route delivery day to obtain an overhead cost per labor unit or case unit.
The total cost per stop was determined separately for each of the two systems using the same procedure except for the units used in allocating indirect costs (labor units or case units). The procedure was as follows:
Labor Costs Direct: minutes per stop x labor cost per minute Indirect: minutes per labor unit, or per case x number of units or
cases per stop x labor cost per minute Total: direct + indirect
Truck Costs Direct: miles to stop x truck cost per mile Indirect: miles per labor unit, or per case x number of units, or
cases, per stop x truck cost per mile Total: direct -(- indirect
Overhead Costs Labor units or case units delivered to each stop x overhead cost per labor unit or case unit
Total Costs: Total Labor + Total Truck + Overhead

LSA EXPERIMENT STATION TECHNICAL BULLETIN 87 13
Total costs per package were computed by dividing the total cost per stop by the total number of labor units (half gallon equivalents) handled under each system. The resultant cost per half gallon was multiplied by the labor relatives for other package sizes to obtain costs per unit under each system.
Data Processing Methods
The data on individual stops were analyzed using the Statistical Package for the Social Sciences (SPSS) available at the Computer and Processing Services at the University of Maine at Orono. Data on the routes were analyzed using SPSS and various packaged programs on the CMS Environment at the University of Maine at Orono.
LABOR USED PER PACKAGE An average of 307 minutes of a routeman's day was spent in direct
delivery operations. A total of 1633 packages or 159 cases of product was delivered per route day. The time to perform various delivery services and the quantity of individual packages delivered per route are reported in Appendix table 1.
The time used to deliver a package varied widely among packages and differences due to the methods of allocation used were substantial. Allocations based upon the variable time per package for delivery resulted in less time being charged to half gallon packages and more time to gallon packages than did allocations based upon the total time to deliver a package. The time used per package and the labor relatives per package developed under each system of allocation are presented in the following sections followed by a comparison of time used per half gallon equivalent for various sizes and types of delivery stops.
Labor Unit System Minutes per Package. The solution of the least squares regression equation resulted in:
Y=7.20 + .007x1* + .018x2 + .050x3 + .215x4** + .693x6** + .163x„** (.004) (.028) (.018) (.024) (.213) (.023)
+ .130x7 + 11.785xa** - 2.571x9 - 3.075x](1* + 1.379n# + 1.212x12# (.108) (1.519) (.824) (1.398) (.717) (.733)
r2= .84 F = 124.95**
where: ( ) indicates standard error of coefficient
# indicates significance at the .10 level * indicates significance at the .05 level
** indicates significance at the .01 level

14 LSA EXPERIMENT STATION TECHNICAL BULLETIN 87
A summary of the regression coefficients with identification of the variables is presented in Table 1.
Half gallon packages took .05 minutes of direct variable delivery time per package. Gallons took .215 minutes per package to deliver. Half pints and pints of cream and milk by-products showed a delivery time of .163 minutes per package. Each of these coefficients was statistically significant at the one percent level.
Half pints of milk and small miscellaneous packages took only .007 minute per package in comparison to the half pints of cream and by-products at .163 minute. Half pints of milk were usually delivered to restaurants and institutions where they were not removed from the case by the driver. Half pints of cream and milk by-products were mainly delivered to stores where they were put out in a display case by the driver and, therefore, required more handling time.
The regression equation showed that quarts used .018 minute per package of direct variable labor and that this amount of labor time was not significantly different from zero. Multicollinearity existed among the independent variables. Pearson's r equalled .79, between quarts and half gallons and .78 between half gallons and gallons. Since gallon packages correlated more closely with the dependent variable than other packages, the time estimated to deliver gallon packages was probably overestimated. The time to deliver quart and half gallon packages was, therefore, probably underestimated.
Bulk milk dispensers (3, 5, 6 gallon packages) took .69 minute per package while large miscellaneous packages took .13 minute. Only the labor minutes for the bulk dispenser package was significantly different from zero minutes, Table 1.
Large stores used an additional 12 minutes of fixed delivery labor above that used at a small store. Restaurants and other wholesale stops averaged three minutes less of fixed time than the small stores.
Stops on out-of-town routes took 1.4 minutes longer than stops on in-town routes. This difference was significant at the 10 percent level of confidence. The stops made by northern dealers took 1.2 minutes longer per stop than southern dealers. The difference in fixed delivery time between stops made on routes originating in the southern portion of the State and those in the northern portion was significant at the 10 percent level.
Labor Relatives. The variable labor used to deliver one half gallon package, .05 minute, was set equal to one labor unit and labor relatives computed for the other packages from their variable delivery times.

LSA EXPERIMENT STATION TECHNICAL BULLETIN 87 15
Table 1
Coefficients for 12 Independent Variables in Regression Analysis of the Relationship of Time Per Stop in Milk Delivery to Quantity and Type of Packages Delivered to Small Stores on In-Town Routes in Southern Maine,
July - August 1976
1 Half pints whole and skim milk, and flavored drink; pints flavored drink; 16 oz or less fruit juice; cottage cheese - 8 and 12 oz.; butter and oleo pound; miscellaneous - pkg.; and eggs - doz.
2 Quarts - whole, skim, and low fat milk, flavored drink, cream buttermilk; and fruit juice.
3 Half gallons - whole, skim, and low fat milk, flavored drink, cream, ice milk mix and fruit juice; "Twin Pak" half gallons (two quarts) whole milk.
* Gallons - whole, skim, and low fat milk, flavored drink, cream, ice milk mix and fruit juice; "Twin Pak" gallon (two half gallons) - whole milk.
5 3,5,6 Gallon bulk Dispenser - whole and skim milk, flavored drink, buttermilk and fruit juice; cottage cheese - 30 lb.
6 Half pint light and heavy cream; pint medium cream and half and half; half pint, pint and pound sour cream; pound cottage cheese; 8 and 16 oz. yogurt.
7 Bulk medium cream and ice milk mix; quart, 2.5 qt. and 5 lb. sour cream: 2 and 5 pound cottage cheese; 32 oz. yogurt; 5 lb. butter; pkg. creamers.
8 Large stores - more than two cash registers.
Regression Item Coefficients
minutes Package Sizes
Half Pints & Small Misc. Pkg.1 .007* Quarts2 .018 Half Gallons* .050** Gallons4 .215** 3,5,6 Gallons'*
Bulk Milk Dispenser .693** Half Pint & Pint Cream
and Milk By Products6 .163** Misc. Bulk Pkg.7 .130
Stop Characteristics Large Store8 11.785** Restaurant -2.571* Other5 -3.075*
Route Characteristics Out of Town10 1.379# North11 1.212#
Constant 7.20
r2 = .84 F Value = 124.95**

16 LSA EXPERIMENT STATION TECHNICAL BULLETIN 87
9 Includes nursing homes, factory vending machines, hospitals, etc. 10 Stops on routes that required travelling more than 50 miles in one day
or where deliveries were entirely outside the urban area in which the plant was located.
11 All routes of processors with plants located to the north and east of Waterville, including plants located in Waterville.
# Indicates significance at the .10 level.
* Indicates significance at the .05 level.
** Indicates significance at the .01 level.
Labor relatives varied from .1 for half pint packages to 13.9 for three to six gallon bulk dispenser units, Table 2. Using these relatives, the number of total delivery minutes per package was computed. First the quantity of each package size was multiplied by the relative and the products summed as total labor units or half gallon equivalents per stop. Dividing the stop time by the labor units gave the time per half gallon equivalent. Using the relatives, total delivery time per package was computed using the time per half gallon as a base. Half gallons took .129 minute, quarts .052 minute and gallons .555 minute, Table 2.
Table 2
Labor Relatives and Direct Delivery Time For Various Package Sizes, Labor Unit and Case Unit Bases, 296 Stops, 14 Wholesale Routes, 9 Maine Milk Dealers,
July - August 1976
Packages Package Per
Case
Allocation Basis Allocation Basis
Size
Per
Case Labor Units Case Units Labor Units Case Units
—labor relatives— —minutes per pkg— Half Pint 48 .1 .2 .013 .039 Pint 28 3.3 .3 .426 .067 Quart 16 .4 .6 .052 .117 Half Gallon (Reg) 9 1.0 1.0 .129 .207 Half Gallon
(Twin qts) 8 1.0 1.1 .129 .233 Gallon 4 4.3 2.2 .555 .466 Bulk (3,5,6 gal) 1 13.9 9.0 1.793 1.866 Other Large Pkg! ! 7 2.6 3.0 .335 .621
Based upon 14.1 minutes of direct delivery time, 7.5 cases of products, and 109 labor units per stop.
Case Unit System
Minutes Per Package. Stops on wholesale routes took 14.1 minutes of direct delivery time on the average, including the time to get the order, deliver, service, collect, perform other functions, account and

LSA EXPERIMENT STATION TECHNICAL BULLETIN 87 17
arrange. A total of 7.5 cases was delivered per stop. The average case took 1.9 minutes to deliver, and a half gallon package, at nine to a case, used .207 minute of labor to deliver, Table 2.
Labor Relatives. The number of half gallons per case, 9, was set equal to one labor unit and labor relatives computed for the other packages from their number per case. Labor relatives varied from .2 for half pints to 9.0 for 3-6 gallon bulk dispenser units. Both labor relatives and packages per case for the major package sizes are reported in Table 2. Using these relatives, the number of delivery minutes per package was computed using the time per half gallon as a base. Quarts took .117 minute of direct delivery time. "Twin Pak" quarts (V2 gal) which fit only 8 to a case, used .233 minute per package and gallons used .466 minute of direct delivery time, Table 2.
Direct Delivery Time Per Labor Unit. ( Half Gallon Equivalent) by Size and Type of Stop
Delivery times and labor units were determined for six stop size groupings and for each of four types of stops - small stores, large stores, restaurants and other (primarily hospitals and factories).
An average of 7.5 cases of product was delivered per stop. An average of 5 cases was delivered to small stores, 25 cases to large stores, 4 cases to restaurants and 7 cases to other type stops, Appendix Table 2. The average time to make these deliveries is reported in the section which follows along with the half gallon equivalents represented by the two allocation systems.
Delivery Time. The average delivery time per wholesale stop was 14.1 minutes. Time per stop varied with size of delivery and type of stop. Direct delivery time per wholesale stop ranged from 5.7 minutes at "other" stops, where under three cases were delivered, to 59.9 minutes per stop where over 40 cases were delivered, Table 3. Large stores averaged 42.3 minutes of direct delivery time, and, therefore, were the type of stop using the most delivery labor. Restaurants used the least amount of labor per stop, 7.4 minutes. Delivery labor used per stop increased with the volume delivered from 6.6 minutes per stop where less than three cases were delivered to 58.1 minutes where 40 or more cases were delivered at a stop.
Half Gallon Equivalents Per Stop. As determined by the labor unit system, the average wholesale stop received 109.1 half gallon equivalents, Table 4. As determined by the case unit system the average stop received 67.6 half gallon equivalents, Table 5.

18 LSA EXPERIMENT STATION TECHNICAL BULLETIN 87
Table 3
Average Total Direct Delivery Time Per Stop by Size and Type of Stop, 296 Stops, 14 Wholesale Routes, 9 Maine Milk Dealers, July - August 1976
Number of Cases Small Large Delivered Per Stop Store Store Restaurant Other All
Less than 3 6.7 * 6.4 5.7 6.6 3 - 4.9 12.2 * 7.7 8.5 10.9 5 - 9.9 15.6 25.1 10.4 10.8 14.6
10-19.9 21.0 38.1 7.7 12.4 23.4 20-39.9 * 47.7 * * 36.8 40 or more * 59.9 - - 58.1 A1U 11.5 42.3 7.4 8.8 14.1
1 Weighted by volume.
* Less than three stops reported.
- No stops of this size reported.
Under the labor unit system, the number of half gallon equivalents per stop increased more rapidly with an increase in the size of delivery than did the number of half gallon equivalents determined by the case unit system. The half gallon equivalents derived by the labor unit system went from 19.4, where under three cases were delivered, to 854.0 where 40 or more cases were delivered. In the case unit system the number of half gallon equivalents increased from 13.9 half gallon equivalents delivered, where under 3 cases were delivered per stop, to 471.9 where over 40 cases were delivered.
Table 4
Average Number of Half Gallon Equivalents Per Stop, Labor Unit Basis, by Type and Size of Stop, 296 Stops, 14 Wholesale Routes, 9 Maine Milk Dealers,
July - August 1976
Number of Cases Store
Restaurant Other Delivered Per Stop Small Large Restaurant Other All
Under 3 19.6 * 18.7 19.0 19.4 3 - 4.9 51.5 * 26.8 36.0 49.2 5 - 9.9 100.9 130.4 80.7 73.4 95.0
10-19.9 198.2 318.2 91.9 166.2 215.3 20 - 39.9 * 428.7 * * 350.7 40 or more * 871.0 - - 854.0
Am 66.0 445.4 37.9 67.1 109.1
1 Weighted by volume. * Less than three stops reported.
- No stops of this size reported.

LSA EXPERIMENT STATION TECHNICAL BULLETIN 87 19
For any given level of cases delivered per stop the number of half gallon equivalents varied more among types of stops under the labor unit system than under the case unit system. For instance, where 5 to 9.9 cases were delivered, small stores, large stores, restaurants and other stops received 100.9, 130.4, 80.7 and 73.4 half gallon equivalents, respectively, under the labor unit system, but 62.1, 62.6, 63.2 and 65.9 half gallon equivalents under the case unit system. The changing proportion of package sizes, particularly the percent of gallon packages delivered to large stores, explained the wide variations under the labor unit system. A gallon represented nearly twice as many half gallon equivalent labor units under the labor unit system as under the case unit system.
Table 5 Average Number of Half Gallon Equivalents Delivered Per Stop, Case Unit Basis
by Type and Size of Stop, 296 Stops, 14 Wholesale Routes, 9 Maine Dealers, July - August 1976
Number of Cases Store
Restaurant Other Delivered Per Stop Small Large Restaurant Other All
Less than 3 14.0 * 13.8 13.7 13.9 3 - 4.9 34.7 * 30.8 32.8 33.6 5 - 9.9 62.1 62.6 63.2 65.9 63.0
10-19.9 129.5 125.8 121.4 152.3 128.9 20 - 39.9 * 244.6 * * 234.8 40 or more * 481.6 - - 471.9 Alii 43.5 227.4 34.7 61.5 67.6
1 Weighted by volume. * Less than three stops reported. - No stops of this size reported.
Delivery Time Per Half Gallon Equivalent. Under the labor unit system the delivery labor used per half gallon equivalent averaged .13 minute and ranged from .34 minute at small store and restaurant stops, where under three cases were delivered, to .07 minute at large stores, where over 40 cases were delivered, Table 6. Under the case unit system, a half gallon equivalent used .21 minute of labor to deliver ranging from .48 minute per half gallon equivalent at small store stops, where less than 3 cases were delivered, to .08 minute at restaurants and "other" stops where between 10 and 19.9 cases were delivered, Table 7.
Under the labor unit system, deliveries to large stores used .09 minute of labor, or less labor per half gallon equivalent than any other type of stop. Under the case unit system "other" stops used less labor per half gallon equivalent, .14 minute, than any other type of stop. Large stores under the case unit system used .18 minute of labor per half gallon equivalent.

20 LSA EXPERIMENT STATION TECHNICAL BULLETIN 87
Table 6
Average Direct Delivery Time Per Half Gallon Equivalent, Labor Unit Basis, by Type and Size of Stop, 296 Stops, 14 Wholesale Routes, 9 Maine Dealers,
July - August 1976
Number of Cases Store
Restaurant Other Delivered Per Stop Small Large Restaurant Other All
—minutes— Under 3 .34 * .34 .30 .34
3 - 4.9 .24 * .29 .24 .22 5 - 9.9 .15 .19 .13 .15 .15
10-19.9 .11 .12 .08 .07 .11 20 - 39.9 * .11 * • .10 40 or more * .07 - - .07 AlH .17 .09 .20 .13 .13
1 Weighted by volume. * Less than three stops reported. - No stops of this size reported.
Table 7
Average Direct Delivery Time Per Half Gallon Equivalent, Case Unit Basis, by Type and Size of Stop, 296 Stops, 14 Wholesale Routes, 9 Maine Dealers,
July - August 1976
Number of Cases Store
Restaurant Other Delivered Per Stop Small Large Restaurant Other All
—minutes— Less than 3 .48 * .46 .41 .48
3 - 4.9 .36 * .26 .26 .32 5- 9.9 .26 .40 .17 .17 .23
10-19.9 .17 .30 .08 .08 .18 20 - 39.9 * .20 * * .16 40 or more + .12 - - .12 Alii .27 .18 .21 .14 .21
' Weighted by volume. * Less than three stops reported. - No stops of this size reported.
Under the labor unit system the labor used per half gallon equivalent went from .34 minute, where under three cases were delivered, to .07 minute where 40 or more cases were delivered. Under the case unit system the labor used per half gallon equivalent went from .48 minute to .11 minute over the same size range.
The labor unit system showed greater equivalence in the labor used among the types of stops for a similar size of stop. Small stores, large stores, restaurants and "other" stops receiving between 5 and 9.9

LSA EXPERIMENT STATION TECHNICAL BULLETIN 87 21
cases used .15, .19, .13 and .15 minute of labor per half gallon equivalent, respectively. In comparison the case unit system showed that small stores, large stores, restaurants and other stops ieceiving between 5 and 9.9 cases used .26, .40, .17 and .17 minute of labor per half gallon equivalent, respectively.
TOTAL DELIVERY COSTS PER PACKAGE Labor, truck, overhead, and total costs per stop and total costs per
package were compiled using the two cost allocation systems labor units and case units. The two systems gave different results because of the differences in the method of measuring labor units and weighting the package sizes. The half gallon package showed substantially lower costs and the gallon package substantially higher costs under the labor unit system than under the case unit system of allocation.
It must be recognized that costs for packages other than the three reported would, when considered, result in all the costs for a route or a stop being accounted for irrespective of the system of allocation used.
Route costs per day amounted to $57 for labor, $30 for truck and $30 for overhead expenses, Appendix Table 2. The labor expense was equivalent to 9.7 cents per minute. The truck expenses were equivalent to 53 cents per mile and overhead expenses were equivalent to 32 cents per case or 2.2 cents per labor unit. These time, mileage and overhead charges were used in compiling costs for all stops. Average labor, truck, overhead and total costs per stop are reported for various size and types of stops for each of the two systems in Appendix Tables 3 and 4. Total costs per package are presented in the following sections.
Labor Unit System
The weighted average total delivery cost per half gallon package for all stops was $.060, Table 8. Total costs ranged from $.257 per half gallon package for deliveries of 3 to 4.9 cases at "other" stops to $.037 per half gallon package for deliveries of over 40 cases to large stores. Among the types of stops, deliveries to large stores had the lowest cost, $.044 per half gallon, while those to restaurants had the highest cost, $.094 per half gallon. Delivery cost decreased with size of stop going from $.120 per half gallon for deliveries of under 3 cases, to $.038 for deliveries of 40 cases and over.5
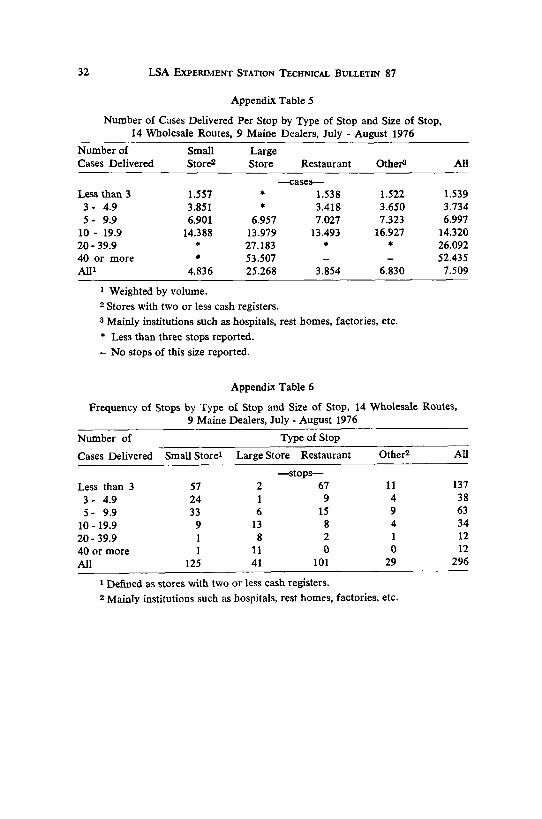
5 See appendix tables 5 and 6 for the frequency of various sizes and types of stops and the average number of cases delivered per stop.

22 LSA EXPERIMENT STATION TECHNICAL BULLETIN 87
Table 8
Average Total Delivery Cost Per Half Gallon, Labor Unit Basis, by Type and Size of Stop, 296 Stops, 14 Wholesale Routes, 9 Maine Milk Dealers,
July - August 1976 Cases Delivered Stores
Restaurant Other Per Stop Small Large Restaurant Other All
Under 3 $.120 * $.123 $.110 $.120 3 - 4.9 .081 * .206 .257 .107 5 - 9.9 .070 $.069 .079 .101 .075
10-19.9 .053 .051 .057 .050 .051 20 - 39.9 * .050 * * .050 40 and over * .037 - - .038 All1 .073 .044 .094 .089 .060
1 Weighted by volume. * Less than three stops reported. - No stops of this size reported.
The average delivery cost of a quart package for all sizes and types of stops was $.024, Table 9. Since the per quart costs were derived from the cost per half gallon equivalent, the same patterns of decreasing costs with size were inherently present. The cost per quart decreased from $.048 for deliveries of under 3 cases to $.015 per quart for deliveries of 40 cases or more. Large stores were the lowest cost type of stop at $.018 per quart and restaurants were the most expensive at $.038. The least cost stop was to large stores where 40 cases or more were delivered and the cost per quart was $.018. The greatest cost was to "'other" stops where between 3 and 4.9 cases were delivered at a delivery cost of $.103 per quart.
Table 9
Average Total Delivery Cost Per Quart, Labor Unit Basis, by Type and Size of Stop, 296 Stops, 14 Wholesale Routes, 9 Maine Milk Dealers,
July - August 1976
Cases Per Store
Restaurant Other Stop Small Large Restaurant Other All
Under 3 $.048 * $.049 $.044 $.048
3 - 4.9 .032 * .082 .103 .043
5 - 9.9 .028 $.028 .032 .040 .030
10-19.9 .021 .020 .023 .020 .020
20 - 39.9 * .020 * * .020
40 or more * .015 - - .015
A1U .029 .018 .038 .036 .024 1 Weighted by volume. * Less than three stops reported. - No stops of this size reported.
LSA EXPERIMENT STATION TECHNICAL BULLETIN 87 23
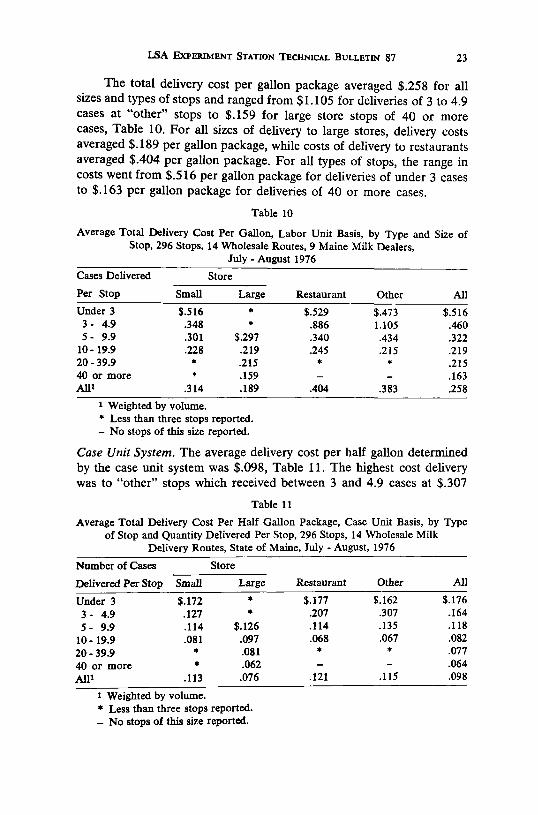
The total delivery cost per gallon package averaged $.258 for all sizes and types of stops and ranged from $1,105 for deliveries of 3 to 4.9 cases at "other" stops to $.159 for large store stops of 40 or more cases, Table 10. For all sizes of delivery to large stores, delivery costs averaged $.189 per gallon package, while costs of delivery to restaurants averaged $.404 per gallon package. For all types of stops, the range in costs went from $.516 per gallon package for deliveries of under 3 cases to $.163 per gallon package for deliveries of 40 or more cases.
Table 10
Average Total Delivery Cost Per Gallon, Labor Unit Basis, by Type and Size of Stop, 296 Stops, 14 Wholesale Routes, 9 Maine Milk Dealers,
July - August 1976 Cases Delivered Store
Restaurant Other Per Stop Small Large Restaurant Other All
Under 3 $.516 * $.529 $.473 $.516 3 - 4.9 .348 * .886 1.105 .460 5- 9.9 .301 $.297 .340 .434 .322
10-19.9 .228 .219 .245 .215 .219 20 - 39.9 * .215 * * .215 40 or more * .159 - - .163 A1H .314 .189 .404 .383 .258
1 Weighted by volume. * Less than three stops reported. - No stops of this size reported.
Case Unit System. The average delivery cost per half gallon determined by the case unit system was $.098, Table 11. The highest cost delivery was to "other" stops which received between 3 and 4.9 cases at $.307
Table 11
Average Total Delivery Cost Per Half Gallon Package, Case Unit Basis, by Type of Stop and Quantity Delivered Per Stop, 296 Stops, 14 Wholesale Milk
Delivery Routes, State of Maine, July - August, 1976
Number ( >f Cases
Per Stop
Store
Restaurant Other Delivered
>f Cases
Per Stop Small Large Restaurant Other All
Under 3 $.172 * $.177 $.162 $.176 3 - 4.9 .127 * .207 .307 .164 5- 9.9 .114 $.126 .114 .135 .118
10-19.9 .081 .097 .068 .067 .082
20 - 39.9 * .081 * * .077 40 or more • .062 - - .064
All1 .113 .076 .121 .115 .098
i Weighted by volume. * Less than three stops reported. - No stops of this size reported.

24 LSA EXPERIMENT STATION TECHNICAL BULLETIN 87
per half gallon. The lowest cost delivery was for 40 or more cases delivered to large stores, at $.062, per half gallon. But, low cost stops were also found in deliveries of 10 to 10.9 cases to restaurants and "other" stops at $.068 and $.067, per half gallon, respectively.
Large stores, under this system of cost allocation, had the least cost among the various types of stops at $.076 per half gallon. Small stores, restaurants and "'other" stops were all similar in their delivery costs. Average delivery costs per half gallon were: small stores $.113, restaurants $.121 and other stops $.115.
The cost per half gallon decreased with the size of delivery, going from $.176 for deliveries of under 3 cases to $.064 for deliveries of 40 or more cases. For deliveries of equal size, deliveries to large stores tended to cost more than to small stores or restaurants. When 5 to 9.9 cases were delivered to large stores, the cost was $.126 per half gallon as opposed to $.114 for deliveries to small stores or restaurants.
The average cost per quart for all types and sizes of stops was $.055, ranging from $.173 per quart for deliveries to "other" stops of 3 to 4.9 cases to $.035 per quart for deliveries of 40 cases or more to large stores, Table 12. Large store stop delivery costs averaged $.043 per quart. Small stores, restaurants and "other" stop costs were similar ranging from $.064 to $.068 per quart.
Table 12 Average Total Delivery Cost Per Quart Package, Case Unit Basis, by Type of
Stop and Volume of Delivery, 296 Stops, 14 Wholesale Routes, 9 Maine Milk Dealers, July - August 1976
Number of Cases Store
Restaurant Other Delivered Small Large Restaurant Other All
Under 3 $.098 * $.010 $.091 $.100 3 - 4.9 .072 A .116 .173 .092 5 - 9.9 .064 $.071 .064 .076 .067
10-19.9 .182 .219 .154 .152 .185 20 - 39.9 * .046 * * .043 40 or more * .035 - - .036 All* .064 .043 .068 .064 .055
1 Weighted by volume. * Less than three stops reported. - No stops of this size reported.
Per gallon costs under the case unit system averaged $.220 and ranged from $.691 for "other" stops taking 3 to 4.9 cases to .140 for large store stops with deliveries of 40 cases and over, Table 13. Gallon packages delivered to large stores cost an average of $.171 per unit. Costs of delivery to small stores averaged $.255 per gallon package while costs to restaurants averaged $.272 and to "other" stops $.258.

LSA EXPERIMENT STATION TECHNICAL BULLETIN 87 25
Table 13
Average Total Delivery Cost Per Gallon Package, Case Unit Basis by Type of Stop and Volume of Delivery, 206 Stops, 14 Wholesale Routes, 9 Maine Milk
Dealers, July - August 1976
Case Per Store
Restaurant Other Stop Small Large Restaurant Other All
Under 3 $.392 * $.398 $.364 $.396 3 - 4.9 .286 * .465 .691 .370 5 - 9.9 .258 $.284 .256 .303 .266
10-19.9 .182 .219 .154 .152 .185 20-39.9 * .183 * * .174 40 or more * .140 - - .143 All1 .255 .171 .272 .258 .220
1 Weighted by volume.
* Less than three stops reported.
- No stops of this size reported.
Comparison of Costs Under the Two Allocation Systems
The labor unit system of allocating costs produced a lower cost per half gallon equivalent than did the case system, $.060 versus $.098. Quarts were even less costly to deliver than half gallons under the labor unit system than under the case system of cost allocation, $.024 and $.055 per quart, respectively. However, the cost per gallon package was greater under the labor unit system, $.258, than under the case system, $.220.
Under the labor unit system the variation in cost between the various types of stops was perceivably greater. Under the labor unit system the cost per half gallon varied from $.044 at large stores to $.094 at restaurants, while under the case system the costs varied from $.076 for large stores to $.121 for restaurants, a smaller difference in both absolute and percentage terms.
For the same sizes of delivery the costs for half gallons by both systems tended to be similar among the stop types. Under the labor unit system when 5 to 9.9 cases were delivered the cost per half gallon was $.069 for large stores, $.079 for restaurants, and $.070 for small stores. Under the case system, with the same size of delivery, large stores had costs of $.126 per half gallon, as compared to $.114 for small stores and restaurants.
Because of the greater weight given to gallon packages under the labor unit system and the increasing percentages of gallon packages delivered as the size of stop increased, the labor unit system resulted in

26 LSA EXPERIMENT STATION TECHNICAL BULLETIN 87
a greater rate of decline in the cost per half gallon equivalent with the increase in the amount delivered per stop than under the case unit system. The cost per half gallon under the labor unit system declined from $.120 for the smallest size of stop, under three cases, to about one-third that cost, or $.038, at the largest size of stop, 40 or more cases. In contrast, the cost per half gallon under the case unit system went from $.176 at the smallest stops to $.064 at the largest, a decline to less than one-third the cost.
Discussion
Since the differences in costs derived by each cost allocation method were substantial, selection of one method over the other could have a substantial impact on dealer margins when used for minimum price fixing purposes.
Using the variable amount of direct delivery labor for the various package sizes as a means for allocating all direct delivery labor costs to various package sizes is a sound approach. Using the variable labor as a means for assessing total route volume and allocating indirect charges for truck and overhead on this basis is less sound. Since overhead costs are 37 percent of total delivery costs, the method of their allocation to packages has a major impact on the unit cost. It is difficult to show that delivery labor is related to overhead costs. Perhaps overhead charges should be allocated strictly on a volume of product basis.
Using the direct amount of labor per case as a means of allocation of labor to packages has the weakness of not recognizing labor differences in handling various packages. It also gives no weight to the relative quantity of different package sizes in the delivery mix, thus large volume items tend not to absorb their proportionate share of delivery labor. While the case basis does not represent volume accurately, it is a reasonably close approximation for major packages, except half pints. Thus its use for allocating indirect truck and overhead costs seems reasonable.
Because of the wide variation in delivery conditions throughout the State, the regression analysis used to determine variable time per package yielded results which were not statistically reliable for some packages. Additional application of the method using more data could change the relationships obtained in this analysis.

LSA EXPERIMENT STATION TECHNICAL BULLETIN 87 27
REFERENCES CITED
1. Christensen, Rondo A., Frederick W. Palmer and Lynn H. Davis. The Cost of Wholesale Milk Distribution in Urban Utah. Logan, Utah: Utah Agricultural Experiment Station, Utah State University, Research Report 23, July 1975.
2. Cook, Hugh L., Harlow W. Halvorson and R. Wayne Robinson. Costs and Efficiency of Milk Distribution in Milwaukee, Madison, Wise.: Agricultural Experiment Station, University of Wisconsin, Research Bulletin 196, May 1956.
3. Courtney, Richard H., and Elton Brooks. An Analysis of Wholesale Milk Delivery Costs and Volume-Pricing Procedures in California, Berkeley, California; California Agricultural Experiment Station, Giannini Foundation of Agricultural Economics, Research Report No. 317, June 1972.
4. Devino, Gary T. and R. D. Aplin. Measuring and Improving the Profitability of Milk Distribution Routes, Ithaca, N. Y.: Cornell University Agricultural Experiment Station, New York State College of Agriculture, Bulletin 1015, May 1968.
5. Fletcher, R. R. and H. J. McKinney. "An Economic Analysis of Processing and Distributing Dairy Products in Wyoming." Wyoming University Research Journal, 1973.
6. Goodwin, J. B., J. C. Purcell and J. C. Elrod. Analysis of Factors Affecting Time Requirements for Distributing Milk on Wholesale and Retail Routes in Georgia. Experiment, Georgia: University of Georgia, College of Agriculture Experiment Station. Research Bulletin 52, January 1969.
7. Hallberg, M. C. and W. R. Kriebel. Designing Efficient Pickup and Delivery Route Systems by Computer, University Park, Pennsylvania, The Penna. State University Agricultural Experiment Station, Bulletin 782, June 1972.
8. McDaniel, Norman R. and Lowell E. Wilson. Delivery Practices and Costs for Wholesale Milk Routes in Alabama. Auburn, Ala. Agricultural Experiment Station of Auburn University, Agricultural Economics series 15, November 1967.
9. Metzger, H. B. and N. E. Flanders, Costs and Efficiency in Fluid Milk Processing and Distribution in Maine. Orono, Me.: Life Sciences and Agriculture Experiment Station, University of Maine, Misc. Report 190, May 1977.
10. Purcell, J. C. and J. C. Elrod. Fluid Milk Distribution in Georgia. Experiment, Georgia: University of Georgia College of Agriculture, mimeo series N. S. 218. December 1964.
11. Purcell, J. C , J. B. Goodwin and J. C. Elrod. Fluid Milk Distribution in Georgia: Costs and Alternatives. Experiment, Georgia: University of Georgia College of Agriculture, Research Bulletin 17, November 1967.

28 LSA EXPERIMENT STATION TECHNICAL BULLETIN 87
Appendix Table 1
Total Delivery Time, Koute Characteristics and Quantity Delivered, 14 Wholesale and 8 Mixed Milk Delivery Routes, 16 Maine Milk Dealers, July - August 1976
All Item Wholesale Mixed
Number of Routes 14 8 —amount per route day—
Driver Route Time (minutes) Drive to stop 119 172 Delivery
Get order 43 16 Deliver 108 100 Service 107 27 Collect 36 18 Other 4 3 Account 4 15 Arrange 5 7
Total 307 186 Persona] 35 25 Misc. 3 10 Return to plant 16 7
Total Route 480 400 Driver Plant Time (minutes)
Load 21 31 Unload 17 15 Service Truck 4 2 Check out 34 12 Misc. 8 3
Total Plant 84 63 Unaccounted 26 33
Total driver's time 590 496 Route characteristics
Number of stops 24 98 Mileage, miles 59 66 Truck length, feet 16 9
Quantity Delivered Half Pints & small pkgs. 603 114 Quarts 208 246 Half Gallons 391 160 Gallons 247 55 3,5,6 Gallon bulk dispensers 12 2 Half pts & pts cream & by-products 146 27 Large Misc. pkg. 26 3
Total packages 1633 607 Total cases 159 54

Wholesale Delivery Cost
Average Per Route Item Per Year Per Route1 Day2 Per Unit
Number of Routes 7.4
Labor Costs Selling - Delivery Wages $ 95,686.70 Payroll Tax 6,368.50 Employee Insurance 6,692.00 Uniform 1,245.60
Total Labor Costs $109,992.80 $14,864 $57 $.097a
Truck Costs Repair Vehicles 15,609.00 Depreciation Vehicles 13,562.90 Tires and Tubes 2,090.50 Gas, Oil, Grease 14,496.10 Rental Equipment 1,229.90 Allocation from Garage 11,611.10
Total Truck Costs $ 58,599.50 7,919 30 .514*
Overhead Costs Supplies - Selling & Delivery 3,767.80 Repair Buildings 37.50 Depreciation Buildings 19.30 Depreciation Cases 3,193.20 Utilities 622.20 Insurance 204.70 Taxes - Real Estate 25.30 Rent Buildings 165.40 Allocation from Administration 63,042.30 Allocation from Warehouse 17,636.10 Allocation from Depot 8,836.60
Total Overhead Costs $ 97,550.40 .32 5; .022«
Total Wholesale Delivery Costs $266,142.70
17.4 routes per firm
2 260 route days 3 Amount per minute - 591 minutes per route day
< Amount per mile - 59 miles per route day
s Amount per case - 159 cases per route day
s Amount per labor unit - 2306 labor units per route day
LSA EXPEBIMENT STATION TECHNICAL BULLETIN 87 29
Appendix Table 2
Average Total Yearly Delivery Costs, Wholesale Routes, by Cost Category 14 Maine Dealers, Various Fiscal Years
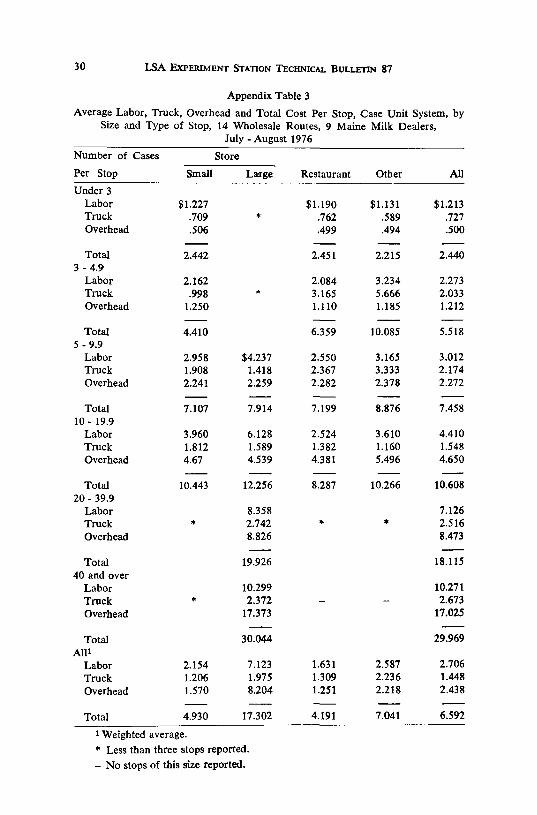
30 LSA EXPERIMENT STATION TECHNICAL BULLETIN 87
Appendix Table 3
Average Labor, Truck, Overhead and Total Cost Per Stop, Case Unit System, by Size and Type of Stop, 14 Wholesale Routes, 9 Maine Milk Dealers,
July - August 1976
Number of Cases Store
Restaurant Other Per Stop Small Large Restaurant Other All
Under 3 Labor $1,227 $1,190 $1,131 $1,213 Truck .709 * .762 .589 .727 Overhead .506 .499 .494 .500
Total 2.442 2.451 2.215 2.440 3 - 4 . 9
Labor 2.162 2.084 3.234 2.273 Truck .998 >* 3.165 5.666 2.033 Overhead 1.250 1.110 1.185 1.212
Total 4.410 6.359 10.085 5.518 5-9 .9
Labor 2.958 $4,237 2.550 3.165 3.012 Truck 1.908 1.418 2.367 3.333 2.174 Overhead 2.241 2.259 2.282 2.378 2.272
Total 7.107 7.914 7.199 8.876 7.458 10 - 19.9
Labor 3.960 6.128 2.524 3.610 4.410 Truck 1.812 1.589 1.382 1.160 1.548 Overhead 4.67 4.539 4.381 5.496 4.650
Total 10.443 12.256 8.287 10.266 10.608 20 - 39.9
Labor 8.358 7.126 Truck * 2.742 * * 2.516 Overhead 8.826 8.473
Total 19.926 18.115 40 and over
Labor 10.299 10.271 Truck * 2.372 - - 2.673 Overhead 17.373 17.025
Total 30.044 29.969
All» Labor 2.154 7.123 1.631 2.587 2.706
Truck 1.206 1.975 1.309 2.236 1.448
Overhead 1.570 8.204 1.251 2.218 2.438
Total 4.930 17.302 4.191 7.041 6.592
1 Weighted average. * Less than three stops reported.
- No stops of this size reported.

LSA EXPERIMENT STATION TECHNICAL BULLETIN 87 31
Appendix Table 4
Average Labor, Truck, Overhead and Total Cost Per Stop, Labor Unit System, by Type and Size of Stop, 14 Wholesale Routes, 9 Maine Milk Dealers,
July - August 1976
Number of Cases Store
Restaurant Other Per Stop Small Large Restaurant Other All
Under 3 Labor $1,207 $1,139 $1,091 $1,181 Truck .711 * .741 .587 .719 Overhead .432 # .410 .417 .427
Total 2.350 2.290 2.095 2.327 3 -4 .9
Labor 2.059 1.889 2.968 2.180 Truck .957 * 3.055 5.471 2.006 Overhead 1.133 .590 .791 1.083
Total 4.149 5.534 9.230 5.269 5 - 9.99
Labor 2.949 $4,563 2.364 2.894 2.956 Truck 1.937 1.523 2.270 2.932 2.119 Overhead 2.220 2.868 1.774 1.615 2.089
Total 7.106 8.954 6.408 7.441 7.164
10 - 19.9 Labor 4.383 6.786 1.979 3.517 4.634 Truck 1.846 1.928 1.197 1.166 1.645 Overhead 4.360 7.000 2.023 3.657 4.737
Total 10.589 15.714 5.199 8.340 11.016
20 - 39.9 Labor 9.050 7.273
Truck * 2.748 * * 2.444
Overhead 9.431 7.715
Total 21.229 17.432
40 and over Labor 10.695 10.657
Truck f 2.494 - - 2.809
Overhead 19.162 18.787
Total 32.351 32.253
All1
Labor 2.146 7.680 1.497 2.388 2.715
Truck 1.210 2.181 1.250 2.079 1.433
Overhead 1.452 9.798 .835 1.477 2.400
Total 4.808 19.659 3.582 5.944 6.548
i Weighted average * Too few stops for meaningful average. - No instances found.
32 LSA EXPERIMENT STATION TECHNICAL BULLETIN 87
Appendix Table 5
Number of Cases Delivered Per Stop by Type of Stop and Size of Stop, 14 Wholesale Routes, 9 Maine Dealers, July - August 1976
Number of Small Large Cases Delivered Store2 Store Restaurant Others All
—cases— Less than 3 1.557 * 1.538 1.522 1.539
3 - 4.9 3.851 * 3.418 3.650 3.734 5 - 9.9 6.901 6.957 7.027 7.323 6.997
10 - 19.9 14.388 13.979 13.493 16.927 14.320 20 - 39.9 * 27.183 * * 26.092 40 or more * 53.507 - - 52.435 A1H 4.836 25.268 3.854 6.830 7.509
1 Weighted by volume. 2 Stores with two or less cash registers. 3 Mainly institutions such as hospitals, rest homes, factories, etc. * Less than three stops reported. - No stops of this size reported.
Appendix Table 6
Frequency of Stops by Type of Stop and Size of Stop, 14 Wholesale Routes, 9 Maine Dealers, July - August 1976
Number of Type of Stop
Cases Delivered Small Store1 Large Store Restaurant Other2 All
—stops— Less than 3 57 2 67 11 137
3 - 4.9 24 1 9 4 38
5 - 9.9 33 6 15 9 63
10-19.9 9 13 8 4 34
20-39.9 1 8 2 1 12
40 or more 1 11 0 0 12
All 125 41 101 29 296
1 Defined as stores with two or less cash registers. 2 Mainly institutions such as hospitals, rest homes, factories, etc.