tbac discussion charts merged 2
TRANSCRIPT

8/7/2019 TBAC Discussion Charts Merged 2
http://slidepdf.com/reader/full/tbac-discussion-charts-merged-2 1/93
UNITED STATES DEPARTMENT OF THE TREASURY
Presentation to theTreasury Borrowing Advisory Committee
U.S. Department of Treasury
Office of Debt Management
February 1, 2011
8/7/2019 TBAC Discussion Charts Merged 2
http://slidepdf.com/reader/full/tbac-discussion-charts-merged-2 2/93
UNITED STATES DEPARTMENT OF THE TREASURY
Agenda
• Fiscal Developments
• Auction Demand & Market Trends
• Portfolio Metrics
• Long-term Challenges
2
8/7/2019 TBAC Discussion Charts Merged 2
http://slidepdf.com/reader/full/tbac-discussion-charts-merged-2 3/93
UNITED STATES DEPARTMENT OF THE TREASURY
FISCAL DEVELOPMENTS
3

8/7/2019 TBAC Discussion Charts Merged 2
http://slidepdf.com/reader/full/tbac-discussion-charts-merged-2 4/93
UNITED STATES DEPARTMENT OF THE TREASURY
Steady Growth in Individual Tax Receipts
4
-40%
-30%
-20%
-10%
0%
10%
20%
30%
40%
50%
60%
M a r - 0
0
J u n - 0
0
S e p - 0
0
D e c - 0
0
M a r - 0
1
J u n - 0
1
S e p - 0
1
D e c - 0
1
M a r - 0
2
J u n - 0
2
S e p - 0
2
D e c - 0
2
M a r - 0
3
J u n - 0
3
S e p - 0
3
D e c - 0
3
M a r - 0
4
J u n - 0
4
S e p - 0
4
D e c - 0
4
M a r - 0
5
J u n - 0
5
S e p - 0
5
D e c - 0
5
M a r - 0
6
J u n - 0
6
S e p - 0
6
D e c - 0
6
M a r - 0
7
J u n - 0
7
S e p - 0
7
D e c - 0
7
M a r - 0
8
J u n - 0
8
S e p - 0
8
D e c - 0
8
M a r - 0
9
J u n - 0
9
S e p - 0
9
D e c - 0
9
M a r - 1
0
J u n - 1
0
S e p - 1
0
D e c - 1
0
Corporate Taxes Withheld Taxes Nonwithheld Taxes
Note: Adjusted for 9/11/01 Corporate Tax Receipts disruptionSource: Monthly Treasury Statement
Quarterly Tax Receipts Year-over-Year Percentage Change
A closer look at Q1 FY2011 ending Dec. 31, 2010 :Corporate: +6%Withheld: +8%Nonwithheld: +17%
Note: Data plotted is year-over-year changes in quarterly receipts
8/7/2019 TBAC Discussion Charts Merged 2
http://slidepdf.com/reader/full/tbac-discussion-charts-merged-2 5/93
UNITED STATES DEPARTMENT OF THE TREASURY
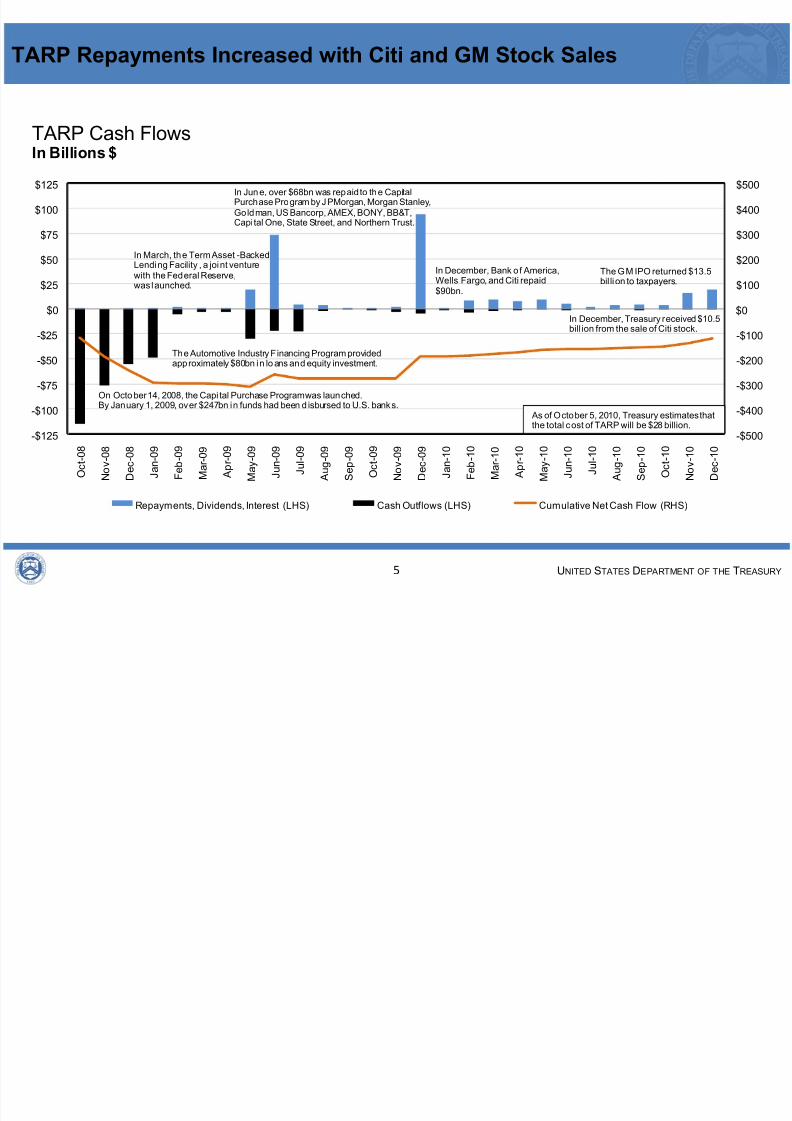
TARP Repayments Increased with Citi and GM Stock Sales
-$500
-$400
-$300
-$200
-$100
$0
$100
$200
$300
$400
$500
-$125
-$100
-$75
-$50
-$25
$0
$25
$50
$75
$100
$125
O c
t - 0 8
N o v - 0
8
D e c - 0
8
J a n - 0
9
F e
b - 0
9
M a r - 0
9
A p r - 0
9
M a y - 0
9
J u n - 0
9
J u
l - 0 9
A u g - 0
9
S e p - 0
9
O c
t - 0 9
N o v - 0
9
D e c - 0
9
J a n - 1
0
F e
b - 1
0
M a r - 1
0
A p r - 1
0
M a y - 1
0
J u n - 1
0
J u
l - 1 0
A u g - 1
0
S e p - 1
0
O c
t - 1 0
N o v - 1
0
D e c - 1
0
Repayments, Dividends, Interest (LHS) Cash Outflows (LHS) Cumulative Net Cash Flow (RHS)
TARP Cash FlowsIn Billions $
The Automotive Industry Financing Program providedapproximately $80bn in lo ans and equity investment.
In June, over $68bn was repaid to the CapitalPurchase Program by JPMorgan, Morgan Stanley,Goldman, US Bancorp, AMEX, BONY, BB&T,Capital One, State Street, and Northern Trust.
In March, the TermAsset -BackedLending Facility , a joint venturewith the Federal Reserve,was launched.
On October 14, 2008, the Capi tal Purchase Program was launched.By January 1, 2009, over $247bn in funds had been d isbursed to U.S. banks.
In December, Bank o f America,Wells Fargo, and Citi repaid$90bn.
In December, Treasury received $10.5bill ion from the sale of Citi stock.
As of October 5, 2010, Treasury estimates thatthe total cost of TARP will be $28 billion.
The GM IPO returned $13.5bil lion to taxpayers.
5

8/7/2019 TBAC Discussion Charts Merged 2
http://slidepdf.com/reader/full/tbac-discussion-charts-merged-2 6/93UNITED STATES DEPARTMENT OF THE TREASURY
Non-Marketable Redemptions Slowed in Q1 FY2011
6
-$30
-$20
-$10
$0
$10
$20
$30
Q12005
Q2 Q3 Q4 Q12006
Q2 Q3 Q4 Q12007
Q2 Q3 Q4 Q12008
Q2 Q3 Q4 Q12009
Q2 Q3 Q4 Q12010
Q2 Q3 Q4 Q12011
Savings Bond Foreign Series SLGS
Net Non-marketable IssuanceIn Billions $
Source: Monthly Treasury Statement
8/7/2019 TBAC Discussion Charts Merged 2
http://slidepdf.com/reader/full/tbac-discussion-charts-merged-2 7/93UNITED STATES DEPARTMENT OF THE TREASURY
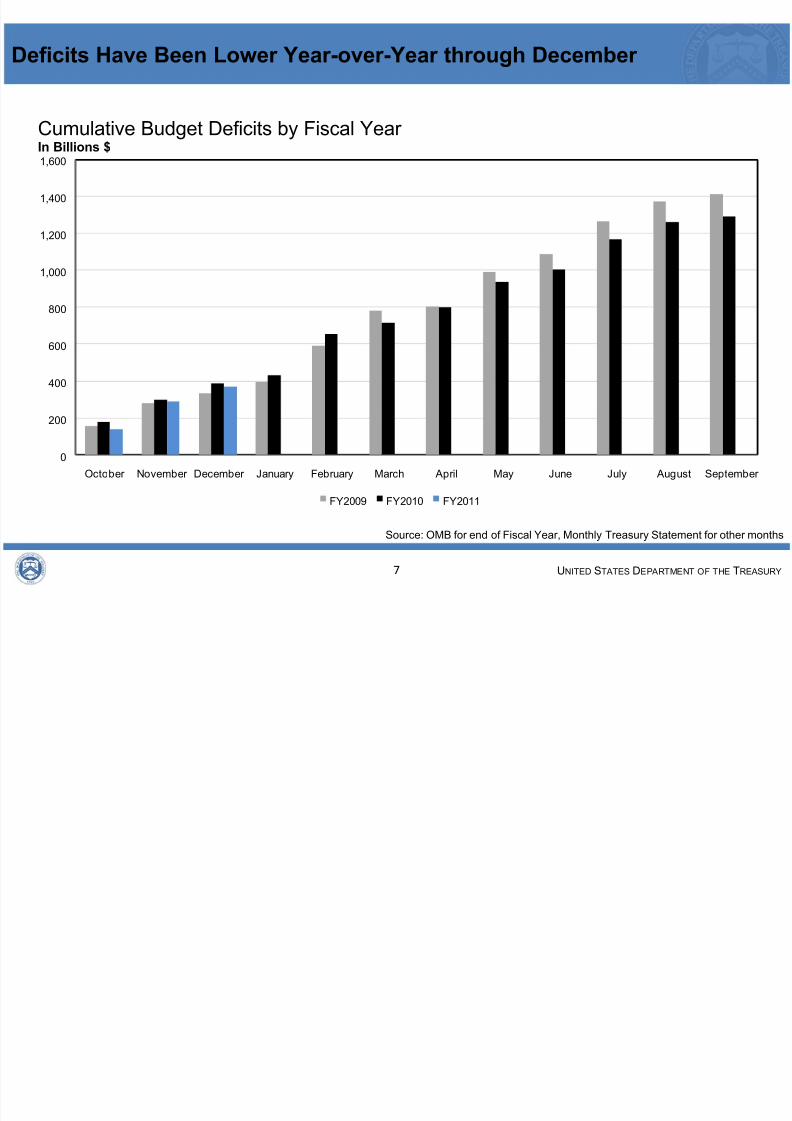
Deficits Have Been Lower Year-over-Year through December
0
200
400
600
800
1,000
1,200
1,400
1,600
October November December January February March April May June July August September
FY2009 FY2010 FY2011
Cumulative Budget Deficits by Fiscal Year In Billions $
7
Source: OMB for end of Fiscal Year, Monthly Treasury Statement for other months

8/7/2019 TBAC Discussion Charts Merged 2
http://slidepdf.com/reader/full/tbac-discussion-charts-merged-2 8/93UNITED STATES DEPARTMENT OF THE TREASURY
Primary Dealer and Government Deficit Estimates
FY 2011-2013 Deficit and Borrowing Estimates In Billions $
PrimaryDealers* CBO OMB
FY 2011 Deficit Estimate 1,363 1,480 1,416
FY 2012 Deficit Estimate 1,107 1,100 911
FY 2013 Deficit Estimate 932 704 736
FY 2011 Deficit Range 1,200-1,550
FY 2012 Deficit Range 1,000-1,200FY 2013 Deficit Range 735-1,050
FY 2011 Marketable Borrowing Range 1,050-2,116
FY 2012 Marketable Borrowing Range 1,000-2,239
Estimates as of: Jan 2011 Jan 2011 July 2010
*Based on Primary Dealer feedback on January 24, 2011. Deficit estimates are averages.
8
8/7/2019 TBAC Discussion Charts Merged 2
http://slidepdf.com/reader/full/tbac-discussion-charts-merged-2 9/93UNITED STATES DEPARTMENT OF THE TREASURY
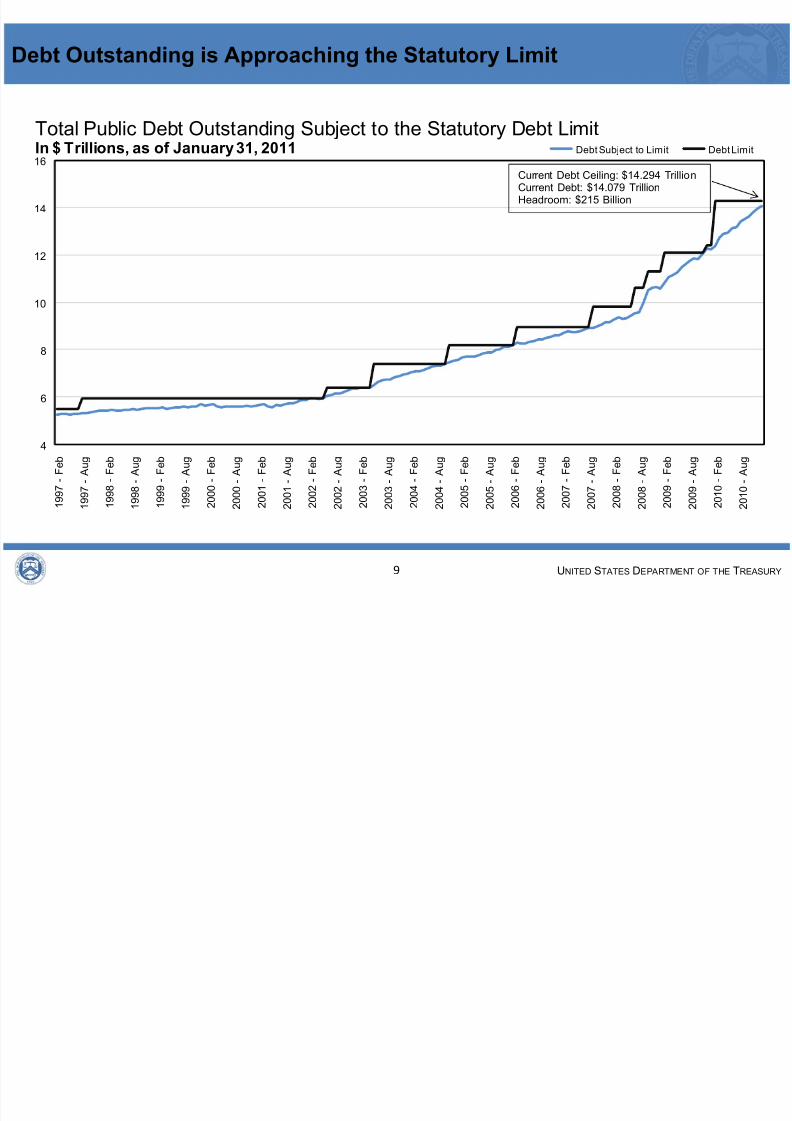
Debt Outstanding is Approaching the Statutory Limit
9
4
6
8
10
12
14
16
1 9 9 7 -
F e
b
1 9 9 7 -
A u g
1 9 9 8 -
F e
b
1 9 9 8 -
A u g
1 9 9 9 -
F e
b
1 9 9 9 -
A u g
2 0 0 0 -
F e
b
2 0 0 0 -
A u g
2 0 0 1 -
F e
b
2 0 0 1 -
A u g
2 0 0 2 -
F e
b
2 0 0 2 -
A u
2 0 0 3 -
F e
b
2 0 0 3 -
A u g
2 0 0 4 -
F e
b
2 0 0 4 -
A u g
2 0 0 5 -
F e
b
2 0 0 5 -
A u g
2 0 0 6 -
F e
b
2 0 0 6 -
A u g
2 0 0 7 -
F e
b
2 0 0 7 -
A u g
2 0 0 8 -
F e
b
2 0 0 8 -
A u g
2 0 0 9 -
F e
b
2 0 0 9 -
A u g
2 0 1 0 -
F e
b
2 0 1 0 -
A u g
Debt Subject to Limit Debt Limit
Total Public Debt Outstanding Subject to the Statutory Debt LimitIn $ Trillions, as of January 31, 2011
Current Debt Ceiling: $14.294 TrillionCurrent Debt: $14.079 TrillionHeadroom: $215 Billion
8/7/2019 TBAC Discussion Charts Merged 2
http://slidepdf.com/reader/full/tbac-discussion-charts-merged-2 10/93UNITED STATES DEPARTMENT OF THE TREASURY
AUCTION DEMAND & MARKET TRENDS
10

8/7/2019 TBAC Discussion Charts Merged 2
http://slidepdf.com/reader/full/tbac-discussion-charts-merged-2 11/93UNITED STATES DEPARTMENT OF THE TREASURY
Coverage Ratios Have Remained Strong in FY2011
1.0
1.5
2.0
2.5
3.0
3.5
$0
$500
$1,000
$1,500
$2,000
$2,500
FY2000 FY2001 FY2002 FY2003 FY2004 FY2005 FY2006 FY2007 FY2008 FY2009 FY2010 FY2011YTD
Weighted Average Coverage Ratio on Notes and BondsIn Billions $, Coverage Ratio
Gross Private Issuance (LHS) Weighted Average Coverage Ratio (RHS)
Note: Excludes TIPS and Bills issuance.
11
Source: Treasury Auction Data; Through 1/31/2011
8/7/2019 TBAC Discussion Charts Merged 2
http://slidepdf.com/reader/full/tbac-discussion-charts-merged-2 12/93
UNITED STATES DEPARTMENT OF THE TREASURY
SOMA 3%
Primary Dealers
46%
Other Dealers
& Brokers
11%
Investment Funds
17%
Foreign &
International
22%
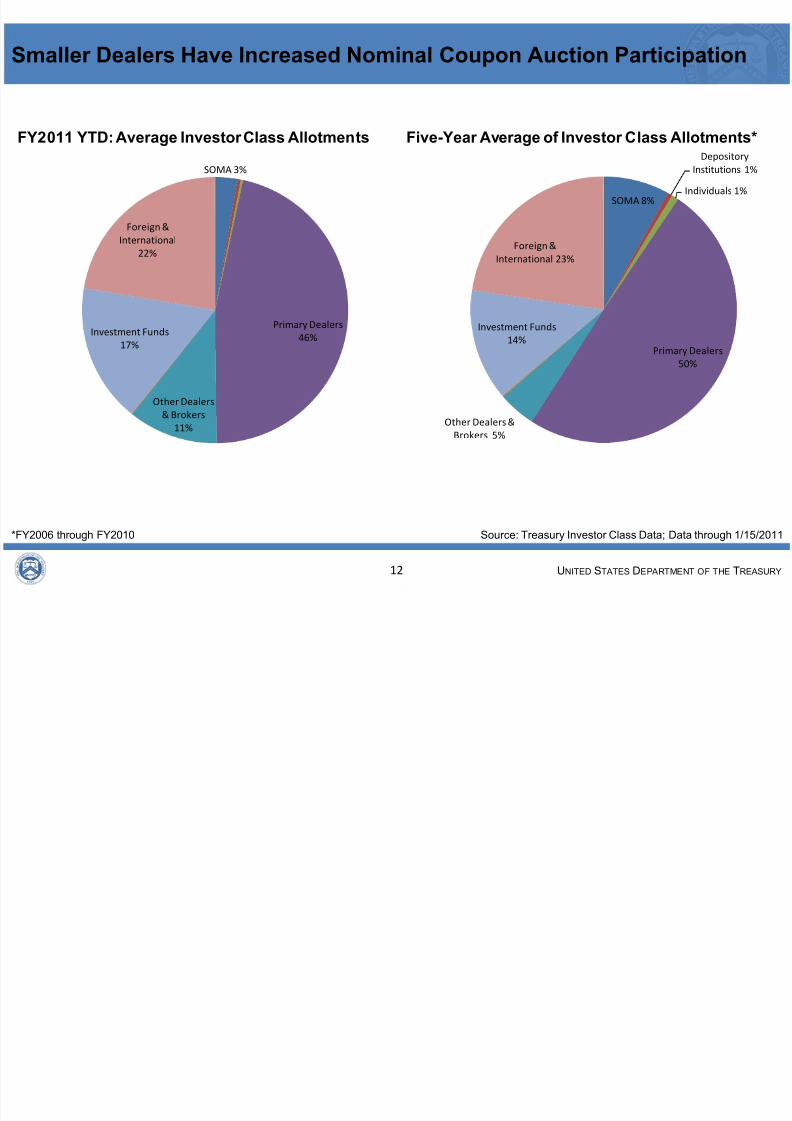
FY2011 YTD: Average Investor Class Allotments
SOMA 8%
Depository
Institutions 1%
Individuals 1%
Primary Dealers
50%
Other Dealers &
Brokers 5%
Investment Funds
14%
Foreign &
International 23%
Five-Year Average of Investor Class Allotments*
Smaller Dealers Have Increased Nominal Coupon Auction Participation
12
Source: Treasury Investor Class Data; Data through 1/15/2011*FY2006 through FY2010

8/7/2019 TBAC Discussion Charts Merged 2
http://slidepdf.com/reader/full/tbac-discussion-charts-merged-2 13/93
UNITED STATES DEPARTMENT OF THE TREASURY
SOMA 11% Individuals 4%
Primary Dealers
53%
Other Dealers &
Brokers 7%
Investment Funds
14%
Foreign
&
International
10%
Other 1%
Five-Year Average of Investor Class Allotments*
SOMA 4%Individuals 2%
Primary Dealers
54%Other Dealers &
Brokers 12%
Investment Funds
14%
Foreign &
International
14%
FY2011 YTD: Average Investor Class Allotments
Smaller Dealers Have Also Increased Bill Auction Participation
13
Source: Treasury Investor Class Data; Data through 1/27/2011*FY2006 through FY2010

8/7/2019 TBAC Discussion Charts Merged 2
http://slidepdf.com/reader/full/tbac-discussion-charts-merged-2 14/93
UNITED STATES DEPARTMENT OF THE TREASURY
PORTFOLIO METRICS
14
8/7/2019 TBAC Discussion Charts Merged 2
http://slidepdf.com/reader/full/tbac-discussion-charts-merged-2 15/93
UNITED STATES DEPARTMENT OF THE TREASURY
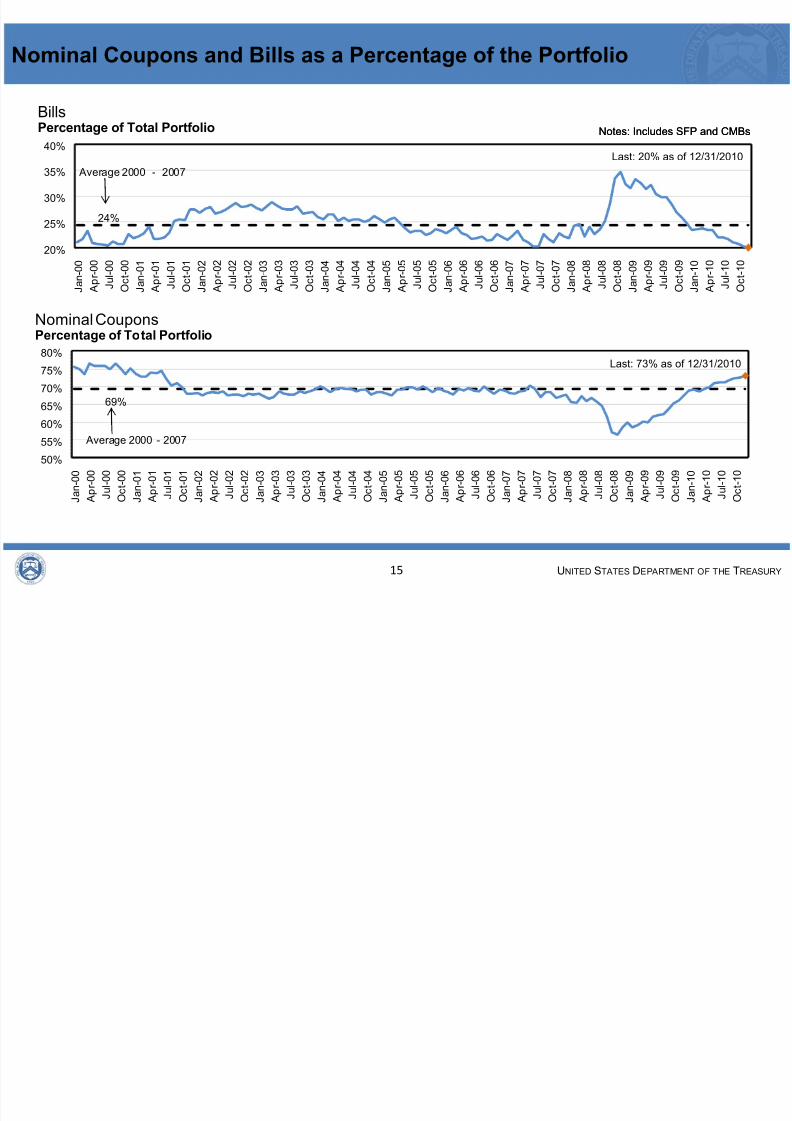
Nominal Coupons and Bills as a Percentage of the Portfolio
15
69%
50%
55%
60%
65%
70%
75%
80%
J a n - 0
0
A p r - 0
0
J u
l - 0 0
O c
t - 0 0
J a n - 0
1
A p r - 0
1
J u
l - 0 1
O c
t - 0 1
J a n - 0
2
A p r - 0
2
J u
l - 0 2
O c
t - 0 2
J a n - 0
3
A p r - 0
3
J u
l - 0 3
O c
t - 0 3
J a n - 0
4
A p r - 0
4
J u
l - 0 4
O c
t - 0 4
J a n - 0
5
A p r - 0
5
J u
l - 0 5
O c
t - 0 5
J a n - 0
6
A p r - 0
6
J u
l - 0 6
O c
t - 0 6
J a n - 0
7
A p r - 0
7
J u
l - 0 7
O c
t - 0 7
J a n - 0
8
A p r - 0
8
J u
l - 0 8
O c
t - 0 8
J a n - 0
9
A p r - 0
9
J u
l - 0 9
O c
t - 0 9
J a n - 1
0
A p r - 1
0
J u
l - 1 0
O c
t - 1 0
Nominal CouponsPercentage of Total Portfolio
Average 2000 - 2007
Last: 73% as of 12/31/2010
24%
20%
25%
30%
35%
40%
J a n - 0
0
A p r - 0
0
J u
l - 0 0
O c
t - 0 0
J a n - 0
1
A p r - 0
1
J u
l - 0 1
O c
t - 0 1
J a n - 0
2
A p r - 0
2
J u
l - 0 2
O c
t - 0 2
J a n - 0
3
A p r - 0
3
J u
l - 0 3
O c
t - 0 3
J a n - 0
4
A p r - 0
4
J u
l - 0 4
O c
t - 0 4
J a n - 0
5
A p r - 0
5
J u
l - 0 5
O c
t - 0 5
J a n - 0
6
A p r - 0
6
J u
l - 0 6
O c
t - 0 6
J a n - 0
7
A p r - 0
7
J u
l - 0 7
O c
t - 0 7
J a n - 0
8
A p r - 0
8
J u
l - 0 8
O c
t - 0 8
J a n - 0
9
A p r - 0
9
J u
l - 0 9
O c
t - 0 9
J a n - 1
0
A p r - 1
0
J u
l - 1 0
O c
t - 1 0
BillsPercentage of Total Portfolio Notes: Includes SFP and CMBs
Average 2000 - 2007
Notes: Includes SFP and CMBs
Last: 20% as of 12/31/2010

8/7/2019 TBAC Discussion Charts Merged 2
http://slidepdf.com/reader/full/tbac-discussion-charts-merged-2 16/93
UNITED STATES DEPARTMENT OF THE TREASURY
Balances in the SFP Will Decline as the Debt Limit Approaches
16
$0
$100
$200
$300
$400
$500
$600
$700
$800
S e p - 0
8
O c
t - 0 8
N o v - 0
8
D e c - 0
8
J a n - 0
9
F e
b - 0
9
M a r - 0
9
A p r - 0
9
M a y - 0
9
J u n - 0
9
J u
l - 0 9
A u g - 0
9
S e p - 0
9
O c
t - 0 9
N o v - 0
9
D e c - 0
9
J a n - 1
0
F e
b - 1
0
M a r - 1
0
A p r - 1
0
M a y - 1
0
J u n - 1
0
J u
l - 1 0
A u g - 1
0
S e p - 1
0
O c
t - 1 0
N o v - 1
0
D e c - 1
0
J a n - 1
1
F e
b - 1
1
M a r - 1
1
Treasury Supplementary Financing Program Cash BalanceIn Billions $
Max: $560B
Min: $5B12/30/09
Current: $200B 3/31/11:$5B
Projected

8/7/2019 TBAC Discussion Charts Merged 2
http://slidepdf.com/reader/full/tbac-discussion-charts-merged-2 17/93
UNITED STATES DEPARTMENT OF THE TREASURY
TIPS Issuance Will Continue to Increase
17
0%
3%
6%
9%
12%
$0
$25
$50
$75
$100
1997 1999 2001 2003 2005 2007 2009 2011YTD
TIPSCalendar Year Issuance in Billions $, Percentage of Portfolio
5‐Year (L) 10‐Year (L) 20‐Year (L) 30‐Year (L) TIPS as % of the Portfolio (R)
Note: Data through 1/21/2011
8/7/2019 TBAC Discussion Charts Merged 2
http://slidepdf.com/reader/full/tbac-discussion-charts-merged-2 18/93
UNITED STATES DEPARTMENT OF THE TREASURY
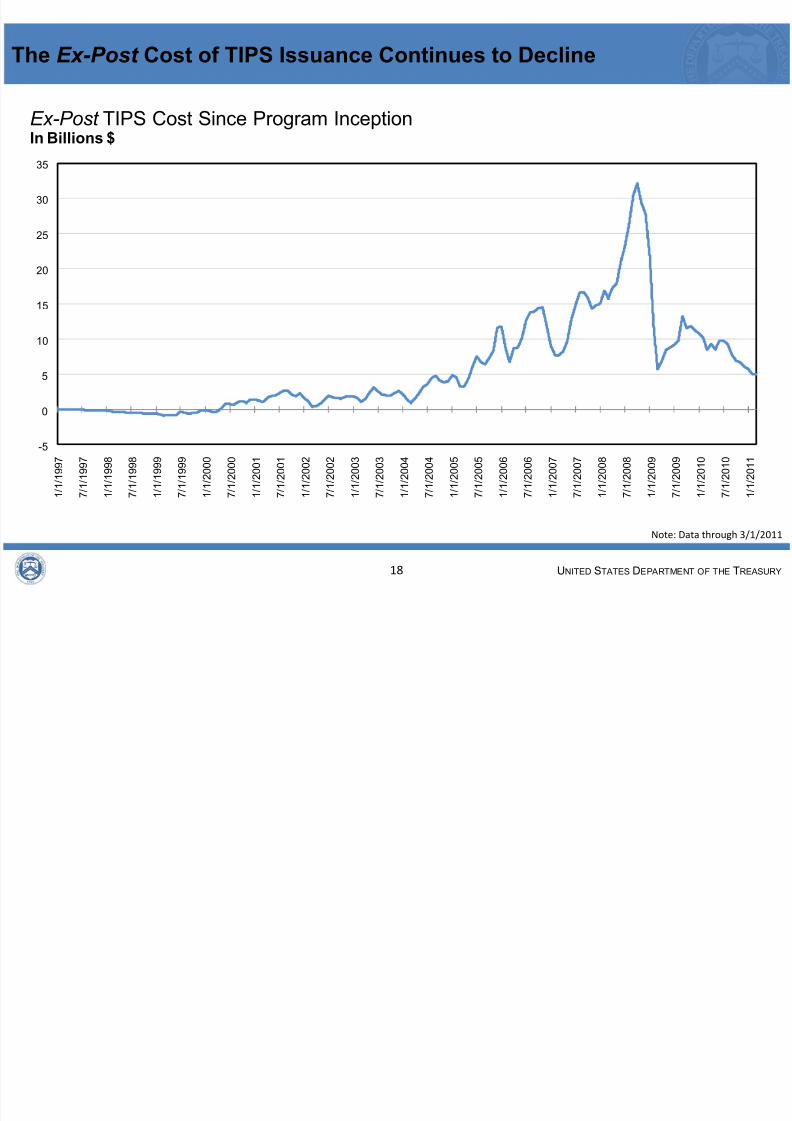
The Ex-Post Cost of TIPS Issuance Continues to Decline
18
-5
0
5
10
15
20
25
30
35
1 / 1 / 1 9 9 7
7 / 1 / 1 9 9 7
1 / 1 / 1 9 9 8
7 / 1 / 1 9 9 8
1 / 1 / 1 9 9 9
7 / 1 / 1 9 9 9
1 / 1 / 2 0 0 0
7 / 1 / 2 0 0 0
1 / 1 / 2 0 0 1
7 / 1 / 2 0 0 1
1 / 1 / 2 0 0 2
7 / 1 / 2 0 0 2
1 / 1 / 2 0 0 3
7 / 1 / 2 0 0 3
1 / 1 / 2 0 0 4
7 / 1 / 2 0 0 4
1 / 1 / 2 0 0 5
7 / 1 / 2 0 0 5
1 / 1 / 2 0 0 6
7 / 1 / 2 0 0 6
1 / 1 / 2 0 0 7
7 / 1 / 2 0 0 7
1 / 1 / 2 0 0 8
7 / 1 / 2 0 0 8
1 / 1 / 2 0 0 9
7 / 1 / 2 0 0 9
1 / 1 / 2 0 1 0
7 / 1 / 2 0 1 0
1 / 1 / 2 0 1 1
Ex-Post TIPS Cost Since Program InceptionIn Billions $
Note: Data through 3/1/2011
8/7/2019 TBAC Discussion Charts Merged 2
http://slidepdf.com/reader/full/tbac-discussion-charts-merged-2 19/93
UNITED STATES DEPARTMENT OF THE TREASURY
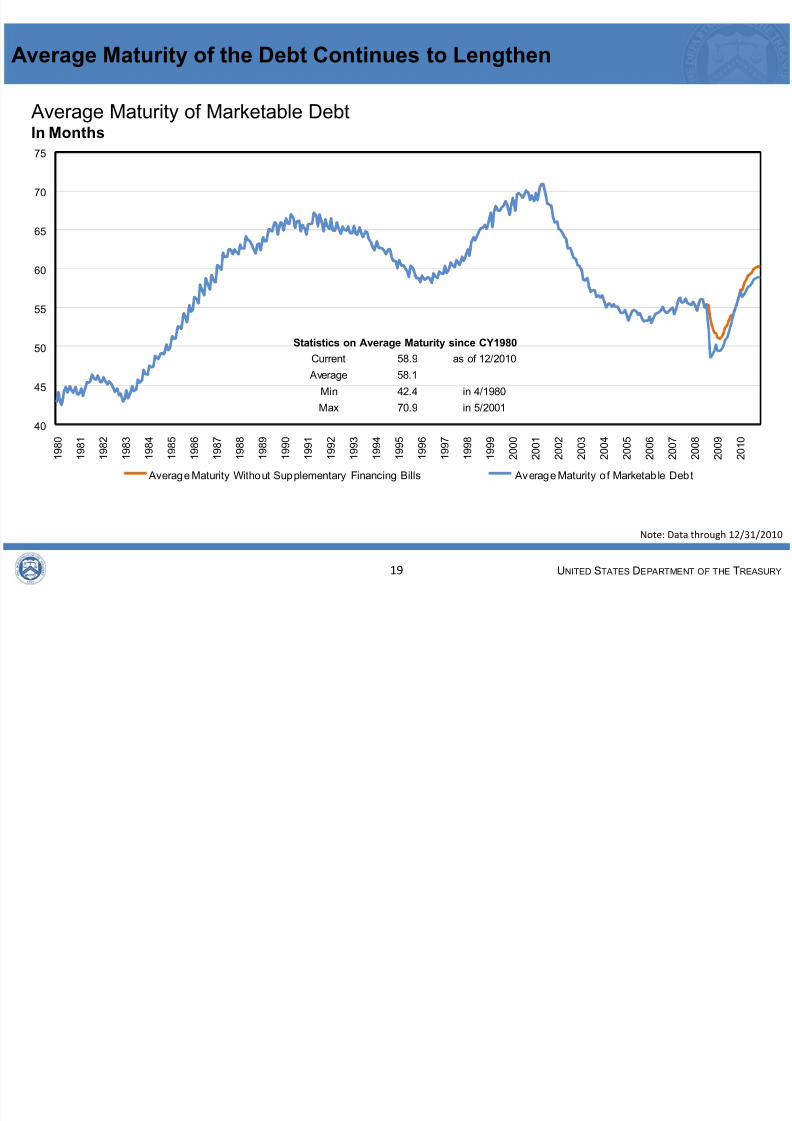
Average Maturity of the Debt Continues to Lengthen
19
40
45
50
55
60
65
70
75
1 9 8 0
1 9 8 1
1 9 8 2
1 9 8 3
1 9 8 4
1 9 8 5
1 9 8 6
1 9 8 7
1 9 8 8
1 9 8 9
1 9 9 0
1 9 9 1
1 9 9 2
1 9 9 3
1 9 9 4
1 9 9 5
1 9 9 6
1 9 9 7
1 9 9 8
1 9 9 9
2 0 0 0
2 0 0 1
2 0 0 2
2 0 0 3
2 0 0 4
2 0 0 5
2 0 0 6
2 0 0 7
2 0 0 8
2 0 0 9
2 0 1 0
Average Maturity of Marketable DebtIn Months
Average Maturity Without Supplementary Financing Bills Average Maturity o f Marketable Debt
Current 58.9 as of 12/2010
Average 58.1
Min 42.4 in 4/1980
Max 70.9 in 5/2001
Statistics on Average Maturity since CY1980
Note: Data through 12/31/2010
8/7/2019 TBAC Discussion Charts Merged 2
http://slidepdf.com/reader/full/tbac-discussion-charts-merged-2 20/93
UNITED STATES DEPARTMENT OF THE TREASURY
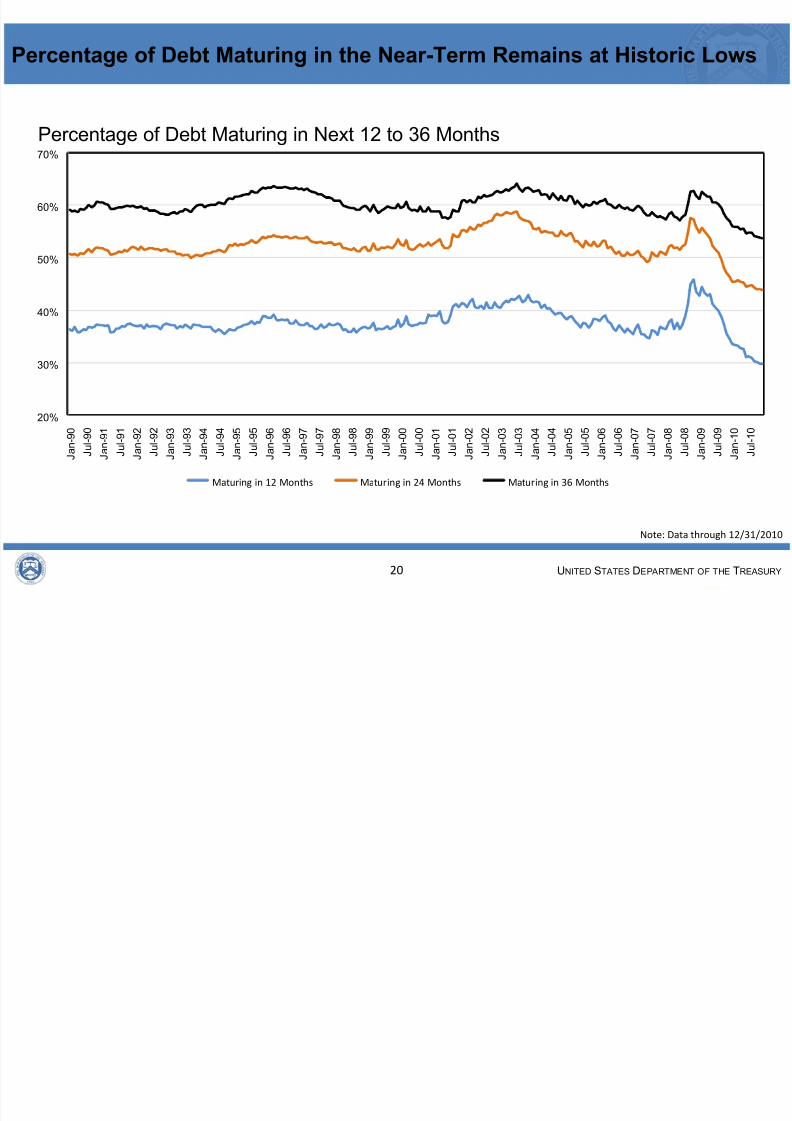
Percentage of Debt Maturing in the Near-Term Remains at Historic Lows
20
20%
30%
40%
50%
60%
70%
J a n - 9
0
J u
l - 9 0
J a n - 9
1
J u
l - 9 1
J a n - 9
2
J u
l - 9 2
J a n - 9
3
J u
l - 9 3
J a n - 9
4
J u
l - 9 4
J a n - 9
5
J u
l - 9 5
J a n - 9
6
J u
l - 9 6
J a n - 9
7
J u
l - 9 7
J a n - 9
8
J u
l - 9 8
J a n - 9
9
J u
l - 9 9
J a n - 0
0
J u
l - 0 0
J a n - 0
1
J u
l - 0 1
J a n - 0
2
J u
l - 0 2
J a n - 0
3
J u
l - 0 3
J a n - 0
4
J u
l - 0 4
J a n - 0
5
J u
l - 0 5
J a n - 0
6
J u
l - 0 6
J a n - 0
7
J u
l - 0 7
J a n - 0
8
J u
l - 0 8
J a n - 0
9
J u
l - 0 9
J a n - 1
0
J u
l - 1 0
Percentage of Debt Maturing in Next 12 to 36 Months
Maturing in 12 Months Maturing in 24 Months Maturing in 36 Months
Note: Data through 12/31/2010
8/7/2019 TBAC Discussion Charts Merged 2
http://slidepdf.com/reader/full/tbac-discussion-charts-merged-2 21/93
UNITED STATES DEPARTMENT OF THE TREASURY
LONG-TERM CHALLENGES
21

8/7/2019 TBAC Discussion Charts Merged 2
http://slidepdf.com/reader/full/tbac-discussion-charts-merged-2 22/93
UNITED STATES DEPARTMENT OF THE TREASURY
OMB FY2011 Mid-Session Review Projections
22
-18%
-16%
-14%
-12%
-10%
-8%
-6%
-4%
-2%
0%
2%
4%
-$1,600
-$1,400
-$1,200
-$1,000
-$800
-$600
-$400
-$200
$0
$200
$400
1 9 5 0
1 9 5 2
1 9 5 4
1 9 5 6
1 9 5 8
1 9 6 0
1 9 6 2
1 9 6 4
1 9 6 6
1 9 6 8
1 9 7 0
1 9 7 2
1 9 7 4
1 9 7 6
1 9 7 8
1 9 8 0
1 9 8 2
1 9 8 4
1 9 8 6
1 9 8 8
1 9 9 0
1 9 9 2
1 9 9 4
1 9 9 6
1 9 9 8
2 0 0 0
2 0 0 2
2 0 0 4
2 0 0 6
2 0 0 8
2 0 1 0
2 0 1 2
2 0 1 4
2 0 1 6
2 0 1 8
2 0 2 0
Budget Surplus/DeficitIn Billions $, Percentage of GDP
Surplus/Deficit $ (LHS) Surplus/Deficit Percentage of GDP (RHS)
OMB FY2011Mid-Session Review
8/7/2019 TBAC Discussion Charts Merged 2
http://slidepdf.com/reader/full/tbac-discussion-charts-merged-2 23/93
UNITED STATES DEPARTMENT OF THE TREASURY
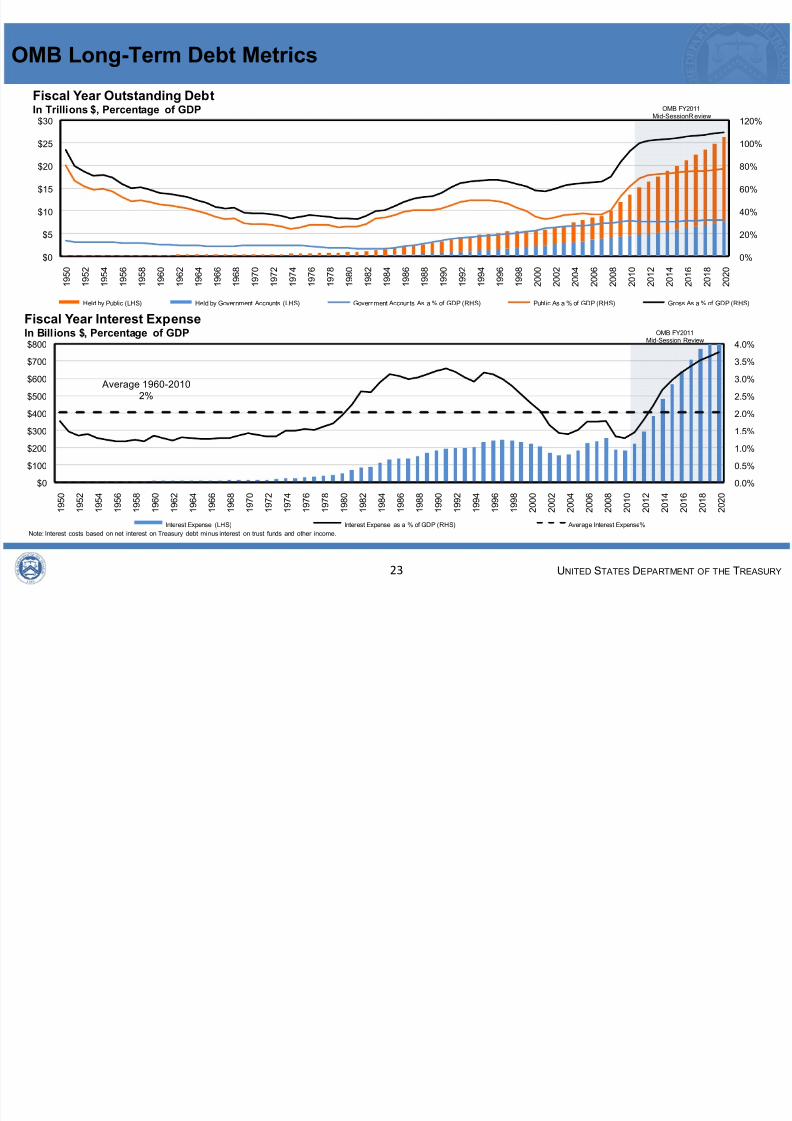
OMB Long-Term Debt Metrics
23
0%
20%
40%
60%
80%
100%
120%
$0
$5
$10
$15
$20
$25
$30
1 9 5 0
1 9 5 2
1 9 5 4
1 9 5 6
1 9 5 8
1 9 6 0
1 9 6 2
1 9 6 4
1 9 6 6
1 9 6 8
1 9 7 0
1 9 7 2
1 9 7 4
1 9 7 6
1 9 7 8
1 9 8 0
1 9 8 2
1 9 8 4
1 9 8 6
1 9 8 8
1 9 9 0
1 9 9 2
1 9 9 4
1 9 9 6
1 9 9 8
2 0 0 0
2 0 0 2
2 0 0 4
2 0 0 6
2 0 0 8
2 0 1 0
2 0 1 2
2 0 1 4
2 0 1 6
2 0 1 8
2 0 2 0
Fiscal Year Outstanding DebtIn Trillions $, Percentage of GDP
Held by Public (LHS) Held by Government Accounts (LHS) Government Accounts As a % of GDP (RHS) Public As a % of GDP (RHS) Gross As a % of GDP (RHS)
OMB FY2011Mid-SessionReview
0.0%
0.5%
1.0%
1.5%2.0%
2.5%
3.0%
3.5%
4.0%
$0
$100
$200
$300$400
$500
$600
$700
$800
1 9 5 0
1 9 5 2
1 9 5 4
1 9 5 6
1 9 5 8
1 9 6 0
1 9 6 2
1 9 6 4
1 9 6 6
1 9 6 8
1 9 7 0
1 9 7 2
1 9 7 4
1 9 7 6
1 9 7 8
1 9 8 0
1 9 8 2
1 9 8 4
1 9 8 6
1 9 8 8
1 9 9 0
1 9 9 2
1 9 9 4
1 9 9 6
1 9 9 8
2 0 0 0
2 0 0 2
2 0 0 4
2 0 0 6
2 0 0 8
2 0 1 0
2 0 1 2
2 0 1 4
2 0 1 6
2 0 1 8
2 0 2 0
Fiscal Year Interest ExpenseIn Billions $, Percentage of GDP
Interest Expense (LHS) Interest Expense as a % of GDP (RHS) Average Interest Expense%
OMB FY2011Mid-Session Review
Note: Interest costs based on net interest on Treasury debt minus interest on trust funds and other income.
Average 1960-20102%
8/7/2019 TBAC Discussion Charts Merged 2
http://slidepdf.com/reader/full/tbac-discussion-charts-merged-2 24/93
UNITED STATES DEPARTMENT OF THE TREASURY24
What adjustments to debt issuance, if any, should Treasury make inconsideration of its financing needs in the short-, medium-, and long-term?
8/7/2019 TBAC Discussion Charts Merged 2
http://slidepdf.com/reader/full/tbac-discussion-charts-merged-2 25/93
U.S. Treasury Borrowing
Advisory CommitteePresentation to Treasury
February 1, 2011

8/7/2019 TBAC Discussion Charts Merged 2
http://slidepdf.com/reader/full/tbac-discussion-charts-merged-2 26/93
U.S. Treasury Financial Innovation:Opportunities and Challenges

8/7/2019 TBAC Discussion Charts Merged 2
http://slidepdf.com/reader/full/tbac-discussion-charts-merged-2 27/93
3
Charge Question #2
Debt Management Tools and Strategy
Treasury continually seeks ways to minimize borrowing costs, better manage itsliability profile, enhance market liquidity, and expand the investor base inTreasury securities. In light of these objectives, we would like the Committee tocomment on the potential costs and benefits of new Treasury products that mightassist Treasury in achieving some or all of these objectives. In addition, are there
any other debt management tools that Treasury should consider? In answeringthe question, please review the practices and products employed by debtmanagement authorities around the world.

8/7/2019 TBAC Discussion Charts Merged 2
http://slidepdf.com/reader/full/tbac-discussion-charts-merged-2 28/93
Part I
8/7/2019 TBAC Discussion Charts Merged 2
http://slidepdf.com/reader/full/tbac-discussion-charts-merged-2 29/93
5
Overview
• The U.S. is heavily reliant on foreign ownership of Treasury debt.
• Treasury may wish to diversify its investor base in a way that does notcannibalize the current auction process by making sure new products are
additive to demand.
• Treasury could take advantage of structural changes in the U.S. debt marketsas well as regulatory developments.
• Treasury can benefit from the experience of other sovereign issuers.• Treasury may wish to expand their current suite of debt instruments by adding
other fixed-rate tenors, Floating Rate Notes (FRNs) and/or products withembedded options.
• These instruments, and their relative merits, are discussed in detail in thesecond part of this presentation.
8/7/2019 TBAC Discussion Charts Merged 2
http://slidepdf.com/reader/full/tbac-discussion-charts-merged-2 30/93
6
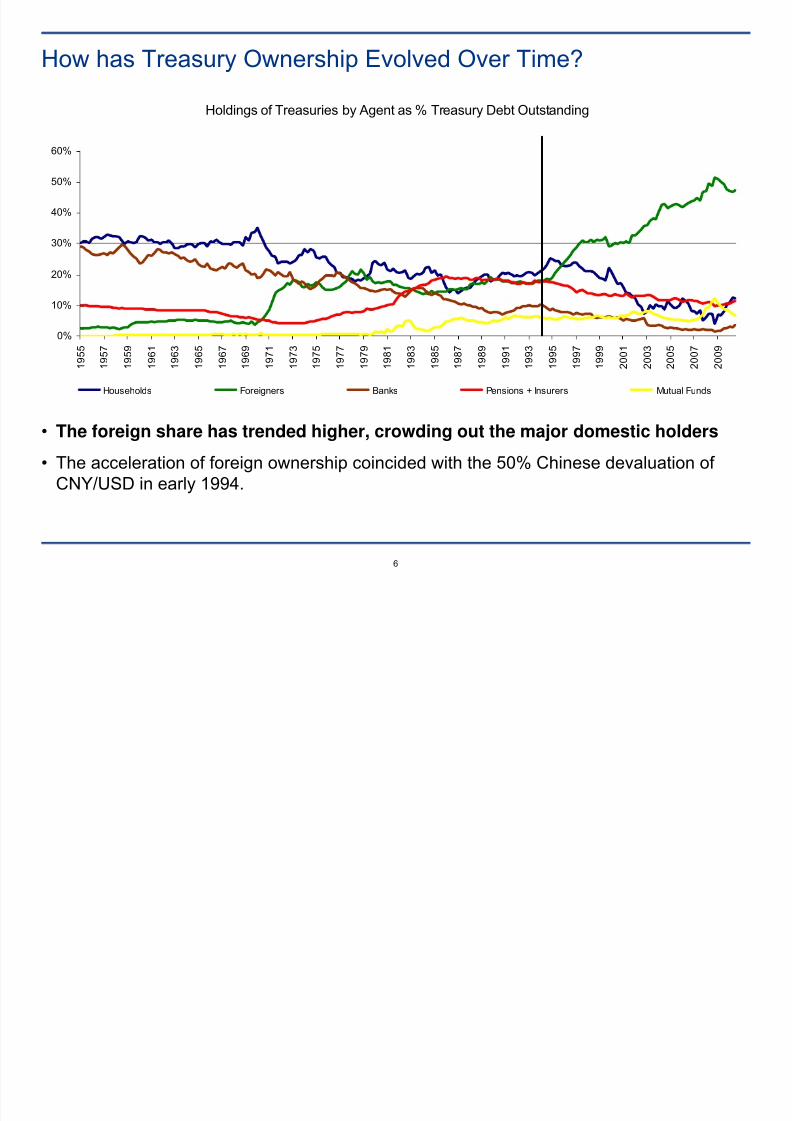
How has Treasury Ownership Evolved Over Time?
• The foreign share has trended higher, crowding out the major domestic holders
• The acceleration of foreign ownership coincided with the 50% Chinese devaluation of CNY/USD in early 1994.
Holdings of Treasuries by Agent as % Treasury Debt Outstanding
0%
10%
20%
30%
40%
50%
60%
1 9 5 5
1 9 5 7
1 9 5 9
1 9 6 1
1 9 6 3
1 9 6 5
1 9 6 7
1 9 6 9
1 9 7 1
1 9 7 3
1 9 7 5
1 9 7 7
1 9 7 9
1 9 8 1
1 9 8 3
1 9 8 5
1 9 8 7
1 9 8 9
1 9 9 1
1 9 9 3
1 9 9 5
1 9 9 7
1 9 9 9
2 0 0 1
2 0 0 3
2 0 0 5
2 0 0 7
2 0 0 9
Households Foreigners Banks Pensions + Insurers Mutual Funds

8/7/2019 TBAC Discussion Charts Merged 2
http://slidepdf.com/reader/full/tbac-discussion-charts-merged-2 31/93
7
Foreign Ownership of Treasuries is Concentrated in a Few Countries
Foreign Holdings by Selected Groups in % Total Foreign Holdings
0%
5%
10%
15%
20%
25%
30%
35%
40%
1 9 9 0
1 9 9 1
1 9 9 2
1 9 9 3
1 9 9 4
1 9 9 5
1 9 9 6
1 9 9 7
1 9 9 8
1 9 9 9
2 0 0 0
2 0 0 1
2 0 0 2
2 0 0 3
2 0 0 4
2 0 0 5
2 0 0 6
2 0 0 7
2 0 0 8
2 0 0 9
China & HK Taiwan Oil Exporters Japan
• China and other Non-Japan Asia hold nearly 20% of total Treasury debt outstanding, or 37% of debt
held by foreigners. These ratios are up from 2% and 11%, respectively, in early 1994.• Given the high concentration of foreign ownership, Treasury may wish to focus on alternative domestic
sources of debt placement.
• A more diversified debt holder base would prepare the Treasury for a potential decline in foreignparticipation.

8/7/2019 TBAC Discussion Charts Merged 2
http://slidepdf.com/reader/full/tbac-discussion-charts-merged-2 32/93
8
Treasury Could Benefit from Expanding the Current Investor Base
Foreign Ownership of Government Bonds
0%
10%
20%
30%
40%
50%
60%
US UK JP IT
Treasury’s strategy to increase domestic sponsorship could focus on:
• Learning lessons from the experience of other sovereigns.• Following a targeted approach by investor class (Banks, Pensions and Insurers, Retail).
• Taking advantage of structural changes in the U.S. debt market.
• Taking advantage of legislative and regulatory reform, and
• Introducing new products that are aligned with investor needs.
8/7/2019 TBAC Discussion Charts Merged 2
http://slidepdf.com/reader/full/tbac-discussion-charts-merged-2 33/93
9
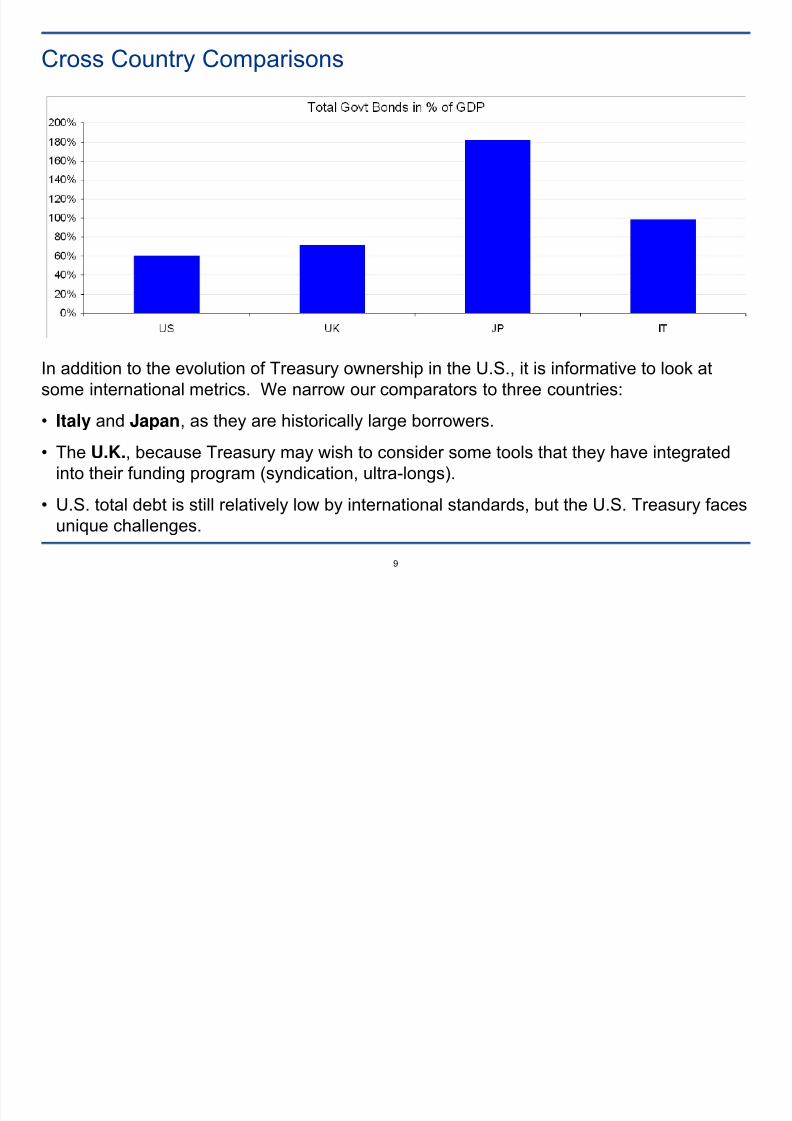
Cross Country Comparisons
In addition to the evolution of Treasury ownership in the U.S., it is informative to look atsome international metrics. We narrow our comparators to three countries:
• Italy and Japan, as they are historically large borrowers.
• The U.K., because Treasury may wish to consider some tools that they have integratedinto their funding program (syndication, ultra-longs).
• U.S. total debt is still relatively low by international standards, but the U.S. Treasury faces
unique challenges.
8/7/2019 TBAC Discussion Charts Merged 2
http://slidepdf.com/reader/full/tbac-discussion-charts-merged-2 34/93
10
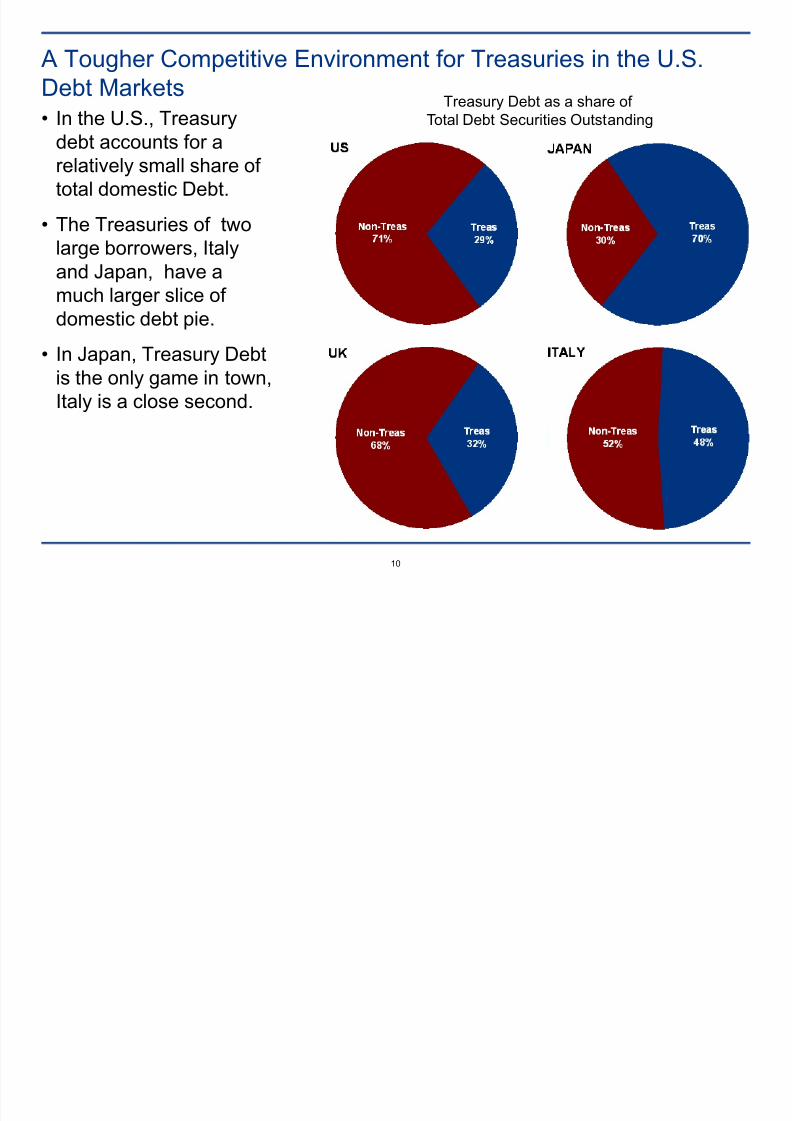
A Tougher Competitive Environment for Treasuries in the U.S.Debt Markets• In the U.S., Treasury
debt accounts for arelatively small share of total domestic Debt.
• The Treasuries of twolarge borrowers, Italyand Japan, have amuch larger slice of
domestic debt pie.
• In Japan, Treasury Debtis the only game in town,Italy is a close second.
Treasury Debt as a share of Total Debt Securities Outstanding
8/7/2019 TBAC Discussion Charts Merged 2
http://slidepdf.com/reader/full/tbac-discussion-charts-merged-2 35/93
11
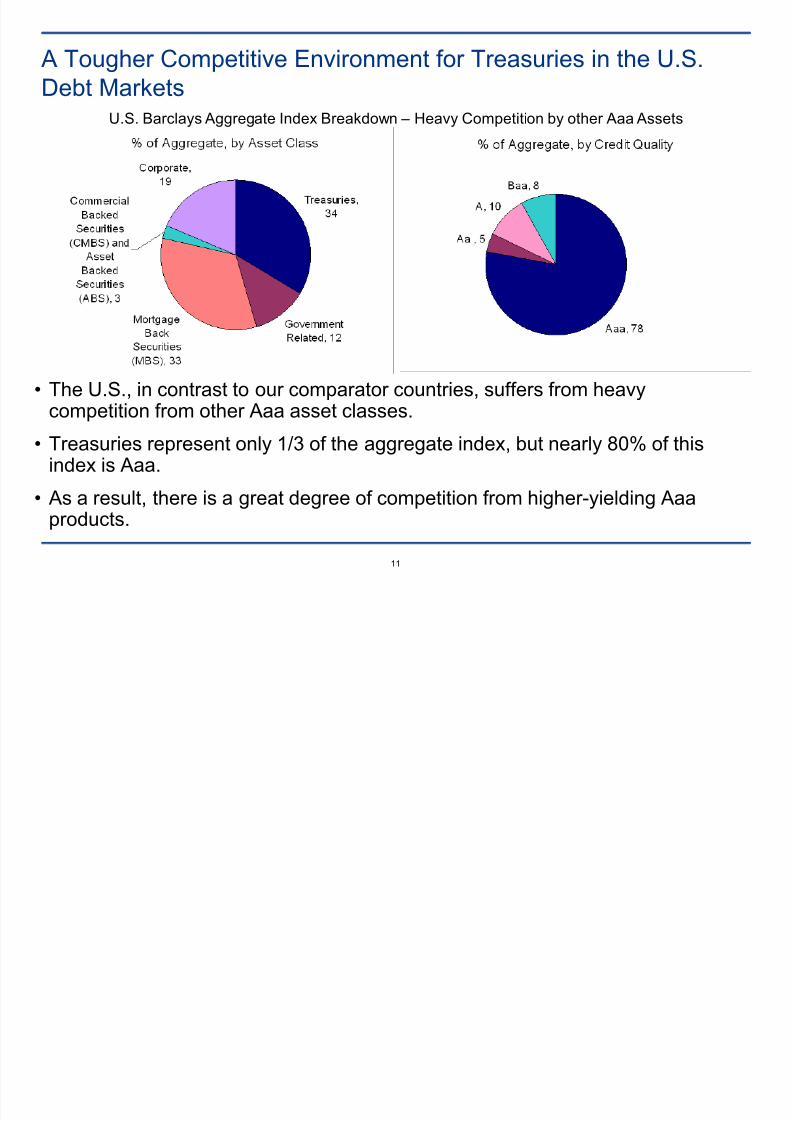
A Tougher Competitive Environment for Treasuries in the U.S.Debt Markets
• The U.S., in contrast to our comparator countries, suffers from heavy
competition from other Aaa asset classes.• Treasuries represent only 1/3 of the aggregate index, but nearly 80% of this
index is Aaa.
• As a result, there is a great degree of competition from higher-yielding Aaa
products.
U.S. Barclays Aggregate Index Breakdown – Heavy Competition by other Aaa Assets
8/7/2019 TBAC Discussion Charts Merged 2
http://slidepdf.com/reader/full/tbac-discussion-charts-merged-2 36/93
12
Taking Advantage of Market Changes (Adapt or Die)
Treasury may want to focus on areas where a product gap has developed in order to expand the demand base. TheGovernment Sponsored Enterprises (GSEs) successfully followed this strategy, when Treasury issuance droppeddramatically in the late 90’s, by introducing the Benchmark and Reference Note programs.
The current environment offers comparable opportunities for Treasury because of dislocations in several markets, as wellas regulatory and legislative developments.
• GSE debt issuance is expected to decline, as the Agencies are required to shrink their balance sheet, diverting demandtoward Treasury securities.
• The roll off of bank debt issued under the Temporary Liquidity Guarantee Program (TLGP) during the financial crisis willgenerate demand for high quality assets.
• Muni credit is coming into question, increasing demand for safe haven assets, like Treasuries.
• Money Markets face a dearth of short-term paper because of the contraction of the Commercial Paper (CP) market,
boosting demand for short-term Treasury paper.
• Legislative and regulatory developments - Dodd-Frank, pension reform by the Financial Accounting Standard Board(FASB), the Liquidity Cover Ratio (LCR) under Basel III - have the potential to lead to greater demand for long datedsecurities and liquid, high quality products.
The above market dynamics could generate demand in the following products:• Fixed rate vanilla term debt, especially in the long end.
• FRNs and other short-dated products.
• Callable and other yield-enhancement products.
These products and opportunities will be reviewed in detail in the second half of the presentation.

8/7/2019 TBAC Discussion Charts Merged 2
http://slidepdf.com/reader/full/tbac-discussion-charts-merged-2 37/93
13
Where can the incremental demand come from?
• We will now focus on three key Treasury debt buyers: ─ Banks,
─ Pensions/Insurers and
─ Retail.
• These buyers could substantially increase their demand in light of the marketdislocations, as well as the regulatory and legislative changes mentioned earlier.
• We think Treasury could tap into an additional $2.4 trn in demand from these threeinvestor bases over the next 5 years, if the right products are offered to them.

8/7/2019 TBAC Discussion Charts Merged 2
http://slidepdf.com/reader/full/tbac-discussion-charts-merged-2 38/93
14
Banks: Structural and regulatory forces should increase bankallocation to Treasuries
Bank demand for Treasuries is expected to be boosted by three keymarket developments:
• The gradual reduction in GSE balance sheets.
• The roll off of Government guaranteed bank debt issued during thefinancial crisis (TLGP), and
• Upcoming regulatory changes emanating from the Basel III framework.
We now turn to these developments.

8/7/2019 TBAC Discussion Charts Merged 2
http://slidepdf.com/reader/full/tbac-discussion-charts-merged-2 39/93
15
Banks: GSE Balance Sheet reduction and TLGP roll off generate potential demand for Treasuries
The Debt Landscape for Aaa substitutes is changing, and this is supportive for Treasuries.
GSEs -
• Fannie and Freddie are currently required to shrink their retained portfolios by 10% each year.
• The resulting reduction of the GSEs balance sheet should reduce their issuance by around 120 bln per year over the next 5 years. Buyers of GSE paper will have to find alternative use for their funds.
TLGP -
• The investment in government guaranteed bank debt (TLGP) will also need to shift to another asset as this paper matures, as the TLGP andother programs have expired. There is almost $370 bln of this debt maturing by the end of 2012, and nearly $440 bln by March 2015.
Treasury could fill the gap left by the GSE size reduction and TLGP roll off.
USD Guaranteed Bank Debt Maturity Profile (TLGP and Foreign Bank Issued)

8/7/2019 TBAC Discussion Charts Merged 2
http://slidepdf.com/reader/full/tbac-discussion-charts-merged-2 40/93
16
Banks: Changes on the regulatory front should also helpincrease their demand for Treasuries
• The key regulatory change emanates from Basel III.
• The most important is the phasing in of the Liquidity Cover Ratio (LCR).
• Although the date of implementation has been pushed to January 2015, banksseem to be trying to get there sooner to gain investor confidence.
• When the Fed eventually unwinds QE and drains cash, domestic banks will beforced to replace it with liquid securities.
• Barclays Capital estimates that banks can buy roughly $1 trn in liquid securities(split between Treasuries and Agency/other alternatives).
• If the current mix is maintained, we estimate $650-700 bln could go into
Treasuries.• This projected flow into Treasuries is roughly twice that resulting from the TLGP
roll off.

8/7/2019 TBAC Discussion Charts Merged 2
http://slidepdf.com/reader/full/tbac-discussion-charts-merged-2 41/93
17
Banks: U.S. banks are underinvested in Treasuries compared toother countries
• U.S. Bank holdings of Treasuries are relatively low due to crowding out by other high-quality asset classes (e.g. MBS, agency callables).
• Treasury can bridge the gap relative to other countries and maximize the benefits of theforthcoming structural and regulatory changes by identifying products suited to bankneeds.
• These products (e.g., callables, Floating Rate Notes) are covered in detail in the second
part of this presentation.
8/7/2019 TBAC Discussion Charts Merged 2
http://slidepdf.com/reader/full/tbac-discussion-charts-merged-2 42/93
18
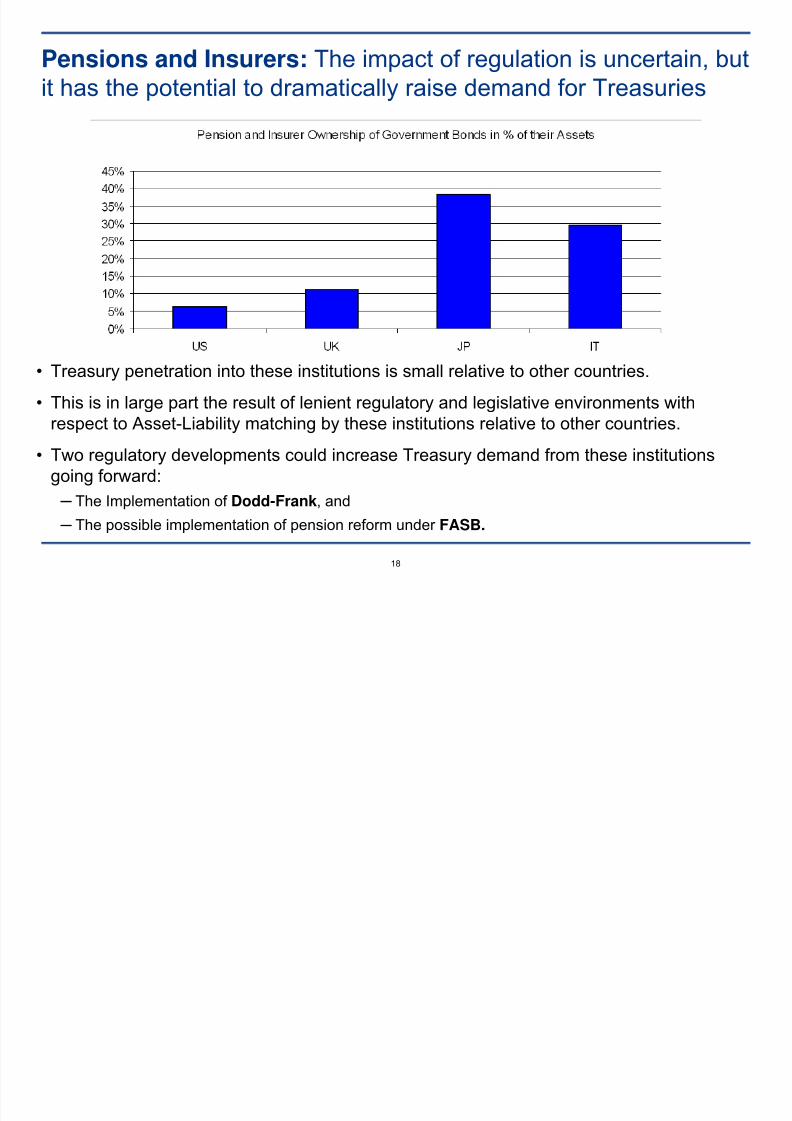
Pensions and Insurers: The impact of regulation is uncertain, butit has the potential to dramatically raise demand for Treasuries
• Treasury penetration into these institutions is small relative to other countries.
• This is in large part the result of lenient regulatory and legislative environments with
respect to Asset-Liability matching by these institutions relative to other countries.
• Two regulatory developments could increase Treasury demand from these institutionsgoing forward:
─ The Implementation of Dodd-Frank, and
─ The possible implementation of pension reform under FASB.
8/7/2019 TBAC Discussion Charts Merged 2
http://slidepdf.com/reader/full/tbac-discussion-charts-merged-2 43/93
19
Pensions and Insurers: Important legislative and regulatory changesare coming
Dodd – Frank
• The implementation of Dodd Frank imposes higher costs to the user of derivativeinstruments (e.g., posting of margins for exchange traded swaps).
• As a result institutions may turn to the Treasury market for acquiring long durationexposure, provided their demand can be met.
FASB
• After tackling the balance sheet side of Pension Reform under Phase I, FASB is nowpursuing the more complex Phase II addressing the income statement.
• In order to align the U.S. regulatory framework to international standards, regulatoryPhase II is now awaiting progress by the International Accounting Standard Board (IASB).
• The final recommendations could and should generate additional demand for long datedfixed income assets in order to reduce the volatility of the plan sponsor’s earnings.
• FASB has consistently shied away from taking a U.K.-style approach to pension reform.Their actions in the coming years has the potential for radically increasing the demand for Treasuries by the pension industry.

8/7/2019 TBAC Discussion Charts Merged 2
http://slidepdf.com/reader/full/tbac-discussion-charts-merged-2 44/93
20
Pensions and Insurers: How can Treasury capitalize on thesechanges?
In order to capitalize on these important developments, Treasury may want toconsider the following strategies:
• Issuing longer duration instruments, currently in scarce supply, and
• Creating a syndicate desk similar to that of the U.K. Debt Management Office(DMO).

8/7/2019 TBAC Discussion Charts Merged 2
http://slidepdf.com/reader/full/tbac-discussion-charts-merged-2 45/93
21
Pensions and insurers: The U.S. market is starved of high quality longduration securities
• Currently less than 10% of U.S. debt issuance has a maturity longer than 10yrs.• By comparison, nearly 30% of the U.K. issuance is in the long end.
• The U.K., and to some extent Japan, have enjoyed a longer average maturity of debt. Over time, thishas provided considerable protection during periods of market disruption.
The second part of the presentation will discuss in more detail the issuance of long dated Treasuries.
Maturity Distribution of 2010 Government Bond Issuance and Average Maturity of Debt Stock (latest)

8/7/2019 TBAC Discussion Charts Merged 2
http://slidepdf.com/reader/full/tbac-discussion-charts-merged-2 46/93
22
Pensions and Insurers: There should be demand for ultra-longbonds, and syndication may help their initial placement
• If ultra-long products are contemplated, Treasury may consider creating asyndicate desk, to aid in the pricing and distribution of these bonds. The U.K.has been very successful in employing the syndication-style of distribution.
─ Syndication has accounted for 15 % of issuance in the U.K. in the last two years.
─ This method has been used extensively for the placement of long dated paper.
─ The syndication process allows the borrower to gauge more closely market conditions and adjustsize and tenor accordingly.
─ This would be especially critical during the early phase of the introduction of new ultra-long tenors.
─ A syndication desk would also be able to address reverse inquiries by lenders with specific needs(e.g., institutional investors, corporate treasurers, etc).
• Under a scenario of concrete progress on the pension regulatory front, and anexpansion of long dated instruments issued by Treasury, it is reasonable to
assume that the U.S. could close at least half of the existing gap with the U.K.in terms of allocation to fixed income by insurers and (private) pension portfolios.
• Such a move could expand Treasury demand by more than $400 bln.

8/7/2019 TBAC Discussion Charts Merged 2
http://slidepdf.com/reader/full/tbac-discussion-charts-merged-2 47/93
23
Retail Sector: There Appears to be Room for Expansion
• Treasury is less successful in selling U.S. Treasuries (UST) to households, both relativeto the past and compared to other sovereigns.
• Households’ investment in UST has waned considerably since the 1950s: They currentlyhold roughly 3% of their assets in Treasuries, up from the 2007 lows but still well belowthe 5% level in ‘50s and ‘60s.
• Treasury used to place 30% of their debt to households; now they place only roughly 15%.
• Savings Bonds used to be ubiquitous in retail portfolios, but they are now a dying breed.
• Direct investment in Treasuries have failed to fill the gap left by their gradual
disappearance.
Retail Holdings of UST as % of UST Debt Outstanding Retail Holdings of UST Debt as % of Their Assets

8/7/2019 TBAC Discussion Charts Merged 2
http://slidepdf.com/reader/full/tbac-discussion-charts-merged-2 48/93
24
Retail Sector – There are substantial differences in “indirect” retailownership of Treasuries across countries
Direct ownership of Treasury debt in the U.S. is roughly in line with our comparator countries, but indirectownership falls short.
• This is at least in part due to lower bank holdings of Treasuries in the U.S. (they prefer higher yielding products likeagency callables and MBS), and much higher Government bond holdings by Japanese banks.
• Here, “Indirect ownership” by retail is meant to capture Treasury debt holdings made as a result of householdinvestments into other institutions, ie: through mutual funds, bank deposits, pension and insurance contracts.
•These entities then use the funds deposited by households and re-invest them into government bonds.
•Indirect ownership is estimated by taking share ownership of Treasury debt of 3 categories of buyers (Banks, MutualFunds, and Pensions and Insurers) and multiplying it by the share of these buyers in the household portfolio.
Household Holdings of Government Bonds: Direct and Indirect Ownership as % Household Total Financial Assets
8/7/2019 TBAC Discussion Charts Merged 2
http://slidepdf.com/reader/full/tbac-discussion-charts-merged-2 49/93
25
Retail Sector: There are lessons to be learned from other sovereign borrowers
• Italy and Japan have both pursued strategies to increase household investment ingovernment securities. While both countries have traditionally had higher savings ratesthan the U.S., Italy was far more successful in translating that into purchases of
government bonds.
• Italy: The Italian Treasury followed the route of liquid, fungible instruments to place debtwith individuals.
─ Retail investors used to invest almost exclusively in short term bills (BOTs).
─ The Italian Treasury was an innovator with the introduction of a Floating Rate Note (the 7yr CCT)which allowed the transition toward longer term borrowing by retail without the duration risk.
─ Once the retail community felt comfortable committing savings beyond the short term, they becamemore interested in long term fixed rate issuance (BTPs).
─ This was particularly important when rates fell, and ownership of BOTs declined sharply while
ownership of CCTs and especially BTPs held up.
• Japan: MoF followed the route of dedicated (illiquid, non-fungible) instruments, and theywere far less successful increasing direct investment by households.
• The lesson learned is: stick primarily to liquid products.

8/7/2019 TBAC Discussion Charts Merged 2
http://slidepdf.com/reader/full/tbac-discussion-charts-merged-2 50/93
26
Retail Sector: In terms of Products and Marketing, it’s all aboutyield, liquidity, and safety
Products:
• Yield enhancement products would likely be well received by the retail account base.
• Other structured notes (callable range accruals etc.) offer an even greater degree of yieldenhancement and are often purchased by more sophisticated retail investors.
• Floaters offer the benefits of being a liquid term instrument without significant duration risk. Theycould also offer some protection for individuals who have adjustable rate mortgages (ARMs).
Marketing:
• Treasury may consider employing a marketing campaign to increase broader ownership of USTdebt as an asset class in individual portfolios.
• Treasury could take a page from earlier efforts to promote individual ownership of UST debt.
• Current Savings Bonds are the offspring of WW I Liberty Bonds and WW II Defense Bonds.
• Defense Bonds (renamed War Bonds after Pearl Harbor) benefited from more than $250madvertising donated during the first three years of the National Defense Savings Program.
• Through a combination of new attractive products, and aggressive marketing, Treasury could aimat growing the household ownership share of Treasuries to the average of the last 50 years.
• Such expansion would allow Treasury to place an additional $300-350 bln of debt with retailaccounts.

8/7/2019 TBAC Discussion Charts Merged 2
http://slidepdf.com/reader/full/tbac-discussion-charts-merged-2 51/93
27
• Over the course of the World War II, 85 million Americans purchased nearly$50 bln of Savings Bonds, tripling their ownership share of Treasury debt toabout 18%.
• It worked then….

8/7/2019 TBAC Discussion Charts Merged 2
http://slidepdf.com/reader/full/tbac-discussion-charts-merged-2 52/93
28
• We now turn to the second part of our presentation.
• There, we will address in more detail new securities and debt
management techniques which Treasury may wish to consider to
diversify its investor base.

8/7/2019 TBAC Discussion Charts Merged 2
http://slidepdf.com/reader/full/tbac-discussion-charts-merged-2 53/93
Part II

8/7/2019 TBAC Discussion Charts Merged 2
http://slidepdf.com/reader/full/tbac-discussion-charts-merged-2 54/93
30
Securities and Debt Management Techniques Discussed:
• Ultra-long bonds and associated strips: 40yr, 50yr, 100yr • Bonds with embedded options
─ Callables
─ Puttables
• Money Market instruments
• Bonds for individual retail investors
• Floating rate bonds ─ Short floaters
─ CMT-style
• Other
─ GDP-linked bonds
─ A pure inflation security stripped from TIPS
• Debt management techniques: interest rate derivatives, buybacks, mini-tenders, debt exchanges

8/7/2019 TBAC Discussion Charts Merged 2
http://slidepdf.com/reader/full/tbac-discussion-charts-merged-2 55/93
31
An Approach to Financial Innovation in the U.S. TreasuryMarket
• Identify areas of excess net product demand and unfilled investor niches
• Pricing analytics• Limit rollover risk
• Lower interest cost volatility
• Expand investor base
• Liquidity
• Distribution Methods
• Time to develop market
• Ease of accounting and taxation mechanics for the U.S. Treasury andinvestors
8/7/2019 TBAC Discussion Charts Merged 2
http://slidepdf.com/reader/full/tbac-discussion-charts-merged-2 56/93
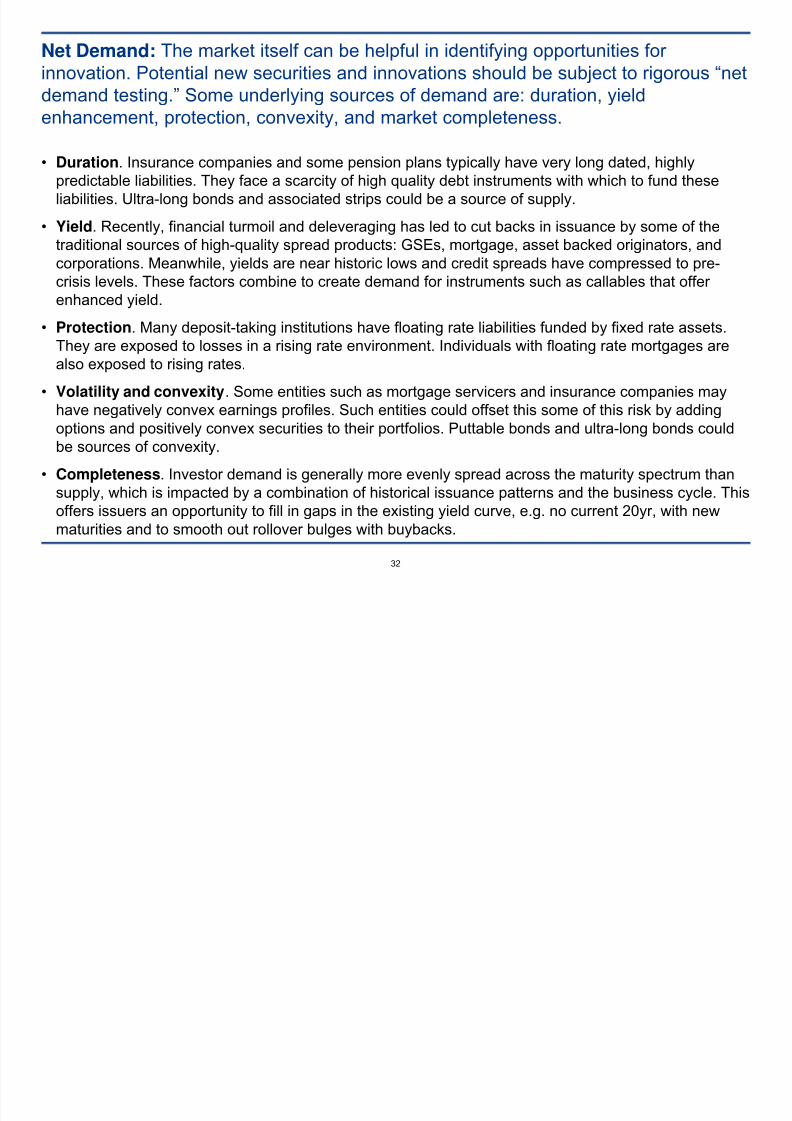
32
Net Demand: The market itself can be helpful in identifying opportunities for innovation. Potential new securities and innovations should be subject to rigorous “netdemand testing.” Some underlying sources of demand are: duration, yield
enhancement, protection, convexity, and market completeness.
• Duration. Insurance companies and some pension plans typically have very long dated, highlypredictable liabilities. They face a scarcity of high quality debt instruments with which to fund theseliabilities. Ultra-long bonds and associated strips could be a source of supply.
• Yield. Recently, financial turmoil and deleveraging has led to cut backs in issuance by some of thetraditional sources of high-quality spread products: GSEs, mortgage, asset backed originators, andcorporations. Meanwhile, yields are near historic lows and credit spreads have compressed to pre-crisis levels. These factors combine to create demand for instruments such as callables that offer enhanced yield.
• Protection. Many deposit-taking institutions have floating rate liabilities funded by fixed rate assets.They are exposed to losses in a rising rate environment. Individuals with floating rate mortgages arealso exposed to rising rates.
• Volatility and convexity. Some entities such as mortgage servicers and insurance companies mayhave negatively convex earnings profiles. Such entities could offset this some of this risk by addingoptions and positively convex securities to their portfolios. Puttable bonds and ultra-long bonds couldbe sources of convexity.
• Completeness. Investor demand is generally more evenly spread across the maturity spectrum thansupply, which is impacted by a combination of historical issuance patterns and the business cycle. Thisoffers issuers an opportunity to fill in gaps in the existing yield curve, e.g. no current 20yr, with new
maturities and to smooth out rollover bulges with buybacks.

8/7/2019 TBAC Discussion Charts Merged 2
http://slidepdf.com/reader/full/tbac-discussion-charts-merged-2 57/93
33
Ultra-Long Bonds: Main Conclusions
• Demand. There is significant demand for high-quality, long-duration bonds fromentities with long-duration liabilities such as insurance companies and pensionfunds.
•Strips
. The arithmetic of the maturity-duration relationship (duration rises muchmore slowly than maturity for ordinary coupon bonds) suggests that if ultra-longbonds are issued, they be made strippable (the duration of strips rises linearly withmaturity).
• Pricing. Dealers can determine where they see demand for the P-strip and thenwork backward to determine where to bid whole ultra-long coupon bond auctions.
• Distribution. P-strip demand will give dealers a solid basis for bidding ultra- longcoupon auctions. Syndication methods have been successful in other countries andcould further support the distribution process but normal reverse Dutch auction
process may also be sufficient.
• Costs. Ultra-long bond yields are unlikely to be significantly higher than those in the30yr sector, keeping issuing costs down. Spreads in the U.S. swap market and inoverseas ultra-long bond markets are very tight to 30yr rates.

8/7/2019 TBAC Discussion Charts Merged 2
http://slidepdf.com/reader/full/tbac-discussion-charts-merged-2 58/93
34
Long-Duration Liabilities vs. Assets: the case of insurance companies and pension funds
• Assets
─ Duration of insurance company assets is typically: 6-10 years.
• Liabilities ─ Duration of liabilities is typically much longer than 6-10 years and is actuarially
relatively stable, inviting cash-matching funding strategies.
• Sources of long-duration liabilities
─ Long term care (you pay up front and are covered in old age)
─ Term life insurance: 20-year term is most popular and some companies offer 30-year term.
─ Permanent life policies.
─ Annuity products increasingly contain secondary guarantees such as of guaranteedminimum death benefits.
─ Defined benefit pension plans.
8/7/2019 TBAC Discussion Charts Merged 2
http://slidepdf.com/reader/full/tbac-discussion-charts-merged-2 59/93
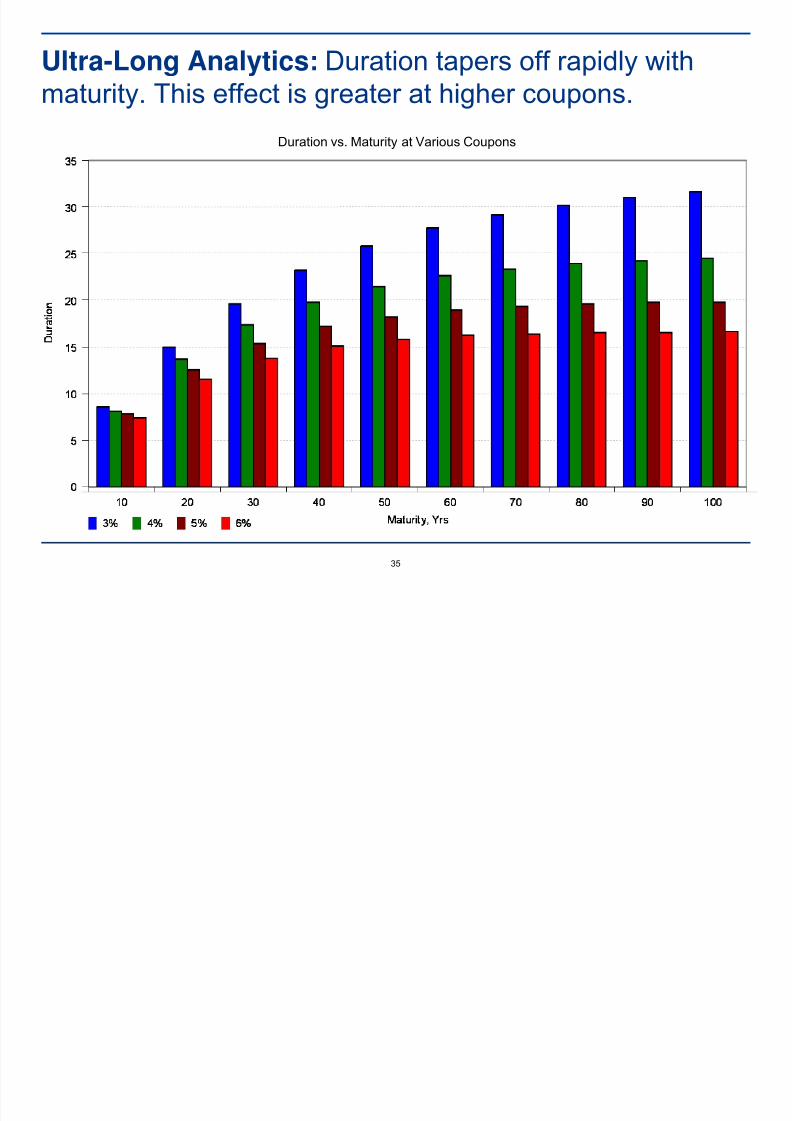
35
Ultra-Long Analytics: Duration tapers off rapidly withmaturity. This effect is greater at higher coupons.
Duration vs. Maturity at Various Coupons
8/7/2019 TBAC Discussion Charts Merged 2
http://slidepdf.com/reader/full/tbac-discussion-charts-merged-2 60/93
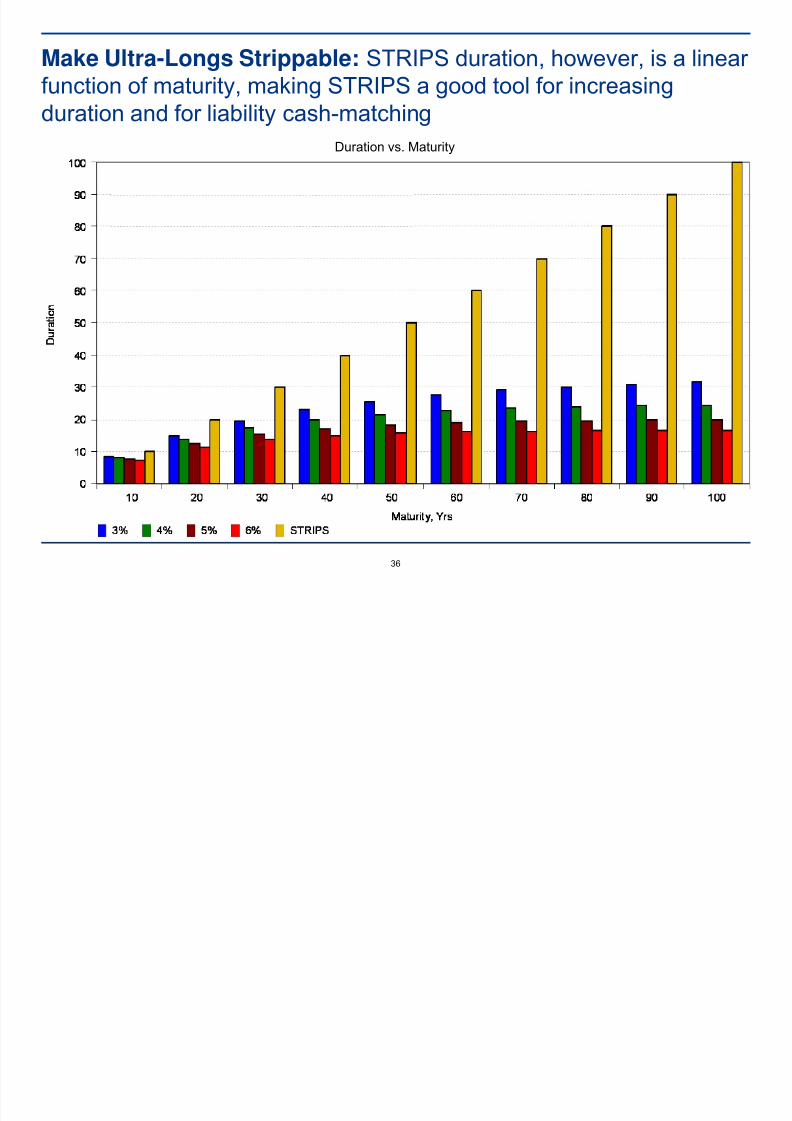
36
Make Ultra-Longs Strippable: STRIPS duration, however, is a linear function of maturity, making STRIPS a good tool for increasing
duration and for liability cash-matchingDuration vs. Maturity
8/7/2019 TBAC Discussion Charts Merged 2
http://slidepdf.com/reader/full/tbac-discussion-charts-merged-2 61/93
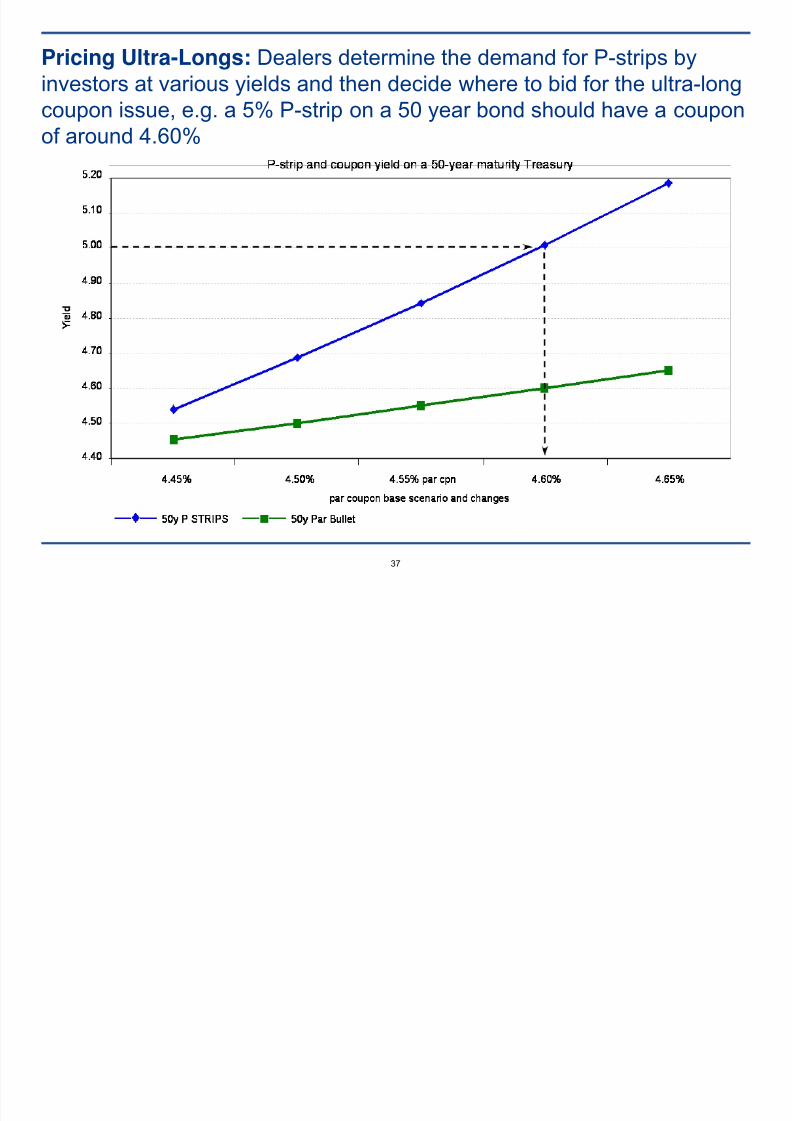
37
Pricing Ultra-Longs: Dealers determine the demand for P-strips byinvestors at various yields and then decide where to bid for the ultra-long
coupon issue, e.g. a 5% P-strip on a 50 year bond should have a couponof around 4.60%
8/7/2019 TBAC Discussion Charts Merged 2
http://slidepdf.com/reader/full/tbac-discussion-charts-merged-2 62/93
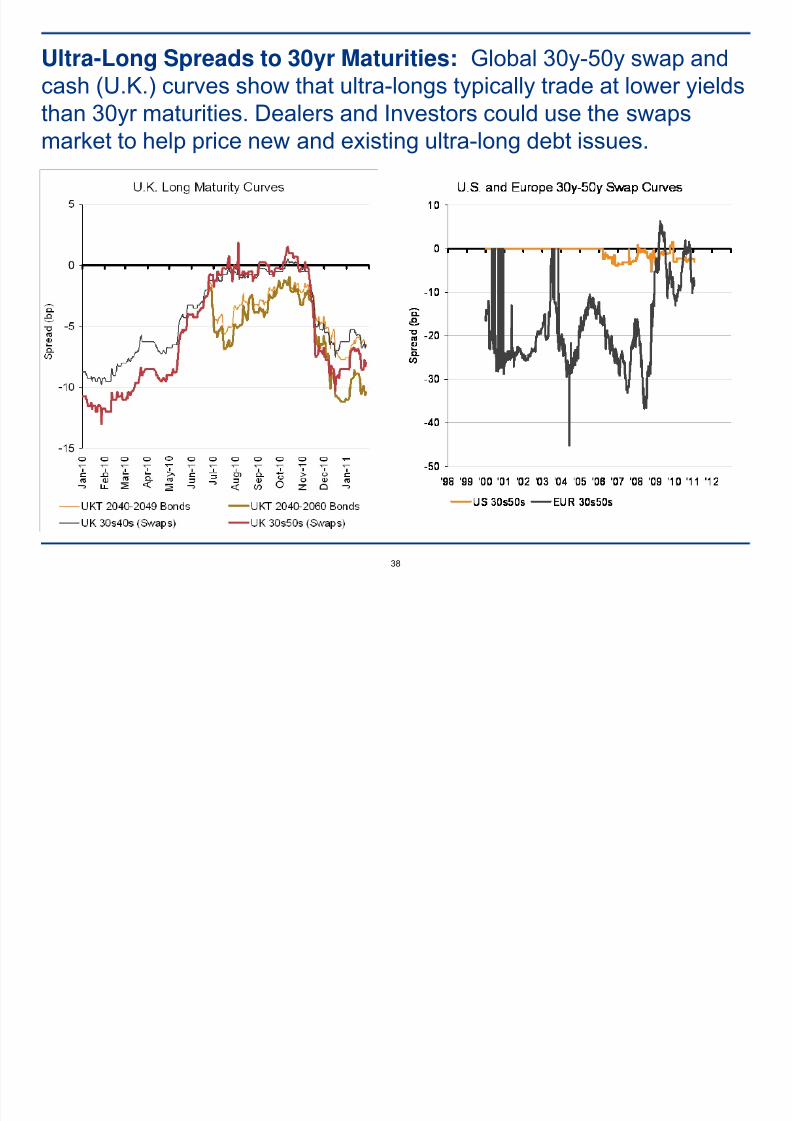
38
Ultra-Long Spreads to 30yr Maturities: Global 30y-50y swap andcash (U.K.) curves show that ultra-longs typically trade at lower yields
than 30yr maturities. Dealers and Investors could use the swapsmarket to help price new and existing ultra-long debt issues.
8/7/2019 TBAC Discussion Charts Merged 2
http://slidepdf.com/reader/full/tbac-discussion-charts-merged-2 63/93
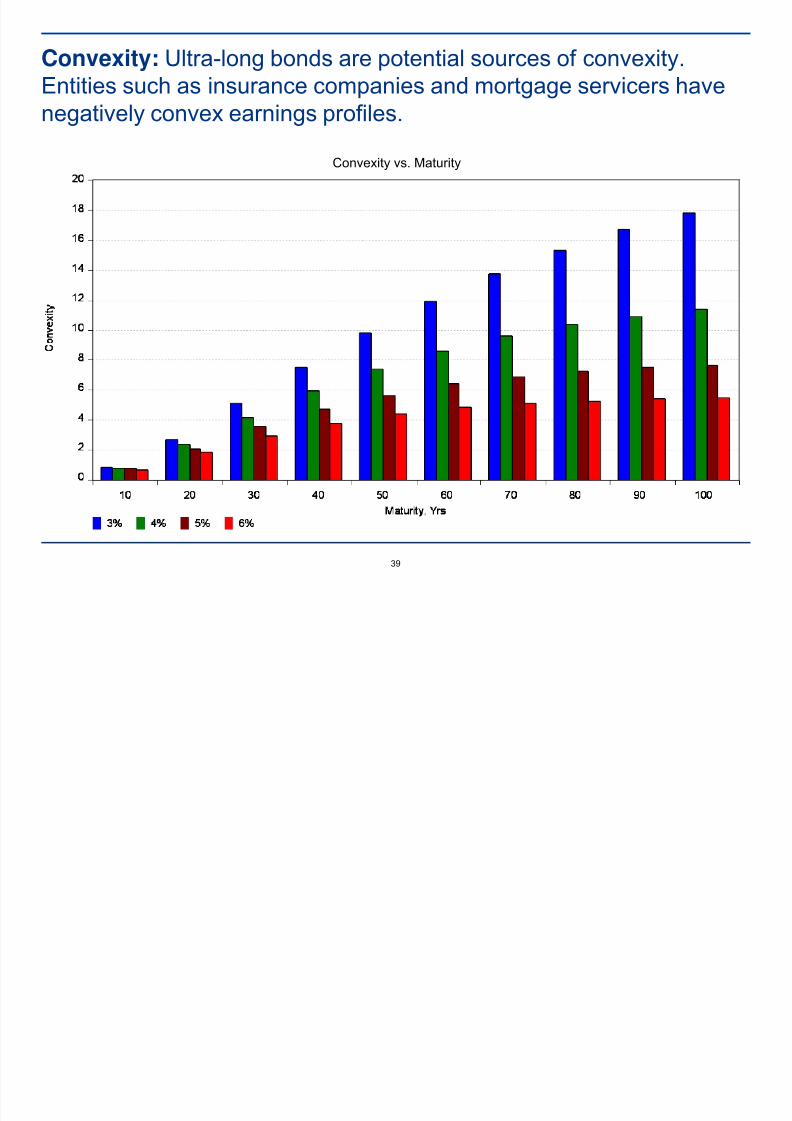
39
Convexity: Ultra-long bonds are potential sources of convexity.Entities such as insurance companies and mortgage servicers have
negatively convex earnings profiles.
Convexity vs. Maturity

8/7/2019 TBAC Discussion Charts Merged 2
http://slidepdf.com/reader/full/tbac-discussion-charts-merged-2 64/93
40
Callable Bonds: Main Conclusions
• Demand-supply gap. Callable Treasuries could fill an emerging gap between demand and supply.
─ Demand for instruments offering enhanced yields is being driven by the absolute low level of yields, spreadcompression, and regulatory changes.
─ Net supply of high quality spread product, including callables is likely to continue to fall due to the drop in issuancein the Agency, MBS, and structured product markets.
─ The demand for volatility has decreased due to falling home mortgage issuance and Treasury callable issuance
can fill this gap.• Replacing GSE supply. Treasuries are relatively close substitutes for Agencies.
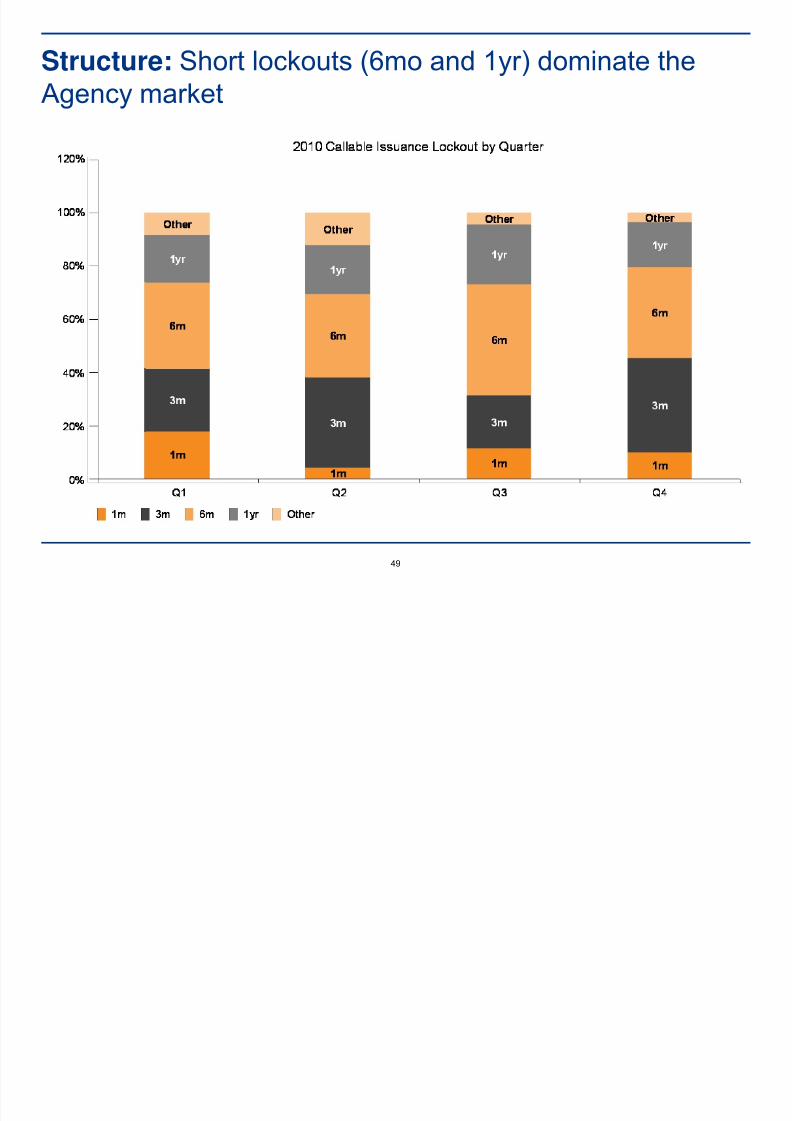
─ The greatest opportunities for callable Treasury issuance may lie in the maturity ranges and lock outs that havebeen previously mapped by the GSEs. Popular maturities are 2-5 years and the lock outs are 6mo or 1yr.
• Corporate callable issuance. There may be demand for a regularly issued callable long maturity
Treasury. ─ The bulk of the outstanding callable corporate bonds carry ratings of BBB or lower, making for less substitutability
between them and Treasuries.
─ Corporate issuance is somewhat irregular. Corporate issuers generally tailor securities to suit their specific needs interms of maturity and lockouts (project finance or cash outflow) rather than those of buyers.
• Cost. Pricing models suggest the incremental cost to Treasury of issuing callables is manageable, eg18 bp for a 5yrNC1yr and 8 bp for a 2yrNC6mo.
• Risk. Demand for callables tends to fall off if investors expect rates are heading higher. Investorsgenerally expect (hope) to be called. Once a rate-rise cycle gets underway or market volatilityincreases, Treasury may have to offer higher yield enhancement to maintain a regular issuance
program or be willing to curtail the program.

8/7/2019 TBAC Discussion Charts Merged 2
http://slidepdf.com/reader/full/tbac-discussion-charts-merged-2 65/93
41
Treasury Yields are Low and Corporate Bond Spreads areCompressed, Increasing Demand for Yield Enhancement
5Yr Treasuries vs. A Rated Corporate Bond Spreads
1.50
2.00
2.50
3.00
3.50
4.00
4.50
5.00
2001 2002 2003 2004 2005 2006 2007 2008 2009 2010
P c t Y i e
l d
-
100
200
300
400
500
600
b p s S pr e a d
5yr Treasury Yield A Rated Corporate Bond Spreads

8/7/2019 TBAC Discussion Charts Merged 2
http://slidepdf.com/reader/full/tbac-discussion-charts-merged-2 66/93
42
Net Supply of High Quality Assets: Trending lower even beforeQE2 removes $600bln in Treasuries through June 2011

8/7/2019 TBAC Discussion Charts Merged 2
http://slidepdf.com/reader/full/tbac-discussion-charts-merged-2 67/93
43
ABS Has Also Seen Negative Net Issuance(2010 net -$97bln)
Net ABS Issuance
-150
-100
-50
0
50
100
150
2000 2001 2002 2003 2004 2005 2006 2007 2008 2009 2010
Includes Auto, Credit Card, Equipment, and Student Loan ABS.

8/7/2019 TBAC Discussion Charts Merged 2
http://slidepdf.com/reader/full/tbac-discussion-charts-merged-2 68/93
44
Overall Net Callable Issuance Declined in 2010 by $384 bln
Net Callable Issuance
-600
-400
-200
0
200
400
600
800
1000
1200
2001 2002 2003 2004 2005 2006 2007 2008 2009 2010
Agencies Agency MBS Non-Agency MBS Total

8/7/2019 TBAC Discussion Charts Merged 2
http://slidepdf.com/reader/full/tbac-discussion-charts-merged-2 69/93
45
Agency Callables: A Closer Look at Investors
• Domestic banks – larger banks buy short maturity, liquid, high credit- quality product toenhance yield. Recent regulatory changes such as Dodd-Frank and Basel III will increasedemand significantly in Treasury-based liquidity portfolios. Some smaller banks willpurchase short lockout callables with maturities of 15yr as a substitute to mortgage loans.
• Foreign Banks – are opportunistic. Demand is strong when rates are low but tends tofade when rates rise and calls go out of the money.
• State and local governments – need securities with high liquidity, very high creditquality, and enhanced yields. They are often required by law to buy Treasury or GSE
securities. Maturities favored are generally 3yrs and shorter; 6 month lock outs arefavored but some entities will be opportunistic for yield pick up.
• Fund Managers – will overweight callables in order to attempt to outperform their index.
• Insurance Companies and Pension Funds – buy callable agencies opportunistically as
a potential substitute for corporate bonds.
• Foreign investors – many foreign investors have backed away from the Agency marketdue to uncertainty surrounding future status of GSEs. Callable Treasuries might bewelcomed by many of these former GSE buyers.
U d l i D d f C ll bl A i I 2010
8/7/2019 TBAC Discussion Charts Merged 2
http://slidepdf.com/reader/full/tbac-discussion-charts-merged-2 70/93
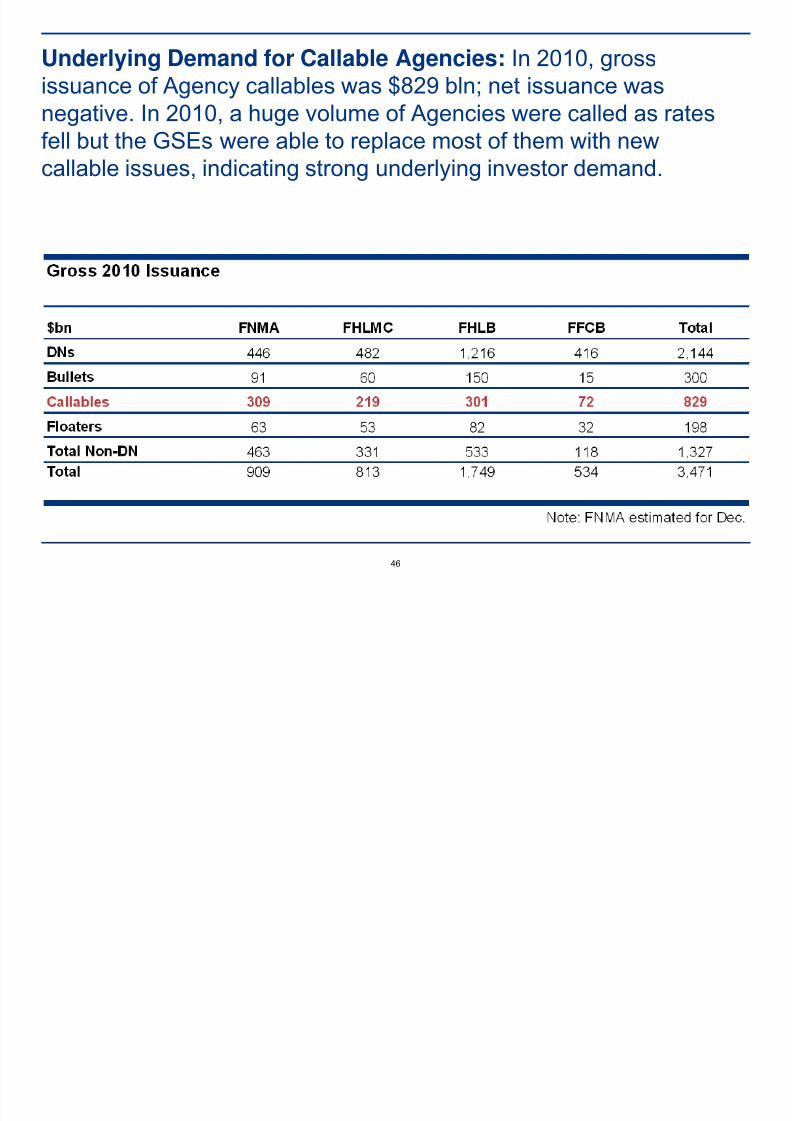
46
Underlying Demand for Callable Agencies: In 2010, grossissuance of Agency callables was $829 bln; net issuance was
negative. In 2010, a huge volume of Agencies were called as ratesfell but the GSEs were able to replace most of them with newcallable issues, indicating strong underlying investor demand.
GS f C O
8/7/2019 TBAC Discussion Charts Merged 2
http://slidepdf.com/reader/full/tbac-discussion-charts-merged-2 71/93
47
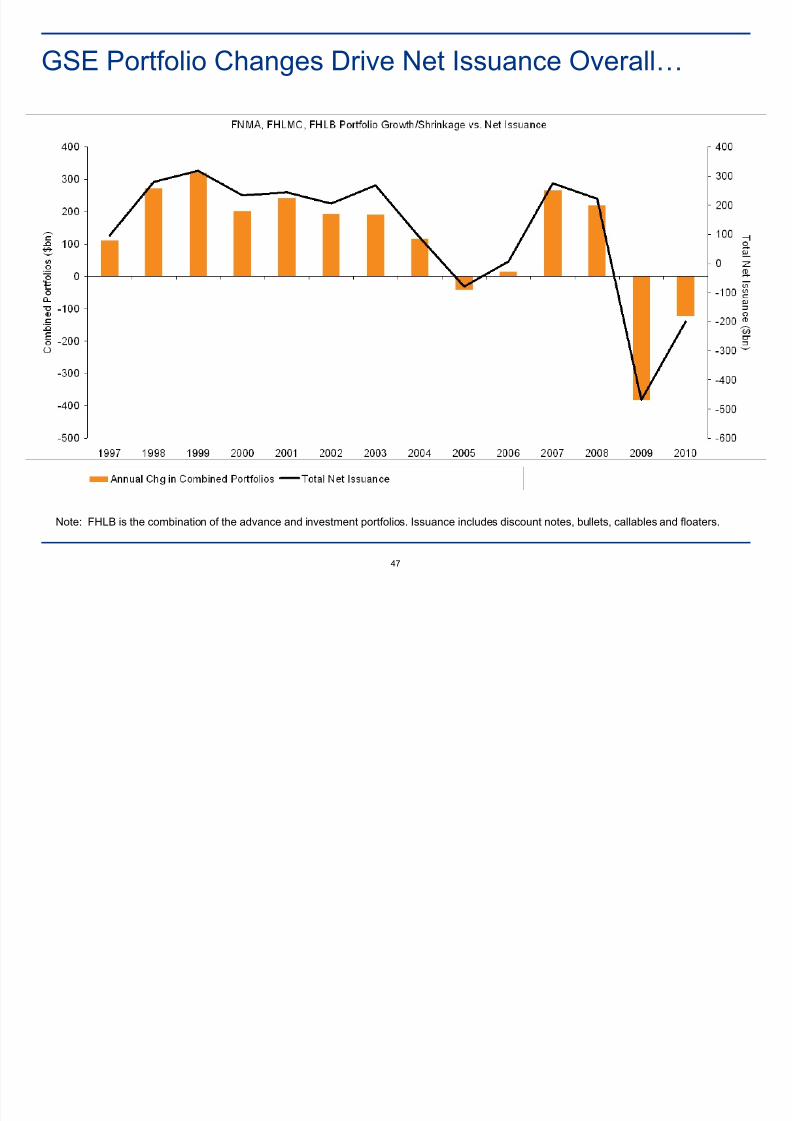
GSE Portfolio Changes Drive Net Issuance Overall…
Note: FHLB is the combination of the advance and investment portfolios. Issuance includes discount notes, bullets, callables and floaters.
I l di N t C ll bl I

8/7/2019 TBAC Discussion Charts Merged 2
http://slidepdf.com/reader/full/tbac-discussion-charts-merged-2 72/93
48
… Including Net Callable Issuance
Note: FHLB is the combination of the advance and investment portfolios. Issuance includes discount notes, bullets, callables and floaters. Thedecrease in net callable issuance in 2007/2008 was driven by an increase in FHLB discount note and floating rate notes while callable issuance
decreased.
St t Sh t l k t (6 d 1 ) d i t th
8/7/2019 TBAC Discussion Charts Merged 2
http://slidepdf.com/reader/full/tbac-discussion-charts-merged-2 73/93
49
Structure: Short lockouts (6mo and 1yr) dominate theAgency market
C ll bl A M k t Li idit
8/7/2019 TBAC Discussion Charts Merged 2
http://slidepdf.com/reader/full/tbac-discussion-charts-merged-2 74/93
50
Callable Agency Market Liquidity
• The difference between new issue spreads and secondary spreads is5-10 bp.
• But liquidity has been improving.
─ Deal sizes have increased.
─ Rising number of underwriters.
─ European call structures
─ Shorter maturities
P i i d C t t T I t l t f i i

8/7/2019 TBAC Discussion Charts Merged 2
http://slidepdf.com/reader/full/tbac-discussion-charts-merged-2 75/93
51
Pricing and Cost to Treasury: Incremental cost of issuingcallables in the present Agency-range is estimated to be
8-22 bp according to fair value pricing models. Empiricalevidence from the Agency market is consistent with theseresults.
Estimated Value of Embedded Call Options
C ll bl Yi ld B ll t Hi t i l S d

8/7/2019 TBAC Discussion Charts Merged 2
http://slidepdf.com/reader/full/tbac-discussion-charts-merged-2 76/93
52
Callable Yield vs. Bullets: Historical Spreads
• Yield difference between new issue agency callable yields and par bulletsaveraged 11-24 bp in 2010 for 2-5yr maturities with European call options.
Callable Corporates: The bulk of outstanding callable corporates are
8/7/2019 TBAC Discussion Charts Merged 2
http://slidepdf.com/reader/full/tbac-discussion-charts-merged-2 77/93
53
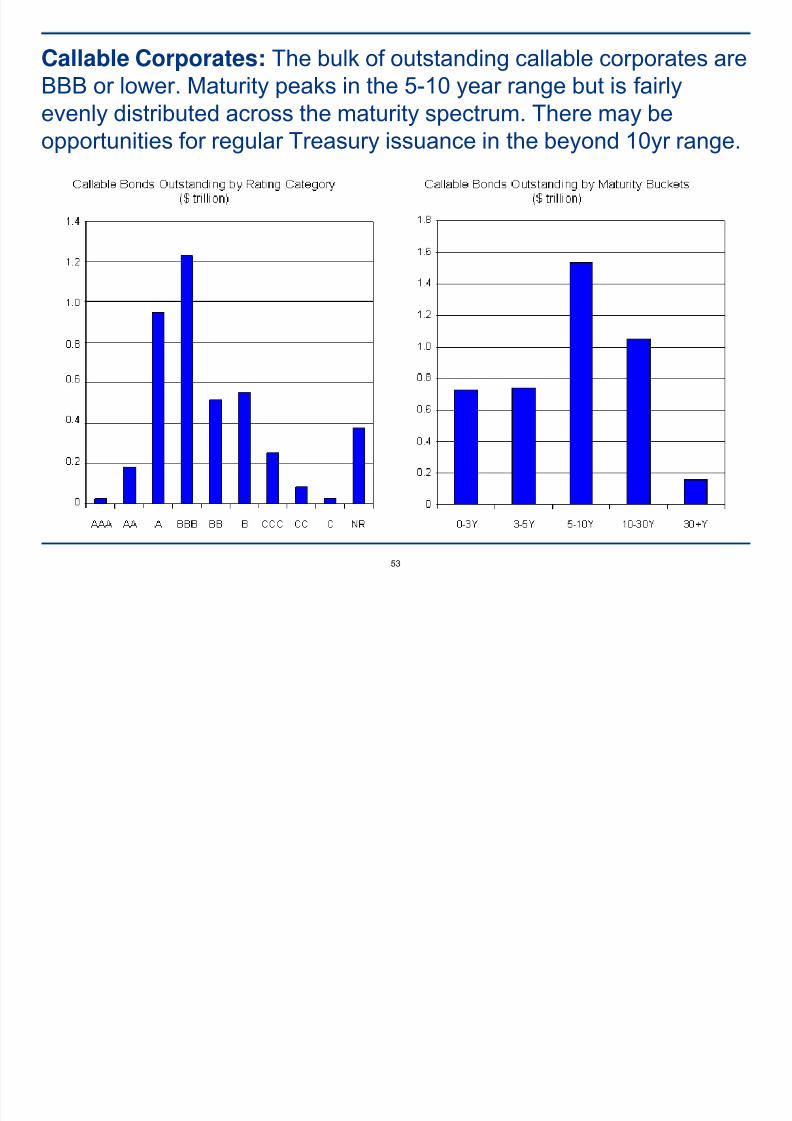
Callable Corporates: The bulk of outstanding callable corporates areBBB or lower. Maturity peaks in the 5-10 year range but is fairly
evenly distributed across the maturity spectrum. There may beopportunities for regular Treasury issuance in the beyond 10yr range.
Money Market Instruments Main Concl sions

8/7/2019 TBAC Discussion Charts Merged 2
http://slidepdf.com/reader/full/tbac-discussion-charts-merged-2 78/93
54
Money Market Instruments: Main Conclusions
• Regulatory changes are creating new demand for short-term instruments such as Treasury billsand short callables.
─ Estimates of the overall increase in demand for government debt to meet the new liquidityrequirements in order to comply with Basel III range from $400-800 bln.
─ Most of the increased demand is likely to be for short maturity, highly liquid securities,
whose risk weighting is zero.
• Money market mutual funds: regulatory changes are requiring them to shorten up on thematurity of their assets.
• Banks et al: at the same time, new regulations require banks and others to lengthen the
maturity of their liabilities.• The demand-supply gap will naturally widen further in a rising rate environment.
• Treasury has room to issue more bills if it desires to do so. Bills outstanding as a percent of total U.S. Treasury debt have returned to pre-crisis levels as has the average maturity of thedebt.
• Costs. More bill issuance may conflict with objective of further lengthening the maturity of thedebt and expose Treasury to rollover risk and higher funding costs in a rising rate cycle.
Room to Issue More Bills: T bills as percent of

8/7/2019 TBAC Discussion Charts Merged 2
http://slidepdf.com/reader/full/tbac-discussion-charts-merged-2 79/93
55
Room to Issue More Bills: T-bills as percent of marketable debt have fallen back to around 20% from thealmost 35% of 2008/2009
Room to Issue More Bills: The average maturity of

8/7/2019 TBAC Discussion Charts Merged 2
http://slidepdf.com/reader/full/tbac-discussion-charts-merged-2 80/93
56
Room to Issue More Bills: The average maturity of Treasury debt held by the public is up to ~59.5 months
Regulatory Paradox: Regulations are creating a possible

8/7/2019 TBAC Discussion Charts Merged 2
http://slidepdf.com/reader/full/tbac-discussion-charts-merged-2 81/93
57
Regulatory Paradox: Regulations are creating a possibleniche for increased bill and callable issuance targetingmoney market mutual funds
• Money Market Mutual Funds (MMMFs) ─ SEC 2a-7 regulations requires the MMMFs to shorten the term of their assets by
bringing the weighted asset maturity to 60 days from 90 days and to maintain 30% of their assets have to mature within 7 days.
─ This has increased the MMMFs demand for short-dated securities.
• Banks and others
─ Basel III requires banks to lengthen their liabilities.
• The gap ─ There may be room for increased bill and callable issuance to fill the emerging gap
between MMMFs and issuers that will be created by new regulations.
─ This gap will naturally widen (MMMFs will want more short paper and banks andothers will want to lengthen liabilities) if market participants expect that we are enteringa rate hike cycle.
─ Puttable securities with puts exercisable every 60 days would find interest amongMMMFs and offer a lower nominal initial interest rate for the U.S. Treasury.
Bonds for Individual Investors: Main Conclusions
8/7/2019 TBAC Discussion Charts Merged 2
http://slidepdf.com/reader/full/tbac-discussion-charts-merged-2 82/93
58
Bonds for Individual Investors: Main Conclusions
• Increasing household ownership of Treasuries has the potential tobroaden the investor base significantly. Each 1% increase holdings as apercent of household assets = ~$535 bln.
• Holdings of Treasuries by households are up sharply since the financial
crisis and demographics favor further increases in the long run.
• But household holdings of savings bonds has been relatively stable for the past few years at low levels ($190 bln).
• Households now have many, more liquid alternatives to savings bonds,which are simpler and which do not face severe penalties for earlyredemption.
• Treasury should focus on instruments that appeal to both householdsand institutional investors.
• It should consider stepping up marketing initiatives, including increasedadvertising geared toward retail investors, and it should consider new
types of issues.
Savings Bonds: Savings bonds outstanding are at the

8/7/2019 TBAC Discussion Charts Merged 2
http://slidepdf.com/reader/full/tbac-discussion-charts-merged-2 83/93
59
Savings Bonds: Savings bonds outstanding are at thelowest level in years, and an increasingly small share of Total Public Debt
Household Holdings of Treasury Debt has Increased

8/7/2019 TBAC Discussion Charts Merged 2
http://slidepdf.com/reader/full/tbac-discussion-charts-merged-2 84/93
60
Household Holdings of Treasury Debt has IncreasedRecently
Floating Rate Securities with Short Dated Reference

8/7/2019 TBAC Discussion Charts Merged 2
http://slidepdf.com/reader/full/tbac-discussion-charts-merged-2 85/93
61
Floating Rate Securities with Short Dated ReferenceRates: Main Conclusions
• A floating rate instrument, whose reset and reference rate are the same, eg a 6 mo reset with the 6 mo billrate as its reference rate, would be a “convenience” product, allowing both individuals and institutions to avoidthe inconvenience of rolling bill positions or incurring transaction costs in the secondary market.
• Holders would not be exposed to the significant curve risks associated with CMT-style floating rate
instruments where there is a mismatch between reference rate maturity and reset frequency.• Institutional demand for such instruments could be strong based on the likely increase in holdings of short
term, high quality assets required by Basel III. And, there is a dearth of default-risk free floating rate assets.
• Demand will likely increase if rates are expected to rise.
• From Treasury’s point of view, such instruments are attractive because they reduce rollover risks.
• Treasury could set the maturity based on the distribution of its future redemptions to lessen marketcongestion. 5yr and 10yr maturities look promising from this point of view.
• For Treasury, these floaters do not of mitigate against increased debt service costs in a rising rateenvironment, but neither do they increase them.
• From a liability management perspective, floaters offer a counter-cyclical component, i.e. typically rates willrise in a stronger economy, and at the same time federal tax receipts will be increasing - mitigating the rise indebt-servicing costs.
• We assume that no fixed-margin discount or premium would be applied to the reference rate, implying that theconvenience for investors and the advantages to Treasury are about equal, but this may not always be thecase.
CMT-Style Floaters: The reference rate is generally on a maturity

8/7/2019 TBAC Discussion Charts Merged 2
http://slidepdf.com/reader/full/tbac-discussion-charts-merged-2 86/93
62
CMT-Style Floaters: The reference rate is generally on a maturitythat is much longer than the reset period, eg a 5yr reference rate
and a 6 mo reset period. Japan and France have tried these withmixed success.
Sample term sheet:
• Maturity: 10yrs.
• Reference rate: 5yr auction rates set in the period just prior to the reset date.
• Margin: A “margin” is set at auction, which is subtracted (or added to) from the reference rates. Themargin is fixed for the life of the bond.
• The margin reflects investors’ demand for floating rate assets at a spread to their floating rate liabilities.
• Floor: Future coupon payments can not go below zero.
Demand:
• These securities may be demanded by deposit-taking entities, which have floating rate liabilities thatthey fund at a spread using fixed rate assets. Such instruments give them a spread pick up and someprotection from rising rates.
• Individuals, especially those who expect rising rates or who have floating rate mortgages, may alsofind these securities attractive.
Analytics: CMT-style floaters are simple to describe but
8/7/2019 TBAC Discussion Charts Merged 2
http://slidepdf.com/reader/full/tbac-discussion-charts-merged-2 87/93
63
Analytics: CMT style floaters are simple to describe butrelatively complex to price
• Computing the “fair value” of a CMT-style floater:
─ Extract the discount factors (zero coupon rates) associated with future coupon and principal paymentsfrom the current yield curve.
─ Estimate the expected future coupon payments from the current forward curve, making the usualadjustment for convexity.
─ In the case of a 10yr floater indexed to a 5yr reference rate with a 6mo reset, we need 15 yrs of discountfactors and associated expected forward 5yr rates.
─ To value the zero-floor on coupon payments, we need to value an associated string of options on theindex rate.
─ Volatility enters the valuation through its impact on the value of the floor and in the convexity adjustment.
• Sensitivity to the slope of the yield curve: ─ The fair value of CMT floaters is relatively sensitive to changes in the slope of the yield curve, increasing
when the curve steepens and falling when it flattens.
─ This is because an increase in a zero coupon rate has two opposite effects on the fair value of a CMT-style floater:
A negative effect operating via the higher discount factors A positive effect operating via the implied higher coupons
For shorter maturities, the discount effect dominates the coupon effect, but as maturity increases, the higher implied coupon effect dominates.
─ One implication of this is to avoid exceptionally long maturities for both the floater itself and the referencerate because this exposes deposit-taking entities to large and likely unanticipated changes in the very long
end of the yield curve. This happened, for instance, in Japan.
GDP-Linked Bonds: Interesting but need more research

8/7/2019 TBAC Discussion Charts Merged 2
http://slidepdf.com/reader/full/tbac-discussion-charts-merged-2 88/93
64
GDP-Linked Bonds: Interesting but need more researchto assess their potential
Premise: A GDP-linked bond pays a coupon based on a nation’s growth. For example, if trendgrowth is 3%, and a nation regularly borrows at 7%, a GDP-linked bond’s coupon will be 7% +/-the GDP deviation from trend growth (3% in this example).
Pros:
• Dampens the relationship between the business cycle and interest expense.• Reduces the pro-cyclicality of government spending by decreasing coupon payments in
economic contractions, and vice-versa in economic expansions.
• Allows investors to express a view on the economy’s future growth and may derive demandfrom equity index investors.
Cons:
• Complicated structure, difficult to price. Premium may be required due to volatility of cash flows.
• Debate as to whether to adjust to the rate of growth of GDP, or the level of GDP.
• Economic data, which is the basis of the reference rate, is frequently revised.
• If GDP is strong, and coupons increase, investors may be concerned that the sovereign will“call” the bond or enact buybacks.
• Demand for GDP-linked structures is unknown, extremely limited comparisons are available.
Stripping Out the Inflation Uplift from TIPS: To create additional

8/7/2019 TBAC Discussion Charts Merged 2
http://slidepdf.com/reader/full/tbac-discussion-charts-merged-2 89/93
65
Stripping Out the Inflation Uplift from TIPS: To create additionaloverall demand for TIPS
Pros
• As much as 60% of long-dated nominal Treasury issues are held as strips, indicatingsignificant demand for zero coupon securities.
• TIPS stripping, on the other hand, is very small partly because under existing rules, the
final cashflow includes both the face value (unadjusted principal) and the accrual for inflation.
• Any type of increase to stripping activity will increase liquidity in the underlying bond.
• Separating the final cash flow into two components – an unadjusted principal and theinflation accrual or uplift (“pure” inflation) may increase the demand for TIPS overall.
• Demand for the pure inflation uplift could come from TIPS funds, pension funds,insurance companies, corporations, and retail investors.
• Similar demand for pure inflation uplift has been seen in other currencies.
Cons• Dealers may be resistant to holding the residual strips, decreasing overall liquidity.
• Demand for the non-pure inflation component may be less robust than demand for theinflation uplift.
• Tax issues and fungibility issues with principal strips off conventional whole bonds.
Buybacks and Completeness: Treasury faces big rollovers from 2012
8/7/2019 TBAC Discussion Charts Merged 2
http://slidepdf.com/reader/full/tbac-discussion-charts-merged-2 90/93
66
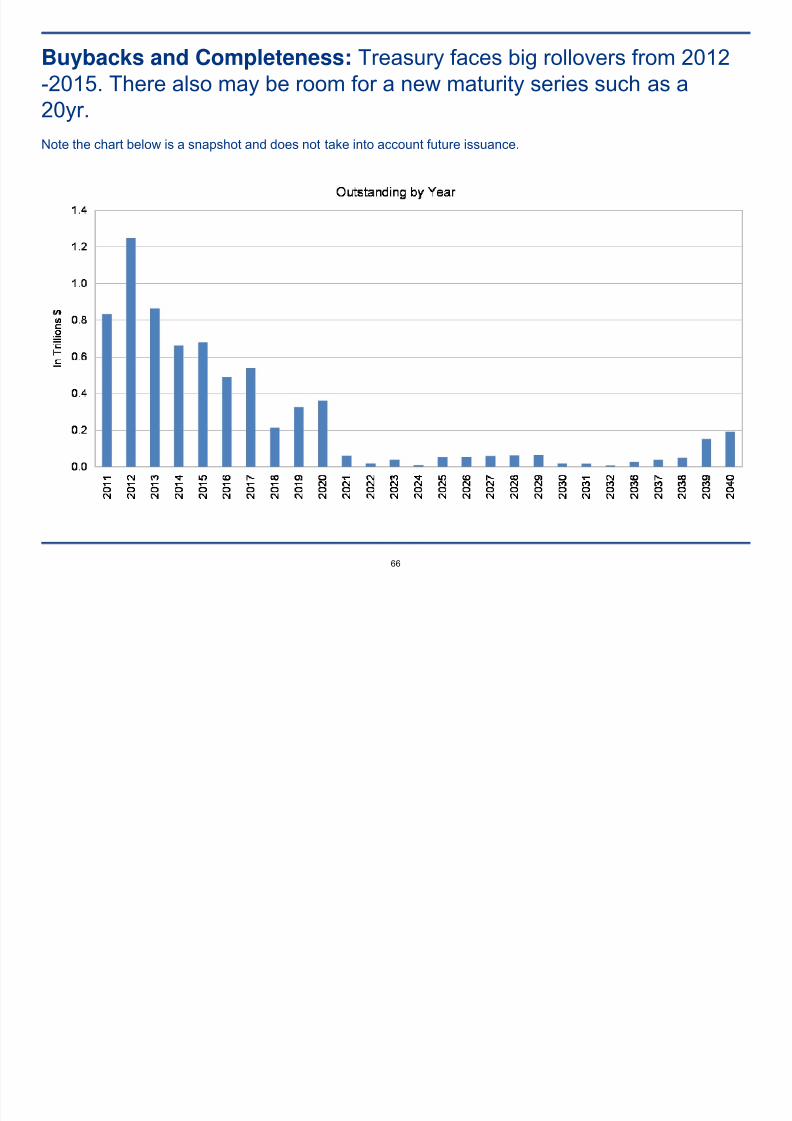
Buybacks and Completeness: Treasury faces big rollovers from 2012-2015. There also may be room for a new maturity series such as a
20yr.Note the chart below is a snapshot and does not take into account future issuance.
Buybacks and Completeness:

8/7/2019 TBAC Discussion Charts Merged 2
http://slidepdf.com/reader/full/tbac-discussion-charts-merged-2 91/93
67
Buybacks and Completeness:
• Buybacks can be effective in reducing “peaks” in maturities and smoothing out the debt profile. Japanused these effectively over a multi-year period earlier in the decade to smooth borrowing.
• Currently, there is a sharp rollover peak in 2012, and the 2011 deficit, estimated by CBO at $1.5 trn, isrelatively large.
• There is little time or room in the 2011 funding plan to implement a buyback program that would makea significant impact on the 2012 rollover peak. Moving $100 bln from 2012 to 2022 increases the
average maturity of the debt by approximately 1.2 months.• As an example, with four quarters remaining in 2011, a $100 bln buy-back program would only slightly
shift the debt profile, but might risk disrupting the market, leading to increased borrowing costs.
• Post 2012, there may be more scope to introduce a buy-back program.
• Treasury may find it difficult to purchase shorter maturity bonds held by real-money investors.
Interest Rate Derivatives As a Tool for Liability

8/7/2019 TBAC Discussion Charts Merged 2
http://slidepdf.com/reader/full/tbac-discussion-charts-merged-2 92/93
68
Interest Rate Derivatives As a Tool for LiabilityManagement
Pros
• Treasury could use interest rates swaps to increase floating rate liabilities vs. fixed rateliabilities.
• It could take advantage of aberrations in the USD swap curve, eg currently in the 30yr maturities, swaps are trading around 30 bp below Treasuries of the same maturity. By payingfixed and receiving floating at this maturity, Treasury could potentially realize an arbitragesavings.
• Treasury could issue callable or puttable securities and hedge out the optionality through
interest rate swaptions to create a straight, fixed rate liability, as is currently done in thecorporate sector.
• Treasury could issue foreign-currency denominated securities that could be hedged back intoU.S. dollars at possibly lower yields than those on its current USD-denominated issuance.
Cons
• Treasury would be assuming counterparty risk, although this could be mitigated if swaps areexchange-cleared, as proposed by Dodd-Frank legislation.
• Treasury may face collateral management issues if swaps are cleared via an exchange or central clearing house.
• Lack of liquidity in certain segments of the swap market may limit scope of the opportunities.
Summary and Conclusions
8/7/2019 TBAC Discussion Charts Merged 2
http://slidepdf.com/reader/full/tbac-discussion-charts-merged-2 93/93
Summary and Conclusions
• We found the following promising and deserving of further consideration: ─ Measures to expand retail investment in Treasury securities. These include: stepped-up marketing
and advertising along with the addition of new securities that appeal directly to households as wellas to institutions.
─ Ultra-long bonds with maturities of 40 or 50 years. Such bonds should be strippable.
─ Callable securities, especially those with relatively short maturities and lockouts, and possibly aregularly issued longer-maturity callable.
─ Instruments targeting the money markets and households, including FRNs where the referencerate and reset periods are short-dated and synchronized.
─ Changes in the structure of TIPS stripping program to enable investment in the “pure” inflation
component of TIPS principal repayments in order to augment overall liquidity in the TIPS market. ─ Buybacks and similar measures to help Treasury smooth out the large increase in rollovers coming
in the coming decade.
─ Interest rate derivatives to help manage liabilities and achieve cost-savings arbitrage.
• Measures we found less viable and requiring more study at this point were:
─ Longer-maturity CMT-style floaters, which are complex and expose investors to a high degree of yield curve risk.
─ GDP-linked bonds, where demand is uncertain and the index is subject to large revisions.
─ Puttable bonds, where demand for volatility and preferred structure are uncertain.