tbilisi real estate market outlook - galt & taggarttbilisi real estate market outlook in need of...
TRANSCRIPT
Tbilisi Real Estate Market OutlookIn Need of Modernization
Industry OverviewDecember 17, 2019
Kakha SamkurashviliSenior Analyst | [email protected] | +995 32 2401 111 ext. 4298
Please refer to important disclaimers on the final page of this document.
Eva BochorishviliHead of Research | [email protected] | +995 32 2401 111 ext. 8036
Georgia │ Real Estate

2
Georgia │ Real Estate Industry Overview
December, 2019
Contents Terms and Definitions 3
Investment Opinion 4
Economic Background 5
Residential and Commercial Real Estate Demand Drivers 7
Tbilisi Residential Real Estate 11
Residential apartment sales 11 Residential apartment prices 14 Residential apartment rents 17 Residential market – peer comparison 18
Tbilisi Office Real Estate 24
Tbilisi Retail Real Estate 26
Tbilisi Hotel Real Estate 28
Tbilisi Development Land 30
Annex 1: Regulatory Changes 32 Annex 2: Mortgage Lending 34 Annex 3: Average Prices by District 36 Annex 4: Capital Markets 37 Annex 5: Snapshot of Batumi, Bakuriani & Gudauri Residential Real Estate 38
Methodological Notes 39
Disclaimer 40
3
Georgia │ Real Estate Industry Overview
December, 2019
Terms and Definitions
ADR – Average Daily Rate
ASP – Average Selling Price
CAGR – Compound Annual Growth Rate
CBD – Central Business District
CEE – Central and Eastern Europe
CPI – Consumer Price Index
EU – European Union
FC – Foreign Currency
FDI – Foreign Direct Investments
FX – Foreign Exchange
GDP – Gross Domestic Product
Geostat – National Statistics Office of Georgia
GLA – Gross Leasable Area
GNTA – Georgian National Tourism Administration
KPI – Key Performance Indicators
LTV – Loan to Value
NAPR – National Agency of Public Registry in Georgia
NBG – National Bank of Georgia
PTI – Payment-to-Income
RevPar – Revenue per Available Room
VAT – Value Added Tax
WB – World Bank

4
Georgia │ Real Estate Industry Overview
December, 2019
Investment Opinion Despite strong development in recent years, Tbilisi’s real estate stock is outdated and still dominated by old buildings. Less than 25% of existing residential, retail and office real estate is built according to modern standards, demonstrating the sector’s strong growth potential. Residential – Promising fundamentals Apartment sales experienced record-high growth in 2018 before cooling in 2019 as sales accelerated prior to the mortgage regulatory changes. We expect a re-acceleration from 2021, after subdued sales in 2020, on the back of tighter financial conditions and the 2020 election related deterioration in sentiment. Prices have been stable in US$ in recent years and there are no signs of housing bubble in Tbilisi. On the supply side, construction regulations are shifting active residential development from the city centre to suburbs. These regulations will also trigger price growth mostly in central districts. We expect a decline in supply in 2021-2022 due to the temporary reduction of construction permits issued in 2018. On the demand side, we believe the fundamentals (growing urbanisation, declining household size, etc.) guarantee stable sales growth in the medium to long term. Yields are high and stable but are expected to gradually decline, converging to peer cities’ levels. The rent market is supported by Airbnb, stressing need of strong tourism growth. Office – Price-to-quality set to rise Office rents in Tbilisi remain high compared to peer cities despite a gradual decrease over 2012-2019. Modern leasable offices only account for 22% of total office space in Tbilisi, the country’s business hub. This gives bargaining power to landlords and results in high rents, driving many companies to own offices rather than lease. However, the office market will be re-shaped by large-scale supply growth by end-2020, which will redistribute tenants to better quality offices, with price-to-quality going up. The new status-quo is expected to benefit tenants as rents are likely to go down in existing prime offices. There are also early signs of a Central Business District (CBD) forming around Vake Park, which is favourable for high street retail in the neighbourhood. Retail – Fuelled by consumer behaviour Modern shopping centres in Tbilisi benefit from a growing consumer preference for shopping centres, good locations and tourism traffic. They are present in all of Tbilisi’s districts, except for Didube district. We do not see a pressing need for further expansion of these retail formats in the short term, but expect their dominance to continue. Looking ahead, there will be opportunities in the retail sector as consumer income grows and bazaars and low-quality spaces are replaced. Unlike in peer cities, the lack of parking lots and low pedestrian traffic make high street retail uninviting for retailers in Tbilisi. Only Rustaveli Avenue remains attractive, because of its central location and tourist traffic. Consequently, high street rents are declining, while shopping centre occupancy and rents are slightly growing. Notably, the concentration of several business centres on Chavchavadze Avenue promises the formation of another retail hotspot in Tbilisi. Hotels – Need to attract high-spending tourists Tbilisi’s accommodation stock almost doubled during 2015-9M19, totalling over 10k rooms. The hotel market is dominated by international chains, accounting for 24% of the room stock in the capital. Currently, international upscale and midscale chains enjoy high occupancy rates and prices, similar to in Western European cities. However, the extensive chain hotel pipeline for 2020-2022 in Tbilisi, which will double rooms in this segment, creates the risk of oversupply in the upscale segment. If unsuccessful in attracting high-spending visitors, the upscale chain hotel segment is likely to experience pressure on prices and occupancy rates in the short term. However, midscale chain hotels, despite considerable expansion in 2020, will still benefit from strong growth in low-spending visitors, in our view. Scarcity of budget accommodation was filled by the rapid expansion of the Airbnb market in 2016-19. We believe Airbnb’s share of Tbilisi’s accommodation market could rise to 20% over next three years, from 17% currently. Development land – Prices are rising Available land resources in Tbilisi’s central districts are scarce, and have been subject to intensive residential sector development since 2004. Naturally, developers have shifted to suburban districts, where land resources are more abundant. We are already seeing that scarcity of land resources and the Tbilisi Master Plan are shifting demand to and lifting land prices in suburbs.

5
Georgia │ Real Estate Industry Overview
December, 2019
Economic Background Country’s transformation and solid economic growth supported the development and construction of real estate in Georgia – residential, office and retail:
The economic boom years of 2004-2007 were the catalyst for real estate development. Modern residential, retail and office facilities started to emerge as consumption was growing strongly and new companies – local and foreign – were established.
The tourism boom from 2013 further lifted demand in the real estate, retail and other related sectors as tourists drove demand for housing, shopping, and entertainment facilities.
We expect Georgia’s strong growth outlook to support demand for real estate in medium to long term. Even in a slower growth scenario momentum is positive, supported by healthy demand fundamentals (growing urbanization, declining household size and rising employment).
Real estate is the third largest sector of the Georgian economy, accounting for 11.4% of GDP in 2018. Value added in real estate activities was up CAGR 6.3% over 2010-2018. Developers mostly invest their own money to fund residential real estate projects. The majority of developers invest equity ahead of obtaining bank credit. Part of the project financing also comes from apartment pre-sales. Banking sector supporting real estate development. Banking sector finances all key components of the supply chain including construction materials, construction companies and developers, with credit portfolio at GEL 3.9bn or 13% of total in Sep-19. From the demand side c. 40% of sales are financed by bank mortgages with credit portfolio at GEL 6.2bn or 20.7% of total in Sep-19. Foreign investor interest is also strong in Georgia’s real estate. FDI inflows in real estate operations reached US$ 1.1bn over 2010-18, accounting for 8.6% of total FDI. Georgian developers are yet to uncover capital market opportunities. Only several developers have issued bonds on local market since 2014 till present. First bond was issued in 2014 by M2 Real Estate and there are three outstanding bonds currently with a total volume of US$ 77mn.
Figure 1: GDP by sector in 2018 Figure 2: Value added in real estate activities over 2010-2018
Source: Geostat Source: Geostat
Industry14.6%
Trade13.9%
Real estate11.4%
Construction8.3%Agriculture
7.8%
Public administration
7.5%
Transportation & storage
6.3%
Financial & insurance
6.1%
Other24.1%
14%
12% 12% 12% 12% 12% 13%12%
11%
0%
4%
8%
12%
16%
0
1,000
2,000
3,000
2010 2011 2012 2013 2014 2015 2016 2017 2018
Value added in real estate activities, US$ mn (LHS)
As a % of GDP (RHS)

6
Georgia │ Real Estate Industry Overview
December, 2019
Real estate is high yielding investment. Yields on residential real estate in Tbilisi has remained stable in last three years hovering around 9.0%, far above the level found in peer cities of CEE and deposit rates. We expect residential yields to remain stable in medium term but we also see that soft rental demand can bring rents down and trigger a correction. Tbilisi office market is characterized by some of the highest rental rates and yields in CEE countries, yielding 11.7% vs 7.1% in peers. Prime modern shopping center yield in Tbilisi is one of the highest among selected cities also, standing at 13.0% vs average 6.8% in selected CEE cities. The prime yield for high street retail in Tbilisi is also higher, and stands at 9.2% vs average of 6.6% in selected cities.
Figure 3: Residential rental yields in Tbilisi vs deposit rates Figure 4: Real estate yields in Tbilisi, 2018
Source: NBG, Area.ge, Galt & Taggart Research Source : Galt & Taggart Research, Colliers International
0%
2%
4%
6%
8%
10%
12%
1Q
16
2Q
16
3Q
16
4Q
16
1Q
17
2Q
17
3Q
17
4Q
17
1Q
18
2Q
18
3Q
18
4Q
18
1Q
19
2Q
19
3Q
19
Deposit rate in GEL Deposit rate in FX
Residential rental yields
13.0%
11.7%
9.3% 9.2%
0%
4%
8%
12%
16%
Prime shoppingcenter yields
Prime officeyields
Residential yield Prime highstreet yields
7
Georgia │ Real Estate Industry Overview
December, 2019
Residential and Commercial Real Estate Demand Drivers
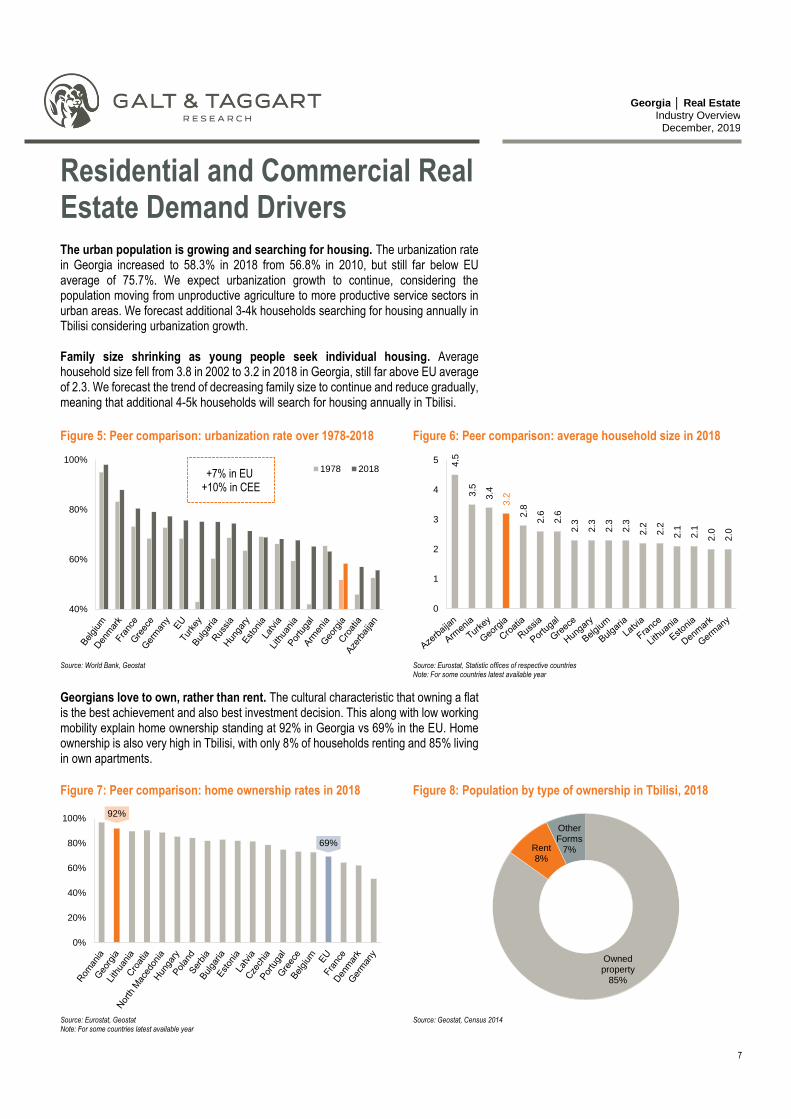
The urban population is growing and searching for housing. The urbanization rate in Georgia increased to 58.3% in 2018 from 56.8% in 2010, but still far below EU average of 75.7%. We expect urbanization growth to continue, considering the population moving from unproductive agriculture to more productive service sectors in urban areas. We forecast additional 3-4k households searching for housing annually in Tbilisi considering urbanization growth. Family size shrinking as young people seek individual housing. Average household size fell from 3.8 in 2002 to 3.2 in 2018 in Georgia, still far above EU average of 2.3. We forecast the trend of decreasing family size to continue and reduce gradually, meaning that additional 4-5k households will search for housing annually in Tbilisi.
Georgians love to own, rather than rent. The cultural characteristic that owning a flat is the best achievement and also best investment decision. This along with low working mobility explain home ownership standing at 92% in Georgia vs 69% in the EU. Home ownership is also very high in Tbilisi, with only 8% of households renting and 85% living in own apartments.
Figure 5: Peer comparison: urbanization rate over 1978-2018 Figure 6: Peer comparison: average household size in 2018
Source: World Bank, Geostat Source: Eurostat, Statistic offices of respective countries
Note: For some countries latest available year
Figure 7: Peer comparison: home ownership rates in 2018 Figure 8: Population by type of ownership in Tbilisi, 2018
Source: Eurostat, Geostat Note: For some countries latest available year
Source: Geostat, Census 2014
40%
60%
80%
100%1978 2018+7% in EU
+10% in CEE
4.5
3.5
3.4
3.2
2.8
2.6
2.6
2.3
2.3
2.3
2.3
2.2
2.2
2.1
2.1
2.0
2.0
0
1
2
3
4
5
92%
69%
0%
20%
40%
60%
80%
100%
Owned property
85%
Rent8%
Other Forms
7%

8
Georgia │ Real Estate Industry Overview
December, 2019
Investment and migration – reasons for foreigners to buy an apartment in Georgia. Foreigners from post-soviet countries mostly buy apartments for investment purposes, while immigrants from the Middle East are buying flats for long-term residence. Share of sales to foreigners of total apartments sold in Georgia stood at 23.3% in 2018, up from 12.5% in 2016 – the number of apartments purchased by foreigners reached 11,038 (of which c. 2k sold in Tbilisi by our estimates) in 2018, 3x as many as purchased in 2016. Housing stock outdated creating need for replacement. Most of the housing stock is built during 1961-1999 and only 22% of Tbilisi’s existing apartment stock is built since 1991. Khrushchyovkas are good example of brownfield re-development opportunities in the central districts. There are c. 500 Khrushchyovka buildings with approximately 30 households living in each of them. Khrushchyovkas are mainly located in Saburtalo, Digomi, and Varketili and are highly outdated. There are talks on replacement of these buildings, which might be a good investment opportunity for developers.
Tourists drive demand for housing, shopping, and entertainment facilities. Georgia’s tourism sector is growing rapidly thanks to the visa-free travel arrangements in place with over 100 countries, its rich culture, improved accessibility and services and government support. International visitors (tourist and same-day arrivals combined) were up 11.1% y/y to 7.2mn in 2018. Tourist arrivals reached 4.8mn (+16.9% y/y), exceeding Georgia’s local population of 3.7mn, and generated US$ 3.2bn revenues in 2018. In 2019, Georgia also demonstrated that it can navigate through Russia’s direct flight ban well by attracting more visitors from EU and Middle East. Tourist arrivals expected to reach 8.4mn in 2025 or 2.3x of Georgia’s local population based on our estimates. This growth needs continued improvement in hotel and tourism-related infrastructure. Importantly, we do not rule out even faster growth in tourist arrivals, as peer countries accommodate even higher tourist numbers currently (e.g. tourist to population ratio was 4.1 in Croatia and 3.3 in Montenegro in 2018). Workers remittances have significant social and economic implications for Georgia. Over 1mn Georgian migrants work abroad. Remittances represent a major source of foreign currency inflows, accounting for 7.8% of GDP or US$ 1.6bn in 2018. Remittances finance consumption and investment in Georgia and significant part goes to purchase real estate. Notably, several developers have special offers for emigrants. Tbilisi lacks student housing creating demand on a rental market. Notably, number of students is growing at a CAGR of 5.1% to 147.7k over 2012-2018. Vast majority (more than 80%) of students study in Tbilisi currently. Furthermore, the number of foreign students rises rapidly, up by 27.0% CAGR to 12.2k over 2012-2018, boosting rental demand further.
Figure 9: Apartments purchased by foreigners in Georgia Figure 10: Apartment stock by construction period in Tbilisi
Source: Migration Profile 2019, NAPR, BoG, Galt & Taggart Research Note: Include sales in Tbilisi, Batumi, Gudauri and Bakuriani
Source: Census 2014, Galt & Taggart Research
3,658 5,632
11,03829,25536,684
47,387
12.5%
15.4%
23.3%
0%
5%
10%
15%
20%
25%
0
20,000
40,000
60,000
2016 2017 2018
Total apartments purchased by foreigners (LHS)
Total apartments sold in Georgia* (LHS)
Share of foreigners in total sales (RHS)
Before 196016%
1961-199062%
1991-20052%
2006-201920%
331kunits

9
Georgia │ Real Estate Industry Overview
December, 2019
Over 11k internally displaced households still seek for housing in Tbilisi, according to the Ministry of Internally Displaced Persons. Notably, the Ministry already purchased c. 5,000 apartments over 2015-2018 for internally displaced households. Mortgages finance about 40% of total apartment sales in Tbilisi. Strict mortgage regulations introduced by NBG in 2019 reduced mortgage affordability. There are 821,000 formally employed individuals in Georgia as of June 2019, according to the Revenue Service data. Based on this data we estimate that only 136,000 individual wage workers or 17% of total employed are eligible for a mortgage under NBG’s recent limitations. These 136,000 persons can take a mortgage loan to finance a small apartment purchase in suburban Tbilisi, while only 88,000 can afford similar flat near city center. Notably, large central apartments are affordable for only 2-3% of employees. We note that, these numbers do not capture the well-established co-borrowing practice (when household members apply for a mortgage) in Georgia, which significantly increases the pool of eligible borrowers. Notably, simplified procedures by NBG from mid-19 allow large pool of informal workers also to be eligible for mortgage. Furthermore, developers intensified inner installment schemes which support apartment sales.
Customer preferences driving modern shopping center development in Tbilisi. Increasing disposable income and changing lifestyle of time-poor consumers are driving demand for well-organized, all-in-one shopping and entertainment options in Tbilisi. These preferences were met by proactive development in modern shopping centers over 2012-2018 - GLA per 1,000 inhabitants increased to 344.0m2 in 2018 vs 116.6m2 in 2012. Tbilisi lacks modern office spaces. Georgia’s business activity as well as office stock are concentrated in Tbilisi. However, Tbilisi lacks modern office facilities and office stock remains outdated - modern offices only account for 21% of total office space in Tbilisi.
Figure 11: Flat affordability under NBG's mortgage standards
Source: NBG, Galt & Taggart Research Note: We assume 14 year mortgage, 11% interest rate in GEL and PTI limitations for hedged borrower
2%
5%
11%
3%
7%
11%
2%
6%
10%
3%
10%
11%
3%
6%
11%
4%
9%
11%
6%
11%
13%
5%
11%
17%
7%
11%
17%
7%
11%
13%
7%
11%
17%
0
20,000
40,000
60,000
80,000
100,000
120,000
140,000
160,000
0 2 4 6 8 10 12
Number of wage worker
821,000
Small, 40 m2
Medium, 65 m2
Large, 105 m2
Vake
Sabu
rtalo
Mta
tsm
ind
a
Chug
hu
reti
Krt
sa
nis
i
Did
ub
e
Isani
Did
i D
ighom
i
Gld
ani
Nad
zala
devi
Sam
gori

10
Georgia │ Real Estate Industry Overview
December, 2019
Residential Real Estate

11
Georgia │ Real Estate Industry Overview
December, 2019
Tbilisi Residential Real Estate
Residential – Promising fundamentals
Apartment sales experienced record-high growth in 2018 before cooling in 2019 as sales accelerated prior to the mortgage regulatory changes. We expect a re-acceleration from 2021, after subdued sales in 2020, on the back of tighter financial conditions and the 2020 election related deterioration in sentiment. Prices have been stable in US$ in recent years and there are no signs of housing bubble in Tbilisi. On the supply side, construction regulations are shifting active residential development from the city centre to suburbs. These regulations will also trigger price growth mostly in central districts. We expect a decline in supply in 2021-2022 due to the temporary reduction of construction permits issued in 2018. On the demand side, we believe the fundamentals (growing urbanisation, declining household size, etc.) guarantee stable sales growth in the medium to long term. Yields are high and stable but are expected to gradually decline, converging to peer cities’ levels. The rent market is supported by Airbnb, stressing need of strong tourism growth.
Residential market thriving in Tbilisi as Georgia’s economic activity is concentrated in the capital, which accounts for 71% of business sector turnover, 40% of formal employment and 32% of the population. Tourism growth and related expansion of Airbnb is another catalyst for sector growth. Developers will benefit from the need of housing stock modernisation. Tbilisi residential market is dominated by old soviet-type apartment blocks, with c. 255k apartments (78% of total) constructed before 1991. This means that demand for modern stock will persist.
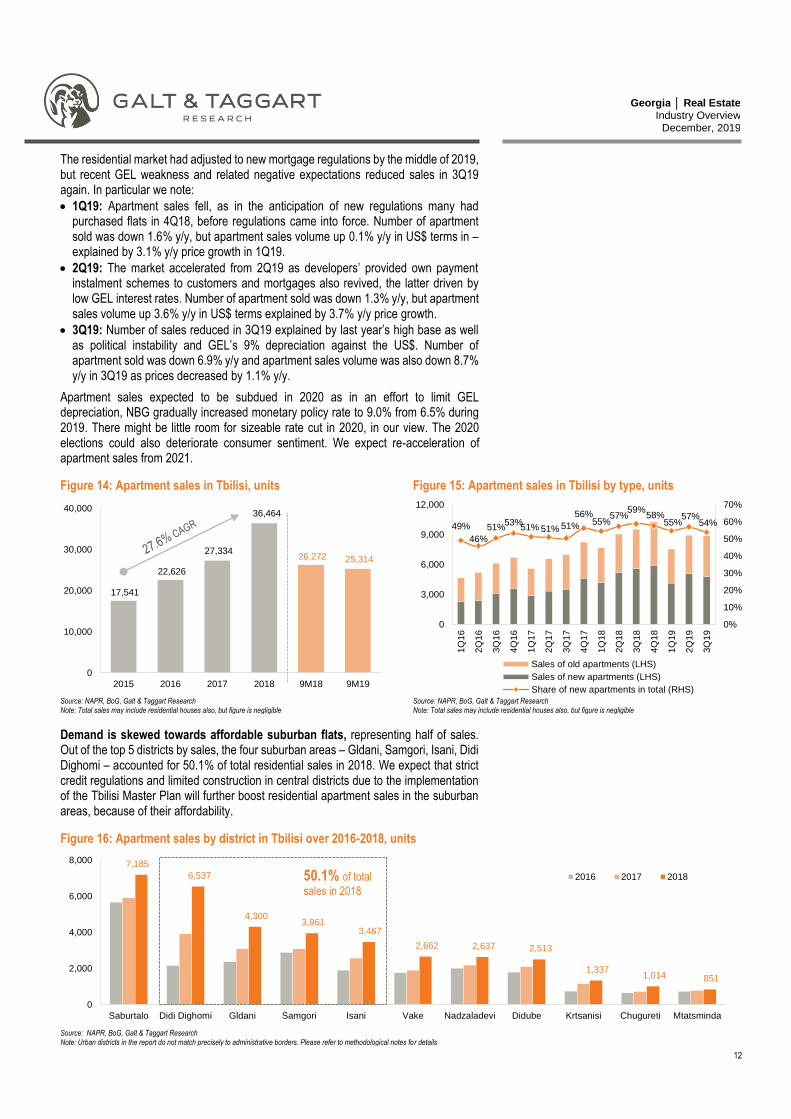
Residential apartment sales Apartment sales cooling in 2019, after record growth in 2018. The number of apartment sales skyrocketed in 2018 and reached 36,464 units – a CAGR of 27.6% over 2015-18. Notably, apartment sales growth was exceptional in 2018 (+33.4% y/y) as a result of demand being brought forward due to the stricter mortgage regulations being introduced in Jan-19. The total apartment sales value stood at GEL 4.1bn (US$ 1.6bn) in 20181. Notably, demand for new apartments is growing, with share up to 57% in total sales in 2018, compared to 43% in 2015.
1 We note that market size is larger in each reporting period than reported by NAPR, as part of sales financed with mortgages and also part of preliminary sales are not included in NAPR’s database in the reporting period, eventually reflected in statistics with a time lag.
Figure 12: Apartment sales in Tbilisi, GEL bn Figure 13: Apartment sales in Tbilisi, US$ bn
Source: NAPR, BoG, Galt & Taggart Research
Source: NAPR, BoG, Galt & Taggart Research
1.8
2.5
2.9
4.1
2.93.2
0
1
2
3
4
5
2015 2016 2017 2018 9M18 9M19
Total sales of old apartments Total sales of new apartments
0.8
1.01.2
1.6
1.2 1.1
0
1
2
2015 2016 2017 2018 9M18 9M19
Total sales of old apartments Total sales of new apartments
12
Georgia │ Real Estate Industry Overview
December, 2019
The residential market had adjusted to new mortgage regulations by the middle of 2019, but recent GEL weakness and related negative expectations reduced sales in 3Q19 again. In particular we note:
1Q19: Apartment sales fell, as in the anticipation of new regulations many had purchased flats in 4Q18, before regulations came into force. Number of apartment sold was down 1.6% y/y, but apartment sales volume up 0.1% y/y in US$ terms in – explained by 3.1% y/y price growth in 1Q19.
2Q19: The market accelerated from 2Q19 as developers’ provided own payment instalment schemes to customers and mortgages also revived, the latter driven by low GEL interest rates. Number of apartment sold was down 1.3% y/y, but apartment sales volume up 3.6% y/y in US$ terms explained by 3.7% y/y price growth.
3Q19: Number of sales reduced in 3Q19 explained by last year’s high base as well as political instability and GEL’s 9% depreciation against the US$. Number of apartment sold was down 6.9% y/y and apartment sales volume was also down 8.7% y/y in 3Q19 as prices decreased by 1.1% y/y.
Apartment sales expected to be subdued in 2020 as in an effort to limit GEL depreciation, NBG gradually increased monetary policy rate to 9.0% from 6.5% during 2019. There might be little room for sizeable rate cut in 2020, in our view. The 2020 elections could also deteriorate consumer sentiment. We expect re-acceleration of apartment sales from 2021.
Demand is skewed towards affordable suburban flats, representing half of sales. Out of the top 5 districts by sales, the four suburban areas – Gldani, Samgori, Isani, Didi Dighomi – accounted for 50.1% of total residential sales in 2018. We expect that strict credit regulations and limited construction in central districts due to the implementation of the Tbilisi Master Plan will further boost residential apartment sales in the suburban areas, because of their affordability.
Figure 14: Apartment sales in Tbilisi, units Figure 15: Apartment sales in Tbilisi by type, units
Source: NAPR, BoG, Galt & Taggart Research Note: Total sales may include residential houses also, but figure is negligible
Source: NAPR, BoG, Galt & Taggart Research Note: Total sales may include residential houses also, but figure is negligible
Figure 16: Apartment sales by district in Tbilisi over 2016-2018, units
Source: NAPR, BoG, Galt & Taggart Research Note: Urban districts in the report do not match precisely to administrative borders. Please refer to methodological notes for details
17,541
22,626
27,334
36,464
26,272 25,314
0
10,000
20,000
30,000
40,000
2015 2016 2017 2018 9M18 9M19
49%
46%
51%53%
51% 51% 51%
56%55%
57%59%
58%55%
57%54%
0%
10%
20%
30%
40%
50%
60%
70%
0
3,000
6,000
9,000
12,000
1Q
16
2Q
16
3Q
16
4Q
16
1Q
17
2Q
17
3Q
17
4Q
17
1Q
18
2Q
18
3Q
18
4Q
18
1Q
19
2Q
19
3Q
19
Sales of old apartments (LHS)
Sales of new apartments (LHS)
Share of new apartments in total (RHS)
7,185
6,537
4,300 3,961
3,467
2,662 2,637 2,513
1,337 1,014 851
0
2,000
4,000
6,000
8,000
Saburtalo Didi Dighomi Gldani Samgori Isani Vake Nadzaladevi Didube Krtsanisi Chugureti Mtatsminda
2016 2017 201850.1% of total
sales in 2018

13
Georgia │ Real Estate Industry Overview
December, 2019
In new apartment sales medium-sized apartments (51-80 m2) are most prevalent – 48.2% of total sales in 2018. Notably, the share of the small apartments (16-50 m2) went up from 23.2% to 29.6% over 2016-2018, at the expense of reduced share of a large-sized apartment sales (80-150 m2). We expect this trend to continue. In old apartment sales small-sized apartments (<50 m2) are most prevalent. Importantly, demand distribution by sizes among old apartments is stable – the shares of small, medium and large-sized apartments rerelatively constant over 2016-2019.
Low-price segment is most demanded – evidence that low-to-middle-income household’s drive demand for the housing market. 54.4% of total number of apartments sold were in the low-price segment, while the premium segment accounts for 11.4% of total in 2018. Demand is high on medium-sized apartments (50-80 m2) in all districts of Tbilisi, except central districts (Vake, Saburtalo and Mtatsminda), where large-sized flats dominate the sales. Small-sized flats are mostly sold in suburbs.
Figure 17: Sales by unit size in Tbilisi, new apartments Figure 18: Sales by unit size in Tbilisi, old apartments
Source: NAPR, BoG, Galt & Taggart Research Source: NAPR, BoG, Galt & Taggart Research
Figure 19: Apartment sales by price segments in Tbilisi, units Figure 20: Sales by unit size, Tbilisi districts
Source: NAPR, BoG, Galt & Taggart Research Source: NAPR, BoG, Galt & Taggart Research
23% 28% 30% 29%
47%48% 48% 49%
25%21% 19% 19%
4% 3% 3% 3%
0%
20%
40%
60%
80%
100%
2016 2017 2018 9M19
Small (16-50 sq.m.) Medium (51-80 sq.m.)
Large (81-150 sq.m) Very large (150-250 sq.m.)
43% 41% 39% 39%
35% 35% 36% 37%
20% 21% 22% 21%
3% 3% 3% 3%
0%
20%
40%
60%
80%
100%
2016 2017 2018 9M19
Small (16-50 sq.m.) Medium (51-80 sq.m.)
Large (81-150 sq.m) Very large (150-250 sq.m.)
52%59% 54% 53%
35%31%
34% 34%
13% 9% 11% 12%
1% 1% 1% 1%
0%
20%
40%
60%
80%
100%
2016 2017 2018 9M19
Luxury (US$ 2,500-5000 per sq.m.) Premium (US$ 1001-2500 per sq.m.)
Medium (US$ 601-1,000 per sq.m.) Low (US$ 300-600 per sq.m.)
0%
20%
40%
60%
80%
100%
Small (16-50 sq.m.) Medium (51-80 sq.m.)
Large (81-150 sq.m) Very large (150-250 sq.m.)

14
Georgia │ Real Estate Industry Overview
December, 2019
Residential apartment prices Prices are more stable in dollar terms and are volatile in GEL, explained by stable costs in USD and GEL’s depreciation over 2015-19. We do not see the real estate bubble in Tbilisi considering healthy demand drivers (discussed on page 7) and stable prices of recent years.
Airbnb pushes prices up only in central districts - Mtatsminda, Vake, and Chugureti. However, these three districts account for only 12.4% of total sales and don’t have significant effect on overall price level. Meanwhile, growth of prices in Saburtalo, is affected by elevated demand from locals as well as high-end projects from M2, Axis, etc. Average selling prices in 2018 in central districts were:
Mtatsminda - US$ 957 per m2 up 3.5% y/y
Vake - US$ 903 per m2 up 5.3% y/y
Saburtalo - US$ 803 per m2 up 8.7% y/y
Chugureti - US$ 710 per m2 up 3.3% y/y Prices stable in suburbs, despite high demand in 2018. Average US$ prices were flat in all suburbs except Didi Digomi - one-off effect as flats in the “Green Diamond” project were sold at above-average-district prices (for detailed price analysis please see Annex 3).
Figure 21: Tbilisi residential real estate price index by NBG
Source: NBG
Figure 22: Average selling price of apartments by districts in Tbilisi, US$ per m2
Source: BoG, NAPR, Galt & Taggart Research
0
100
200
300
400
500
600
Ja
n-0
4
May-0
4
Sep
-04
Ja
n-0
5
May-0
5
Sep
-05
Ja
n-0
6
May-0
6
Sep
-06
Ja
n-0
7
May-0
7
Sep
-07
Ja
n-0
8
May-0
8
Sep
-08
Ja
n-0
9
May-0
9
Sep
-09
Ja
n-1
0
May-1
0
Sep
-10
Ja
n-1
1
May-1
1
Sep
-11
Ja
n-1
2
May-1
2
Sep
-12
Ja
n-1
3
May-1
3
Sep
-13
Ja
n-1
4
May-1
4
Sep
-14
Ja
n-1
5
May-1
5
Sep
-15
Ja
n-1
6
May-1
6
Sep
-16
Ja
n-1
7
May-1
7
Sep
-17
Ja
n-1
8
May-1
8
Sep
-18
Ja
n-1
9
May-1
9
Sep
-19
Real estate price index in GEL Real estate price index in US$
926 911
778
684 655
727
626 597
485
579 597
925 857
739 646
688 680 600 579
492 550 558
957 903
803
724 710 689
604 567 562 553 552
3.5% 5.3% 8.7% 12.1% 3.3% 1.4% 0.6% -2.1% 14.3% 0.5% -1.1%
-120000.0%
-100000.0%
-80000.0%
-60000.0%
-40000.0%
-20000.0%
0.0%
0
200
400
600
800
1,000
1,200
Mtatsminda Vake Saburtalo Krtsanisi Chugureti Didube Isani Nadzaladevi Didi Dighomi Samgori Gldani
2016 2017 2018 y/y growth in 2018

15
Georgia │ Real Estate Industry Overview
December, 2019
We see costly safety regulations to fully affect prices from 2H20. Sales of apartments that are currently under construction according to new safety standards not delivered to market yet and fully affecting market prices, but will definitely push prices up in medium term. Notably, we see depreciation-related price increase in GEL, as prices remain stable in US$ in 9M19.
Price difference between black frame and white frame new apartment estimated at US$ 186 on average, while difference between black frame and turnkey stands at US$ 343 per m2.
Figure 23: Average selling price (ASP) of new apartments in Tbilisi
Figure 24: Average selling price (ASP) of old apartments in Tbilisi
Source: NAPR, BoG, Galt & Taggart Research
Source NAPR, BoG, Galt & Taggart Research
Figure 25: Apartment price premium based on a project type in 9M19, US$ per m2
Source: Area.ge, Galt & Taggart Research
0
500
1,000
1,500
2,000
2,500
1Q
15
2Q
15
3Q
15
4Q
15
1Q
16
2Q
16
3Q
16
4Q
16
1Q
17
2Q
17
3Q
17
4Q
17
1Q
18
2Q
18
3Q
18
4Q
18
1Q
19
2Q
19
3Q
19
ASP in US$, new apartments ASP in GEL, new apartments
0
500
1,000
1,500
2,000
2,500
1Q
15
2Q
15
3Q
15
4Q
15
1Q
16
2Q
16
3Q
16
4Q
16
1Q
17
2Q
17
3Q
17
4Q
17
1Q
18
2Q
18
3Q
18
4Q
18
1Q
19
2Q
19
3Q
19
ASP in US$, old apartments ASP in GEL, old apartments
642
985
9138
57
108
49
0
200
400
600
800
1,000

16
Georgia │ Real Estate Industry Overview
December, 2019
Map 1: Apartment sales and average selling prices by district in Tbilisi, 2018
Source: NAPR, BOG, Galt & Taggart Research Note: Please refer to methodological notes for district border details

17
Georgia │ Real Estate Industry Overview
December, 2019
Residential apartment rents
Supply in central districts is mostly absorbed by Airbnb. Central districts are not affordable for locals, while number of expats, who rent flats in central districts, is limited. Profitability of rental market was secured by the emergence of Airbnb as flat owners shifted to short-term renting. In October 2019, 15k flats were listed on Airbnb in Tbilisi, far above the number of listings for Prague (12k), Budapest (11k) and Athens (10k). Notably, 44.5% of listed properties in Tbilisi did not get booked during 9M19 on Airbnb, which reduced prices significantly. However, vacant flats are not pressuring long-term rental market in Tbilisi which we find counterintuitive and explain by information asymmetry and also think that many flat owners are waiting for better conditions. This helps rental yields to remain high in Tbilisi compared to many cities, ranging from 8% to 10% by districts. Strong tourism growth is essential for securing rental market profitability in Tbilisi’s central districts, in our view. Locals mostly rent apartments in suburbs due to affordability. Average rent price in suburbs is 2.x lower than in central parts. Notably, customer interaction is two times higher on an advertisings of suburban apartments compared to central ones, according to Area.ge.
Figure 26: Average rental rates by district in 9M19, US$ per m2 Figure 27: Tbilisi residential rent index by NBG
Source: Area.ge, Galt & Taggart Research Source: NBG, Galt & Taggart Research
Figure 28: Rental yields by district, 9M19 Figure 29: Booking rates of Airbnb rentals in Tbilisi
Source: Area.ge, Galt & Taggart Research Source: Airdna, Galt & Taggart Research
7.8 7.1
6.0 5.7 5.7
4.9 4.5
4.2 3.9 3.7 3.7
0
2
4
6
8
10
0
50
100
150
200
250
300
350
Ja
n-0
4
Sep
-04
May-0
5
Ja
n-0
6
Sep
-06
May-0
7
Ja
n-0
8
Sep
-08
May-0
9
Ja
n-1
0
Sep
-10
May-1
1
Ja
n-1
2
Sep
-12
May-1
3
Ja
n-1
4
Sep
-14
May-1
5
Ja
n-1
6
Sep
-16
May-1
7
Ja
n-1
8
Sep
-18
May-1
9
Real estate rent index in GEL
Real estate rent index in US$
10.2%10.0% 9.9%
9.4% 9.3% 9.3% 9.1% 9.0% 8.8% 8.6%8.1%
0%
3%
6%
9%
12%
3,125 4,370
6,620 7,885 1,049
1,950
3,669
6,329 25.1%
30.9%
35.7%
44.5%
0%
10%
20%
30%
40%
50%
0
4,000
8,000
12,000
16,000
2016 2017 2018 9M19
Average monthly booked rentals (LHS)
Average monthly unbooked rentals (LHS)
Share of booked rentals in total (RHS)

18
Georgia │ Real Estate Industry Overview
December, 2019
Residential market – peer comparison Tbilisi is the cheapest real estate market in its peer group – the apartment price per m2 is 2.5x lower in the city center and 3.1x lower in suburbs, compared to the average for the peer cities. This is the result of the deregulated environment – until recently there was no Master Plan, or safety and other construction regulations, which kept construction costs, and thus prices low.
Low prices make real estate affordable in Tbilisi compared to peer cities. In order to assess the affordability to buy a medium-sized (65 m2) apartment, we analyzed how many average gross annual salary is required to buy the flat in peer cities. Based on our analysis, it takes c. 7 years to buy an apartment outside the city center in Tbilisi and c. 13 years in central districts. Notably, average worker needs 6 more years of salary to afford an apartment in Tbilisi city center compared to other districts, while in Kiev 20 years are required. The most affordable housing for average worker is found in Athens, requiring only c. 6.5 years of annual salary, with average salary 4-times higher than in Georgia.
Figure 30: Peer comparison: apartment price, US$ per m2
Source: Numbeo, Galt & Taggart Research Note: Numbeo’s prices for Tbilisi slightly differ from our data, explained by methodological difference
Figure 31: The number of average gross annual salary needed to buy a 65m2 flat in central and peripheral districts
Source: Numbeo, Galt & Taggart Research
0
1,000
2,000
3,000
4,000City centre Outside of city centre
1 5 10 15 20 25 30 35 40 years
0
2
4
6
8
10
12
14
1 5 10 15 20 25 30 35 40 years
Kiev
Tbilisi
Baku
Yerevan
Riga
Prague
Belgrade
Budapest
Warsaw
Zagreb
Bucharest
Athens
Sofia
Talin
City centre
Outside of city centre
Range
19
Georgia │ Real Estate Industry Overview
December, 2019
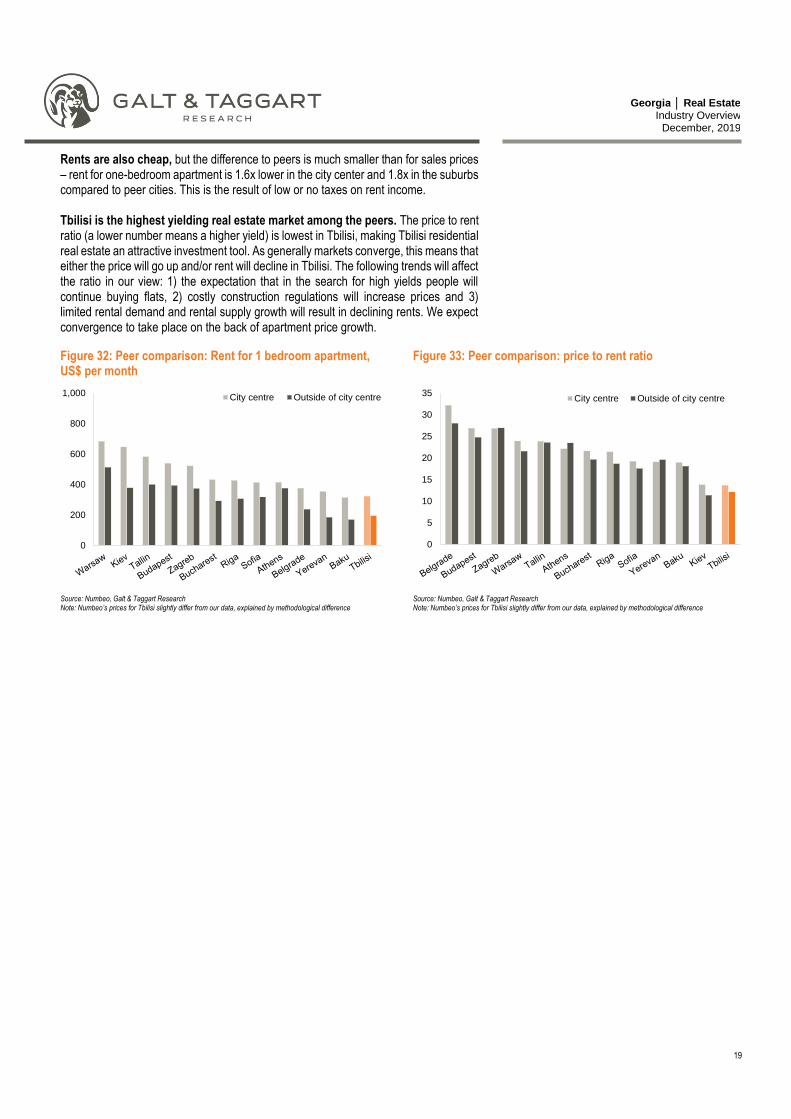
Rents are also cheap, but the difference to peers is much smaller than for sales prices – rent for one-bedroom apartment is 1.6x lower in the city center and 1.8x in the suburbs compared to peer cities. This is the result of low or no taxes on rent income. Tbilisi is the highest yielding real estate market among the peers. The price to rent ratio (a lower number means a higher yield) is lowest in Tbilisi, making Tbilisi residential real estate an attractive investment tool. As generally markets converge, this means that either the price will go up and/or rent will decline in Tbilisi. The following trends will affect the ratio in our view: 1) the expectation that in the search for high yields people will continue buying flats, 2) costly construction regulations will increase prices and 3) limited rental demand and rental supply growth will result in declining rents. We expect convergence to take place on the back of apartment price growth.
Figure 32: Peer comparison: Rent for 1 bedroom apartment, US$ per month
Figure 33: Peer comparison: price to rent ratio
Source: Numbeo, Galt & Taggart Research Note: Numbeo’s prices for Tbilisi slightly differ from our data, explained by methodological difference
Source: Numbeo, Galt & Taggart Research Note: Numbeo’s prices for Tbilisi slightly differ from our data, explained by methodological difference
0
200
400
600
800
1,000 City centre Outside of city centre
0
5
10
15
20
25
30
35City centre Outside of city centre

20
Georgia │ Real Estate Industry Overview
December, 2019
Residential supply in Tbilisi Residential supply remains stable, with a slight decline expected in 2021-2022. On average, permits for 0.9mn m2 living areas were issued each year over 2013-2017. However, permit issuance has halved in 2018 – permits for 0.5mn m2 living area were issued, a decline of 50.2% y/y. Tightened construction permit issuance procedures during the elaboration of Tbilisi Master Plan was the major reason behind this drop. Notably, permit issuances picked up in 9M19 with Master Plan published in 1Q19. We expect that the reduction of permit issuance in 2018 will decrease supply in 2021-2022, considering the 3-4 years’ time lag between permit issuance and construction completion. Development land sales promise stable supply in the medium-to-long term. Development land sales for construction purposes was up 8.7% y/y in 2018, which continued in 9M19 also. Number of development land sales reached 393 parcels, up 10.4% y/y in 9M19.
Construction regulations to increase prices in the city center, while we expect suburban real estate to remain affordable. The market boomed in an unregulated environment, with balanced demand and supply, reflected in relatively stable prices over years. However, regulations likely to change the status-quo. Firstly, safety and quality (Decree 41) regulations will make construction costlier in the short-term as it reduces residential area of a project by 10% on average. However, some developers already built to a standards that complied with fire standards before regulation took force, leaving them with a competitive advantage. Other developers will be forced to increase prices or squeeze margins. Secondly, Tbilisi Master Plan limits intensive construction in the central districts, likely pushing prices up with limited supply in the medium term. Thirdly, lower construction limitations will shift construction to suburbs keeping affordable supply in peripheries. Finally, we expect price gap between the center and suburbs to increase in the medium term as in peer cities. Major regulations affecting supply and price trends in real estate came into force in 2017-19, jotted down in table below (details provided in Annex 1):
Figure 34: Residential permit issuance for III-IV class* buildings in Tbilisi
Figure 35: Development land sales over 2016-2019, parcels
Source: City Hall, Galt & Taggart Research Note: III & IV class buildings include high intensity residential projects
Source: NAPR, BoG, Galt & Taggart Research
258
315 328 338
299
156
117
158
0
100
200
300
400
0
400
800
1,200
1,600
2013 2014 2015 2016 2017 2018 9M18 9M19
Total livable area permitted for III and IV class residential buildings, '000sq.m. (LHS)
Number of permits issued for III and IV category residential buildings, units(RHS)
18.1%
29.5%
8.7%
17.2%
9.9%
0%
10%
20%
30%
40%
0
100
200
300
400
500
2016 2017 2018 9M18 9M19
Total land sales (LHS) Growth, y/y (RHS)
21
Georgia │ Real Estate Industry Overview
December, 2019
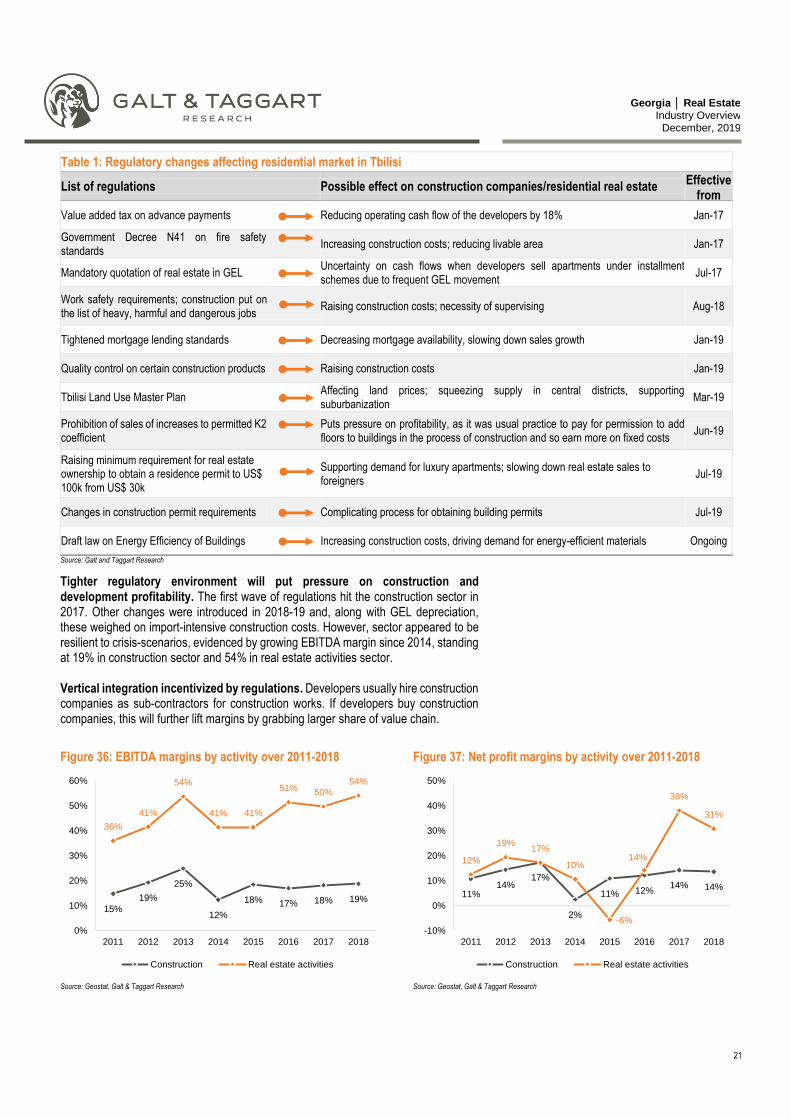
Table 1: Regulatory changes affecting residential market in Tbilisi
List of regulations Possible effect on construction companies/residential real estate Effective
from
Value added tax on advance payments Reducing operating cash flow of the developers by 18% Jan-17
Government Decree N41 on fire safety standards
Increasing construction costs; reducing livable area Jan-17
Mandatory quotation of real estate in GEL Uncertainty on cash flows when developers sell apartments under installment schemes due to frequent GEL movement
Jul-17
Work safety requirements; construction put on the list of heavy, harmful and dangerous jobs
Raising construction costs; necessity of supervising Aug-18
Tightened mortgage lending standards Decreasing mortgage availability, slowing down sales growth Jan-19
Quality control on certain construction products Raising construction costs Jan-19
Tbilisi Land Use Master Plan Affecting land prices; squeezing supply in central districts, supporting suburbanization
Mar-19
Prohibition of sales of increases to permitted K2 coefficient
Puts pressure on profitability, as it was usual practice to pay for permission to add floors to buildings in the process of construction and so earn more on fixed costs
Jun-19
Raising minimum requirement for real estate ownership to obtain a residence permit to US$ 100k from US$ 30k
Supporting demand for luxury apartments; slowing down real estate sales to foreigners
Jul-19
Changes in construction permit requirements Complicating process for obtaining building permits Jul-19
Draft law on Energy Efficiency of Buildings Increasing construction costs, driving demand for energy-efficient materials Ongoing
Source: Galt and Taggart Research
Tighter regulatory environment will put pressure on construction and development profitability. The first wave of regulations hit the construction sector in 2017. Other changes were introduced in 2018-19 and, along with GEL depreciation, these weighed on import-intensive construction costs. However, sector appeared to be resilient to crisis-scenarios, evidenced by growing EBITDA margin since 2014, standing at 19% in construction sector and 54% in real estate activities sector. Vertical integration incentivized by regulations. Developers usually hire construction companies as sub-contractors for construction works. If developers buy construction companies, this will further lift margins by grabbing larger share of value chain.
Figure 36: EBITDA margins by activity over 2011-2018 Figure 37: Net profit margins by activity over 2011-2018
Source: Geostat, Galt & Taggart Research Source: Geostat, Galt & Taggart Research
15%
19%
25%
12%
18% 17% 18% 19%
36%
41%
54%
41% 41%
51% 50%54%
0%
10%
20%
30%
40%
50%
60%
2011 2012 2013 2014 2015 2016 2017 2018
Construction Real estate activities
11%14%
17%
2%
11% 12%14% 14%
12%
19%17%
10%
-6%
14%
38%
31%
-10%
0%
10%
20%
30%
40%
50%
2011 2012 2013 2014 2015 2016 2017 2018
Construction Real estate activities
22
Georgia │ Real Estate Industry Overview
December, 2019
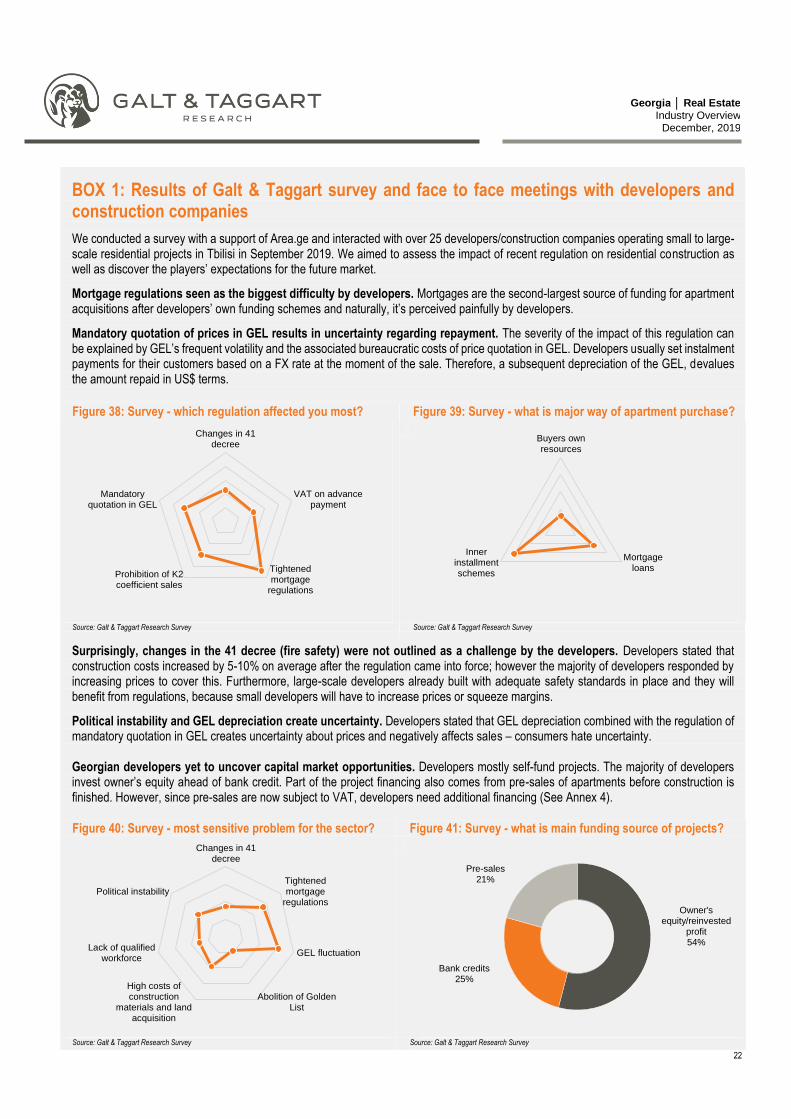
BOX 1: Results of Galt & Taggart survey and face to face meetings with developers and construction companies
We conducted a survey with a support of Area.ge and interacted with over 25 developers/construction companies operating small to large-scale residential projects in Tbilisi in September 2019. We aimed to assess the impact of recent regulation on residential construction as well as discover the players’ expectations for the future market.
Mortgage regulations seen as the biggest difficulty by developers. Mortgages are the second-largest source of funding for apartment acquisitions after developers’ own funding schemes and naturally, it’s perceived painfully by developers.
Mandatory quotation of prices in GEL results in uncertainty regarding repayment. The severity of the impact of this regulation can be explained by GEL’s frequent volatility and the associated bureaucratic costs of price quotation in GEL. Developers usually set instalment payments for their customers based on a FX rate at the moment of the sale. Therefore, a subsequent depreciation of the GEL, devalues the amount repaid in US$ terms.
Figure 38: Survey - which regulation affected you most? Figure 39: Survey - what is major way of apartment purchase?
Source: Galt & Taggart Research Survey Source: Galt & Taggart Research Survey
Surprisingly, changes in the 41 decree (fire safety) were not outlined as a challenge by the developers. Developers stated that construction costs increased by 5-10% on average after the regulation came into force; however the majority of developers responded by increasing prices to cover this. Furthermore, large-scale developers already built with adequate safety standards in place and they will benefit from regulations, because small developers will have to increase prices or squeeze margins.
Political instability and GEL depreciation create uncertainty. Developers stated that GEL depreciation combined with the regulation of mandatory quotation in GEL creates uncertainty about prices and negatively affects sales – consumers hate uncertainty. Georgian developers yet to uncover capital market opportunities. Developers mostly self-fund projects. The majority of developers invest owner’s equity ahead of bank credit. Part of the project financing also comes from pre-sales of apartments before construction is finished. However, since pre-sales are now subject to VAT, developers need additional financing (See Annex 4).
Figure 40: Survey - most sensitive problem for the sector? Figure 41: Survey - what is main funding source of projects?
Source: Galt & Taggart Research Survey Source: Galt & Taggart Research Survey
Changes in 41decree
VAT on advancepayment
Tightenedmortgage
regulations
Prohibition of K2coefficient sales
Mandatoryquotation in GEL
Buyers ownresources
Mortgageloans
Innerinstallmentschemes
Changes in 41decree
Tightenedmortgage
regulations
GEL fluctuation
Abolition of GoldenList
High costs ofconstruction
materials and landacquisition
Lack of qualifiedworkforce
Political instability
Owner's equity/reinvested
profit54%
Bank credits25%
Pre-sales21%

23
Georgia │ Real Estate Industry Overview
December, 2019
Commercial Real Estate Overview

24
Georgia │ Real Estate Industry Overview
December, 2019
Tbilisi Office Real Estate
Office – Price-to-quality set to rise
Office rents in Tbilisi remain high compared to peer cities despite a gradual decrease over 2012-2019. Modern leasable offices only account for 22% of total office space in Tbilisi, the country’s business hub. This gives bargaining power to landlords and results in high rents, driving many companies to own offices rather than lease. However, the office market will be re-shaped by large-scale supply growth by end-2020, which will redistribute tenants to better quality offices, with price-to-quality going up. The new status-quo is expected to benefit tenants as rents are likely to go down in existing prime offices. There are also early signs of a Central Business District (CBD) forming around Vake Park, which is favorable for high street retail in the neighborhood.
Office real estate is almost entirely concentrated in Tbilisi – the center of Georgia’s business activity. Tbilisi accounts for 73.9% of Georgia’s total business sector turnover. Tbilisi lacks modern office space. Tbilisi’s office stock stands at c. 1.0mn m2 and is almost equally distributed between owner-occupied and leasable offices. Leasable space further combines traditional and modern office stock (A, B, C and D classes; 21.1% of total). Modern office stock GLA estimated at 215k m2 by Galt & Taggart. The Tbilisi office market is very specific and cannot be compared to peer cities in Central and Eastern Europe because of following key factors:
Wealthy firms prefer buying their own offices rather than lease them, because of high rents.
The modern office stock is mostly absorbed by branches of international companies, while there is no significant presence of IT companies in the business centers, which lead tenant mix in EU.
There is no established Central Business District.
Lack of modern offices results in high rents. Modern leasable offices only account for 21.1% of total office space in Tbilisi. This gives bargaining power to existing landlords, letting them set high rents. However, gradual supply growth over recent years has slowly decreased rents, but Tbilisi still has one of the highest prime office rents among the CEE cities. As a result, underpenetrated market yields are high. Prime yield in Tbilisi stands at 11.7% vs a 7.1% average in peer cities. Price-to-quality up and changes ongoing. Since the opening of the King David business center in 2017, demand for prime stock has grown. King David entered the market with lower-than average rents, resulting in significant decline in Class A rents, down to US$ 23 per m2 from US$ 30 over 2017-2019. However, growing demand for
Figure 42: Business sector turnover by region, 2018 Figure 43: Office stock by class in Tbilisi, 2019
Source: Geostat Source: Galt & Taggart Research
Tbilisi74%
Adjara6%
Kvemo Kartli5%
Imereti5% Others
10%
Owner occupied
50%
Traditional leasable
28%
A3%
B5%
C6%
D8%
Modern leasable
22%

25
Georgia │ Real Estate Industry Overview
December, 2019
prime stock illustrates redistribution rather than overall demand growth – companies are switching to better offices. Notably, four new major business centers are in the pipeline: Axis Towers, City Tower, CH64 and Vake Plaza which will add c. 50,000 m2 to the city office stock by 2020. Therefore, supply growth expected to further continue redistribution to higher class offices, while existing business center rents will shrink, in our view unless emergence of new affluent companies intensifies. A Central Business District could be established. Currently, the business centers are dispersed across the city with no particular CBD. However, with the upcoming major additions a CBD could be established around Vake Park. In particular, there are three class A business centers with a combined GLA of c. 40,000 m2 opening close to each other in 2020. Notably, the establishment of a CBD would also benefit high street retail in the neighbourhood, driving rents up. Occupancy rates will suffer in low-profile offices, in our view. With the lack of new tenants and boosted supply through 2020, there might be high vacancy rates in lower-profile offices mostly as companies will move to higher quality spaces. IT and BPO companies lacking in Tbilisi offices. IT companies are the largest tenant category in European cities, but are not widely present in Tbilisi business centers. However, we expect that Georgia’s positioning as a regional business hub will attract outsourcing and IT companies in the future. The entrance of Majorel, Evolution Gaming, CMX solutions and Base4 in Georgia recently is a promising example. Meanwhile, international companies, such as international financial institutions (EBRD, IMF, IFC, ADB, etc.) and embassies, are the main absorbers of modern office space in Tbilisi currently.
Shift from landlord-driven to tenant-oriented market. Supply growth will transform the market. Rents will gradually decrease, tenants will shift to better class offices in the short term. Meanwhile, in the medium term, wealthy local firms will return to the office market to rent, saving the money previously spent on buying real estate, in our view.
Figure 44: Weighted average rent by office class in Tbilisi, US$ per m2
Figure 45: Peer comparison: prime office rents and yields in 2018
Source: Galt & Taggart Research, Colliers Georgia Source: Colliers Office Map 2018
30
24 23
1716 15
0
5
10
15
20
25
30
35
1H17 1H18 1H19
Class A Class B
38 32 25 25 23 22 19 19 18 18 18 17
8%
12%
7%
5%6%
12%
6% 6%
8%
7% 6%
8%
0%
4%
8%
12%
16%
0
10
20
30
40
Prime CBD headline rent, US$ per sq.m. (LHS) Prime yields (RHS)

26
Georgia │ Real Estate Industry Overview
December, 2019
Tbilisi Retail Real Estate
Retail – Fuelled by consumer behaviour
Modern shopping centres in Tbilisi benefit from a growing consumer preference for shopping centres, good locations and tourism traffic. They are present in all of Tbilisi’s districts, except for Didube district. We do not see a pressing need for further expansion of these retail formats in the short term, but expect their dominance to continue. Looking ahead, there will be opportunities in the retail sector as consumer income grows and bazaars and low-quality spaces are replaced. Unlike in peer cities, the lack of parking lots and low pedestrian traffic make high street retail uninviting for retailers in Tbilisi. Only Rustaveli Avenue remains attractive, because of its central location and tourist traffic. Consequently, high street rents are declining, while shopping centre occupancy and rents are slightly growing. Notably, the concentration of several business centres on Chavchavadze Avenue promises the formation of another retail hotspot in Tbilisi.
Bazaars and open air markets still account for large share of retail space in Tbilisi. As of 2018, Tbilisi had 1.6mn m2 of total retail stock, comprised of bazaars (46.4% of total GLA), modern shopping centers (24.6%), high street retail (3.2%), specialized centers (10.8%) and other retail formats (14.9%). Consumers shifting to modern formats with income growth. This is matched by growing share of modern shopping centers in retail formats. The supply of modern shopping centers was up 3.3x over 2012-2018 in terms of GLA, with City Mall Saburtalo expansion being latest notable addition. As a result, the GLA of modern shopping centers per 1,000 inhabitants increased to 327 m2 in 2019 up from 117 m2 in 2012. Despite growth this is still low compared to 524m2 in CEE capital cities in 2018.
Increasing disposable income and changing lifestyles of time-poor consumers is driving a preference for well-organized, all-in-one shopping options in Tbilisi. In particular, shopping malls with convenient access, free parking, food court and a major grocery retailer as an anchor have become extremely popular among customers. City Mall extension being a proper example for shoppertainment options. High street retail unattractive for consumers and retailers. Rustaveli, Chavchavadze, Pekini and Aghmashenebeli Avenues are the main high streets in Tbilisi. However, the lack of parking lots and, low pedestrian traffic make them unattractive for customers and, as a result, for retailers. Only Rustaveli Avenue is attractive, because of its centrality and high tourist traffic, while rents on other streets are decreasing. Notably, upcoming opening of several class A business centers on Chavchavadze Avenue, promises opportunities for high-end retailers going forward. No other high street is seen attractive for retailers in our view.
Figure 46: Tbilisi retail space breakdown by retail format, 2019 Figure 47: Tbilisi modern shopping center GLA over 2012-1019
Source: Galt & Taggart Research Source: Galt & Taggart Research
Bazaars46.4%
Modern shopping
center24.6%
Specialized centers10.8%
Secondary streets9.3%
High streets3.2%
Other 5.6%
105 114 137
193 209
292 289
327
0
100
200
300
400
0
100
200
300
400
500
2012 2013 2014 2015 2016 2017 2018 2019
Shopping center GLA, '000(LHS)
Shopping center GLA per 1,000 capita (RHS)

27
Georgia │ Real Estate Industry Overview
December, 2019
Consumer and retailer preferences reflected in rents. Rents are down on several high streets, while there is slight increase in shopping centers.
Shopping centers are higher-yielding assets for real estate investors, compared to high street retail, where rents are decreasing and yields are lower. Prime modern shopping center yield in Tbilisi stands at 13.0% vs an average 6.8% in peer CEE cities. Prime yield for high street retail in Tbilisi is also higher and stands at 9% vs an average of 6.8% in peer CEE cities.
E-commerce at an early stage of development. Currently, only c. 2.5% of total retail sales in Georgia is generated by e-sales, because:
Internet penetration in Georgia stands at 64% vs 80% in EU-28.
79% of Georgians have never shopped online vs 40% in EU-28.
Only 5.6% of Georgian enterprises have offered any products for sale online.
Figure 48: Weighted average rents in Tbilisi street retail, US$ per m2
Figure 49: Weighted average rents in Tbilisi shopping centres, US$ per m2
Source: Cushman & Wakefield Note: Net of VAT and service charges
Source: NAPR, Galt & Taggart Research Note: Net of VAT and service charges
Figure 50: Peer comparison: prime retail rents, 1H19 Figure 51: Peer comparison: prime yields, 1H19
Source: Colliers International Retail Map 1H19 Source: Colliers International Retail Map 1H19
35
40
2825
35
49
3329
22 21
0
10
20
30
40
50
601Q18 1Q19
$22.7 $23.2
$21.3 $22.1
10
15
20
25
30
2016 2017 2018 2019E
168
100 90
83 78 67
46 45 38 38
90
134
82 80
44 47
43
56
30
52
0
20
40
60
80
100
120
140
160
180
Prime high street rent, US$ per sq.m
Prime shopping center rent, US$ per sq.m
10%9%
8%7% 7%
6% 6% 6%
5% 5%
12%
13%
7%7%
5%
6%
8%
4%
6%7%
0%
4%
8%
12%
16%
Prime high street yield
Prime shopping center rent yield

28
Georgia │ Real Estate Industry Overview
December, 2019
Tbilisi Hotel Real Estate
Hotels – Need to attract high-spending tourists
Tbilisi’s accommodation stock almost doubled during 2015-9M19, totalling over 10k rooms. The hotel market is dominated by international chains, accounting for 24% of the room stock in the capital. Currently, international upscale and midscale chains enjoy high occupancy rates and prices, similar to in Western European cities. However, the extensive chain hotel pipeline for 2020-2022 in Tbilisi, which will double rooms in this segment, creates the risk of oversupply in the upscale segment. If unsuccessful in attracting high-spending visitors, the upscale chain hotel segment is likely to experience pressure on prices and occupancy rates in the short term. However, midscale chain hotels, despite considerable expansion in 2020, will still benefit from strong growth in low-spending visitors, in our view. Scarcity of budget accommodation was filled by the rapid expansion of the Airbnb market in 2016-19. We believe Airbnb’s share of Tbilisi’s accommodation market could rise to 20% over next three years, from 17% currently.
Tbilisi was most active hotspot for hotel investments in recent years. As of 9M19, Tbilisi had over 492 registered accommodation units, with 10,244 rooms and 23,072 beds. Notably, accommodation rooms almost doubled during 2015-9M19. The capital boasts the largest number of hotel rooms (33.5% of total) in the country with Adjara (31.1%) and Samtskhe-Javakheti (9.5%) being other hotspots for hotel development. Tbilisi is dominated by 17 international chain brands, accounting for 23.6% of hotel room stock. Chain brands currently enjoy high prices and occupancy rates, similar to hotels in Western European cities. However, extensive pipeline through 2022, which will double rooms in this segment from 2,459 currently to 5,389, expected to weigh on profitability without strong growth in high-spending visitors, in our view.
In upscale chain hotel segment, there are 1,575 additional rooms in the pipeline in 2020-2022, compared to the current capacity of 1,004. Notably, 372 rooms (Sheraton Metekhi Palace, Wyndham Grand) were added to the upscale stock in 2019, with another 440 (Pullman, Marriott Autograph Collection) to start operation from 2020. We believe, the entrance of the Marriott Autograph Collection hotels (400 rooms) from 2020-21, will be game-changing for the hotel market because of their higher value-to-price compared to existing hotels, which will reduce prices in the segment, in our view. The midscale segment is more affordable for tourists as the low-spending neighbors dominate the visitor mix. This segment also expected to double by 2022 with 13 more hotels entering the market with a combined 1,974 rooms vs 1,455 currently.
Figure 52: Accommodation rooms and beds in Tbilisi over 2015-2019
Figure 53: Tbilisi accommodation room stock breakdown in 9M19
Source: GNTA Source: GNTA, Galt & Taggart Research
6 7 8 9
10
13
16 18
20
23
0
10
20
30
2015 2016 2017 2018 9M19
Rooms, '000 Beds, '000
International chain brands
24%
Rooms in other accomodations
76%
10,244 rooms

29
Georgia │ Real Estate Industry Overview
December, 2019
Airbnb also oversupplied. In the hope of generating stable income, listings for nearly 15k flats were published on Airbnb in October 2019, far above the number for Prague (12k), Budapest (11k) and Athens (10k). As a result, market is oversupplied, pressuring prices. The median Airbnb price in Tbilisi at US$ 31 in 9M19 is the lowest among the peer cities. Airbnb mostly competes with local midscale/economy/budget class hotels, offering lower prices to tourists. Absence of regulations will drive further growth of Airbnb. Airbnb accounts for 17% of the accommodation market by nights sold in Tbilisi, similar to the share in the peers. Many Airbnb markets are regulated with length of stay limits ranging from 60 to 120 days in Paris, Amsterdam, Madrid, Berlin, London. The absence of this regulation illustrates the growth potential of Tbilisi Airbnb market. Taking into account tourism growth projections, we forecast Airbnb to gain up to 20% of Tbilisi’s accommodation market over the next three years on the back of low-spending visitors.
Figure 54: KPIs of international upscale brands in Tbilisi, US$ Figure 55: KPIs of international midscale brands in Tbilisi, US$
Source: Galt & Taggart Research Note: Prices net of VAT
Source: Galt & Taggart Research Note: Prices net of VAT
Figure 56: Share of Airbnb in Tbilisi accommodation market
Figure 57: ADR of different hotel and Airbnb categories in 2018, US$
Source: Airdna, Galt & Taggart Research Source: Airdna, Galt & Taggart Research
Note: Prices net of VAT
171 164 158 156 153 148116 109 115 112
9480
68% 66%
73% 72%
62%
54%
0%
20%
40%
60%
80%
0
50
100
150
200
250
2015 2016 2017 2018 2019F 2020F
ADR, US$ (LHS) RevPar, US$ (LHS) Occupancy (RHS)
132 124 118 116 108 9787 87 85 76 70 65
66%70%
72%
66% 65%68%
0%
20%
40%
60%
80%
0
50
100
150
200
2015 2016 2017 2018 2019F 2020F
ADR, US$ (LHS) RevPar, US$ (LHS) Occupancy (RHS)
Airbnb nights sold17%
Nights sold in other forms of
accommodation83%
Share of Airbnb :
Paris 15%
Prague 15%
Budapest 14%
Berlin 7%
London 7%
Tbilisi 17%
156
116101
85
5138 35
0
40
80
120
160
200

30
Georgia │ Real Estate Industry Overview
December, 2019
Tbilisi Development Land
Development land – Prices are rising
Available land resources in Tbilisi’s central districts are scarce, and have been subject to intensive residential sector development since 2004. Naturally, developers have shifted to suburban districts, where land resources are more abundant. We are already seeing that scarcity of land resources and the Tbilisi Master Plan are shifting demand to and lifting land prices in suburbs.
Development land sales growing steadily in Tbilisi promising stable supply. Development land sales increased at a CAGR 18.8% over 2015-2018, to a total of 484 parcels of development land sold in 2018. Development land sales suggest the suburban shift of residential development. Available land resources for residential development are already scarce in the central districts. As result, the share of Samgori, Didi Digomi, Gldani, Isani in total development land sales was up to 65.7% in 2018 from 56.5% in 2016. We expect construction regulations and Tbilisi Master Plan limitations to further shift development to the suburban areas from the already oversupplied central areas in the medium term. Scarcity of land resources will drive average prices up. The highest average selling prices over 2016-2018 were in Mtatsminda and Chugureti, US$ 443 per m2 and US$ 340, respectively. However, average prices by districts are volatile as the transactional sample is small and biased towards one-off large-scale sales. Consistent price spikes in the large samples were observed in the following districts:
Didi Dighomi – Average land price went up to US$ 162 per m2 in 2018, from US$ 141 in 2016, growth of 14.9%.
Nadzaladevi – Average land price went up to US$ 139 per m2 in 2018, from US$ 47 in 2016, up 3x.
Figure 58: Development land sales by district in Tbilisi, units
Figure 59: Average selling price of development land in Tbilisi, over 2016-2018, US$ per m2
Source: NAPR, BoG, Galt & Taggart Research Note: Sales include land parcels over 1,000 m2
Source: NAPR, BoG, Galt & Taggart Research
149
86
5650
3325 25
18 1812 12
0
40
80
120
1602018 2017 2016 443
340 324
275 242 241 237
162 160 132
97
0
100
200
300
400
500

31
Georgia │ Real Estate Industry Overview
December, 2019
Annexes

32
Georgia │ Real Estate Industry Overview
December, 2019
Annex 1: Regulatory Changes Value added tax on advance payments – effective from January 2017 Cash generated from pre-sales was one of the major sources of funding for construction projects, especially for small construction companies. In January 2017 funds received under pre-sales became subject to VAT taxation, reducing working capital by 18%.
Government Decree N41 on safety standards – effective from January 2017 Government Decree No. 41 introduced minimum fire safety requirements2 for buildings that received construction permits from November 2017. These requirements reduce the liveable area by c. 10%, forcing developers to increases real estate prices accordingly. Some developers already built to a standards that complied with fire standards before regulation took force, leaving them with a competitive advantage while other developers, will be forced to increase prices or squeeze margins.However, the effect is not fully delivered to the market yet, because the majority of the existing stock of buildings was constructed or is being constructed under pre-regulation permits. The full effect of updated fire safety standards on real estate prices will be evident from 2H20, in our view.
Mandatory quotation of real estate in GEL – effective from July 2017 Under NBG’s de-dollarization policy, fixing real estate sale prices in GEL became mandatory from 2H17. Mandatory quotation in GEL, coupled with currency volatility increases uncertainty about the value of repayment in US$. Internal instalment payments are usually fixed to the FX rate at the moment of the sale. Therefore, subsequent depreciation of the GEL, devalues repayments received in US$ terms.
Safety requirements; construction on list of harmful and dangerous jobs – effective from August 2018 Under new regulations, construction-related jobs have been identified as heavy, harmful and dangerous. As a result, companies are required to provide a safe working environment, inspect if safety standards are met by workers and ensure that all workers are well-equipped during construction. Tightened work safety requirements have increased construction costs.
Quality control on construction materials – effective from January 2019 The new regulation sets minimum technical requirements for imported and locally produced cement products, steel frames, plastic pipes and electric cables. Use of products that do not meet the requirements is banned. Updated quality control requirements for certain construction products is expected to raise construction costs.
Tbilisi Land Use Master Plan – effective from March 2019 The Tbilisi Master Plan defines a framework for urban development, setting land utilization, construction intensity and recreation zone standards. The Tbilisi Master Plan is expected to support the suburbanization process. Suburban areas should become more interesting for developers due to higher permitted K2 coefficients (construction intensity) and Greenfield development opportunities. The Master Plan identifies several problematic areas of the city:
Lisi Lake – proximity to recreational areas and the city center, drove demand for the areas around Lisi Lake, where there has been an incoherent and unplanned approach to building development.
Eliava Market – this circa 150,000 m2. land plot is occupied by an
unorganized group of retail shops and outlets. Therefore, moving Eliava Market out of the city center offers development opportunities for residential and commercial real estate developers.
2 Minimum fire safety requirements include the designation of evacuation routes, exit facilities, fire detection and alarm systems, proper lighting and ventilation, etc.

33
Georgia │ Real Estate Industry Overview
December, 2019
Akademkalaki – the area surrounding the Sports’ Palace of Tbilisi has become a symbol of post-soviet chaotic development. Developer interest is still high in the remaining individual houses and barracks. However the Master Plan aims to limit further residential development in the site.
Prohibition of sales of increases to permitted K2 coefficient – effective from June 2019 The K2 coefficient limits the maximum construction size, i.e. floor space of the building. However, construction companies used to be able to increase the permitted K2 coefficient by paying an additional fee, allowing them to add more floors at a low incremental cost and, therefore, to increase the profitability of the project. By prohibiting sales of K2 coefficient increases, construction intensity can be kept to that defined in the Tbilisi Master Plan. The Master Plan sets higher K2 coefficients in the suburbs of the city, incentivising suburban development. Raising resident permit requirements – effective from July 2019 Before the latest regulation, foreigners could obtain a residence permit by purchasing real estate worth US$ 35k and then gift it, or sell, without losing the residence permit. The minimum investment requirement has been increased to US$ 100k and residence permit will be revoked if the real estate ownership is transferred to another person. The increased investment requirement aims to limit the purchasing of real estate for the purpose of getting a residence permit in Georgia. Changes in construction permit requirements – effective from July 2019 After receiving the construction permit, any adjustments to the building project that changes the functionality of the building or the land development area by more than 20% are subject to a new permit issuance. The new regulation is expected to make obtaining a building permit a more complex process and make it more time-consuming. Draft law on energy efficiency of buildings Georgia has undertaken responsibility to harmonize its regulations to energy efficient environment with the 2010/31/EU Directive. The draft law on Energy Efficiency of Buildings was initiated in June 2018 and is subject to parliament approval. However, some Georgian developers and construction companies already use energy efficient materials due to increasing demand from middle- to high-income households. As a result, for those companies the transition to energy-efficient construction will be smooth.

34
Georgia │ Real Estate Industry Overview
December, 2019
Annex 2: Mortgage Lending NBG has introduced mortgage regulations to limit dollarization and household indebtedness by:
Setting the floor for FX loans at GEL 100k from January 2017, increasing to GEL 200K from January 2019.
Imposing limits on payment-to-income (PTI) and loan-to-value (LTV) ratios with stricter limits for unhedged exposures.
Table 2: PTI standards under new regulations
Monthly net Salary, GEL
Monthly PTI
Hedged Borrower Unhedged Borrower
Max term Contract term Max term Contract term
<1,000 25% 35% 20% 25%
1000-2000 35% 45%
2000-4000 45% 55% 25% 30%
More than 4,000 50% 60% 30% 35% Source: NBG
One should earn at least GEL 1,600 net monthly salary to afford a flat in suburban Tbilisi. Taking into consideration the PTI and LTV limitations set by NBG, in order to buy a small (40 m2) apartment in suburban districts of Tbilisi (Samgori, Gldani, Didi Dighomi) a minimum GEL 1,600 net monthly salary is required. Notably, with GEL 2,000 net monthly salary small flats in central districts are also affordable.
Issuance of new mortgages fell to GEL 461mn (-27.8% y/y excl. FX effect) in 1Q19 but rebounded strongly in 2Q19 to GEL 936mn (+7.9% y/y excl. FX effect) driven by low GEL interest rates and simplified mortgage offerings. However, mortgages reduced again in 3Q19 – down 37.3% y/y excluding FX effect to GEL 794mn. This reduction reflects high base of 3Q18 as well as deteriorated sentiments. Mortgage loans dollarization reduced due to FX floor and record-low GEL interest rates. Consequently, the issuance of new GEL-denominated mortgage loans was up 123.3% y/y, while new FX-denominated mortgage loans were down by 73.6% y/y excluding the FX effect in 9M19. As a result, mortgage loan portfolio dollarization reduced to 65.3% in Sep-19 from 75.9% in Sep-18.
Figure 60: Minimum net monthly salary required to afford a flat under NBG's mortgage standards
Source: NBG, Galt & Taggart Research Note: We assume 14 year mortgage, 11% interest rate in GEL and PTI limitations for unhedged borrower Small apartment – 40 m2, medium – 65 m2, large – 105 m2
2,000 2,100 2,000 2,000 2,000 1,900 1,600 1,800 1,600 1,800 1,600
4,900 4,700
4,450 4,150 4,100
3,550 3,350
2,950 2,750 2,750 2,750
0
1,000
2,000
3,000
4,000
5,000
6,000
Vake Mtatsminda Chughureti Krtsanisi Saburtalo Didube Didi Dighomi Isani Gldani Nadzaladevi Samgori
Small Medium Large

35
Georgia │ Real Estate Industry Overview
December, 2019
Mortgages are healthy with NPLs at 3.0% as of Sep-19. Mortgage loans to GDP stood at 14% in 2018, above the level in neighbours, but far below EU countries. Low level of non-performing mortgage loans and relatively low share of mortgages to GDP create room for healthy growth in mortgages, in our view.
Figure 61: Growth of mortgage loans granted monthly Figure 62: Mortgage-financed apartment sales in Tbilisi
Source: NBG, Galt & Taggart Source: NAPR, BoG, Galt & Taggart Research
Note: Net of refinancing and house renovation loans
Figure 63: Mortgage loans to GDP, 2018 Figure 64: Share of non-performing loans in total mortgages
Source: ECB, Central banks of respective countries Source: NBG
-100%
-50%
0%
50%
100%
150%
200%
250%
Ja
n-1
8
Feb
-18
Mar-
18
Apr-
18
May-1
8
Ju
n-1
8
Ju
l-18
Aug
-18
Sep
-18
Oct-
18
No
v-1
8
De
c-1
8
Ja
n-1
9
Feb
-19
Mar-
19
Apr-
19
May-1
9
Ju
n-1
9
Ju
l-19
Aug
-19
Sep
-19
Total mortgage loans, y/y (exc. FX effect)
GEL-denominated mortgage loans, y/y
FX-denominated mortgage loans, y/y (exc. FX effect)
35%
40%
32%
48%
42%36%
40%41%
35%40%
54% 53%
23%
37%30%
0%
20%
40%
60%
80%
0
500
1,000
1,500
2,000
1Q
16
2Q
16
3Q
16
4Q
16
1Q
17
2Q
17
3Q
17
4Q
17
1Q
18
2Q
18
3Q
18
4Q
18
1Q
19
2Q
19
3Q
19
Total apartments sales, GEL mn (LHS)
Total mortgages issued for apartment purchases, GEL mn (LHS)
Share of mortgage financed sales (RHS)
13.5
%
10.6
%
7.7
%
0%
20%
40%
60%
80%
100%
0%
1%
2%
3%
4%
5%
Ju
n-1
4
Sep
-14
De
c-1
4
Mar-
15
Ju
n-1
5
Sep
-15
De
c-1
5
Mar-
16
Ju
n-1
6
Sep
-16
De
c-1
6
Mar-
17
Ju
n-1
7
Sep
-17
De
c-1
7
Mar-
18
Ju
n-1
8
Sep
-18
De
c-1
8
Mar-
19
Ju
n-1
9
Sep
-19
GEL-denominated FX-denominated

36
Georgia │ Real Estate Industry Overview
December, 2019
Annex 3: Average Prices by District
Figure 65: Average prices per m2 in Vake Figure 66: Average prices per m2 in Mtatsminda
Figure 67: Average prices per m2 in Saburtalo Figure 68: Average prices per m2 in Chugureti
Figure 69: Average prices per m2 in Krtsanisi Figure 70: Average prices per m2 in Didube
Figure 71: Average prices per m2 in Nadzaladevi Figure 72: Average prices per m2 in Didi Dighomi
Figure 73: Average prices per m2 in Isani Figure 74: Average prices per m2 in Gldani Figure 75: Average prices per m2 in Samgori
Source: NAPT, BOG, Galt & Taggart Research
833 974
2,030
2,847
0
1,000
2,000
3,000
1Q
16
2Q
16
3Q
16
4Q
16
1Q
17
2Q
17
3Q
17
4Q
17
1Q
18
2Q
18
3Q
18
4Q
18
1Q
19
2Q
19
3Q
19
US$ GEL
824 963
2,009
2,821
0
500
1,000
1,500
2,000
2,500
3,000
3,500
1Q
16
2Q
16
3Q
16
4Q
16
1Q
17
2Q
17
3Q
17
4Q
17
1Q
18
2Q
18
3Q
18
4Q
18
1Q
19
2Q
19
3Q
19
US$ GEL
788 820
1,923
2,390
0
1,000
2,000
3,000
1Q
16
2Q
16
3Q
16
4Q
16
1Q
17
2Q
17
3Q
17
4Q
17
1Q
18
2Q
18
3Q
18
4Q
18
1Q
19
2Q
19
3Q
19
US$ GEL
719 796
1,758
2,318
0
1,000
2,000
3,000
1Q
16
2Q
16
3Q
16
4Q
16
1Q
17
2Q
17
3Q
17
4Q
17
1Q
18
2Q
18
3Q
18
4Q
18
1Q
19
2Q
19
3Q
19
US$ GEL
693 849
1,682
2,463
0
1,000
2,000
3,000
1Q
16
2Q
16
3Q
16
4Q
16
1Q
17
2Q
17
3Q
17
4Q
17
1Q
18
2Q
18
3Q
18
4Q
18
1Q
19
2Q
19
3Q
19
US$ GEL
698 698
1,693
2,043
0
1,000
2,000
3,000
1Q
16
2Q
16
3Q
16
4Q
16
1Q
17
2Q
17
3Q
17
4Q
17
1Q
18
2Q
18
3Q
18
4Q
18
1Q
19
2Q
19
3Q
19
US$ GEL
624 585
1,521 1,706
0
1,000
2,000
3,000
1Q
16
2Q
16
3Q
16
4Q
16
1Q
17
2Q
17
3Q
17
4Q
17
1Q
18
2Q
18
3Q
18
4Q
18
1Q
19
2Q
19
3Q
19
US$ GEL
476 562
1,151
1,639
0
1,000
2,000
3,000
1Q
16
2Q
16
3Q
16
4Q
16
1Q
17
2Q
17
3Q
17
4Q
17
1Q
18
2Q
18
3Q
18
4Q
18
1Q
19
2Q
19
3Q
19
US$ GEL
649 590
1,583 1,723
0
1,000
2,000
3,000
1Q
16
2Q
16
3Q
16
4Q
16
1Q
17
2Q
17
3Q
17
4Q
17
1Q
18
2Q
18
3Q
18
4Q
18
1Q
19
2Q
19
3Q
19
US$ GEL
559 548
1,357 1,600
0
1,000
2,000
3,000
1Q
16
2Q
16
3Q
16
4Q
16
1Q
17
2Q
17
3Q
17
4Q
17
1Q
18
2Q
18
3Q
18
4Q
18
1Q
19
2Q
19
3Q
19
US$ GEL
604 541
1,472 1,581
0
1,000
2,000
3,000
1Q
16
2Q
16
3Q
16
4Q
16
1Q
17
2Q
17
3Q
17
4Q
17
1Q
18
2Q
18
3Q
18
4Q
18
1Q
19
2Q
19
3Q
19
US$ GEL

37
Georgia │ Real Estate Industry Overview
December, 2019
Annex 4: Capital Markets
Georgian developers are yet to uncover capital markets opportunities. Only M2 Real Estate, Green Development and Lisi Lake have issued bonds on local market. First bond was issued in 2014 by M2 Real Estate, while there are three outstanding bonds issued currently with a total volume of US$ 77mn.
Commercial real estate is more suitable for bond financing. M2 Real Estate was also first to issue bond for their consolidated commercial assets. Generally, stable cash flow allows commercial real estate owners to offer low-risk real estate bonds to debt investors. Most of real estate developers in CEE started issuing bonds in 2010s.
Bond financing offers certain opportunities and advantages for issuers, including:
No principal payments – developers can issue bonds without paying the principal, and after the maturity date pay debt by issuing a new bond.
No collateral – unlike bank loans, bonds do not require collateral, giving additional comfort to developers.
Diversification – bond market is an opportunity to diversify funding sources for more stability.
Table 3: Real estate bonds issued by Georgia companies
Issuer Year of
issuance Tenor (years) Coupon rate Amount in US$ Placement agent
Currently outstanding
M2 Real Estate 2014 1 9.5% 5mn Galt & Taggart No
M2 Real Estate 2014 1 8.4% 10mn Galt & Taggart No
M2 Real Estate 2015 2 9.5% 20mn Galt & Taggart No
M2 Real Estate 2016 3 7.5% 25mn Galt & Taggart No
Green Development 2017 2 11.0% 2mn Issuer No
Lisi Development 2018 3 8% 12mn TBC Capital Yes
M2 Commercial Assets 2018 3 7.5% 30mn Galt & Taggart Yes
M2 Real Estate 2019 3 7.5% 35mn Galt & Taggart YES Source: Galt & Taggart Research
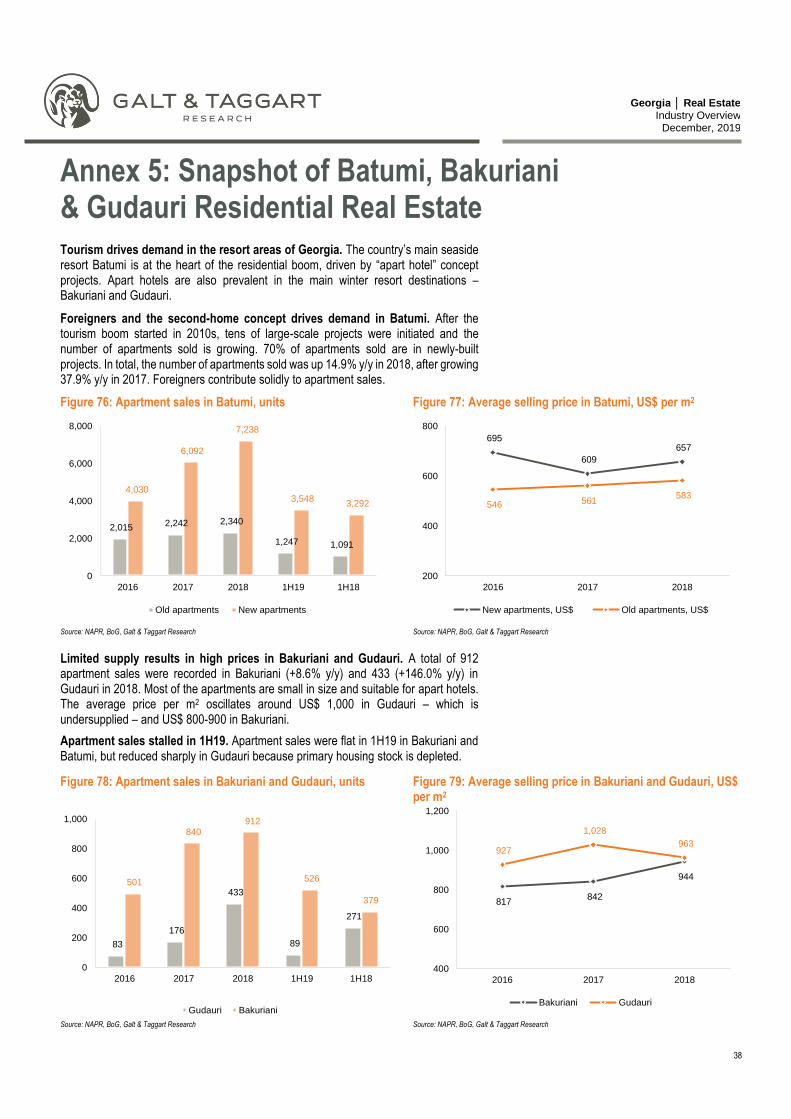
38
Georgia │ Real Estate Industry Overview
December, 2019
Annex 5: Snapshot of Batumi, Bakuriani & Gudauri Residential Real Estate
Tourism drives demand in the resort areas of Georgia. The country’s main seaside resort Batumi is at the heart of the residential boom, driven by “apart hotel” concept projects. Apart hotels are also prevalent in the main winter resort destinations – Bakuriani and Gudauri.
Foreigners and the second-home concept drives demand in Batumi. After the tourism boom started in 2010s, tens of large-scale projects were initiated and the number of apartments sold is growing. 70% of apartments sold are in newly-built projects. In total, the number of apartments sold was up 14.9% y/y in 2018, after growing 37.9% y/y in 2017. Foreigners contribute solidly to apartment sales.
Limited supply results in high prices in Bakuriani and Gudauri. A total of 912 apartment sales were recorded in Bakuriani (+8.6% y/y) and 433 (+146.0% y/y) in Gudauri in 2018. Most of the apartments are small in size and suitable for apart hotels. The average price per m2 oscillates around US$ 1,000 in Gudauri – which is undersupplied – and US$ 800-900 in Bakuriani.
Apartment sales stalled in 1H19. Apartment sales were flat in 1H19 in Bakuriani and Batumi, but reduced sharply in Gudauri because primary housing stock is depleted.
Figure 76: Apartment sales in Batumi, units Figure 77: Average selling price in Batumi, US$ per m2
Source: NAPR, BoG, Galt & Taggart Research Source: NAPR, BoG, Galt & Taggart Research
Figure 78: Apartment sales in Bakuriani and Gudauri, units
Figure 79: Average selling price in Bakuriani and Gudauri, US$ per m2
Source: NAPR, BoG, Galt & Taggart Research Source: NAPR, BoG, Galt & Taggart Research
2,015 2,242 2,340
1,247 1,091
4,030
6,092
7,238
3,548 3,292
0
2,000
4,000
6,000
8,000
2016 2017 2018 1H19 1H18
Old apartments New apartments
695
609
657
546 561 583
200
400
600
800
2016 2017 2018
New apartments, US$ Old apartments, US$
83
176
433
89
271
501
840 912
526
379
0
200
400
600
800
1,000
2016 2017 2018 1H19 1H18
Gudauri Bakuriani
817 842
944
927
1,028
963
400
600
800
1,000
1,200
2016 2017 2018
Bakuriani Gudauri

39
Georgia │ Real Estate Industry Overview
December, 2019
Methodological Notes District borders. The urban districts in the report do not match precisely with administrative borders of Tbilisi. Didi Dighomi has been separated from the Saburtalo Division and includes the Vashlijvari area and former territories of Dighomi Satsdeli Meurneoba. Some areas in the Vake Administrative Division (Vazha-Pshavela Avenue, Nutsubidze Plateaus, and other bordering streets) has been moved to Saburtalo. Apartment price segment. Projects are divided into several categories by selling price: (US$ 300-600), medium (US$ 800-1200) and premium (US$ 1,200 and higher). Apartment size segment. Projects are divided into several categories by size such as: low (16-50 m2), medium (51-80 m2), large (81-120 m2) and very large (121-250 m2). Modern shopping center is a retail property that is planned, built, and managed as a single entity, comprising units and “communal” areas, with a minimum GLA of 5,000 m2. Retail centers are classified as modern shopping centers according to ICSC standards. Prime rent represents the top open-market tier of rent that could be expected to be paid by an in-line tenant in a shopping centre for a unit of standard size commensurate with demand (typically 250 m²), of the highest quality and specification (grade A) in the best shopping centre in the market at the survey date. Prime yield: The yield an investor is prepared to pay to buy a grade A building, fully-let to high quality tenants at an open market rental value in a prime shopping centre. Lease terms size of the building should be commensurate with the market. Gross yield is considered in calculations. Gross yield = first years' passing rent/property price. Prime headline CBD rent represents the rent that could be expected for a unit of standard size commensurate with demand (typically 500-1,000 m2 for offices), for space of the highest quality and specification (grade A) in the CBD area at the survey date. Prime office yield: The yield an investor is prepared to pay to buy a grade A building, fully-let to high quality tenants at an open market rental value in a prime location. Lease terms should be commensurate with the market. Gross yield is considered in calculations. Gross yield = first years' passing rent/property price.
40
Georgia │ Real Estate Industry Overview
December, 2019
Disclaimer This document is the property of and has been prepared by JSC Galt & Taggart ("Galt & Taggart"), a member of Bank of Georgia Group PLC (‘Group”) solely for informational purposes and independently of the respective companies mentioned herein. This document does not constitute or form part of, and should not be construed as, an offer or solicitation or invitation of an offer to buy, sell or subscribe for any securities or assets and nothing contained herein shall form the basis of any contract or commitment whatsoever or shall be considered as a recommendation to take any such actions. Galt & Taggart is authorized to perform professional activities on the Georgian market. The distribution of this document in certain jurisdictions may be restricted by law. Persons into whose possession this document comes are required by Galt & Taggart to inform themselves about and to observe any and all restrictions applicable to them. This document is not directed to, or intended for distribution, directly or indirectly, to, or use by, any person or entity that is a citizen or resident located in any locality, state, country or other jurisdiction where such distribution, publication, availability or use would be contrary to law or regulation or which would require any registration or licensing within such jurisdiction. Investments (or any short-term transactions) in emerging markets involve significant risk and volatility and may not be suitable for everyone. The recipients of this document must make their own investment decisions as they believe appropriate based on their specific objectives and financial situation. When doing so, such recipients should be sure to make their own assessment of the risks inherent in emerging market investments, including potential political and economic instability, other political risks including without limitation changes to laws and tariffs, and nationalization of assets, and currency exchange risk. No representation, warranty or undertaking, express or implied, is or will be made by Galt & Taggart or any other member of the Group or their respective directors, employees, affiliates, advisers or agents or any other person as to, and no reliance should be placed on, the fairness, accuracy, completeness or correctness of this document and the information contained herein (and whether any information has been omitted from this document) and no reliance should be placed on it. This document should not be considered as a complete description of the markets, industries and/or companies referred to herein. Nothing contained in this document is, is to be construed as, or shall be relied on as legal, investment, business or tax advice, whether relating to the past or the future, by Galt & Taggart any other member of the Group or any of their respective directors, employees, affiliates, advisers or agents in any respect. Recipients are required to make their own independent investigation and appraisal of the matters discussed herein. Any investment decision should be made at the investor's sole discretion. To the extent permitted by law, Galt & Taggart, any other member of the Group and their respective directors, employees, affiliates, advisers and agents disclaim all liability whatsoever (in negligence or otherwise) for any loss or damages however arising, directly or indirectly, from any use of this document or its contents or otherwise arising in connection with this document, or for any act, or failure to act, by any party, on the basis of this document. The information in this document is subject to verification, completion and change without notice and Galt & Taggart is not under any obligation to update or keep current the information contained herein. The delivery of this document shall not, under any circumstances, create any implication that there has been no change in the information since the date hereof or the date upon which this document has been most recently updated, or that the information contained in this document is correct as at any time subsequent to the date on which it is supplied or, if different, the date indicated in the document containing the same. No representation or warranty, expressed or implied, is made by Galt & Taggart or any other member of the Group, or any of their respective directors, employees, affiliates, advisers or agents with respect to the accuracy or completeness of such information. The information provided and opinions expressed in this document are based on the information available as of the issue date and are solely those of Galt & Taggart as part of its internal research coverage. Opinions, forecasts and estimates contained herein are based on information obtained from third party sources believed to be reliable and in good faith, and may change without notice. Third party publications, studies and surveys generally state that the data contained therein have been obtained from sources believed to be reliable, but that there is no guarantee of the accuracy or completeness of such data. Accordingly, undue reliance should not be placed on any such data contained in this document. Neither Galt & Taggart, any other member of the Group, nor their respective directors, employees, affiliates, advisors or agents make any representation or warranty, express or implied, of this document's usefulness in predicting the future performance, or in estimating the current or future value, of any security or asset. Galt & Taggart does, and seeks to do, and any other member of the Group may or seek to do business with companies covered in its research. As a result, investors should be aware of a potential conflict of interest that may affect the objectivity of the information contained in this document. Unauthorized copying, distribution, publication or retransmission of all or any part of this document by any medium or in any form for any purpose is strictly prohibited. The recipients of this document are responsible for protecting against viruses and other destructive items. Receipt of the electronic transmission is at risk of the recipient and it is his/her responsibility to take precautions to ensure that it is free from viruses and other items of a destructive nature.
Head of Research Eva Bochorishvili | [email protected] Head of Macroeconomic Analysis and Forecasting Lasha Kavtaradze | [email protected] Head of Analytics Giorgi Iremashvili | [email protected] Head of Sector Research Bachana Shengelia | [email protected] Senior Analyst Mariam Chakhvashvili | [email protected] Senior Analyst Ana Nachkebia | [email protected] Senior Analyst Kakhaber Samkurashvili | [email protected] Analyst Tatia Mamrikishvili | tmamrikishvili @gt.ge Analyst Nino Peranidze | [email protected] Analyst Nika Megutnishvili | [email protected]
Address: 79 D. Agmashenebeli Avenue, Tbilisi 0102, Georgia Tel: + (995) 32 2401 111 Email: [email protected]