tc-dhmc analysis - existing & future sfmta - draft report d3 (7-19-11)
TRANSCRIPT
DRAFT REPORT – FOR INTERNAL REVIEW
TROLLEY COACHES & DIESEL HYBRID MOTOR COACHES:
ANALYSIS OF EXISTING CONDITIONS AND
FUTURE OPERATIONS AT THE SFMTA
Paul Bignardi Transportation Planner IV
Sustainable Streets Division
July 19, 2011

DRAFT DRAFT DRAFT DRAFT DRAFT
1
EXECUTIVE SUMMARY
TROLLEYCOACHES AND HYBRID MOTOR COACHES: ANALYSIS OF EXISTING CONDITIONS
AND POSSIBLE FUTURE OPERATIONS AT SFMTA
INTRODUCTION This report is separated into five sections, and each section was written so it could either be read as part of the larger report, or it could stand alone as an individual document. The five sections are:
1) The Trolley Coach transit mode in North America, 2) Existing Conditions of the SFMTA trolley coach fleet 3) The Next Generation of SFMTA transit vehicles 4) Coordination on Research and Possible Joint Agency Procurement of New Trolley
Coach Transit vehicles 5) Next Vehicle Procurement – Recommended Action
The catalyst for this report is the upcoming procurement by the SFMTA of new transit vehicles to replace 60 60’ electric trolley coaches, and 45 40’ diesel motor coaches by 2014-2015. The issue of the vehicle replacement has become more complicated by the requirement that some of the vehicles to be procured will be used to provide transit vehicles for the Van Ness BRT service that is currently in environmental review, and which has an projected opening of 2016. This planned vehicle procurement raised the issue of the merits of trolley coach service, and whether the SFMTA should continue to operate trolley coach service, or start plans to phase out existing trolley coach service. The report addresses the question above in detail regarding an existing state of affairs summary of trolley coach operations in North America, life cycle costs of trolley coaches versus motor coaches and possible joint procurement with other transit agency trolley coach operators. It also goes beyond to analyze information concerning possible future vehicle types, including revisions of the trolley coach concept and similar experimental transit vehicles that could become part of a future fleet at the SFMTA within a decade. SECTION 1: THE TROLLEY COACH TRANSIT MODE IN NORTH AMERICA Only six North American cities operate trolley coach vehicles: in 2011:
• San Francisco 313 vehicles • Seattle 159 vehicles • Vancouver, Canada 266 vehicles • Boston 60 vehicles • Philadelphia 38 vehicles • Dayton, OH 54 vehicles
The three Pacific coast cities are home to 80% of all trolley coach operations in North America. These cities are similar to one another in that they have access to inexpensive clean electricity generated by hydro-power, they have hilly geography that for decades has favored trolley coach vehicle operations, and they have public support for retention of trolley coach service. The last new trolley coach service was implemented over 50 years ago, and no U.S. or Canadian cities are planning to implement new trolley coach service. As a transit mode, trolley coach service has several “plusses”:
• zero or near zero emissions – (electricity generation may have emissions)

DRAFT DRAFT DRAFT DRAFT DRAFT
2
• lower energy costs than fossil fuel transit vehicles – lower by 75% or more • quiet operations • higher energy efficiency versus fossil fuel powered transit vehicles • service (U.S.) is eligible for FTA “fixed guideway funds”
Trolley coach service also has several “minuses”: • unattractive overhead wire system • service is limited to the length of the overhead wire system • costs associated with maintenance of the overhead wire system • costs associated with capital infrastructure replacement of infrastructure • only one North American supplier of new transit vehicles
In 2011, the trolley coach as a mode in North America remains a viable transit mode, but only in a very small niche market of the few cities that continue to operate this type of transit vehicle. One of the niche cities is San Francisco. SECTION 2: EXISTING CONDITIONS OF THE SFMTA TROLLEY COACH FLEET SFMTA has operated trolley coach service for over 70 years, and currently has the largest trolley coach fleet (313 vehicles) in North America. SFMTA operates both 40’ and 60’ length trolley coaches, and the existing fleet is comprised of a mix of vehicles produced by New Flyer and ETI. Service operates on many of the busiest and slowest transit routes in San Francisco including:
• 14 Mission 33,000 daily passengers • 22 Fillmore 19,000 daily passengers • 30 Stockton 24,000 daily passengers • 49 Van Ness-Mission 25,000 daily passengers
Life Cycle Costs – 2010 Snapshot: TC Vehicles versus DMC / DHMC Vehicles A review of life cycle costs using 2010 data from multiple sources showed trolley coach service was less expensive than diesel motor coach / diesel hybrid motor coach service by slightly less than $6M dollars. At the individual vehicle level, the 2010 cost difference was in favor of trolley coaches by $19,125. Expenditure categories included the four National Transit Database (NTD) sub-categories of SFMTA data sent annually to FTA, two capital infrastructure “State of Good Repair” long tern capital funding categories (annualized figures), and capital costs of new transit vehicles. The revenue category consisted of FTA fixed guideway funds given to U.S transit agencies with trolley coach operations. In the table, an X marks the more cost effective mode. Trolley Cost Expenditure Category Diesel Coach Cost Coach Diff. (Operations / Capital) Hybrid Coach Diff. X -2.2M NTD – Operations X -6.3M NTD – Energy* X -3.9M NTD – Vehicle Maintenance NTD – Non Vehicle Maintenance X -3.0M X -4.9M NTD – Administration Capital – Substations (annualized) X -1.2M Capital – Overhead & Support (annualized) X -16.5M Capital – New vehicles (local match annualized) X -0.3M Revenue Category X -10.6M FTA – Fixed Guideway Funds X -6.0M Final Total – Fleet Mode - in favor of Trolley coach mode * NTD data lumps energy into the operations sub-category, but it is split out here.

DRAFT DRAFT DRAFT DRAFT DRAFT
3
Although trolley coach NTD costs were cheaper, the annual requirements to be spent on replacement and maintenance of capital infrastructure more than offset the operations savings, which swung the overall cost advantage to the diesel motor coach / hybrid mode. However, when the added revenue of FTA fixed guideway funds was added in, the final outcome swung back to the overall cost advantage being with the trolley coach mode. Maintenance, Reliability, Emissions, Historic Preservation, Public Support Trolley coaches did not perform as well vs. diesel motor coach on maintenance as they did in service costs. NTD 2010 data showed on an individual vehicle average that trolley coaches were 5X as likely to have a “major mechanical system failure, and the SFMTA road call data showed 2X as many calls for trolley coaches. Maintenance of the ETI fleet at SFMTA is affected by difficulties in obtaining replacement parts. ETI is no longer a U.S. company, so some parts must be imported from the Czech Republic in Europe. High costs and customs delays are a recurring problem. Other issues that were analyzed regarding the future of TC service included emissions (TCs are the greenest mode), historic preservation (some TC infrastructure may qualify for protection), and the level of public support for TC service in San Francisco. SECTION 3: THE NEXT GENERATION OF SFMTA TRANSIT VEHICLES The transit vehicle market continues to evolve with many options available to the SFMTA for selection of the next generation of transit vehicles. The report focused on five possible modes:
• Diesel hybrid motor coach (DHMC) • Electric trolley coach (TC) • Battery powered “rapid charge” coach (Proterra) • Dual-Mode coach (dual mode) • Fuel cell coach (fuel cell)
Standard diesel motor coaches (DMC) will not be sought by SFMTA because of local commitments made by the agency to achieve improved emissions levels by 2020. Diesel Hybrid Motor Coach (DHMC) The DHMC transit vehicle with an electric motor backed by a diesel engine and featuring power savings through regenerative braking has moved from pilot to mainstream in less than a decade. It is currently the most common alternative to standard DMC transit vehicles being purchased by U.S. transit agencies.
• DHMCs use either a “series” or “parallel” powerplant / motor system. • The SFMTA has 86 Orion “series” type DHMCs with BAE Systems powerplants. • New York City MTA operates over 1,400 hybrids. • The advantage of a “series” design is that any type of powerplant system can
support the electric motor: diesel or gas engine, electricity (TC wires), fuel cell, etc. • DHMCs cost more than DMCs, but higher fuel mpg of 30-50 percent is a reality. • DHMCs can service routes with steep grades as well as TC vehicles. • A 60’ DHMC cost breakdown: $986K total / $792K FTA / $194K local match.
Electric Trolley Coach (TC) The electric trolley coach (TC) vehicle operates in only six North American cities in 2010. Aside from changing from DC to AC motors, recently procured TCs in San Francisco,
DRAFT DRAFT DRAFT DRAFT DRAFT
4
Vancouver and Philadelphia are very similar to their predecessors, and basic TC infrastructure has changed little as well.
• The SFMTA has 313 TCs which is the largest TC fleet in North America. • TC’s require the presence of a support infrastructure comprised of powered
overhead wires, underground support hardware and power substations, all of which must be maintained in addition to maintenance of the transit vehicles.
• TC vehicles are the most energy efficient and have the lowest energy costs. • TC vehicles are the only “zero emission” vehicle option. • A 60’ TC cost breakdown (SFMTA): $1.5M total / 1.3M FTA / 260K local match.
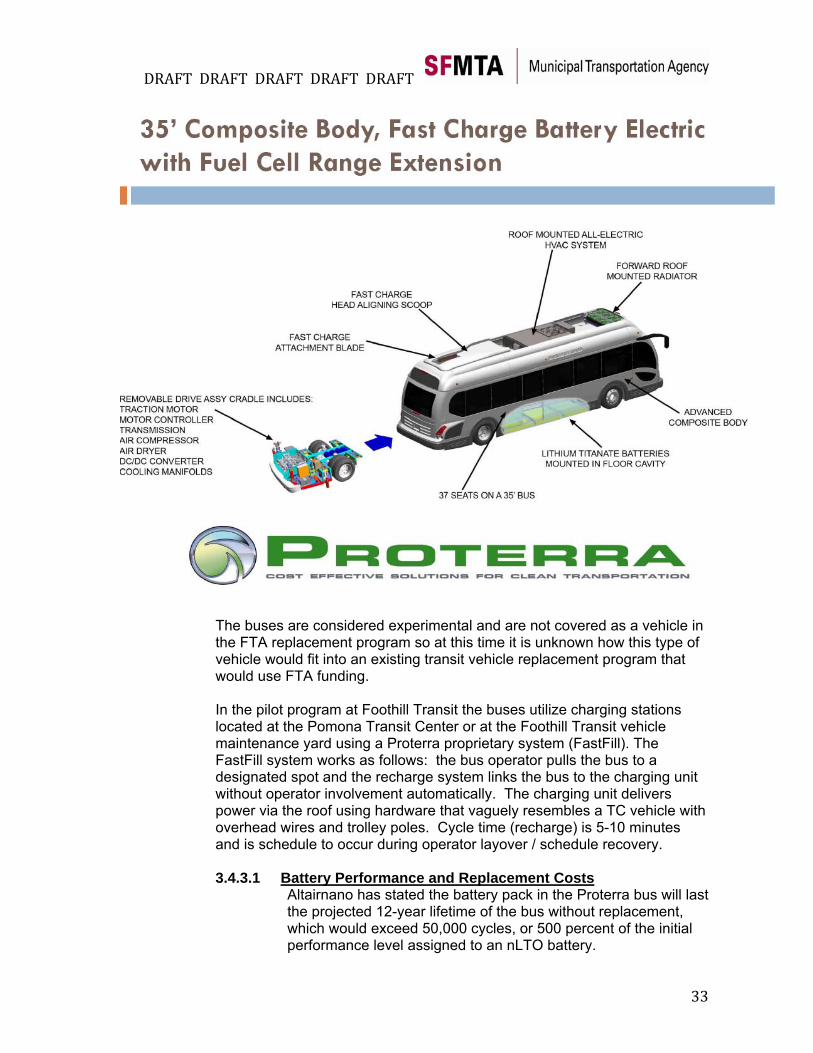
Battery powered “rapid charge” coach (Proterra) The Battery Powered “Rapid Charge” transit vehicle is a new concept, much like hybrids and fuel cells were a decade ago. The Proterra bus (U.S.) is the most advanced of multiple efforts underway around the world. The “rapid charge” concept utilizes power stored in batteries that are recharged frequently during layovers (5-10 minutes) at the end of a service route instead of attempting to charge a bus once overnight and have the charge last throughout an entire day of service.
• A new battery – lithium titinate – is the basis for this vehicle: 2X more expensive than its predecessor, but with 4X-20X durability and performance.
• Battery pack life – too new to know with certainty, but it appears to need replacement 1-3 times during 12-year lifespan – cost of $110,000 (2011).
• Pilot vehicle (35’ bus) Altoona tested – where it achieved 17-29mpg equivalent performance, 5X more efficient than SFMTA Orion hybrid.
• The Proterra bus started active service at Foothill Transit in Los Angeles in fall 2010 – 3 buses in daily operation – goal of 50,000 service hours in one year.
• Proterra expects to produce 80 vehicles in 2011-2012, 42’ model due in 2014. • A 35’ cost breakdown: $1.0M per unit, plus charging unit cost. • The bus is still considered “experimental” – not covered by FTA replacement.
Dual-Mode Coach (Dual Mode) The “Dual-Mode” transit vehicle (DMC and TC) is an existing concept with a mixed past in the U.S. The challenge of fitting together the hardware necessary to operate both modes into one vehicle and vehicle reliability have limited application of this concept. Boston is the only major North America city using a fleet of dual-mode transit vehicles.
• The advent of the DHMC technology may be the catalyst to create a simple and efficient dual-mode transit vehicle.
• As stated above a “series” hybrid can use any source of power to assist the electric motor that powers the vehicle. Diesel engines are the most common.
• It is feasible to equip an existing DHMC “series” hybrid with trolley poles, controller, and other equipment to power the electric motor – all while leaving the existing diesel engine in place.
• The result is a new era dual-mode transit vehicle. • The costs to create a dual-mode are TBD, but can easily be estimated by SFMTA
staff using required TC equipment costs. • Other types of dual-mode are possible: TC / fuel cell, TC / battery bus, etc.
Fuel Cell Coach (Fuel Cell) The Fuel Cell transit vehicle as a concept has existed for a decade, and during that time major advances have been achieved to address major issues: hydrogen production and storage, durability of the fuel cell “stack”, high cost of all elements of the concept. The
DRAFT DRAFT DRAFT DRAFT DRAFT
5
largest U.S. pilot program (12 vehicles) is at AC Transit in Oakland, CA, and the SFMTA is a member of the S.F. Bay Area Zero Emission Fuel Cell Bus Demonstration project.
• Fuel cell stacks durability is 9,000 hours – or 2 years – replacement = $100K. Durability is expected to double or triple by 2028.
• Efficiency is 4.5-7.0 mpg – about 20%-60% better than SFMTA Orion DHMC. • Fuel cell vehicles are “zero emission”. • Fuel cell vehicle cost (2011) is $3.0M. • It is possible for the SFMTA to lease a bus from AC Transit for trial in S.F.
SECTION 4: COORDINATION ON RESEARCH AND POSSIBLE JOINT AGENCY PROCUREMENT OF NEW TROLLEY COACH TRANSIT VEHICLES The concept of joint procurement of the same transit vehicle by two or more transit agencies can speed up vehicle acquisition while also saving money for participating agencies.
• In 2011 three of the six agencies that operate TC vehicles are planning to purchase up to 270 new vehicles by 2016.
• Staff at the SFMTA have exchanged information with staff at King County Metro (Seattle) and the Greater Dayton Regional Transit Authority (Dayton).
• All three agencies started work with the belief that it may be time to replace TC service with another mode – most likely DHMC vehicles.
• All three agencies concluded that TC service was cheaper to operate, and TC life cycle costs were lower than costs of DMC / DHMC service, but only when FTA fixed guideway funds were included in the cost equation.
• Seattle and Dayton have made the decision to replace TC vehicles with new TC vehicles – specifications TBD. The SFMTA is yet to make a decision.
• If SFMTA decides to replace outgoing TC vehicles with new TC vehicles, an opportunity exists to collaborate on design and vehicle procurement with staff at Seattle and Dayton. A decision by the SFMTA is needed by the end of 2011.
SECTION 5: NEXT VEHICLE PROCUREMENT – RECOMMENDED ACTION The SFMTA has initiated planning to replace 60 New Flyer 60’ TC vehicles, and 45 NABI 40’ DMC vehicles. The new vehicles are scheduled to enter service between 2014-2016. The new vehicles will be added to a fleet that is stored and maintained at seven main yards located around San Francisco. Issues exist regarding the adequacy of storage and maintenance space at the yards used by the DMC / DHMC fleet that appear to be critical within the next decade. The SFMTA will need to implement a fully operational transit facility within a decade to support the DMC / DHMC fleet projected to be in place by 2030.
• The SFMTA has $145M dollars (FTA funds / Prop K) to spend on new vehicles. • The Van Ness BRT project may contribute $28M dollars of “Small Starts” funds.
Below are summaries of six recommended actions to be taken by the SFMTA and brief information to support the recommendations.
• Action #1: Activate the Fleet Management Team o The multi-division team will further analyze the issues and make more
detailed recommendations regarding the proposed actions below and other actions as are necessary
• Action #2: Preserve Trolley Coach service at SFMTA o TC vehicles are cheaper to operate than DMC / DHMC vehicles o TCs are “zero emission”, energy efficient, and enjoy public support o Consider not using TC’s on Van Ness BRT due to other reasons
DRAFT DRAFT DRAFT DRAFT DRAFT
6
• Action #3: Select a Vehicle Option Within the SFMTA Budget and with a High Probability of Success
o Do not select an ALL TC vehicle option for Van Ness BRT $43M-$62M shortfall in capital infrastructure funds for Van Ness
o Select a mixed mode (TC and DHMC) Continues existing service operations – but modernized This is the option proposed in Van Ness BRT EIS/EIR Preserves TC service 5 door design implementation may be risky / costly
o Select an all DHMC vehicle option for Van Ness BRT if a mixed mode option is not selected
Simplest option – and 3 door or 5 door designs are possible 3 door design is estimated at $30M less than 5 door design
• Action #4: Secure Funds for New Technology Pilot Transit Vehicle Programs o Pilot A: TC vehicle using a “series” hybrid motor placed in an existing
SFMTA Orion DHMC Test concept that one powerplant system can supply both DHMC
vehicles and TC vehicles If pilot project verifies feasibility and performance, the savings in
maintenance, training, spare parts, etc. is possibly significant because both TC and DHMC vehicles would be using the same electric motor and powerplant systems.
o Pilot B: Dual-Mode transit vehicle Similar to pilot vehicle proposed above, except the diesel engine in
the DHMC is retained along with the new electric poles, controller, etc.
Same as above, if pilot vehicle verifies feasibility, the maintenance savings, and greater opportunities in service operations could transform SFMTA service planning and operations
o Pilot C: Proterra “Rapid Charge” Battery Bus Pilot project at Foothill Transit in Los Angeles, and pilot projects
planned in other cities have been 100% grant funded As much as Pilot A may be the next TC mode evolution, the Proterra
bus may be the next evolution after Pilot A. If a pilot proves successful, the SFMTA has more of the electric
hardware and infrastructure in place to operate a fleet of these vehicles than any other city in North America.
o Pilot D: Fuel Cell Lease from AC Transit The proximity to AC Transit, the leader in U.S. fuel cell operations
among active transit agencies, presents an opportunity for the SFMTA to rigorously test this vehicle mode at a minimal cost and with access to maximum maintenance knowledge.
• Action #5: Study Feasibility of Transit Vehicle Sustainability Program o FTA requires transit vehicles to last 12-15 years and then pays 80% of
funding to allow for purchase of new vehicles – local match is 20%. o Guaranteed replacement funding can be a disincentive for good
maintenance – leading to adoption of an informal “turn and burn” policy. o SFMTA exceptions to this non-sustainable policy include fleet management
of the cable cars and the historic streetcars. o The agency should analyze if a more sustainable approach to bus and
trolley coach management with a goal of longer vehicle life would be a positive monetary and environmental policy.
DRAFT DRAFT DRAFT DRAFT DRAFT
7
• Action #6: Obtain Property for a New Transit Vehicle Facility o The SFMTA will need to open a new transit facility for DMC / DHMC
vehicles prior to 2030. The shortage of storage and maintenance space that is already present will only become worse during the next decade.
2030 facility needs = a space shortage of 66 40’ length DHMCs. 2030 facility needs = a space shortage of 28-75 60’ length DHMCs. 2030 facility needs = a space shortage of 14 TC vehicles.
There are many questions to be answered by the SFMTA concerning vehicle procurement, funding strategies, long term facility management, etc., in the near future. This report will be a resource to help provide information to managers and staff to address these questions.

DRAFT DRAFT DRAFT DRAFT DRAFT
8
DRAFT DRAFT DRAFT DRAFT DRAFT
9
SECTION 1
THE TROLLEY COACH TRANSIT MODE IN NORTH AMERICA Introduction The electric trolley coach has been in existence for over 70 years throughout the world, but their peak use in North America was over 50 years ago when they replaced electric streetcars in many locations after the end of World War II. They currently are a popular transit mode in Eastern Europe and to a lesser extent in Western Europe, but they have almost disappeared in Asia and in North America. 1.1 Conceptual Summary of Plusses and Minuses of Trolley Coach Service 1.1.1 The greatest plusses of the Trolley Coach mode 1.1.2 The greatest minuses of the Trolley Coach mode 1.2 Trolley Coach Use in North America 1.2.1 TC Plus: Fixed Guideway Funding
1.2.2 TC Minus: Only one U.S. / Canada Trolley Coach Supplier
1.1 Conceptual Summary of Pluses and Minuses of Trolley Coach Service
Over the last 50 years the trolley coach (TC) has almost disappeared in North America. Today only 910 trolley coaches remain in service in six cities: • San Francisco, 313 vehicles • Seattle, 259 vehicles • Boston, 60 vehicles • Philadelphia, 38 vehicles • Dayton Ohio, 54 vehicles • Vancouver, Canada. 266 vehicles The TC mode (a.k.a. trolley bus, trackless trolley), offer many desirable features, but they also possess many limitations that lessen their attractiveness in comparison to the diesel motor coach (DMC) mode and the diesel hybrid motor coach (DHMC) mode. They require unique elements that very few transit agencies possess: special equipment, staff to address a host of specialized operations and maintenance tasks, institutional knowledge of operation characteristics unique to the mode, etc. During the past 50 years no transit agencies in North America have implemented a new TC system, but several cities have ended TC service and transitioned to DMC service.
1.1.1 The greatest plusses of the TC mode:
• zero emissions on street in service • far lower “fuel”(electricity) costs than motorcoach “fuel” (diesel) • higher energy “efficiency” vs. electric hybrid motorcoach • quiet operation • lower overall operations costs • superior ability to climb hills with heavy passenger loads • ability to utilize FTA capital fixed guideway funds
DRAFT DRAFT DRAFT DRAFT DRAFT
10
1.1.2 The greatest minuses of the TC mode: • unattractive view of overhead wires and support system, • limited operation flexibility (limited to overhead wire system) • staff personnel and costs associated with overhead wire
maintenance • greatly diminished presence in service in the U.S. and Canada • only one transit vehicle manufacturer continues to offer units for sale in
U.S. and Canada 1.2 Trolley Coach Use in North America
Three North American cities, all located on the west coast, are home to over 80% of remaining TC service on the continent. These cities, San Francisco, Seattle and Vancouver, Canada, possess similar attributes that favor TC service: • routes operating in hilly topography that benefit from use of electric propulsion, • cheap electricity generated by hydro electric supplies, and • public support for the benefits of the mode that are listed above.
(e.g. quiet operations, zero emission at the vehicle and at the power generation source).
Two items of note worth a brief discussion in greater detail are the issue of FTA fixed guideway funding, and the lack of TC vehicle suppliers in North America.
1.2.1 TC Plus: Fixed Guideway Funds
Transit agencies that operate TC services are eligible to receive Federal Transit Administration (FTA) funds known as “fixed guideway funds” which are used to assist with capital infrastructure costs, certain types of maintenance and procurement of new specialized vehicles. DMC and DHMC service, and the routes they serve are not eligible to seek these funds.
1.2.2 TC Minus: Only one U.S. / Canada Trolley Coach Supplier Available options for new TC vehicle procurement to U.S. agencies are limited by “Buy America” restrictions. Recent experience shows most new transit vehicles are comprised of parts from several sources under the umbrella of one lead manufacturer. Although it is possible that an RFP for new TC vehicles will see a coalition of companies get together to win the contract, at this time The New Flyer Co. is the only TC manufacturer in North America that meets Buy America restrictions, and that has a history of manufacturing TC vehicles.
DRAFT DRAFT DRAFT DRAFT DRAFT
11
SECTION 2
EXISTING CONDITIONS OF THE SFMTA TROLLEY COACH FLEET Introduction This section presents facts, history and a summary of existing conditions of the Trolley Coach fleet at SFMTA. The existing conditions focuses on fleet information, performance (cost, emissions, reliability), and special factors. 2.1 A History of Trolley Coaches at the SFMTA 2.2 Current SFMTA Trolley Coach Operations 2.3 Life Cycle Costs at SFMTA: TC Service vs. DMC / DHMC Service
2.3.1 NTD Data : TC Service Costs Less than DMC / DHMC Service 2.3.2 NTD Data: Operations Costs including Energy 2.3.3 NTD Data: Non Operations 2.3.4 Capital Costs: SFMTA State of Good Repair TC Infrastructure 2.3.5 Capital Costs: Local Match – Vehicle Replacement Funding 2.3.6 Capital Costs: Fixed Guideway Grant Funding – FTA 2.3.7 Summary of 2010 Life Cycle Analysis and Mode Cost Comparison in the
Future 2.4 SFMTA Maintenance Challenges with ETI and New Flyer TC Fleets 2.4.1 NTD Data: TC Failure Rate
2.4.2 SFMTA Road Call Data – TC Fleet 2.4.3 TC Fleet: ETI Spare Parts Supply Line Challenges 2.5 Environmental Issues: Emissions and Historic Preservation 2.5.1 Emissions 2.5.2 Historic Preservation 2.6 San Francisco Public Support for TC Service 2.1 A History of Trolley Coaches at the SFMTA
SFMTA has operated TC service in San Francisco since 1944 when Muni took over TC routes operated by Market Street Railway since 1935. Between 1947-1952 over 380 TCs built by the Marmon-Herrington Co. and St. Louis Car Co. were acquired, and they were the preferred choice to replace streetcars and cable cars on slow and busy routes, and many of the steep and hilly routes present in S.F. This fleet was replaced by 343 TCs built by the Flyer Co. in 1975-76, and in turn the mid-70’s fleet was replaced in stages between the mid 1990s and early 2000s by TCs that comprise the current fleet.
In 2011 the SFMTA TC fleet makeup features a total of 313 vehicles: • 40 New Flyer Co. articulated 60’ length (1994) • 33 ETI Co. articulated 60’ length (2000) • 240 ETI Co. 40’ standard length TCs (2002-2003) The 40 New Flyer 60’ artic. units are scheduled for replacement by 2016, and all of the ETI’s (artic. 60’ length and 40’ length) are scheduled for replacement in 2019-2022. An additional 20 60’ length units were present at SFMTA (1994 60’ New Flyer), but were retired early due to performance issues, so the 2016 replacement will be for 60 vehicles.
DRAFT DRAFT DRAFT DRAFT DRAFT
12
The SFMTA ETI vehicles are equipped with batteries (auxiliary power unit or APU) to store power so they could operate offline for a short distance: a few blocks (hills) to several blocks (flat). Although they included battery power, the ETI’s were not designed as hybrids. ETI, which was a new vehicle supplier comprised of multiple companies and led by Skoda of the Czech Republic ceased U.S. operations between 2006-2009. This has negatively impacted both SFMTA and the GDRTA of Dayton, OH, which purchased 53 40’ length ETI TCs in 1993.
2.2 Current SFMTA Trolley coach Service Operations
SFMTA operates TCs on 14 service routes, including some of the slowest routes with the heaviest ridership in San Francisco: • 14-Mission 33,000 daily passengers • 22-Fillmore 20,000 daily passengers • 30-Stockton 24,000 daily passengers • 49-Van Ness/Mission 25,000 daily passengers TCs are maintained at two SFMTA facilities: Presidio Yard (ca.1912 - originally a streetcar yard), and Potrero Yard (ca. 1916 – originally a streetcar yard). Although both yards and affiliated structures have received upgrades and some seismic retrofit, they are both very old facilities, and neither facility has space for a modest sized fleet expansion. This info is summarized in table form in Table 2-1 below.
Table 2-1: SFMTA Existing Trolley Coach Vehicle Information SFMTA Trolley Coach Service Summary Table Existing Fleet
Divisions: 2 Potrero Yard 40’ & 60’ capacity = 191 vehicles on-site = 157
Presidio Yard 40’ capacity = 165 vehicles on site = 156 356 vehicles on site = 313 TC Vehicle Size 40’ 60’ artic._______ Number of Vehicles / Size: 240 – 40’ / *73 – 60’ (20 retired early) Replacement Schedule 40’ 60’ artic._______
105 in 2019 60 in 2014 55 in 2020 33 in 2023 80 in 2023 2.3 Life Cycle Costs at SFMTA: TC Service vs. DMC / DHMC Analysis
The following four sources of information were used to create a life cycle cost analysis for the TC mode and the DMC / DHMC mode as operated at SFMTA:
• SFMTA National Transit Database (NTD) data submitted to FTA • Capital cost data from the SFMTA State of Good Repair Report • Capital cost estimates of required local match funding (20%) for new buses • Information on the FTA Fixed Guideway Funds granted to SFMTA
Using these sources, a 2010 snapshot of operations and capital costs for both the TC and the DMC / DHMC modes was created for this report. Due to differences in mode fleet size, vehicle type lifespan, and cost categories, the clearest manner to
DRAFT DRAFT DRAFT DRAFT DRAFT
13
portray a detailed summary of cost information was at the individual vehicle level. The calculations showed it cost $19,125 less to operate a TC vehicle in 2010 at SFMTA. See Table 2-2. A detailed cost breakdown is shown in Figure 2-1.
Table 2-2: 2010 SFMTA Life Cycle Costs at the Individual Vehicle Level DMC / DHMC vs. TC Operations Costs per Vehicle
• $534,173 DMC / DHMC • $515,048 TC The difference in costs in favor of TC service when viewed at the fleet level equaled a “savings” in the 2010 expenditures of $5,985,117 to SFMTA. See Table 2-3.
Table 2-3: 2010 SFMTA Life Cycle Costs at the Fleet Level by Mode
Trolley Cost Expenditure Category Diesel Coach Cost Coach Diff. (Operations / Capital) Hybrid Coach Diff. X -2.2M NTD – Operations X -6.3M NTD – Energy* X -3.9M NTD – Vehicle Maintenance NTD – Non Vehicle Maintenance X -3.0M X -4.9M NTD – Administration Capital – Substations (annualized) X -1.2M Capital – Overhead & Support (annualized) X -16.5M Capital – New vehicles (local match annualized) X -0.3M Revenue Category X -10.6M FTA – Fixed Guideway Funds X -6.0M Final Total – Fleet Mode – in favor of Trolley Coach mode * NTD data lumps energy into the operations sub-category, but it is split out here.
An easier way to view the findings is to state that using 2010 cost figures, if all TC service operated by SFMTA were to be provided by DMC / DHMC vehicles, the service provided by the DMC / DHMC vehicles would have cost almost $6 million dollars more than the TC service actually did cost. The data comprised from the four categories showed that TC service was $15.0 million dollars less expensive than DMC / DHMC service when only NTD costs of service operations were calculated, but became $4.3 million dollars more expensive when estimated annual capital costs to maintain a State of Good Repair for TC infrastructure were added to the equation. The balance shifted back in favor of TC service by slightly less than $6 million dollars when the FTA allotment of Fixed Guideway Funds were added to the equation. The impact of estimation of annual capital costs for new vehicles slightly favored DMC / DHMC service, but did not impact the final outcome in the same manner as the other three categories.
The SFMTA findings are similar to results obtained by the Greater Dayton Transit
Commission in Dayton, OH, and by King County Metro in Seattle when they analyzed the same question. Both transit agencies reached the conclusion that retention of TC service was warranted, but a key element in the cost equation was continued receipt of FTA Fixed Guideway Funding.
DRAFT DRAFT DRAFT DRAFT DRAFT
14
The next several paragraphs following the costs per vehicle per mode graph below
go into greater detail on data and findings obtained from the four cost categories. Figure 2-1: SFMTA 2010 Per Vehicle Costs - TC vs. DMC / DHMC

DRAFT DRAFT DRAFT DRAFT DRAFT
15
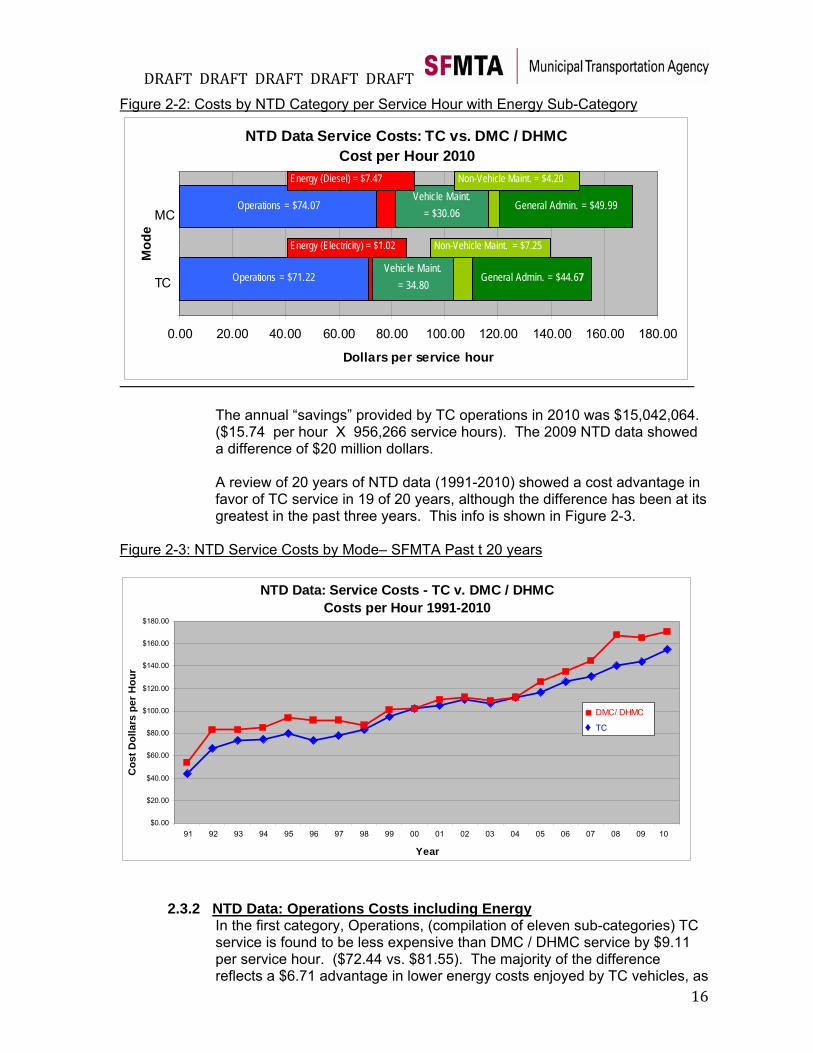
2.3.1 NTD Data : TC Service Costs Less than DMC / DHMC Service Overall service costs are lower for TC service at SFMTA than for DMC or DHMC service based on analysis of NTD data. NTD data is a set of information that is sent annually to FTA by all U.S. transit agencies. NTD data is separated into four categories: • Operations, • Maintenance, • Non-Vehicle Maintenance, and • General Administration These four categories generally represent a snapshot of “fully loaded costs” of operations of a transit mode at a transit agency in the U.S.
Table 2-3 below shows the outcome of analysis of SFMTA 2010 NTD Section 15 data. The column at far right shows a difference of $15.73 per service hour in favor of TC service, and an adjusted service miles difference of $2.37 per service mile in favor of TC service. These outcomes were achieved by division of total cost per mode by the total annual hours of operation by mode, and the adjusted service mile figure carried the equation a step further as explained in the note under Table 2-4 shown below.
Table 2-4: Overall SFMTA Costs by Mode per Service Hour / Service Mile
2010 SFMTA NTD Data TC DMC / DHMC Difference Service Hour $154.82 $170.56 (+15.73 per hour) Service Mile $ 23.34 $ 19.81 N/A – see note Adjusted Service Mile* $ 23.34 $ 25.71 (+2.37per mile) Adjusted service mile cost achieved by “slowing down” DMC / DHMC avg. mph toTC speed, and then recalculating total hours required to provide the same service if all TC hours were replaced with DMC / DHMC service to get a revised annual total. A “speed up” of TC service to equal DMC / DHMC mph obtains a similar result with the TC service being less expensive per service mile than the DMC / DHMC service.
The 2010 data below in Table 2-5 shows that in three of the four NTD categories, the SFMTA TC fleet was less expensive than the SFMTA combined DMC / DHMC fleet. This data is graphed in Figure 2-2.
Table 2-5: Costs by NTD Category per Service Hour with Energy Sub-Category
NTD Category TC DMC / DHMC Difference Operations $ 72.44 $ 81.55 (+9.11 per hour) Non-Energy $ 71.22 $ 74.07 Energy $ 1.02 $ 7.47 Maintenance $30.66 $34.80 (+4.14 per hour) Non-Vehicle Maint. $ 7.25 $ 4.20 (-3.05 per hour) General Administration $44.67 $49.99 (+5.32 per hour) Total $82.58 $88.99 (+15.73 per hour)
DRAFT DRAFT DRAFT DRAFT DRAFT
16
Figure 2-2: Costs by NTD Category per Service Hour with Energy Sub-Category
NTD Data Service Costs: TC vs. DMC / DHMC Cost per Hour 2010
Operations = $74.07
Operations = $71.22
Vehicle Maint. = $30.06
Vehicle Maint. = 34.80
General Admin. = $49.99
General Admin. = $44.67
0.00 20.00 40.00 60.00 80.00 100.00 120.00 140.00 160.00 180.00
1
2
Mod
e
Dollars per service hour
Energy (Diesel) = $7.47 Non-Vehicle Maint. = $4.20
MC
TC
Energy (Electricity) = $1.02 Non-Vehicle Maint. = $7.25
The annual “savings” provided by TC operations in 2010 was $15,042,064. ($15.74 per hour X 956,266 service hours). The 2009 NTD data showed a difference of $20 million dollars. A review of 20 years of NTD data (1991-2010) showed a cost advantage in favor of TC service in 19 of 20 years, although the difference has been at its greatest in the past three years. This info is shown in Figure 2-3.
Figure 2-3: NTD Service Costs by Mode– SFMTA Past t 20 years
NTD Data: Service Costs - TC v. DMC / DHMC Costs per Hour 1991-2010
$0.00
$20.00
$40.00
$60.00
$80.00
$100.00
$120.00
$140.00
$160.00
$180.00
1 2 3 4 5 6 7 8 9 10 11 12 13 14 15 16 17 18 19 20
Year
Cos
t Dol
lars
per
Hou
r
91 92 93 94 95 96 97 98 99 00 01 02 03 04 05 06 07 08 09 10
■ DMC/ DHMC
♦ TC
2.3.2 NTD Data: Operations Costs including Energy In the first category, Operations, (compilation of eleven sub-categories) TC service is found to be less expensive than DMC / DHMC service by $9.11 per service hour. ($72.44 vs. $81.55). The majority of the difference reflects a $6.71 advantage in lower energy costs enjoyed by TC vehicles, as
DRAFT DRAFT DRAFT DRAFT DRAFT
17
/
Although energy costs are not a majority of the Operations category costs,
e ic
herefore, a $2 increase in diesel fuel (e.g. $3 per gallon to $5 per gallon)
l
n an annual level, a $2 increase in diesel fuel costs per gallon would
able 2-6: Calculation of Energy Costs (Electricity and Diesel Fuel)
detailed in Table 2-6 below, but even after energy costs are removed, TC fleet operations costs of ($71.27 hr.) remain lower than costs for the DMC DHMC fleet combination ($74.07 hr.).
they are important to separate out, both to understand the differences between modes, and because of the relative volatility of fossil fuel in thcurrent economic environment. Electricity costs produced via hydroelectrpower are expected to remain steady, but in early 2011 fossil fuel costs are tending to increase. Twould result in a 20 percent increase in the cost difference between modesin the NTD Operations category in favor of TC service, and a 13 percent increase in the cost difference between modes in the combined total of alfour NTD categories, again in favor of TC service. Oincrease the operations budget by about $7 million dollars.
T
Energy costs (hydro-electric power vs. diesel fuel) o Hydro power (electricity) = $0.05 cents per kilowatt hr (Kwh) (Hetch Hetchy cost 2010)
99 per service hr.(Hetch Hetchy-SF cost) X 3.0 Kwh per mile X 6.6 avg. mph = $0. X 1.0297 (add 0.297 deadhead hours) = $1.02 per service hr. o Fossil fuel energy (diesel fuel) =
llons per hour (Nov. 2010 SFMTA fleet average)
$7.48 per service hr.
$3.00 gallon X 2.42 ga = $7.26 per service hr. X 1.0297 (add 0.297 deadhead hours) =
he end result is that electricity to power TC vehicles costs SFMTA about
e
2.3.3 NTD Data: Non Operations
(7.95 mph / 2.42 gallons per hr = 3.28 mpg fuel economy) T$1.02 cents per service hour, while diesel fuel costs SFMTA about $7.48 per service hour (per the averaged figure obtained above). Nationwide thaverage cost for electricity is about $0.12 cents per kWh which results in a cost of $2.38 per service hour. The energy costs overwhelmingly favor the TC mode.
ice costs for TC vehicles is not focused on
he advantage appears to be present due to lower overall maintenance costs associated with TC service, and the TC advantage continues to be
The overall advantage in servonly one area of NTD data. Analysis of the three NTD categories focused on Maintenance and Administration, which comprise about 50 percent of total costs, show TC service ($82.58 per hr.) to be less expensive than thecombined DMC / DHMC service ($88.99 per hr.). T
DRAFT DRAFT DRAFT DRAFT DRAFT
18
ice )
cture maintenance costs are reflected in the Non-Vehicle aintenance category, which was the only NTD category where TC service
Table 2-7 - NT
present after maintenance of fixed infrastructure associated with TC serv(overhead wires, power sub-stations, underground electrical systems, etc.are factored in. The fixed infrastruMcosts were greater than DMC / DHMC costs. This data in the form of costs per service hour is shown in Table 2-7 below which is the same as Table 2-5 with the Operations cost category removed.
D Costs: Non-Operations Categories
NTD Category TC DMC / DHMC Difference
intena ce hour) Maintenance $30.66 $34.80 (+4.14 per hour) Non-Vehicle Ma n $7.25 $4.20 (-3.05 per General Administration $44.67 $49.99 (+5.32 per hour) Total $82.58 $88.99 (+6.41 per hour)
revie of su mary n of S wed is cheaper and faster to repair an electric motor with a few
er there
2.3.4
A w m informatio FMTA maintenance records shothat generally itmoving parts than it is to repair a diesel engine and transmission combination. TC vehicles also require less brake maintenance than DMC vehicles, but DHMC vehicles are about the same as TCs. Howevare other maintenance issues that impact the analysis of the two modes.
Capital Costs: SFMTA State of Good Repair TC Infrastructure The second category of analyzed costs were capital costs associated with
al capital
associated with vehicle aintenance and storage facilities. For the purposes of this report, the
ms: es:
fans,
ces. TC service quires a significant infrastructure to support operations. A similar level of
ture verhead wires, support poles, electric substations, duct banks and
d
maintenance of SFMTA capital infrastructure. The addition of annucosts to maintain TC infrastructure transforms the TC service cost advantage of $15.0M dollars over DMC / DHMC service into an annual deficit of approximately $2.0M dollars. Both modes of service have capital costsmsimilarities between facilities (building structures and internal systeHVAC, electrical, plumbing, etc.), are assumed to outweigh the differencelectrical overhead, poles, etc. vs. fuel tanks and fuel delivery, exhaust etc., so facility replacement systems are assumed to be approximately the same between modes. Therefore they are not addressed as a separate capital costs that can be compared between modes. Capital costs beyond vehicle facilities did show differenreinfrastructure is not required to support DMC / DHMC service. NTD data only captures maintenance costs affiliated with infrastructure, requiring capital replacement costs to be determined from a separate source. At the SFMTA, the capital costs affiliated with replacement of infrastruc(ounderground wiring systems) were obtained from the recently completed State of Good Repair report (2010). Analysis of replacement costs antimelines contained in the State of Good Repair report showed a required
DRAFT DRAFT DRAFT DRAFT DRAFT
19
r
f the capital costs were associated with replacement of verhead wires, support poles, duct banks and underground wiring
2.3.5 e Replacement Funding
annual commitment of $17.1M dollars to sustain infrastructure needed foTC operations. The vast majority oosystems. Replacement of electric substations was a much smaller component of required capital costs.
Capital Costs: Local Match – Vehicl The third category of analyzed costs were those associated with the
icle t local tching
ssumed for both transit vehicle izes in both modes (the existing DHMC fleet size and an expanded TC
to
Table 2-8 – Ne
acquisition of new transit vehicles. The standard new transit vehreplacement formula is based upon an 80 percent federal / 20 percenmatch, with the federal funds comprised of Section 5309 funding. Malocal funds can be provided by one of many sources (e.g. grant funding, local tax, general revenue funds, etc.). In this analysis, new vehicle costs were asfleet size were used for numbers of vehicles), and costs were split 80 / 20get the required local match amount. The new vehicle costs approximaterecent SFMTA estimates. The local match amount was then divided by the expected lifespan of the vehicle (15 years for TC vehicles / 12 years for DHMC vehicles) to achieve an equalized annualized cost. See Table 2-8. w Vehicle Assumptions to Estimate Capital Costs
al Years Annual Mode Length Est. cost 80% Fed 20% Loc
) taled $6,400,000 annually ($17,778 avg. annually per vehicle), and the
2.3.6 Guideway Grant Funding – FTA
TC 40’ $1.25M $1.00M $0.25M 15 $16,667 DHMC 40’ $0.75M $0.60M $0.15M 12 $12,500 TC 60 ‘ $1.50M $1.20M $0.30M 15 $20,000 DHMC 60’ $1.00M $0.80M $0.20M 12 $16,667
The new transit vehicle local match capital cost total for TC vehicles (360tolocal match for DHMC vehicles (453) totaled $6,104,170 annually ($13,475avg. annually per vehicle), for a difference in favor of the DHMC mode by $296,000 annually.
Capital Costs: Fixed The fourth category of data used to develop a cost comparison between
ixed Guideway t of
d in 010 the SFMTA received $10,640,000 in funds to be used on TC capital
n,
modes is not a cost element, but a funding source. FTA FFunding, provided through the Transit Capital Investment Program (a parSection 5309 funding), provides funds to be used for capital projects on transit service that utilizes fixed guideway (rail, overhead wire, etc.). TC service is an applicable mode to receive fixed guideway funding an2projects. The SFMTA has followed a capital projects implementation plan for several years that prioritizes the expenditure of these funds on an individual project basis, so in any given year an amount greater or less thanthe amount received may be spent, but for purposes of cost comparisothe key figure is the annual amount received from the FTA.

DRAFT DRAFT DRAFT DRAFT DRAFT
20
2.3.7 Summary of 2010 Life Cycle Analysis and Mode Cost Comparison in the Future As stated in Section 2.3.1, analysis of 2010 data shows TC service is less expensive than DMC / DHMC service. The difference in costs in favor of
if the operations cost advantage of TC’s in ombination with fixed guideway funding will continue to exceed the cost
2.4 SFMTA
TC service equaled a “savings” in the 2010 expenditures of $5,985,117 to the SFMTA. However, the SFMTA will replace DMC vehicles with DHMC vehicles during the next decade, and the more fuel efficient vehicles will lessen the operations cost advantage of TC vehicles. New 60’ artic. DHMCvehicles will not equal mileage and cost profiles of 30’ and 40’ DHMC vehicles, but they will be an improvement over the existing 60’ DMC vehicles that will be replaced. It is too speculative to estimatecadvantages of DHMC vehicles in capital expenses. Maintenance Challenges with ETI and New Flyer TC Fleets
Although analysis of TC operations data shows it to be less expensive than DMC / bility to be
MTA Maintenance staff within the Transit
Division is poor. Anecdotal comments show the majority of managers prefer DMC /
DHMC service, maintenance data for TC service shows overall fleet relialower than for the DMC / DHMC fleet.
The reputation of TC vehicles among SF
DHMC vehicles over TC vehicles if given a choice between the two modes. The old age of the 60’ articulated fleet of New Flyer TC vehicles (1994) presents an ongoing maintenance challenge, while the ETI fleet (2000-2003) has had reliabilityissues that started soon after they were placed into service.
2.4.1 NTD Data: TC Major Failure Rate The 2010 NTD data showed the SFMTA TC fleet maintenance performance
t. TC vehicles were 5X more likely to
Table 2-9: TC Failures
was inferior to the DMC / DHMC fleebreakdown than DMC / DHMC vehicles. See Table 2-9. vs. DMC / DHMC Failure Rate: Major Mechanical System
icle Avg.Mode Number Fleet Size Per Veh
The SFMTA Maintenance staff categorized a “major mechanical system
ilure” as – a vehicle is unable to enter or complete a day of transit ut
hicle.
the outcome raises the question of whether there is a correlation between
TC 3,126 313 9.99 DMC / DHMC 954 453 2.11
faservice. Although these vehicle failures were not evenly spaced throughothe year, or evenly spaced among individual vehicles, for purposes ofshowing the disparity between modes, an even distribution showed 9.99 major mechanical system failures per TC vs. 2.11 per DMC / DHMC ve
The issues behind this finding should be an area of more research, because
lower maintenance costs and a higher equipment failure rate associated with TC service?
DRAFT DRAFT DRAFT DRAFT DRAFT
21
ith electric motor) and energy delivery system (OCS wires,
trievers, trolley poles, trolley shoes, etc.) as compared to the propulsion
being
2.4.2 S
Although it is simpler, anecdotal arguments associate a higher “fragility” wthe TC propulsion (reand energy delivery systems in a DMC (diesel engine and transmission). If any problem arises with the electrical system, even if unrelated to propulsion, a TC is likely to be sidelined and unable to continue service, whereas a DMC with a non severe-engine or transmission problem can often make it to the end of a trip or the end of a service day before taken out of service for repair.
FMTA Road Call Data – TC Fleet Aside from the NTD failure rate, basic repair log information provided by SFMTA Maintenance staff show the ETI fleet and the old 60’ New Flyer fleet
aintain. The data log shows the road e
Table 2-10: TC
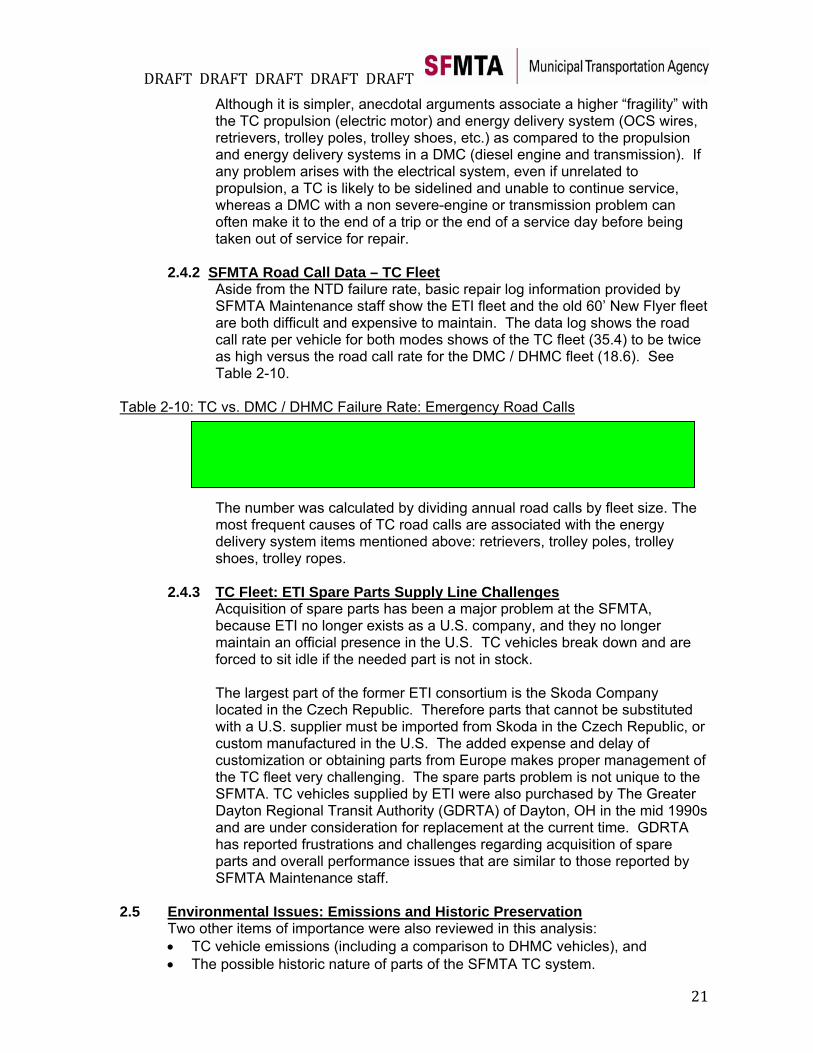
are both difficult and expensive to mcall rate per vehicle for both modes shows of the TC fleet (35.4) to be twicas high versus the road call rate for the DMC / DHMC fleet (18.6). See Table 2-10. vs. DMC / DHMC Failure Rate: Emergency Road Calls
ode Total Road Calls Fleet Size Avg. per vehicleM
35.4
ividi nu l road calls by fleet size. The cal a ociate with ergy
elivery system items mentioned above: retrievers, trolley poles, trolley
2.4.3
TC 11,080 313 DMC / DHMC 8,425 453 18.6
The number was calculated by d ng an amost frequent causes of TC road ls are ss d the endshoes, trolley ropes. TC Fleet: ETI Spare Parts Supply Line Challenges Acquisition of spare parts has been a major problem at the SFMTA,
ecause ETI no longer exists as a U.S. company, and they no longer reak down and are
t cannot be substituted ith a U.S. supplier must be imported from Skoda in the Czech Republic, or
f
reater
2.5 Enviro
bmaintain an official presence in the U.S. TC vehicles bforced to sit idle if the needed part is not in stock. The largest part of the former ETI consortium is the Skoda Company located in the Czech Republic. Therefore parts thawcustom manufactured in the U.S. The added expense and delay of customization or obtaining parts from Europe makes proper management othe TC fleet very challenging. The spare parts problem is not unique to the SFMTA. TC vehicles supplied by ETI were also purchased by The GDayton Regional Transit Authority (GDRTA) of Dayton, OH in the mid 1990s and are under consideration for replacement at the current time. GDRTA has reported frustrations and challenges regarding acquisition of spare parts and overall performance issues that are similar to those reported by SFMTA Maintenance staff.
nmental Issues: Emissions and Historic Preservation Two other items of importance were also reviewed in this analysis: • TC vehicle emissions (including a comparison to DHMC vehicles), and
. • The possible historic nature of parts of the SFMTA TC system
DRAFT DRAFT DRAFT DRAFT DRAFT
22
he SFMTA as relied on the presence of zero emission electric powered LRV and TC vehicles
on tructure network, some of which dates to streetcar
perations and is almost 100 years old.
The first issue is a concern of the SFMTA, because the agency made a commitment to be zero emission by the end of the decade. To date thin combination with procuring some of the cleanest diesel buses to progress toward the 2020 goal, but meeting the goal is a challenge. Although diesel buses emit afraction of the emissions they did only a decade ago, TC service remains cleaner and greener than the best DHMC vehicles. It is a key positive attribute that is a cornerstone of TC service. The second issue is concerned with the possible findings of historic significance parts of the existing TC infraso 2.5.1 Emissions
TC vehicles at the SFMTA are celebrated as zero emission vehicles. The fact is displayed right on the sides of the vehicle for the general public to
ission vehicle.” Greenhouse gases consist of:
),
Of the five gases, by far the greatest concern in California and in many other places is CO2.
, and st of the electricity needed to supply the TC
fleet from the Hetch Hetchy hydroelectric power generation facility in
r
by decaying plant materials in the water at the storage reservoir.
s Evaluation
see: “zero em• H20 (water), • C02 (carbon dioxide), • NOX (nitrous oxide), • CH4 (methane• O3 (ozone)
TC vehicles don’t produce these emissions while in revenue servicebecause SFMTA obtains mo
Yosemite (estimate is 80 percent or more), greenhouse gas emissions at the power source are believed to be as low as possible. By comparison, emissions from TC service in Dayton, OH are higher because power is provided by a coal-fired energy plant.
However, hydroelectric power is not an absolutely zero emission powesource as some emissions (CO2 and CH4) are produced
After accounting for differences in power utilized by the respective hybrid and TC fleets, the 2011 King County Trolley Bu report showed that DHMC vehicles produced higher pollutants than TC vehicles in the four
categories listed below: DHMC higher emissions than TC
• volatile organic compounds (VOC) 600%, • particulate matter (PM10) 500%
600%
The inf etail nd sh an estimated amount of emissio
• nitrous oxide (NOX) • carbon dioxide (CO2) 1500% ormation did not go into d a owns produced by an individual vehicle.
DRAFT DRAFT DRAFT DRAFT DRAFT
23
M by 99 percent since 1999
hen the newer 40’ buses began to be phased into the fleet (NABI and
MC vehicles below:
At SFMTA preliminary analysis has been performed on CO2, NOX, and Pemissions. PM emissions have been reducedwNeoplan). More detailed CO2 analysis, reached down to produce estimates at the individual vehicle level of detail. The figures below show a comparison using Seattle model first, and list individual emissions for TC, DHMC and D DHMC higher emissions than TC
• carbon dioxide (CO2) 200%
CO2 emissions per hour Vehicle Mode – Est. Single vehicle
• DHMC 50 lbs.
2.5.2 Histori
• DMC 80 lbs.
• TC 25 lbs.
c Preservation TC serv pport infrastructure are even older. The Van Ness BRT project encountered the
ment of overhead wire support poles / streetlights
ry integrity they were not found to be a historic source.
are ut it appears that issues of this type will be addressed on
dividual circumstances and merits, and not in relation to a controlling
on if the ystem were proposed to be removed by the SFMTA?
2.6 San Fra
ice has existed in S.F. for over 70 years, but parts of the su
issue of repair or replacethat were 95 years old and were built as part of preparations for the 1915 Pan Pacific Exposition. A historic research analysis was necessitated, but in the end because the poles lacked the necessare Other parts of the TC system could have a similar issue arise if changes proposed, binpolicy or legal finding specific to TC poles and infrastructure. On a more general level, it is unknown if the entire TC system could be found to be a historic resource, subject to protection, or mitigatis ncisco Public Support for TC Service vice has strong public support in all cities that continue tTC ser o offer the service
mode. San Francisco is not an exception. Although the negative reality of visual ue, most passengers and many
r
A TC service.
clutter due to overhead wires is an often cited issnon-transit users support TC service because the vehicles are quiet, efficient on hilly routes and emit zero emissions from the vehicle. They also emit near zero emissions at the hydroelectric power facility which provides the electricity to powethe vehicles. Public support will be a factor in any decisions that are made to retain, expand or reduce SFMT
DRAFT DRAFT DRAFT DRAFT DRAFT
24
DRAFT DRAFT DRAFT DRAFT DRAFT
25
SECTION 3
THE NEXT GENERATION OF SFMTA TRANSIT VEHICLES Introduction This section presents information on the next generation of transit vehicles available to SFMTA for possible purchase with a focus on electric powered vehicles. The transit vehicle market continues to evolve with innovative and exciting vehicles due to be available to transit agencies in the near future. 3.1 Next Generation - Transit Vehicle Concepts 3.2 Diesel Hybrid Motor Coach (DHMC)
3.2.1 DHMC: Series Hybrid Motor and Parallel Hybrid Motor 3.2.2 DHMC: New Vehicle Costs / Fuel Performance / Green Factor
3.3 Trolley Coach (TC) 3.3.1 TC: Existing and Future Electric Motors / Powerplant System 3.3.2 TC: New Vehicle Costs / Fuel Performance / Green Factor 3.4 “Rapid Charge” – Battery Powered Transit Vehicles 3.4.1 Battery Performance and Cost
3.4.2 International and U.S. Summary of Progress 3.4.3 Battery Bus (Proterra) New Vehicles / Performance / Green Factor 3.4.4 SFMTA Application Concept
3.5 “Dual-Mode” Transit Vehicles 3.5.1 U.S. Existing Examples of Dual-Mode Operation 3.5.2 Series Hybrid Powerplant and Dual-Mode Concept
3.5.3 Dual-Mode Performance / Green Factor 3.5.4 An SFMTA Application Concept 3.5.5 Further Study
3.6 Fuel Cell Transit Vehicles 3.6.1 Fuel Cell Vehicle Costs / Fuel Performance / Green Factor 3.6.2 An SFMTA Application Concept 3.1 Next Generation - Transit Vehicle Concepts
Diesel hybrid motor coaches (DHMCs) have been on the market for less than 20 years, but now thousands of units are in service and they are present at several dozen transit agencies in the U.S. By comparison TCs have been present for over 70 years, but currently are only found at five transit agencies in the U.S. plus one in Canada. In spite of the last statement, the TC as a mode is not yet dead, although it appears it will continue to be a specialized and rare transit vehicle for the foreseeable future. Other modes which may be viable in the future include transit vehicles utilizing battery power, dual mode power and fuel cell power.
The summary analysis of possible “next generation” SFMTA transit vehicles will focus on five mode or vehicle concepts:
1) Diesel electric hybrid motor coaches (DHMC) 2) Trolley coaches (TC) 3) Battery powered “rapid charge” transit vehicles (Proterra) 4) “Dual mode” transit vehicles (Dual mode) 5) Fuel cell transit vehicles (FC)
DRAFT DRAFT DRAFT DRAFT DRAFT
26
Standard diesel motor coaches, which still comprise a sizable portion of the SFMTA fleet, are not considered because of increasingly stringent air quality requirements, and because of a local commitment to phase out standard diesel motor coaches that was adopted by the SFMTA.
3.2 Diesel Hybrid Motor Coach (DHMC)
Diesel hybrid motor coaches have expanded to be used by many U.S. transit agencies after first being introduced in service in the late 1990s. Currently over 1,400 DHMC buses are in service in New York City. The “heart” of a DHMC is similar to the “heart” of a trolley coach (TC): the motor and controller. U.S. bus manufacturers (New Flyer, NABI, Gillig, etc.) use motors (powerplants) produced by third party companies (Allison, BAE, Cummins, etc.) that are designed for use in hybrid transit vehicles.
3.2.1 DHMC: Series hybrid motor and Parallel hybrid motor
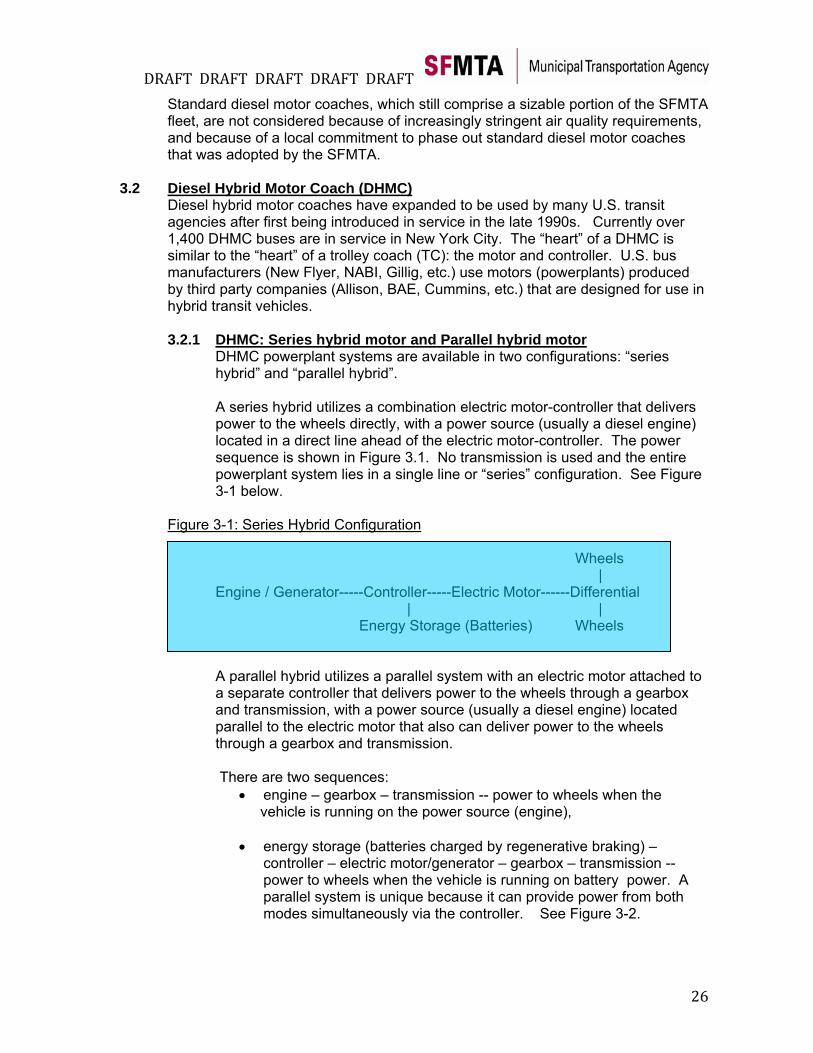
DHMC powerplant systems are available in two configurations: “series hybrid” and “parallel hybrid”.
A series hybrid utilizes a combination electric motor-controller that delivers power to the wheels directly, with a power source (usually a diesel engine) located in a direct line ahead of the electric motor-controller. The power sequence is shown in Figure 3.1. No transmission is used and the entire powerplant system lies in a single line or “series” configuration. See Figure 3-1 below.
Figure 3-1: Series Hybrid Configuration
Wheels |
Engine / Generator-----Controller-----Electric Motor------Differential | | Energy Storage (Batteries) Wheels
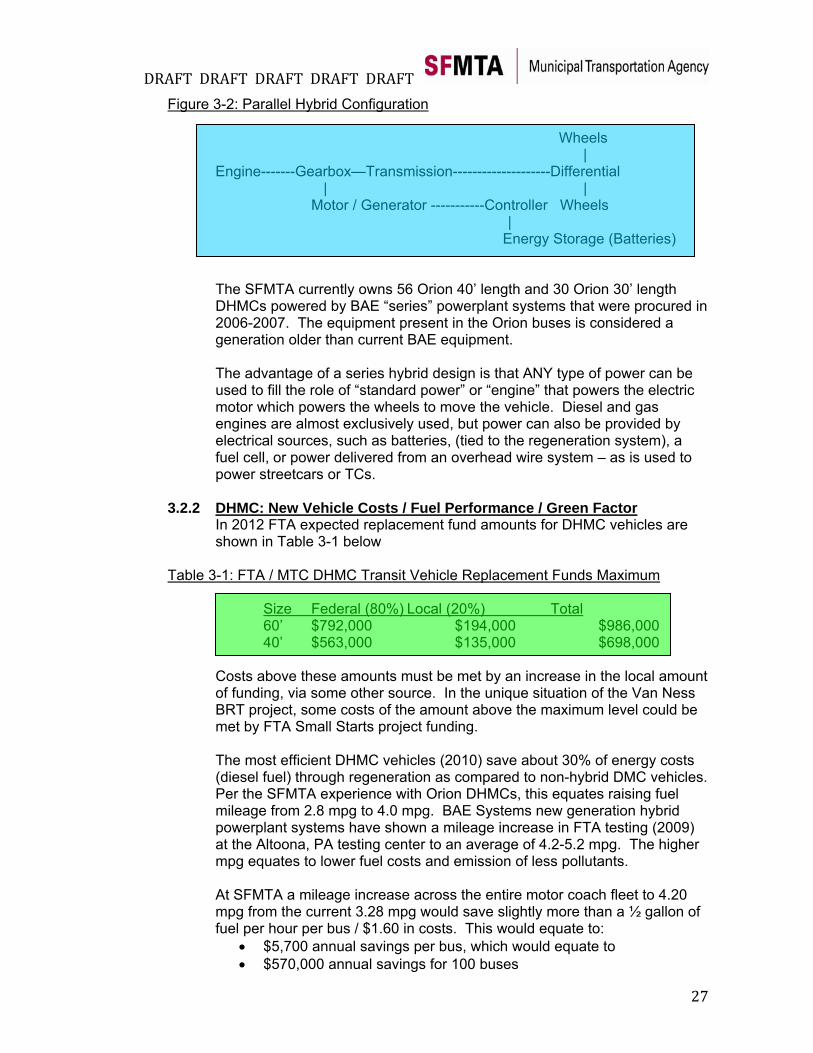
A parallel hybrid utilizes a parallel system with an electric motor attached to a separate controller that delivers power to the wheels through a gearbox and transmission, with a power source (usually a diesel engine) located parallel to the electric motor that also can deliver power to the wheels through a gearbox and transmission. There are two sequences:
• engine – gearbox – transmission -- power to wheels when the vehicle is running on the power source (engine),
• energy storage (batteries charged by regenerative braking) – controller – electric motor/generator – gearbox – transmission -- power to wheels when the vehicle is running on battery power. A parallel system is unique because it can provide power from both modes simultaneously via the controller. See Figure 3-2.
DRAFT DRAFT DRAFT DRAFT DRAFT
27
Figure 3-2: Parallel Hybrid Configuration Wheels |
Engine-------Gearbox—Transmission--------------------Differential | | Motor / Generator -----------Controller Wheels | Energy Storage (Batteries)
The SFMTA currently owns 56 Orion 40’ length and 30 Orion 30’ length DHMCs powered by BAE “series” powerplant systems that were procured in 2006-2007. The equipment present in the Orion buses is considered a generation older than current BAE equipment.
The advantage of a series hybrid design is that ANY type of power can be used to fill the role of “standard power” or “engine” that powers the electric motor which powers the wheels to move the vehicle. Diesel and gas engines are almost exclusively used, but power can also be provided by electrical sources, such as batteries, (tied to the regeneration system), a fuel cell, or power delivered from an overhead wire system – as is used to power streetcars or TCs.
3.2.2 DHMC: New Vehicle Costs / Fuel Performance / Green Factor
In 2012 FTA expected replacement fund amounts for DHMC vehicles are shown in Table 3-1 below
Table 3-1: FTA / MTC DHMC Transit Vehicle Replacement Funds Maximum
Size Federal (80%) Local (20%) Total 60’ $792,000 $194,000 $986,000 40’ $563,000 $135,000 $698,000
Costs above these amounts must be met by an increase in the local amount of funding, via some other source. In the unique situation of the Van Ness BRT project, some costs of the amount above the maximum level could be met by FTA Small Starts project funding.
The most efficient DHMC vehicles (2010) save about 30% of energy costs (diesel fuel) through regeneration as compared to non-hybrid DMC vehicles. Per the SFMTA experience with Orion DHMCs, this equates raising fuel mileage from 2.8 mpg to 4.0 mpg. BAE Systems new generation hybrid powerplant systems have shown a mileage increase in FTA testing (2009) at the Altoona, PA testing center to an average of 4.2-5.2 mpg. The higher mpg equates to lower fuel costs and emission of less pollutants. At SFMTA a mileage increase across the entire motor coach fleet to 4.20 mpg from the current 3.28 mpg would save slightly more than a ½ gallon of fuel per hour per bus / $1.60 in costs. This would equate to:
• $5,700 annual savings per bus, which would equate to • $570,000 annual savings for 100 buses
DRAFT DRAFT DRAFT DRAFT DRAFT
28
o $2.28M annual savings for the SFMTA 400 bus fleet, • $5.70M in savings over a 12-year lifespan for 100 buses
o $27.50M in savings over a 12-yr lifespan for the SFMTA 400 bus fleet
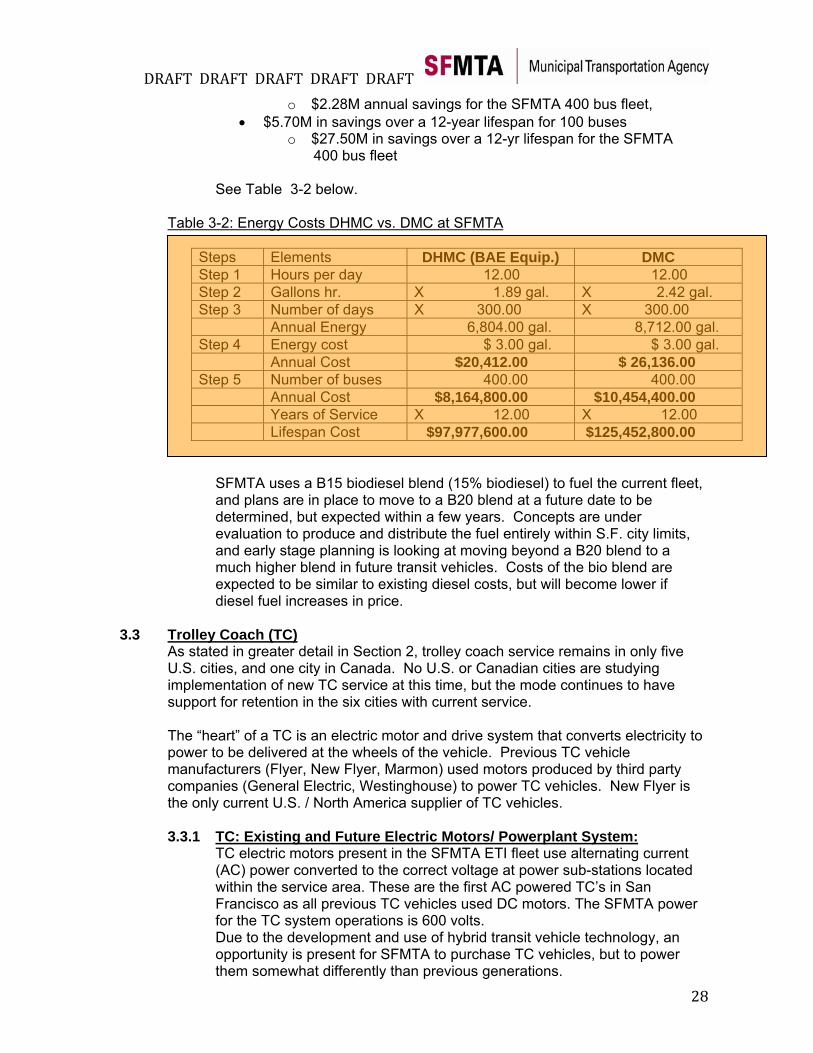
See Table 3-2 below.
Table 3-2: Energy Costs DHMC vs. DMC at SFMTA
Steps Elements DHMC (BAE Equip.) DMC Step 1 Hours per day 12.00 12.00 Step 2 Gallons hr. X 1.89 gal. X 2.42 gal. Step 3 Number of days X 300.00 X 300.00 Annual Energy 6,804.00 gal. 8,712.00 gal. Step 4 Energy cost $ 3.00 gal. $ 3.00 gal. Annual Cost $20,412.00 $ 26,136.00 Step 5 Number of buses 400.00 400.00 Annual Cost $8,164,800.00 $10,454,400.00 Years of Service X 12.00 X 12.00 Lifespan Cost $97,977,600.00 $125,452,800.00
SFMTA uses a B15 biodiesel blend (15% biodiesel) to fuel the current fleet, and plans are in place to move to a B20 blend at a future date to be determined, but expected within a few years. Concepts are under evaluation to produce and distribute the fuel entirely within S.F. city limits, and early stage planning is looking at moving beyond a B20 blend to a much higher blend in future transit vehicles. Costs of the bio blend are expected to be similar to existing diesel costs, but will become lower if diesel fuel increases in price.
3.3 Trolley Coach (TC)
As stated in greater detail in Section 2, trolley coach service remains in only five U.S. cities, and one city in Canada. No U.S. or Canadian cities are studying implementation of new TC service at this time, but the mode continues to have support for retention in the six cities with current service. The “heart” of a TC is an electric motor and drive system that converts electricity to power to be delivered at the wheels of the vehicle. Previous TC vehicle manufacturers (Flyer, New Flyer, Marmon) used motors produced by third party companies (General Electric, Westinghouse) to power TC vehicles. New Flyer is the only current U.S. / North America supplier of TC vehicles.
3.3.1 TC: Existing and Future Electric Motors/ Powerplant System:
TC electric motors present in the SFMTA ETI fleet use alternating current (AC) power converted to the correct voltage at power sub-stations located within the service area. These are the first AC powered TC’s in San Francisco as all previous TC vehicles used DC motors. The SFMTA power for the TC system operations is 600 volts. Due to the development and use of hybrid transit vehicle technology, an opportunity is present for SFMTA to purchase TC vehicles, but to power them somewhat differently than previous generations.
DRAFT DRAFT DRAFT DRAFT DRAFT
29
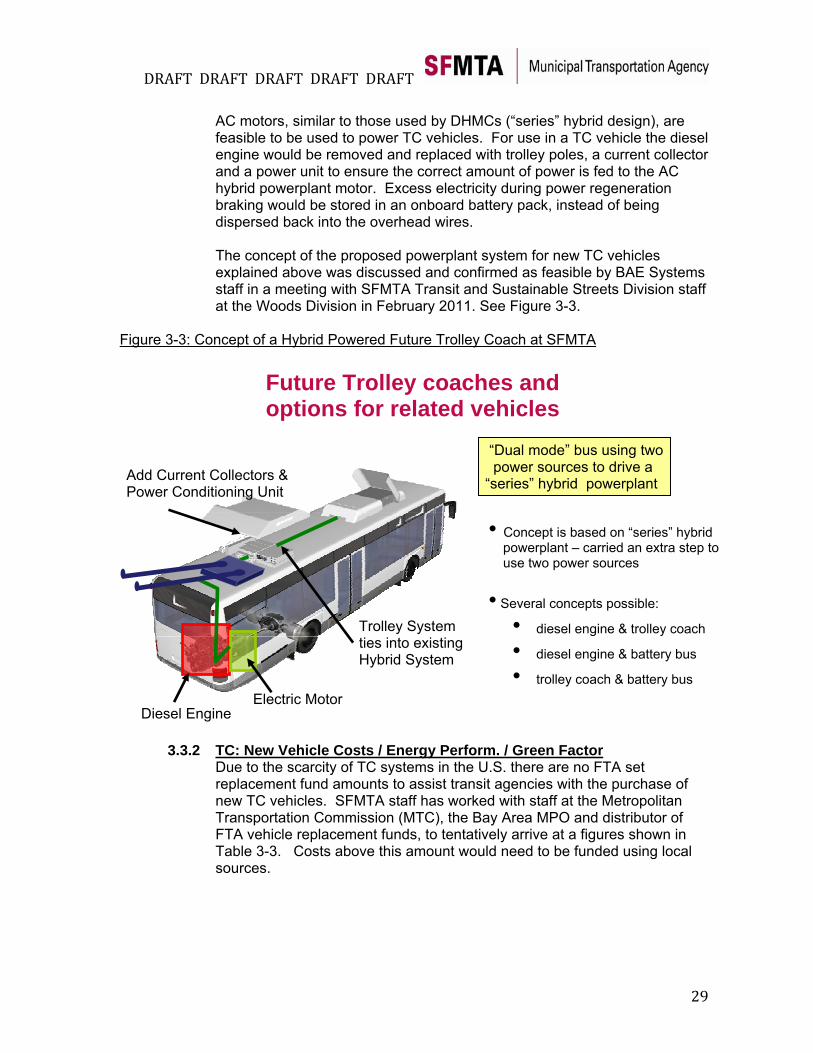
AC motors, similar to those used by DHMCs (“series” hybrid design), are feasible to be used to power TC vehicles. For use in a TC vehicle the diesel engine would be removed and replaced with trolley poles, a current collector and a power unit to ensure the correct amount of power is fed to the AC hybrid powerplant motor. Excess electricity during power regeneration braking would be stored in an onboard battery pack, instead of being dispersed back into the overhead wires. The concept of the proposed powerplant system for new TC vehicles explained above was discussed and confirmed as feasible by BAE Systems staff in a meeting with SFMTA Transit and Sustainable Streets Division staff at the Woods Division in February 2011. See Figure 3-3.
Figure 3-3: Concept of a Hybrid Powered Future Trolley Coach at SFMTA
Future Trolley coaches and options for related vehicles
Electric Motor Diesel Engine
Add Current Collectors & Power Conditioning Unit
Trolley System ties into existing Hybrid System
• Concept is based on “series” hybrid powerplant – carried an extra step to use two power sources
• Several concepts possible:
• diesel engine & trolley coach
• diesel engine & battery bus
• trolley coach & battery bus
“Dual mode” bus using two power sources to drive a “series” hybrid powerplant
3.3.2 TC: New Vehicle Costs / Energy Perform. / Green Factor
Due to the scarcity of TC systems in the U.S. there are no FTA set replacement fund amounts to assist transit agencies with the purchase of new TC vehicles. SFMTA staff has worked with staff at the Metropolitan Transportation Commission (MTC), the Bay Area MPO and distributor of FTA vehicle replacement funds, to tentatively arrive at a figures shown in Table 3-3. Costs above this amount would need to be funded using local sources.
DRAFT DRAFT DRAFT DRAFT DRAFT
30
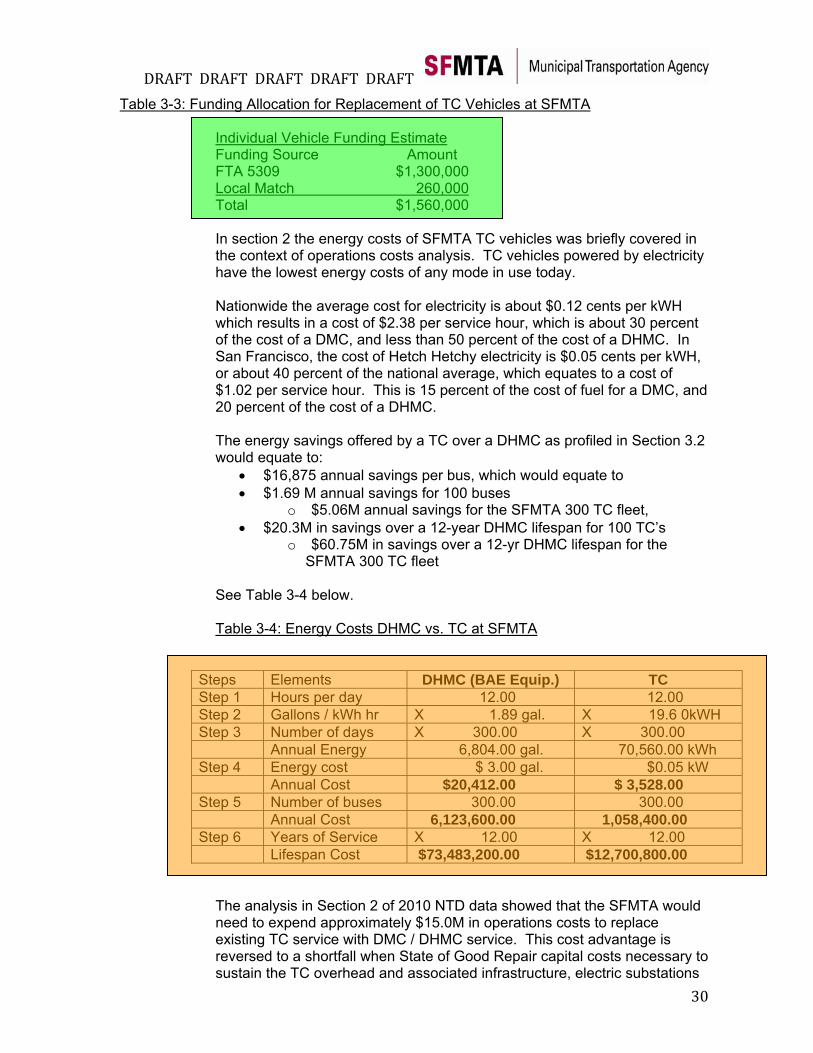
Table 3-3: Funding Allocation for Replacement of TC Vehicles at SFMTA
Individual Vehicle Funding Estimate Funding Source Amount FTA 5309 $1,300,000 Local Match 260,000 Total $1,560,000 In section 2 the energy costs of SFMTA TC vehicles was briefly covered in the context of operations costs analysis. TC vehicles powered by electricity have the lowest energy costs of any mode in use today. Nationwide the average cost for electricity is about $0.12 cents per kWH which results in a cost of $2.38 per service hour, which is about 30 percent of the cost of a DMC, and less than 50 percent of the cost of a DHMC. In San Francisco, the cost of Hetch Hetchy electricity is $0.05 cents per kWH, or about 40 percent of the national average, which equates to a cost of $1.02 per service hour. This is 15 percent of the cost of fuel for a DMC, and 20 percent of the cost of a DHMC. The energy savings offered by a TC over a DHMC as profiled in Section 3.2 would equate to:
• $16,875 annual savings per bus, which would equate to • $1.69 M annual savings for 100 buses
o $5.06M annual savings for the SFMTA 300 TC fleet, • $20.3M in savings over a 12-year DHMC lifespan for 100 TC’s
o $60.75M in savings over a 12-yr DHMC lifespan for the SFMTA 300 TC fleet
See Table 3-4 below. Table 3-4: Energy Costs DHMC vs. TC at SFMTA
Steps Elements DHMC (BAE Equip.) TC Step 1 Hours per day 12.00 12.00 Step 2 Gallons / kWh hr X 1.89 gal. X 19.6 0kWH Step 3 Number of days X 300.00 X 300.00 Annual Energy 6,804.00 gal. 70,560.00 kWh Step 4 Energy cost $ 3.00 gal. $0.05 kW Annual Cost $20,412.00 $ 3,528.00 Step 5 Number of buses 300.00 300.00 Annual Cost 6,123,600.00 1,058,400.00 Step 6 Years of Service X 12.00 X 12.00 Lifespan Cost $73,483,200.00 $12,700,800.00
The analysis in Section 2 of 2010 NTD data showed that the SFMTA would need to expend approximately $15.0M in operations costs to replace existing TC service with DMC / DHMC service. This cost advantage is reversed to a shortfall when State of Good Repair capital costs necessary to sustain the TC overhead and associated infrastructure, electric substations
DRAFT DRAFT DRAFT DRAFT DRAFT
31
and in ground infrastructure is factored in. The TC mode cost advantage appears again when FTA Fixed Guideway funding is included in the calculation.
The electricity used to supply power to operate TC vehicles can be provided by almost any source. In San Francisco, none of the other mode alternatives discussed in this section can outperform the TC mode for cheap energy costs, or for being “green” provided TC services continues to be powered by electricity generated via hydro power at the Hetch Hetchy facility in Yosemite.
3.4 “Rapid Charge” – Battery Powered Transit Vehicles
The rapid charge battery bus concept is an all-electric transit vehicle operation system without the necessity of overhead wires to supply power. Advances in battery technology (more powerful, lighter, capable of greater repetition of recharging (i.e. “cycling” or “cycles”) have completely changed the battery bus concept in the last few years. Unlike experimental battery powered buses from a decade ago which utilized lengthy recharge cycles (overnight or several hours), the increased ability of newer batteries to cycle (faster and higher repetitions) have resulted in a new vehicle concept, known as the “rapid charge” battery bus. As a transit vehicle mode, it is on the cutting edge of practical application in the U.S., but it is still a specialty vehicle. However, this mode may perform a significant role in transit vehicle operations by the end of the decade. Electric power is supplied to a battery pack located on the bus at service terminals in a rapid charge manner that takes 5-10 minutes to complete. Once charged, the bus operates using battery power until the next rapid charge takes place.
3.4.1 Battery Performance and Cost
Until recently nickel metal hydride (NiMH) batteries were the most advanced battery in use in transit applications. NiMH batteries cost $500-$1,000 per kW hr of capacity (2010), and had a lifespan of 500-1,000 cycles at deep discharge, and 2,500 cycles at a 33 percent discharge.
Lithium titinate (nLTO) batteries have a higher cost than the NiMH batteries at $2,000 per kW hr of capacity, but manufacturers claim a lifespan of 10,000 cycles at deep discharge. Therefore, although the nLTO batteries cost 2-4 times as much, it appears they produce a higher performance and last 4-20 times longer than the NiMH batteries. One manufacturer has claimed an efficiency of 50,000 cycles with its nLTO batteries.
3.4.2 International and U.S. Summary of Progress
Efforts in China (BYD Co. – main focus on cars), and Spain (Opbrid Transporte SL), coupled with Furrer-Frey (Switzerland) and Schunk (Germany) are advancing along with research and development of rapid charge transit vehicle. The Spanish effort has resulted in a transit service route in operation in Granada, Spain.
In the U.S. none of the major bus suppliers are producing or considering production of a “rapid charge battery bus”, but a small company has
DRAFT DRAFT DRAFT DRAFT DRAFT
32
emerged as the U.S. and world leader. The Proterra Company of Golden, CO and Greenville, SC is the furthest along in bringing the concept of a “rapid charge electric battery bus” to the transit market.
Proterra and their partners: Altairnano of Reno, NV (battery supplier), UQM Technologies of Longmont, CO (electric motors and power systems), and (BlueNan (formerly ISE) of San Diego, CA (hybrid electric drive systems) have created the “world’s first rapid charge battery bus” that is in regular transit service. The Proterra Bus is in operation on Route 291 at Foothill Transit (West Covina, CA). Three of the 35’ length – 35 seat low-floor buses (EcoRide BE 35 “Ecoliner”) make the 19 mile round trip between the cities of LaVerne and Pomona near Los Angeles several times per day. The buses started service in September 2010 with a plan to collect data over a twelve-month period. Buses that serve this route have averaged 60,000 service hours annually in the past few years, although the goal for the Proterra buses is around 50,000 service hours. Foothill Transit recently acted to exercise an option with Proterra to buy nine more to add to their fleet. Other transit agencies in the western U.S. (Fresno, Reno, San Antonio, TX,) are in discussion for pilot projects utilizing the Proterra bus.
Information is not yet available to know if decreased capital costs would result if production were to increase to a level where these were not specialty vehicles. Proterra has stated they have plans to build up to 80 buses in 2011-2012.
3.4.3 Battery Bus (Proterra) New Vehicles / Performance / Green
Factor The Proterra EcoRide as outfitted for Foothill Transit costs approximately $1.0M per unit. They are powered by a permanent magnet motor rated at 150kW peak / 100kW continuous mated to a 3-speed automatic BorgWarner eGearDrive transmission. The capacity of the Proterra battery pack is 55kWh. At $2,000 per kWh, the battery pack costs about $110,000 of the overall vehicle cost. Battery storage is under the floor and the bus recharges lithium titinate (nLTO)batteries at a terminal located along or adjacent to a service route. The vehicle powerplant setup allows the bus to operate at a 92-95 percent efficiency range for both drive and regenerative braking modes, which is approximately the same efficiency as a TC vehicle.
DRAFT DRAFT DRAFT DRAFT DRAFT
33
The buses are considered experimental and are not covered as a vehicle in the FTA replacement program so at this time it is unknown how this type of vehicle would fit into an existing transit vehicle replacement program that would use FTA funding. In the pilot program at Foothill Transit the buses utilize charging stations located at the Pomona Transit Center or at the Foothill Transit vehicle maintenance yard using a Proterra proprietary system (FastFill). The FastFill system works as follows: the bus operator pulls the bus to a designated spot and the recharge system links the bus to the charging unit without operator involvement automatically. The charging unit delivers power via the roof using hardware that vaguely resembles a TC vehicle with overhead wires and trolley poles. Cycle time (recharge) is 5-10 minutes and is schedule to occur during operator layover / schedule recovery. 3.4.3.1 Battery Performance and Replacement Costs
Altairnano has stated the battery pack in the Proterra bus will last the projected 12-year lifetime of the bus without replacement, which would exceed 50,000 cycles, or 500 percent of the initial performance level assigned to an nLTO battery.
DRAFT DRAFT DRAFT DRAFT DRAFT
34
However, there is a huge difference between battery performance and durability (including recharging) between a complete recharge cycle and a partial recharge cycle. Batteries can perform many partial recharge cycles with less degradation than when they do a single complete recharge cycle. Therefore assuming that many cycles are partial recharge in nature (equivalent to adding fuel when a tank is half empty), the 50,000 cycle level may be achievable. Direct discussions with Proterra staff did not support or deny the Altairnano statement, because the batteries are too new to have shown their lifespan potential. If the performance is true, it would be a quantum leap in battery technology that would possibly be a game changing impact on the future of battery bus operations.
Since the lifespan claimed is at least 3X above the best bus battery pack performance to date, and because a worst case scenario provides useful information, an analysis of battery performance and replacement costs is shown below using an assumption that the battery pack would be replaced three times during the 12-year vehicle lifespan. See Table 3-5 below. A four year lifespan with two battery pack replacements (year 5 and year 9) would add $220,000 in costs to the $1.0M baseline cost.
Table 3-5: Proterra Cycle (Battery Re-charge) Information
Scenario 1 2 Charges per day X 10 X 15 Service Days per year X 300 X 300 Battery Lifespan X 4 X 4
Cycles (Recharges) 12,000 18,000
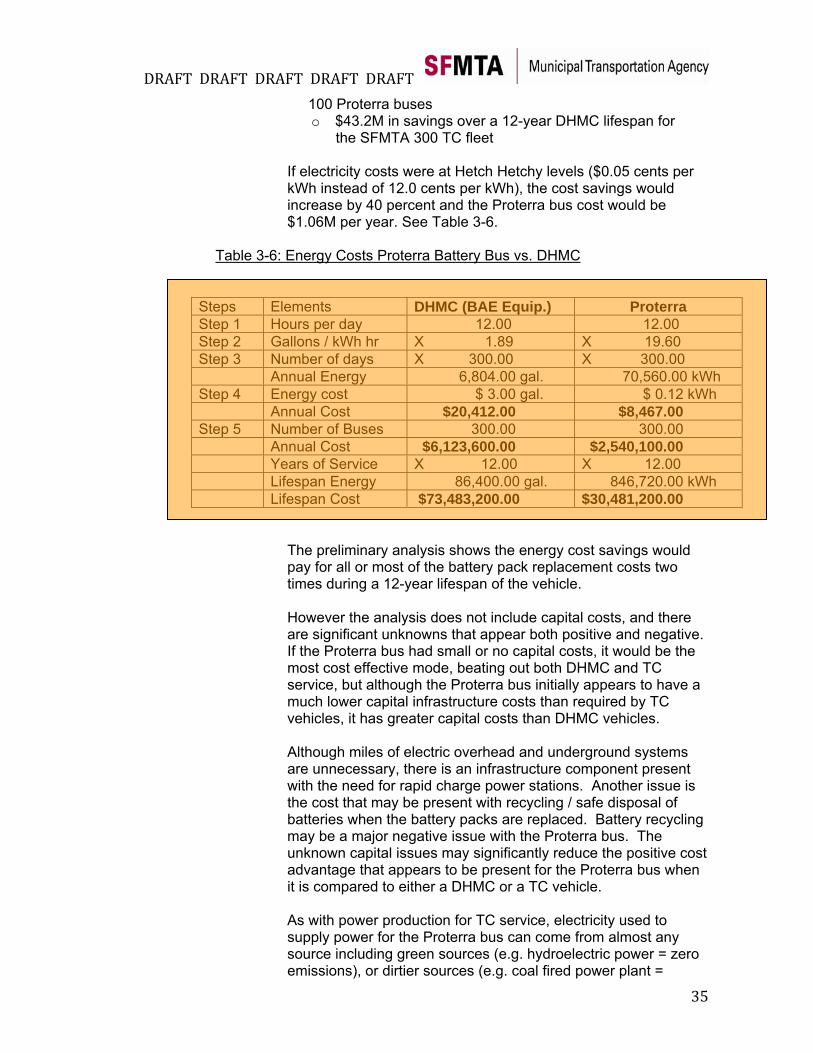
3.4.3.2 Energy Cost Comparison and Analysis The cost, performance and durability of the battery pack is one part of an electric bus propulsion analysis. The second part is energy consumption using the standard measure of miles per gallon (mpg). In testing at the FTA Altoona, PA facility, the Proterra EcoRide BE 35 bus recorded 17.5-29.0 mpg performance equivalent on fuel economy. Assuming a performance of 20mpg, the EcoRide BE 35 bus is 5X more efficient than the Orion DHMC vehicles in the SFMTA fleet which achieve 4.0 mpg. Assuming diesel fuel cost is $3.00 a gallon for the DHMC, while the Proterra bus would draw electricity power at $0.12 per kWh, the energy cost savings of the Proterra vs. a DHMC as profiled in Section 3.2 would equate to: • $12,000 annual savings per bus, which would equate to • $1.20M annual savings for 100 Proterra buses
o $3.6M annual savings for the SFMTA 300 TC Fleet
• $14.4M in savings over a 12-year DHMC lifespan for
DRAFT DRAFT DRAFT DRAFT DRAFT
35
100 Proterra buses o $43.2M in savings over a 12-year DHMC lifespan for the SFMTA 300 TC fleet
If electricity costs were at Hetch Hetchy levels ($0.05 cents per kWh instead of 12.0 cents per kWh), the cost savings would increase by 40 percent and the Proterra bus cost would be $1.06M per year. See Table 3-6.
Table 3-6: Energy Costs Proterra Battery Bus vs. DHMC
Steps Elements DHMC (BAE Equip.) Proterra Step 1 Hours per day 12.00 12.00 Step 2 Gallons / kWh hr X 1.89 X 19.60 Step 3 Number of days X 300.00 X 300.00 Annual Energy 6,804.00 gal. 70,560.00 kWh Step 4 Energy cost $ 3.00 gal. $ 0.12 kWh Annual Cost $20,412.00 $8,467.00 Step 5 Number of Buses 300.00 300.00 Annual Cost $6,123,600.00 $2,540,100.00 Years of Service X 12.00 X 12.00 Lifespan Energy 86,400.00 gal. 846,720.00 kWh Lifespan Cost $73,483,200.00 $30,481,200.00
The preliminary analysis shows the energy cost savings would pay for all or most of the battery pack replacement costs two times during a 12-year lifespan of the vehicle. However the analysis does not include capital costs, and there are significant unknowns that appear both positive and negative. If the Proterra bus had small or no capital costs, it would be the most cost effective mode, beating out both DHMC and TC service, but although the Proterra bus initially appears to have a much lower capital infrastructure costs than required by TC vehicles, it has greater capital costs than DHMC vehicles. Although miles of electric overhead and underground systems are unnecessary, there is an infrastructure component present with the need for rapid charge power stations. Another issue is the cost that may be present with recycling / safe disposal of batteries when the battery packs are replaced. Battery recycling may be a major negative issue with the Proterra bus. The unknown capital issues may significantly reduce the positive cost advantage that appears to be present for the Proterra bus when it is compared to either a DHMC or a TC vehicle. As with power production for TC service, electricity used to supply power for the Proterra bus can come from almost any source including green sources (e.g. hydroelectric power = zero emissions), or dirtier sources (e.g. coal fired power plant =
DRAFT DRAFT DRAFT DRAFT DRAFT
36
significant emissions), so there may be emissions issues at the power source.
3.4.4 SFMTA Application Concept
Conceptually a rapid charge system to support a fleet of battery buses is feasible in San Francisco due to the extensive TC and LRV system electric grid network. • The S.F. network can provide 300-1200kW of 600 volt DC
current to both terminals of about 33 percent of SFMTA motor coach routes, and can provide the same power to one terminal of all remaining routes, except Rt. 28-19th Avenue.
• The overall capacity of the electric network can be increased by adding feeders to existing underground feeder duct banks, and most existing substations have excess capacity that can be utilized, because they were rebuilt during the 1970s-1980s with future extensions of the TC system in mind, most of which has not happened.
Independent research of battery power and weight issues by SFMTA staff developed the following information. • The recommended battery capacity for a battery bus in SF is
50kWh-60kWh, which is equivalent to the Proterra bus in use in Southern California.
• The batteries are estimated to weigh 1,840 lbs. and occupy approximately 16 cubic feet.
3.5 Dual-Mode Transit Vehicles
The concept of a dual-mode transit vehicle has had a mixed past in U.S. transit service. Boston uses dual-mode transit vehicles in current service, and until recently they also operated in Seattle. Recent advances in electric hybrid motor coach technology, battery technology, and other transit vehicle power concepts (e.g. fuel cell bus), and the overlap and integration of parts of these systems all raise the possibility of “dual mode” transit vehicles being a future vehicle option.
3.5.1 U.S. Existing Examples of Dual-Mode Operation
The most recent development of dual-mode transit equipment was undertaken by the MBTA in Boston in 2004 when they created a fleet of 32 60’ length artic. dual-mode trolleycoach / motor coach vehicles for use on the Silver Line BRT project using a combination of electric traction motor and diesel engine technology in a design that applied diesel power to the electric traction motor to provide power to the wheels. In the same year King County Metro (Seattle) ended use of 239 dual mode 60’ length artic. transit vehicles, but retained 39 of the vehicles and converted them to electric trolleycoach operation only.
3.5.2 Series Hybrid Powerplant and Dual-Mode Concept
The development of the “series” hybrid powerplant system allows for the application of multiple modes on one vehicle: diesel engine, electric power (via overhead wires), battery bus, fuel cell, etc. Conceptual dual-mode, or tri-mode combinations could consist of: • Electric hybrid motor coach (diesel) / trolleycoach • Electric hybrid motor coach (diesel) / battery bus

DRAFT DRAFT DRAFT DRAFT DRAFT
37
(aka – battery hybrid) • Trolley Coach / Battery Bus • Trolley Coach / Fuel Cell / Electric Hybrid Motor Coach (diesel) • Fuel Cell / Electric Hybrid Motor Coach (diesel) / Battery Bus
Possible advantages present with the use of a dual-mode transit vehicle if one or both of the modes include electric power operations (battery bus or TC operations) including: • Offline operations beyond limits of overhead wire power
(available to transit agencies with TC mode service • Electric bus operations without use of overhead wire power
(available to all transit agencies) • Operations savings (electricity vs. diesel fuel costs) • Emission reductions (vs. diesel emissions) • Quieter operations (vs. diesel operations)
Possible disadvantages to use of a dual-mode transit vehicle, even one based on a “series” hybrid powerplant motor, include: • increased capital costs to procure vehicles • increased maintenance costs due to vehicle complexity
- offset by operations savings = unknown
BAE Systems, supplier of the hybrid motor and systems on the SFMTA Orion 40’ length electric hybrid motor coaches has produced documentation to quickly explain the flexibility of the “series”-hybrid design. The information shows a concept of how a dual-mode (electric (TC) / diesel engine hybrid motor coach (DHMC)) could be designed using BAE equipment placed into a transit bus body from any manufacturer.
3.5.3 Dual-Mode Performance / Green Factor
At this time a lack of dual-mode transit vehicles utilizing a series-hybrid powerplant system prevent assessment or analysis of performance or relative greenness of this type of bus. Conceptually, depending upon the combination of modes present, a dual-mode bus should be less expensive to operate and be greener than a DHMC vehicle, because at least part of the time operation would be as a TC or battery bus, both of which are exclusively electric.
3.5.4 An SFMTA Application Concept
As one of five U.S. transit agencies that continue to operate TC service, the dual-mode concept based on a “series” hybrid powerplant would have the benefit of allowing SFMTA TC service operate into areas that do not have overhead wires to support electric operations. The dual-mode setup could be either a TC / DHMC option, or a TC / “battery bus” option. The extension of Route 22-Fillmore into Mission Bay without the need to extend the overhead electric system is one desired route improvement that would be achievable if this type of transit vehicle was in the SFMTA fleet. Another potential application of this concept would be on the proposed Van Ness BRT where Route 47-Van Ness would operate in TC mode and draw power from overhead wires while on the BRT segment, but would operate
DRAFT DRAFT DRAFT DRAFT DRAFT
38
as an DHMC or battery bus on the route segment between South Van Ness and Caltrain.
3.5.5 Further Study
For the purposes of this report, the concept of a dual-mode transit vehicle is briefly presented. More detailed research into the feasibility and practicality of a future application of dual-mode transit vehicles at SFMTA is necessary before any plans are drafted or action is taken if there is a desire to proceed with the concept.
3.6 Fuel Cell Transit Vehicles
Fuel cell transit vehicles have been in pilot service in the U.S. for over a decade. The largest use and testing has occurred at AC Transit in Oakland, CA where currently 12 40’ standard low-floor buses are in service. Unlike the development and adoption of hybrid engine technology and the rapid charge battery bus technology, the interest in fuel cells has not accelerated in the past few years. The largest issues appear to be:
• High startup capital costs to establish a maintenance facility • High capital costs for vehicles • High costs to maintain vehicles • Hydrogen generation / storage issues • Vehicle reliability (target is 4,000 miles avg. between failures) • Large scale producer availability
The cost of one of the AC Transit fuel cell buses that are in service is $2.25M per unit. Costs are expected to drop by up to 50 percent by 2017. 3.6.1 Fuel Cell Vehicle Costs / Fuel Performance / Green Factor
The cost of a fuel cell bus in 2011 is about $2.25M per unit for a 40’ standard low-floor bus. Fuel cell buses are considered experimental and are not covered by FTA vehicle replacement funding. The fuel cell stack durability is about 9,000 hours, or two years before need of replacement, and the cost of replacement is about $100,000. These figure mean the fuel cell stack will need to be replaced six times during a 12-year period, which when added to the initial purchase price of a bus raises the capital total to $3.0M dollars. This is 5X-6X the cost of a similar sized DMC vehicle and about 4X-5X the cost of a similar sized DHMC vehicle. Fuel cell stack durability is expected to increase by 150-300 percent by 2028, and if the latter improvement is achieved, it will mean the stack will only need to be replaced once during a 12-year lifespan
The estimated fuel efficiency of a fuel cell is about 4.5mpg-7.0mpg, which is about 20-60 percent better than a DHMC, but only 33 percent of the initial performance of the Proterra bus.
Fuel cell buses emit water vapor from their exhaust, so they are classified as a zero emission vehicle. However, like TC vehicles with electricity generation, the production of hydrogen for use in a fuel cell vehicle can be an emission issue if fossil fuels are used.
DRAFT DRAFT DRAFT DRAFT DRAFT
39
3.6.2 An SFMTA Application Concept
SFMTA is a member of the S.F. Bay Area Zero Emission Fuel Cell bus Demonstration. One experimental 40’ low floor bus at SFMTA has been outfitted with a BAE series hybrid powerplant and an auxiliary fuel cell is in pilot service in 2011. Information is being collected. It is possible to lease one of the AC Transit fuel cell buses if SFMTA were to pursue this course of action.
Similar to the Proterra bus, fuel cell buses remain specialty vehicles that are years away from regular service at the earliest date.
DRAFT DRAFT DRAFT DRAFT DRAFT
40
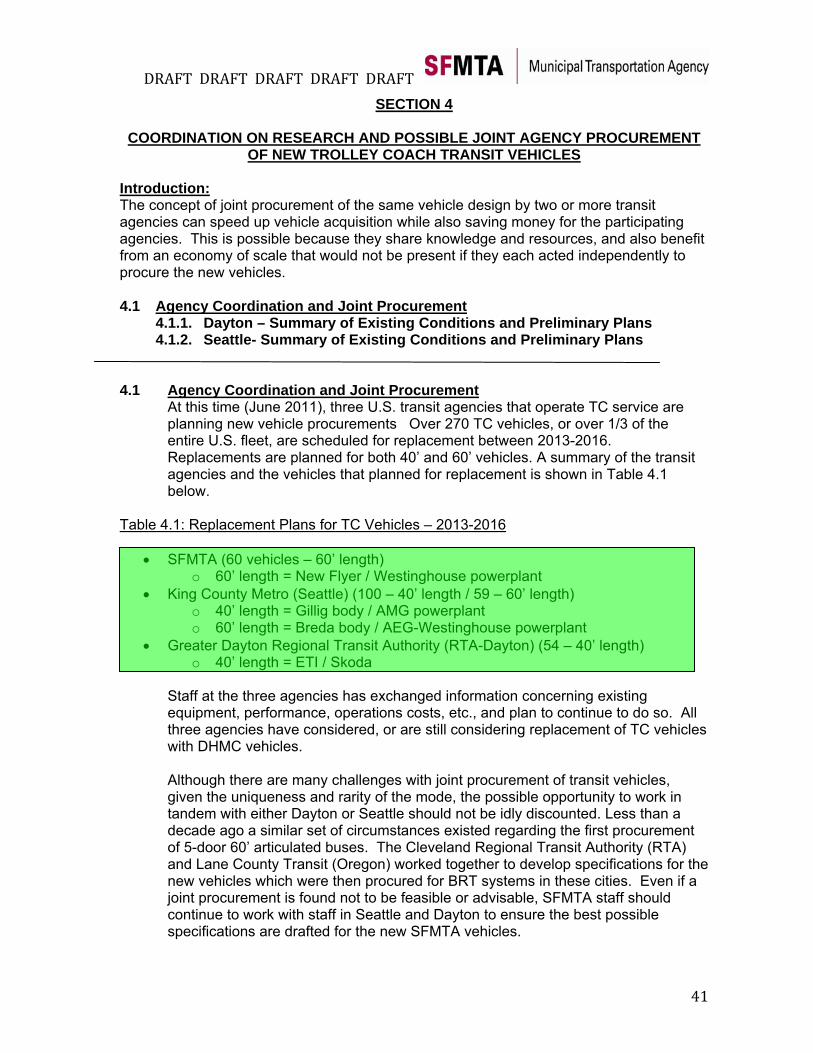
DRAFT DRAFT DRAFT DRAFT DRAFT
41
SECTION 4
COORDINATION ON RESEARCH AND POSSIBLE JOINT AGENCY PROCUREMENT OF NEW TROLLEY COACH TRANSIT VEHICLES
Introduction: The concept of joint procurement of the same vehicle design by two or more transit agencies can speed up vehicle acquisition while also saving money for the participating agencies. This is possible because they share knowledge and resources, and also benefit from an economy of scale that would not be present if they each acted independently to procure the new vehicles. 4.1 Agency Coordination and Joint Procurement
4.1.1. Dayton – Summary of Existing Conditions and Preliminary Plans 4.1.2. Seattle- Summary of Existing Conditions and Preliminary Plans
4.1 Agency Coordination and Joint Procurement At this time (June 2011), three U.S. transit agencies that operate TC service are planning new vehicle procurements Over 270 TC vehicles, or over 1/3 of the entire U.S. fleet, are scheduled for replacement between 2013-2016. Replacements are planned for both 40’ and 60’ vehicles. A summary of the transit agencies and the vehicles that planned for replacement is shown in Table 4.1 below.
Table 4.1: Replacement Plans for TC Vehicles – 2013-2016
• SFMTA (60 vehicles – 60’ length) o 60’ length = New Flyer / Westinghouse powerplant
• King County Metro (Seattle) (100 – 40’ length / 59 – 60’ length) o 40’ length = Gillig body / AMG powerplant o 60’ length = Breda body / AEG-Westinghouse powerplant
• Greater Dayton Regional Transit Authority (RTA-Dayton) (54 – 40’ length) o 40’ length = ETI / Skoda
Staff at the three agencies has exchanged information concerning existing equipment, performance, operations costs, etc., and plan to continue to do so. All three agencies have considered, or are still considering replacement of TC vehicles with DHMC vehicles. Although there are many challenges with joint procurement of transit vehicles, given the uniqueness and rarity of the mode, the possible opportunity to work in tandem with either Dayton or Seattle should not be idly discounted. Less than a decade ago a similar set of circumstances existed regarding the first procurement of 5-door 60’ articulated buses. The Cleveland Regional Transit Authority (RTA) and Lane County Transit (Oregon) worked together to develop specifications for the new vehicles which were then procured for BRT systems in these cities. Even if a joint procurement is found not to be feasible or advisable, SFMTA staff should continue to work with staff in Seattle and Dayton to ensure the best possible specifications are drafted for the new SFMTA vehicles.
DRAFT DRAFT DRAFT DRAFT DRAFT
42
4.1.1 Dayton – Summary of Existing Conditions and Preliminary Plans The current Dayton fleet is comprised of 13 year old ETI TC vehicles, and like SFMTA, Dayton has experienced significant reliability problems and problems getting replacement parts. Electric power is produced via a coal-fired plant, so although it is cheaper as fuel than diesel, at least in Dayton, TC vehicles are not zero emission at the level they are in San Francisco. It appears Dayton has made the decision to continue to operate TC service and acquire new TC vehicles to replace their existing fleet. Dayton also is considering building an experimental “dual-mode” transit vehicle (TC mode / DHMC mode). The vehicle would be based on a series-electric-diesel hybrid engine and body that would also have trolley poles and other electrical equipment attached so it could operate on any route served by Dayton RTA. A short report titled Benefit Cost Analysis of Trolleybus System produced by in-house staff was completed in late 2010 and makes a fiscal argument tied to continued support of federal fixed guideway funds (not completely compelling) to retain the trolleycoach system.
4.1.2 Seattle – Summary of Existing Conditions and Preliminary Plans
The Seattle fleet of 159 TC vehicles is comprised of reconfigured equipment. The 100 unit strong 40’ length fleet uses newer traction motors placed into old bodies, while the 59 unit strong 60’ length fleet uses reconditioned old traction motors placed into newer bodies. Both sets of vehicles are 15-19 years old from their date of creation and are in need of replacement. Seattle released a report in May 2011 titled, King County Trolley Bus Evaluation which analyzed the issues present concerning their decision on replacement transit vehicles. It appears that Seattle, like Dayton, is leaning strongly toward a decision to retain TC service and not to reduce the size of their 159 unit TC fleet.
DRAFT DRAFT DRAFT DRAFT DRAFT
43
SECTION 5
NEXT VEHICLE PROCUREMENT RECOMMENDED ACTION
Introduction: The SFMTA has initiated planning to replace 60 articulated New Flyer 60’ length TC vehicles and 45 standard NABI 40’ length DMC vehicles. These vehicles are due for retirement between 2012-2014. Twenty New Flyer TC vehicles are already retired, leaving only 40 on the active SFMTA vehicle roster. The issue of the vehicle replacement has become more complicated by the requirement that some of the vehicles to be procured will be used to provide transit vehicles for the Van Ness BRT service that is currently in environmental review, and which has an projected opening date of 2016. Issues slso exist regarding the adequacy of storage and maintenance space at the yards used by the DMC / DHMC fleet that appear to be critical within the next decade. The SFMTA will need to implement a fully operational transit facility within a decade to support the DMC / DHMC fleet projected to be in place by 2030. These issues are addressed in this section. 5.1 Next Vehicle Procurement – Summary of Recommendations
5.1.1 Action #1: Activate Fleet Management Team 5.1.2 Action #2: Preserve Trolley Coach Service at the SFMTA 5.1.3 Action #3: Select New Vehicle Option Within Budget
and with a High Probability of Success 5.1.4 Action #4: Secure Funding for New Technology
Pilot Transit Vehicles and Implement Pilot Program 5.1.5 Action #5: Study Feasibility of Transit Vehicle
Sustainability Program to Lengthen Transit Vehicle Lifespan 5.2 SFMTA Maintenance Facility Plans – Summary of Recommendations
5.2.1 Action #6: Obtain Property for a New Storage and Maintenance Facility
5.1 SFMTA Next Vehicle Procurement – Summary of Recommendations
As of June 2011, SFMTA has $145 M dollars between FTA Section 5307 / 5309 funds and local funds (San Francisco County Prop. K ) to spend on new vehicles to replace 60 New Flyer 60’ articulated trolley coaches, and 45 NABI 40’ diesel motor coaches. Funds expected to be received as part of the Van Ness BRT project, which is an FTA “Small Starts” project may provide additional funding up to $28 M dollars, for a combined total of $173 M dollars. There are almost an infinite number of possible replacement vehicle options and combinations, but there are two important service needs that must be met with the arrival of the new vehicles: • Vehicles to comprise the Van Ness BRT fleet • Vehicles of an adequate size and mode to meet all SFMTA service
5.1.1 Action #1: Activate Fleet Management Team
The primary recommendation is for SFMTA to empower the fleet management team to lead a process to select a preferred vehicle to replace the retired New Flyer TC vehicles.
DRAFT DRAFT DRAFT DRAFT DRAFT
44
The small team should be comprised of SFMTA staff with representatives from the Transit Division, Sustainable Streets Division, Capital Programs and Construction Division and the Finance and Information Technology Division.
After selection of the preferred new transit vehicle, the team would monitor project progress and review new information to make adjustments or corrections as necessary during the procurement process.
The timeline to make the initial vehicle selection recommendation is between now and August 2011.
5.1.2 Action #2: Preserve Trolley Coach Service at SFMTA The analysis in Section 2 of this report addressed a 2010 snapshot review of SFMTA TC service and compared it to service provided by the existing DMC / DHMC fleet.
5.1.2.1 The TC vehicles were found to be less expensive to operate, but gave up their cost advantages when the greater capital infrastructure costs of a TC fleet were added into the equation. The cost equation shifted back to TC vehicles once more when the receipt of FTA Fixed Guideway Funds for TC service were added to the equation. These findings were similar to findings obtained when Dayton and Seattle studied replacement options for their TC fleets.
5.1.2.2 Given that TC vehicles are competitive or less expensive
than DHMC service, and have the additional benefits of quiet operation, zero emissions, and generally hold higher public support, SFMTA should retain TC service in as many corridors as possible unless unique circumstances argue otherwise.
5.1.2.3 Van Ness Avenue is a unique circumstance where TC
vehicles are proposed to be removed in favor of an all DHMC plan due to concerns about vehicle cost, production and reliability. No U.S. transit vehicle supplier has produced a 5 door TC, and the issues surrounding development of such a vehicle appear formidable.
It is possible that given the scarcity of 5 door motor coaches in U.S. service, that no manufacturer / supplier would produce a 5 door TC vehicle, even if SFMTA sought to obtain them for the BRT project. The challenges appear to exceed an acceptable level of risk on an already complex project.
DRAFT DRAFT DRAFT DRAFT DRAFT
45
5.1.3 Action #3: Select New Vehicle Option Within Budget and with a High Probability of Success As of June 2011, SFMTA has $145 M dollars between FTA Section 5307 / 5309 funds and local funds (San Francisco County Prop. K ) to spend on new vehicles to replace 60 New Flyer 60’ articulated trolley coaches, and 45 NABI 40’ diesel motor coaches. Funds expected to be received as part of the Van Ness BRT project, which is an FTA “Small Starts” project may provide additional funding up to $28 M dollars, for a combined total of $173 M dollars. Although the simpler vehicle design concepts (3 door bus design, DHMC, etc.) may lack some of innovation of the more complex vehicle design concepts (5 door bus design, trolley coach, fuel cell, etc.), the simpler vehicles are more likely to have fewer problems and a higher probability of operations success. Based on the information contained within this report, and recent cost estimate information provided from staff in Fleet Engineering, the following recommendations are presented. 5.1.3.1 Do not select an all TC vehicle option
A preliminary estimate (SFMTA Capital Programs (2009)) to upgrade Van Ness Avenue for an all TC operation was calculated at a cost of $19M-$38M dollars. No capital funding has been identified for this expenditure.
Vehicle replacement funding shows a shortfall of
approximately $3M if an all TC fleet were to be purchased to replace the outgoing TC vehicles. The combination of funding shortfalls listed above is $22M-$41M dollars. TC Service on Van Ness Avenue is not required. Other than promotion of zero emission transit, there does not appear to be a single critical operations rationale to support the presence of TC vehicles as a mode for Van Ness BRT service. The Van Ness-Mission-Ocean corridor is comprised mostly of major thoroughfares so quiet transit vehicle operations are not a critical element of service. Route 49 service comprises about 10 percent of all SFMTA TC service hours (90,000 annual), but because BRT service qualifies for FTA fixed guideway funds, elimination of TC service on Van Ness should not result in the loss of any funding to SFMTA.

DRAFT DRAFT DRAFT DRAFT DRAFT
46
5.1.3.2 Select a Mixed Mode vehicle option The rationale for this selection (30 artic. 60’ length TCs and 30 artic. 60’ length DHMCs) is based on politics/policy and specifically involves the Van Ness BRT project. It preserves a modernized version of the hybrid mixed mode service that is present today with TCs and DHMCs sharing the corridor. This is the option proposed in the Van Ness BRT DEIS/DEIR that is weeks away from public release and comment. A change from this option will result in consequences for the Van Ness BRT project, including required revisions to the environmental document, additional planning and engineering, and added expenses to the SFMTA and the SFCTA.
5.1.3.3 Select an all DHMC vehicle option
The all DHMC vehicle options are the lowest cost options, with the 3 door vehicle sub-option costing an estimated $30M dollars less than the 5 door vehicle sub-option. Both appear to be fundable. A challenge with this option is that it requires the end of TC service on Van Ness Avenue, and if the lowest cost vehicle option (3door) is selected, it requires the use of Alternative 3 (center-side) in the infrastructure design of the Van Ness project after much effort and political investment has been made in support of Alternative 4 (center-center).
5.1.4 Action #4: Secure Funding for New Technology Pilot Transit Vehicles
and Perform Pilot Programs This action will allow SFMTA to obtain direct experience with new vehicle concepts, including but not necessarily limited to the vehicles listed below.
5.1.4.1 Pilot A: TC vehicle – using “series” hybrid motor – placed in an existing SFMTA Orion DHMC SFMTA should proceed with creation of draft specifications to perform the transformation utilizing an existing agency owned Orion 40’ DHMC. The starting point should be the basic information provided by BAE Systems in early 2011, followed by creation of a scope of work to perform the modifications to create the vehicle. Competitive funding for pilot transit vehicle concepts of this type is available from the FTA that should be pursued by the SFMTA. Even if TC service is removed from Van Ness Avenue, SFMTA will continue to operate close to 300 TCs in service, and all of these vehicles will be up for replacement within ten years.
DRAFT DRAFT DRAFT DRAFT DRAFT
47
This pilot vehicle as conceptualized would be a DHMC (diesel engine retained or removed) and trolley poles and other equipment inserted to allow for TC operations. This concept could be the next evolution of the TC vehicle in the U.S., and actually has a significant overlap with the next concept pilot vehicle. If pilot project verifies feasibility and performance, the savings in maintenance, training, spare parts, etc. is possibly significant because both TC and DHMC vehicles would be using the same electric motor and powerplant systems.
5.1.4.2 Pilot B : “Dual-Mode” transit vehicle DHMC / TC This vehicle would the same vehicle as described in Section 5.1.4.1, except it would also have a diesel engine, behind the motor, so the vehicle would be fully loaded with all equipment needed for both modes of operation. The “Dual-Mode” bus would provide the best benefits of a TC vehicle when it operated in TC mode, but it would not be limited to the overhead wire system. Therefore, the vehicle could operate into neighborhoods without overhead wire and it could pass other transit vehicles of any type if needed in regular service or due to service breakdowns.
5.1.4.3 Pilot C: Proterra “Rapid Charge” Battery Bus The Proterra “rapid charge battery bus” appears to be another promising technology breakthrough in an effort to get the benefits of TC service (low energy costs, quiet vehicle noise, green emissions), without the requirement of a large overhead wire system to supply electricity. The pilot project at Foothill Transit in Los Angeles and pilot projects planned in other cities have been 100% grant funded. The acquisition of a 35 foot version for use as a pilot, as specified by Foothill Transit in Los Angeles is one option that should be pursued by SFMTA. A 42 foot version is due out by 2014. As much as Pilot A may be the next TC mode evolution, the Proterra bus may be the next evolution after Pilot A. The SFMTA should investigate and perform both pilot projects. If a pilot proves successful, the SFMTA has more of the electric hardware and infrastructure in place to operate a fleet of these vehicles than any other city in North America.
DRAFT DRAFT DRAFT DRAFT DRAFT
48
5.1.4.4 Pilot D: Fuel Cell Lease from AC Transit
The proximity to AC Transit, the leader in U.S. fuel cell operations among active transit agencies, presents an opportunity for the SFMTA to rigorously test this vehicle mode at a minimal cost and with access to maximum maintenance knowledge. Even if other new transit vehicle technologies appear more promising, the SFMTA should not overlook utilizing this opportunity.
5.1.5 Action #5: Study Feasibility of Transit Vehicle
Sustainability Program to Lengthen Transit Vehicle Lifespan The current vehicle procurement plans at SFMTA call for acquisition of new transit vehicles as soon as possible after they reach their FTA lifespan of 12 years for buses, and 15 years for trolley coaches. It is a “turn and burn” policy: turn the vehicles out to the point of exhaustion, and when they are no longer able to perform, it is time to replace them. Most if not all public transit agencies in the Bay Area follow this course of action. Is this a sustainable practice? Is this a practice the SFMTA should continue to follow? The course of action is predicated on access to FTA transit vehicle replacement funds (section #5307 / 5309) that cover approximately 80 percent of total costs to purchase a new transit vehicle. The remaining 20 percent of vehicle funding is paid by local match funds. The SFMTA has two exceptions that do embrace the concept of sustainability:
• cable cars • F-Line historic streetcars.
Maintenance of these vehicle types has been a priority, because SFMTA staff know there is a finite supply of these vehicles.
Historically, when most U.S. transit was in private ownership, a much greater emphasis on vehicle maintenance and sustainability was in place, because federal capital funding assistance for new vehicles didn’t exist. The result was that due to a mandatory focus on maintenance, buses lasted for 20 years, trolley coaches lasted for 30 years, and light rail vehicles lasted for 40 years. Admittedly in many instances transit vehicles were pushed past their lifetimes, and safety may have been at issue, but regardless of the underlying reasons, the transit managers of long ago clearly acted in a more sustainable manner than their current counterparts. The SFMTA should take a lead role to analyze if current maintenance policies, vehicle replacement strategies, capital funding policies and overall financial management should be modified to focus more on vehicle maintenance and sustainability with a goal toward lengthening the lifespan of fleet vehicles of all modes.
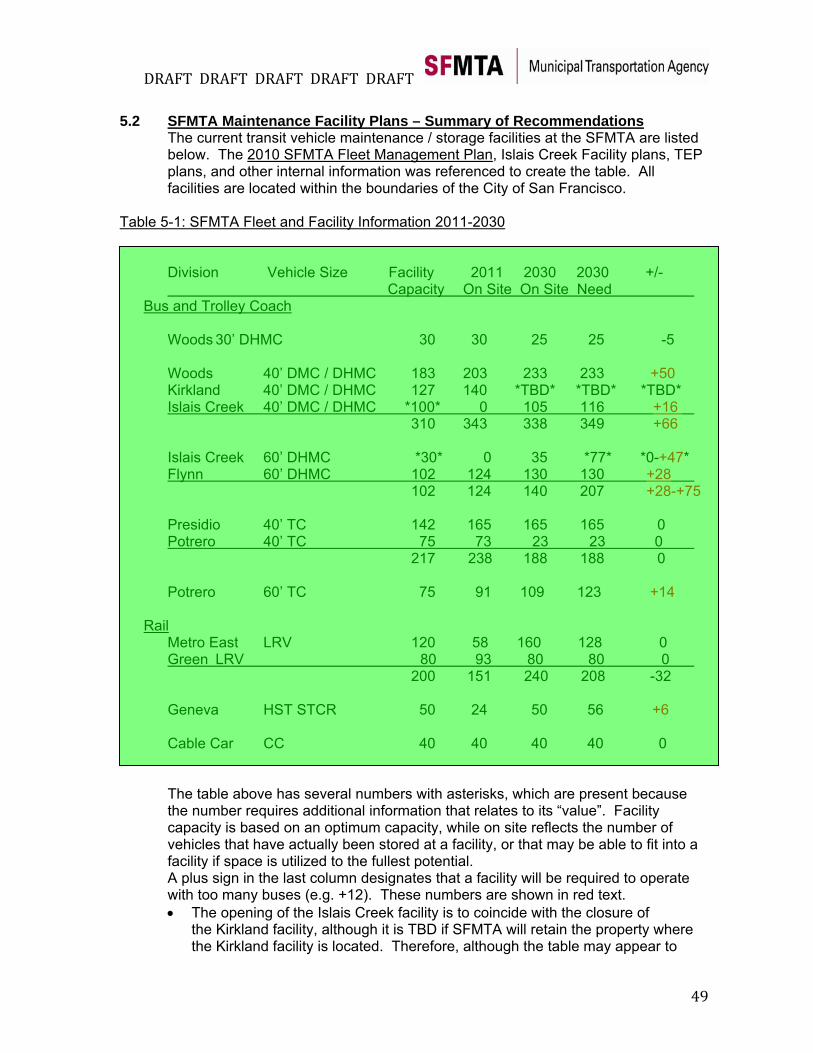
DRAFT DRAFT DRAFT DRAFT DRAFT
49
5.2 SFMTA Maintenance Facility Plans – Summary of Recommendations
The current transit vehicle maintenance / storage facilities at the SFMTA are listed below. The 2010 SFMTA Fleet Management Plan, Islais Creek Facility plans, TEP plans, and other internal information was referenced to create the table. All facilities are located within the boundaries of the City of San Francisco.
Table 5-1: SFMTA Fleet and Facility Information 2011-2030
Division Vehicle Size Facility 2011 2030 2030 +/- Capacity On Site On Site Need
Bus and Trolley Coach Woods 30’ DHMC 30 30 25 25 -5 Woods 40’ DMC / DHMC 183 203 233 233 +50 Kirkland 40’ DMC / DHMC 127 140 *TBD* *TBD* *TBD* Islais Creek 40’ DMC / DHMC *100* 0 105 116 +16 310 343 338 349 +66 Islais Creek 60’ DHMC *30* 0 35 *77* *0-+47* Flynn 60’ DHMC 102 124 130 130 +28 102 124 140 207 +28-+75 Presidio 40’ TC 142 165 165 165 0 Potrero 40’ TC 75 73 23 23 0 217 238 188 188 0 Potrero 60’ TC 75 91 109 123 +14
Rail Metro East LRV 120 58 160 128 0 Green LRV 80 93 80 80 0 200 151 240 208 -32 Geneva HST STCR 50 24 50 56 +6 Cable Car CC 40 40 40 40 0 The table above has several numbers with asterisks, which are present because the number requires additional information that relates to its “value”. Facility capacity is based on an optimum capacity, while on site reflects the number of vehicles that have actually been stored at a facility, or that may be able to fit into a facility if space is utilized to the fullest potential. A plus sign in the last column designates that a facility will be required to operate with too many buses (e.g. +12). These numbers are shown in red text. • The opening of the Islais Creek facility is to coincide with the closure of
the Kirkland facility, although it is TBD if SFMTA will retain the property where the Kirkland facility is located. Therefore, although the table may appear to
DRAFT DRAFT DRAFT DRAFT DRAFT
50
show adequate space if both Islais Creek and Kirkland are in operation, the current plans are not to have them in operation simultaneously.
• The Islais Creek facility was to be a 40’ DMC / DHMC facility with a 165 vehicle capacity, but has been converted to be a mixed 40’ and 60’ DMC / DHMC facility. The revised facility capacities are estimates.
• The shortfall of 2030 60’ DHMC capacity assigned to the Islais Creek facility is based upon an estimated range that assumes either the Islais Creek facility alone is being used (+47 buses), or that the Islais Creek facility is being augmented by vehicle storage at the adjacent Marin facility (+0 buses).
The information above shows the fleet management plan is somewhat integrated with the needs of facilities and maintenance, but improved integration is possible and should be pursued. All DMC / DHMC facilities are overcrowded and in need of relief, and the situation in the future is only going to become more critical. 5.2.1 Recommended Action #6: Obtain Property for a New Vehicle Facility
The information shows adequate rail facilities space for storage and maintenance through 2030 at the four SFMTA facilities. Space at the Geneva facility may be slightly constrained, but due to its location adjacent to the Green facility, proper vehicle management can probably mitigate any crowding issues.
The information shows a shortfall, and possibly a critical shortfall for bus and trolley coach facilities by 2030. Available bus space for 40’ DHMC vehicles has a shortfall of 66 spaces, and for 60’ DHMC vehicles the shortfall is 28-75 spaces.
These figures show a need for acquisition of an additional maintenance and storage facility to support the DHMC fleet is a critical need long before 2030. The existing facilities at Woods, Flynn and the soon to be opened Islais Creek yards are unable to accommodate projected vehicle and passenger growth in the next 20 years. The information also shows a 60’ TC shortfall of 14 spaces at the Potrero Division.

DRAFT DRAFT DRAFT DRAFT DRAFT
51
APPENDIX A
COMPANY INFORMATION FOR NORTH AMERICAN MANUFACTURERS /
SUPPLIERS OF ELECTRIC TRANSIT VEHICLES AND PROPULSION SYSTEMS The current major transit vehicle suppliers and parts producers n the U.S. market are listed below along with basic contact information (2010-2011). New Flyer (only supplier of trolley coach vehicles located in U.S.) 711 Kernaghan Avenue Winnipeg, Manitoba (MB) R2C 3T4 204-225-1251 www.newflyer.com BAE Systems 600 Main Street North American Bus Industries (NABI) Johnson City, NY 13790 106 National Drive 607-770-2000 Anniston, AL 36207 www.baesystems.com316-204-4313 www.NABusInd.com Cummins Inc. 500 Jackson Street Motor Coach Industries (MCI) Columbus, IN 47202 1700 East Golf Road, Suite 300 812-377-5141 / 800-343-7357 Schaumburg, IL 60173 www.everytimecummins.com847-285-8000 / 866-624-2622 www.mcicoach.com Proterra 16360 Table Mountain Parkway Gillig LLC Golden, CO 80403 25800 Clawiter Road 303-562-0500 Hayward, CA 94545 www.proterra.com510-785-6819 www.gillig.com Allison Transimissions 4700 West 10th Street Daimler Buses North America (also Orion) Indianapolis, IN 46206 6012-B High Point Road 317-242-5000 Greensboro, NC 27407 www.allisontansmis om sion.c
8054 336-878-5400 / 800-882-www.daimler-busna.com UQM Technologies 4120 Specialty Place Nova Bus Longmont, CO 80504 2600 Banker Road 303-682-4900 Plattsburgh, NY 12901 www.uqm.com518-566-6682 www.novabus.com Altairnano
304 Edison Way Reno, NV 89502 775-856-2500
www.altairnano.com

DRAFT DRAFT DRAFT DRAFT DRAFT
52

DRAFT DRAFT DRAFT DRAFT DRAFT
53
APPENDIX B
BIBLIOGRAPHY OF INFORMATION SOURCES References
1. San Francisco Municipal Transportation Agency (SFMTA). (2011). State of Good Repair – 2011.
2. Katz, John. (May 2011). Personal interview about fixed guideway funding.
3. SFMTA. Sustainable Streets Division. (May 2011). [Fixed Guideway Funding]. Unpublished project spreadsheet.
4. SFMTA. (May 2011). Trolley Overhead Reconstruction FY 01/02 to FY 10/11. CPT 447.
5. Federal Transit Administration. National Transit Database Report. Retrieved April 2011 from www.ntdprogram.gov
6. Hunniecutt, Gloria. (March 2011). Federal Transit Administration. National Transit Database Report.
7. Parametrix LTK Engineering for King County Metro. (May 2011). King County Trolley Bus Evaluation.
8. Goldman, Joshua. Director of Business Development, Proterra Inc. (May 2011). In-person interview
9. Suain, Glenn. (Oct-Nov 2010). All Electric Buses Make Inroads. Bus Ride Magazine.
10. Barry, Keith. (Nov. 4, 2009). Altairnano Batteries Make Proterra a Magic Bus. Retrieved April 2011 from www.wired.com/autopia/2009
11. Foothill Transit. Bus Schedules, Line 291. Retrieved April 2011 from www.foothilltransit.org
12. Foothill Transit. (May 2011) Personal site visit.
13. Green Car Congress. (Oct. 6, 2010). Opbrid Introduces New Overhead Fast-Charging System for Buses; Leveraging Lithium Titanate Battery Technology for Rapid Charge Hybrids. Retrieved Oct. 2010 from www.greencarcongress.com/2010/10/opbrid-20101006.html
14. TechChunks. (Sept. 20, 2010). Foothill Transit Sets World’s First Rapid Charge Electric Bus. Retrieved from http://techchunks.com/technology/foothill-transit-gets-worlds-first-rapid-charge-electric-bus-videos
15. Garthwaite, Josie. (Aug 31, 2010). Proterra’s Fast Charging Electric Bus Hits the Road. Retrieved from http://gigaom.com/cleantech/proterras-fast-charging-electric-bus-hits-the-road/
DRAFT DRAFT DRAFT DRAFT DRAFT
54
16. Pennsylvania Transportation Institute. (April 2009). STURRA Test (Altona) Proterra. Mudc FCBE 35.
17. Fuel Cell and Hydrogen Energy Association. (March 2011). Building a Commercially Viable National Fuel Cell Electric Bus Program.
18. Electropaedia - Battery and Energy Technologies. Retrieved May 2011 from www.mrpoweruk.com
19. Maddox, John of BAE Systems Inc. (Feb 2011). Presentation to SFMTA staff about the Hybridrive® Propulsion System.
20. Greater Cleveland Regional Transit Authority. (July 2004). Greater Cleveland Regional Transit Authority Draft Procurement Specification for Twenty-one 60’ Articulated Low-Floor Coaches. RFP#2003-045.
21. Checkel, David. (April 2008). Hybrid Diesel Electric Bus/Trolley Bus Demonstration Project Technical Companion of In-use Performance. University of Alberta.
22. Stolte, C. and J. Sirovyk for the Edmonton City Council. (May 2008). Transit Vehicle (Trolley) Technology Renew. Transportation Department 2008-TD1482.
23. Booz Allen Hamilton. (March 2008). Alternative Scenarios for Trolley Bus Replacement – Cost and Environmental Implications. Edmonton, Canada.
24. Greater Dayton Regional Transit Authority. (Nov. 2010). Electric Trolley Bus Benefit-Cost Analysis.
25. O’Claire, Christine of King County Metro. (March 2011). Personal interview and phone call.
26. SFMTA. Transit Division. (March 2011). SFMTA Maintenance Data – Road Calls 2010-2011.
27. Perles, Anthony. (Dec. 1981). The People’s Railway: The History of the Municipal Railway of San Francisco. Glendale, CA: Interurban Press.
28. Kane, John. (1982). Inside Muni: The properties and operations of the Municipal Railway of San Francisco. Glendale, CA: Interurban Press.
29. Metropolitan Transportation Commission. Regional Bus and Van Price List FY 2009-2012, pages 16-18. Agency Resolution #3908. Retrieved from http://apps.mtc.ca.gov/meeting_packet_documents/agenda_1686/tmp-3908.pdf
30. Natvig, Carl for the Sustainable Streets Division of the SFMTA. (May 2011). Rubber Tired Electric Transit Service. Unpublished report.
DRAFT DRAFT DRAFT DRAFT DRAFT
55
APPENDIX C
FUNDING ASSUMPTIONS FOR NEW VEHICLE PROCUREMENT – 2011
Funds for New Transit Vehicle Procurment - Summer 2011 – SFMTA The spreadsheet below assumes SFMTA Fleet Engineering cost estimated developed June 2011, MTC vehicle replacement per unit figures for FY 2012, and revenue or funds sources believed to be present in spring 2011. FUNDS AVAILABLE Source Number Unit Amount Total Amount FTA Vehicle 5307 & 5309 Funds (New Flyer 60' and NABI 40') New Flyer 60' Trolley coach (TC) ($1,300,000) 60 $ 1,395,155 $ 83,709,275 NABI 40' diesel motor coach (DMC) ($562,000) 45 $ 536,874 $ 24,159,333 (The unit amount doesn't match max. fed funding info from MTC) Proposition K (Local Match to FTA funds [20% of federal amount} N/A $ 37,303,779 $145,172,387 Small Starts - Van Ness BRT (vehicle line item #70) funds (9-10 submittal) N/A $27,795,000 Total 105 $172,967,387 EXPENDITURES All cost estimates include a 55% associated costs add-on to reflect the full estimated costs per vehicle Option #1: 3 dr BRT Hybrid Motor Coach Number Unit Amount Total Amount Van Ness BRT - 3dr 60' Hybrid Motor Coach (peak) 24 $ 1,150,000 $ 27,600,000 Spare ratio = 20% 5 $ 1,150,000 $ 5,750,000 Procurement associated costs (Unit costs * 0.55) $ 18,342,500 Total 29 $ 51,692,500 SFMTA - 3dr 60' Hybrid Motor Coach 31 $ 1,150,000 $ 35,650,000 Procurement associated costs (Unit costs * 0.55) $ 19,607,500 Total 31 $ 55,257,500 SFMTA - 40' Hybrid Motor Coach 45 $ 562,000 $ 25,290,000 Procurement associated costs (Unit costs * 0.55) $ 13,909,500 Total 45 $ 39,199,500 Grand Total 105 $146,149,500
DRAFT DRAFT DRAFT DRAFT DRAFT
56
Option #2: 5 dr BRT Hybrid Motor Coach Number Unit Amount Total Amount Van Ness BRT - 5dr 60' Hybrid Motor Coach (peak) 24 $ 1,500,000 $ 36,000,000 Spare ratio = 50% 12 $ 1,500,000 $ 18,000,000 Procurement associated costs (Unit costs * 0.55) $ 29,700,000 Total 36 $ 83,700,000 SFMTA - 3dr 60' Hybrid Motor Coach 24 $ 1,150,000 $ 27,600,000 Procurement associated costs (Unit costs * 0.55) $ 15,180,000 Total 24 $ 42,780,000 SFMTA - 40' Hybrid Motor Coach 45 $ 562,000 $ 25,290,000 Procurement associated costs (Unit costs * 0.55) $ 13,909,500 Total 45 $ 39,199,500 Grand Total 105 $165,679,500 Funding Assumptions Spreadsheet for New Vehicle Procurement EXPENDITURES (contd.) Option #3: 3 dr BRT Hybrid Motor Coach / 3 dr BRT Trolley Coach Number Unit Amount Total Amount
Van Ness BRT - 3dr 60' Hybrid Motor Coach (peak) 9 $ 1,150,000 $ 10,350,000
Spare ratio = 20% 2 $ 1,150,000 $ 2,300,000
Procurement associated costs (Unit costs * 0.55) $ 6,957,500 Total 11 $ 19,607,500
Van Ness BRT - 3dr 60' Trolley Coach (peak) 15 $ 1,400,000 $ 21,000,000
Spare ratio = 20% 3 $ 1,400,000 $ 4,200,000
Procurement associated costs (Unit costs * 0.55) $ 13,860,000 Total 18 $ 39,060,000
SFMTA - 3dr 60' Hybrid Motor Coach 31 $ 1,150,000 $ 35,650,000
Procurement associated costs (Unit costs * 0.55) $ 19,607,500 Total 31 $ 55,257,500
SFMTA - 40' Hybrid Motor Coach 45 $ 562,000 $ 25,290,000
Procurement associated costs (Unit costs * 0.55) $ 13,909,500 Total 45 $ 39,199,500 Grand Total 105 $153,124,500
DRAFT DRAFT DRAFT DRAFT DRAFT
57
APPENDIX D
SFMTA TROLLEY COACH – MOTOR COACH COMPARISON SHEET
OF COSTS AND PERFORMANCE

DRAFT DRAFT DRAFT DRAFT DRAFT
58

DRAFT DRAFT DRAFT DRAFT DRAFT
59
APPENDIX E SFMTA TROLLEY COACH VS. MOTOR COACH / DIESEL HYBRID MOTOR COACH COST
EXPENDITURES Cost Category Info
Source 2010 Motor Coach 2010 Trolley Coach
Total Sub-Category Items sum to total
Sub Category Level 2
Total Sub-Category Items sum to total
Sub-Category Level 2
Total Operations Expenses NTD SFMTA Submittal
243,154,600 148,049,104
Vehicle Operations Costs (includes energy costs – see sub–category 2 diesel and electricity costs)
NTD SFMTA Submittal
116,273,975 10,663,675
69,080,656 974,820
Vehicle Maintenance Costs NTD SFMTA Submittal
49,611,750 29,319,116
Vehicle Non-Maintenance Costs (includes maintenance of TC OCS and TC support systems)
NTD SFMTA Submittal
6,001,881 6,932,929
General Administration Costs NTD SFMTA Submittal
71,266,994 42,716,403
Capital Costs (Infrastructure Replacement) Separate from annual maintenance
SFMTA Comp. Asset Inventory
0 17,081,000
Substation (State of Good Repair) SFMTA Comp. Asset Inventory
0 1,042,000
Overhead (State of Good Repair) (includes trolley wire, ductbanks, tangent span, special work, feed span, poles, foundations, decorative streetlights, pole grounding, manhole)
SFMTA Comp. Asset Inventory
0 16,039,000
New Vehicle Costs (local cost per vehicle)
SFMTA cost estimates
6,104,170 6,720,000
Local match needed / annualized 12 years for MC / DHMC 15 years for TC
SFMTA cost estimates
3,837,500 2,266,670 40’ Info. Assume 307 40’ $0.75M each total (local match =$0.15M each X 307 = $46.05M / 12 = $3,837,500 yr.
60’ Info. Assume 136 60’ $1.0M each total (local match = $0.20M each X 136 = $27.20M / 12 = $2,266,670 yr.)
4,000,000 2,720,000 40’ Info. Assume 240 40’ $1.25M each total (local match = $0.25M each X 240 = $60.00M / 15 = $4,000,000 yr.
60’ Info. Assume 120 60’ $1.70M each total (local match = $0.34M each X 120 = $40.80M / 15 = $2,720,000 yr.
See next page to continue table

DRAFT DRAFT DRAFT DRAFT DRAFT
60
FUNDING SOURCESS Cost Category Info
Source 2010 Motor Coach 2010 Trolley Coach
Total Sub-Category Items sum to total
Sub Category Level 2
Total Sub-Category Items sum to total
Sub-Category Level 2
General Revenue Funds to Operations
Cost carried over from above
243,154,600 148,019,104
General Revenue Fund Match to Capital Costs (Annualized Vehicles)
Cost carried over from above
6,104,170 6,720,000
General Revenue Funds to Capital Costs (Annual Infrastructure)
Cost carried over from above
0 6,441,000
Fixed Guideway Funding
SSD / CPC 0 10,640,000
TOTAL 249,258,770 171,850,104

DRAFT DRAFT DRAFT DRAFT DRAFT
61
COSTS PER SERVICE HOUR COMPARISON Cost Category Info
Source 2010 Motor Coach
2010 Trolley Coach
Total Sub-Category Items sum to total
Sub Category Level 2
Total Sub-Category Items sum to total
Sub-Category Level 2
Funding Scenario with FTA Fixed Guideway Funds Total Service Expenses by Mode and Revenue Source
249,258,770 161,210,104
General Revenue Funds to Operations
243,154,600 148,049,104
General Revenue Funds to Match Capital Costs (Annualized vehicle replacement)
6,104,170 6,720,000
General Revenue Funds to Match Capital Costs
0 17,081,000
Fixed Guideway Funding 0 -10,640,000 Total 249,258,770 161,210,104 Service Hours by Mode 1,425,625 956,266 Cost per Service Hour 174.84 168.58 Mode Leader by Cost per Service Hour
6.26
Calculation of Annual Operations Costs if Service Mode is changed
6.26 X 956,266
Savings vs. Diesel Motor Coach 5,985,117 Funding Scenario WITHOUT FTA Fixed Guideway Funds Total Service Expenses by Mode and Revenue Source
249,258,770 161,210,104
General Revenue Funds to Operations
243,154,600 148,049,104
General Revenue Funds to Match Capital Costs (Annualized vehicle replacement)
6,104,170 6,720,000
General Revenue Funds to Match Capital Costs
0 17,081,000
Fixed Guideway Funding 0 0 Total 249,258,770 171,850,104 Service Hours by Mode 1,425,625 956,266 Cost per Service Hour 174.84 179.71 Mode Leader by Cost per Service Hour
- 4.87
Calculation of Annual Operations Costs if Service Mode is changed
-4.87 X 956,266
Savings vs. Diesel Motor Coach (4,654,883)
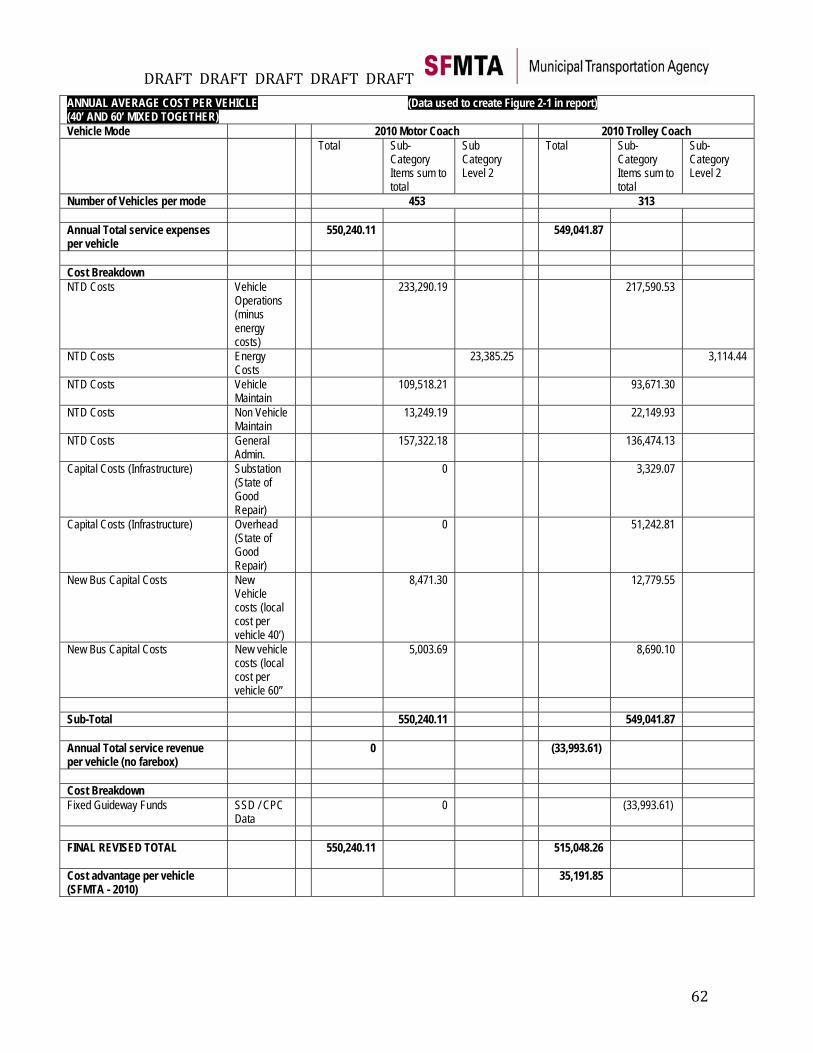
DRAFT DRAFT DRAFT DRAFT DRAFT
62
ANNUAL AVERAGE COST PER VEHICLE (Data used to create Figure 2-1 in report) (40’ AND 60’ MIXED TOGETHER) Vehicle Mode 2010 Motor Coach 2010 Trolley Coach Total Sub-
Category Items sum to total
Sub Category Level 2
Total Sub-Category Items sum to total
Sub-Category Level 2
Number of Vehicles per mode 453 313 Annual Total service expenses per vehicle
550,240.11 549,041.87
Cost Breakdown NTD Costs
Vehicle Operations (minus energy costs)
233,290.19 217,590.53
NTD Costs Energy Costs
23,385.25 3,114.44
NTD Costs Vehicle Maintain
109,518.21 93,671.30
NTD Costs Non Vehicle Maintain
13,249.19 22,149.93
NTD Costs General Admin.
157,322.18 136,474.13
Capital Costs (Infrastructure) Substation (State of Good Repair)
0 3,329.07
Capital Costs (Infrastructure) Overhead (State of Good Repair)
0 51,242.81
New Bus Capital Costs New Vehicle costs (local cost per vehicle 40’)
8,471.30 12,779.55
New Bus Capital Costs New vehicle costs (local cost per vehicle 60”
5,003.69 8,690.10
Sub-Total 550,240.11 549,041.87 Annual Total service revenue per vehicle (no farebox)
0 (33,993.61)
Cost Breakdown Fixed Guideway Funds SSD / CPC
Data 0 (33,993.61)
FINAL REVISED TOTAL 550,240.11
515,048.26
Cost advantage per vehicle (SFMTA - 2010)
35,191.85