tcp/egy/0168 (a) rehabilitation, … (a) rehabilitation, conservation and sustainable utilization of...
TRANSCRIPT

TCP/EGY/0168 (A)
REHABILITATION, CONSERVATION AND SUSTAINABLE UTILIZATION OF MANGROVES IN EGYPT
EGYPT
COMMUNITY-BASED MANGROVE REHABILITATION AND ECOTOURISM DEVELOPMENT AND MANAGEMENT IN THE RED SEA COAST, EGYPT
by
D. M. Cabahug FAO Consultant
MINISTRY OF AGRICULTURE & LAND RECLAMATION
MINISTRY OF STATE FOR ENVIRONMENT
FOOD AND AGRICULTURE ORGANIZATION OF THE UNITED NATIONS
Cairo, September 2002
Consultancy Report TCP/EGY/0168(A)

ii

iii
ACKNOWLEDGEMENTS
It is the pleasure of the consultant to acknowledge and thank the following persons who in one way or the other have significantly contributed to the successful completion of the consultancy work:
• Mr. Farag Thasi Camel Owner, Bedouin Garghana Village
• Mr. Gomaal Mohamoud Fisherman, Bedouin Garghana Village • Mr. Esmaiel Mahamoud Fisherman, Bedouin Garghana Village • Mr. Mamdouh Apok Taleed Fisherman, Bedouin Garghana Village • Mr. Mohamed Lebba Fisherman, Bedouin Garghana Village • Mr. Selme Soliman Community Bedouin Worker, Nabq
Multiple Managed Protected Area • Mr. Sheik Oda Chieftain, Bedouin Garghana Village • Bedouin Representative/Leader Wadi Al-Qu’lan delta, Hamata • Mr. Maqed Samir Income Department, South
Sinai Protectorate Sector • Mr. Amr Tawfik Accountant in Nabq, South Sinai
Protected Areas • Ms. Eusa Dell’ Ores Tourist/Visitor, Nabq • Mr. Magdy Saad Park Ranger, Ras Mohammed, South
Sinai Protected Areas • Mr. Essam Saadalla Deputy Manager, South Sinai Sector,
Protected Areas • Mr. Hesham Gabr • Mr. Ayman Mabrook Manager, Nabq Multiple Managed
Protected Areas • Mr. Omar Hassan South Sinai Sector Manager • Mr. Rady Tawfik Rady Tawfik, Head of Income
Department, South Sinai Protected Areas • Dr. Mohamed A. S. Abdel Monem FAO Programme Officer for Egypt • Dr. Hassan Osman Abdel Nour FAO Senior Forestry Officer, RNE • Dr. Mahmoud Abdel Radi Dar National Institute of Oceanography and
Fisheries • Mr. Ayman Afify Manager, Red Sea Marine Parks • Mr. Ahmed Md. A. El Khalik Research Officer, Red Sea Protectorate,
Marsa Alam • Dr. Mostafa Fouda Egyptian Environmental Affairs Agency • Dr. Nasser Galal National Mangrove Consultant • Dr. Alain Jeudy de Grissac Programme Manager, South Sinai
Protected Areas • Dr. Ahmed K. Hegazy Mangrove Project Coordinator • Dr. James Kairo FAO Special Consultant • Mr. Mohammed Gad El-Rub Mahmoud Elba Protectorate, Shalateen • Dr. Mamdouh Riyad HE Ministry of Environment

iv
• Mr. Waleed M. Salama Research Officer, Red Sea Protectorate, Hurghada
• Dr. Peter Saenger FAO Special Consultant • Dr. James Spurgeon FAO Special Consultant • Mr. Ayman H. Taher Secretary General, HEPCA • Mr. Mohamed Abbas Elsaid Tahoon Research Officer, Red Sea Protectorate,
Quseir • Ms. Mette Loyche Wilkie FAO Forestry Officer, Rome Once again, heartfelt appreciation is given to the abovementioned persons for their
unselfish cooperation, assistance and guidance throughout the entire duration of the project implementation.

v
TABLE OF CONTENTS
ACKNOWLEDGEMENTS ................................................................................................. iii
TABLE OF CONTENTS ...................................................................................................... v
LIST OF ACRONYMS....................................................................................................... vii
EXECUTIVE SUMMARY .................................................................................................. ix
1. INTRODUCTION........................................................................................................ 1
1.1 Study background ................................................................................................ 1
1.2 Methodology/approach of the study ..................................................................... 2
2. ANALYSIS OF CURRENT AND POTENTIAL NATURE-BASED TOURIST ATTRACTIONS ALONG THE RED SEA IN EGYPT ................................................ 3
2.1 Mangroves as an Ecological Tourist Destination.................................................. 4
3. THE FEASIBILITY OF PROMOTING ECOTOURISM IN MANGROVE AREAS... 7
3.1 Ecotourism: Definition and Concepts................................................................... 7
3.2 Potential of Mangroves for Ecotourism................................................................ 8
3.3 Product, Place and Promotion ............................................................................ 10
3.4 Environmental Considerations ........................................................................... 11
3.5 Proposal to Upgrade Visitor Facilities at Nabq................................................... 13
4. OTHER POTENTIAL INCOME-GENERATING ACTIVITIES................................ 15
4.1 Community-based Mangrove Rehabilitation and Management (CBMRM)......... 15
4.2 Community-Based Small-Scale Ecotourism Enterprises (CBSSEE)................... 16
4.3 Seedling Production for Landscaping and Urban Greening ................................ 18
4.4 Composting and Waste Recycling...................................................................... 20
4.5 Beekeeping/Apiculture ...................................................................................... 20
5. SOCIO-ECONOMIC AND INSTITUTIONAL DEVELOPMENT............................. 23
5.1 Socioeconomic Profile of Nabq.......................................................................... 23
5.2 The community organizing (CO) framework and activities for Community- based Ecotourism and Mangrove Resources Management (CBEMRM)....................... 27
5.3 Community Organizing Strategy........................................................................ 28
6. SUMMARY AND RECOMMENDATIONS.............................................................. 29
REFERENCES ................................................................................................................... 31
ANNEX INVESTMENT APPRAISAL OF UPGRADING VISITOR FACILITIES AT NABQ PROTECTED AREA............................................................................. 35

vi
LIST OF FIGURES Figure 1 Community organizing strategy for community-based ecotourism and mangrove
resources management. ...................................................................................... 28 Figure 2 Trends in total revenue collection at Nabq Protected Area 1997/98 - 2001/02 .... 36 Figure 3 Trend in the number of foreign tourists visiting Egypt 1980 - 2001.................... 37 Figure 4 Trends in the number of visitors to Sharm El Sheik 1997/98 - 2000/01 .............. 38 Figure 5 Trends in the number of visitors to Nabq Protected Area 1997/98 - 2000/01 ...... 39 Figure 6 Trends in visitor numbers to Nabq Protected Area 1997/98 - 2000/01 and
projections from 2003/04 to 2012/13 ................................................................. 40 Figure 7 Seasonality of visitor numbers to Nabq Protected Area 1997/98 - 2000/01......... 41 Figure 8 Increases in foreign visitor numbers at Nabq required under a range of different
assumptions about increases in entrance charges ................................................ 66 Figure 9 Trend in the EGP:USD exchange rate from 1997/98 to 2002/03......................... 67 Figure 10 Effect of continued depreciation in the EGP:USD exchange rate on the internal
rate of return (IRR) on investment in visitor new facilities at Nabq .................... 68
LIST OF TABLES Table 1 Population of the Bedouin in the Southern Red Sea Zone................................... 24 Table 2 Visitors to Sharm El Sheik and Nabq Protected Area ......................................... 38 Table 3 Projected entrance charges to Nabq Protected Area under the two options ......... 42 Table 4 Estimated building construction and maintenance costs for upgrading the visitor
facilities at Nabq Protected Area ........................................................................ 45 Table 5 Estimated costs of construction and maintenance of other facilities as part of the
upgrading of visitor facilities at Nabq Protected Area ........................................ 47 Table 6 Estimated costs of purchasing other equipment for visitors as part of the
upgrading of facilities at Nabq Protected Area ................................................... 49 Table 7 Estimated staff salary costs at Nabq Protected Area ........................................... 51 Table 8 Estimated costs of purchasing other equipment for staff as part of the
upgrading of facilities at Nabq Protected Area ................................................... 54 Table 9 Cash-flow for Option 1 - do nothing (baseline option) ....................................... 59 Table 10 Discounted cash-flow for Option 1 - do nothing (baseline option)...................... 60 Table 11 Cash-flow for Option 2 - invest in upgrading visitor facilities at Nabq ............... 62 Table 12 Discounted cash-flow for Option 2 - invest in upgrading visitor facilities
at Nabq .............................................................................................................. 63 Table 13 Summary of the discounted cash-flow analysis for Options 1 and 2 ................... 64 Table 14 Sensitivity analysis of changes in the assumptions about visitor numbers and
increases in entrance charges at Nabq if visitor facilities are improved............... 66

vii
LIST OF ACRONYMS ALAs Alternative Livelihood Activities ANR Assisted Natural Regeneration CBMRM Community-Based Mangrove Rehabilitation and Management CBSSEE Community-Based Small Scale Ecotourism Enterprises CD Community Development CO Community Organizing EEAA Egyptian Environmental Affairs Agency FAO Food and Agriculture Organization of the United Nations FRA Fisheries Resources Authority EP Enrichment Planting GEF Global Environmental Facility HANDS Hands Along the Nile Development Services; Linking Americans and Egyptians for Cultural Understanding, Community Development and Hope HEPCA Hurghada Environmental Protection and Conservation Association ICZM Integrated Coastal Zone Management IGA Income Generating Activities IPAS Integrated Protected Areas System ITTO International Tropical Timber Organization LGU Local Government Unit MALR Ministry of Agriculture and Land Reclamation MOT Ministry of Tourism MSE Ministry of State for Environment MSI Mangrove Stand Improvement NCICZM National Institute for Remote Sensing and Space Sciences (under the SMSR) NCS Nature Conservation Sector (of EEAA) PERSGA Regional Organization for the Conservation of the Environment of the Red Sea and Gulf of Aden PO Peoples Organization RSG Red Sea Governorate SAP Strategic Action Programme (of PERSGA) SMSR State Ministry for Scientific Research TDA Tourism Development Authority (under MOT) TCDC Technical Cooperation between Developing Countries TCP Technical Cooperation Programme (of FAO) UAE Under-secretariat for the Afforestation and the Environment (under MALR) UNDP United Nations Development Programme UNESCO United Nations Education Scientific and Cultural Organization

viii

ix
EXECUTIVE SUMMARY
Mangroves produce a number of very valuable ecological benefits. However, these benefits are largely intangible and do not provide income or revenue for the managers of the mangroves or for other stakeholders living in and around them. Therefore, they are often considered as “wasteland” rather than as highly prized ecosystems.
In order to capture the interest and understanding of all stakeholders in and around
mangroves, it is important to try to convert some of this intangible ecological value into a monetary value. One way in which this can be done is through the development of ecotourism in the mangroves. Ecotourism can provide considerable benefits to the environment, local stakeholders, visitors to the mangroves and the agencies responsible for the management of the mangroves. With thorough planning and careful consideration of the economic, environmental and cultural aspects of such developments, ecotourism can contribute to conservation, education, resource protection and the involvement and empowerment of local people.
In addition to the development of ecotourism, the development of other income
generating activities in and around mangroves can also contribute to the protection of the mangroves and improve the lives of local stakeholders.
The current status of ecotourism development in mangroves on the Red Sea Coast The global market for ecotourism is huge, but ecotourism in the Red Sea accounts for
only a small share of this market. For example, in 2000/01, 551,204 people visited the Red Sea Coast, particularly for diving and snorkelling (Hegazy 2002). However, at the global level, this number of visitors only accounts for about 2.5 percent of this segment of the ecotourism market (Mustafa 2002).
Ecotourism has been developed in mangroves throughout the Red Sea Coast, but most
of this development has taken place in South Sinai. In South Sinai, an average of around 400,000 tourists have visited Ras Mohammad and Nabq each year, mostly for diving, snorkelling, eco-cruising, sightseeing, safari and eco-adventure. Although mangrove areas are limited in Ras Mohammad, they form part of the ecotourism attraction, especially for those who travel by land. At Nabq, the main ecotourism destination is Shora Al Rowaisseya, which includes mangroves, a lagoon, sea grass meadows and a shipwreck. The number of visitors to Nabq (Egyptians and foreign tourists) amounted to 21,500 in 2000/01, with foreign tourists accounting for the majority of visitors to the area.

x
The potential for new ecotourism developments in mangroves on the Red Sea Coast Participants in the consultative workshop, held at the Training Centre of South Sinai
Protectorate on 22 August 2002, assessed the potential of mangroves in Marsa Abozabal and Shora Manqautta as ecological tourist destinations. To promote these areas to tourists and visitors, the participants suggested the following:
1. upgrade and maintain the facilities in Nabq;
2. install additional facilities such as basic amenities for tourists; and
3. construct non-intrusive ecotourism facilities in a natural setting.
This strategy is meant to address the minimum limit of acceptable changes to maintain and sustain the integrity and stability of the uniqueness of the biophysical characteristics of the sites.
During the conduct of a focus group discussion in Hurghada on August 24 2002, the
manager and some technical staff of the Red Sea Protectorate initially selected and ranked the mangrove areas, including the immediate environs of Sharm El Qebly, Al Gouna, and El Queih (Wadi Abu Hamrah) as suitable areas for promoting and developing natural resource-based ecotourism along the Red Sea Coast.
The Red Sea Protectorate staff considered five islands and islets with mangrove
stands in the Red Sea, and they selected and ranked Abu Monkar, Wadi Gimal and Geisum Islands/Islets as highly viable for ecotourism. While these islands are protected and closed for landing, facilities with low intensity, low density and are non-intrusive may be permitted to ensure the integrity, stability and sustainability of the islands as habitats for birds and other wildlife for the tourists to appreciate.
In the consultative meeting of the Elba Protectorate on 26 August 2002, its manager suggested to develop and promote Marsa Sha’Ab, El Hoor and Marsa Abou Fasi as biodiversity and genetic conservation areas, hence, access to these areas is limited.
Investment appraisal of a proposal to upgrade visitor facilities at Nabq
The mangrove area of Shora Al Rowaisseya in Nabq has demonstrated that mangrove areas can be promoted as ecological tourist destinations, so long as sufficient and appropriate visitor facilities are provided. Furthermore, a study at Nabq has indicated that visitors are willing to pay higher entrance charges if the services provided at the site would be improved. Therefore, a proposal to improve the facilities at Nabq was developed in consultation with local stakeholders.
In terms of future revenue, two assumptions have been made. Firstly, it has been
assumed that future visitor numbers will increase in line with the historical trend in the increase in visitor numbers to Nabq (a scenario of lower growth in visitor numbers has also been analysed as well). The second assumption that has been made is that entrance charges can be doubled if the facilities at Nabq are improved.

xi
On the cost side of the equation, the proposed development includes the construction of new facilities such as shelters, cafeterias, a craft workshop, carparks, walking trails, viewing decks and boardwalks. It includes measures to improved information about the area, including road signs and direction signs within the site, information panels and the distribution of brochures about Nabq. It also includes expenditure on new equipment for staff at the site to improve the level of service that they can provide.
The complete investment appraisal of this proposal is given in the annex to this report
(starting on Page 35). Under the assumptions made about future growth in visitor numbers and the assumption that entrance charges at Nabq can be doubled, the expected increase in revenue from visitor entrance charges is more than enough to justify the investment in new facilities. Indeed, the investment in new facilities is projected to earn a rate of return on the investment of between about 30 percent and 40 percent, depending on future increases in visitor numbers.
However, the crucial variable in this analysis is the assumption that entrance charges
can be doubled if the facilities at Nabq are improved. If it is not possible to raise entrance charges by so much, then an increase of at least 64 percent in the charges for admission to the site will be required to earn a rate of return of 10 percent on the investment in new facilities. If it is believed that it will not be possible to increase charges by this much, then it may still be economically feasible to develop the site at a smaller scale and with a lower level of investment.
The potential to develop other income-generating activities in the area The development of income-generating activities for the local Bedouin community
should be compatible with the conservation and sustainable utilization of the mangroves in the area. With this in mind, the following activities have been identified:
1. Community-based Mangrove Rehabilitation and Management (CBMRM) 2. Community-based Small-scale Ecotourism Enterprises (CBSSEE) 3. Home-gardening 4. Seedling production for landscaping and urban greening 5. Composting and waste recycling 6. Beekeeping

xii
Using a matrix of selection criteria and ranking, the following potentially suitable sites for CBMRM have been identified:
1. Nabq Multiple-Use Managed Protected Area
a. Al Garghana b. Marsa Abozabad c. Shora Al Rowaisseya d. Shora Al Manqautta
2. Elba Protectorate Area
a. Adel Deep b. El-Hamirah
3. Red Sea Marine Parks Areas
a. Sharm El-Qebly b. Hamata’s Mangrove Cluster/Group Stand c. South of Safaga (um hawitat) d. Wadilahmi
Of these areas, it is recommended that Al Garghana, El Hamirah and Sharm El Qebly
should be initially selected for development of CBMRM at a pilot level.
The following mangrove areas were also selected for CBSSEE:
1. Nabq Protected Area
a. Al Garghana b. Marsa Abozabad c. Shora Al Rowaisseya d. Shora Al Manqautta
2. Red Sea Marine Park Area
a. Sharm El Quebly b. Hamata Mangrove Areas
• Wadi Al-Qu Lan Delta • Wadi Masturah • Wadi Rawad El-Adaiah • Wadi Harbiyyah

xiii
The community-based approach of mangrove rehabilitation and ecotourism enterprises should include the following components/activities:
1. awareness creation and social mobilization through a social marketing
strategy;
2. capacity building of the local people as partners in mangrove rehabilitation and ecotourism;
3. liaison and networking by creating and institutionalizing a national
coordinating agency or committee; and 4. capacity building of the technical staff of involved agencies to strengthen
their social, technical and organizational knowledge and skills in implementing community- based mangrove projects.
Furthermore, because income and employment in the community as a whole is
limited, these activities should be integrated with other sustainable development initiatives of the Ministry of State for Environment at the local level.
The CBMRM and other alternative livelihood/income-generating projects can
supplement and augment the local people’s income and employment since ecotourism markets are seasonal and are sensitive to external influences such as the peace and order situation in neighbouring Arab countries, political changes and economic instability of Egypt and/or countries of origin of visitors/tourists. The horizontal integration within the community and vertical integration with national level initiatives will also be necessary for the success of local ecotourism to support and promote responsible tourism at the country-based level.
The proposed project of CBSSEE should link with the support program of European
Union (EU)-funded projects for Bedouins in Nabq, particularly the provision of basic services to Bedouins such as primary health care, drinking water/potable water, support for veterinary and fisheries services, job opportunities and handicraft work for women.
In addition to making linkages with the EU-Bedouin Support Program in Nabq, the national level support of MSE, MOT and MALR are necessary to promote community-based ecotourism with appropriate legislations and assistance towards small enterprises and community initiatives, and national and international promoters. It is also a meritorious work if at an early stage of establishing community-based ecotourism in Egypt, efforts are undertaken to be aware of and learn from the lessons of other countries with community-based schemes and seek mutually beneficial coordination from other national and international agencies. The lesson learned from community-based initiatives of UNDP, HANDS, EU, USAID and World Bank in other parts of Egypt, particularly communities along the Nile River and urban poor in Cairo City will serve as jumping board/benchmark for the development and implementation of a pilot community-based ecotourism and mangrove rehabilitation initiative in Nabq Protected Area.

1
1. INTRODUCTION Mangroves, consisting of trees and bushes growing below the high water level of
spring tides, are the most typical forest formations of sheltered coastlines in the tropics and subtropics. They are key components of the interrelated parts of the coastal ecological systems that attract the attention and appreciation of visitors that are nature-oriented, research-oriented or are natural scientists.
Considered to be unique elements of coastal ecosystems, mangroves are among the
most productive ecosystems, which directly or indirectly provide economic and ecological benefits to man. They serve as buffers or inter-tidal protective zones against typhoons, storm surges and tidal waves, preventing soil erosion and minimizing water pollution; are instrumental in building considerable areas of tidal land; and provide unique habitat, sanctuary and breeding ground for endemic, rare and endangered species of aquatic and terrestrial flora and fauna.
Any disturbance in the structure of any ecosystem causes adverse effects on the
dynamics of the whole system. In some instances, the disturbance exceeds the tolerance limit of the ecosystem, resulting in resource degradation, which ultimately leads to irreversible and irreparable damages. Continuous indiscriminate use of mangroves has grave implications on the stability of coastal-island communities.
For instance, the economic interests in the utilization of mangroves are often in
conflict with the ecological value of mangroves. Causes of mangrove forest destruction in every country vary––from conversions into fishponds to overexploitation for timber, firewood, charcoal and tanbark to improper management of ecotourism development activities, overgrazing, among other things. Once the mangroves are converted or severely degraded, they are no longer able to function as a natural system, thus generating unpredictable environmental problems.
Destruction of mangroves will inevitably have adverse effects on the lives of the local
people, particularly on their income, food security and other related basic needs. In Egypt, mangroves are an important scarce resource. The government of Egypt
recognizes the close link between coral reefs and associated ecosystems, as well as the wide range of goods and services they provide, including ecotourism development, which is a boon for the local and national economy. As such, Egyptians have initiatives on mangrove conservation and protection.
The Ministry of State for the Environment (MSE), through its Egyptian
Environmental Affairs Agency (EEAA), and the Ministry of Agriculture and Land Reclamation (MALR) are the lead institutions. A number of other agencies, institutions and organizations are, however, also concerned with the mangrove resources of the country.
1.1 Study background A Global Environment Facility (GEF)-funded project formulated the integrated
coastal zone management (ICZM) action plan for the Egyptian Red Sea. Within the ICZM

2
framework, a number of activities have been undertaken in coastal areas but in mangroves it is limited only to surveying and mapping of mangrove areas.
The concerned agencies on mangroves such as the MSE-EEAA and the Ministry of
Agriculture and Reclamation (MALR) had no actual field experience in the conservation and management of mangrove ecosystems. Hence, the Government of Egypt availed the technical assistance of FAO to prepare a national mangrove development program geared towards the conservation and sustainable management of mangrove ecosystem.
This particular project addresses the objective of “conducting studies and pilot
activities on mangrove conservation, rehabilitation and sustainable utilization to gain experience necessary for the development and implementation of a national mangrove conservation and development programme”.
Notwithstanding its several expected outputs, the present study primarily aimed at
identifying potential mangrove-based income-generating activities to improve the economies of local communities, while conserving the mangroves. These income-generating activities, such as ecotourism and benefits from non-wood forest products, must complement conservation efforts.
Specifically, the consultant was tasked to: • analyze current potential nature-based attractions along the Red Sea Coast of
Egypt; • examine the feasibility of promoting ecotourism in mangrove areas; • identify potential income-generating activities for local communities that are
compatible with the conservation and sustainable utilization of mangroves; • provide an in-service training to counterparts and conduct a one-day seminar on
the findings and recommendations of the consultancy; and • produce a consultancy report with findings and recommendations, which could
assist the Egyptian Government in implementing a national development programme for the rehabilitation, conservation and sustainable utilization of mangroves in Egypt.
The consultancy lasted a month in one mission, covering the period of 4–30 August
2002. The consultant was based in Cairo, with field trips to the coastal areas along the Red Sea. During the mission, the consultant worked with the rest of the team and representatives from various government departments, particularly the EEAA, Tourism Development Authority and the FAO regional office.
1.2 Methodology/approach of the study The study was primarily conducted through secondary data gathering, personal
interview of key informants, focus group discussions, field visits and direct personal observations.

3
2. ANALYSIS OF CURRENT AND POTENTIAL NATURE-BASED TOURIST ATTRACTIONS ALONG THE RED SEA IN EGYPT
Nature-based tourism includes a full range of outdoor activities. In particular, the Red
Sea offers ecological cruise and other adventures. Special tours to sites with interesting seascapes and landscapes are also offered by a range of diving and resort operators. The marine environment allows tourists to appreciate the coral reef and its associated fish and other fauna through scuba diving and snorkelling. The Hurghada Environmental Protection and Conservation Association (HEPCA), an association of owners of resorts, hotels, dive shops and other tourism establishments in Hurghada, estimate that each week, more than 700 boats cruise the Red Sea, between Hurghada and the coral reef areas, located within an hour from Hurghada. An average of 20 percent of the total visitors in Hurgada in 2000–2001 (estimated at 551,204) visited Giftums and Far Islands for diving, snorkelling, and ecological cruising and sightseeing. The tourists visited the area mainly for relaxation (Hegazy, 2002).
Four species (the green, loggerhead, hawksbill and leatherback) of marine turtles nest
along the Red Sea Coast. Divers frequently see these turtles foraging on reefs and sea grass beds. But most of the nature-based tourists were found to prefer cruising the Red Sea for adventure and sightseeing. The crystal blue waters and the fascinating landscape of the Red Sea Coast include sea grass meadows, mangroves, white sand beaches and shallow flat reefs. The seascape and landscape include the open-water lagoon, tidal flats, mangroves, tidal channel façade, islets and islands. The fringing coastal landscape is dominated by fossil reefs in terraces and represents successive rising and falling sea levels (Lacovara et al. 2001).
There are 25 protected islands in the Red Sea as listed in the Prime Minister’s Decree
No. 642 /1995. The Red Sea is an internationally significant migratory route of millions of birds who pass through Egypt to escape the European autumn and winter, rest and roost in the mud flats, tidal flats, islets, mangroves and shallow reef and islands along the Red Sea. Many of the Red Sea’s islands are of global significance because they are the habitats of the endemic white-eyed gull. It is estimated that 30 percent of the world population of this bird breed on the islands at the mouth of the Gulf of Suez connecting the Red Sea. The islands of Tiran, Ashrafi, North Quisum, Tawila and Zabangad are among the most important breeding habitats for sea birds. Among the important Red Sea coastal birds that tourists often see during cruises are osprey, Reef heron, Green-backed heron, Brown booby, White-eyed gull, Hemprich’s gull, Lesser crested tern and Caspian tern (HEPCA, 2001). Thousands of dolphins are sighted at the Dolphin’s Reef, which is one hour by speedboat from the Shagra diving village (Helmy, pers com). Dolphins usually rest and stay in these sites.
The Red Sea is also known for its cultural heritage and historical sites, particularly the
Ras Mohammad National Park, where both Christians and Muslims go on a pilgrimage. Moreover, adequate world-class infrastructure and support facilities are available. Added to these are the warm and cordial accommodation of the local people, the active promotion of tourism, the government’s liberal policy on tourism and land ownership and the Red Sea’s strategic location, particularly for European tourists such as those from Italy, France and Germany.

4
2.1 Mangroves as an Ecological Tourist Destination The mangroves along the Red Sea in Egypt, including those along the coast of the
Sinai Peninsula, are a remarkable sight. The view of the desert, particularly along the central and northern parts of the Red Sea is desolate, dry and generally barren and the mangroves provide a welcome scenic landscape. In Nabq, Shalateen and Halaib, mangroves noticeably thrive vigorously at the mouths of wadis (seasonal riverbeds), where there are suitable sediments and sources of freshwater, in which mangrove stands thrive. Although the wadis appear dry, except during occasional rainstorms, the freshwater from flash floods and groundwater allow the Avicennia marina stands to grow in a high-saline substrate frequently inundated by seawater. From the southern part of Shalateen to Halaib, Rhizophora mucronata thrive well in contiguous blocks.
This indicates that the area has sufficient supply of freshwater from rainfall and
groundwater. As reported by the key informant, rainfall occurs more often in the southernmost part than in the central part of the Red Sea (Galal, pers com, 2002).
Mangroves in Abu Monkar and Geisum Islands provide some greenery in areas where
no other vegetation thrives. Italian, Russian and German tourists are common visitors to the area. In Ras Mohammad National Park, the mangroves are a regular ecological destination for tourists who access the park by land. Nature-oriented tourists are awed by the mangrove survival in the midst of the desert, in the crevices created by a narrow fault line connected to the sea.
In Al Rowaisseya and El-Garghana, the mangroves and the integral immediate
environment are the focal destinations of tourists inside the Nabq Multiple-Management Protected Area. Mangroves in Ras Mohammad and Al Rowaisseya are fenced or lined with nylon ropes to limit the access of tourists and to guide them to other places of attraction such as the shipwreck in Al Rowaisseya. The Manager of the Nabq Protectorate estimated that almost 90 percent of the visitors to the Nabq ecotourism area consider Al Rowaisseya as their final and focal destination after watching the landscape and scenery of the wadis, tamarix and the desert along the winding and bumpy tracks inside the protected area.
Based on the records of the Income Department of the South Sinai Protectorate, the
number of foreign tourists who visited the Nabq Protected Area amounted to 15,750 and 19,800 in 1997/98 and 2000/01, respectively. The mangrove area in Al Rowaisseya was the primary ecological destination of the tourists. Visitors to Nabq are expected to increase further once the construction of 28 hotels is completed within the next five years. Most of these hotels will be located about 5 km from the gate of the Nabq Protected Area. Galal (2002) estimated that at least an additional 20,000 tourists will be coming to Sharm El Sheik once the 28 hotels are fully operational.
There is an increasing demand for ecotourism throughout the world. The Red Sea has
the necessary infrastructure and facilities to capture the potential market in ecotourism. It has the internationally well-known and protected coral reef and near-shore shallow areas for scuba diving and snorkelling. However, the facilities in Nabq need to be improved. The increase in the number of visitors must also be monitored in terms of the absorption capacity or limit of acceptable change (LAC) at the site, particularly in the mangrove areas if they are to be used as a focus of ecotourism development.

5
Mangroves are part of the coastal habitat “mosaic”, which occurs in patches along the coast of Egypt. They are key components of the coastal ecosystem, which filter and block sediments from the unstable substrates of the wadi and the desert (particularly during occasional rainstorms) and prevent the siltation of sea grass beds and coral reefs.
Although the mangroves are only a small part of the total ecological tourist attraction
of the Red Sea, there are resort and hotel operators that promote these as an important focus of ecotourism. In Sharm El-Quebly, one resort operator identified and plans to construct a boardwalk into and around the mangrove areas. The Sheraton Miramar Resort in El Gouna protects the mangrove islet facing the seacoast entrance of the resort, which serves as a green buffer to shield the coastline facilities of the resort. The Mangrove Bay Hotel, located 30 km south of Quseir, was named as such because of the existing mangrove stand adjacent to its resort in Sharm El Bahari. The mangrove stand in front of the White Villas in El Gouna promotes mangroves as a natural ambience that enhances and accentuates the scenery of the Red Sea Coast.
However, the ecological importance of the mangrove stands adjacent to the El Gouna
(White Villas and the Sheraton Miramar) and the Marsa Shagra (Shagra diving village) are at times, not fully understood by the resort and hotel operators. The Mangrove Bay Resort staff for example periodically spray insecticides on the mangrove stand to eradicate mosquitoes (Gad, M, Personal Communication, 19 August 2002).
The 14 mangrove bushes of Avicennia marina described by Saenger (2002) are
threatened by extinction because of compaction (as part of the football or soccer field and the cut-off of the supply of freshwater and saline water. The mangrove stand in the islet fronting the Sheraton Miramar Resort physically manifests stress conditions although the hotel manager vouches of its protection. Regeneration is wanting and empty spaces cut off the continuous distribution of Avicennia marina in the islet. This was obviously a result of the alteration of the islet’s natural landform. The concrete ripraps along the resort’s façade show erosion of the bank, probably induced by the splash of seawater on the unstable bank, which is perhaps a result of dredging and the force of currents or waves created by passing speedboats. The altered land use of the islet manifests the lack of understanding of the biophysical and hydrological dynamics of mangrove ecosystem, thus affecting the growth of the Avicennia stand and stability of the islet.
The mangroves’ uniqueness as part of the mosaic of coastal habitats and their
significant ecological functions as links between and among the desert and the wadi terrestrial ecosystem and the marine ecosystem should be fully understood to awaken the interest and appreciation of the operators and tourists.
People are fascinated by or attracted to the mangrove stands in the middle of barren
deserts. They protect these because of existing laws protecting the mangroves but they lack understanding of the dynamics of mangroves as a crucial link to the terrestrial and marine ecosystems. It is not enough that the general public is aware of the physical presence of mangroves to motivate them to value the mangroves highly. There is a need to translate the ecological value of mangroves into monetary terms. Thus, effective social marketing should be designed and undertaken instead of merely producing information and education campaign materials. There is a need to motivate people into action, especially those in the ecotourism industry and local inhabitants to participate actively in the rehabilitation, conservation and management of mangroves and the immediate coastal ecosystem.

6
7
3. THE FEASIBILITY OF PROMOTING ECOTOURISM IN MANGROVE AREAS 3.1 Ecotourism: Definition and Concepts
Ecotourism has become a new tool to promote environmentally and culturally friendly tourism. The potential of ecotourism for assisting in resource conservation and community development has drawn considerable attention. Ecotourism has unique characteristics that need special management regimes in order for tourists to enjoy their stay, while at the same time maintaining the natural environment. The principal management concepts that need to be taken into consideration for ecotourism development are the following:
a. Nature-based setting
Ecotourism allows tourists to appreciate the surrounding nature while at the same time learning about a unique culture. Since ecotourism is based on natural biophysical attributes, conservation of natural resources is fundamental. Ecotourism sites should be rich in natural attractions; have diverse flora and fauna; be conducive to adventure and travel; have unique features and some historical and cultural values, which may be interesting and educational; not be frequented by mass tourists and not threatened by destructive activities; have untouched native or tribal tradition; and be suitable for rehabilitation and conservation by tourism activity. The area should be ideal for walking, hiking, bird watching, swimming and similar activities. Ecotourism involves travelling to relatively undisturbed natural areas to study/appreciate and enjoy the scenery and its flora and fauna. It is an environmentally sound tourism activity in a given ecosystem that yields socioeconomic benefits and enhances natural/cultural conservation. It is a means to generate income and employment for the local population, to help develop rural infrastructure, to raise funds and to build political support for nature conservation. However, ecotourism may alter norms, beliefs and the lifestyle of the host community.
b. Educational Value
Ecotourists normally seek educational experiences to learn more about the environment. Through interpretative programs such as high-quality guided tours, ecotourism can also promote environmental awareness and cultural understanding.
c. Local Participation and Benefits
The underlying concept is the reduction of local dependence on consumptive use of natural resources through benefits from tourism. By participating in ecotourism activities (such as guiding, providing camel rides and food services), local people can earn supplementary income while at the same time ensuring the conservation of biodiversity.

8
Sustainable resources are essential for sustainable ecotourism. To achieve both resource conservation and sustainable economic use, ecotourism must have a wide variety of groups who directly or indirectly determine the use of an ecotourism area, a strong local and hotel and resort operators’ cooperation and support, some mechanisms for the involvement of different groups in the planning and management process and education of various groups.
d. Encouraging Conservation Awareness
Ecotourists are normally willing to volunteer or contribute to conservation or development projects within the area. This can include identifying birds and wildlife, participating in ecosystem restoration projects and assisting in trash collection. In return, tourists receive a sense of satisfaction for conserving nature or assisting in the development of an area or community. Providing awards or certificates showing that they have contributed to the protection of the environment or assisting in community development can enhance these initiatives.
e. Low impacts and sensitivity to the environment
Strategies to minimize the impacts of ecotourism activities include:
1. Identifying appropriate locations for ecotourism development; 2. Identifying proper ecotourism activities that do not harm the environment; 3. Managing visitors; 4. Controlling the number of visitors per trip; 5. Controlling impacts by taking in all necessities needed as well as bringing out
all trash to remote areas; and 6. Designing the facilities, which emphasize blending with the natural
surroundings.
3.2 Potential of Mangroves for Ecotourism
Cursory assessment of the potential of mangrove areas for ecotourism is high, especially for the sites suggested below, which are accessible and located close to the existing resorts and hotels. The resort and hotel operators can be potential partners in promoting and developing these sites. The marketing, technical, financial, environmental and social aspect of promoting and developing mangrove areas for ecotourism should be closely looked into before any actual development and operations are made. The technical viability, financial feasibility, environmental soundness and social acceptability of ecotourism development should be ascertained thoroughly and carefully.
To this end, the outputs of the participatory workshop, group and individual
discussion in this report, may only serve as indicators and insights in considering mangroves as a nature-based tourist attraction. The strategy of promoting mangroves and the immediate surroundings for ecotourism should only be to provide amenities to visitors in a natural setting that offers low density, low intensity and non-intrusive facilities to maintain the integrity and stability and to assure the sustainability of the mangrove ecosystem and the link to the terrestrial and marine ecosystems.

9
a) Nabq Multiple-use Management Protected Area Nabq mangrove area in Shora Al Rowaisseya is currently considered the focal destination of tourists to the area. Although the mangrove area is only a part of the scenery, which includes the lagoon with clear blue waters, sea grass meadows and the shipwreck, its presence obviously enhances tourist attraction. The mangrove stand is strategically located and it occupies half of the scenery of the area, which maintains not only the integrity, and stability of its attraction, but also its nearby near-shore marine ecosystem scenery. Based on the results of the consultative-workshop in Sharm El Sheik on 22 August 2002, the facilities in Nabq should be maintained and additional facilities are considered necessary to cater to the increasing number of visitors. Basic amenities such as safety lockers/cabinets, shower rooms, dressing rooms, garbage boxes, additional toilets, carparks, sheds/shelters and walking trails are needed. Other potential mangrove areas for ecotourism are the adjacent mangrove areas of Marsa Abo Zabad and Shora Al Manqautta. Non-intrusive tourism facilities should be established in these areas to provide amenities to the visitors in a natural setting. Nabq should be developed as an alternative ecological destination of Ras Mohammad, which is also set to be subjected to an increase in ecotourism activities. Hence, site facilities and information such as road and directional signs along the Marsa Abo Zabad and Al Garghana are necessary. The main information panel and site map should be provided on the mangrove sites. Boardwalks may be constructed for visitors to access the mangrove area without destroying the root system and stand. The actual site of these facilities and on-site information guides should be strategically located to reduce the expected negative impact to within the minimum limit of acceptable change and to maintain the biophysical stability of the sites/areas.
b) Ras Mohammad National Park
In Ras Mohammad, although mangroves occupy a very limited area along the crevices of the fault line, they are an important ecological destination of tourists especially for those who travel by land.
c) Red Sea Marine Park Protectorate
The result of the focus group discussion with the Manager and Technical staff of the Marine Parks of the Red Sea Protectorate showed that they ranked Sharm El Quebly, Al Gouna and El Quieh (Wadi Abu Hamrah) as their first, second and third choices, respectively, in terms of their unique biophysical attraction for ecotourism if appropriate facilities and access are provided. Among the five islands/islets with mangrove stands that are potential ecotourism sites are Abu Monkar, Wadi Gimal and Geisum. Although these islands/islets are protected and closed for sea landings, visitor amenities in a natural setting that are of low density, low intensity but high quality, self-contained and non-intrusive may be allowed. However, the integrity, stability and sustainability of the island as a habitat for wildlife, including migratory, endemic and endangered birds and marine turtles, should be assured by all means.

10
d) Elba Protectorate The Manager of the Elba Protectorate indicated preference for Marsa Sha’ab, El Hoor and Marsa Abou Fasi to be developed as ecological tourist destinations because of their landscape scenery that boast of a mangrove stand and mud flats/reef flats that serve as resting and roosting sites for wildlife and migratory birds. The mangrove stands in these sites are extensive and contain both Avicennia marina and Rhizophora mucronata, the only two mangrove species found in Egypt (Saenger, 2002). The development of the area for natural resource-based ecotourism should promote the biodiversity and genetic conservation not only of the mangrove flora and fauna but also the diverse species of sea grass and aquatic organisms. These sites have high potential for ecotourism that focuses on biodiversity conservation.
3.3 Product, Place and Promotion The attraction of mangroves is due more to the attractiveness of the ecosystem in
general rather than interest in any particular species. Hence, what is required is skilled interpretation and education to attract and satisfy ecotourists, based on an assessment of the attributes of the area that are of potential interest to ecotourists.
For a skilled interpreter, a mangrove and its nearby ecosystems can be the focal point
around which a web of attributes and stories can be woven. For example, the mangroves in Nabq can be described as the last mangrove frontier along the Eastern coast of the African Continent. They include sabkha, desert, wadi, sea grass beds, beach, coastline and near-shore shallow areas, which are mixed together to create a unique ecotourism destination.
Information on the nature of tourists is likewise important. There are hardcore
ecotourists as well as casual, less committed ecotourists. Ecotourists are heterogeneous, depending on their interest, intensity of interest and their willingness and ability to pay to satisfy their interest. A social marketing survey is necessary to understand these different market segments and their relationship to the range of ecotourism opportunities available.
The promotion of mangroves as ecotourism sites should focus on their high ecological
value, which to the extent possible, should be translated into a tangible monetary value to easily facilitate the understanding of the public, decision-makers, planners, managers, hotel and resort operators as well as tourists on the importance of mangroves.
The design and production of the information, education and communication (IEC)
materials to promote mangroves as an ecological tourist attraction may not be sufficient from the point of view of infusing behavioural changes and motivating stakeholders’ involvement and commitment in the conservation of mangroves, through ecotourism promotion and development. An effective and sustained social marketing strategy should be carefully designed and implemented to specific target audience such as tourists (in each nationality – Italian, French, German, Russian and Arabic), the local people/Bedouins and the general public, particularly school children from the primary level. In addition to the 4Ps of commercial marketing (product, place, price and promotion), social marketing considers people as the focal goal of the development strategy in changing the knowledge, attitude, skills and practices (KASP) of the specific target audience.

11
Hotel and resort operators, protectorates, private organizations and individuals are already promoting, through magazines, brochures, ads and the Internet. The promotion is focused on the biophysical attraction and the unique scenery, particularly as guide for divers and snorkellers. Mangroves are included as an added benefit of the coastal ecosystem.
3.4 Environmental Considerations
The tourism industry is the principal force in the development of ecotourism. There are, however, environmental costs and benefits and to ensure that the benefits exceed the costs, management structures should be in place.
Environmental benefits maybe attained through the following:
1. Enhances biodiversity conservation once local people commits to the changes in ways of utilizing the resource when they have benefited from ecotourism;
2. Raises the environmental awareness of visitors and locals; and 3. Supports biodiversity knowledge and protection
However, in order to realize these benefits, it is necessary to have a thorough
understanding of the proposed sites to determine their attributes and ability to withstand the influx of visitors. There is also a need to formulate a strategic ecotourism plan that considers the different perspectives of the ecotourism opportunity spectrum (EOS). Towards this end, inputs must be drawn, in a participatory-integrative manner, from various local, national and regional stakeholders, as well as the government.
Based on the definition and concept of ecotourism, environmental and social values
should be mutually inclusive - that is, ecotourism development should result in net economic and social benefits for local communities as well as net environmental benefits to assure its sustainability. Early on, the potential cost and benefits of any proposed ecotourism development must be clearly identified.
Ecotourism may provide the following benefits: 1. Providing economic and conservation benefits.
Ecotourism may play a role in changing the way local communities benefit from their local environment. The major underlying cause of the destructive ways of utilizing resources is poverty. The desire to improve one’s standard of living leads to the overexploitation of commonly accessed resources such as mangroves.
Ecotourism should link directly to the local people’s needs. Conservation activities through ecotourism should provide long-term economic benefits to the local people. The accrued benefits from conservation have to be greater than the short-term, intermediate and personal benefits. It is necessary to provide alternative sources of income to reduce the dependency of the local people on the natural resources, which have greater potential to provide long-term community welfare. The immediate individual gains from consumptive exploitation of the resources should also be set aside in favour of the accrued benefits that the resources could provide in a sustainable manner.

12
For instance, the overgrazing in mangrove areas is not only an issue of what is more important, the camel or the mangrove, but the problem has deeper socioeconomic and socio-cultural implications. The local people can play a key role in restoring the mangroves. The establishment of a community-based nursery, involving the local people in rehabilitation, will augment their income and build up their commitment to conserve the resources.
2. Raising environmental consciousness and changing behaviour.
Local people’s involvement and participation in ecotourism development and management provide them the opportunity to have direct contact with their natural environments. As it has often been said, “to care we must understand, to understand we must know, and to know we must have met.” The consciousness-raising should be done not only for local people, but for tourists as well. Training local people as ecotourism guides can supplement their incomes and develop a local body of conservation advocates.
Hands-on and on-the-job/field work increases their level of awareness and understanding and strengthens their capability to manage their resources sustainably.
3. Support of research and conservation activities. Ecotourists may contribute directly and indirectly to research and conservation activities in the area by donating their time, expertise or other resources. The Nabq mangrove areas are ideal sites for ecosystem research as part of an R&D and for graduate studies. Interesting area for research may start on unique adaptation of mangrove vegetation to its adverse environmental condition such as 1) the crown/foliage emerging from the buried bole or stems and root system; 2) the accumulation of sediments or silt in the sabkha which mangroves are able to trap soil particles thereby hindering the siltation of sea grass beds and coral reefs.
3.4.1 Environmental Aspects of Ecotourism Planning
1) Determining the Limits of Acceptable Change (LAC)
The focus of LAC analysis is to determine what the management objectives are in a particular area and the amount of change in the conditions of that area that is acceptable, and to select the indicators of change that can be monitored. Monitoring ensures that management prescriptions are successful in maintaining impacts below the LAC. For instance in Al Rowaisseya, as people continually walk on the soil daily, soil compaction may inhibit the growth of roots near the pathways. Likewise, the daily disturbance on the lagoon may loosen up the soil, which may cause the transport of silt or sediments into nearby sea grass beds or coral reefs. This should be monitored closely and baseline data should be collected. The area must also be observed at a time when there is no disturbance.

13
It was observed by the FAO Team that different kinds of fish were in the lagoon when there were no disturbances. As such, the lagoon may be used for sightseeing and observation, instead of using it to access the shipwreck or for swimming. A boardwalk may be provided across the lagoon or into the mangrove stand on the way to the shipwreck, which may be the final destination of the tourists in the Al Rowaisseya area. The management prescription of providing a boardwalk may lead to a change in the type of visitors. The hardcore ecotourists may no longer be able to see closely the ecosystem or species that they are interested in nor perhaps enjoy the limited number of visitors that made the site a satisfactory experience. It is important to maintain a range of ecotourism opportunities that will fulfil a wide array of visitors and conservation goals. The environmental impact of ecotourism is not only that of the ecotourism activities but also that of the infrastructure and service facilities. The facilities should be non-intrusive, have low impact waste disposal, be of low density but of high quality, eco-friendly, provide energy and be self-contained.
2) Assessment of Ecotourism Potential of Nabq Protected Area
The different ecotourism resources that should be assessed are as follows:
1. Natural resources (mangrove, lagoon, sea grasses, coral reef, wadi, sabkha,
tribe village, desert, the last frontier mangrove in the Near East); 2. Facilities (hiking trails, a visitor centre, sheds, cafeteria, tracks, signage,
post, carpark, entrance gate, and other things); 3. Interpretation (visitor centre, information materials such as brochures,
magazines, but lack self guided interpretative trails, local guides that lead interpretative hikes for organized or individual tours);
4. Visitors (to provide statistics); and 5. Local participation (to serve as guides, park workers and labourers;
provide catering services and garbage collection). 3.5 Proposal to Upgrade Visitor Facilities at Nabq
As part of this assignment, a proposal to upgrade the visitor facilities at Nabq was
developed in consultation with local stakeholders. A complete investment appraisal of this proposal is given in the annex to this report (starting on Page 35). The investment appraisal shows that investment in new facilities at Nabq can be justified if it will be possible to raise entrance charges to the area to cover the cost of this investment.
The appraisal assumes that entrance charges can be doubled if the investment in new
facilities takes place, which will result in a rate of return on the investment of between about 30 percent and 40 percent, depending on future increases in visitor numbers. If it is not possible to raise entrance charges by so much, then an increase of at least 64 percent in the charges for admission to the site will be required to earn a rate of return of 10 percent on the investment in new facilities. If it is believed that it will not be possible to increase charges by this much, then it may still be economically feasible to develop the site at a smaller scale and with a lower level of investment.

14

15
4. OTHER POTENTIAL INCOME-GENERATING ACTIVITIES
Based on the results of the rapid assessment and validation for appropriate and potential income-generating activities for the Bedouins, including the results of consultations with stakeholders such as the Bedouin key leaders, the program manager of the Gulf of Aqaba Protectorate Development Programme, the technical staff of the Bedouin Support Program and the manager and senior technical staff of the Nabq Multiple Managed Protected Area, the selected potential community-based income generating projects and activities for the Bedouin in Nabq are as follows. 4.1 Community-based Mangrove Rehabilitation and Management (CBMRM)
Potential sites suitable for CBMRM were assessed by stakeholders using a Matrix of
Selection Criteria and Ranking, using the following criteria/indicators: • extent • accessibility • availability of Bedouins dwelling near the mangrove area • suitability of the specific area for rehabilitation
This resulted in recommendations that the following sites could be developed further:
1. Nabq Multiple-use Managed Protected Area
• Al Garghana • Marsa Abo Zabad • Shora Al Rowaisseya • Shora Al Marqautta
2. Elba Protectorate
• Adal Deep • El-Hamirah
3. Red Sea Marine Parks
• Sharm El-Qebly • Hamata’s mangrove cluster/group • Wadi Lahmi
The areas initially selected for pilot-scale CBMRM are the following:
• Al Garghana area including the mud flats with eroded shoreline
and access tract • El-Hamirah • Sharm El Qebly
Galal (1995) estimated that mangrove areas in Nabq that were identified to have potential for rehabilitation and for ecotourism was 53 hectares. The different schemes for
16
afforestation that may be suitable are: 15 hectares for Assisted Natural Regeneration; 15 hectares for Reforestation and 23 hectares for Mangrove Stand Improvement.
The mangrove area selected based on biophysical aspect will also be subjected to
further selection and ranking using socioeconomic suitability parameters and political-institutional indicators such as:
• social acceptance and support of local people (Bedouin) • no legal and policy restriction • no conflict of land use • favourable support of hotel and resort operators nearby and adjacent to the area
for access or availability of sewage provide treated sewage and desalinated water to be used for irrigation of the nursery
• available technical support by the MALR • Endorsement and concurrence of the governorate or local government unit (LGU) • Prospect of the area for financial support • Priority of the area for future development and consideration of the MALR and
EEAA for future regular activities, etc. Although afforestation in Egypt is directly implemented by the MALR, there are community initiatives of tree planting along the roadside and riverbanks, which are an integral part of the projects funded by UNDP, HANDS and EU. In Sinai, the Protectorate of EEAA provided the seeds and rationing water for nursery and the Bedouins extended labour as counterpart to produce planting materials of Acacia and indigenous species. Once the seedlings have reached a plantable size, the project pays the Bedouins. The Bedouins also provided labour for planting and maintenance. The initiative of Sinai Protectorate in involving the active participation of Bedouins in managing ecotourism, which includes seedling production and planting, may serve as a springboard to implement the community based mangrove rehabilitation in Nabq mangrove areas, which is part also of the jurisdiction of Sinai Protectorate. 4.2 Community-Based Small-Scale Ecotourism Enterprises (CBSSEE)
In 1996, ecotourism has become the primary goal of the Sinai Protectorate of the EEAA in its aim to conserve the natural environment of the Sinai region and sustain the well-being of local people. The project aims at developing ecotourism according to the Bedouin management system. Ecotourism provide economic opportunity to the local community/Bedouin appropriate to their cultural environment in order to limit the impact of tourism on Bedouin lifestyle. Since 1996, the St. Katherine Protectorate's main concern has not only been tourism. It has successfully worked on other programs to study and support health care, specifically the growth of Bedouin children. It also has conducted extensive botanical, veterinarian, zoological and geological research aimed at conserving the natural environment of the area.
One specific project name Fansina embodied the spirit of St. Katherine's Bedouin managed ecotourism, which was run predominantly by Bedouin women. The women produce handicrafts of Bedouin style, which help the local community preserve their traditional skills and, at the same time, generate income to sustain the local economy.

17
Trekking the historical and religious sites in Sinai and backcountry hiking are the preferred outdoor activities of the visitors or tourists. Another tourist attraction is the Wadi I'tlah and Wadi Tala'. In the wadis, one can listen to the sound of splashing and spluttering water springs. The St Katherine Protectorate also offers a unique Bedouin mediated experience. These areas within the St. Katherine Protectorate and surrounding interior desert of South Sinai have been recognized by the international market as an area viable for "adventure tourism".
In partnership with local people, the staff of EEAA turned the abandoned traditional houses and gardens in Wadi Gerba into a Bedouin eco-lodge. The eco-lodge is managed directly by the Bedouins. In fact, the final goals of the project was to develop the South Sinai area by making its inhabitants responsible for their own land and eventually appoint a management team entirely composed by locals.
Conservation would become an attractive option to rural people by linking sustainable tourism with local community development. In pursuit of these goals, the management unit of the St. Katherine Protectorate actively promotes environmental and cultural tourism in these areas (/http://www.trvel watch.com/articles.htm).
4.2.1 Areas Selected for Community-based Ecotourism
The mangrove areas preliminary selected for community based ecotourism development and management are the following:
1. Nabq Multiple-Use Management Protected Area
• Al Garghana • Marsa Abo Zabad • Shora Al Rowaisseya
2. Red Sea Marine Park Area
• Sharm El-Quebly • Hamata cluster/group of mangrove such as:
� Wadi Masturah � Wadi Al-Qu’lan delta � Ubdi Rawad El Adaiah � Wadi Harbiyyah
These areas were selected for their accessibility, existing available facilities
(hotel, resort, diving centre, etc.) nearby/adjacent to the area, uniqueness of the biophysical scenery of the area, availability/existence of local people/Bedouins, willingness of the hotel/resort operators to adapt the area as part of ecological tourist destination and the absence of legal/policy restrictions as well as the prospects of the area for future development.

18
The community-based approach of mangrove rehabilitation and ecotourism development and management will include the following components:
1. Mobilization of the support of the local communities through a sustained social marketing strategy;
2. Strengthening the capability of the local people as partners in mangrove
development and management;
3. Partnership with private organizations (such as hotel and resort operators for promotion and logistic assistance), other government agencies such as the Ministry of Public Works (MPW) for water allocation; Ministry of Tourism (MOT) for promoting mangrove for ecotourism; and the Ministry of Rural Development (MRD) and the governorate for provision of basic facilities and needs and for the development of the Bedouin community; and
4. Capability building of the technical staff involved in the promotion and
development of ecotourism and rehabilitation.
An ecotourism site can be ideally managed through a community-based approach in which any capable member of most households in the locality can participate. The local community can organize a cooperative to undertake the task of managing the site.
Among other things, the activities involved are the following:
� assessing the potential of a particular resource for ecotourism; � identifying achievable compatible objectives for the development of the
area; � coordinating with different stakeholders to develop strategies and policies
related to the implementation of an ecotourism project; � preparing sound conservation and protection programs; � developing environmentally sound structures and facilities inside the area; � training personnel on resource-use management, conservation and
protection; and � promoting ecotourism through an effective marketing strategy.
4.3 Seedling Production for Landscaping and Urban Greening
Species for urban planting are selected according to the location and type of project to
be implemented (i.e. for major thoroughfares, because of the emission of oxides, pollution-resistant species are required).
Urban greening and landscaping involve planting of trees and other plants in parks, thoroughfares and islands, boulevards and other areas in the urban and peri-urban areas. Primarily, these plants are planted to enhance the beauty and create unique settings. Narrow dense belts of trees are effective barriers to noise. Research reveals that where houses are and where there are windbreak plantings, energy requirement for cooling is significantly reduced by over 50 percent.

19
In Sharm El Sheik, the city council has embarked on a project geared towards urban greening and landscaping. But the city council found difficulty in raising or buying good-quality seedlings necessary for planting. Thus, this livelihood option was offered for backyards or big-scale seedling production.
Generally, trees for urban greening and landscaping are propagated from seeds. For ornamental plants, they are propagated through cuttings and sprouts. Other
species are raised through seeds. Potted seedlings or cuttings are properly maintained and hardened before planting-out. It may also be possible to raise Acacia and other species for landscape and urban greening.
As practiced in Mt. Sinai Protectorate, partnership between the Bedouin and the Ras Mohammad National Park management evolved through their joint effort to raise planting stocks for establishment of seed orchard and plantation. The protectorate provided water and seeds while the Bedouins provided labour. The protectorate bought the seedlings raised by the Bedouins at three Egyptian pounds per seedling.
In Sharm El Sheik, hotel and resort operators and contractors are engaged in urban
greening and landscaping. However, contracting private groups such as local people association and individual firm is preferable. Demand is high at the onset of the rainy season.
Production of quality seedlings of required species will greatly ensure saleability.
Rare species, when properly propagated, demand higher price. However, it is useful to secure the market before production of seedlings.
Raising and displaying the planting stock along major thoroughfares and commercial
counters are good venues for advertising products. Personal inquiries regarding demand or requirements of buyers could also help. Brochures with colourful illustrations on how to grow and maintain seedlings will be of great help in promoting the planting of materials. It is also a good practice to attend seminars and workshops on how to grow plants properly and effectively. Topics may include tree surgery, plant propagation and the like.
In terms of ecological and social considerations, production of good- quality seedlings
will greatly enhance the physical appearance of a place, increase its floral biodiversity and eventually invite animals, birds, insects and other useful organisms. Providing enough seedlings to plant is a big contribution to Sharm El Sheik. These plants offer social, recreational, economic and environmental benefits.
In terms of waste generation, tree planting does not generate waste. All cuttings can be propagated again. Unused leaves and branches can be used as mulch or can be composted for use as organic fertilizer. This livelihood encourages recycling of plant parts for productive uses. Plastic pots can also be re-used.
This livelihood is labour intensive. It provides employment and income to most since
all members of the family can participate from potting to protection and maintenance of seedlings.

20
4.4 Composting and Waste Recycling
Somebody’s trash can be another’s treasure. This is the principle behind in putting up a centre for recyclable wastes. The centre will provide sustained livelihood opportunities not only for the enterprising urbanites but for rural folks as well. At the same time, it can also offer an alternative income source for the out-of-school youths, who can be tapped as area coordinators while villages or cooperatives can be the operators.
This potential activity of the Bedouins shall involve the organization of groups that
will be tapped as area coordinators. The key leaders of the local people can also serve as coordinators if the area is to be run by the community. Seed money may be provided for every group.
To operationalise this activity, area coordinators can then be assigned in each of the
ten selected areas to buy recyclables from the hotel and resort establishments. With a given seed money, the coordinator buys recyclables such as assorted plastics, bottles, aluminium and other metals, paper and even plastic wrappers. The coordinators are given the freedom to device their own strategy such as house-to-house calls and/or put up signs in the neighbourhood or working area. The coordinators shall deliver the sorted recyclables to the centre regularly (once a week) to repack and sell or market the non-biodegradable waste product to the recycling plant in Cairo and compost the biodegradable waste product in Bedouin village as source of organic fertilizer which can be used in seedling production.
Recyclables are accumulated and stored properly. To facilitate smooth operation of
activities, previously contacted bulk buyers are informed for the pick-up and sale of recyclables after accumulating agreed-upon volume.
In terms of marketing considerations, there are many recycling and manufacturing
firms located in Cairo. These firms usually purchase recyclables in bulk, at times in quantities with a minimum weight of a ton. Purchase prices would vary for each recyclable.
Many Bedouins already realize the significant positive impact of properly managing
recyclables in the homes, resorts and hotel establishments on the environment and the citizenry. Putting up a properly managed recyclable centre strengthens further the people’s commitment to help the government solve the problem on solid wastes, of which 60 percent are considered recyclables. Recycling will lessen the volume of wastes being dumped, and will eventually minimize the occurrence of pests, diseases and illnesses.
4.5 Beekeeping/Apiculture
The Arabic countries, particularly the plains, valleys and mountains are rich in agricultural resources, blossoms and plants that produce different kinds of honey. Egypt alone has two million (2,000,000) colonies of bees, presenting 48% of the total number of colonies in the Arab countries (http://www.beekeeping.com/articles/us/arab_countries.htm).
According to the statistics of the Arab Organization for Agricultural Development (AOAD), as cited in http://www.beekeeping.com/articles/us/arab_countries.htm, there are 406,170 beekeepers in the whole of the Arab countries, with Egypt alone having half of this number (200,000). Meanwhile, it was reported that Egypt comes first in producing honey of

21
about 16000 tons of honey yearly (equivalent to 57% of the total production in the Arab countries). It was also cited that the average annual consumption of honey that is available in the Arabian country for an individual is 116 grams. However, others believed that this is not really the actual average of consumption per individual because the actual consumption really depends on the accessible quantities of honey, either produced or exported. The medical importance of honey (i.e. jelly, pollen, prosopolis) has been gaining recognition in the Arabian countries but most often still dependent on other countries’ supply.
Beekeeping fits in well as part of integrated rural development programmes, and the best projects are those that promote sustainable beekeeping on a long-term basis that makes use of indigenous expertise, knowledge and materials. Imported equipment should be avoided as supply may be unpredictable, or may later on be obsolete because of lack of spare parts or suitably trained maintenance technicians. Some beekeeping management objectives are given below (Ntenga and Mugongo 1991):
1. To alleviate rural poverty by creating in situ income-generating activities through beekeeping;
2. To improve the potential for beekeeping by planting melliferous mangrove species towards the landward fringe;
3. To improve the quantity and quality of beekeeping products through sound management;
4. To assist in the making of beekeeping products; 5. To overcome specific problems such as disease or pesticide misuse; 6. To transform destructive honey hunting from wild nests to sustainable methods.
In the Sunderbans mangroves, large amount of beeswax and honey are produced by wild bee swarms that build hives on branches, in tree holes, and crevices are collected (232,640 kg of honey). The hives and trees are often destroyed during collection (Christensen and Snedaker, 1984, as cited by Ntenga and Mugongo, 1991).
In the Philippines, beekeeping is an enterprise with social, economic and ecological benefits that only requires minimal time, labour and resources. It provides additional income to farmers through honey production and other bee by-products like pollen, wax, prosopolis, royal jelly and bee venom. At present, the supply of honey and other bee-based products is far below the demand. Beekeepers could only provide 25 percent (30 tons) of the 120-ton demand for bee products per year (Tamayo, Personal Communication 1997 as cited in Sustainable livelihood options for the Philippines: an information kit 1997).
The honey can be sold in groceries, supermarkets, trade centres, malls, cooperatives,
bakeries, food processors, confectioners and pharmaceutical companies. Beekeeping also helps improve the ecological balance by promoting plant regeneration and species diversity through pollination.
Honey production depends on the type of bees, the availability of pollen and nectar,
prevailing wind, temperature salinity, contaminants, availability of freshwater and other factors. Aerial spraying of pesticides can affect beekeeping. Seasonal burning of the inter-terrestrial zone and the mangrove landward fringe will also destroy a number or melliferous plants.
Apiculture is likewise an important activity in the Asia Pacific and Oceania, Australia, Burma, Bangladesh and India (1984 loc. cit.). At least three honeybees are native to Asia and

22
all are exploited by man. Two of these, the little honeybee (Apis florea), and the giant honeybee (Apis dorsata), cannot be kept in hives as they nest in the open air, on a single comb. The former builds its small comb (about 25 cm in diameter) hanging from branches within bushes, while the latter suspends its much larger combs (around 1 m in diameter) from tree branches, rocky ledges and buildings. The giant honeybee's nest may well contain 50 kg of honey. The third species, Apis cerana, is known as the Asian hive bee and can be kept in a hive.
Beekeeping in Nabq may not be possible during dry season because of the rain coming only three to four times per year during winter and the area is too dry for the Avicennia marina to bear flowers abundantly. During the conduct of the field visit, it was observed that there were not enough insects, especially bees, in the mangrove stand. This observation was confirmed by the Bedouin village leaders, technical staff of the Nabq Multiple-use Management Protected Area. The Program Manager of the Gulf of Aqaba Protectorate Development Program doubted the viability of apiculture in a single species of A. marina in mangrove areas. The viability of apiculture had been proven only along the Nile River and other places where there are sufficient rainwater annually.
In order to promote apiculture in the Arabian countries, the following
recommendations are hereby proposed (www.beekeeping.com/articles/us/arab-countries): 1) construct stations for producing the improved queens either in isolated areas or by
using instrument insemination to devise races that are suitable for the Arabian weather; and 2) diversifying bee products in the Arabic countries.

23
5. SOCIO-ECONOMIC AND INSTITUTIONAL DEVELOPMENT 5.1 Socioeconomic Profile of Nabq
Currently, the Bedouin village adjacent to the mangrove area in Garghana is part of
the ecological destination of tourists, particularly those who access the entrance of the military checkpoint along the coast. But the influx of visitors beyond the limits of Bedouin social absorption and adjustment or carrying capacity has cultural, economic, environment and political implications and consequences that affect their socio-cultural integrity and cohesiveness. Thus, the Bedouin community should be considered as an integral part of the ecotourism development and their welfare should be given topmost consideration/priority to balance the economic growth.
El Bastawisi (1995) described the Bedouin community as marginalized. The Sheik of
the Garghana and the Bedouins key leaders complained that they have found it difficult to secure food because the Governor has banned fishing within the Nabq Protected Area. During summer or dry season, the Bedouins rely on fishing as their primary source of livelihood. They preserve fish for the winter as they move to the wadi to escape the cold front and strong gusty winds at the coast. Most of the key Bedouin leaders, who were interviewed, expressed their sentiments that they were being isolated and marginalized by limiting their access to the fishing grounds, as a result of the booming ecotourism industry in South Sinai for the last years. The resort and hotel operators prohibited them from fishing and having access to the fishing grounds within their establishments. The Bedouins agreed to fish only in the designated fishing grounds imposed by the Protectorate of South Sinai. Two months ago, they have been completely banned by the Governor to fish in any of the fishing grounds Thus, they complained that they were continuously being pushed into the hinterlands and being isolated and marginalized because of tourism developments. Unfortunately, because of the tourism boom, the Bedouins’ socio-cultural and economic conditions have deteriorated. Clearly, not all changes lead to betterment––some may lead to retrogression.
The onset of ecotourism and its subsequent economic growth changed the perspective
of development for most of the younger generations of Bedouins. They tried to adapt and cope with the changes so as not to be isolated, but along the way, they lost the integrity of their traditional values of simplicity, cohesiveness, respect and traditional loose organization, and livelihood pattern of pasture and raising livestock (El Bastawisi 1995 and Gabr, Personal Communication 21 August 2002).
Hence, any development and investment to uplift the socioeconomic condition of the
Bedouins should be responsive to their needs and sensitive to their social structure, culture and value system. Their understanding of the process of any developmental change must be ascertained to win their support and trust. Any socioeconomic or livelihood project should focus on the strengths of the poor (Bedouin) to build up and strengthen their capability to get out of poverty and not to create the “dependency syndrome” (Sing 1998 and Naresh 1998). Population
The census data (El Bastawisi, 1995) show that Bedouins inhabited the three administrative sectors along the coast of the Gulf of Aqaba: Sharm El Sheikh, Dahab and Nuweiba. Although numbers are considered approximate, about 585 persons from 10

24
inhabitant groups were recorded to reside in Sharm El Sheikh. There were 1,996 persons, comprising five inhabitant groups, who lived in Dahab and 703 persons of four inhabitant groups resided in Nuweiba.
A large area of land along the coastal area of the Gulf of Aqaba is controlled by El Mezeina, one of the largest and most powerful tribes of the El Tawara Group in South Sinai. Moreover, the three administrative sectors that were mentioned have traditionally formed El Mezeina’s territory. Thus, the census data on Bedouin inhabitants indicated a Mezeinan population.
It is believed that the development of the region brought the significant population movement of migrants, non-Bedouins from other regions, particularly from overpopulated Cairo City. The significant number of immigration reflects the remarkable population movement of government employees, private investors and labourers from the Nile Valley and North Sinai to the region. Employees, administrators and teachers comprised the largest group that moved to the region. Some, particularly those with toddlers and school-age children moved with their families. Others left their families and sought for better opportunities. Newly married couples also preferred to settle in the region.
Other factors that contributed to this were tourism progress, government services and projects introduced to the peninsula. The people lived in administrative housing, provided either by the Israeli or Egyptian government, in Sharm El Sheikh, Dahab and Nuweiba. The lack of housing for teachers was addressed by school building accommodations. Since the coastal area of Aqaba offers more opportunities for investment, it is expected that more migrants will be encouraged to move to the area and may be displacing the Bedouin population. The population of Bedouins in the Southern Red Sea Zone is presented in Table 1. In 1996, there were 1,646 and 1,736 people in Marsa Alam and Abu Ghosoun, respectively.
Table 1 Population of the Bedouin in the Southern Red Sea Zone Location 1966 1976 1986 1996 Marsa Alam 600 600 500 1,646 Abu Ghosoun 500 0 1,100 Branice-Hamata 600 2,200 3,100
1,736
Shalateen 300 0 1,000 n.a.
Source: Marsa Alam Comprehensive Plan. Settlements From the traditional perspective of the Bedouin, an ideal lifestyle is living in a tent with one’s relatives. The tents must be 7–8 meters away from neighbours and far from authorities and strangers. The Bedouin people used to depend on healing herbs, moonlight, sunlight and traditional practices. Through time, their lifestyle changed and they were able to cope-up with development according to the social and economic situation of the Gulf. There were only few houses found in wadis and mountains and some still preferred to live in small groupings with their

25
relatives. Nobody moved with his or her herds but fishing on the nearest shore was still very common. Houses were made of local stones, wood and tin with extension for herds and poultry near water sources. Development brought more changes. Shanty settlement was introduced in 1982. El Silk and El Roweisat became known. Both were considered part of the El Nur Suburb of Sharm El Sheikh. El Silk is one kilometre away from the city while the other is 2.5 km away. Later on, the government divided the land into 60 divisions (2.3 m2/division). The Bedouin people looked forward to have new houses, which were estimated to cost EGP 18,000. Existing houses were 1.5– 2 m apart. Recently, inhabitants of El Silk and El Roweisat were starting to aspire for permanent housing with proper electricity installation and reliable sewage system. Health Services Due to the lack of health services, mobile medical clinics were required to visit the Bedouins regularly, especially those who lived in mountains and valleys. The only health centre available was the Hyperbaric Centre in Sharm El Sheik. Thus, the Bedouins had to depend partly on traditional cure. In critical cases, patients were advised to visit physicians and doctors in Suez, Ismailia or in Cairo. Since economic status was also reflected on the kind of health services one gets, the present condition still needs improvement. Water Sources Lack of water is a problem for the Bedouins. Drinking water has to be transported from Sharm El Sheikh. Even though the Protectorate provides water, they have to seek other government help to address the problem. This indicates a relatively poor economic situation. Occupational Activities and Job Opportunities Activities of Bedouin communities are no longer limited to traditional ones such as livestock raising, minor seasonal agriculture, horticulture and fishing Tourism, construction, business and other work opportunities are getting popular. However, divisions of labour according to sex and age are still observed in some occupations. The following cases are some of the very common jobs among Bedouin communities: Herding Traditionally, a 12-year old girl, who steps into a more challenging stage of her life as a shepherdess for her mother’s and female relatives’ flocks, gets a sakhala (small goat) or clothes at the end of the year A 16-year old boy, who is responsible for the family’s and other relatives’ camels, gets a xmas oud (small camel) at the end of the year as a reward. Hired herders are paid cash of up to EGP 10, 000 for those tending camels and about EGP 1,500 for sheep and goat herders. Herding as a traditional practice is still very common in the Gulf of Aqaba. Flocks move to a tribal and non-tribal rangeland in times of drought. Movement starts in spring (around October or November) and lasts for about 4–5 months. It takes place in different wadi. Herding in the Gulf of Aqaba is considered poor as compared with herding in

26
the north of Sinai. The Mezeina tribe in South Sinai never relies on livestock raising for a living. Bedouin communities derive milk from the animals they produce and raise. They spin and weave wool into traditional bags, rugs and camels’ saddle, among other things. When the distribution of fodder stopped in 1990, the raising of sheep and goats ceased. Generally, records from 1982 to 1990 show a decrease in the number of sheep and goats as well as in the number of owners. The Mezeina tribe associated the decrease with the drought and the shortage of natural grass and the ensuing involvement of the Bedouins in tourism activities. However, they believed that herding will always be a part of their life as it plays an important role in marriage, birth or death of relatives and friends wherein a hermula (a sheep) is offered as a present. In addition, there is a belief that a flock of sheep and goats is a woman’s property that must be taken care of. From an anthropological point of view, the present (a sheep) is a sort of reciprocal active contribution in special occasions that symbolize the Bedouins’ social cohesion and surety. Fishing Fishing was allowed in the designated portion of the protected area of the Gulf of Aqaba before the Governor banned it in May 2002. El Mezeina is known to be the only tribe on the coast of the Gulf of Aqaba that depends heavily on fishing. Fishing activities are now controlled and supervised by the staff of Ras Mohammad National Park System (RMNPS) of the EEAA to prevent over fishing or loss of some rare fish species. Five years ago, the Fishermen Cooperative Association introduced 13 motorboats with horsepower ranging from 3.9 to 25. They were sold to the Bedouin fishermen by instalment. All rowboats, on the other hand, are made of wood and the two motorized boats are covered with fibreglass. Fishing starts in the middle of April and lasts for 2–3 months. The season begins with the hunting of Lethrinidae in Ras Mohammed when there is moonlight. Fishing areas extend along the coast of Gulf of Aqaba. Fish are delivered to the government’s Fishermen Cooperative. Some are sold to middlemen who do not rely heavily on local fishing and who transport them to hotels, tourist villages and restaurants. Fish is conserved or preserved by drying.
Farming The environmental conditions of the Gulf of Aqaba limit cultivation to small-scale gardens, mainly in Dahab and Nuweiba. Different fruits, vegetables and trees are grown. Some 1,455 wells provide irrigation in Dahab and Nuweiba

27
Other Occupation and Job Opportunities A number of Bedouin people work in recreational services, tourism, hotel management, diving clubs, restaurants, cafeterias, supermarkets and bazaars. Others work in construction and quarries. Some are drivers and mechanics. Inhabitants of RMNPS, which include the Nabq Multiple-use Management Protected Area, proposed additional tourism projects that will soon be established in the area.
5.2 The community organizing (CO) framework and activities for Community- based Ecotourism and Mangrove Resources Management (CBEMRM)
Community organizing (CO) shall be the basic mechanism for preparing the target
communities of Bedouins in Nabq for the current and future activities related to resource protection, conservation and regeneration. CO prepares the community to overcome shared problems and needs. It deems to transform communities in any ecological setting into more independent, self-reliant and viable entities.
Some key considerations shall be undertaken to ensure the success of community-based related projects, namely:
1. The project staff will have to live, plan and work with the community. When the community already becomes self-reliant, the roles will then be passed to capable leaders of the community.
2. The local people know better what concerns them most, and how limitations can
be overcome, hence, people are enjoined to plan, decide, implement and evaluate their actions. They shall be motivated to build consensus on certain issues rather than compete in resolving them.
3. Leadership shall not only be confined to the traditional and political units of a
leader. It includes the development and mobilization of the youth, women and the marginalized sectors as local leaders.
4. The CO framework may be modified depending on the type of communities, the
ecological state and the kind of CO-worker.
5. The Protectorate should believe that local knowledge, their technologies, practices, groupings and the like are very useful in attaining particular objectives of a project.
CO shall be introduced as an alternative approach in implementing the CBEMRM
project in Nabq because of the following reasons and field realities:
1. The Nabq Multipurpose Management area is part of the Ras Mohammad National Park which means that the environmental management activities will become a felt responsibility of the stakeholders including the local people;
2. The indigenous people derive their living and so the CO strategy of social marketing will let them feel the need to conserve coastal resources for future generation;

28
3. There is potential for active participation of local people based on the relatively young population in a household;
4. CO approach to some extent, aside from being locally facilitated, have also facilitated implementation of environmental activities;
5. CO processes can facilitate good partnership with local agencies; and 6. There are better opportunities for more people-oriented dissemination of
environment-friendly, custom-fit technical assistance or technology extension.
The Protectorate should recognize that CO is an integral part of a large project and plays a vital role in facilitating other project components. Community participation is promoted and encouraged by UNDP projects along the Nile River wherein the depressed and marginalized local communities along Nile River are organized to implement and sustain various sustainable alternative livelihood funded by UNDP.
5.3 Community Organizing Strategy
CO shall be guided by a framework called “tri-track” or “two-winged” approach (see Figure 1). The local community will be the centre of all actions. To attain a well-managed environment and to improve economic conditions, the local initiatives will be developed to enhance the community. Attention will be given to mangrove development through ecotourism as well as coastal environment and management. The project will also consider the indigenous knowledge systems, basic norms in the community and the policies governing coastal and resource management. Figure 1 Community organizing strategy for community-based ecotourism and
mangrove resources management.
However, the framework can be modified depending on the peculiarities of the area,
the type of communities and site conditions. There are field realities that will either enhance or hinder the movement and possible adjustment of the activities. These are worth documenting for future projects and program reforms.
Environmental management (Coastal and mangrove areas)
Poverty alleviation or economic upliftment
Indigenous System
Government Policies
Local people initiative building

29
6. SUMMARY AND RECOMMENDATIONS Ecotourism is one of the fastest growing industries today. In some countries, where there is enormous concern for identifying alternative livelihood activities, particularly for those communities dependent on natural resources such as the mangrove/coastal areas, ecotourism can be regarded as an appropriate industry. To ensure success of such an endeavour, however, there has to be a strategic plan, which should consider among other things, the environmental attributes/base of the given resource and its limit to acceptable change or its carrying capacity and the varying interests of the ecotourists, including their willingness and abilities to pay. In the ecotourism enterprise, environmental factors are greatly considered and integrated with business and social concerns in a carefully studied and implemented plan.
Moreover, it is necessary to consider the distribution of the costs and benefits that are to be generated by the ecotourism activity, and how these may change over time depending on the amount and nature of the visitors, and the kinds of facilities needed to service the visitors. These factors should be examined in detail to ascertain whether there is an optimal size of visitation for a community that will maximize benefits while minimizing costs, considering the social, economic and environmental aspects.
Ecotourism can provide considerable benefits to the environment, local visitors and
agencies concerned with conservation initiatives. With thorough planning and careful consideration of the environmental and cultural aspects, together with the business aspect, ecotourism can increase the morale of the travel industry. Ecotourism may contribute to conservation education, resource protection, and the involvement and empowerment of local people.
Since income and employment for the community as a whole is limited, the
ecotourism activities in Egypt should be integrated with the sustainable development initiatives of the MSE at the local level.
The CBMRM and other alternative livelihood/income-generating projects can supplement and augment the locals’ income and employment since ecotourism markets are seasonal and are sensitive to external influences such as the peace and order situation in neighbouring Arab countries, political changes and economic instability of Egypt and/or countries of origin of visitors/tourists. The horizontal integration within the community and vertical integration with national level initiatives are necessary for the success of local ecotourism to support and promote responsible tourism at the country-based level. The proposed project of CBSSEE should link with the support program of European Union (EU)-funded projects for Bedouins in Nabq, particularly the provision of basic services to Bedouins such as primary health care, drinking water/potable water, support for veterinary and fisheries services, job opportunities and handicraft work for women.
In addition to making linkages with the EU-Bedouin Support Program in Nabq, the national level support of MSE, MOT and MALR are necessary to promote community-based ecotourism with appropriate legislations and assistance towards small enterprises and community initiatives, and national and international promoters. It is also a meritorious work if at an early stage of establishing community-based ecotourism in Egypt, efforts are undertaken to be aware of and learn from the lessons of other countries with community-based schemes and seek mutually beneficial coordination from other national and

30
international agencies. The lesson learned from community-based initiatives of UNDP, HANDS, EU, USAID and World Bank in other parts of Egypt, particularly communities along the Nile River and urban poor in Cairo City will serve as jumping board/benchmark for the development and implementation of a pilot community-based ecotourism and mangrove rehabilitation initiative in Nabq protected area.

31
REFERENCES Ahmad Iftikhar. 1997. Sustainable utilization of natural resources: a community-based
conservation effort in Bar Valley, Gilgit, Pakistan. In Ecotourism for forest conservation and community development, pp.187-201. Proceedings of an international seminar held in Chiang Mai, Thailand, 28-31 January 1997. RECOFTC Report No. 15, FAO/RAP: Publication.
Alexandria Small Business Association (ABA), Egypt. Best Practices for Human Settlement.
Most Clearing House: Best Practices http://www.unesco.org/most/bpeco.htm Amr, M. Moustafa El-Kammash. 2002. Data and information needs for Red Sea
conservation finance, USAID. Unpublished. Baba, J. 1997. Ecotourism dimensions of sustainability. In Ecotourism for forest
conservation and community development. Proceedings of an international seminar held in Chiang Mai, Thailand, 28-31 January 1997. RECOFTC Report No. 15, FAO/RAP Publication: 1997/42.
Cabahug, D. M. 1997. Community-based mangrove rehabilitation and production technology.
Paper presented during the Training-Workshop of the Fisheries Sector Program, Tanchuling Resort, Bajajay, Albay, Philippines, 22–23 July 1997.
Cater, E. 1997. Towards sustainable livelihoods: The Koroyanitu development program. In
Ecotourism for forest conservation and community development. Proceedings of an international seminar held in Chiang Mai, Thailand, 28-31 January 1997. RECOFTC Report No. 15, FAO/RAP Publication: 1997/42.
Clinton, B. & Dain. 1981. Economic Botany, 35(2), 145-162. New York Botanic Garden
Bronx. Cochrane, J. 1997. Factors influencing ecotourism benefits to small, forest-reliant
communities: a case study of Bromo-Tengger Semeru National Park, East Jaya. In Ecotourism for forest conservation and community development. Proceedings of an international seminar held in Chiang Mai, Thailand, 28-31 January 1997. RECOFTC Report No. 15, FAO/RAP Publication: 1997/42.
Dearden, P. 1997. Carrying capacity and environmental aspects of ecotourism. In
Ecotourism for forest conservation and community development. Proceedings of an international seminar held in Chiang Mai, Thailand, 28-31 January 1997. RECOFTC Report No. 15, FAO/RAP Publication: 1997/42.
EEAA, 2000. Nature Preserves and National Parks in Sinai. National Parks of Egypt, South
Sinai Sector, Egyptian Environmental Affairs Agency-Department of Natural Protectorates. http://www.sinaiparks.gov.eg
El-Shehavy, A. M. Undated. The Future of Bees and Honey Production in Arab Countries.
www.beekeeping.com/articles/US/arab_countries.htm

32
Emphandhu, Dachanee & Surachet Chettamart. 1997. What makes for a viable ecotourism site? In Ecotourism for forest conservation and community development. Proceedings of an international seminar held in Chiang Mai, Thailand, 28-31 January 1997. RECOFTC Report No. 15, FAO/RAP Publication: 1997/42.
Fletcher, P. 2002. The Lower Kinabatangan: The importance of community consultations in
ecotourism development. In Studies on the coastal ecology and management of Nabq, South Sinai, Egypt. Unpublished.
Galal, N. 2002. The Sinai mangroves, Avicennia marina (Forsk.) vegetational patterns under
extreme environmental conditions. In Studies on the coastal ecology and management of Nabq, South Sinai, Egypt. Unpublished.
Ghurmi, G. 1997. Developing a tourism destination: the experience of the King Mahendra
Trust for nature conservation with ecotourism. In Ecotourism for forest conservation and community development. Proceedings of an international seminar held in Chiang Mai, Thailand, 28-31 January 1997. RECOFTC Report No. 15, FAO/RAP Publication: 1997/42.
Griefenberg, R. 1997. Operating a successful ecotourism enterprise: the case of Siam Safari
in Phuket, Thailand. In Ecotourism for forest conservation and community development. Proceedings of an international seminar held in Chiang Mai, Thailand, 28-31 January 1997. RECOFTC Report No. 15, FAO/RAP Publication: 1997/42.
Grissac, J. A. 2000. Progress Report of the European Countries Contribution to the Gulf of
Aqaba Protectorates Development Programme. EU-EEAA. Unpublished. HANDS-five areas of development: Health, Education, Economic Development,
Environment and Agriculture. http://www/handsalongsidethenile.org/programs/programs.html. Hegazy, I. 2002. A survey of Red Sea tourists and tourism operators’ willingness to pay for
coral reef conservation. USAID-EEAA. Unpublished. HEPCA, 2000. Enviro Guide of Hurghada Environmental Protection and Conservation
Association in Red Sea. DEPCA Publication. Hopkins, Nicholas and Mehanna, Sohai, 1997. Pollutions, popular perception and grassroots
environmental activism: Middle East Report. USAID website. USAID MISSION: Egypt Program Data Sheet 263-020.
http://www.usaid.gov/update.htm. Joy, R. 1997. Development of ecotourism enterprises in Gunung Halimun National Park,
West Java, Indonesia. In Ecotourism for forest conservation and community development. Proceedings of an international seminar held in Chiang Mai, Thailand, 28-31 January 1997. RECOFTC Report No. 15, FAO/RAP Publication: 1997/42.
Macloren, F. T. 2002. A strategic approach for community-based ecotourism development.
Unpublished.

33
MALR, 2000. Forest Plantations Irrigated by Treated Sewage Water. FAO-ITTO-Ministry of Agriculture and Land Reclamation, Dokki, Cairo, Egypt. Brochures printed by MALR-FAO-ITTO, Undated.
Pierandrei, E. Bedouin managed ecotourism in Sinai. http://www.travelwatch.com/articles.htm. Pleumarom, A. 1997. Open questions concerning the concept, policies and practices of
ecotourism. In: Ecotourism for forest conservation and community development. Proceedings of an international seminar held in Chiang Mai, Thailand, 28-31 January 1997. RECOFTC Report No. 15, FAO/RAP Publication: 1997/42.
Radi Dar, M. 2002. Studies on anthropogenic threats to the mangrove environment in the Red
Sea Coast, Egypt. National Workshop on the Environmental Protection of Mangrove on the Red Sea Coast. August 3-5, 2002. Marlot Hotel, Hurghada, Egypt.
Saenger, Peter, 2002. Ecological Assessment of Mangroves in Egypt. In Rehabilitation,
Conservation, and Sustainable Utilization of Mangroves in Egypt. TCP/EGY/0168(A) FAO of the United Nations.
Said, Nasr Raqheb. 2002. Environments affecting mangrove growth in Egypt. National
Workshop in the Environmental Protection of Mangroves on the Red Sea Coast. August 3-5, 2002. Marlot Hotel, Hurghada, Egypt.
Santiago, F. & Libosada, C. Jr. 1997. Ecotourism development in the Philippines. In
Ecotourism for forest conservation and community development. Proceedings of an international seminar held in Chiang Mai, Thailand, 28-31 January 1997. RECOFTC Report No. 15, FAO/RAP Publication: 1997/42.
Shehata, Ahmed. 1998. Protected areas on the Gulf of Aqaba, Egypt: a mechanism of
integrated coastal management: a case study on coastal development. EU-EEAA. Unpublished.
Sumarwoto, J. 1997. Business management in operating community-based ecotourism: a case study of practical experience. In Ecotourism for forest conservation and community development. Proceedings of an international seminar held in Chiang Mai, Thailand, 28-31 January 1997. RECOFTC Report No. 15, FAO/RAP Publication: 1997/42.
Tewfik, Imas. 1995. Community Participation and Environmental Change. Field Work
Report as part of the completion of MA in Anthropology. American University of Cairo.
The staff and participants from the Sikkim Biodiversity and Ecotourism Project. 1997.
Community initiatives in ecotourism: a case study from Sikkim. In: Ecotourism for forest conservation and community development. Proceedings of an international seminar held in Chiang Mai, Thailand, 28-31 January 1997. RECOFTC Report No. 15, FAO/RAP Publication: 1997/42.
Trousdale, W. T. 2002. Appropriate tourism impact assessment: a case study of Kaniki Point
Resort, Palawan, Philippines. http://www.ecoplanintl.com.

34
Trousdale, W. T. 1996. Sustainable tourism planning for a new millennium presented at the 1996 World Congress on Coastal and Marine Tourism, Honolulu, Hawaii.
United Nations Development Programme (UNDP). 1998. Concept paper on the sustainable
livelihood approach. UNDP. Undated. UNDP-Sustainable Livelihoods. Egypt Workshop Report. UNDP/SL
Documents: Egypt Workshop Report. Unknown. Nature preserves and national parks in Sinai. http://www.sinaiparks.gov.eq/ Viste, M. 1997. Local participation in ecotourism at the Calauit Game Reserve and Wildlife
Sanctuary. In Ecotourism for forest conservation and community development. Proceedings of an international seminar held in Chiang Mai, Thailand, 28-31 January 1997. RECOFTC Report No. 15, RAP Publication.
World Bank Report. Undated. Participation and Indigenous People: The World Bank
Participation Sourcebook. Zeppel, H. 1997. Ecotourism and indigenous people.

35
ANNEX INVESTMENT APPRAISAL OF UPGRADING VISITOR FACILITIES AT NABQ PROTECTED AREA
by
Adrian Whiteman Economist,
Forest Economics Service, FAO Forestry Department, Rome
Background As part of the technical backstopping for FAO project TCP/EGY/0168(A): Rehabilitation, conservation and sustainable utilization of mangroves in Egypt, the Forest Economics Service of the FAO Forestry Department was asked to prepare an investment appraisal of the proposed upgrading of visitor facilities at Nabq Protected Area. This appraisal is based on the data collected by Cabahug and follows standard investment appraisal techniques used in many countries throughout the World. Objective The objective of this appraisal is to examine the economic viability of upgrading the visitor facilities at Nabq Protected Area and recovering the cost of this investment through higher entrance charges to the area. Options The appraisal examines two possible courses of action or options. These are as follows:
Option 1 - do nothing (baseline option): this option assumes a continuation of the current management of Nabq Protected Area, including a small amount of expenditure on staff costs and income from entrance charges maintained at their current level. Option 2 - invest in upgrading visitor facilities: this option includes investment in new facilities at four sites within Nabq Protected Area and some upgrading of equipment used by staff. It also assumes that entrance charges can be raised to recover the cost of these investments.
Because both of these options include both costs and benefits, the financial return on the investment in upgrading visitor facilities is equal to the difference in the cash-flows (and associated measures of economic performance) between the two different options.
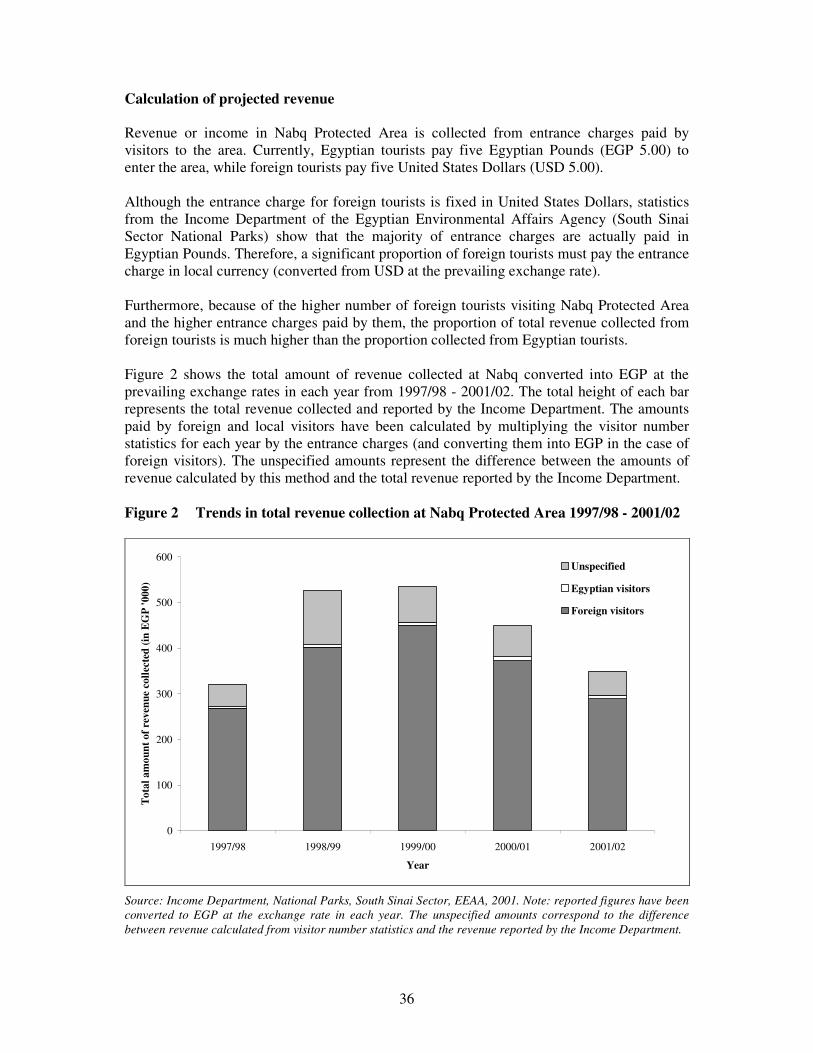
36
Calculation of projected revenue Revenue or income in Nabq Protected Area is collected from entrance charges paid by visitors to the area. Currently, Egyptian tourists pay five Egyptian Pounds (EGP 5.00) to enter the area, while foreign tourists pay five United States Dollars (USD 5.00). Although the entrance charge for foreign tourists is fixed in United States Dollars, statistics from the Income Department of the Egyptian Environmental Affairs Agency (South Sinai Sector National Parks) show that the majority of entrance charges are actually paid in Egyptian Pounds. Therefore, a significant proportion of foreign tourists must pay the entrance charge in local currency (converted from USD at the prevailing exchange rate). Furthermore, because of the higher number of foreign tourists visiting Nabq Protected Area and the higher entrance charges paid by them, the proportion of total revenue collected from foreign tourists is much higher than the proportion collected from Egyptian tourists. Figure 2 shows the total amount of revenue collected at Nabq converted into EGP at the prevailing exchange rates in each year from 1997/98 - 2001/02. The total height of each bar represents the total revenue collected and reported by the Income Department. The amounts paid by foreign and local visitors have been calculated by multiplying the visitor number statistics for each year by the entrance charges (and converting them into EGP in the case of foreign visitors). The unspecified amounts represent the difference between the amounts of revenue calculated by this method and the total revenue reported by the Income Department. Figure 2 Trends in total revenue collection at Nabq Protected Area 1997/98 - 2001/02
0
100
200
300
400
500
600
1997/98 1998/99 1999/00 2000/01 2001/02
Year
Tot
al a
mou
nt o
f rev
enue
col
lect
ed (i
n E
GP
'000
)
Unspecified
Egyptian visitors
Foreign visitors
Source: Income Department, National Parks, South Sinai Sector, EEAA, 2001. Note: reported figures have been converted to EGP at the exchange rate in each year. The unspecified amounts correspond to the difference between revenue calculated from visitor number statistics and the revenue reported by the Income Department.

37
This figure shows that income at Nabq has declined in the last two years in line with the decline in visitor numbers to the area. It also shows that foreign tourists account for at least 80 percent of the total revenue collected at Nabq and possibly more. Assuming that the revenue statistics are probably more reliable than the visitor number statistics, the presence of a significant amount of unspecified or unexplained income also suggests that the visitor number statistics may be underestimates of the real numbers of people visiting the area. Projections of visitor numbers Figure 3 shows the trend in the number of foreign tourists visiting Egypt since 1980. On average, the annual number of foreign tourists has increased steadily over the last two decades by about 170,000 visitors per year or around eight percent. More recently, the tourism industry in Egypt was negatively affected by the bombing of the World Trade Centre on 11 September 2001, which resulted in a drastic reduction in the number of foreign tourists visiting the Red Sea. However, the effect of this was only temporary and the industry slowly recovered after six months. Apart from this temporary setback, it is expected that, on the whole, the number of foreign tourists visiting Egypt will continue to increase at the same rate as it has in the past. Figure 3 Trend in the number of foreign tourists visiting Egypt 1980 - 2001
0
1
2
3
4
5
6
1980 1983 1986 1989 1992 1995 1998 2001
Year
Num
ber
of to
uris
ts (i
n m
illio
ns)
Average annual increase:170,000 or 8 percent
Source: Statistical, Economic & Social Research & Training Centre for Islamic Countries (www.sesrtcic.org).

38
At the local level, trends in visitor numbers to Sharm El Sheik and the Nabq Protected Area are shown in Table 2. This table also shows the sudden fall in visitor numbers to Nabq in 2001/02 (July 2001 to June 2002), which could be attributed to the events of 11 September 2001. Table 2 Visitors to Sharm El Sheik and Nabq Protected Area
Number of Egyptian visitors Number of foreign visitors Year Sharm El
Sheik Nabq Nabq as % of Sharm El Sheik
Sharm El Sheik Nabq Nabq as % of
Sharm El Sheik 1997/98 95,765 600 0.6% 317,150 15,750 5.0% 1998/99 143,355 1,000 0.7% 363,449 23,500 6.5% 1999/00 146,193 1,400 1.0% 645,687 26,150 4.0% 2000/01 185,781 1,700 0.9% 893,810 19,800 2.2% 2001/02 n.a. 1,550 n.a. n.a. 13,000 n.a. Average 142,774 1,250 0.8% 555,024 19,640 3.8%
Source: Income Department, National Parks, South Sinai Sector, EEAA, 2001 In order to make projections of the revenue that will be collected from visitors to Nabq, it is necessary to make projections of future visitor numbers. Excluding the last year (2001/02), the number of foreign visitors to Sharm El Sheik has increased by about 201,000 visitors per year or approximately 44 percent per year, while the annual number of Egyptians visiting Sharm El Sheik has increased by 27,000 or 26 percent per year (see Figure 4). Figure 4 Trends in the number of visitors to Sharm El Sheik 1997/98 - 2000/01
0
100
200
300
400
500
600
700
800
900
1997/98 1998/99 1999/00 2000/01
Year
Num
ber
of v
isito
rs (i
n th
ousa
nds)
Foreignvisitors
Egyptianvisitors
Average annual increase(foreign visitors):
201,000 or 44 percent
Average annual increase(Egyptian visitors):
27,000 or 26 percent
Source: Income Department, National Parks, South Sinai Sector, EEAA, 2001

39
At Nabq, past increases in visitor numbers have been somewhat less than this. The number of foreign visitors to Nabq has increased by about 1,480 visitors per year or 12 percent per year over the period 1997/98 to 2000/01, while the annual number of Egyptians visiting Nabq has increased by 370 visitors or 23 percent per year (see Figure 5). Figure 5 Trends in the number of visitors to Nabq Protected Area 1997/98 - 2000/01
-
5,000
10,000
15,000
20,000
25,000
30,000
1997/98 1998/99 1999/00 2000/01
Year
Num
ber
of v
isito
rs
Foreignvisitors
Egyptianvisitors
Average annual increase(foreign visitors):
1,480 or 12 percent
Average annual increase(Egyptian visitors):370 or 23 percent
Source: Income Department, National Parks, South Sinai Sector, EEAA, 2001 For the purpose of this analysis, it seems reasonable to exclude the figures for visitor numbers in 2001/02 from the estimation of the historical trends in visitor numbers, due to the unusual circumstances experienced during that year. Thus, it is assumed here that future visitor numbers will increase at the same rate as they have in the past (i.e. over the period 1997/98 to 2000/01), but starting from the relatively low level of visitor numbers recorded in 2001/02.

40
The projections of future visitor numbers made on this basis are shown in Figure 6. The number of Egyptians visiting Nabq is projected to increase from 2,290 visitors per year in 2003/04 to 5,620 in 2012/13 (i.e. increasing each year by 370 visitors per year, in line with the historical trend). For foreign tourists, two projections have been made. The high projection assumes that the number of foreign tourists visiting Nabq will increase from 15,960 visitors per year in 2003/04 to 29,280 in 2012/13 (i.e. at an annual increase of 1,480 visitors per year, in line with the historical trend), while the low projection assumes a more conservative increase in foreign tourists visiting Nabq, from 15,000 visitors per year in 2003/04 to 24,000 in 2012/13 (i.e. at an annual increase of 1,000 visitors per year). Figure 6 Trends in visitor numbers to Nabq Protected Area 1997/98 - 2000/01 and
projections from 2003/04 to 2012/13
0
5,000
10,000
15,000
20,000
25,000
30,000
1997/98 2000/01 2003/04 2006/07 2009/10 2012/13
Year
Num
ber
of v
isito
rs
Foreign visitors
Foreign visitors:high projection
Foreign visitors:low projection
Egyptian visitors
Egyptian visitors:projection
Source: author’s estimates, based on Income Department, National Parks, South Sinai Sector, EEAA, 2001 It should be noted that both of these projections of increases in foreign tourists visiting Nabq are quite conservative. The lower projection results in a level of visitor numbers in 2012/13 that is less than the number of visitors experienced in 1999/00 and the higher projection rises to a level that is only 12 percent higher than this figure. Thus, it seems highly likely that these projected levels of visitor numbers can be achieved in the future.

41
Seasonality of visitor numbers The variation throughout the year in the number of visitors to Nabq is not important for the calculation of projected revenue. However, this variation, or the seasonality of visitor numbers, is important in terms of the visitor facilities that will have to be provided. In order to maintain a high level of service provision, visitor facilities must be provided at a level that can cope with the numbers of visitors that will come on the most popular days of the week in the months when visitor numbers are at their highest. Figure 7 Seasonality of visitor numbers to Nabq Protected Area 1997/98 - 2000/01
0%
2%
4%
6%
8%
10%
12%
14%
16%
January March May July September November
Month
Prop
ortio
n of
ann
ual v
isits
in e
ach
mon
th (1
997
- 200
2) Foreign visitors Egyptian visitors
Figure 7 shows the average seasonality of visitor numbers to Nabq over the period 1997/98 to 2000/01. As this figure shows, the most popular month for Egyptian visitors to Nabq is January, while the most popular month for foreign tourists is April. Given that foreign tourists account for the majority of visitors to Nabq, the highest number of visitors can be expected in April, when just under 12 percent of the total annual number of foreign tourists will visit Nabq and just under 10 percent of the annual number of Egyptian tourists will visit the site. In terms of the projections of visitor numbers, these seasonal patterns in visitor numbers suggest that, under the high growth scenario, the number of visitors to Nabq could rise to around 4,000 per month (or about 130 per day) in the most popular month (i.e. April) by 2012/13.

42
Projections of entrance charges A policy of differential pricing (i.e. setting an entrance charge for foreign tourists that is higher than the entrance charge for local people) is common at visitor facilities in developing countries. This reflects the difference in ability to pay between these two groups of people and it is a sensible strategy for increasing revenue. Thus, it is recommended that this policy should be continued. With respect to the potential to increase entrance charges at Nabq, a 1994 study of Dr Er-Hawary showed that visitors would be willing to pay higher entrance charges to Nabq Protected Area as long as a high standard of facilities, amenities and other services could be maintained. This also corresponds to international experiences in the management of ecotourism facilities, in that ecotourists are willing to pay high charges if they perceive that there is a high level of service provision at such sites. The study by Er-Hawary indicated that foreigners would be willing to pay an additional USD 8.50 for entrance to the area, while Egyptian tourists would be willing to pay an additional EGP 7.50. Based on this information, the following assumptions have been made about the potential to increase entrance charges to Nabq in the future:
Under Option 1 (do nothing), it has been assumed that entrance charges will remain the same (at EGP 5.00 for Egyptians and USD 5.00 for foreign tourists), but will be increased by 20 percent in years 3, 5, 7 and 9 (i.e. 2006/07, 2008/09, 2010/11 and 2012/13). These increases will be made to adjust the entrance charges for inflation (currently about 10 percent per year) so that the real price for admission to Nabq will remain roughly the same over the next 10 years. Under Option 2 (upgrade the facilities at Nabq), it is assumed that entrance charges will be doubled in year 1 (2004/05) after work has started on upgrading the facilities. This increase is within the amounts reported in the study of Er-Hawary. Following this, the charges will again be increased by 20 percent in years 3, 5, 7 and 9 to account for inflation (i.e. as under Option 1).
A summary of the projected entrance charges to Nabq under both of these options is shown in Table 3. These entrance charges, along with the projections of visitor numbers presented earlier, have been used to produce the projections of revenue presented later on. Table 3 Projected entrance charges to Nabq Protected Area under the two options
Year Option Year 0
(2003/04) Year 1
(2004/05) Year 3
(2006/07) Year 5
(2008/09) Year 7
(2010/11) Year 9
(2012/13) Option 1 (do nothing) - Egyptian tourists (in EGP) - Foreign tourists (in USD)
5.00 5.00
5.00 5.00
6.00 6.00
7.20 7.20
8.64 8.64
10.37 10.37
Option 2 (upgrade facilities) - Egyptian tourists (in EGP) - Foreign tourists (in USD)
5.00 5.00
10.00 10.00
12.00 12.00
14.40 14.40
17.28 17.28
20.74 20.74

43
Calculation of projected costs Proposals to upgrade the facilities at Nabq were obtained by Cabahug from the Program Manager of the Gulf of Aqaba Protectorate Development Program. The Program Manager suggested a number of improvements that could be made in terms of construction of new buildings and facilities for visitors, the increased provision of other facilities and services for visitors, improvements in staffing and the provision of equipment for staff. In the original proposal, it was suggested that four of each new facility or building would be constructed at Nabq, implying that visitor facilities would be developed at four separate sites within the total Nabq Protected Area. Given that the total area of mangroves at Nabq is 54.5 ha (or 52.5 ha excluding Ras Mohammed) and that there is also a significant but unspecified area of land without trees in the protected area, it seems reasonable to propose the development of four separate visitor sites within Nabq. Specifications for these proposals were obtained by Cabahug, along with estimates of costs (at September 2002 prices). The costs of these proposed improvements have been updated to 2003/04 prices and are briefly described below. Proposals for new building construction Proposals for the construction of new buildings included the construction of shelters for visitors and campers, the construction of toilet blocks, the construction of cafeterias and the construction of a Bedouin craft workshop.
• Shelters/sheds for visitors: the original proposal suggested constructing eight shelters/sheds for visitors (i.e. two at each visitor site) over the first four years of the development. Each shelter would be 10 metres in length at a cost of EGP 1,000 per metre (at September 2002 prices). Adjusted to 2003/04 prices, each shelter/shed would cost approximately EGP 1,100 per metre, giving a total investment cost of EGP 22,000 in each of the first four years of the development (i.e. EGP 1,100/metre x 10 metres x 2 shelters/sheds in each of the first four years). In addition, it is assumed here that each of these shelters/sheds would have to be refurbished after five years at a cost of 20 percent of the original building cost (i.e. EGP 4,400 in each year from Year 5 to Year 8).
• Camping shelters/sheds for visitors: the original proposal suggested that eight
camping shelters (of the same specification as above) would also be provided over the same period. The costs of these would be exactly the same as those described above.
• Toilet blocks: Cabahug reported that a single toilet block costs EGP 3,000 and a
double block costs EGP 8,000, but then went on to report that “four site costs” amount to EGP 15,000 (all at September 2002 prices). Although it is unclear what this means, it is certainly likely that the total cost of installing toilet blocks will amount to more than the cost of purchasing the blocks themselves (i.e. to include the costs of site preparation, plumbing etc.). Based on experience at other locations, it is assumed that the total cost of installing double toilet blocks will amount to approximately twice the cost of purchasing the toilet blocks or EGP 16,500 each (at 2003/04 prices). The proposal calls for installation of four double toilet blocks (one in each of the first four years of the development), which seems more than adequate to cope with the

44
maximum expected number of daily visitors to the site (about 130 visitors on a busy day by 2012/13). In addition, as above it is assumed here that each of these toilet blocks would have to be refurbished after five years at a cost of 20 percent of the original building cost (i.e. EGP 3,300 in each year from Year 5 to Year 8).
• Cafeteria, with toilet, deep freezer and solar power: the original cost calculations
by Cabahug included the construction of four cafeterias and the installation of a deep freezer (powered by solar power) in the Bedouin craft workshop. Firstly, it seems unlikely that the number of visitors would be sufficient to justify the construction of four cafeterias, so this has been reduced to only two (the first in Year 0 and the second in Year 5). Secondly, it would seem to make more sense to install deep freezers in the cafeterias rather than the Bedouin craft workshop, so it has been assumed here that each cafeteria will include a deep freezer and solar power unit. The building cost has been updated for inflation from the figure of EGP 25,000 given by Cabahug (at September 2002 prices) to a figure of EGP 27,500 (at 2003/04 prices). Similarly, the cost of the deep freezer and associated solar power equipment has been updated for inflation to EGP 57,200 per unit. It has also been assumed that the building will have to be refurbished after five years (at a cost of 20 percent of the original construction cost) and that the deep freezer and solar power unit will have to be completely replaced after five years.
• Bedouin craft workshop: the original proposal also included the construction of a
Bedouin craft workshop. This would cost the same as the construction of a cafeteria and it has been assumed that this will be constructed in Year 1. As with the cafeteria, it has also been assumed that the Bedouin craft workshop will have to be refurbished after five years at a cost of 20 percent of the original construction cost.
• Maintenance cost: the original calculations by Cabahug estimated the cost of
maintenance as equal to 10 percent of the cost of all capital expenditure in all previous years. A similar approach has been used here, except that the refurbishment of buildings has been specified explicitly (see above) and it has been assumed that more general maintenance costs (e.g. painting, minor repairs, replacement of windows, cleaning, etc.) will amount to five percent of the costs of construction (including the cost of purchasing the deep freezers and solar power units).
A synthesis of all of these costs over the next ten years (i.e. from 2003/04 to 2012/13) is given in Table 4, along with the estimate of the total building construction and maintenance costs for these improvements.

45
Table 4 Estimated building construction and maintenance costs for upgrading the visitor facilities at Nabq Protected Area
Construction and maintenance of buildings Year 0 (2003/04)
Year 1 (2004/05)
Year 2 (2005/06)
Year 3 (2006/07)
Year 4 (2007/08)
Year 5 (2008/09)
Year 6 (2009/10)
Year 7 (2010/11)
Year 8 (2011/12)
Year 9 (2012/13)
Shelter/shed Quantity (length in metres) 20 20 20 20 Cost @ EGP 1,100/metre 22,000 22,000 22,000 22,000 Refurbishment @ 20% of cost after 5 years 4,400 4,400 4,400 4,400 Double toilet block Quantity 1 1 1 1 Cost @ EGP 16,500/block 16,500 16,500 16,500 16,500 Refurbishment @ 20% of cost after 5 years 3,300 3,300 3,300 3,300 Camping shed Quantity (length in metres) 20 20 20 20 Cost @ EGP 1,100/metre 22,000 22,000 22,000 22,000 Refurbishment @ 20% of cost after 5 years 4,400 4,400 4,400 4,400 Cafeteria, with toilet, deep freeze and solar power Quantity: building and toilet 1 1 Cost @ EGP 27,500/building 27,500 27,500 Refurbishment @ 20% of cost after 5 years 5,500 Quantity: deep freeze and solar power system 1 1 Cost @ EGP 57,200/unit 57,200 57,200 Replacement after 5 years 57,200 Bedouin craft workshop Quantity 1 Cost @ EGP 27,500/building 27,500 Refurbishment @ 20% of cost after 5 years 5,500 Building maintenance (including deep freeze and solar power) Annual cost @ 5% of construction cost after 1 year 7,260 10,285 13,310 16,335 16,335 20,570 20,570 20,570 20,570 TOTAL COST OF BUILDING CONSTRUCTION AND MAINTENANCE 145,200 95,260 70,785 73,810 16,335 175,835 38,170 32,670 32,670 20,570
46
Proposals for the construction of other visitor facilities In addition to the proposals for new building construction, the construction of other visitor facilities has also been proposed as follows.
• Carparks: the original proposal included the construction of four carparks at a total cost of about EGP 12,000 each (at September 2002 prices). Each carpark would have the capacity for 30 cars and this cost would include all site preparation, signs and the construction of low stone walls around each carpark. With a projected maximum of only 130 visitors to Nabq on a busy day, the provision of 120 parking spaces is a little on the high side, but this has been included in the cost calculations, using an updated cost estimate of EGP 13,200 per carpark (at 2003/04 prices) and assuming that one carpark will be constructed in each of the first four years of the development. The cost of maintaining these carparks has been estimated as 2.5 percent of the construction costs over each of the first five years, increasing to five percent of the construction costs for the years after this. This increase in maintenance costs is expected to occur as more visitors come to Nabq and the carparks are used more heavily.
• Simple walking trails: simple walking trails will be constructed by clearing paths
through the mangroves and using lines and ropes to delineate these paths. The proposal includes the construction of 500 metres of such paths in each of the first four years of the development. The original cost estimated by Cabahug was EGP 7,500 per 500 metres or EGP 15 per metre (at September 2002 prices). Updated to 2003/04 prices, it has been assumed that these will cost EGP 17 per metre or a total of EGP 8,500 in each of the first four years. Maintenance of these paths is assumed to start three years after they are constructed and will cost five percent of the original construction cost every year.
• Boardwalks: boardwalks will also be constructed to allow people access to see the
mangroves. The original costs presented by Cabahug contained a discrepancy, giving a cost of EGP 1,000 per metre in the text and USD 250 per five metres (equal to about EGP 230 per metre) in the financial calculations later on. Given that the cost of constructing the sheds was also estimated at EGP 1,000 per metre, it seems likely that the higher figure presented by Cabahug is a mistake. Therefore, it is assumed here that the construction of boardwalks will cost around EGP 300 per metre (at 2003/04 prices) and that 200 metres of boardwalk will be constructed in each of the first four years of the development. As with the simple walking trails, it is assumed that maintenance of the boardwalks will start three years after they are constructed and will cost five percent of the original construction cost every year.
• Viewing decks: four viewing decks will be constructed (one in each of the first four
years). Each viewing deck will be five metres high and constructed of wood and/or metal poles with a palm-leaf roof. Cabahug estimated the cost of each viewing deck as EGP 25,000 (at September 2002 prices), which has been updated to EGP 27,500 per unit (at 2003/04 prices). For maintenance costs, the same assumptions as above have been used.
A synthesis of all of these costs along with the total cost of construction and maintenance of these other facilities is given in Table 5.

47
Table 5 Estimated costs of construction and maintenance of other facilities as part of the upgrading of visitor facilities at Nabq Protected Area
Construction and maintenance of other visitor facilities Year 0
(2003/04) Year 1
(2004/05) Year 2
(2005/06) Year 3
(2006/07) Year 4
(2007/08) Year 5
(2008/09) Year 6
(2009/10) Year 7
(2010/11) Year 8
(2011/12) Year 9
(2012/13) Carpark (for 30cars) Quantity 1 1 1 1 Cost @ EGP 13,200/carpark 13,200 13,200 13,200 13,200 Maintenance @ 2.5% of cost each year after 1 year, 5% after 5 years 330 660 990 1,320 2,640 2,640 2,640 2,640 2,640 Simple walking trails Quantity (length in metres) 500 500 500 500 Cost @ EGP 17/metre 8,500 8,500 8,500 8,500 Maintenance @ 5% of cost each year after 3 years 425 850 1,275 1,700 1,700 1,700 1,700 Board walk Quantity (length in metres) 200 200 200 200 Cost @ EGP 300/metre 60,000 60,000 60,000 60,000 Maintenance @ 5% of cost each year after 3 years 3,000 6,000 9,000 12,000 12,000 12,000 12,000 Viewing deck (5m height) Quantity 1 1 1 1 Cost @ EGP 27,500/deck 27,500 27,500 27,500 27,500 Maintenance @ 5% of cost each year after 3 years 1,375 2,750 4,125 5,500 5,500 5,500 5,500 TOTAL COST OF CONSTRUCTION AND MAINTENANCE OF OTHER FACILITIES 109,200 109,530 109,860 114,990 10,920 17,040 21,840 21,840 21,840 21,840

48
Purchase of other equipment for visitors The proposal included the purchase of a variety of other equipment and materials for visitors, including the following:
• Two-door safety lockers/cabinets: purchase of one two-door safety locker/cabinet in each of the first four years (i.e. one at each site). The purchase price estimated by Cabahug of EGP 500 per unit is equal to EGP 550 per unit at 2003/04 prices.
• Litter bins: the original proposal included the purchase of ten stone/wooden litter
bins (with metallic lids) in each of the first four years (i.e. ten for each site). It is assumed here that five litter bins will be purchased for each site at first, with another five after five years. The purchase price estimated by Cabahug of EGP 500 per unit is equal to EGP 550 per unit at 2003/04 prices.
• Road signs: purchase of ten road signs made of wood and stone with ceramics, in
each of the first four years (i.e. forty in total). The purchase price estimated by Cabahug of EGP 250 per unit is equal to EGP 275 per unit at 2003/04 prices.
• Direction signs: purchase of ten wooden direction signs for on-site use, in each of the
first four years (i.e. forty in total). The purchase price estimated by Cabahug of EGP 50 per unit is equal to EGP 55 per unit at 2003/04 prices.
• On-site information panel: two on-site information panels (2.00m x 1.20m) made of
aluminium with a fibre cover and UV-resistant printing will be installed in each of the first four years (i.e. eight in total). The purchase price estimated by Cabahug of EGP 2,500 per panel is equal to EGP 2,750 per panel at 2003/04 prices.
• Three-dimensional site map: site maps (2.00m x 1.00m) will be installed, one in
each of the first four years (i.e. four in total). The purchase price estimated by Cabahug of EGP 6,000 per panel is equal to EGP 6,600 per panel at 2003/04 prices.
• Fencing rope: fencing rope (nylon marine type) will be required to restrict access to
some areas. It is assumed that 500 metres of rope will be required in each of the first four years and 50 metres of rope each year after this. The purchase price estimated by Cabahug of EGP 5.00 per metre is equal to EGP 5.50 per metre at 2003/04 prices.
• Brochures: the original cost calculations by Cabahug included printing 2,000
brochures about Nabq in each of the first four years. Effective marketing will be very important for the success of this development, so this appraisal has included the cost of 2,000 brochures in every year, at a total cost of EGP 12,600 per year.
• Maintenance and replacement: the maintenance cost has been estimated as 10
percent of the purchase price of all of the above items each year (excluding the fencing rope and brochures). It has also been assumed that the above equipment will be replaced after thee to five years.
A synthesis of all of these costs along with the total cost of purchasing other equipment for visitors is given in Table 6.

49
Table 6 Estimated costs of purchasing other equipment for visitors as part of the upgrading of facilities at Nabq Protected Area
Purchase of other equipment for visitors Year 0 (2003/04)
Year 1 (2004/05)
Year 2 (2005/06)
Year 3 (2006/07)
Year 4 (2007/08)
Year 5 (2008/09)
Year 6 (2009/10)
Year 7 (2010/11)
Year 8 (2011/12)
Year 9 (2012/13)
Two-door safety lockers/cabinets Quantity 1 1 1 1 Cost @ EGP 550/unit 550 550 550 550 Replacement after 3 years 550 550 550 1,100 550 550 1,100 Litter bins Quantity 5 5 5 5 5 5 5 5 Cost @ EGP 550/unit 2,750 2,750 2,750 2,750 2,750 2,750 2,750 2,750 Replacement after 5 years 2,750 2,750 2,750 2,750 Road signs Quantity 10 10 10 10 Cost @ EGP 275/unit 2,750 2,750 2,750 2,750 Replacement after 5 years 2,750 2,750 2,750 2,750 Direction signs Quantity 10 10 10 10 Cost @ EGP 55/unit 550 550 550 550 Replacement after 3 years 550 550 550 1,100 550 550 1,100 On-site information panel (2.00m x 1.20m) Quantity 2 2 2 2 Cost @ EGP 2,750/unit 5,500 5,500 5,500 5,500 Replacement after 3 years 5,500 5,500 5,500 11,000 5,500 5,500 11,000 Three-dimensional site map (2.00m x 1.00m) Quantity 1 1 1 1 Cost @ EGP 6,600/unit 6,600 6,600 6,600 6,600 Replacement after 5 years 6,600 6,600 6,600 6,600 Fencing rope (nylon marine type) Quantity (length in metres) 500 500 500 500 50 50 50 50 50 50 Cost @ EGP 5.50/metre 2,750 2,750 2,750 2,750 275 275 275 275 275 275 Brochures (printing) Quantity (number of brochures) 2,000 2,000 2,000 2,000 2,000 2,000 2,000 2,000 2,000 2,000 Cost @ EGP 6.30/copy 12,600 12,600 12,600 12,600 12,600 12,600 12,600 12,600 12,600 12,600 Maintenance of other equipment Cost @ 10% of purchase price each year 1,870 3,740 5,610 7,480 7,480 7,755 8,030 8,305 8,580 8,580 TOTAL COST OF OTHER EQUIPMENT 35,920 37,790 39,660 48,130 26,955 42,080 48,955 42,630 42,905 34,655

50
Staffing costs Irrespectively of whether the visitor facilities at Nabq Protected Area are upgraded, staff will be required to collect the entrance charges at the site, maintain the facilities and generally look after the area. The costs of this are as follows:
• Revenue collector: one revenue collector will be required at Nabq to collect the entrance charges to the site. Cabahug estimated the cost of this as EGP 800 per month or EGP 9,600 per year, which is equal to EGP 10,560 per year at 2003/04 prices.
• Caretaker: one caretaker will be required at Nabq to look after the site. Cabahug
estimated the cost of this as EGP 750 per month or EGP 9,000 per year, which is equal to EGP 9,900 per year at 2003/04 prices.
• Rubbish collectors: rubbish collectors will be required to collect rubbish at the site
and perform other simple cleaning and maintenance tasks. It is assumed that only one will be required at first, rising to two in Year 2 and three in Year 5, as the number of visitors to the site increases. Cabahug estimated the cost of this (per person) as EGP 500 per month or EGP 6,000 per year, which is equal to EGP 6,600 per year at 2003/04 prices.
• Staff management overhead: as given by Cabahug, the staff management overhead
has been estimated to amount to an additional 15 percent on top of salary costs. The above staff salary costs and overheads will be incurred whether the visitor facilities at Nabq are upgraded or not, so they have been included in the calculation of cash-flows under both options. A synthesis of all of these costs along with the total staff salary costs is given in Table 7.

51
Table 7 Estimated staff salary costs at Nabq Protected Area
Staff salary costs Year 0 (2003/04)
Year 1 (2004/05)
Year 2 (2005/06)
Year 3 (2006/07)
Year 4 (2007/08)
Year 5 (2008/09)
Year 6 (2009/10)
Year 7 (2010/11)
Year 8 (2011/12)
Year 9 (2012/13)
Revenue collector Quantity 1 1 1 1 1 1 1 1 1 1 Cost (salary) @ EGP 10,560/year 10,560 10,560 10,560 10,560 10,560 10,560 10,560 10,560 10,560 10,560 Caretaker Quantity 1 1 1 1 1 1 1 1 1 1 Cost (salary) @ EGP 9,900/year 9,900 9,900 9,900 9,900 9,900 9,900 9,900 9,900 9,900 9,900 Rubbish collector Quantity 1 1 2 2 2 3 3 3 3 3 Cost (salary) @ EGP 6,600/year 6,600 6,600 13,200 13,200 13,200 19,800 19,800 19,800 19,800 19,800 Staff management overhead Cost @ 15% of salary cost 4,059 4,059 5,049 5,049 5,049 6,039 6,039 6,039 6,039 6,039 TOTAL STAFF SALARY COSTS (INCLUDING OVERHEADS) 31,119 31,119 38,709 38,709 38,709 46,299 46,299 46,299 46,299 46,299

52
Purchase of other equipment for staff The proposal to upgrade facilities at Nabq also included the purchase of other equipment and materials for staff at the site. Most of these proposals were not included in the original text of the proposal, but were included in the cash-flow calculations made separately by Cabahug. There is always a risk that a new investment proposal provides an opportunity for staff to request additional equipment that might not necessarily be essential for the success of the development. Therefore, all such requests must be scrutinised very carefully. In this case, most of the proposals seemed reasonable and have been included in the appraisal (with some modifications). The full details of the equipment proposed for staff are given below.
• Small truck for rubbish collection and water delivery: the original cost calculations by Cabahug included the purchase of a small truck or dump truck for rubbish collection and water delivery. Such a vehicle would be useful to improve the operation of the site and successfully maintain a high level of service provision, so this request seems reasonable. Cabahug estimated the cost of this as USD 11,000, which is equal to about EGP 55,000 at 2003/04 prices and exchange rates. It has been assumed that one small truck will be purchased in the first year of the development (i.e. Year 0) and that this will be replaced after five years (i.e. in Year 5).
• Car for caretaker/revenue collector: the calculations by Cabahug also included the
rental or purchase of a car for the rubbish collector. If there is already a truck for rubbish collection, it does not seem necessary to have a car for the rubbish collector as well. However, having a car on site could probably be justified for use by the revenue collector (e.g. to take money to the bank) and caretaker (e.g. to collect materials for repairs, distribute brochures to local hotels and tourist information centres, etc.). Therefore, the purchase of a car has been included in the appraisal. Cabahug’s original estimate was that it would cost approximately EGP 1,000 per month to rent a car or EGP 50,000 to purchase a car (at September 2002 prices). This cost for renting a car seems too low compared to the cost of purchasing a car. Therefore, it has been assumed that a car will be purchased in the first year (i.e. Year 0) at a cost of EGP 55,000 (at 2003/04 prices). This will be replaced after five years (i.e. in Year 5).
• Motorcycles: Cabahug proposed that three motorcycles would be purchased (one
each in Years 2, 3 and 4). The original proposal did not give any justification for these purchases and this timing would result in more vehicles than staff at the site in the early years of the development. The purchase of motorcycles would help staff to move around the facility, so this can be justified and it has been assumed here that a motorcycle would be purchased in Year 0, Year 2 and Year 5, to coincide with the increase in the number of rubbish collectors at the facility. This timing of the purchase of vehicles (including the car and truck) would ensure that the number of vehicles at the facility will match the number of staff as the facility expands. In addition, as with the truck and car, it is assumed that the motorcycles will be replaced after five years.
• Vehicle operating costs (petrol, oil, lubricants): the original cost calculation by
Cabahug estimated vehicle operating costs at USD 1,000 (or about EGP 4,600) per year. This seems a little on the low side and the assumption of the same amount every year does not take into account the fact that the number of vehicles at the site will increase over time. It has been assumed in this appraisal, that the vehicle operating

53
costs of the car and truck will amount to EGP 2,500 per unit per year and that vehicle operating costs of the motorcycles will amount to EGP 1,000 per unit per year.
• Vehicle maintenance costs: as given by Cabahug, annual vehicle maintenance costs
have been estimated to amount to 10 percent of the vehicle purchase price.
• Binoculars/telescope: Cabahug included the cost of purchasing an unspecified number of binoculars or telescopes in Years 1, 2 and 3 of the development. Binoculars or telescopes could be useful for staff in the performance of their duties or to enhance the experience of visitors to the site, so it has been assumed here that four binoculars or telescopes will be purchased in each of the first four years of the development at a cost of EGP 500 per unit and that these will be replaced after five years.
• Mobile/two way radio: Cabahug also included the cost of purchasing a number of
mobile/two way radios (four in Year 1, two in Year 2 and another four in Year 3). Again, no justification was given for the number or timing of these purchases. It has been assumed here that four mobile/two way radios will be purchased in Year 0 and that an additional unit will be purchased in Year 2 and Year 5. The timing of these purchases will ensure that every staff member can have a radio and that there will also be a spare radio in case one of them breaks down. The cost given by Cabahug of USD 350 per unit has been updated to a cost of EGP 1,800 per unit (at 2003/04 prices) and it has been assumed that these will be replaced after five years.
• Computer and cash register: Cabahug included the cost of purchasing one computer
or cash register in the first year of operation at a cost of USD 1,500. It has been assumed here that one computer and one cash register will be purchased in Year 0 at a cost of EGP 7,600 per unit and that these items will be replaced after five years.
• Maintenance costs: as given by Cabahug, it has been estimated that the annual costs
of maintaining this equipment will amount to 10 percent of the purchase price.
• Plastic jars/drums for water supply: Cabahug included the cost of purchasing 20 plastic jars/drums for water supply in Years 1, 2 and 3 at a cost of USD 50 each. This seems a little on the low side, so it has been assumed here that 20 plastic jars/drums will be purchased in each of the first four years, at a cost of EGP 250 per unit. It has also been assumed that these will have to be replaced every three years.
• Plastic rubbish bags: Cabahug estimated the cost of purchasing rubbish bags as a
fixed amount of USD 40 per month or USD 480 per year (equal to about EGP 2,200 per year). It seems likely that the number of rubbish bags required will start off lower than this, then increase over the first four years as the four sites at Nabq are developed. Therefore, it has been assumed here that the provision of rubbish bags will cost EGP 600 per site and that this will increase from serving one site in Year 0 to all four sites in Year 3 (and thereafter).
A synthesis of all of these costs along with the total cost of purchasing all of this equipment is given in Table 8.

54
Table 8 Estimated costs of purchasing other equipment for staff as part of the upgrading of facilities at Nabq Protected Area
Purchase of other equipment for staff Year 0 (2003/04)
Year 1 (2004/05)
Year 2 (2005/06)
Year 3 (2006/07)
Year 4 (2007/08)
Year 5 (2008/09)
Year 6 (2009/10)
Year 7 (2010/11)
Year 8 (2011/12)
Year 9 (2012/13)
Small truck for rubbish collection and water delivery Quantity 1 Cost @ EGP 55,000/unit 55,000 Replacement after 5 years 55,000 Car for caretaker/revenue collector Quantity 1 Cost @ EGP 55,000/unit 55,000 Replacement after 5 years 55,000 Motorcycle for staff Quantity 1 1 1 Cost @ EGP 7,600/unit 7,600 7,600 7,600 Replacement after 5 years 7,600 7,600 Vehicle operating costs (petrol, oil, lubricants) Car and truck: cost @ EGP 2,500/unit/year 5,000 5,000 5,000 5,000 5,000 5,000 5,000 5,000 5,000 5,000 Motorcycle: cost @ EGP 1,000/unit/year 1,000 1,000 2,000 2,000 2,000 3,000 3,000 3,000 3,000 3,000 Vehicle maintenance costs Cost @ 10% of purchase price each year 11,760 11,760 12,520 12,520 12,520 13,280 13,280 13,280 13,280 13,280

55
Table 8 Estimated costs of purchasing other equipment for staff as part of the upgrading of facilities at Nabq Protected Area (cont.)
Purchase of other equipment for staff Year 0 (2003/04)
Year 1 (2004/05)
Year 2 (2005/06)
Year 3 (2006/07)
Year 4 (2007/08)
Year 5 (2008/09)
Year 6 (2009/10)
Year 7 (2010/11)
Year 8 (2011/12)
Year 9 (2012/13)
Binoculars/telescope Quantity 4 4 4 4 Cost @ EGP 500/unit 2,000 2,000 2,000 2,000 Replacement after 5 years 2,000 2,000 2,000 2,000 Mobile/two way radio Quantity 4 1 1 Cost @ EGP 1,800/unit 7,200 1,800 1,800 Replacement after 5 years 7,200 1,800 Computer and cash register Quantity 2 Cost @ EGP 7,600/unit 15,200 Replacement after 5 years 15,200 Maintenance of other equipment (except vehicles) Cost @ 10% of purchase price each year 2,440 2,640 3,020 3,220 3,220 3,400 3,400 3,400 3,400 3,400 Plastic jars/drums for water supply Quantity 20 20 20 20 Cost @ EGP 250/unit 5,000 5,000 5,000 5,000 Replacement after 3 years 5,000 5,000 5,000 10,000 5,000 5,000 10,000 Plastic rubbish bags Quantity (number of sites served) 1 2 3 4 4 4 4 4 4 4 Cost @ EGP 600/site/year 600 1,200 1,800 2,400 2,400 2,400 2,400 2,400 2,400 2,400 TOTAL COST OF OTHER EQUIPMENT FOR STAFF 167,800 28,600 40,740 37,140 30,140 183,480 39,080 43,480 34,080 37,080

56
Discounted cash-flow analysis In order to assess and compare the economic viability of the two options for future developments at Nabq, it is necessary to combine all of the revenue and cost information described above and to calculate measures of the economic or financial performance of the two options. The process for doing this is called discounted cash-flow analysis. Explanation of financial methodology and terminology used in this appraisal Before proceeding, it is useful to first explain a little of the methodology and terminology that will be used in this analysis.
• A cash-flow presents the projections of revenue and costs over a specified investment period. For the purpose of this analysis, a ten-year investment period has been used. This is a reasonable length of time, so that the much of the impact of upgrading the visitor facilities at Nabq can be measured and included in the analysis without having to make projections too far into the (uncertain) future. Each year in the investment period is numbered from Year 0 to Year 9, where Year 0 represents the current year or the first year of the development (i.e. 2003/04).
• A discounted cash-flow presents the projections of future revenue and costs, but the
figures in each year are adjusted to account for the fact that monetary amounts in later years have less value now (i.e. in the current year) than amounts in earlier years. The easiest way to think of the process of discounting is to consider the process in reverse. For example, USD 100 at the present time could be invested in a bank account at an interest rate of 10 percent, to give USD 110 in one year’s time. In other words, the present (or discounted) value of USD 110 in one year’s time would be only USD 100 at the present time. Discounting is the process whereby monetary amounts in later years are reduced to take this effect into account. After discounting, revenue and costs become discounted revenue and discounted costs.
• The discount rate is the amount by which future values are reduced and can be
thought of as similar to an interest rate. For the purpose of this analysis, two discount rates have been used: 10 percent and 15 percent. In other words, at the 10 percent discount rate, all future costs and benefits have been reduced by 10 percent for each year in the future in which they occur. The use of a 10 percent discount rate is common in investment appraisals in developing countries and the 15 percent discount rate has also been used as a simple way of accounting for the potential risk associated with this development (i.e. in order to adjust for potential uncertainty in the future, it places less weight on the costs and benefits that will occur in later years of the development). The discount rate is also sometimes referred to as the target rate of return (TRR), which is the (real) rate of return that the investor expects to earn on all money invested in the project (also see NPV and IRR below).
• Investment analysis is always conducted in real terms rather than nominal terms. In
other words, future revenues and costs are not increased to take into account the possible effects of inflation. This is because it is difficult to forecast future inflation. In stead it is assumed that inflation will have exactly the same effect on all revenues and costs in the future, so that any monetary amounts specified at current prices can be input into the cash-flow in later years without adjustment (i.e. under the

57
assumption that they will not change in real terms). In the case of this appraisal, there is one item that will not automatically increase with inflation and this is the level of entrance charges to Nabq, which will be fixed by the Government. It is proposed that the entrance charges will be increased in future years to take some account of inflation so, for the purposes of this analysis, they are shown in the cash-flows in both nominal terms and converted into real terms (i.e. after adjustment for future inflation, assuming a 10 percent rate of inflation).
• Net discounted revenue is equal to discounted revenue minus discounted cost and is
a measure of the surplus of revenue over costs in each year of the investment period, after adjusting these figures to take into account the discount rate. Net discounted revenue, discounted revenue and discounted costs over the whole investment period can also be added together to give total net discounted revenue or net present value (see below), total discounted revenue and total discounted cost.
• The net present value (NPV) of each cash-flow is calculated by adding together the
net discounted revenue in every year of the investment period. The NPV is a measure of the total economic or financial value of each cash-flow. If the NPV is positive, this indicates that the revenue from the cash-flow is sufficient to cover all costs, meet the target rate of return (i.e. discount rate) on all of the money spent over the investment period and produce a surplus over and above this. If the NPV is negative, this indicates that the revenue is not sufficient to cover all costs and meet the target rate of return. If NPV equals zero, this indicates that the revenue is just sufficient to cover all costs and meet the target rate of return. As noted at the start of this appraisal, the investment in new facilities at Nabq is represented by the difference in the cash-flows between Option 1 and Option 2 (i.e. if the investment in new facilities at Nabq can be economically justified, the cash-flow for Option 2 should be better than the cash-flow for Option 1), so it is the difference in NPV between these two options that is the correct measure of the economic or financial performance of the investment in new facilities.
• The internal rate of return (IRR) is the rate of return earned on all money invested
in the project (i.e. all costs). This can be calculated by adjusting the discount rate until NPV = 0. When this occurs, that discount rate is the IRR of the project or the rate of return earned on all of the money invested in the project. For a project to be economically viable, the IRR must also be higher than the target rate of return (or discount rate). IRR can only be calculated if the net discounted revenue in at least one of the years of the investment period is negative (i.e. in at least one year, costs are higher than revenue). As noted above, in the case of this appraisal the return on the investment in new facilities at Nabq should be calculated as the difference in the cash-flows between Options 1 and 2, so the IRR of the investment in new facilities should also be calculated from the difference in the two cash-flows.
Discounted cash-flows for Option 1 - do nothing (baseline option) The cash-flows and discounted cash-flows for Option 1- do nothing (baseline option), are shown in Table 9 and Table 10 respectively. Starting with Table 9, the first set of rows in this table shows the projections for visitor numbers made earlier (and shown in Figure 6 above). The next set of rows then shows the

58
projected entrance charges to Nabq assumed under Option 1 (i.e. from Table 3 above). The entrance charges in USD here are also converted to EGP using the average exchange rate in 2002/03 (i.e. USD 1.00 = EGP 5.15). This is done because the whole of the remainder of this financial analysis is calculated in EGP. As noted above, these entrance charges are stated in nominal values (i.e. they will not automatically increase to account for inflation, although some increases in nominal values have been assumed). Therefore, the next two rows present the entrance charges in EGP in real terms (i.e. after adjustment for inflation, assuming a 10 percent rate of inflation). The five rows after this then present the projections of total real revenue at Nabq over the next 10 years. These have been calculated by multiplying the projections of visitor numbers by the real entrance charges in EGP. The last two rows here present the totals under the two different scenarios of high and low growth in the number of foreign tourists visiting Nabq. The original calculations made by Cabahug also deducted 10 percent from the projections of revenue. No explanation was given for this, but it is assumed here that this is sales tax on the entrance charges. Thus, the next two rows calculate the amount of sales tax that will have to be paid out of the revenue from entrance charges (under the high and low visitor number scenarios). This is deducted from the pre-tax revenue from entrance charges (given above) to give the projections of post-tax revenue from entrance charges in the last two rows of this section. The next section of this table then presents the projected costs under Option 1. Because under Option 1 there is no investment in upgrading the facilities at Nabq, this is simply equal to the projections of staffing costs (already shown in Table 7 above). The last section of this table then shows the projections of net revenue. These are calculated as the projected revenue after tax in each year less the projected cost. Again, two projections are given, corresponding to the two different scenarios of high and low growth in the number of foreign tourists visiting Nabq. In Table 10, the figures for total revenue, total costs and total net revenue are presented again except that in this table they are discounted. In the top part of this table, all of the figures are discounted using a 10 percent discount rate while, in the lower part of this table, the figures are presented after discounting using a 15 percent discount rate. This table also gives the total discounted revenue, total discounted cost and total discounted net revenue or NPV in the column on the left-hand side of the figures for Year 0. These figures are simply the sum of the amounts given in Year 0 to Year 9 in each row.

59
Table 9 Cash-flow for Option 1 - do nothing (baseline option)
Undiscounted revenue projections Year 0 (2003/04)
Year 1 (2004/05)
Year 2 (2005/06)
Year 3 (2006/07)
Year 4 (2007/08)
Year 5 (2008/09)
Year 6 (2009/10)
Year 7 (2010/11)
Year 8 (2011/12)
Year 9 (2012/13)
Number of visitors Egyptian visitors 2,290 2,660 3,030 3,400 3,770 4,140 4,510 4,880 5,250 5,620 Foreign visitors: low projection 15,000 16,000 17,000 18,000 19,000 20,000 21,000 22,000 23,000 24,000 Foreign visitors: high projection 15,960 17,440 18,920 20,400 21,880 23,360 24,840 26,320 27,800 29,280 Entrance charge (nominal value) Egyptian visitors (in EGP) 5.00 5.00 5.00 6.00 6.00 7.20 7.20 8.64 8.64 10.37 Foreign visitors (in USD) 5.00 5.00 5.00 6.00 6.00 7.20 7.20 8.64 8.64 10.37 Exchange rate (EGP per USD 1.00) 5.15 5.15 5.15 5.15 5.15 5.15 5.15 5.15 5.15 5.15 Foreign visitors (in EGP) 25.75 25.75 25.75 30.90 30.90 37.08 37.08 44.50 44.50 53.40 Entrance charge (real value, assuming 10% inflation) Egyptian visitors (in EGP) 5.00 4.55 4.13 4.51 4.10 4.47 4.06 4.43 4.03 4.40 Foreign visitors (in EGP) 25.75 23.41 21.28 23.22 21.11 23.02 20.93 22.83 20.76 22.64 Real revenue (before tax) from entrance charges Egyptian visitors (in EGP) 11,450 12,091 12,521 15,327 15,450 18,508 18,330 21,636 21,161 24,711 Foreign visitors: low projection (in EGP) 386,250 374,545 361,777 417,881 400,997 460,475 439,545 502,337 477,427 543,475 Foreign visitors: high projection (in EGP) 410,970 408,255 402,636 473,599 461,780 537,835 519,918 600,977 577,064 663,039 Total - Egyptian visitors plus foreign visitors: low projection (in EGP) 397,700 386,636 374,298 433,208 416,447 478,984 457,874 523,973 498,588 568,186 Total - Egyptian visitors plus foreign visitors: high projection (in EGP) 422,420 420,345 415,157 488,926 477,230 556,344 538,248 622,614 598,225 687,750 Sales tax (10% of pre-tax entrance charge) Total - Egyptian visitors plus foreign visitors: low projection (in EGP) 36,155 35,149 34,027 39,383 37,859 43,544 41,625 47,634 45,326 51,653 Total - Egyptian visitors plus foreign visitors: high projection (in EGP) 38,402 38,213 37,742 44,448 43,385 50,577 48,932 56,601 54,384 62,523 Real revenue (after tax) from entrance charges Total - Egyptian visitors plus foreign visitors: low projection (in EGP) 361,545 351,488 340,270 393,826 378,588 435,440 416,249 476,339 453,262 516,533 Total - Egyptian visitors plus foreign visitors: high projection (in EGP) 384,018 382,132 377,415 444,478 433,845 505,767 489,316 566,012 543,841 625,228
Undiscounted cost projection Year 0 (2003/04)
Year 1 (2004/05)
Year 2 (2005/06)
Year 3 (2006/07)
Year 4 (2007/08)
Year 5 (2008/09)
Year 6 (2009/10)
Year 7 (2010/11)
Year 8 (2011/12)
Year 9 (2012/13)
Total staff salary costs including overheads (in EGP) 31,119 31,119 38,709 38,709 38,709 46,299 46,299 46,299 46,299 46,299
Undiscounted net revenue projection Year 0 (2003/04)
Year 1 (2004/05)
Year 2 (2005/06)
Year 3 (2006/07)
Year 4 (2007/08)
Year 5 (2008/09)
Year 6 (2009/10)
Year 7 (2010/11)
Year 8 (2011/12)
Year 9 (2012/13)
Net revenue (revenue after tax minus costs) Total - Egyptian visitors plus foreign visitors: low projection (in EGP) 330,426 320,369 301,561 355,117 339,879 389,141 369,950 430,040 406,963 470,234 Total - Egyptian visitors plus foreign visitors: high projection (in EGP) 352,899 351,013 338,706 405,769 395,136 459,468 443,017 519,713 497,542 578,929

60
Table 10 Discounted cash-flow for Option 1 - do nothing (baseline option)
Discounted cash-flow: discount rate = 10% Year 0 (2003/04)
Year 1 (2004/05)
Year 2 (2005/06)
Year 3 (2006/07)
Year 4 (2007/08)
Year 5 (2008/09)
Year 6 (2009/10)
Year 7 (2010/11)
Year 8 (2011/12)
Year 9 (2012/13)
Discounted revenue (after tax) Total Total - Egyptians plus foreign visitors: low projection (in EGP) 2,697,046 361,545 319,534 281,215 295,887 258,581 270,374 234,962 244,437 211,450 219,060 Total - Egyptians plus foreign visitors: high projection (in EGP) 3,073,155 384,018 347,393 311,914 333,943 296,322 314,041 276,206 290,454 253,706 265,158 Discounted cost Total Total staff salary costs including overheads (in EGP) 266,797 31,119 28,290 31,991 29,083 26,439 28,748 26,135 23,759 21,599 19,635 Net discounted revenue (revenue after tax minus costs) Total Total - Egyptians plus foreign visitors: low projection (in EGP) 2,430,249 330,426 291,244 249,224 266,804 232,142 241,626 208,827 220,679 189,851 199,425 Total - Egyptians plus foreign visitors: high projection (in EGP) 2,806,358 352,899 319,103 279,923 304,860 269,883 285,293 250,072 266,695 232,107 245,522
Discounted cash-flow: discount rate = 15% Year 0 (2003/04)
Year 1 (2004/05)
Year 2 (2005/06)
Year 3 (2006/07)
Year 4 (2007/08)
Year 5 (2008/09)
Year 6 (2009/10)
Year 7 (2010/11)
Year 8 (2011/12)
Year 9 (2012/13)
Discounted revenue (after tax) Total Total - Egyptians plus foreign visitors: low projection (in EGP) 2,270,409 361,545 305,641 257,293 258,947 216,459 216,490 179,956 179,074 148,172 146,831 Total - Egyptians plus foreign visitors: high projection (in EGP) 2,573,288 384,018 332,289 285,380 292,251 248,052 251,456 211,545 212,785 177,783 177,729 Discounted cost Total Total staff salary costs including overheads (in EGP) 223,769 31,119 27,060 29,270 25,452 22,132 23,019 20,016 17,406 15,135 13,161 Net discounted revenue (revenue after tax minus costs) Total Total - Egyptians plus foreign visitors: low projection (in EGP) 2,046,640 330,426 278,581 228,024 233,495 194,327 193,472 159,940 161,668 133,037 133,670 Total - Egyptians plus foreign visitors: high projection (in EGP) 2,349,519 352,899 305,229 256,111 266,800 225,920 228,437 191,529 195,380 162,647 164,568

61
Discounted cash-flows for Option 2 - invest in upgrading visitor facilities at Nabq The cash-flows and discounted cash-flows for Option 2 - invest in upgrading visitor facilities at Nabq, are shown in Table 11 and Table 12 respectively. These tables follow the same format and are the same as the tables presented above for Option 1, except for the following:
• In Table 11, a doubling of nominal entrance charges in shown in Year 1 (as already discussed and described in Table 3 above). Following this, the same assumptions have been made with respect to the increase in nominal entrance charges every two years to account for some of the effects of inflation. These increases in entrance charges also result in higher projections of total real revenue in other rows lower down the table.
• Table 11 also includes projections of costs based on all of the proposed investments in
new facilities as described and shown in Table 4 to Table 8 above. These higher cost figures also result in different projections of net revenue given in the final section of Table 11 (and shown on the next page).
• Table 12 gives the projections of discounted revenue, discounted costs and discounted
net revenue, using these new figures, along with total discounted revenue, total discounted cost and total discounted net revenue or NPV in the column on the left-hand side of the figures for Year 0.

62
Table 11 Cash-flow for Option 2 - invest in upgrading visitor facilities at Nabq
Undiscounted revenue projections Year 0 (2003/04)
Year 1 (2004/05)
Year 2 (2005/06)
Year 3 (2006/07)
Year 4 (2007/08)
Year 5 (2008/09)
Year 6 (2009/10)
Year 7 (2010/11)
Year 8 (2011/12)
Year 9 (2012/13)
Number of visitors Egyptian visitors 2,290 2,660 3,030 3,400 3,770 4,140 4,510 4,880 5,250 5,620 Foreign visitors: low projection 15,000 16,000 17,000 18,000 19,000 20,000 21,000 22,000 23,000 24,000 Foreign visitors: high projection 15,960 17,440 18,920 20,400 21,880 23,360 24,840 26,320 27,800 29,280 Entrance charge (nominal value) Egyptian visitors (in EGP) 5.00 10.00 10.00 12.00 12.00 14.40 14.40 17.28 17.28 20.74 Foreign visitors (in USD) 5.00 10.00 10.00 12.00 12.00 14.40 14.40 17.28 17.28 20.74 Exchange rate (EGP per USD 1.00) 5.15 5.15 5.15 5.15 5.15 5.15 5.15 5.15 5.15 5.15 Foreign visitors (in EGP) 25.75 51.50 51.50 61.80 61.80 74.16 74.16 88.99 88.99 106.79 Entrance charge (real value, assuming 10% inflation) Egyptian visitors (in EGP) 5.00 9.09 8.26 9.02 8.20 8.94 8.13 8.87 8.06 8.79 Foreign visitors (in EGP) 25.75 46.82 42.56 46.43 42.21 46.05 41.86 45.67 41.52 45.29 Real revenue (before tax) from entrance charges Egyptian visitors (in EGP) 11,450 24,182 25,041 30,654 30,900 37,017 36,659 43,273 42,322 49,423 Foreign visitors: low projection (in EGP) 386,250 749,091 723,554 835,763 801,994 920,951 879,089 1,004,673 954,855 1,086,949 Foreign visitors: high projection (in EGP) 410,970 816,509 805,273 947,198 923,560 1,075,670 1,039,837 1,201,955 1,154,129 1,326,078 Total - Egyptian visitors plus foreign visitors: low projection (in EGP) 397,700 773,273 748,595 866,416 832,894 957,967 915,748 1,047,946 997,176 1,136,372 Total - Egyptian visitors plus foreign visitors: high projection (in EGP) 422,420 840,691 830,314 977,851 954,459 1,112,687 1,076,496 1,245,227 1,196,450 1,375,501 Sales tax (10% of pre-tax entrance charge) Total - Egyptian visitors plus foreign visitors: low projection (in EGP) 36,155 70,298 68,054 78,765 75,718 87,088 83,250 95,268 90,652 103,307 Total - Egyptian visitors plus foreign visitors: high projection (in EGP) 38,402 76,426 75,483 88,896 86,769 101,153 97,863 113,202 108,768 125,046 Real revenue (after tax) from entrance charges Total - Egyptian visitors plus foreign visitors: low projection (in EGP) 361,545 702,975 680,541 787,651 757,176 870,879 832,498 952,678 906,524 1,033,066 Total - Egyptian visitors plus foreign visitors: high projection (in EGP) 384,018 764,264 754,831 888,956 867,690 1,011,534 978,633 1,132,025 1,087,682 1,250,455
Undiscounted cost projection Year 0 (2003/04)
Year 1 (2004/05)
Year 2 (2005/06)
Year 3 (2006/07)
Year 4 (2007/08)
Year 5 (2008/09)
Year 6 (2009/10)
Year 7 (2010/11)
Year 8 (2011/12)
Year 9 (2012/13)
Total cost of building construction and maintenance (in EGP) 145,200 95,260 70,785 73,810 16,335 175,835 38,170 32,670 32,670 20,570 Total cost of construction and maintenance of other facilities (in EGP) 109,200 109,530 109,860 114,990 10,920 17,040 21,840 21,840 21,840 21,840 Total cost of other equipment (in EGP) 35,920 37,790 39,660 48,130 26,955 42,080 48,955 42,630 42,905 34,655 Total staff salary costs including overheads (in EGP) 31,119 31,119 38,709 38,709 38,709 46,299 46,299 46,299 46,299 46,299 Total cost of other equipment for staff (in EGP) 167,800 28,600 40,740 37,140 30,140 183,480 39,080 43,480 34,080 37,080 Total cost (in EGP) 489,239 302,299 299,754 312,779 123,059 464,734 194,344 186,919 177,794 160,444

63
Table 11 Cash-flow for Option 2 - invest in upgrading visitor facilities at Nabq (cont.)
Undiscounted net revenue projection Year 0 (2003/04)
Year 1 (2004/05)
Year 2 (2005/06)
Year 3 (2006/07)
Year 4 (2007/08)
Year 5 (2008/09)
Year 6 (2009/10)
Year 7 (2010/11)
Year 8 (2011/12)
Year 9 (2012/13)
Net revenue (revenue after tax minus costs) Total - Egyptian visitors plus foreign visitors: low projection (in EGP) -127,694 400,676 380,787 474,872 634,117 406,145 638,154 765,759 728,730 872,622 Total - Egyptian visitors plus foreign visitors: high projection (in EGP) -105,221 461,965 455,077 576,177 744,631 546,800 784,289 945,106 909,888 1,090,011
Table 12 Discounted cash-flow for Option 2 - invest in upgrading visitor facilities at Nabq
Discounted cash-flow: discount rate = 10% Year 0 (2003/04)
Year 1 (2004/05)
Year 2 (2005/06)
Year 3 (2006/07)
Year 4 (2007/08)
Year 5 (2008/09)
Year 6 (2009/10)
Year 7 (2010/11)
Year 8 (2011/12)
Year 9 (2012/13)
Discounted revenue (after tax) Total Total - Egyptians plus foreign visitors: low projection (in EGP) 5,032,546 361,545 639,068 562,431 591,774 517,162 540,748 469,924 488,875 422,900 438,121 Total - Egyptians plus foreign visitors: high projection (in EGP) 5,762,291 384,018 694,786 623,827 667,886 592,644 628,083 552,413 580,908 507,412 530,315 Discounted cost Total Total of all costs (in EGP) 1,976,004 489,239 274,817 247,731 234,995 84,051 288,563 109,702 95,919 82,942 68,044 Net discounted revenue (revenue after tax minus costs) Total Total - Egyptians plus foreign visitors: low projection (in EGP) 3,056,543 -127,694 364,251 314,700 356,778 433,111 252,184 360,222 392,956 339,958 370,077 Total - Egyptians plus foreign visitors: high projection (in EGP) 3,786,287 -105,221 419,969 376,097 432,890 508,593 339,520 442,711 484,989 424,470 462,271
Discounted cash-flow: discount rate = 15% Year 0 (2003/04)
Year 1 (2004/05)
Year 2 (2005/06)
Year 3 (2006/07)
Year 4 (2007/08)
Year 5 (2008/09)
Year 6 (2009/10)
Year 7 (2010/11)
Year 8 (2011/12)
Year 9 (2012/13)
Discounted revenue (after tax) Total Total - Egyptians plus foreign visitors: low projection (in EGP) 4,179,272 361,545 611,283 514,587 517,893 432,918 432,981 359,912 358,147 296,344 293,662 Total - Egyptians plus foreign visitors: high projection (in EGP) 4,762,558 384,018 664,578 570,761 584,503 496,105 502,911 423,090 425,570 355,565 355,457 Discounted cost Total Total of all costs (in EGP) 1,743,856 489,239 262,869 226,657 205,657 70,359 231,055 84,020 70,270 58,121 45,608 Net discounted revenue (revenue after tax minus costs) Total Total - Egyptians plus foreign visitors: low projection (in EGP) 2,435,417 -127,694 348,414 287,930 312,236 362,559 201,926 275,892 287,877 238,223 248,053 Total - Egyptians plus foreign visitors: high projection (in EGP) 3,018,702 -105,221 401,709 344,104 378,846 425,745 271,856 339,070 355,300 297,444 309,849

64
Summary of the cash-flow analysis A summary of the discounted cash-flow analysis for Options 1 and 2 is given in Table 13. This also shows the return on the investment in new facilities at Nabq as the difference between the two options (i.e. the amount by which Option 2 is preferred to Option 1). Table 13 Summary of the discounted cash-flow analysis for Options 1 and 2
Option 1 Option 2 Difference between Option 2 and Option 1
Measure of economic or financial performance
Discount rate = 10%
Discount rate = 15%
Discount rate = 10%
Discount rate = 15%
Discount rate = 10%
Discount rate = 15%
Total discounted revenue (low) 2,697,046 2,270,409 5,032,546 4,179,272 2,335,501 1,908,863 Total discounted revenue (high) 3,073,155 2,573,288 5,762,291 4,762,558 2,689,137 2,189,270 Total discounted cost 266,797 223,769 1,976,004 1,743,856 1,709,207 1,520,087 NPV (low) 2,430,249 2,046,640 3,056,543 2,435,417 626,293 388,777 NPV (high) 2,806,358 2,349,519 3,786,287 3,018,702 979,929 669,183 IRR (low) 29.9% IRR (high) 39.1% Payback period (low) 3.6 years Payback period (high) 3.2 years
Note: except for the IRR and payback periods, all of the above figures are given in EGP. As the table shows, the total discounted revenue from Option 2 is just under twice the total amount of discounted revenue from Option 1, due to the doubling of entrance charges from Year 1 onwards under Option 2. This difference in total discounted revenue amounts to between EGP 1.9 million and EGP 2.7 million over the 10 year investment period, depending on which discount rate and visitor number scenario is used. The difference between total discounted costs under the two options is much less than this. At a 10 percent discount rate, the investment in new facilities at Nabq increases total discounted costs by EGP 1.7 million. At a 15 percent discount rate, the increase in total discounted costs is only EGP 1.5 million. By adding the total discounted revenue and costs together, the NPV of the investment in new facilities at Nabq (i.e. the difference in the NPVs of the two options) is somewhere between EGP 0.4 million and EGP 1.0 million, depending on which discount rate and visitor number scenario is used. The IRR of the investment in new facilities is 29.9 percent under the assumption of low growth in visitor numbers or 39.1 percent if the assumption of high growth in visitor numbers is used. Table 13 also shows the payback period for the investment in new facilities at Nabq. This is the point in time in the future when the difference in the accumulated cash-flows between the two options turns positive. It represents the point in time at which the revenue from Option 2 will cover all of the costs of the investment in new facilities and increase beyond the revenues that would have been collected if the investment had not been made. This is approximately 3.6 years under the scenario of low growth in visitor numbers or 3.2 years under the high growth scenario.

65
Sensitivity analysis Because all investment appraisals include a number of assumptions about the future, it is always sensible to test the results of the analysis under a range of different assumptions. This is called a sensitivity analysis. A sensitivity analysis identifies the variables that have the most impact on the financial performance of the investment and examines how changes in these variables result in changes in those measures of financial performance (e.g. NPV and IRR). Clearly, in the case of this appraisal, the projections of revenue are the most important variables in the analysis, because revenue is projected to increase by much more than costs if the investment in new facilities at Nabq takes place. The projections of revenue in the analysis are based on the following two main assumptions:
• the assumption that visitor numbers will increase in the future at approximately the same rate as they have in the past; and
• the assumption that entrance charges at Nabq can be doubled if visitor facilities are
improved. Changes in both of these assumptions should be tested to examine what effect they might have on the results of the analysis. In addition, one other important variable that should be examined is the exchange rate. Most of the materials that will be purchased for the upgrading of facilities at Nabq will be obtained from local suppliers, so all of the cash-flows used in this investment appraisal have been specified in EGP. However, a substantial proportion of the revenue at Nabq will come from entrance charges paid by foreign tourists, which are denominated in USD. It has been assumed that the future EGP:USD exchange rate will remain at the same level as in 2002/03 (i.e. USD 1.00 = EGP 5.15), but the EGP has depreciated over the last few years. Therefore, an assumption of continued depreciation of the EGP should also be examined to see what effect this would have on the results of the analysis. Alternative assumptions about changes in visitor numbers and entrance charges The easiest way to examine the effect of alternative assumptions about visitor numbers and entrance charges is as follows:
• firstly, assuming that the visitor number projections are correct, it is possible to calculate the increase in entrance charges that would be required under Option 2 to meet the Target Rate of Return on the investment in new facilities (i.e. the minimum increase in charges that would result in no difference between the NPVs of Options 1 and 2 at a discount rate or TRR or 10 percent or 15 percent);
• alternatively, assuming that entrance charges can be doubled (i.e. raised by 100
percent) under Option 2, it is possible to calculate the minimum increase in the annual number of foreign visitors that would be required to meet the TRR of 10 percent or 15 percent.

66
These amounts have been calculated and are shown in Table 14 below. The first two rows of this table show the minimum increases in entrance charges that would be required to cover the costs of investment in new facilities and earn a rate of return of 10 percent or 15 percent on this investment. As the table shows, entrance charges must increase by at least 64 percent to justify the investment in new facilities. However, if the higher rate of return of 15 percent is required and the more pessimistic scenario for visitor numbers is used (i.e. an increase of only 1,000 foreign visitors per year), then entrance charges to Nabq must be raised by at least 80 percent to cover the costs of the investment in new facilities. Table 14 Sensitivity analysis of changes in the assumptions about visitor numbers and
increases in entrance charges at Nabq if visitor facilities are improved
Alternative assumption Target Rate of Return
(TRR) = 10%
Target Rate of Return
(TRR) = 15% Increase in entrance charges under Option 2 that would be required to meet the TRR if the annual number of foreign visitors to Nabq increases by 1,000 per year +73% A +80% B
Increase in entrance charges under Option 2 that would be required to meet the TRR if the annual number of foreign visitors to Nabq increases by 1,480 per year +64% C +69% D
Increase in the annual number of foreign visitors to Nabq that would be required under Option 2 to meet the TRR if entrance charges increase by 100 percent
+150 visitors per year E +335 visitors
per year F
The third row in Table 14 shows the increase in visitor numbers that must occur to meet the TRR, assuming that entrance charges can be doubled under Option 2. This shows that only relatively modest increases in visitor numbers are required to justify the investment in new facilities at Nabq, if entrance charges can definitely be doubled. Figure 8 Increases in foreign visitor numbers at Nabq required under a range of
different assumptions about increases in entrance charges
0
500
1,000
1,500
2,000
2,500
3,000
+50% +60% +70% +80% +90% +100%
Increase in entrance charges proposed under Option 2
Incr
ease
in th
e an
nual
num
ber
of fo
reig
n vi
sito
rs to
Nab
q re
quir
ed to
mee
t the
TR
R o
n in
vest
men
t in
new
faci
litie
s
Target Rate of Return of 15%
Target Rate of Return of 10%
A B
C D
E
F

67
Another way of presenting this type of analysis is to show the increases in visitor numbers that would be required to meet the TRR across a range of different increases in the entrance charges and this is shown in Figure 8. The results shown in Table 14 are also displayed in this figure labelled as the points A to F. This figure shows that the most important variable in this analysis is the assumption that it will be possible to increase visitor entrance charges by 100 percent under Option 2. If there is resistance to increasing visitor charges, then visitor numbers would have to increase dramatically to justify the investment in new facilities. For example, if entrance charges could only be raised by 50 percent, then foreign visitor numbers would have to increase by 2,500 per year to earn a TRR of 10 percent or by 3,000 per year to earn a TRR of 15 percent. The effect of continued depreciation of the Egyptian Pound on the analysis The trend in the EGP:USD exchange rate from 1997/98 to 2002/03 is shown in Figure 9. As this figure shows, the exchange rate was fairly stable at around EGP 3.40 to the USD over the first three years of this period, but the Egyptian Pound has since depreciated to EGP 5.15 to the USD. Furthermore, in the last two years, the EGP has fallen in value each year by about EGP 0.70 to the USD. Figure 9 Trend in the EGP:USD exchange rate from 1997/98 to 2002/03
0.00
1.00
2.00
3.00
4.00
5.00
6.00
1997/98 1998/99 1999/00 2000/01 2001/02 2002/03
Year
Exc
hang
e ra
te (E
GP
per
USD
1.0
0)
The preceding analysis has been based on an assumption that the EGP:USD exchange rate will remain at a level of EGP 5.15 to the USD. Although it is not possible to forecast future exchange rates very accurately, it is possible to show the effect that a continued depreciation in the Egyptian Pound would have on the internal rate of return (IRR) on the investment in new visitor facilities at Nabq and this is shown in Figure 10.

68
The results shown in Figure 10 have been calculated assuming that future depreciation in the exchange rate will only have an impact on the revenue collected from the entrance charges paid by foreign visitors to Nabq. They may be a slight overestimate of the impact of depreciation on the IRR because some items of expenditure (e.g. the purchase of vehicles and vehicle maintenance and running costs) may also increase if the Egyptian Pound continues to depreciate. However, the effect of depreciation on costs is only likely to be small, because the majority of materials and other inputs to the development are likely to be purchased from local suppliers. Figure 10 Effect of continued depreciation in the EGP:USD exchange rate on the
internal rate of return (IRR) on investment in visitor new facilities at Nabq
0%
10%
20%
30%
40%
50%
60%
70%
0.00 0.10 0.20 0.30 0.40 0.50 0.60 0.70
Depreciation in exchange rate (additional EGP per USD each year)
Inte
rnal
rat
e of
ret
urn
(IR
R) o
n in
vest
men
t
in n
ew v
isito
r fa
cilit
ies a
t Nab
q
High growth in foreign visitor numbers
Low growth in foreign visitor numbers
Figure 10 shows that the IRR of the investment in new facilities increases by three to four percentage points for every increase of EGP 0.10 to the USD each year. In other words, the investment in new facilities is very well protected from future currency depreciation (indeed, it will improve if the currency depreciates), because the entrance charges for foreign tourists are denominated in USD rather than local currency.

69
Social and environmental costs and benefits No attempt has been made to value the social and environmental costs and benefits of both options. However, Option 2 is likely to result in a number of social and environmental benefits compared to Option 1. Environmental benefits Compared to Option 1, Option 2 is likely to result in the following environmental benefits:
• investment in recreational infrastructure will allow the managers of Nabq Protected Area to guide visitors to areas where they will have minimal impact on the mangroves and keep them out of the most sensitive areas at the site;
• investment in facilities such as carparks, walking trails and boardwalks will also
reduce the impact of visitors on the mangroves;
• investment in information displays will make visitors more aware of the fragility of the mangrove ecosystem, which should encourage them to act more carefully; and
• investment in litter bins and toilet blocks and the concentration of visitors at
developed sites within the protected area will reduce the impact of the waste left by visitors on the site and make it easier to clean-up after visitors.
In order to minimise the environmental impact of the development, care should be taken to ensure that all facilities are developed in an environmentally sensitive way and that they are maintained to a high standard Social benefits The main social benefits of the development will be as follows:
• the provision of information panels at the site will increase visitors knowledge and understanding about the mangrove ecosystem, enhancing their education and generating more support for the protection of such areas; and
• the development of visitor facilities will lead to indirect employment in the provision
of services to the site (e.g. construction and maintenance of the facilities and employment in the cafeterias and craft workshop); and
• the development may also lead to other opportunities for local people to sell local
products and services to visitors on an informal basis.

70
Conclusions and recommendations The proposed development of visitor facilities at Nabq Protected Area includes a significant amount of investment in new facilities and upgrading of the equipment available for staff at the site. The level of investment in the first year of the development will exceed the revenue collected at the site and will require investment by the Government from other revenue sources. In later years, the levels of investment required could be funded out of revenue collected from entrance charges. Compared with the current and expected numbers of visitors to the site, the level of proposed investment seems a little on the high side. However, this appraisal has assumed a very modest increase in the number of visitors to the site, which could easily be exceeded. Furthermore, the financial analysis indicates that the investment in new facilities would be more than adequately covered by the expected increases in revenue each year given the expected increases in visitor numbers to the site and the increases in entrance charges that have been proposed. However, the one factor that will be most crucial to the success of this development will be the ability to raise entrance charges by 100 percent. If it is not possible to do this, then the financial success of this development will be at risk. The sensitivity analysis has shown that, under the most optimistic assumptions, entrance charges must be raised by at least 64 percent to cover the costs of the investment in new facilities. The managers of Nabq Protected Area must critically assess whether they think it will be possible to increase visitor charges by this much. Although the study by Er-Hawary indicated that visitors said they would be prepared to pay a lot more to visit the site, there are often differences between what people say they will pay and what actually happens when charges are increased. In particular, it will be important to ensure that the (increased) entrance charges to Nabq seem reasonable when compared to entrance charges for other similar facilities and attractions in the local area. If there is any doubt that it will be possible to increase entrance charges by so much, then it is recommended that a more gradual approach should be taken to the development of the site. For example, increases in the real level of entrance charges could be introduced in stages over the next ten years and the construction of new facilities could be undertaken more gradually (e.g. they could be funded out of the net revenue collected at the site each year). However, if it is genuinely felt that entrance charges could be doubled without much resistance, then the development could go ahead as proposed. Monitoring and evaluation All investment proposals are based on numerous assumptions that are made before the new development is actually implemented. Therefore, it is always wise to monitor the implementation of the development, so that adjustments can be made if future costs and revenues start to deviate from the assumptions made in the proposal. It is recommended that the managers of Nabq Protected Area should carefully monitor the costs of the investments in new facilities as the development is implemented and continue to monitor visitor numbers and the income from entrance charges to the site. As part of this

71
monitoring, it may also be useful to obtain feedback from visitors about what they think about the improvement of facilities at the site. This could be done using visitor books at the cafeterias and craft workshop and by distributing cards for comments when people pay to enter the site. It is also recommended that the managers at Nabq should evaluate the development in Year 4 before expenditure increases again as some of the facilities are renovated and refurbished. This evaluation should critically examine the condition of the facilities and the need to refurbish or replace some of them. It should also re-examine the trends in visitor numbers and revenue from entrance charges to see whether they are increasing as projected. If the revenue from visitor charges is not increasing by as much as expected, then the managers at Nabq should look at other ways in which they might increase revenue or cut costs.