tcrp report 111 – elements needed to create high...
TRANSCRIPT

Elements Needed to Create High Ridership
Transit Systems
TRANSIT COOPERATIVERESEARCHPROGRAMTCRP
REPORT 111
Sponsored by
the Federal
Transit Administration

TRANSPORTATION RESEARCH BOARD 2007 EXECUTIVE COMMITTEE*
OFFICERSCHAIR: Linda S. Watson, CEO, LYNX–Central Florida Regional Transportation Authority, Orlando VICE CHAIR: Debra L. Miller, Secretary, Kansas DOT, Topeka EXECUTIVE DIRECTOR: Robert E. Skinner, Jr., Transportation Research Board
MEMBERSJ. Barry Barker, Executive Director, Transit Authority of River City, Louisville, KYMichael W. Behrens, Executive Director, Texas DOT, AustinAllen D. Biehler, Secretary, Pennsylvania DOT, HarrisburgJohn D. Bowe, President, Americas Region, APL Limited, Oakland, CA Larry L. Brown, Sr., Executive Director, Mississippi DOT, JacksonDeborah H. Butler, Vice President, Customer Service, Norfolk Southern Corporation and Subsidiaries,
Atlanta, GA Anne P. Canby, President, Surface Transportation Policy Partnership, Washington, DCNicholas J. Garber, Henry L. Kinnier Professor, Department of Civil Engineering, University of Virginia,
Charlottesville Angela Gittens, Vice President, Airport Business Services, HNTB Corporation, Miami, FLSusan Hanson, Landry University Professor of Geography, Graduate School of Geography, Clark
University, Worcester, MAAdib K. Kanafani, Cahill Professor of Civil Engineering, University of California, BerkeleyHarold E. Linnenkohl, Commissioner, Georgia DOT, AtlantaMichael D. Meyer, Professor, School of Civil and Environmental Engineering, Georgia
Institute of Technology, AtlantaMichael R. Morris, Director of Transportation, North Central Texas Council of Governments, Arlington John R. Njord, Executive Director, Utah DOT, Salt Lake CityPete K. Rahn, Director, Missouri DOT, Jefferson CitySandra Rosenbloom, Professor of Planning, University of Arizona, TucsonTracy L. Rosser, Vice President, Corporate Traffic, Wal-Mart Stores, Inc., Bentonville, ARRosa Clausell Rountree, Executive Director, Georgia State Road and Tollway Authority, AtlantaHenry G. (Gerry) Schwartz, Jr., Senior Professor, Washington University, St. Louis, MOC. Michael Walton, Ernest H. Cockrell Centennial Chair in Engineering, University of Texas, AustinSteve Williams, Chairman and CEO, Maverick Transportation, Inc., Little Rock, AR
EX OFFICIO MEMBERSThad Allen (Adm., U.S. Coast Guard), Commandant, U.S. Coast Guard, Washington, DCThomas J. Barrett (Vice Adm., U.S. Coast Guard, ret.), Pipeline and Hazardous Materials
Safety Administrator, U.S.DOT Marion C. Blakey, Federal Aviation Administrator, U.S.DOTJoseph H. Boardman, Federal Railroad Administrator, U.S.DOTJohn A. Bobo, Jr., Acting Administrator, Research and Innovative Technology Administration, U.S.DOTRebecca M. Brewster, President and COO, American Transportation Research Institute, Smyrna, GAGeorge Bugliarello, Chancellor, Polytechnic University of New York, Brooklyn, and Foreign Secretary,
National Academy of Engineering, Washington, DC J. Richard Capka, Federal Highway Administrator, U.S.DOTSean T. Connaughton, Maritime Administrator, U.S.DOTEdward R. Hamberger, President and CEO, Association of American Railroads, Washington, DCJohn H. Hill, Federal Motor Carrier Safety Administrator, U.S.DOT John C. Horsley, Executive Director, American Association of State Highway and Transportation
Officials, Washington, DC J. Edward Johnson, Director, Applied Science Directorate, National Aeronautics and Space Administration,
John C. Stennis Space Center, MS William W. Millar, President, American Public Transportation Association, Washington, DC Nicole R. Nason, National Highway Traffic Safety Administrator, U.S.DOTJeffrey N. Shane, Under Secretary for Policy, U.S.DOTJames S. Simpson, Federal Transit Administrator, U.S.DOTCarl A. Strock (Lt. Gen., U.S. Army), Chief of Engineers and Commanding General, U.S. Army Corps of
Engineers, Washington, DC
TCRP OVERSIGHT AND PROJECTSELECTION COMMITTEE*
CHAIRDavid A. LeeConnecticut Transit
MEMBERSAnn AugustSantee Wateree Regional Transportation AuthorityLinda J. BohlingerHNTB Corp.Robert I. BrownsteinPB Consult, Inc.Peter CannitoMetropolitan Transportation Authority—Metro
North RailroadGregory CookAnn Arbor Transportation AuthorityNathaniel P. FordSan Francisco MUNIRonald L. FreelandBooz Allen Hamilton, Inc.Fred M. GilliamCapital Metropolitan Transportation AuthorityKim R. GreenGFI GENFAREJill A. HoughNorth Dakota State UniversityJohn InglishUtah Transit AuthorityJeanne W. KriegEastern Contra Costa Transit AuthorityCelia G. KupersmithGolden Gate Bridge, Highway and Transportation
DistrictClarence W. MarsellaDenver Regional Transportation DistrictFaye L. M. MooreSoutheastern Pennsylvania Transportation
AuthorityStephanie L. PinsonGilbert Tweed Associates, Inc.Robert H. Prince, Jr.DMJM+HarrisJeffrey M. RosenbergAmalgamated Transit UnionMichael ScanlonSan Mateo County Transit DistrictBeverly ScottSacramento Regional Transit DistrictJames S. SimpsonFTAFrank TobeyFirst TransitKathryn D. WatersDallas Area Rapid TransitFrank WilsonMetropolitan Transit Authority of Harris County
EX OFFICIO MEMBERSWilliam W. MillarAPTARobert E. Skinner, Jr.TRBJohn C. HorsleyAASHTOJ. Richard CapkaFHWA
TDC EXECUTIVE DIRECTORLouis SandersAPTA
SECRETARYChristopher W. JenksTRB
*Membership as of March 2007.*Membership as of March 2007.

TRANSPORTAT ION RESEARCH BOARDWASHINGTON, D.C.
2007www.TRB.org
T R A N S I T C O O P E R A T I V E R E S E A R C H P R O G R A M
TCRP REPORT 111
Research sponsored by the Federal Transit Administration in cooperation with the Transit Development Corporation
Subject Areas
Public Transit
Elements Needed to Create High Ridership
Transit Systems
TranSystemsMedford, MA
W I T H
Planners Collaborative, Inc.Boston, MA
Tom Crikelair AssociatesBar Harbor, ME

TCRP REPORT 111
Project H-32ISSN 1073-4872ISBN: 978-0-309-09885-4Library of Congress Control Number 2007927801
© 2007 Transportation Research Board
COPYRIGHT PERMISSION
Authors herein are responsible for the authenticity of their materials and for obtainingwritten permissions from publishers or persons who own the copyright to any previouslypublished or copyrighted material used herein.
Cooperative Research Programs (CRP) grants permission to reproduce material in thispublication for classroom and not-for-profit purposes. Permission is given with theunderstanding that none of the material will be used to imply TRB, AASHTO, FAA, FHWA,FMCSA, FTA, or Transit Development Corporation endorsement of a particular product,method, or practice. It is expected that those reproducing the material in this document foreducational and not-for-profit uses will give appropriate acknowledgment of the source ofany reprinted or reproduced material. For other uses of the material, request permissionfrom CRP.
NOTICE
The project that is the subject of this report was a part of the Transit Cooperative ResearchProgram conducted by the Transportation Research Board with the approval of theGoverning Board of the National Research Council. Such approval reflects the GoverningBoard’s judgment that the project concerned is appropriate with respect to both thepurposes and resources of the National Research Council.
The members of the technical advisory panel selected to monitor this project and to reviewthis report were chosen for recognized scholarly competence and with due considerationfor the balance of disciplines appropriate to the project. The opinions and conclusionsexpressed or implied are those of the research agency that performed the research, andwhile they have been accepted as appropriate by the technical panel, they are notnecessarily those of the Transportation Research Board, the National Research Council,the Transit Development Corporation, or the Federal Transit Administration of the U.S.Department of Transportation.
Each report is reviewed and accepted for publication by the technical panel according toprocedures established and monitored by the Transportation Research Board ExecutiveCommittee and the Governing Board of the National Research Council.
The Transportation Research Board of the National Academies, the National ResearchCouncil, the Transit Development Corporation, and the Federal Transit Administration(sponsor of the Transit Cooperative Research Program) do not endorse products ormanufacturers. Trade or manufacturers’ names appear herein solely because they areconsidered essential to the clarity and completeness of the project reporting.
TRANSIT COOPERATIVE RESEARCH PROGRAM
The nation’s growth and the need to meet mobility, environmental,and energy objectives place demands on public transit systems. Currentsystems, some of which are old and in need of upgrading, must expandservice area, increase service frequency, and improve efficiency to servethese demands. Research is necessary to solve operating problems, toadapt appropriate new technologies from other industries, and to intro-duce innovations into the transit industry. The Transit CooperativeResearch Program (TCRP) serves as one of the principal means bywhich the transit industry can develop innovative near-term solutionsto meet demands placed on it.
The need for TCRP was originally identified in TRB Special Report213—Research for Public Transit: New Directions, published in 1987and based on a study sponsored by the Urban Mass TransportationAdministration—now the Federal Transit Administration (FTA). Areport by the American Public Transportation Association (APTA),Transportation 2000, also recognized the need for local, problem-solving research. TCRP, modeled after the longstanding and success-ful National Cooperative Highway Research Program, undertakesresearch and other technical activities in response to the needs of tran-sit service providers. The scope of TCRP includes a variety of transitresearch fields including planning, service configuration, equipment,facilities, operations, human resources, maintenance, policy, andadministrative practices.
TCRP was established under FTA sponsorship in July 1992. Pro-posed by the U.S. Department of Transportation, TCRP was autho-rized as part of the Intermodal Surface Transportation Efficiency Actof 1991 (ISTEA). On May 13, 1992, a memorandum agreement out-lining TCRP operating procedures was executed by the three cooper-ating organizations: FTA, the National Academies, acting through theTransportation Research Board (TRB); and the Transit DevelopmentCorporation, Inc. (TDC), a nonprofit educational and research orga-nization established by APTA. TDC is responsible for forming theindependent governing board, designated as the TCRP Oversight andProject Selection (TOPS) Committee.
Research problem statements for TCRP are solicited periodically butmay be submitted to TRB by anyone at any time. It is the responsibilityof the TOPS Committee to formulate the research program by identi-fying the highest priority projects. As part of the evaluation, the TOPSCommittee defines funding levels and expected products.
Once selected, each project is assigned to an expert panel, appointedby the Transportation Research Board. The panels prepare project state-ments (requests for proposals), select contractors, and provide techni-cal guidance and counsel throughout the life of the project. The processfor developing research problem statements and selecting researchagencies has been used by TRB in managing cooperative research pro-grams since 1962. As in other TRB activities, TCRP project panels servevoluntarily without compensation.
Because research cannot have the desired impact if products fail toreach the intended audience, special emphasis is placed on dissemi-nating TCRP results to the intended end users of the research: tran-sit agencies, service providers, and suppliers. TRB provides a seriesof research reports, syntheses of transit practice, and other support-ing material developed by TCRP research. APTA will arrange forworkshops, training aids, field visits, and other activities to ensurethat results are implemented by urban and rural transit industrypractitioners.
The TCRP provides a forum where transit agencies can cooperativelyaddress common operational problems. The TCRP results support andcomplement other ongoing transit research and training programs.
Published reports of the
TRANSIT COOPERATIVE RESEARCH PROGRAM
are available from:
Transportation Research BoardBusiness Office500 Fifth Street, NWWashington, DC 20001
and can be ordered through the Internet at
http://www.national-academies.org/trb/bookstore
Printed in the United States of America
CRP STAFF FOR TCRP REPORT 111
Christopher W. Jenks, Director, Cooperative Research ProgramsCrawford F. Jencks, Deputy Director, Cooperative Research ProgramsGwen Chisholm Smith, Senior Program OfficerEileen P. Delaney, Director of PublicationsHillary Freer, Senior Editor
TCRP PROJECT H-32 PANELField of Policy and Planning
David A. Lee, Connecticut Transit, Hartford, CT (Chair)Alan Castaline, Massachusetts Bay Transportation Authority, Boston, MA Richard L. Dreyer, Tindale-Oliver & Associates, Inc., Tampa, FL Eric T. Hill, Metro Plan Orlando, Orlando, FL Douglas Holcomb, Greater Bridgeport Transit Authority, Bridgeport, CT Ronald Kilcoyne, Greater Bridgeport Transit Authority, Bridgeport, CT David M. Luskin, University of Texas - Austin, Austin, TX Jan Maynard, Utah Transit Authority, Salt Lake City, UT John F. McGee, Jr., Southeastern Pennsylvania Transportation Authority, Philadelphia, PA Rosie Sanford, Loxley, AL Richard F. Stevens, Fairfax County (VA) DOT, Fairfax, VA Elizabeth Day, FTA Liaison William B. Menczer, FTA Liaison Richard Weaver, APTA Liaison Karen Wolf-Branigin, Other Liaison Peter Shaw, TRB Liaison
AUTHOR ACKNOWLEDGMENTS
The research described in this report was performed under TCRP Project H-32 by TranSystems Corp.,with assistance from Planners Collaborative, Inc., and Tom Crikelair Associates.
Daniel Fleishman of TranSystems was the Principal Investigator for the project and the primary authorof this Guidebook. Also contributing to the research and preparation of the Guidebook were James Wens-ley, Rick Halvorsen, Larry Englisher, Stephen Falbel, Carol Schweiger, Bruce Kaplan and Kathleen Fay ofTranSystems; Scott Hamwey, Dan Rabinowitz, Nicole Buxton and Don Kidston of Planners Collaborative;and Tom Crikelair.
The guidance of Gwen Chisholm Smith, the TCRP Program Officer for the project, and the ProjectPanel is also acknowledged.
C O O P E R A T I V E R E S E A R C H P R O G R A M S

TCRP Report 111: Elements Needed to Create High Ridership Transit Systems describes thestrategies used by transit agencies to create high ridership and includes case studies of success-ful examples of increased or high ridership. The case studies focus on the internal and exter-nal elements that contributed to successful ridership increases and describe how the transitagencies influenced or overcame internal and external challenges to increase ridership.
This report includes a companion interactive CD-ROM that contains a database of indi-vidual transit agency ridership strategies linked to the strategies and examples presented inthe report. The CD-ROM also contains a brochure that outlines the key elements identifiedin this report for increasing and sustaining ridership. These materials have been designedto assist transit managers and staff, as well as policymakers and other regional stakeholders,by identifying strategies that can be used to increase ridership.
Increasing ridership is a national goal of the Federal Transit Administration and a high pri-ority for all transit systems. Increasing ridership is important to sustain public investment intransit, particularly in a resource-constrained environment. Ridership is generally used bypublic authorities as the basis for measuring the effectiveness of public transportation invest-ments. In addition, strong transit ridership supports a wide variety of public policy goals,including energy conservation; air-quality improvement; congestion relief; mobility for trans-portation-disadvantaged groups; and promotion of livable communities, economic develop-ment, and sustained growth initiatives. Increasing transit ridership also improves the effi-ciency of the overall transportation system by using available capacity. Transit agenciesthroughout the United States and abroad have had success at generating higher-than-usualrates of ridership growth, through innovative use of service improvements, marketing tech-niques, fare policy and technology initiatives, and partnerships with other entities. This reportidentifies transit ridership “success” stories that can be emulated and describes the types ofactions that can be taken to sustain or increase transit ridership.
Daniel Fleishman of TranSystems was the principal author of this report. Also contribut-ing to the research and preparation of the reporreport and CD-ROM were James Wensley,Rick Halvorsen, Larry Englisher, Stephen Falbel, Carol Schweiger, Bruce Kaplan, and Kath-leen Fay of TranSystems; Scott Hamwey, Dan Rabinowitz, Nicole Buxton, and Don Kidstonof Planners Collaborative; and Tom Crikelair of Tom Crikelair Associates. Under TCRPProject H-32, “Determining the Elements Needed to Create High Ridership Transit Sys-tems,” the research team conducted a comprehensive review of literature, practice, and find-ings related to producing and sustaining high transit ridership. Based on the informationgathered, this report provides information on the effective use and effects of a broad rangeof strategies on ridership and provides guidance on selecting appropriate strategies to sus-tain or increase ridership.
F O R E W O R D
By Gwen Chisholm SmithStaff OfficerTransportation Research Board

1 Chapter 1 Introduction and Overview1 Introduction2 Industry Research/Dissemination Efforts2 Industry Research3 Information Dissemination Efforts4 Case Studies4 The Guidebook
6 Chapter 2 Factors Affecting Ridership 6 Introduction 6 Factors Affecting Ridership7 Previous TCRP Studies
11 Mineta Institute Study13 Other Studies14 Findings from the Case Studies 17 Categorization of Factors Affecting Ridership
22 Chapter 3 Identification of Service Needs and Opportunities 22 Introduction 22 Evaluation of Existing Services22 Service Evaluation27 Needs Assessment of Marketing/Information and Fare Systems28 Identification of Needs & Potential Markets28 Conducting Demographic and Travel Pattern Analysis29 Conducting Market Research32 Identifying Market Segments
37 Chapter 4 Selection of Strategies 37 Introduction 37 Service Environments and Strategies37 Identifying Types of Service Environments39 Identifying Strategies for Different Service Environments41 Identifying Relative Cost-Effectiveness of Potential Strategies41 Evaluating Ridership Impacts 43 Elements of Successful Strategies43 Characteristics of Successful U.S. Examples50 Successful Examples from Abroad51 Conclusions
52 Chapter 5 Operating/Service Adjustments52 Introduction 52 Design/Implementation Guidelines52 Applicable Settings52 Planning/Research Activities
C O N T E N T S

53 Design and Performance Measures56 Cost Estimation Considerations57 Expected Ridership Response58 Routing/Coverage Adjustments58 Increased Route Coverage61 Route Restructuring62 Improved Schedule/Route Coordination65 Scheduling/Frequency Adjustments66 Increased Service Frequency and Increased Span of Service67 Improved Reliability/On-time Performance68 New Types of Service68 Improved Travel Speed70 Targeted Services72 Improved Amenities73 Passenger Facility Improvements 75 New/Improved Vehicles76 Increased Security and Safety
78 Chapter 6 Partnerships/Coordination Initiatives78 Introduction 78 Guidelines and Examples78 Partnerships79 University/School Pass Programs81 Travel Demand Management Strategies84 Subsidized Activity Center Service85 Coordination Initiatives86 Consistent Regional Operating Policies87 Coordination with Social Services Agencies88 Coordination with Other Transportation Agencies90 Promotion of Transit-Supportive Design and TOD
92 Chapter 7 Marketing & Information Initiatives 92 Introduction 92 Design/Implementation Guidelines92 Applicable Settings94 Planning Activities94 Expected Ridership Response95 Marketing/Promotional Initiatives95 Targeted Marketing/Promotions97 General Marketing/Promotions
101 Information Improvements101 Improved Printed Informational Materials103 Improved Customer Information and Assistance103 Automated Transit Traveler Information
109 Chapter 8 Fare Collection/Structure Initiatives 109 Introduction 109 Design/Implementation Guidelines 109 Applicable Settings110 Planning Activities110 Fare Collection System Design Process112 Fare Structure Development Process

113 Cost/Revenue Considerations114 Expected Ridership Response114 Fare Collection Improvements114 Improved Payment Convenience120 Regional Payment Integration121 Fare Structure Changes121 Fare Structure Simplification123 Fare Reduction

Introduction
Increasingly, public transit ridership supports a broad range of public policy goals, includingair quality improvement, energy conservation, congestion reduction, provision of mobility to thetransportation-disadvantaged, access to jobs, and promotion of economic development andsustained growth initiatives. As transit is often undervalued by policymakers as an importantcomponent of the local transportation system, attracting and sustaining high demand thereforerepresents transit’s best weapon in the fight for scarce public funding. However, evaluating thedirect impact on most of those goals is difficult at best. Instead, measures related to usage (e.g.,systemwide ridership levels or ridership per capita) or productivity (e.g., riders per revenuevehicle hour) represent the best indicators of transit “success” and are typically considered theprimary measures of the effectiveness of a transit investment.
For this reason, it is important that transit operators—as well as funding partners—are awareof the various types of strategies that have been effectively used by their peer agencies to increaseridership on their systems. Transit agencies all around the country have had success at generat-ing relatively high per capita ridership rates and at promoting higher-than-usual rates of growth,through service improvements, innovative marketing techniques, and policy changes. A numberof agencies have also developed partnerships with other entities (e.g., universities, developers,tourist attractions, and employers) to expand usage, and many agencies have developed arrange-ments to provide service to special events.
If every agency were able to generate a ridership level approaching that of the best-performingsystems (operating in similar environments), overall transit usage in the United States would seea dramatic increase. The purpose of Transit Cooperative Research Program (TCRP) Project H-32 (Determining the Elements Needed to Create High Ridership Transit Systems) was thus todevelop guidance materials that effectively (1) identify the full range of types of actions, initia-tives or special projects that offer the potential to create high ridership and (2) provide examplesof their effective usage and impacts. The research sought to address the following key questions,among others:
• What are the major factors, both within and outside transit agencies’ control, that influencetransit demand?
• What types of strategies—and combinations of strategies—have proven successful indifferent types of operating environments (e.g., rural areas, suburban towns, large cities, andcollege towns)?
• What are the types of tradeoffs an agency may have to make in pursuing high ridership versus promoting other goals (e.g., cost control, increased revenue, and improved equityconsiderations)?
Introduction and Overview
1
C H A P T E R 1

This Guidebook and the accompanying interactive CD have been designed to facilitate anunderstanding of the full range of actions and initiatives available, and provide guidance onselecting appropriate strategies. The remainder of this chapter (1) identifies key transit industryresearch and information dissemination efforts, (2) summarizes the case studies conducted aspart of the project, and (3) presents the outline of the remainder of the Guidebook.
Industry Research/Dissemination Efforts
Industry Research
There has been considerable research over the years on the various types of strategies that havebeen used to spur ridership growth. For instance, a number of TCRP projects have focused onsuch topics as ridership-building initiatives in general, marketing and market segmentationstrategies, fare policy/technology developments, traveler information technologies, and transitamenities. These and other studies have reported on many transit agencies’ success at producingsignificant ridership increases, while also exploring the influence of various internal and externalfactors on ridership.
The research team has conducted a comprehensive review of relevant literature, practice andresearch findings related to producing—and sustaining—high transit ridership. Key categories ofreference materials and other sources of information are identified below; specific referencedocuments are listed in the appendices, with key sources included in the Annotated Bibliography(Appendix B) and other sources presented in Appendix C. The findings from these materials arediscussed in Chapter 2.
TCRP Studies
A number of TCRP studies closely related to this topic have been undertaken; the most directlyrelated studies are as follows (these documents are summarized in Appendix B, AnnotatedBibliography):
• TCRP Research Results Digest 4: Transit Ridership Initiative (1995) identifies key factors andinitiatives that led to ridership increases at 27 transit agencies between 1991 and 1993.
• TCRP Research Results Digest 29: Continuing Examination of Successful Transit RidershipInitiatives (1998) follows up on the above study and identifies key factors and initiatives thatled to ridership increases at 42 transit agencies between 1994 and 1996.
• TCRP Research Results Digest 69: Evaluation of Recent Ridership Increases (2005) follows up onthe above study and identifies key factors and initiatives that led to ridership increases at 28transit agencies between 2000 and 2002.
• TCRP Report 27: Building Transit Ridership: An Exploration of Transit’s Market Share and thePublic Policies that Influence It (1997) explores a variety of public policies and transitmanagement actions that can potentially influence transit ridership.
• TCRP Report 28: Transit Markets of the Future: the Challenge of Change (1998) identifies poten-tial effects of anticipated demographic, geographic, economic, technological, and societaltrends on transit ridership and services; the report also identifies future transit markets result-ing from those trends and the most appropriate types of services to address these markets.
• TCRP Report 36: A Handbook: Using Market Segmentation to Increase Transit Ridership (1998)presents an overview of market segmentation for transit professionals, including a discussionof the different types of data used for defining market segments.
• TCRP Report 46: The Role of Transit Amenities and Vehicle Characteristics in Building TransitRidership (1999) identifies and describes how passenger amenities and vehicle characteristicsattract transit ridership.
2 Elements Needed to Create High Ridership Transit Systems

• TCRP Report 55: Guidelines for Enhancing Suburban Mobility Using Public Transportation(1999) identifies, assesses, and documents current practices used by transit agencies to betterserve suburban travel needs; the report also categorizes the different types of suburbanenvironments and discusses the application of types of service to each.
• TCRP Report 70: Guidebook for Change and Innovation at Rural and Small Urban TransitSystems (2001) focuses specifically on rural and small urban systems and (1) identifieselements that can produce a “culture of innovation” in this type of environment and(2) describes examples of initiatives and innovation at small transit agencies.
• TCRP Report 95: Traveler Response to Transportation System Changes (2004) represents a com-pilation and discussion of previous analyses of the impacts of various types of transportationsystem actions on demand. Individual chapters of the overall study have been published asstand-alone reports. Four of these reports (Chapter 9—Transit Scheduling and Frequency,Chapter 10—Bus Routing and Coverage, Chapter 11—Transit Information and Promotion, andChapter 12—Transit Pricing and Fares) are particularly relevant to this study. Each of thesechapters presents and discusses the results of analyses and agency experience regarding thenature of traveler response to a particular type of strategy.
Because of the range of factors affecting ridership and types of actions that can be pursued, anumber of other TCRP reports also provide information that is applicable to this research; theseare listed in Appendix B.
Other Research Efforts and Sources of Information
The research team has also reviewed related research efforts undertaken by other entities,including individual transit agencies. Several key reports are summarized in Appendix B.
The research team has also compiled information on national ridership trends, as well asrecent and current initiatives implemented (and planned) by individual transit agencies andlocalities. Key sources of this information include the following:
• Federal Transit Administration Innovative Practices for Increased Ridership database/website—FTA has developed this interactive website/database that highlights examplesfrom around the country; FTA has solicited input from local agencies, through its regionaloffices, in an effort to document success stories from various sizes and types of transitservices. The projects reported on in the database represent a key source of examplesdiscussed in Chapter 4 and Appendix A of this Guidebook. (link: http://ftawebprod.fta.dot.gov/bpir/).
• APTA Transit Ridership Reports—quarterly ridership figures for U.S. transit agencies (link:http://apta.com/research/stats/ridership/).
• FTA’s National Transit Database Reports—annual demographic and service operations andusage data profiles of individual transit agencies, as well as national-level summary data (link:http://www.ntdprogram.com/NTD/ntdhome.nsf/Docs/NTDData?OpenDocument).
• Presentations at (and proceedings from) conferences (e.g., the APTA Bus/Paratransit, Rail andFare Collection Workshops; the TRB Annual Meeting; the Canadian Urban Transport Associ-ation Conference; and state transportation conferences).
• Articles in transit-related journals (e.g., Passenger Transport, Metro, and Mass Transit).• Individual agency websites and discussions with various transit agency, MPO, municipality,
and state transportation department staff and officials.
Information Dissemination Efforts
Recognizing that achieving and maintaining high ridership should be a national goal and ahigh priority for all transit systems, the FTA and APTA have introduced several other initiatives
Introduction and Overview 3

intended to disseminate information about effective ridership strategies. These initiatives repre-sent another source of information for this study. These efforts include
• Regional workshops—FTA has sponsored regional workshops presenting examples of varioustypes of ridership initiatives.
• Transit Ridership Best Practices Webinar—FTA and APTA held a “webinar” on this topic,featuring presentations on several key projects.
• Individualized Marketing Demonstrations—FTA selected four agencies (WTA in Bellingham,WA; GCRTA in Cleveland; Sacramento RTD; and TTA in Research Triangle Park, NC) todemonstrate the promotion of transit usage through targeted marketing methods.
• BRT Research Project—FTA has conducted research to determine which features are mostcost-effective in increasing ridership.
• “United We Ride”Initiative—FTA developed this five-part initiative to assist communities andstates in the establishment of coordinated human services transportation services.
Chapter 2 discusses the key findings of the industry review.
Case Studies
The research team conducted case studies of a dozen U.S. transit agencies that have deployedvarious strategies to promote ridership growth; the case study agencies were as follows:
• Advance Transit (Wilder, VT);• BAT Community Connector (Bangor, ME);• Baldwin Rural Area Transportation System (Robertsdale, AL);• Capital Area Transportation Authority (Lansing, MI);• Greater Cleveland Regional Transit Authority (Cleveland, OH);• Orange County Transportation Authority (Orange, CA);• Ride On (Montgomery Co., MD);• Transfort (Fort Collins, CO);• Tri-County Metropolitan Transportation District (Portland, OR);• Utah Transit Authority (Salt Lake City, UT);• Ventura Intercity Service Transit Authority (Ventura, CA); and• Whatcom Transportation Authority (Bellingham, WA).
The goal in selecting case study sites was to choose agencies that represent (1) a range of systemsizes (i.e., covering each of the major operating environment categories), (2) different modalcombinations (i.e., bus only as well as multi-modal), and (3) a range of types of strategies. Thecase studies also reflect a variety of specific market orientations (e.g., college towns and subur-ban areas). The individual case study reports are presented in Appendix D. The overall findingsare discussed in Chapter 2.
The Guidebook
The contents of the Guidebook are as follows:
• Chapter 2, Factors Affecting Ridership, synthesizes the key findings of ongoing and previousresearch and information dissemination efforts—as well as the findings of the case studiesconducted for this study—and includes (1) a review of industry-wide ridership trends; (2) adiscussion of the internal and external factors/elements affecting ridership; and (3) a catego-rization of the different types of strategies, actions, and initiatives that have been effectivelyutilized by transit agencies.
4 Elements Needed to Create High Ridership Transit Systems

• Chapter 3, Identification of Service Needs and Opportunities, provides guidance related toevaluating existing service needs and identifying market opportunities. This includes identi-fying gaps/deficiencies in existing services, as well as understanding the characteristics andservice needs of different market segments.
• Chapter 4, Selection of Strategies, addresses the process of identifying appropriate strategies/actions/initiatives to attract and/or retain riders. The chapter includes a discussion ofsuccessful agency examples, by service environment size (i.e., large city, medium city, and smalltown/rural area) and category (i.e., metropolitan, suburban, downtown/CBD, or regional).
• Chapter 5, Operating/Service Adjustments, describes the strategies that fall under thiscategory.
• Chapter 6, Partnerships/Coordination Initiatives, describes the strategies that fall under thiscategory.
• Chapter 7, Marketing & Information Initiatives, describes the strategies that fall under thiscategory.
• Chapter 8, Fare Collection/Structure Initiatives, describes the strategies that fall under thiscategory.
The following appendixes are included on the CD-ROM that accompanies this report:
• Appendix A, Successful Examples—This appendix identifies and describes examples oftransit agency strategies, actions and initiatives that have proven successful at generatinghigh ridership levels and/or significant ridership increases.
• Appendix B, Annotated Bibliography—This appendix identifies and summarizes the mostrelevant research reports related to the production and retention of high transit ridership.
• Appendix C, Other References—This appendix identifies additional sources not included inAppendix B.
• Appendix D, Case Studies—The individual case study reports are presented here.• Appendix E, Using the Interactive CD—Accompanying this report is an interactive CD that
contains a database of individual transit agency ridership strategies linked to the strategies andexamples presented in the written report. The CD’s contents and usage instructions aredescribed here.
Introduction and Overview 5

Introduction
As indicated in Table 2-1, ridership on all U.S. transit systems has risen substantially over thepast decade. Based on APTA’s ridership reports, total national ridership increased by over 22%between 1996 and 2005. As shown, ridership peaked in 2001, dropping somewhat over the next2 years and then rising again in 2004 and reaching the high point for the decade in 2005. Thegrowth during the late 1990s generally coincided with the economic boom during that period—and the subsequent ridership decline in the next 2 years similarly paralleled the economic down-turn beginning that year.
While most agencies experienced at least modest ridership growth during the late 1990s, manyagencies were able to sustain demand even between 2001 and 2003. As is discussed below, factorsassociated with the economy are certainly among the many influences on transit usage; onespecific factor contributing to the resurgence of demand in 2004—continuing in 2005—was thesharp rise in gasoline prices. However, the research conducted in this study and elsewhere hasshown that transit agency strategies have also played major roles in increasing ridership. Thischapter reviews the external factors that affect ridership and the types of internal strategiesagencies can use to build and retain ridership.
Factors Affecting Ridership
The research in this area has considered both internal and external factors that havecontributed to demand for transit services. Agencies have utilized a broad range of internalstrategies (i.e., actions planned and implemented by the agencies) related to service design,marketing, pricing and other types of efforts to help spur ridership growth. However, externalfactors outside of the agencies’ direct control (e.g., local economic conditions, cost/availabilityof alternative transportation modes, and land use/development patterns and policies) have alsoexerted a strong influence, both positive and negative, on demand levels. The relationshipbetween external factors and ridership can be quite straightforward; for instance, population andemployment growth in a region can raise transit demand simply by expanding the potentialridership base. Alternatively, certain factors (e.g., fuel prices, parking availability and prices, andregional development patterns) affect transit ridership by influencing the relative attractivenessof transit versus automobile use. While an agency may not be able to explicitly control theseexternal factors, it can monitor them, anticipate their potential impact on transit demand, andtake actions to mitigate—or take advantage of—them.
Given the importance of these different types of factors, it is useful to understand the natureof the relative impacts of internal versus external factors. As transit demand is influenced by acombination of factors, it is a challenge to isolate the impact of any particular action or factor.
6
C H A P T E R 2
Factors Affecting Ridership

However, a number of the studies identified in Chapter 1, as well as the case studies conductedfor this project, have examined the relative influences of external and internal factors on transitusage. The key findings from these studies are reviewed below.
Previous TCRP Studies
As indicated in Chapter 1, a number of previous TCRP studies have investigated the factorsaffecting transit ridership growth. Several of these have considered in particular the relativeimpact on demand of internal versus external factors—as well as the impact of individual typesof agency initiatives. TCRP Research Results Digest 4: Transit Ridership Initiative, for example,reports that, based on interviews with senior staff at 27 transit agencies, “forces traditionallyoutside the control of transit planners, managers and even policy makers may have greaterimpacts on ridership than any combination of traditional fare, marketing, service design, oroperational initiatives” (p. 5). On the other hand, the study also notes that “the introduction ofnontraditional services and planning initiatives in many areas seems to suggest, however, thatprogress can be made in terms of both absolute ridership and market share, even in the shortterm. This is particularly true in communities that are pursuing strategies that better match anincreasing variety of services with diverse markets” (p. 5).
A follow-up study, described in TCRP Research Results Digest 29: Continuing Examination ofSuccessful Transit Ridership Initiatives, considered the ridership trends over the next few years(1994–1996) of 22 of the agencies examined in the above study—along with trends at 20additional agencies. Based on interviews with officials at these 42 agencies, the report notes that“external forces continue to have a potentially greater effect on ridership than system and servicedesign initiatives” (p. 1). This report further suggests that the most important external factors(at least for the period covered by the study, 1994 through 1996) were
• “The resurgence of local and regional economies, which has spurred ridership growth;• Reductions in federal transit operating assistance, which have suppressed ridership growth;
and • Integration of public transportation with other public policy initiatives and program areas
(e.g., welfare-to-work, education, and social service delivery), which has spurred ridership andeased some funding constraints.” (p. 1)
However, this study also found that various types of agency actions and initiatives “have playeda significant role in recent ridership success stories” (p. 1). The categories of agency actions/initiatives identified were as follows:
• Service adjustments. Types of service adjustments most frequently mentioned in the surveywere– Reallocation of service to the most productive routes– Increased frequency of service
Factors Affecting Ridership 7
1996 1997 1998 1999 2000 2001 2002 2003 2004 2005Ridership
(000s)7948 8374 8750 9168 9363 9653 9623 9427 9586 9708
Change fromprevious year
— 5.4% 4.5% 4.8% 2.1% 3.1% -0.3% -2.0% 1.7% 1.3%
Cumulativechange (from ’96)
— 5.4% 11.0% 15.4% 17.8% 21.5% 21.1% 18.6% 20.6% 22.1%
SOURCE: APTA Transit Ridership Reports, 1997 - 2005
Table 2-1. Annual US transit ridership totals, 1996–2005.

– Enhanced passenger amenities– Introduction of transit center-based route structures
• Fare and pricing adaptations. Frequently mentioned actions included – The introduction or expansion of deep discount passes– The expansion of outlet sales– Cooperative programs with businesses or other organizations or institutions
• Planning orientation. Frequently mentioned examples included – Community-based planning activities– Strategic plans– Comprehensive operational analyses
• Marketing and informational initiatives. These initiatives included “approaches rangingfrom broad public information campaigns to programs tailored to specific markets or specificservices” (p. 12).
• Service coordination, consolidation and market segmentation. These initiatives “areintended to highlight instances in which integration is occurring across a broad spectrum oftransportation service providers and others, or where the needs of specific submarkets or usergroups are being targeted.” (p. 13).
While the report observes that “most systems experiencing major ridership increases attributethe increases to various combinations of strategies” (p. 1), it also notes that “route and servicerestructuring”was a prominent factor contributing to ridership increases during the study period(1994–96) and that “many of the systems experiencing significant ridership increases between1994 and 1996 instituted or expanded deep discount fare policies along with efforts to makepasses more widely available throughout their communities” (p. 2).1
A second follow-up study, described in TCRP Research Results Digest 69: Evaluation of RecentRidership Increases, reviewed the 31 U.S. transit agencies experiencing the greatest ridershipincreases between 2000 and 2002. This included 15 of the 42 agencies examined in the previousstudy. Based on interviews with senior managers at 28 of these agencies, the study authorsfound that many of the factors observed in the previous study continued to play key roles ininfluencing ridership. As was found in the earlier studies, service adjustments represented thetype of initiatives most widely cited as having influenced ridership, with service expansionmentioned by three-quarters of the agencies; more than half of the agencies reported servicecoordination and partnering (especially with universities), and half cited fare and pricingadaptations (including introduction of new fare media and technologies). Nearly half of theagencies suggested that shifts in planning orientation (including strategic planning andcustomer-oriented planning) were key factors. The one area that was not seen as important inincreasing ridership by at least half of the agencies was marketing and information initiatives:one-sixth of the agencies “indicated that stand-alone marketing campaigns or initiatives weresignificant factors in ridership increases.”2
TCRP Report 27: Building Transit Ridership: An Exploration of Transit’s Market Share andthe Public Policies That Influence It, reported on interviews with managers at 50 transitagencies—and subsequent case studies of 8 selected agencies. Like TCRP Research ResultsDigest 29, this study identified a range of specific internal transit strategies with the “poten-tial for increasing transit ridership or market share” (p. 7). These strategies are shown inTable 2-2.
8 Elements Needed to Create High Ridership Transit Systems
1The ridership changes over the past several years for the examples reviewed in TCRP Research Results Digest 29 are consideredin Appendix A provided on the accompanying CD-ROM.2TCRP Research Results Digest 69, p. 2.

Category Type Strategies Service improvements General Increased route structure Increased frequency Service cutbacks Dynamic scheduling Increased speed Improved security Improved comfort Increased capacity Suburb to suburb High-occupancy vehicle lanes/facilities Transportation demand management programs Suburban activity centers Suburb to central city Feeder services Fare integration Service coordination (timed transfers) Unitickets Station parking provisions Within central city Core services Information to customers Real-time information services Location Schedules Low technology Tailored schedules Bus stop information Medium technology Computerized information systems Kiosks Marketing and promotion Fare incentives Education New resident promotion Image advertising Cooperative promotions Public policy changes User-side subsidies Parking pricing/regulation Income taxes Fuel/carbon taxes Dedicated operating support Land use policy Local area bus services Road pricing Various
SOURCE: TCRP Report 27: Building Transit Ridership: An Exploration of Transit’s Market Share and thePublic Policies That Influence It (1997), p. 8
Table 2-2. List of potential transit strategies for building ridership (from TCRPReport 27).
In analyzing basic mode choice decisions, TCRP Report 27 concluded that “transit ridership,in particular, has been found to vary with five general types of factors:
• The levels of travel-inducing activities. Since travel is predominantly a derived demand, asthe levels of those activities that require passenger transportation change, so can the demandfor transit service be expected to change.
• The price and other characteristics of the service. The price and various aspects of the levelof service provided by the transit system have been shown by substantial previous research toaffect the level of ridership.
• Other transportation options. The price and service characteristics of substitute andcomplementary modes of travel may also be expected to influence transit passengervolumes.
• The characteristics of the population served. The market for transit services comprisesindividuals with heterogeneous tastes, and the level of demand can be expected to varybetween different demographic and socioeconomic subgroups of the population.
• Other factors. Other determinants of transit patronage levels that are not easily classified intothe above four categories include, for example, the weather and changes in public tastes overtime.” (p. 25)
Factors Affecting Ridership 9

However, in considering these mode choice factors, the authors conclude that “transit-sidestrategies alone are insufficient to achieve a large modal shift” (p. 11). This is attributed primarilyto observations that:
• “The private vehicle’s quality of service is valued very highly.• The range of transit service improvements is quite limited.• The automobile ownership decision dominates the mode choice hierarchy.” (p. 11)
TCRP Report 27 also explains that “land use and related factors are very important” (p. 11).Three factors in particular are suggested as “affecting the interrelationship between land use andtransit ridership: urban expressway capacity, urban core density, and downtown parkingavailability” (p. 11). Moreover, “ridership levels and market shares are very strongly associatedwith development densities, and are, therefore, highest in the core areas of the nation’s mostdensely developed cities” (p. 22). Finally, this report considers how various types of publicpolicies (enacted at the federal, state and local levels) affect mode choice—and thus influencetransit demand. Table 2-3 summarizes the mode choice impacts of the different types of publicpolicy initiatives.
TCRP Report 95: Traveler Response to Transportation System Changes represents a compilationand discussion of previous analyses of the nature of the impacts of various types of transportationsystem actions on demand; the study does not specifically address external factors. Individualchapters of the overall study have been published as stand-alone reports. Four of these reports(Chapter 9—Transit Scheduling and Frequency, Chapter 10—Bus Routing and Coverage, Chapter11—Transit Information and Promotion, and Chapter 12—Transit Pricing and Fares) are particu-larly relevant to our study. Each of these chapters presents and discusses the results of analyses andagency experience regarding the nature of traveler response to a particular type of strategy. (Thekey findings from these chapters are discussed in Chapters 5 through 8.)
10 Elements Needed to Create High Ridership Transit Systems
Transportation Inv estment Policy Infrastructure spending directl y affects the relative attractiveness of each mode Tr ansit operating assistance can help maintain, improve or expand servicesResearch and development funding provides innovations in the provision of transportation services
Transportation Pricing Polic y Ta xes and tolls make automobile use more expensive Local policies dictate taxi fares, and indirectl y, service levels Local parking pricing and availabilit y are very important components of the cost of driving
En vi ronmental Policy Federal/state emissions standards increase new car prices Local air qualit y mandates require programs to reduce single-occupant vehicle use Local policies influence development patterns and transportation pricing
Energ y Policy Minimum average fuel econom y standards increase new car prices and decrease operating costs Alternative fuel vehicle and research and development provisions of Energy Polic y Act are unlikely to affect choices made by consumers/households
Tax Policy Income taxes affect economic activity and dispos able income, thereb y influencing the affordabilit y of various travel choices Preferential parking cost deductions promote automobile commuting over transit Sales taxes affect automobile costs and ma y support public transit Mortgage interest deductions influence housing location choice Property taxes ma y support local roadw ay infrastructure
Land Use Polic y Provisions of zoning law s (lot size, us e) affect the viabilit y of public transit Design review s and other restrictions can require definitive plans for addressing transportation issues in new development s
SOURCE: TCRP Report 27: Building Transit Ridership: An Exploration of Transit’s Market Share and the Public Policies That Influence It (1997), p. 33
Table 2-3. Summary of mode choice impacts of public policies.

Mineta Institute Study
The Mineta Transportation Institute study cited earlier (Increasing Transit Ridership: Lessonsfrom the Most Successful Transit Systems in the 1990’s) provides the most comprehensive review ofthe relative impacts of external and internal factors on transit ridership. Utilizing a range ofmethodological approaches (a literature review, an analysis of nationwide transit data/trends, anda survey of transit agency officials and in-depth case studies), the researchers consistently foundthat “the most significant factors influencing transit use are external to transit systems” (p. 105).Through an analysis of the National Transit Database (NTD) data for all U.S. transit agencies, theresearchers found, in particular, “extraordinarily strong correlations between ridership andthree external factors related to economic activity: unemployment rate, real hourly wage and realGDP” (p. 105). These correlations are summarized in Table 2-4. However, the researchers alsofound “a relatively high degree of correlation between transit ridership and the internal factorstested” (p. 105). The internal factors tested were related to average fare and service provided(revenue-vehicle miles and revenue-vehicle miles per person); these correlations are also shownin Table 2-4. The authors note, though, that the correlations to the amount of service “do notnecessarily imply causality.” They point out that “increased service should increase ridership, butincreased demand should also motivate transit managers to increase service” (p. 34).
The Mineta Institute researchers conducted a survey of the 227 U.S. systems that gainedridership between 1995 and 1999; 103 usable responses were obtained. Consistent with thefindings from the other methodologies, the survey responses indicated that ridershipincreases could be attributed to a combination of internal and external factors. The followingbasic categories of external factors were identified through this survey (p. 57):
• Population growth. Specific factors include increased immigration and rising transitdependency (due to aging populations, for instance).
• Strong economy and employment growth. Specific factors include increased tourism andgreater demand for travel in general.
• Changing metropolitan form. Specific factors include increased suburbanization andresidential/employment relocation.
• Changes to transportation system. Specific factors include increased congestion, reducedparking availability and increased costs, increased gas prices, and construction projects andtime delays.
The internal factor categories identified were as follows (p. 57):
• Fare changes and innovations. Specific factors include fare decrease or freeze, universal farecoverage programs, and introduction of new payment options.
Factors Affecting Ridership 11
Unlinked Trips Unlinked Trips/Person Internal Factors Real average fare (2001$) -0.61 -0.81 Revenue vehicle miles 0.81 n/a Revenue vehicle miles per person n/a 0.37 External Factors Unemployment rate -0.70 -0.16 Real hourly wage (2001$) 0.96 0.70 Real GDP (2001$) 0.79 0.24 Real GDP per person (2001$) 0.82 0.29
SOURCE: Mineta Transportation Institute, Increasing Transit Ridership: Lessons from the Most SuccessfulTransit Systems in the 1990’s (2002), p. 4 (source of data in table: calculation using National TransitDatabase data)
Table 2-4. Correlation coefficients of internal and external factors andtransit ridership: 1995–1999.

• Marketing and information programs. This category includes advertising, niche marketing/market segmentation, survey research and customer satisfaction feedback mechanisms.
• Service improvements. This category includes expansion of routes (geographical/temporal),introduction of new/specialized service, and route restructuring.
• Amenities/service quality. This category includes development of transit centers, develop-ment of park-and-ride facilities, increasing frequency/reliability of service, cleanliness ofservice, new vehicles, and bus stop improvements (e.g., signage, shelters, and benches).
• Partnerships. This category includes community outreach/education, planning and strate-gies, and intra-agency cooperation.
The results of the survey, in terms of frequency with which each of the internal factors wascited, are shown in Table 2-5. As indicated, the internal factors mentioned most often by thesurvey respondents as contributing to ridership increases were service expansion and routerestructuring; these were followed by advertising/information programs. In general, internalfactors were mentioned more often than external factors—as could be expected from transitmanagers. However, external factors were acknowledged as having an impact; the mostcommonly mentioned external factors were economic/employment growth, population growthand worsening traffic congestion.
The final element of the study was a set of case studies of a dozen of the “most successful” U.S.transit agencies (in terms of ridership growth during the study period). The major factors citedby these agencies as being primarily responsible for their ridership growth are summarized inTable 2-6. As indicated, there was considerable variability in the major causes identified, although“several agencies were forthright in attributing the bulk of their ridership increases to externalfactors such as rapid population increases and economic growth” (p. 103).
12 Elements Needed to Create High Ridership Transit Systems
Size of Transit System
Type of Program Very Small (n=29)
Small (n=13)
Medium (n=22)
Large (n=17)
Very Large (n=22)
Total (n=103)
% of Systems
Mentioning Program
Rank
Service Improvements Service expansion 23 13 17 14 16 83 81% 1 Route restructuring 19 12 11 12 6 62 60% 2 Introduction of new/specialized services 14 10 10 6 11 51 50% 4 Fare Innovations/Changes New payment options 7 5 2 8 7 29 28% 6 Universal fare coverage program (UFC) 2 6 6 5 9 28 27% 7 Fare freezes/decreases 12 1 1 2 4 20 19 9 Marketing Advertising/information program 20 9 12 7 11 59 57% 3 Market segmentation/niche marketing 2 0 0 6 2 10 10% 10 Partnerships Employer-based partnerships (including UFC) 3 7 6 9 8 33 32% 5 University-based partnerships (including UFC) 3 4 7 5 6 25 24% 8 Community outreach/local government 2 0 3 2 0 7 7% 11 Social service collaboration 1 1 0 1 2 5 5% 14 Service Quality and Amenities Reliability/shortened headways 1 0 2 3 1 7 7% 11 Park and ride lots 1 2 1 0 2 6 6% 13 Rail development 0 1 0 0 4 5 5% 14 Bus stop improvements 1 0 1 1 0 3 3% 16 Safety, cleanliness 0 0 0 3 0 3 3% 16 New buses 1 0 0 0 1 2 2% 18
Note: Since there are multiple responses per transit system, “% of Systems Mentioning Program” does not sum to 100%
SOURCE: Mineta Transportation Institute, Increasing Transit Ridership: Lessons from the Most Successful Transit Systems in the 1990’s (2002), p. 58 (source of data in table: survey of 103 transit agencies that reported ridership increases between 1995 and 1999)
Table 2-5. Frequency of internal programs contributing to ridership growth (from MinetaInstitute survey of U.S. transit agencies).

Other Studies
A number of other studies have considered the relative impacts of internal and externalfactors on transit ridership. For example, Gomez-Ibanez (“Big-City Transit Ridership, Deficitsand Politics Avoiding Reality in Boston,” 1996) analyzed ridership changes at the MBTA(Boston) in the late 20th Century, and found the agency’s ridership to be considerably morestrongly influenced by downtown employment levels and real per capita income levels than bychanges in service levels or fares. He estimated that, for each 1% drop in employment, MBTAridership would be lowered by 1.24 to 1.75%, and that each 1% rise in per capita income wouldresult in a 0.70% drop in ridership. In contrast, Gomez-Ibanez determined that a 1% increasein the amount of service provided would result in a gain of 0.30 to 0.36% in ridership, and a 1%reduction in fares would generate 0.22 to 0.23% in additional ridership.
A study by Kain and Liu (Secrets of Success: How Houston and San Diego Transit ProvidersAchieved Large Increases in Transit Ridership, 1995) analyzed data (for the years 1968–1992), toascertain why ridership in both cities generally increased during the early 1990s—a time whenmany transit systems were suffering significant ridership losses. The researchers attribute muchof the increases in both cities to a combination of two internal transit factors (average fares andrevenue vehicle miles of service) and three external factors (i.e., regional employment levels,fuel prices, and automobile ownership levels). In an earlier study of transit in Portland (OR),Liu (Determinants of Public Transit Ridership: Analysis of Post World War II Trends and Evalua-tion of Alternative Networks, 1993), considering the same types of variables (using data from
Factors Affecting Ridership 13
Agency(location)
Majorpopulation/ employment
increases
Major fare structure change
Flash pass system
instituted
Coordination with major employers
Extensive public
participa- tion
Extensive use of market
research
Majorcapital invest- ment
Landuse
policies
Newfixed rail
routes
Majorroute
reconfig-uration
ATC(Las Vegas, NV)
++
AMA(San Juan, PR)
++
Caltrain(SF Bay area)
++ + ++
Gainesville (FL) RTS
+ +++ +
Green Bus Line (Brooklyn, NY)
++
Long Beach (CA) Transit
++ +
MARTA(Atlanta, GA)
++ +
Milwaukee Co. (WI) Transit
++ ++ ++
MTA-NYCT(NY City)
++ ++ + ++
OMNITRANS(Riverside, CA)
+
Pace(Chicago, IL)
++ ++
Tri-Met (Portland, OR)
+ ++ ++
% cited as major factor
33% 42% 17% 17% 0% 0% 8% 8% 8% 17%
% cited as secondary factor
0% 0% 0% 17% 8% 33% 8% 0% 0% 0%
% cited as factor 33% 50% 17% 33% 8% 33% 17% 8% 8% 17%
++ denotes cited as major factor + denotes cited as secondary factor
SOURCE: Mineta Transportation Institute, Increasing Transit Ridership: Lessons from the Most Successful Transit Systems in the 1990’s (2002), p. 99(source of data in table: interviews with managers at case study agencies listed)
Table 2-6. Causes of ridership increases reported by case study agencies (from Mineta Institute casestudies of U.S. transit agencies).

1976–1990), found that several external factors (per capita income, automobile ownership, andsuburbanization of residences and employment locations) had a greater impact on demand fortransit than did internal factors (i.e., annual transit miles and average fares).
Finally, regarding the relative impact of internal strategies, a major regional bus study in theWashington, DC area (TranSystems Corp. et al., WMATA Regional Bus Study – Final Report,September 2003) included an analysis of the various types of service improvements and theirrelative potential contributions to an overall goal of doubling ridership over the next 20 years.The results of this analysis are shown in Table 2-7. As indicated, “expand fixed route coverage”was expected to have the largest relative impact among the service improvements, followedclosely by “improve frequency”; note, however, that “normal expected ridership growth” (due tonon service-related factors) was expected to have the largest impact.
In considering the factors affecting transit demand and productivity, the WMATA study alsoconcluded that “For bus routes, and indeed for transit in general, perhaps the most importantsingle factor affecting ridership is the density of development in the corridor served by the route.Density is so important because a fixed-route service has, by definition, a limited service area. Itis limited because people (1) don’t like to walk and (2) don’t like to transfer.” (WMATA RegionalBus Study – Comprehensive Operational Analysis Summary Report, February 2001, p. 67)
This study further evaluated the relationship between ridership/productivity on specific routesand several selected land use and demographic factors along these routes. Regression analysis wasconducted involving five independent variables (related to residential density, employmentdensity, household vehicle ownership, number of senior residents, and proximity to regionalactivity centers) and three ridership measures (i.e., ridership, peak productivity, and off-peakproductivity). None of the variables alone were found to explain much of the variation in rider-ship or productivity. However, the analysis confirmed that ridership and productivity tend to behigher in areas that have a greater-than-average percentage of households with no vehicles; it alsoindicated that ridership tends to be higher for routes that serve regional activity centers. (p. 77)
Findings from the Case Studies
As discussed in Chapter 1, a key element of this project was a series of case studies of U.S.transit agencies that have deployed various strategies to promote ridership growth.3
Table 2-8 shows the types of ridership strategies deployed by these agencies. As indicated inthe table, the case study agencies used various combinations of strategies in their efforts toincrease ridership, and most agencies used strategies in all major categories. All twelve agenciesdeployed partnership/coordination initiatives, eleven used operating/service adjustments,
14 Elements Needed to Create High Ridership Transit Systems
Strategy/Factor Estimated % Increase Normal expected ridership growth 36% Expand fixed-route coverage 23% Improve frequency 19% RapidBus, priority and strategic corridors 8% Enhance image of bus systems 8% Extend span of service 4% Introduce flexible-route service 2% Total 100%
SOURCE: TranSystems Corp., WMATA Regional Bus Study Final Report (Sept. 2003), p. 42
Table 2-7. Relative contributions of service improvements todoubling of ridership in Washington region (over a 20-year period).
3The case study reports are included in Appendix D which is provided on the accompanying CD-ROM.

ten marketing/promotional and information initiatives and nine fare collection/structureinitiatives. The most common type of strategy was operating/service adjustments (40 separateactions, strategies or initiatives implemented by all of the case study agencies), followed bypartnership/coordination initiatives (27), marketing/promotional and information initiatives(23), and fare collection/structure initiatives (14).
The most widely used subcategories were partnerships (18 separate initiatives among allthe case study agencies) and routing/coverage adjustments (17). Other commonly usedsubcategories included scheduling/frequency adjustments (12), marketing/promotionalinitiatives (12) and information improvements (11). The least used were improved amenities(4) and fare structure changes (5). With regard to specific types of action, the most commonwas university/school pass (9 separate initiatives), followed by route restructuring (7), traveldemand management strategies (7), general marketing/promotions (7), and improved pay-ment convenience (7).
Factors Affecting Ridership 15
Category/Subcategory/Type of Initiative AT
BA
T
BR
ATS
CA
TA
GC
RTA
OC
TA
Rid
e O
n
Tran
sfor
t
Tri-M
et
UTA
VIST
A
WTA
No.
of
Stra
tegi
es
Operating/Service Adjustments 40Routing/coverage adjustments 17 Increased route coverage X X X X X 5 Route restructuring X X X X X X X 7 Improved schedule/route coordination X X X X X 5 Scheduling/frequency adjustments 12 Increased service frequency X X X X X 5 Increased span of service X X X X 4 Improved reliability/on-time performance X X X 3 New types of service 7 Improved travel speed/reduced stops X X X X 4 Targeted services X X X 3 Improved amenities 4 Passenger facility improvements X X X 3 New/improved vehicles X 1 Increased security and safety 0 Partnerships/Coordination 27Partnerships 18 University/school pass programs X X X X X X X X X 9 Travel demand management strategies X X X X X X X 7 Privately subsidized activity center service X X 2 Coordination 9 Consistent regional (inter-agency) operating policies X X 2 Coordination with social service agencies X X 2 Coordination with other transportation agencies X X X 3 Promotion of transit-supportive design/TOD X X 2 Marketing and Information Initiatives 23Marketing/promotional initiatives 12 Targeted marketing/promotions X X X X X 5 General marketing/promotions X X X X X X X 7 Information improvements 11 Improved informational materials X X X X X 5 Improved customer information/assistance X X X 3 Automated transit traveler information X X X 3 Fare Collection/Structure Initiatives 14Fare collection improvements 9 Improved payment convenience X X X X X X X 7 Regional payment integration X X 2 Fare structure changes 5 Fare structure simplification X 1 Fare reduction X X X X 4
Table 2-8. Types of strategies used by case study agencies.

The case studies examined, to the extent possible, the effect of specific strategies on ridershipat each agency. In some cases, however, strategies are too recent to allow for any assessment of theridership impact. In other cases, particularly where agencies have simultaneously implementedseveral strategies, it was not possible to isolate the impact of individual efforts. At several of theagencies, multiple strategies actually comprised elements of a single comprehensive ridershipenhancement program. For example, OCTA’s “Putting Customers First” campaign includedservice adjustments, marketing efforts and fare collection/structure improvements. Similarly,TriMet’s “Frequent Service” program included a range of marketing and informational efforts aswell as service adjustments.
Based on the cases where sufficiently detailed data were available, it was determined that themost significant direct impacts on ridership have come from different types of operating/serviceadjustments (particularly increased route coverage, route restructuring, and increased servicefrequency) and as a result of partnerships with various local entities (particularly universities).Although marketing/promotions and information improvements seldom had a major direct effecton ridership, they invariably represented important complements to the introduction of anyservice improvements—and were often instrumental in the establishment of key partnerships. Forexample, establishing and maintaining a positive image of the transit agency in the communitywas seen by several agencies as a crucial element both in attracting/retaining riders and buildingkey partnerships. Fare collection and fare structure initiatives similarly were not typically seen ashaving major ridership impacts on their own, but also represented important “pieces of the over-all puzzle.”4 (In actuality, the distinction between categories is often blurred; for example, a keyresult of many partnerships is some type of new fare payment mechanism.)
In addition to reviewing the specific strategies—and ridership trends—at each agency, each ofthe case studies assessed the effect on ridership of various external factors (e.g., gasoline pricetrends, regional employment/unemployment levels, and population growth in the service areas).The key findings regarding external factors are as follows:
• Gasoline prices fluctuated somewhat between 1995 and 2004, experiencing a net increase, butaveraging a less than 5% increase per year through 2003. Although gas prices were presumablyone of many factors affecting people’s decision to use transit, there is no clear relationship inany of the case study locations between gas price and transit demand through 2004. However,the precipitous rise in gas prices (53%) between October 2004 and October 2005 has been amore important factor contributing to the ridership growth during that period. The retailprice of regular gasoline reached a high average price of over $3 per gallon in September 2005;this represents an increase of over 185% since 1995, and the price has more than doubled justsince 2002. Although the price subsequently fell significantly (the average was approximately$2.15, as of December 2005), the earlier sharp rise doubtless led many people who previouslymight never have considered using transit to reconsider their modal decisions—and to usetransit for at least a portion of their trips. Thus, the fuel price increase through much of 2005was clearly a factor affecting transit ridership.
• In most of the case study regions, the unemployment rate peaked in 2002 or 2003 and hasdeclined somewhat since then. However, in a few places (i.e., Lansing, Cleveland, and Bangor),unemployment has continued to rise over the past couple of years. Ridership has grown inthese locations—despite the increase in unemployment—as well as in locations that saw adrop in unemployment. Thus, while unemployment is certainly a factor affecting demand,
16 Elements Needed to Create High Ridership Transit Systems
4Although not observed in any of the Case Studies, Chapter 8 points out that fare-related strategies can have significant effectson ridership; in particular, reduction of fare levels (e.g., introduction of free transfers) has in several instances resulted inconsiderable jumps in demand. For example, the introduction of free bus-rail transfers and a variety of prepaid options inNew York City in the late 1990s led to a 15% ridership gain.

there was no discernible direct relationship between the unemployment trend and ridershipin any of the case study systems.
• Regarding population changes, the case study areas varied considerably: one area (Cleveland)experienced a small loss (3%) between 2000 and 2004, two others (Bangor and Lansing) stayedroughly even, and the others all saw significant growth (from 3% in Advance Transit’s area toVentura County’s 13%). Population growth doubtless contributed to ridership increases inmost of these locations, although the percentage ridership growth generally far outstrippedthe percentage population increase. In comparing the rate of population change to thedemand trend, there is no direct relationship between the two factors; for example, the agencythat saw the greatest percentage rise in demand (Advance Transit) had one of the lowerpopulation increases, and the second largest ridership rise (CATA) occurred in a region thathad very little growth during the review period.
• However, population and economic growth associated with particular trip generatorsdid appear to have an effect on ridership in a couple of the case study locations. These includedgrowth/expansion of college campuses and medical centers. For instance, significant expansionof the Dartmouth campus and two medical centers—and the resulting increase in trafficcongestion and limited availability of parking—directly contributed to increased transitdemand at Advance Transit. Meanwhile, increasing enrollment at University of Maine wouldseem to be a key factor affecting ridership on one of BAT’s key routes.
• Specific events affected demand at two of the case study locations: (1) The presence of theWinter Olympics in 2002 caused an overall increase in economic activity in and around SaltLake City, and a marketing campaign encouraged local residents to use transit rather thandriving. This contributed to an increase in UTA’s ridership in 2002 despite the economicrecession occurring in 2001–02. (2) A period of particularly heavy rainfall in VenturaCounty washed out roads for a week in 2004 and made many routes inoperable; while therewas still ridership growth in 2004–05, it occurred at a rate somewhat lower than that of theprevious years.
Thus, although certain specific developments or events apparently directly affected transit use atseveral of the case study locations, and broader trends (e.g., related to gasoline prices, employment/unemployment levels, and population changes) certainly contributed to ridership increases at alllocations, the overall finding from the case studies is that these external factors had less of an effectthan the agencies’ own initiatives on ridership growth during the review period.
The next section discusses the categorization of specific internal and external factors affectingtransit ridership.
Categorization of Factors Affecting Ridership
Mode Choice Parameters
Thus, as indicated by the above research findings, transit demand results from a combina-tion of a broad range of factors, some within an agency’s direct control and others not. Incategorizing the specific types of factors/strategies of both types, it is also useful to review theparameters that contribute to mode choice decisions, particularly those that influence thedecision to use transit. The basic considerations involved in mode choice decisions arethe characteristics of the mode and the characteristics of the individual traveler and can besummarized as follows:
• Price and availability of each mode. This includes factors such as – The availability and cost of automobile use (i.e., day-to-day costs such as fuel, parking cost/
availability, and tolls, as well as long-term costs such as purchase/lease, maintenance/repairs,insurance, taxes, and registration; also, nature of employer subsidy if any) and
Factors Affecting Ridership 17

– The availability and cost of transit (i.e., fare, employer or other subsidy, if any, and parkingcost, if applicable).
• Quality of service of each mode. This includes factors such as – Travel time (i.e., the door-to-door time required to make a trip);– Convenience (i.e., the effort needed to access and use the transit service, including the need
to transfer and the walking distance to/from a stop/station at both ends of the trip; also, easeof accessing schedule and other types of information, amenities such as bicycle racks,guaranteed-ride-home provision for transit or ridesharing);
– Comfort (e.g., crowding/amount of space, seating arrangements, privacy, shelter at busstops, and personal entertainment possibilities);
– Service reliability (i.e., the predictability of the travel time and schedule from day to day);– Perceived personal security/safety; and– Perceived overall “image”of each mode (e.g., courtesy/helpfulness of transit personnel, and
cleanliness of transit vehicles and stations).• Trip characteristics for each particular trip. This includes factors such as
– Trip length and purpose,– Number of people to be making the trip, and– Whether there are multiple destinations involved.
• Personal (sociodemographic) characteristics of the traveler. This includes factors such as– Income;– Origin and destination locations; and– Status (e.g., employed, student, or retired).
Clearly, the majority of the specific parameters in these categories lie outside of the transitagency’s direct control and thus represent external factors. Nevertheless, it is important to realizethat the transit agency can control key parameters in the first two categories. In other words, thecrux of the challenge in generating high ridership for transit services is to make transit ascompetitive as possible in the areas of pricing and service quality—while developing a clearunderstanding of how best to address the considerations in the latter two categories.
Categorization of External Factors
As indicated above, industry researchers have identified a range of factors outside of transitagencies’ direct control that have a strong influence on transit demand. Essentially, these factorscan be divided into two general classifications, those that affect demand for and supply of tran-sit service. The former can be further divided into those factors, discussed above, that influencethe mode choice decision (this applies to those travelers who have the option of using their ownautomobiles—or another non-transit mode) versus those factors that more directly affect theneed or market for transit service (e.g., population characteristics or changes in a region that havean impact on the number of transit-dependent travelers). The supply side refers to the ability toprovide adequate transit service in a region; this is related to such factors as funding availabilityand land use/development patterns (e.g., can sufficient transit be provided to adequately servedispersed employment and residential locations?).
Based on the industry review, the key external factors affecting transit ridership can becategorized as shown in Table 2-9. The type of impact (demand versus supply) is shown for eachindividual factor.As indicated, a number of factors apply to more than one of these classifications.As suggested above, while a transit agency may not be able to directly control such factors, it isimportant to understand their effect on demand and consider them in developing internalstrategies. In fact, the appropriateness—and effectiveness—of specific types of agency actions willin many cases depend on the prevailing conditions and policies. An agency should thus monitorthe prevailing trends within these factors and pursue strategies that take advantage of—or, ifnecessary, mitigate—them.
18 Elements Needed to Create High Ridership Transit Systems

Categorization of Internal Factors and Strategies/Initiatives Factors Affecting Transit Demand
As indicated above, a transit agency can control key mode choice decision parameters in twobasic areas: pricing/availability and service quality. Thus, the agency’s goal in seeking togenerate high ridership is essentially to influence mode choice by (1) maximizing the relativeattractiveness of transit in those two areas, and (2) recognizing and addressing the full rangeof requirements imposed by travelers’ personal and trip characteristics.
The basic factors comprising the pricing/availability mode choice considerations are asfollows:
• Fare levels;• Nature of subsidy programs (e.g., with employers, social service agencies, and educational
institutions); and• Amount (including service hours/days) and types of service available.
The basic factors constituting the service quality mode choice considerations include thefollowing:
• Route design;• Service schedules and frequency of service;• Service reliability (perceived and actual);• Accessibility features (for persons with disabilities);• Parking availability (e.g., park-and-ride lots for rail and express services);• Availability, ease of obtaining, and usefulness of information and customer assistance;
Factors Affecting Ridership 19
Type of Impact Demand
Type of Factor
Mode choice decision
Need/marketfor transit
Supply (i.e., ability to provideadequate transit)
Population characteristics/changesGeneral growth in the region High/increased immigration High/increased number of seniors High/increased tourism High number of college students
XXXXX
X
Economic conditionsEmployment/unemployment levels Per capita income levels Household auto ownership levels
XXX
XXX
Cost and availability of alternative modes Fuel and toll pricing Parking pricing and availability Taxi fares Fuel taxes Auto purchase and ownership costs Availability of commuter benefits programs by employers
XXXXXX
Land use/development patterns and policiesDensity of development Relative locations of major employers and residential
areas (e.g., increasing suburbanization) Land use/zoning controls and incentives
XXX
XX
XTravel conditions
Climate/weather patterns Traffic congestion levels/highway capacity Traffic disruptions (e.g., from major construction projects)
XXX X X
Public policy/funding initiativesAir quality mandates Auto emission standards Federal/state transit funding levels (capital and operating) Local transit funding (e.g., sales or other tax receipts)
XX
X
XX
Table 2-9. Summary of external factors influencing transit ridership.

20 Elements Needed to Create High Ridership Transit Systems
Category/Subcategory Type of Strategy Examples of Specific Actions/Initiatives
Operating/Service Adjustments Routing/coverage adjustments Increased route coverage Service expansion; introduction of local circulators
Route restructuring Reallocation to most productive routes, new crosstown routes Improved schedule/route coordination Feeder services; timed transfers; transit centers; regional integration
Scheduling/frequency adjustments Increased service frequency Increased frequency on specific routes Increased span of service Longer service hours (e.g., late night/weekend)
Improved reliability/on-time performance Implementation of AVL, transit signal priority, transfer connection protection New types of service
Improved travel speed/reduced stops Introduction of express bus, BRT, rail Targeted services University-oriented service, downtown circulator, special event shuttle Improved amenities Passenger facility improvements Improved bus stop/station, transit center, park-and-ride amenities New/improved vehicles Improved amenities, use of articulated buses Increased security Increased agency security presence Increased safety Promotion of safety features of vehicles Partnerships/CoordinationPartnerships
University/school pass programs Reduced pass price or per trip reimbursement to university (or other school) Travel demand management strategies Employer pass/voucher programs; vanpooling; ride-matching; parking cash-out
Subsidized activity center service Subsidized service to office parks or other activity centers Coordination
Consistent regional (inter-agency) oper. policies Transfer agreements Coordination with social service agencies Mobility manager; user-side subsidy program Coordination with other transportation agencies Roadway or parking management strategies
Promotion of transit-supportive design/TOD Requirements for bus stops/shelters at new developments Marketing and Information Initiatives Marketing/promotional initiatives Targeted marketing/promotions New resident/college student/tourist promotion; individualized marketing
General marketing/promotions Agency image advertising, special promotions, cooperative advertising Information improvements
Improved informational materials Easier to read printed system and route maps/schedules, flyers/newsletters Improved customer information and assistance Transit information center, in-station customer assistants
Automated transit traveler information Pre-trip planning and en-route information, including real-time information Fare Collection/Structure Initiatives Fare collection improvements
Improved payment convenience AFC, new prepaid fare options, expanded fare media distribution/reload options Regional payment integration Regional smart card program
Fare structure changes Fare structure simplification Elimination of fare zones; elimination of express or rail surcharge Fare reduction Deeply discounted options; reduced base fare; free transfers, free fare zone
Table 2-10. Types of strategies/actions/initiatives.

Factors Affecting Ridership 21
• Nature of passenger amenities (i.e., related to cleanliness, aesthetics, and comfort of vehiclesand stations/bus stops/shelters);
• Ease of fare payment (e.g., purchase of prepaid options and type and technology of payment);• Nature of integration (e.g., service/schedules and fare policies and payment) with other
agencies in the region;• Perceptions of agency safety and security; and• Public image of agency.
Finally, certain aspects of the agency’s organizational structure and management approachmay well affect the agency’s ability to develop and implement the types of strategies needed togenerate high ridership; these elements include:
• Agency labor practices,• Governing board structure and vision, and• Agency corporate culture.
Such elements have the potential to facilitate—or inhibit—the agency’s ability to offer newtypes of service (such as flexibly routed community-oriented service), pursue new partnerships(with universities, employers, or social service agencies) or otherwise innovate or respondproactively to changing markets.
The next section identifies the specific types of strategies, actions, and initiatives transitagencies have utilized in addressing the above factors and generating and/or sustaining signifi-cant ridership increases.
Types of Strategies, Actions, and Initiatives
Based on the industry review, transit agency strategies, actions, and initiatives can begenerally categorized as follows:
• Operating/Service Adjustments,• Partnerships/Coordination,• Marketing and Information Initiatives, and• Fare Collection/Structure Initiatives.
Subcategories, as well as examples of more specific types of actions and initiatives, are shownin Table 2-10. Key considerations in identifying appropriate strategies are discussed in Chapter 3.Agency examples of use of the various types of strategies are discussed in Appendix A (providedon the accompanying CD-ROM) and Chapter 4, and details related to each strategy are providedin Chapters 5 through 8.

Introduction
In addition to understanding the relative impacts of external and internal factors, selectingappropriate strategies aimed at attracting/retaining riders requires
• Identifying service needs and opportunities; this includes determining gaps/deficiencies inexisting services, as well as assessing the nature of unmet needs and potential markets fortransit service.
• Identifying strategies that efficiently and effectively address the needs of one or more market segments, address gaps in existing service, and are appropriate to particular serviceenvironments.
The first of these steps is discussed here; the second is addressed in Chapter 4.
Evaluation of Existing Services
The basic elements in identifying the nature of service needs and opportunities in a region are(1) evaluation of the existing service network—as well as the supporting marketing program,information system, and fare system—to identify gaps/deficiencies/opportunities; and (2) devel-opment of an understanding of the characteristics and service needs of different market segments.
Changes in a region’s development patterns,population characteristics, and economic conditionscan often result in significant gaps or inefficiencies in the existing transit network—and can alsocreate new opportunities. The increasing dispersion of population and employment centers inparticular has produced new travel patterns in most regions that are typically not well served byCBD-oriented transit routes. An agency’s marketing, information,and/or fare systems may similarlybe insufficient to effectively support the region’s needs. The first step in seeking to boost ridershipshould therefore be to evaluate the current service design and route performance; the agency shouldthen assess the effectiveness of the existing marketing, information,and/or fare collection programs.
Service Evaluation
An agency can follow one of several approaches to evaluating its service, including
• Ongoing or periodic monitoring of route performance, with detailed evaluation of individualroutes deemed to fall below defined service standards;
• Evaluation of all routes (e.g., a comprehensive operational analysis or service restructuringstudy); and
• Evaluation of a particular type of service (e.g., express routes) or routes within a particularcorridor (i.e., as part of an alternatives analysis or corridor study aimed at considering theneed/potential for a higher capacity service such as rail or BRT).
22
C H A P T E R 3
Identification of Service Needsand Opportunities

A detailed service evaluation process typically includes the following steps:
Ridership Data Collection
There are several different methods and tools for collecting ridership data; the basic methods/tools are as follows:
• Manual boarding/alighting counts or ridechecks—Agency “checkers”(or outside contractors)observe and count riders on individual routes. Counts can either be done at stops (as riders geton or off vehicles), on board (which more easily allows load counts as well as boarding andalighting counts), or even in a trailing automobile. Ridership information may be recordedmanually or via specially programmed handheld units. Counts are most often done on a sampleof trips for each route, although in some cases an agency may opt for collecting data on all tripsfor a particular day or days.
• Automated passenger counts—Agencies are increasingly using automated passenger coun-ters (APCs) installed on buses to collect ridership data. APCs can be integrated with automatedvehicle location (AVL) systems to link counts to the location of the vehicle.
• Farebox data—Agencies that have electronic registering fareboxes can also use fare paymentdata for ridership information separated by type of fare payment (including incidence oftransfers). However, this data tends to be less reliable than that collected by other means, asthe quality of the data tends to vary somewhat depending on the conscientiousness of indi-vidual drivers. Automated fare collection can improve the reliability of the data, especially ifno driver action is required to record each fare category.
• Customer surveys—Agencies also collect a range of types of usage data through surveys ofriders. Besides information related to customer attitudes (see the Conducting Market Researchsection below), questionnaires distributed on board vehicles or at stops/stations are useful forcompiling origin-destination patterns and data on frequency of use, fare paid, access mode,and so forth.
The particular method an agency uses will depend on the resources available (i.e., the existenceof APCs and/or registering fareboxes, and the number of checkers or the budget available forhiring data collection contractors). The method chosen may also depend on the intended usageof the data (e.g., for evaluating route-level performance or for reporting systemwide ridership tothe National Transit Database).
Classification of Routes
Because individual routes perform different functions and serve different geographic areas,it is generally inappropriate to apply one set of standards to all routes. Thus, the first step indeveloping a series of route evaluation measures is to create a system of route classification—recognizing that many routes will not fall neatly into one class because they serve dual ormultiple functions. An example of a route classification scheme is as follows:1
• Radial line haul,• Express,• Commuter,• Urban circulator,• Urban crosstown,• Urban feeder/distributor,• Suburban local,• Suburban circumferential, and• Suburban feeder/distributor.
Identification of Service Needs and Opportunities 23
1TranSystems Corp. et al., WMATA Regional Bus Study – Comprehensive Operational Analysis Summary Report (February 2001),prepared for Washington Metropolitan Area Transit Authority, p. 3.

Development of Route Evaluation Measures
Route evaluation measures are often placed into two basic categories:
• Design measures—These measures concern where bus routes ought to be operated and whatthe service characteristics of those routes should be. Typical examples include– Coverage—This measure applies to the whole system, rather than to individual routes, and
serves to set the recommended spacing between routes for varying densities. For example,for high-density residential areas with at least 3 households per acre, an agency could decidethat 90% of households should be within one quarter mile of a bus route, while, formedium-density suburban areas (e.g., 2–3 households per acre), 80% of households shouldbe within one-quarter mile of a bus route.
– Span of service—This measure addresses how many days per week, and how long on eachday, service should be provided. An example of proposed span of service guidelines for atransit system with the above route classification scheme is shown in Table 3-1.
– Frequency of service—Frequency of service thresholds is set to ensure a basic level of servicefor the area served by a route. For dense areas, for instance, an agency could specify that ser-vice should be provided at least every 15 minutes in peak periods and at least every 30 minutesin off-peak periods. For less dense areas, the thresholds might be 30 minutes for peak periodsand 60 minutes for off-peak periods. An example of proposed frequency of service guidelinesfor a transit system with the above route classification scheme is as follows (Table 3-2).
– Travel time—This measure encompasses both route directness and travel speed, since itcompares the in-vehicle travel time on a bus from point A to point B to the driving timefrom point A to point B. Bus routes that are indirect or that have an excessive number ofstops would have more difficulty attaining the established threshold (e.g., of having a traveltime not more than twice the driving time). An example of proposed travel time guidelinesfor a transit system with the above route classification scheme is as follows (Table 3-3).
• Performance measures—These measures, which are more directly applicable to an operationalanalysis, quantify how well existing bus routes are used and whether service is comfortable andreliable for the passengers. Typical examples include
24 Elements Needed to Create High Ridership Transit Systems
Type of Service First AM
arrival not later than
Last AM arrival not
earlier than
First PM departure not
later than
Last PM departure not earlier than
Radial line haul—Urban 7:00 N/A N/A 22:00
Radial line haul—Suburban 7:00 N/A N/A 20:00
Commuter 7:00 9:00 16:00 18:30
Express 7:00 9:00 16:00 18:30
Urban circulator No specific threshold
Urban cross-town 7:00 N/A N/A 22:00
Urban feeder/distributor 7:00 N/A N/A 19:00
Suburban circumferential 7:00 N/A N/A 18:30
Suburban feeder/distributor 7:00 N/A N/A 19:00
Suburban local 7:00 N/A N/A 19:00
Table 3-1. Example, span of service measures.
Type of Service Weekday Peak Period Weekday Off-Peak
and Weekend Urban Classes: Headway not greater than 15 minutes 30 minutes
Suburban Classes: Headway not greater than 30 minutes 60 minutes
Express Routes: Peak period trips not fewer than 4 trips 0 trips
Table 3-2. Example, frequency of service measures.

– Productivity—Productivity measures the level of demand for the route. The demand canbe quantified, for instance, in terms of the number of boardings per vehicle revenue houror boardings per trip for express routes. The measure may have separate thresholds for peakperiod and off-peak period service and may also have a full-day threshold in case ridershipand operational data are not available for peak and off-peak service separately. An exampleof proposed productivity measures for a transit system with the above route classificationscheme is as follows (Table 3-4).
– Crowding—A passenger’s perception of the crowding on a bus is most easily quantified bythe load factor—the number of passengers on board at the peak load point divided by thenumber of seats. A load factor above 1.0 indicates that some people were forced to stand fora portion of the trip. Except for infrequent services (headway greater than 30 minutes) theload factor on one individual trip is typically not critical; thus, this measure may insteadconsider, for example, the average load over two consecutive trips for medium frequencyservices, and over all trips within the peak 30 minutes for frequent services. An example ofproposed crowding measures for a transit system with the above route classification schemeis as follows (Table 3-5).
– Reliability—Measures of reliability/schedule adherence apply to the whole system, ratherthan to individual routes. An example of an assessment of reliability for a transit system isshown in Table 3-6.
Route-level Performance Assessment
Once evaluation measures have been established, each route is then evaluated in terms of howit compares to agency goals or thresholds for that class of routes. The overall system’s perform-ance may also be assessed for certain measures (e.g., coverage). Examples of the application oftwo of the above measures (span of service, by route class, and productivity, by area) are shownin Tables 3-7 and 3-8.2
Identification of Service Needs and Opportunities 25
Type of Service Ratio of Scheduled End-to-End AM Peak Bus Running Time
to Zone-to-Zone Auto Travel Time All types other than Express 2.0
Express 1.5
Type of Service Weekday
Peak Period Weekday
Whole Day
Weekday Off-Peak and Weekend
Radial Line Haul Routes: Boardings per VRH 30 24 18
Urban Classes (buses ≥30 ft.): Boardings per VRH 30 24 18
Suburban Classes (buses ≥30 ft.): Boardings per VRH 15 12.5 10
Express Routes: Boardings per trip 23 23 23
All Classes (buses <30 ft.): Boardings per VRH 12 11 10
Table 3-3. Example, travel time measures.
Table 3-4. Example, productivity measures.
2In Tables 3-7 and 3-8, the percentage of passing routes is calculated in two ways: at the route level unweighted, and by routeweighted by vehicle revenue hours (VRH) of service. The unweighted method treats each route in the region equally, while theweighted method counts routes in proportion to the vehicle revenue hours of service on that route. The second method givesa more accurate picture of the span of service or productivity in the region, since if a minor route with only a few trips a dayis unable to meet the service span or productivity threshold, it would have only a minimal impact on regional mobility, but ifa major route with many trips is unable to meet the threshold, more people would be affected.

26 Elements Needed to Create High Ridership Transit Systems
Allowances Percent On Time Percent Early Percent Late Departures
0 min. early/5 min. late 90.5% 3.9% 5.7% 1 min. early/5 min. late 92.7% 1.6% 5.7%
Arrivals 0 min. early/5 min. late 57.4% 25.2% 17.3% 1 min. early/5 min. late 66.5% 16.2% 17.3% 2 min. early/5 min. late 72.3% 10.4% 17.3% 2 min. early/6 min. late 75.9% 10.4% 13.7%
Departures and Arrivals 0/5 Departure and 0/5 Arrival 55.1%
-1/5 Departure and -2/6 Arrival 73.3%
Number of trips in sample 14,617
Table 3-6. Example, weekday schedule adherence results.
Route Classification Number of Routes
% Meet Threshold,
Routes Total VRH
% Meet Threshold,
VRHRadial Line Haul 25 92% 3,477 96%
Express 32 19% 741 31%
Commuter 63 35% 969 53%
Urban Circulator 6 100% 192 100%
Urban Cross-town 10 100% 1,354 100%
Urban Feeder/Distributor 44 93% 2,443 94%
Suburban Local 25 64% 813 82%
Suburban Circumferential 6 83% 550 94%
Suburban Feeder/Distributor 83 77% 4,519 88%
TOTAL 294 66% 15,058 87%
Table 3-7. Example, weekday span of service evaluation.
Area Period Number of Routes
% Meet Threshold,
Routes Total VRH
% Meet Threshold,
VRHUrban Peak 97 88% 7,176 94%
Off-Peak 94 90% 7,135 96%
Suburban Peak 167 74% 6,677 85%
Off-Peak 171 70% 7,493 85%
TOTAL Peak 264 79% 13,854 90%
Off-Peak 265 77% 14,628 91%
Table 3-8. Example, weekday productivity evaluation.
Type of Service Weekday Peak Period Load Factor
Weekday Off-Peak and Weekend Load
Factor
All Classes other than Urban Cross-town and Express 1.2 1.0
Urban Cross-town 1.1 1.0
Express Routes with premium fare 1.0 1.0
Table 3-5. Example, crowding measures.

Identification of Problem Routes
Based on the route-level assessment, “problem routes” (i.e., those with design and/orperformance measures that fall below specified thresholds) can be identified. An example of asummary of an agency’s route-level assessments for the above measures is shown in Table 3-9.
Identification of Actions to Address Problems
Based on the route-level assessment, the agency can then identify potential actions for improv-ing the design and performance of problem routes. The types of service adjustments that mightbe considered are described in Chapter 5.
A route-level evaluation is thus an important element of an overall assessment of a transitsystem. When combined with market research and an assessment of unmet needs/latent demand,an agency can identify opportunities for attracting new riders or expanding usage by currentriders. A comprehensive system evaluation may also include a peer analysis that compares theagency’s services and systemwide performance to those of a set of comparable agencies.
The next section briefly discusses the evaluation of an agency’s marketing, information, andfare systems.
Needs Assessment of Marketing/Information and Fare Systems
In addition to identifying service gaps or deficiencies, an agency seeking to maximize ridershipshould review its marketing and information programs, as well as its fare structure/system. With
Identification of Service Needs and Opportunities 27
Route/Line Classification Span Freq. Travel Time
Produc-tivity
Crowding # Not Met
# Border-line
22A-F Urban feeder/distributor No No No No Yes 4 0 AT7 Urban feeder/distributor No No No No Yes 4 0 24M,P Urban feeder/distributor No No Yes~ No Yes 3 1 11P Commuter No No Yes No Yes 3 0 13A-G Radial line haul Yes No No No Yes 3 0 21A-F Express No Yes Yes No No 3 0 25A-R Urban feeder/distributor No No Yes No Yes 3 0 28C Urban feeder/distributor No No Yes No Yes 3 0 AT2 Radial line haul No No No Yes Yes 3 0 AT3 Urban feeder/distributor No No Yes No Yes 3 0 AT4 Urban feeder/distributor No No Yes No Yes 3 0 AT5 Urban circulator Yes No No No Yes 3 0 10B,C,D Urban cross-town No No No~ Yes Yes 2 1 23A-T Urban cross-town No No No~ Yes Yes 2 1 28A,B Urban cross-town Yes No No~ Yes No 2 1 38B Radial line haul No No Yes~ Yes Yes 2 1 25B Urban feeder/distributor No No Yes Yes Yes 2 0 3A-F Radial line haul Yes Yes No No Yes 2 0 AT8 Radial line haul Yes No No Yes Yes 2 0 10A,E Urban feeder/distributor Yes No Yes Yes Yes 1 0 16A-J Radial line haul Yes Yes Yes Yes No 1 0 16L Commuter No Yes Yes Yes Yes 1 0 28F,G Express Yes Yes Yes No Yes 1 0 7A-X Urban feeder/distributor Yes Yes Yes~ Yes Yes 0 1 16S, U, W, X Commuter Yes Yes Yes Yes Yes 0 0 4A-S Urban feeder/distributor Yes Yes Yes Yes Yes 0 0 8S-Z Commuter Yes Yes Yes Yes Yes 0 0 ART Urban circulator Yes Yes N/A Yes Yes 0 0 ShoppersShuttle
Urban circulator Yes Yes N/A Yes Yes 0 0
% of routes not meeting threshold 52% 62% 24% 45% 10%
Table 3-9. Example, summary of routes meeting design thresholds.

regard to marketing/information strategies, how effective are the existing programs/systems atinforming riders about the transit service and how to use it? With regard to the fare structure andfare collection system, are there problem areas or opportunities for improvement? For bothcategories, are there new strategies that might improve the agency’s ability to attract and retainriders? Considerations related to these areas are discussed in Chapters 7 (Marketing &Information Initiatives) and 8 (Fare Collection/Structure Initiatives).
Identification of Needs & Potential Markets
Traditionally, budgetary and other constraints (e.g., land use/roadway network limitations)have by and large forced transit agencies to focus their services on specific trip purposes (notablythe work trip). In other words, the focus has been on serving the greatest number of people inthe most cost-effective manner possible. However, the market for transit services is clearly notmonolithic, but rather consists of a broad mix of types of users, with differing socioeconomiccharacteristics and trip purposes. Efforts to produce significant increases in overall ridership—or greater market share among particular user groups—may therefore require agencies to targetspecific market segments or niches. In any event, developing an understanding of the character-istics and travel needs of different groups is a key element in identifying the most appropriateridership growth strategies/initiatives.
This section presents guidance on identifying unmet needs and potential markets for transitservice. The key elements in identifying needs/markets include the following:
• Conducting analysis of demographics and travel patterns within the area or region; thisanalysis is used to identify– Gaps in transit service coverage, focusing on areas with the potential to support transit
services (e.g., based on development density, activity centers, and concentrations oftransit-dependent residents)
– The size of the current and projected travel markets (e.g., based on travel volumes to majorregional employment centers)
• Conducting market research, identifying (1) key market segments and (2) both currentriders’ and non-riders’ service preferences and propensity to ride improved transit service.
These elements are discussed below.
Conducting Demographic and Travel Pattern Analysis
Several different types of analyses can be carried out in an effort to understand both theavailability of transit services in a city or region and how well that transit service meets currentand future travel needs. For example, transit coverage can be compared with current and futuredevelopment patterns to contrast service availability with evidence of demand. In addition, travelpatterns to major regional activity centers can be analyzed to identify potential transit markets.Then, within these potential markets, transit travel times can be compared with auto access timesin order to examine the effectiveness of transit accessibility.
One approach that has been found to be invaluable in such analyses is to use geographicinformation systems (GIS) tools to map key indicators of potential demand (i.e., demographiccharacteristics, land use patterns, and key travel generators) as well as the existing transitservices and ridership levels. Graphical displays of this information (see Exhibit 3-1 below foran example) can be quite helpful in identifying the nature of the existing market for transitservice as well as areas of potential demand.
28 Elements Needed to Create High Ridership Transit Systems

The GIS data can be used, for instance, to conduct a route coverage analysis. Service areasrepresenting typical walking distance (1⁄4 mile, or 1,300 feet) from the agency’s route network
as a whole, and from each individualroute, can be produced and incorporatedinto the GIS database for display andanalysis. These areas can then be used tocalculate the total population, and the con-centration of various transit-dependentsegments, within walking distance of eachroute, and of the whole system. Unservedareas of moderate population density,or with a significant concentration oftransit-dependent residents, can then beidentified.
Based on the evaluation of the existingservice, coupled with the assessment oftravel, development and demographic patterns—including anticipated futuregrowth patterns—the agency can thenidentify (1) gaps in the existing service net-work and (2) specific travel markets in theservice area which appear to be under-served. The results of this analysis shouldultimately be combined with the findings
of the market research (discussed in the next section) to identify the appropriate types of servicechanges to best address these unmet needs and future opportunities.
Conducting Market Research
Purpose/Goals of Market Research
Although demographic analyses are critical to making general assumptions about probableservice gaps and the size of underserved market segments, these analyses can be enhancedsignificantly through the conduct of targeted market research. The purpose of this research is tospecifically identify potential markets for increased transit ridership and to confirm the reasonsfor current mode choice decisions.
The most fertile markets for potential transit ridership increases are those where the actualrate of transit use falls below that group’s expected level (e.g., based on Journey to Work Censusstatistics). Reasons for lower-than-expected transit usage include the lack of informationavailability, a mismatch between services provided and those desired (e.g., span of service orrouting), pricing, and other operating environment issues (e.g., safety).
Trip characteristics, traveler characteristics, and travel needs and wants represent the primarypieces of information targeted by transit market research. Compiling responses to these travelcharacteristics-related questions with more precision than that afforded by a broad demographicanalysis allows for a better understanding of why a transit provider is not reaching its full poten-tial in market penetration.
In deciding on a market research methodology, a key initial question must be answered: is theagency attempting to learn more about riders or non-riders? Riders are easier to reach and theirinteraction with the system presents opportunities for a variety of market research methods, as well
Identification of Service Needs and Opportunities 29
0 31 2
MilesPrepared By Multisystems, Inc.
Transit Need IndicatorsLowerMediumHigher
Essex
Union
Bergen
Bergen
Exhibit 3-1. Example of GIS graphic.

as providing for easier management of the research program. Non-riders present a host of chal-lenges, not least of which is the large number of them (several times the number of transit ridersin even the highest ridership metropolitan areas), and the costs inherent in reaching out to them.
Market Research Techniques
The next decisions are (1) whether to use quantitative or qualitative market research tech-niques and (2) which specific technique(s) to employ. These decisions are primarily governed bythe nature of the desired information, as well as the resources—and amount of time—available.There is a wide variety of market research techniques, and each is suited to specific research needsand budgets. The basic market research approaches are as follows:
• Surveys and interviews,• Travel diaries,• Focus groups, and• Customer panels and advisory committees.
The advantages and disadvantages of these are discussed below.
Although the above techniques vary in their applicability, all should strive to meet certain stan-dard characteristics:3
• Sufficient detail to form the basis for agency decision-making,• Statistically reliable,• Fully inclusive and representative of target group,• Justifies the costs of research,• Replicable and understandable, and• Usable in context with other techniques.
Surveys/interviews take many forms, including telephone, household/mailback, online, on boardand intercept (e.g., in a station or at a bus stop). Some of these are suitable only for one target group(i.e., customer or non-customer) while others can be used for both. Telephone surveys targetingthe broad population (both customers and non-customers) represent one of the more expensivemarket research techniques. However, this generally represents the best way of reaching non-ridersand is particularly useful (for riders and non-riders) if the survey instrument is complex (e.g.,a “stated preference” survey involving a series of trade-off questions). Other strategies for con-ducting a complex rider survey are to do in-person interviews or to hand out the questionnaires onboard or at stops/stations and provide a mailback option; these approaches are also used to collectorigin-destination and usage data, as described earlier in this chapter. Some of the key differencesbetween telephone and on-board survey methods are compared in Table 3-10.
Travel diaries are another useful market research tool that is applicable to both customer andnon-customer target groups. With this technique, participants log information on all aspectsof their travel behavior (e.g., time of day, mode choice, and origin/destination) over a pre-determined period. Once collected, this information provides a more comprehensive snapshot ofparticipant travel needs and habits than could be obtained through surveys and other techniques.Travel diaries also provide the transit agency with enough information to determine the suitabil-ity of serving non-transit trips with existing or enhanced transit service.
Focus groups cost considerably less to administer than surveys or travel diaries, but have thedrawback of being the least representative of the approaches.4 Focus groups generally cannotbe used to produce statistically significant information—or any quantitative information, for
30 Elements Needed to Create High Ridership Transit Systems
3NCHRP Report 487: Using Customer Needs to Drive Transportation Decisions (2003).4As discussed below, the relative cost of the different techniques to an agency ultimately depends on the nature of the resourcesavailable (e.g., whether there is any in-house market research staff and the specific capabilities of that staff).

that matter. However, focus groups are useful for gauging levels of interest in new initiatives orgetting input from different market groups on key issues or concepts. Agencies also sometimesuse focus groups as a means of establishing or testing questions to be used in a survey.
Customer panels and advisory boards are typically more appropriate to monitoring anongoing agency program than to identifying means for increasing ridership. NCHRP Report 487distinguishes between data-gathering techniques designed to solicit customer or public inputand those that are aimed more at receiving feedback on a program that has already been imple-mented. While market research with the goal of increasing ridership falls into the first categoryof data gathering, customer panels and advisory boards are more suited to the second.
As suggested above, the availability of resources at an agency often governs the technique(s)utilized. The availability of resources—and the size of the agency—also affects an agency’sorganizational approach to market research. For example, large agencies that conduct ongoingmarket research programs may find it cost-effective to maintain a full-time, dedicated marketresearch staff. However, this may mean that most of the agency’s market research is limited towhat can be directly undertaken by that staff. In such a case, for instance, an on-board survey isoften the least expensive technique, as it can be carried out by agency staff. That same agency mayfind techniques such as focus groups prohibitively costly, given a limited budget for hiring out-side contractors to do market research. Alternatively, for a smaller agency that conducts marketresearch on more of an as-needed basis, contracting all survey efforts out to private firms may bethe most cost-effective way to carry out the research. In such cases, the agency often assigns theresponsibility for the research to the specific department in search of market information at thattime. Even for agencies with in-house staff, though, contracting out large or particularly complexsurvey efforts to private firms is often necessary.
Examples of Agency Market Research Approaches
A number of agencies maintain regular comprehensive transit market research programs. Inthe San Francisco Bay Area, for instance, BART conducts bi-annual passenger surveys that gaugerider satisfaction with 44 BART service characteristics. BART compares the results with previoussurveys to identify trends and measure improvement resulting from new service enhancements.This survey is augmented by follow-up telephone surveys conducted in the off year with a sub-set of the passenger survey respondents. BART also makes the results of this research available tothe public through its website.
Identification of Service Needs and Opportunities 31
Telephone interviews On-board surveys/personal interviews
On-board surveys with mailback
Data collection costs Moderate to high High Low to moderate Time for data collection Short to moderate Moderate to long Moderate Control over respondent selection
High High Low
Response rates Moderate to high High Low to moderate Ability to access hidden populations
Moderate High Low
Complexity of questions Simple to moderate Moderate to complex Simple Completion of boring/tedious questions
Moderate High Low
Completion of sensitive questions
Moderate to high Low Moderate
Interviewer bias and error Low to moderate Moderate to high None Ability to ask open-ended questions
Low to moderate High Moderate
Perceived respondent anonymity
Moderate to high Low Moderate to high
SOURCE: TCRP Report 37: A Handbook: Integrating Market Research into Transit Management (1998), p. 94
Table 3-10. Comparison of telephone and on-board surveys.

Depending on the desired information sought by the transit agency, a more focused researchprogram targeting one submarket may be preferred. For instance, the City of Lowell (MA) wasinterested in attracting more city youths (a submarket with the potential for high ridership giventhe cost of automobile ownership and the minimum age requirements for a drivers license)to local transit service. The Lowell Regional Transportation Authority (LRTA) and the city’scampus of the University of Massachusetts jointly conducted a survey of city high school and mid-dle school students. The survey asked youths to identify gaps in service to popular recreationaland employment destinations. The result of the research effort was a “Youth Loop” bus serviceserving 18 popular destinations and residential areas with high concentrations of young people.
Another approach is to conduct a survey focused on a particular aspect of the transit service.For example, agencies often conduct surveys related to fare payment preferences and concernsas part of fare system or policy studies. Similarly, an agency introducing a new type of service(e.g., BRT or LRT) may find it useful to survey area residents on desired attributes and potentialusage of the new service.
Survey Analysis Methods
There is a broad range of survey analysis methods. The appropriate method depends on thenature of the questions and the intended use of the results (e.g., what type of market segmenta-tion will be developed?). For straightforward questions (e.g., related to frequency of travel ordemographic characteristics), simple frequencies are useful. Cross-tabulation is the simplest andmost common method for analyzing the relationships between pairs of variables. Another usefultechnique for depicting the relationship between two variables is quadrant analysis; the relativeratings or performance of the two variables are plotted on a graph that clearly shows their relativeimportance. For analyzing the relationships among several variables or analyzing more complexquestions (e.g., trade-off questions related to how respondents value alternative service or fareattributes), more sophisticated multivariate analysis techniques must be used; examples of suchtechniques include correlation analysis, multiple regression analysis, discriminant analysis, factoranalysis, correspondence analysis and conjoint analysis.5
Regardless of the specific analysis methods employed, the ultimate goal of the market researchshould be to provide the agency with a better understanding of the attitudes, preferences,characteristics, and/or unmet needs of different service area market segments. These findingsshould then be combined with the service evaluation and the analysis of demographic data andtrends to identify mobility needs and growth markets and opportunities for transit in the region.An important aspect of this process is the identification of the needs of key market segments;market segmentation is discussed in the next sections.
Identifying Market Segments
Market Segmentation Approaches
TCRP Report 36: A Handbook: Using Market Segmentation to Increase Transit Ridership notesthe following:
• “Everyone is not a prospect for every product or service offered. It is evident to everyone inthe transit industry that not everyone rides or will ride the bus, participate in a carpool orvanpool, ride a bike to work, or otherwise leave their car at home—even for a day.
32 Elements Needed to Create High Ridership Transit Systems
5For a description of these techniques, as well as other details related to market research, the reader is directed to the follow-ing reports: TCRP Report 37: A Handbook: Integrating Market Research into Transit Management (1998); D. Aaker et. al., Mar-keting Research (1995); P. Alreck and R. Settle, Survey Research Handbook (1995); and G. Churchill, Marketing Research:Methodological Foundations (1995).

• An agency’s product or service mix must be controlled for maximum efficiency. Recentcutbacks in funding make it increasingly important to understand customers’ needs and wantsin order to use these increasingly scarce resources most effectively.
• Since the product/service mix and customer pool are limited, it is most efficient to match yourproducts and services to customer needs and wants.” (p. 2)
Of course, there are a number of different ways to segment the market for transit (or any prod-uct or service). TCRP Report 36 explains that there are two basic approaches:
• “Pre-determined (a priori) segmentation—selecting certain groups from a population basedon known characteristics and declaring them ‘segments.’
• Market-defined (post hoc) segmentation—identifies segments based on actual market inves-tigations, notably analysis of answers to survey questions intended to predict marketplaceresponses.” (p. 75)
The authors of TCRP Report 36 suggest that “Bases used for pre-determined (a priori)segmentation vary widely depending on goals.” (p. 13). They provide a number of examples,including
• “Riders versus nonriders, frequent riders versus infrequent riders versus occasional riders, orformer riders versus current riders.
• Loyal riders versus vulnerable or nonloyal riders.• Transit dependent riders versus choice riders.• Residents of high-density areas versus suburban residents.• Commuters to downtown CBDs versus suburb-to-suburb commuters.• Student commuters versus work commuters.• ‘High’ versus ‘mid’ versus ‘low’ income groups.• Geographic location as defined by zip code, census tract, or transit analysis zone.” (p. 13)
While a priori segmentation uses existing group definitions, post hoc segmentation requires newmarket research.A list of some of the types of classifications and variables often deployed in market-defined segmentation analyses is presented in Table 3-11. (TCRP Report 36 describes and presentsexamples of various types of market segmentation that have been used by transit agencies.)
Identification of Service Needs and Opportunities 33
Product Selection Behaviors Usage rates and occasions (e.g., frequency of riding or trip purpose)
Knowledge of and experience with product
Substitutability of related categories (e.g., availability of alternative modes)
Mode Selection Behaviors Favorite travel mode
Acceptable modes
Disliked modes
Mode loyalty versus mode switching Product Class-Related Attitudes
Benefits sought
Problems encountered using product/service
Attribute utilities of mode
Mode-Related Attitudes Awareness and perceptions
Mode user imagery
Perceived appropriateness for use occasions Person-Related Attitudes
Self-perceptions
Values
Life styles
Other “psychographics”
Other Bases Stage in life cycle
Socioeconomic status
Ethnicity
Other demographics
SOURCE: TCRP Report 36: A Handbook: Using Market Segmentation to Increase Transit Ridership(1998), p. 20
Table 3-11. Some common bases for post hoc segmentation.

Key Market Segments
With regard to identifying specific market segments, a report recently prepared for APTA(B. Hemily, Trends Affecting Public Transit’s Effectiveness: A Review and Proposed Actions,November 2004) identifies four key segments for transit, based on an analysis of demographic,socioeconomic, and land use trends; these segments are (p. 27)
• Commuters;• Immigrants (particularly in older inner suburbs);• Serving the mobility needs of an aging population; and• Access for customers with special needs (i.e., persons with disabilities and economically
disadvantaged).
Hemily argues that these are the market segments most likely to yield significant ridershipincreases in future years and transit agencies must therefore recognize and understand thedifferent needs of these markets in developing service and marketing strategies.
In a broader study of transit market segments, TCRP Report 28: Transit Markets of the Future—The Challenge of Change analyzed current and future transit market groups, based on use oftransit as reported in the 1990 U.S. Census and 1990 Nationwide Personal TransportationStudy (NPTS). Table 3-12 shows “transit use by various market niches indexed to averagemetropolitan transit use.” In this table, groups with an “MSA Transit Index” higher than 1 were“more likely than average to commute using transit”; the higher the index, the higher the group’s
34 Elements Needed to Create High Ridership Transit Systems
Market Niches MSA Transit
Inde x M arket Niches MSA Transit
Inde x Se x Men Women
Race & Ethnicity White Black Hispanic Asian
Vehicle Ownership No car One or more cars
Age of Worker 17 — 29 30 — 39 40 — 49 50 — 59 60 — 64 65 — 69
Education No school Elementary Junior High Some High School High School Some College College Graduate School
0.85 1.18
0.68 2.72 1.73 1.74
5.76 0.68
1.14 0.96 0.87 0.92 1.07 1.10
2.59 2.08 1.69 1.25 0.91 0.82 1.05 1.06
Household Income <$5k $5 — 10k $10 — 15k $15 — 20k $20 — 25k $25 — 30k $30 — 40k $40 — 50k $50 — 60k $60 — 70k $70k plus
Immigration Status Non-immigrant Immigrant
Years in US <5 5 — 10 10 — 15 15 — 20 20 — 25 25 — 30 30 — 40 40 plus
Limitations Work limitation Mobility limitation
1.23 1.24 1.08 1.04 0.97 0.90 0.78 0.77 0.84 0.91 0.95
0.84 2.08
3.01 2.25 1.74 1.89 1.88 1.49 1.48 1.80
1.25 2.41
SOURCE: TCRP Report 28: Transit Markets for the Future—The Challenge of Change (1998), p. 8 — data from 1990 U.S. Census
Table 3-12. Transit use by various market niches indexed to averagemetropolitan transit use.

reliance on transit. Based on this analysis, the authors identified the following groups of transitusers as “. . . being more likely than average to use transit as their principal mode for commutingto work in U.S. metropolitan areas in 1990:
• Women,• Blacks,• Hispanics,• Asians,• Workers with no household cars,• Workers age 17 to 29,• Workers age 60 and over,• Workers with less than high school education,• Workers with some high school but no degree,• Workers with college degree,• Workers with graduate school education,• Workers with household income below $20,000,• Immigrants, and• Workers with mobility or work limitations.” (p. 8)
The report notes that “The data show that there are distinctly different markets among thoseriding transit—it is unlikely that they all could or would be well-served by the same services,routes, schedules, and marketing approaches.” (p. 3)
There may also be distinct differences in the types of strategies an agency should consider intargeting existing riders versus new riders. For instance, surveys from the recent regional busstudy in the Washington, DC, region identified the types of transit improvements desired by bothexisting riders and non-riders. The results of these survey efforts are shown in Exhibits 3-2 and3-3. As indicated, there are significant differences between the most desired improvements forthe two groups: riders rated service-related improvements most important, while non-ridersconsidered better information and improved amenities (i.e., “better shelters”) most important.Thus, targeting new riders would argue for a different set of actions/initiatives than would anattempt to influence the usage patterns of existing riders.
Identification of Service Needs and Opportunities 35
Improvements Desired by Bus Riders
49%
31%
25%22%
13% 12% 10% 10% 9% 8% 8% 7%
0%
10%
20%
30%
40%
50%
60%
On-tim
e Arri
val
More F
requen
t Ser
vice
Longer H
ours
Less C
rowdin
g
Close
r Bus S
tops
Go Mor
e Plac
es
Faste
r Ser
vice
Bette
r Shelt
ers
Sched
ule In
fo/S
ignag
e
Bette
r Veh
icle C
ondition
Lower
Fare
s
Bette
r Cust
omer
Ser
vice
Exhibit 3-2. Results of rider survey (source: TranSystems et al., WMATA Regional BusStudy, 2003).

Along these same lines, a report prepared by the California Department of Transportation(An Analysis of Public Transportation to Attract Non-Traditional Transit Riders in California,April 2003) presents the results of market research conducted by a number of California tran-sit agencies of rider and non-rider attitudes toward transit. The report notes that “Surveysacross the state reveal that approximately one-half to two-thirds of current riders find the exist-ing service in their area ‘good’ or ‘excellent.’ Their suggestions for improvement are over-whelmingly concentrated as follows:
• More frequent service (crosses all demographics);• More ‘on-time’ service;• Better timed transfers;• Extended service (nights and weekends); and• Additional routes (to a lesser extent).” (p. 14)
As for non-riders, the California DOT reports on two aspects of the market research: “whynon-riders don’t use the system now” and “what would entice non-riders to use the system.”Regarding reasons for not using transit now, the most common reason cited was simply owner-ship of a car; many survey respondents claimed that they would only use transit if they had noalternative (e.g., if their car were broken). Regarding what could lure non-riders to transit, asurvey from the Los Angeles area revealed that “To be attracted to transit, (these) non-riderswould need the perceived value of transit to equal their current mode.”(p. 20) These respondentsconsidered “travel time compared to the auto” to be “of high importance” and also rated the localtransit service as “unsafe.”
Thus, given the different types of concerns and travel needs associated with different rider andnon-rider groups, market segmentation can clearly be a useful component of any effort aimedat increasing ridership or market share; designing marketing plans—as well as types of service—that target specific market segments will often represent the best use of an agency’s limitedresources.
The remaining chapters provide guidelines on identification of appropriate strategies toaddress the service needs and potential markets identified through the above method.
36 Elements Needed to Create High Ridership Transit Systems
Improvements Desired by Non-Riders
30%
21%18% 16% 16%
13% 13%9%
6%
0%5%
10%15%20%25%30%35%
Better
Info
rmat
ion
Better
Shelt
ers
More C
onvenien
t Sto
ps
Faster
Ser
vice
More F
requen
t Ser
vice
Servic
e to D
estin
ation
Comforta
ble Buse
s
Servic
e to M
etro
rail
Better
Reli
abilit
y
Exhibit 3-3. Results of non-rider survey (source: TranSystems et al., WMATA Regional BusStudy, 2003).

Introduction
Identifying strategies, actions, and initiatives that can cost-effectively increase an agency’sridership thus require the agency to identify and understand (1) the nature of the externalfactors affecting demand, (2) gaps in existing service—and opportunities for improvements,and (3) the service requirements of key market segments. The agency can then select strategiesthat address the identified types of needs—and that are appropriate to the particular serviceenvironment. An agency may choose to focus on a specific market segment and select a singletype of strategy/initiative—or alternatively may opt for a broader set of strategies that targetmultiple segments. Considerations in choosing individual types of strategies are addressed inChapters 5 through 8; this chapter discusses the selection of appropriate strategies for differenttypes of service environments, including a review of the characteristics and common elementsof successful agency examples.
Service Environments and Strategies
Beyond targeting different market segments, one of the keys to developing transit strategies thatmaximize ridership is to identify the most appropriate type(s) of services for specific serviceenvironments. While transit service has typically focused on the urban core, for instance, theincreasing dispersion of employment and residences throughout metropolitan areas has increasedthe need for suburban-oriented transit services. Exurban and rural areas obviously require differentapproaches as well, and more specialized environments (e.g., downtown areas, college campusareas, or major tourist attractions) may also merit consideration of specially designed services.
Identifying Types of Service Environments
Service environments can be defined in different ways. The FTA, on its Innovative Practices forIncreased Ridership website, has categorized its entries by population, for instance:
• Rural area (under 50,000);• Small urbanized (50,000—200,000);• Medium urbanized (200,000—1 million); and• Large urbanized (over 1 million in population).
For some types of strategies—service design considerations in particular—it is usefulto define more specific environments, including different types of suburban settings as wellas downtown areas and other specialized settings. While transit is provided in a broad range
37
C H A P T E R 4
Selection of Strategies

38 Elements Needed to Create High Ridership Transit Systems
of environments, the following categories can be used to further define many agencies’services:
• Metropolitan—Service (often more than one mode) covers multiple types of settings withina metropolitan area; examples include agencies such as Chicago Transit Authority, Miami-Dade Transit Agency, and Denver Regional Transit District.
• Suburban—Service is focused on a suburban area or a stand-alone town/community withina metropolitan area served by multiple agencies; examples include the individual municipalservices (e.g., Montebello Bus Lines, Culver CityBus, and Santa Clarita Transit) in the LosAngeles area, or local services outside of Washington, DC (e.g., the Fairfax, VA, Connector;Alexandria, VA, DASH; and Ride-On in Montgomery County, MD).
• Downtown/Central Business District—Service is focused on the urban core, either on thedowntown/CBD area or one or more urban neighborhoods; examples include the LADOT’sDASH intracommunity services in urban neighborhoods in Los Angeles.
• Regional—Service covers multiple jurisdictions in a region; examples include commuter railservices such as Metra (Chicago area), SCRRA (Los Angeles area) and VRE (Washington,DC, area).
Finally, service may operate within or have a special market focus, such as
• Tourist centers—Major tourist locations can be year-round (e.g., Las Vegas, NV, and Orlando,FL) or predominantly seasonal destinations (e.g., Cape Cod, MA). The service requirementsfor the latter areas obviously differ considerably from the former.
• College area—This includes large campuses within metropolitan areas (e.g., Universityof Washington in Seattle, University of Minnesota in Minneapolis, and Cleveland StateUniversity in Cleveland), as well as stand-alone “college towns” (e.g., Ann Arbor, MI; ChapelHill, NC; and Davis, CA).
As discussed later in this chapter and in Appendix A, services designed to focus on suchmarkets can be quite effective at generating ridership.
One of these types of environment that has proven particularly challenging to transit agenciesis the suburban environment. Effectively serving the increasingly dispersed travel patterns insuburban settings represents perhaps the single greatest challenge facing the transit industry.Suburban population and jobs have both grown much faster than in the central city: the popu-lation increase in the suburbs between 1990 and 2000 was two and half times the growth rate incentral cities, and nearly three-quarters of job growth during the 1990s occurred in suburbanareas. The crux of the suburban transit issue is summarized in TCRP Report 55: Guidelines forEnhancing Suburban Mobility Using Public Transportation (1999):
“Average residential and employment densities today are not only much lower than adecade or more ago, but trip origins and destinations are also far more spread out. Nation-wide, the share of work trips both beginning and ending in the suburbs, for instance,increased from 38 percent in 1970 to 52 percent in 1990. Traditional commuting paths arebeing replaced by a patchwork of radial, crosstown, lateral and reverse-direction travel.Increasingly, there is a mismatch between the geometry of traditional highway, bus, and railnetworks, which mostly follow a hub-and-spoke pattern, and the geography of commuting,which seemingly moves in all directions. This has led to more circuitous trip making andincreased suburban congestion.” (p. 4)
Complicating the challenge of adequately serving suburban areas is the fact that there are anumber of different types of suburban environments, each requiring a somewhat different focus.TCRP Report 55 identified six basic types of suburban land use environments:
• “Residential suburbs, which occupy much of suburbia’s land mass, range from large-lot,single-family tract subdivisions to more compact settings, with a mixture of housing stock.

• Balanced mixed use suburbs typically feature a mixture of housing, employment and com-mercial land uses.
• Suburban campuses, which proliferated during the 1980’s, mainly comprise office parks, indus-trial estates, and low-density business centers. Most are master planned projects configuredlike university campuses.
• Edge cities, the massive suburban downtowns that blossomed throughout metropolitanAmerica in the 1980’s, feature many of the same land use mixes and sometimes match theemployment densities of traditional downtowns.
• Suburban corridors differ from many of the other operating settings in that they are linearlyconfigured, often made up of an assemblage of land uses aligned along an axial thoroughfareor freeway.
• Exurban corporate enclaves. . . is largely a 1990’s phenomenon. Research has documented theleapfrogging of new commercial developments into favored corridors and exurban frontiersin many growing parts of the country.” (p. 8)
The authors note that each of these “. . . represents a distinct operating setting that poses uniquechallenges to America’s public transit industry.” (p. 2) Hemily (Trends Affecting Public Transit’sEffectiveness: A Review and Proposed Actions) suggests that edge cities in particular actually offer“. . . a relative opportunity to transit systems. They do represent a concentration of office andretail that creates a generator for transit ridership, more so than dispersed office parks in ‘Edge-less Cities’ or strip shopping mall.” (p. 11)
Considerations in identifying appropriate types of strategies for different types of settings arediscussed in the next section.
Identifying Strategies for Different Service Environments
General Applicability
While most of the strategies aimed at increasing ridership are not tied to a specific type of set-ting or service environment, some will be more effective (or efficient) in certain environments.In particular, certain strategies (e.g., any involving fixed guideways or major capital investments)are unlikely to be cost-effective solutions in rural and small urban areas. Moreover, while moststrategies are not mode-specific, several are either inappropriate or infeasible with rail services(i.e., those related to flexible service designs).
The particular types of strategies used in each type of service environment are discussed in theremainder of this chapter and in Appendix A.
Applicability for Suburban Environments
As suggested above, addressing the needs of suburban areas represents a particular challenge—and opportunity—to transit agencies. TCRP Report 55 explains that there are “. . . two basic cate-gories of actions used to improve existing suburban networks:” (p. 10)
• Actions to modify and improve the overall suburban transit framework—These represent the firststep in mobility strategies of most suburban operators and are generally taken at a system level.They include the following:– Establishing a transit centers concept and timed transfer program and– Enhancing line haul services, express buses, and limited services.
• Actions that create supporting/complementary services—This group includes those activitiesundertaken by transit operators to enhance and complete their network. Featured among theseactions are the following:– Internal local area circulators,– Shuttle links,
Selection of Strategies 39

40 Elements Needed to Create High Ridership Transit Systems
– Subscription buses, and– Vanpools.Table 4-1 identifies which of these types of actions are appropriate for each of the six subur-
ban categories. (Examples of the different types of actions are identified in Appendix A andChapters 5 through 8.)
Developing a Family of Services
In line with the above discussion regarding different suburban environments, transit agencies areincreasingly recognizing the need for a mix of products/services. As suggested in Chapter 3, it isbecoming more and more apparent that “one size does not fit all.”Rather,a metropolitan area is likelyto be best served with an integrated network of different types and levels of service—a family ofservices targeted to different market segments and service environments. Such an approach isexemplified in the basic elements defined as part of a service restructuring study undertaken by theNiagara Frontier Transportation Authority (NFTA) in the Buffalo (NY) region in the mid-1990s:1
• Provide different services in the urban, suburban and rural areas designed to meet eacharea’s specific needs. The plan built on the existing bus and LRT network and existing transithubs, adding innovative and more flexible services to enhance collection and distributionaround an expanded group of hubs.
• Establish transit hubs at key locations throughout the region. It was suggested that the hubsinclude well-lit and weather-protected waiting areas, as well as parking and improved userinformation.
• Strengthen fixed-route services along major corridors between hubs. Performance of allroutes was reviewed, and recommendations were developed for improving service in selectedcorridors and modifying poorly performing routes or replacing them with alternative services.
• Develop local circulation and feeder services around hubs. In low-density suburban and ruralareas, flexible services using small vehicles were recommended. These included community-based circulators and services targeting specific activity centers such as shopping malls,employment centers, and college campuses.
• Introduce services targeted to particular markets. Recommended target markets includedinner city reverse commuters, groups of workers to specific employment centers, and seniorsand other transit-dependent people.
Type of Action Residential
suburbsBalanced mix-use suburbs
Suburbancampuses
Edgecities
Suburbancorridors
Exurbanenclaves
Modifications to overall framework Transit centers Express routes Limited routes
Actions creating complementary or supporting servicesFixed route circulators Route deviation circulators Demand response circulators Rail station to employment shuttles Residence to bus/rail shuttle: fixed route Residence to bus/rail shuttle: route deviation Residence to bus/rail shuttle: demand response Midday employee shuttles Subscription bus Vanpools
SOURCE: TCRP Report 55 (Guidelines for Enhancing Suburban Mobility Using Public Transportation, 1999), p. 18
Table 4-1. Matrix of suburban transit service strategies and land use environments.
1(Multisystems, Inc. et al., Transportation Restructuring Study for Western New York – Final Report, December 1997, p. 6-1.)

Selection of Strategies 41
• Incorporate supporting/complementary elements. Recommendations included expansionof the guaranteed-ride-home and employer-subsidized transit pass programs, as well asimprovements for pedestrians and accommodations for bicycles.
• Collaborate with private and non-profit organizations to enhance the effectiveness of thetransportation network. These recommendations focused on coordinating efforts withprivate and non-profit paratransit carriers and human services agency-funded transportationprograms.
Of course, providing a mix of products/services also applies to other categories of strategies/actions. For example, most agencies offer a range of fare payment options, often including oneor more discounted prepaid passes as well as multi-ride instruments (e.g., 10-ride tickets,stored-value farecards, or packs of tokens). With the properly designed mix of options andprices, sometimes incorporating strategies such as “deep discounting,” many agencies havesucceeded at generating increased ridership levels without losing revenue (or, alternatively,raising revenue without losing ridership).
Many agencies have also discovered the value of utilizing targeted marketing programs, and infact, as mentioned earlier, FTA has sponsored a series of “individualized marketing” demonstra-tions. Finally, with regard to disseminating information to riders, agencies have begun to utilizea range of automated pre-trip and real-time transit information applications to supplement tra-ditional information strategies. (Examples of the use of the various types of strategies areincluded in Appendix A and Chapters 5 through 8.)
Identifying Relative Cost-Effectiveness of Potential Strategies
Selecting appropriate strategies also requires identifying the relative costs and cost-effectivenessof the alternatives. TCRP Report 28 reviewed the cost-effectiveness of various service concepts atcontributing to ridership increases at approximately 60 U.S. transit agencies. Of the 40 conceptsconsidered, the researchers determined that 13 were effective at increasing total system ridership(see Table 4-2). The researchers conducted a preliminary assessment of the cost-effectiveness ofthese concepts, estimating the capital and operating cost “. . . for each new trip gained for a tran-sit system by each transit service concept, both initially and over time.” (p. 45) The results of thisassessment are shown in Table 4-2. The costs represented in the table are in comparison to aver-age peak-period bus service unit costs: “low” costs are roughly equivalent to the average peak busunit cost, “very low” costs are lower than the average unit cost, “moderate” costs are up to 50%higher than the average unit cost,“high”costs are up to twice the average unit cost, and “very high”translates to at least twice the average unit cost.
Based on this analysis, the authors concluded “The preliminary cost-effectiveness assessmentssuggest that some of the effective concepts are often relatively inexpensive to implement in manycases (e.g., travel training, vanpool incentives, reverse commute, and route restructuring). Othersare very expensive per ride and should be carefully considered before being implemented as away to target new markets.” (p. 49)
Cost considerations for different types of service and fare collection strategies are discussed inChapters 5 and 8, respectively. The next section reviews considerations in evaluating ridershipimpacts, including the tradeoffs with other goals and the types of measures used.
Evaluating Ridership Impacts
The first step in identifying successful examples of achieving and sustaining high ridership isdefining how to measure “success.” Achieving high ridership can be a significant challenge duesimply to the various types of external factors discussed in Chapter 2. Moreover, transit agencies
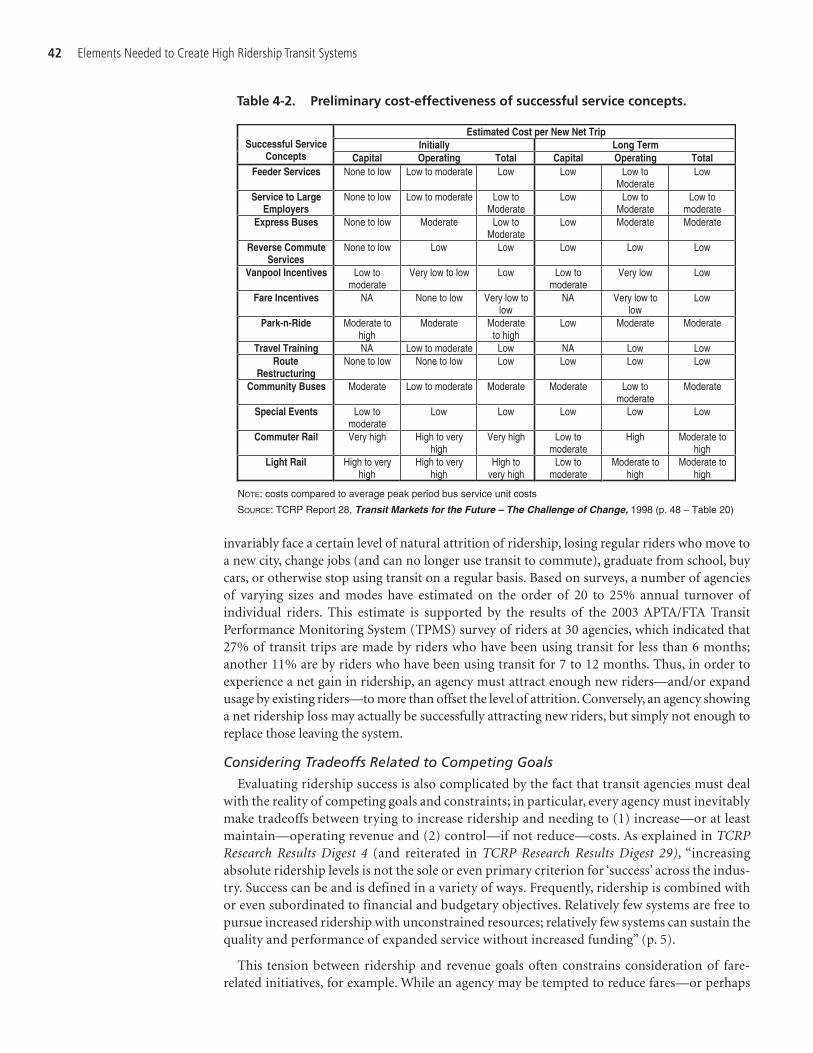
42 Elements Needed to Create High Ridership Transit Systems
invariably face a certain level of natural attrition of ridership, losing regular riders who move toa new city, change jobs (and can no longer use transit to commute), graduate from school, buycars, or otherwise stop using transit on a regular basis. Based on surveys, a number of agenciesof varying sizes and modes have estimated on the order of 20 to 25% annual turnover ofindividual riders. This estimate is supported by the results of the 2003 APTA/FTA TransitPerformance Monitoring System (TPMS) survey of riders at 30 agencies, which indicated that27% of transit trips are made by riders who have been using transit for less than 6 months;another 11% are by riders who have been using transit for 7 to 12 months. Thus, in order toexperience a net gain in ridership, an agency must attract enough new riders—and/or expandusage by existing riders—to more than offset the level of attrition. Conversely, an agency showinga net ridership loss may actually be successfully attracting new riders, but simply not enough toreplace those leaving the system.
Considering Tradeoffs Related to Competing Goals
Evaluating ridership success is also complicated by the fact that transit agencies must dealwith the reality of competing goals and constraints; in particular, every agency must inevitablymake tradeoffs between trying to increase ridership and needing to (1) increase—or at leastmaintain—operating revenue and (2) control—if not reduce—costs. As explained in TCRPResearch Results Digest 4 (and reiterated in TCRP Research Results Digest 29), “increasingabsolute ridership levels is not the sole or even primary criterion for ‘success’ across the indus-try. Success can be and is defined in a variety of ways. Frequently, ridership is combined withor even subordinated to financial and budgetary objectives. Relatively few systems are free topursue increased ridership with unconstrained resources; relatively few systems can sustain thequality and performance of expanded service without increased funding” (p. 5).
This tension between ridership and revenue goals often constrains consideration of fare-related initiatives, for example. While an agency may be tempted to reduce fares—or perhaps
Estimated Cost per New Net Trip Initially Long Term Successful Service
Concepts Capital Operating Total Capital Operating Total Feeder Services None to low Low to moderate Low Low Low to
ModerateLow
Service to Large Employers
None to low Low to moderate Low to Moderate
Low Low to Moderate
Low to moderate
Express Buses None to low Moderate Low to Moderate
Low Moderate Moderate
Reverse Commute Services
None to low Low Low Low Low Low
Vanpool Incentives Low to moderate
Very low to low Low Low to moderate
Very low Low
Fare Incentives NA None to low Very low to low
NA Very low to low
Low
Park-n-Ride Moderate to high
Moderate Moderate to high
Low Moderate Moderate
Travel Training NA Low to moderate Low NA Low Low Route
RestructuringNone to low None to low Low Low Low Low
Community Buses Moderate Low to moderate Moderate Moderate Low to moderate
Moderate
Special Events Low to moderate
Low Low Low Low Low
Commuter Rail Very high High to very high
Very high Low to moderate
High Moderate to high
Light Rail High to very high
High to very high
High to very high
Low to moderate
Moderate to high
Moderate to high
NOTE: costs compared to average peak period bus service unit costs
SOURCE: TCRP Report 28, Transit Markets for the Future – The Challenge of Change, 1998 (p. 48 – Table 20)
Table 4-2. Preliminary cost-effectiveness of successful service concepts.

Selection of Strategies 43
introduce a new low-priced pass—in an effort to attract riders, budget constraints may prohibitconsideration of such an option. Similarly, the ridership growth resulting from a service expan-sion must be weighed against the increased costs. Other types of goals that may compete withincreasing ridership include equity considerations (e.g., requiring or preventing certain types ofservice improvements or fare incentives that are targeted to certain markets) and politicalconsiderations (e.g., requiring the continuation of poorly utilized service on certain routesfavored by board members or local policymakers).
It is important to consider the impacts of these types of tradeoffs in attempting to identifysuccessful examples of achieving and sustaining high ridership. TCRP Research Results Digest 4further notes that, in light of competing goals,“success is often defined informally as minimizingthe ridership losses from measures taken to increase revenues or constrain costs” (p. 5).
Identifying Ridership Evaluation Measures
Measures that can be used to evaluate the success of ridership strategies include changes/trendsin the following:
• Systemwide ridership (e.g., increased from the previous year or continued growth—or at leastsustained levels—over several consecutive years);
• Market share of particular target markets (e.g., increased ridership among market segmentssuch as commuters, college students, or seniors);
• Per capita ridership (e.g., high level compared to other agencies within a similar type of serviceenvironment); and
• Productivity (e.g., increased passengers per hour from the previous year).
The most appropriate measure(s) in any particular instance will depend to some extent on thetypes of ridership strategies or initiatives an agency has implemented. In considering systemwidemarketing or service restructuring programs, for example, broad measures such as systemwideridership growth or high per capita ridership are appropriate. If an agency is expanding serviceonly on certain routes, however, it may be more appropriate to consider productivity measures,rather than simply looking at the total change in ridership. For, if the number of passengers perhour declines on a targeted route, a particular action may not be considered “successful” in termsof cost-effectiveness, despite an increase in absolute ridership. Meanwhile, for strategies that aretargeted to specific markets, a significant increase in that particular market share may representthe most useful indicator of the initiative’s success.
The remainder of this chapter discusses the characteristics and common elements of success-ful agency examples of use of ridership strategies.
Elements of Successful Strategies
A key aspect of this study was the identification of examples of transit agency strategies,actions, and initiatives that have proven successful at generating—and in many cases sustaining—significant ridership increases. The results of this analysis are detailed in Appendix A; the keyfindings/conclusions of this effort are reviewed below.
Characteristics of Successful U.S. Examples
Sources of Examples
As explained in Appendix A (provided on the accompanying CD-ROM), a set of 236 individ-ual strategies or projects recently utilized by 100 U.S. transit agencies to increase ridership wascompiled and reviewed. These examples came from the following sources:

44 Elements Needed to Create High Ridership Transit Systems
• Previous research—Ridership trends over the past several years were reviewed for theexamples presented in earlier studies of ridership strategies. Just over a third of the agenciesconsidered were able to produce at least as much ridership growth between 1999 and 2003 asthey had in 1994–1996. These agencies, as well as several others that experienced ridershipgains of 10% or more in 1999–2003, were included in our list of successful examples.
• FTA’s Innovative Practices for Increased Ridership database—Many of the projects reported onthis website were used in our list of successful examples.
• Other sources, including newsletter/magazine articles—Several examples were selected fromrecent articles detailing agencies’ efforts and results.
For each of the examples selected, systemwide ridership impacts between 1999 and 2003, as wellas population changes and productivity information, were provided. The review also considered,where available, the reported ridership impacts of the different types of strategies (e.g., the changein demand on a particular route or a change in market share for a particular segment). Most ofthe agencies experienced systemwide ridership growth between 1999 and 2003. However, alsoincluded were a number of agencies that did not see overall ridership gains but significantlyincreased demand or market share on a targeted route/corridor/market segment.
Nearly three-quarters of these agencies experienced systemwide ridership increases between1999 and 2003; nearly half saw gains of 10% or more, while a third had growth of 20% or more.This level of growth is noteworthy, as the transit industry overall saw less than a 2.8% aggregateridership gain during these 4 years—and a 2.3% aggregate loss between 2001 and 2003.
Types of Strategies/Actions/Initiatives Used
The agencies reviewed here reported using the full range of types of ridership strategies, andmany agencies used more than one strategy:
• Over 40% (42 of 100) of the agencies identified a combination of two or more types ofstrategies (e.g., operating/service adjustments and fare collection); 16 of these agenciesdeployed strategies from three or more categories. Moreover, 10 of the agencies that usedonly one category deployed two or more projects within that category. Over half of theagencies therefore indicated use of more than one project in an effort to boost ridership. Atotal of 11 agencies each identified five or more individual projects. The overall average wasjust over two projects per agency.2
• All of the possible combinations of types of strategies were used, with operating/service adjust-ments and partnerships/coordination representing the most common pairing. Operating/service adjustments and marketing/promotional initiatives were the second most commonpairing.
• Operating/service adjustments were the most common type of strategy, being deployed by nearly60% of the agencies (58 agencies). Nearly 40% of the agencies used partnership/coordinationinitiatives (39 agencies) and about 30% used marketing/promotional initiatives (31 agencies),while a quarter deployed fare collection/structure initiatives (25 agencies).– Among the 43 large urban area agencies, the distribution of types of strategies was
relatively even: 13—22 of each type. Operating/service adjustments were used by just overhalf of these agencies, while the other three were each deployed by 30 to 40% of theagencies.
– Among the medium urban areas, operating/service adjustments were much more pre-dominant: 76% of the agencies used operating/service adjustments, as opposed to 48%
2As noted in Appendix A, the list of strategies reviewed represented only those identified by the agencies as examples. Many ofthese agencies have actually utilized additional strategies in recent years in an effort to generate higher ridership. Thus, whileit is useful to review the distribution of different categories of strategies identified by these agencies, it is important to remem-ber that we have not assembled an exhaustive list of the ridership initiatives each agency has undertaken.

Selection of Strategies 45
using partnership/coordination, 28% using marketing/promotional, and 21% using farecollection/structure projects.
– Among the small areas, operating/service adjustments and partnership/coordinationinitiatives were each utilized by roughly half of the agencies; 21% used partnership/coordination initiatives and only 11% deployed fare collection/structure initiatives.
The distribution of the specific types of projects reported by all of the agencies is summarizedin Table 4-3. Key points include the following:
• The most widely used subcategories of actions were partnerships (47, or 20% of all projects)and routing/coverage adjustments (46 projects, or 19%). These were followed by marketing/promotion initiatives (35, or 15%). These were used considerably more than the next mostcommon subcategory, information improvements (22, or 9%). The least used were scheduling/frequency adjustments (12, or 5%) and fare structure changes (13, or 6%).
• With regard to specific types of project, the most common were university/school pass pro-grams (28 projects), general marketing/promotional campaigns (24 projects) and increased
Category/Subcategory Type of Strategy Number of Projects Operating/Service Adjustments 86Routing/coverage adjustments 46 Increased route coverage 22
Route restructuring 16 Improved schedule/route coordination 8
Scheduling/frequency adjustments 12 Increased service frequency 4 Increased span of service 4
Improved reliability/on-time performance 4 New types of service 14
Improved travel speed/reduced stops 9 Targeted services 5 Improved amenities 14 Passenger facility improvements 9 New/improved vehicles 3 Increased security 1 Increased safety 1 Partnerships/Coordination 61 Partnerships 47
University/school pass programs 28 Travel demand management strategies 13 Privately-subsidized activity center service 6 Coordination 14
Consistent regional (inter-agency) operating policies 3 Coordination with social service agencies 7 Coordination with other transportation agencies -
Promotion of transit-supportive design/TOD 4 Marketing/Promotional and Information Initiatives 57 Marketing/promotional initiatives 35 Targeted marketing/promotions 11
General marketing/promotions 24 Information improvements 22
Improved informational materials 9 Improved customer information/assistance 6
Automated transit traveler information 7 Fare Collection/Fare Structure Initiatives 32 Fare collection improvements 19
Improved payment convenience 15 Regional payment integration 4
Fare structure changes 13 Fare structure simplification 2 Fare reduction 11
Table 4-3. Frequency of use by type of project (all areas).

46 Elements Needed to Create High Ridership Transit Systems
route coverage (22 projects); these were followed by route restructuring (16 projects) andimproved payment convenience initiatives (15 projects).– Among the large urban area agencies, the most popular types of project were general
marketing/promotional campaigns (14 projects), university/school pass programs (10),and improved payment convenience initiatives (10).
– Among the medium urban area agencies, the most common types of project were increasedroute coverage (9 projects) and general marketing/promotional campaigns (8).
– Among the small urban/rural area agencies, university/school pass programs (12 projects)and increased route coverage (8) were by far the most popular types of project.
Ridership and Productivity Impacts
Beyond absolute ridership changes, it is useful to examine the impact of ridership-enhancingstrategies on service productivity.
• Two-thirds of these agencies (66 of 100) experienced reductions in productivity between1999 and 2003; this includes 41 agencies that had gained ridership during the period. Thisresulted from the fact that, while most of these agencies had increased the amount ofservice provided, the growth in demand fell short of the increase in service (revenue-vehiclehours).
• Thus, while these agencies were successful at raising ridership, their service effectiveness—and hence their cost-effectiveness (cost per rider)—was reduced somewhat. This underscoresthe need for agencies to carefully consider the tradeoff between increasing ridership andcontrolling costs.
Relationship between Types of Strategies and Ridership
Those agencies that experienced the largest percentage systemwide ridership increases between1999 and 2003 deployed strategies spread among all four categories of strategies, althoughoperating/service adjustments were most common, followed by marketing/promotional andinformational initiatives:
• Among the agencies in large urban areas, operating/service adjustments and/or marketing/promotional initiatives were utilized by the three agencies that experienced the high-est ridership gains (Pasco County, FL; Los Angeles DOT; and Tempe Transit, AZ). Amongthe 21 agencies in this category that had ridership increases of 10% or more, 14 usedoperating/service adjustments, 8 marketing/promotional efforts, 5 fare collection/structureinitiatives, and 2 partnership/coordination projects. (The types of strategies identified bythe large urban area agencies with the 10 largest ridership increases are summarized inTable 4-4.)
Type of Strategies Identified
Agency
%Ridershipchange(’99-’03)
Rides per capita(’03)
Oper. / service
Partner. / coord.
Mktng/ prom. / info.
Farecollec./ struc.
Pasco Co. Public Transit (FL) 697% 1.2 X Los Angeles DOT (CA) 272% 2.8 X X Tempe Transit (AZ) 156% 40.0 X Virginia Railway Express (VA/DC) 83% 4.7 X Fairfax Connector (VA) 59% 7.6 X X Montebello Bus Lines (CA) 48% 36.0 X Johnson Co. Transit (KS) 38% 1.4 X Ft. Worth Transportation Authority (TX) 36% 12.3 X Broward Co. Division of Transportation (FL) 36% 22.1 X Santa Clarita Transit (CA) 35% 19.4 X X
* This list covers only those agencies reviewed in this study (see Appendix A).
Table 4-4. Large urban agencies with highest ridership growth (’99–‘03).*

Selection of Strategies 47
• In the medium urban area category, the agency with the highest increase (PARTA in Kent, OH)reported operating/service adjustments only, while the agency with the second highest gain(CATA in Lansing, MI) utilized strategies in all four categories. Among the 13 agencies in thiscategory that had ridership gains of 10% or more, 9 used operating/service adjustments,7 marketing/promotional efforts, 5 partnership/coordination projects, and 5 fare collection/structure initiatives. (The types of strategies identified by the medium urban area agencieswith the 10 largest ridership increases are summarized in Table 4-5.)
• The small urban/rural agency with the highest ridership increase (Advance Transit in Wilder,VT) used strategies in all four categories, while the agency with the next highest gain (CATAin State College, PA) reported a partnership/coordination project only. The other agencythat experienced nearly 100% ridership growth (Bloomington Public Transit, IN) usedstrategies in three categories. The three agencies ranked next in terms of ridership increases(CityBus in Lafayette, IN; RTS in Gainesville, FL; and Fargo Metro Area Transit, ND) all hadpartnership/coordination projects, although one of them (CityBus) also deployed a fare col-lection/structure initiative. Among the 14 agencies in this category that had ridership gainsof 10% or more, 8 used operating/service adjustments, 8 partnership/coordination projects,5 fare collection/structure initiatives, and 4 marketing/promotional efforts. (The types ofstrategies identified by the small agencies with the 10 largest ridership increases are sum-marized in Table 4-6.)
Type of Strategies Identified
Agency
%Ridershipchange(’99-’03)
Rides per capita(’03)
Oper. / service
Partner. / coord.
Mktng/ prom. / info.
Farecollec. / struc.
Advance Transit (Wilder, VT) 170% 16.7 X X X X Centre Area Trans. Auth. (State College, PA) 101% 72.3 X Bloomington Public Transit Corporation (IN) 98% 30.0 X X X CityBus of Greater Lafayette (IN) 84% 35.8 X X Regional Transit System (Gainesville, FL) 84% 56.2 X Fargo Metro Area Transit (ND) 45% 5.1 X Santa Maria Area Transit (CA) 44% 6.2 X X Kalamazoo Transit Division (MI) 38% 15.9 X Logan Transit District (UT) 36% 18.5 X University Transport System (Davis, CA) 34% 47.6 X
* This list covers only those agencies reviewed in this study (see Appendix A).
Table 4-6. Small urban/rural agencies with highest ridership growth (’99–‘03).*
Type of Strategies Identified %Ridershipchange(’99-’03)
Rides per capita(’03)
Oper. / service
Partner. / coord.
Mktng/ prom. / info.
Farecollec./ struc.
Portage Area Regional Trans. Auth. (Kent, OH) 102% 0.8 X Capital Area Trans. Auth. (Lansing, MI) 79% 27.6 X X X X Ventura Intercity Service Transit (CA) 60% 2.8 X X Chapel Hill Transit (NC) 52% 92.2 X Interurban Transit Partnership (Grand Rapids, MI) 39% 11.2 X X Utah Transit Authority (Salt Lake City, UT) 33% 17.5 X X X X Connecticut DOT (Hartford, CT) 28% 1.5 X X Salem-Keiser Transit (OR) 28% 24.9 X Lee Co. Transit (Ft. Myers, FL) 26% 8.3 X Cape Cod Regional Transit Auth. (Hyannis, MA) 22% 0.1 X
* This list covers only those agencies reviewed in this study (see Appendix A).
Agency
Table 4-5. Medium urban agencies with highest ridership growth (’99–‘03).*

48 Elements Needed to Create High Ridership Transit Systems
Relationship between Geography/Population Change and Ridership
The geographical distribution of the highest gaining agencies (i.e., 10% or greater growth overthe 4-year period) differs markedly for the three area size categories:
• In the large urban areas, the high growth agencies are, as might be expected, concentrated inthe West Coast, South, and mid-Atlantic regions: 9 of the 21 agencies are on the West Coast(primarily Southern California), 5 are in the mid-Atlantic region (in and around Washington,DC), and 3 are in Florida; only 1 is in the Northeast, and none are in the Midwest.
• In contrast, more of the highest ridership medium urban systems (6 agencies) are located inthe Midwest and Northeast than in the South or West Coast (5 agencies).
• The majority (57%) of the highest ridership small urban/rural agencies are located in theNortheast and Midwest; only 3 are on the West Coast or South.
While population growth is clearly one of many factors contributing to ridership growth, thereis no evidence among these examples of a strong correlation between the extent of the popula-tion change and the level of ridership change:
• For the large urban areas, there is significant variation in the rate of population growthamong the highest ridership agencies; moreover, the two areas that experienced the greatestpopulation increases (i.e., Las Vegas and San Juan) actually lost riders during the evaluationperiod. Conversely, the Los Angeles area, home of six of the agencies with the highest rider-ship gains, had the smallest population growth among all of these areas.
• The three medium urban area agencies with the highest ridership increases experienced rela-tively modest population growth—or in one case, a significant loss; meanwhile, three of thehighest growth areas lost riders during the 4-year period.
• Among the small urban/rural agencies, there is even less of a correlation between popula-tion change and ridership: nearly half (8 of 15) of the areas with the largest populationincreases were not among the higher ridership gainers, while half (7 of the 14) of the agencieswith the highest ridership gains were not among the areas showing the highest populationincreases.
Per Capita Usage
As indicated above, per capita ridership represents another means of comparing agencies’ suc-cess at generating transit usage.3 Key findings related to this measure are as follows:
• More than two-thirds (68) of the 100 agencies carry 10 or more riders per capita per year;27 carry 25 or more; 11 carry 50 or more.– Among the large urban areas, there is no clear correlation between type of strategies used
and per capita ridership levels. The agencies with per capita figures of 25 or higheridentified using all four types of strategies in virtually equal numbers: 8 agencies usedoperating/service adjustments, 7 each used partnership/coordination and fare collection/structure initiatives; and 6 agencies used marketing/promotional initiatives; 6 of these 16 agencies deployed two or more types of strategies, and 5 each used three or more types.(Table 4-7 shows the types of strategies identified by the 10 highest per capita ridershiplarge urban areas.)
– Among the medium urban areas, operating/service adjustments were used by 14 of the19 agencies with per capita ridership figures of 10 or higher. The other three categories
3As discussed in Appendix A (p. A-18), while per capita ridership is a useful measure, it is strongly affected by the definitionof each agency’s service area. The service area is determined by such factors as the types of modes operated by the agency(e.g., whether it includes commuter rail) and the existence of other agencies serving the same region or metropolitan area.Thus, two agencies located in cities of comparable sizes can have rather different service area populations. This should be keptin mind in reviewing per capita figures.

Selection of Strategies 49
saw lower levels of usage: 10 agencies used partnership/coordination initiatives, 7 usedmarketing/promotional initiatives, and 5 fare collection/structure initiatives; 10 of theseagencies deployed two or more types of strategies, and 4 each used three or more types.While operating/service adjustments predominated in this group, however, the agencywith by far the highest per capita ridership used only a fare collection strategy (theelimination of fares). (Table 4-8 shows the types of strategies identified by the mediumurban areas with the 10 highest per capita ridership figures.)
– Among the small urban/rural areas, the agencies with per capita ridership figures of 10 orhigher most often deployed partnership/coordination strategies (13) and operating/ serviceadjustments (10); fare collection/structure and marketing/promotional initiatives wereused by 5 and 4 agencies, respectively. The agencies in this size category were more apt touse a single type of strategy than those in the larger areas: 7 agencies each deployed two ormore types of strategies, while 3 each used three or more types. (Table 4-9 shows the typesof strategies identified by the 10 highest per capita ridership small urban/rural areas.)
• As would be expected, the bulk of the highest usage agencies are located in large urbanareas; 7 (64%) of the over 50 group, 17 (63%) of those over 25, and 30 (44%) of those over10. However, the small urban/rural group has the next largest percentages of high usageagencies: 3 (27%) of the over 50 group, 7 (26%) of those over 25, and 19 (28%) of thoseover 10.
• The relatively high per capita ridership figures at a number of agencies in both the smallurban/rural and medium urban categories can be attributed, at least in part, to their presence
Type of Strategies Identified Rides per
capita(’03)
%Ridershipchange(’99-’03)
Oper. / service
Partner. / coord.
Mktng/ prom. / info.
Farecollec./ struc.
Chapel Hill Transit (NC) 92.2 52% X Capital Area Transportation Authority (Lansing, MI) 27.6 79% X Regional Transportation Commission (Reno, NV) 25.4 6% X Salem-Keiser Transit (OR) 24.9 28% X Ann Arbor Transportation Authority (MI) 19.8 0% X X Utah Transit Authority (Salt Lake City, UT) 17.5 33% X X X X Corpus Christi Regional Transportation Authority (TX) 16.4 (8) X X South Bend Public Transportation Corp. (IN) 16.3 (4%) X Norwalk Transit District (CT) 16.3 (5%) X Greater Bridgeport Transit Authority (CT) 16.2 (9%) X
* This list covers only those agencies reviewed in this study (see Appendix A).
Agency
Table 4-8. Medium urban agencies with highest per capita ridership.*
Type of Strategies Identified
AgencyRides per
capita(’03)
%Ridershipchange(’99-’03)
Oper. / service
Partner. / coord.
Mktng/ prom. / info.
Farecollec./ struc.
Washington Metropolitan Area Transit Auth. (DC) 299.5 10% X X MTA New York City Transit (NY) 146.8 8% X Chicago Transit Authority (IL) 127.5 2% X X X X Southeastern Penn. Trans. Auth. (Philadelphia, PA) 95.8 4% X Massachusetts Bay Trans. Auth. (Boston, MA) 85.6 10% X Tri-Co. Metro. Transit District (Portland, OR) 77.8 20% X X X King Co. Dept. of Transportation (Seattle, WA) 53.6 (1%) X Miami-Dade Transit Agency (FL) 41.5 2% X Greater Cleveland Regional Trans. Auth. (OH) 42.0 (12%) X X X X Tempe Transit (AZ) 40.0 156% X
* This list covers only those agencies reviewed in this study (see Appendix A).
Table 4-7. Large urban agencies with highest per capita ridership.*

50 Elements Needed to Create High Ridership Transit Systems
in a particular service environment: 9 of the 10 highest levels among the small urban/ruralagencies (see Table 4-9), as well as 3 of the 5 highest levels among medium urban agencies (seeTable 4-8), occur at agencies in major university towns. In addition, four of the other smallurban/rural agencies—as well as five of the medium urban agencies—with 10 or more ridesper capita feature university-oriented strategies. The large urban group also includessubstantial use of university-oriented strategies, as half of the agencies with per capita rider-ship levels of 25 or greater—and four of seven agencies carrying 50 or more—have deployedsuch strategies.
• Among those with per capita figures of 10 or more, 33 (49%) are located in the Northeast (18)or Midwest (15), and 10 are in California. The others are relatively evenly distributed amongthe other parts of the country. Among those with levels of 25 or higher, 12 of 27 (44%) are inthe Midwest (7) or Northeast (5). Among those with levels over 50, four are in the Northeast.
• Among the large urban area agencies, the highest per capita usage levels are, as expected, byand large associated with the largest—and highest ridership—agencies, and these arepredominantly older, more mature systems located in the Northeast, Midwest and mid-Atlantic regions (see Table 4-7).
• As can be seen in Tables 4-5 through 4-9, the agencies with the highest per capita ridershipfigures are not necessarily the agencies that have had the highest percentage ridershipincreases.– In the large urban group, only half of the agencies that experienced 20% or more ridership
growth (1999–2003) are among the higher per capita ridership agencies.– For the medium and small groups, this figure is 55% and 71%, respectively. In each of these
categories, though, there is considerable overlap among the agencies with the highest percapita levels: the two medium urban area agencies with the highest per capita usage levelsalso had among the four highest ridership increases; and six of the seven small urban/ruralagencies with per capita usage levels over 25 also include the agencies with the four highestridership increases.
Successful Examples from Abroad
Despite the much higher rates of transit usage outside of the United States, it was though thatinclusion of examples from abroad would provide useful information for U.S. agencies. Thus,28 selected ridership strategies, representing 17 agencies from Canada, Mexico, Europe, and SouthAmerica were included in this review (see Appendix A). Key points from the review of examplesfrom abroad are as follows.
Type of Strategies Identified
AgencyRides per
capita(’03)
%Ridershipchange(’99-’03)
Oper. / service
Partner. / coord.
Mktng/ prom. / info.
Farecollec. / struc.
Champaign-Urbana Mass Transit District (IL) 74.6 8% X Centre Area Trans. Auth. (State College, PA) 72.3 101% X Regional Transit System (Gainesville, FL) 56.2 84% X University Transport System (Davis, CA) 47.6 34% X CityBus of Greater Lafayette (IN) 35.8 84% X X Bloomington Public Transit Corporation (IN) 30.0 98% X X X Tompkins Consol. Area Transit (Ithaca, NY) 28.7 19% X X Santa Cruz Metro Transit District (CA) 24.1 (3%) X X Chittenden Co. Trans. Authority (Burlington, VT) 19.0 7% X Logan Transit District (UT) 18.5 36% X
* This list covers only those agencies reviewed in this study (see Appendix A).
Table 4-9. Small urban/rural agencies with highest per capita ridership.*

Selection of Strategies 51
Factors Influencing High Ridership
A range of elements contributes to the high transit mode share abroad, and certain factors relateto an underlying physical, economic, and political environment favoring transit that are simplynot present in most U.S. cities. These factors include very high fuel prices and densely developed(and often physically constrained) towns and cities. However, certain practices and policies usedin other countries could be given further consideration in U.S. cities. The key elements include
• Emphasis on convenient, reliable, and comfortable transit service (e.g., provision of transitpriority in mixed traffic, long spacing between stops, advanced information systems, andimproved passenger amenities);
• Policies/practices making transit competitive with the automobile (e.g., implementation ofcentral city parking limits and restricted automobile use in certain areas); and
• Comprehensive integration of land use/development policies and transit planning (e.g., for-mal rules and guidelines on making development designs and street improvements conduciveto transit service).
Types of Strategies
A set of examples of innovative transit efforts from these countries was developed. The keytypes of strategies represented were
• Bus rapid transit and other premium bus services,• Real-time traveler information systems, and• Smart-card-based regional payment systems.
The success of such strategies has led U.S. agencies to begin to adopt them in the past few years.While it is unlikely that most—if any—U.S. cities will ever be able to approach the levels of tran-sit usage found in these countries, continued expansion of the types of approaches studied herewill doubtless bolster the efforts of U.S. agencies to increase ridership.
Conclusions
The review of examples from both the U.S. and abroad has shown that transit agencies in alltypes of environment have successfully utilized a broad range of strategies to increase ridership—if not systemwide then at least within a targeted market segment, route or corridor. External fac-tors, as discussed in Chapter 2, doubtless played major roles in producing ridership change inmany of the locations studied here. Nevertheless, these agency strategies—often used in combi-nation—have apparently been key factors in their own right.
While operating and service adjustments were the most frequently used type of strategy, theseagencies have demonstrated the effective usage of various marketing and fare-related actions aswell. Moreover, partnerships and coordination with entities such as universities, employers, andsocial services agencies have proven effective at tapping key markets; university/school pass pro-grams actually represented the single most widely used strategy.
However, there is no clear evidence from this review that any particular type of strategy is sig-nificantly more effective at boosting demand than the others. These agencies identified an aver-age of just over two strategies apiece, and the largest ridership gains were attributable to differenttypes and combinations of strategies. What has become clear is the importance of each agency(1) identifying its own needs and opportunities and (2) selecting one or more strategies that itbelieves will address these needs/opportunities. As discussed in Chapter 3, this requires devel-oping an understanding of the gaps and inefficiencies in the existing service network as well ascharacteristics and service needs of different market segments. The following chapters presentguidance on selecting and implementing appropriate strategies.

52
C H A P T E R 5
Introduction
The most widely used types of strategies, actions, and initiatives aimed at increasing ridership areoperating/service adjustments. The types of strategies—and specific actions/examples—includedthis category are shown in Table 5-1. These types of strategies are generally intended to attract andretain riders by improving the quality of transit service—or by making use of transit feasible at all.Thus, each strategy should address one or moreof the following mode choice factors:
• Travel time,• Convenience,• Comfort,• Reliability,• Perceived personal security/safety, and• Perceived “image” of the system.
Guidance on the design and implementa-tion of—and agency examples of—the differ-ent types of operating/service adjustment strategies are provided below.
Design/Implementation Guidelines
As explained in earlier chapters, selecting and implementing any of these ridership strategiesrequires analysis of an agency’s service needs and opportunities. The basic planning activities andtypes of considerations for operating/service adjustments are described below. Table 5-2 presentsa checklist of the recommended steps an agency should consider in identifying and developingstrategies within this category.
Applicable Settings
As demonstrated via the examples reviewed in Appendix A, all types of operating/service adjust-ment strategies can be used in a range of service environments. However, some strategies or partic-ular types of actions are not well-suited to certain settings or modes. Table 5-3 identifies whichenvironments and modes are generally appropriate for each type of strategy; obviously, though,eachspecific action must be designed to reflect the needs and constraints of the agency’s environment.
Planning/Research Activities
As discussed in Chapter 3, changes in a region’s development patterns, population character-istics, and economic conditions can often result in gaps or inefficiencies in the existing transit
Operating/Service Adjustments

Operating/Service Adjustments 53
Type of Strategy Specific Actions/Examples Routing/coverage adjustments Increased route coverage Service expansion; introduction of local circulators; expansion into rural areas Route restructuring Reallocation to most productive rtes; revising operating strategies Improved schedule/route coordination Feeder services; timed transfers; transit centers Scheduling/frequency adjustments Increased service frequency Increased frequency on specific route Increased span of service Longer service hours (e.g., late night/weekend) Improved reliability/on-time performance Implementation of AVL, transit signal priority, transfer connection protection New types of service Improved travel speed/reduced stops Introduction of express bus, BRT, rail Targeted services University-oriented service, downtown circulator, special event/other shuttles Improved amenities Passenger facility improvements Improved bus stop/station, transit center, park n’ ride amenities New/improved vehicles Improved amenities, use of articulated buses Increased security Increased agency security presence Increased safety Promotion of safety features of vehicles
Table 5-1. Types of operating/service adjustments.
network—and can also create new service opportunities. Based on an evaluation of (1) thecurrent service design and route performance and (2) service needs and potential market oppor-tunities, an agency can thus identify appropriate operating and service adjustments that addressany existing gaps and/or serve potential new markets. As indicated in Table 5-2, the types ofplanning/design activities that an agency should consider include the following (see Chapter 3for descriptions of these methods):
• Evaluation of existing services (route- and/or system-level), to identify inefficient or problemroutes; this might include a peer agency analysis to identify performance of and strategies usedby comparable agencies;
• Analysis of markets and projected growth, to identify gaps in service coverage and the size ofcurrent and projected travel markets; and
• Market research and public outreach, to identify key market segments and the service pref-erences and propensity (of both riders and non-riders) to ride new or improved service.
Based on the findings of such efforts, an agency can then consider which types of operating/service adjustments to pursue. The types of design and performance measures that can be appliedin evaluating service are reviewed below.
Design and Performance Measures
As described in Chapter 3, various route- or system-level measures can be used to guide theevaluation of existing services and design of service improvements or new services. Examples ofmeasures that might be applied are shown in Table 5-4 (see Chapter 3 for a description of theusage of such measures).
The specific guidelines for each measure will depend on the nature of the agency’s servicenetwork and environment—and the goals/thresholds the agency has established. However, thebasic approach for increasing ridership in any system entails making adjustments to thoseroutes—or in those areas—that do not meet the designated goal or threshold level for that typeof route or service. The agency should select strategies that best address the specific service short-coming or opportunity. The types of strategies and actions that could be considered with eachtype of service deficiency or problem area are shown in Table 5-5.

54 Elements Needed to Create High Ridership Transit Systems
Key Steps/Activities Evaluation of Existing Services
Conduct system-level evaluation Examine service and ridership trends Assess system-wide performance measures Conduct peer agency review Conduct route-level performance assessment Identify design/performance measures and establish goals/thresholds Evaluate route performance according to goals/thresholds Identify deficiencies/problem areas Identify potential strategies to address deficiencies
Analysis of Markets and Projected Growth Conduct demographic and travel pattern analysis Identify characteristics of key market segments (e.g., seniors, youth, low-income households) Identify residential and employment densities Identify locations of employment and other activity centers Identify key travel patterns within area/region
Review growth projections Identify projected development patterns (office, retail, residential, other) Identify projected numbers/characteristics of households/residents Identify projected employment levels and characteristics
Market Research and Public Outreach Conduct surveys/focus groups Conduct survey of current riders (e.g., on-board/in-station) Conduct survey of non-riders or infrequent riders (e.g., telephone) Conduct focus groups of riders and non-riders Analyze results of market research Conduct public outreach/input Meet with stakeholder groups (e.g., civic, government, business, institutional interest groups) Conduct public meetings or open house sessions
Development of Ridership Strategy(ies) Select and design strategy(ies) Identify range of potential strategies Evaluate options and select most appropriate strategy or combination of strategies Design service change or new service Estimate ridership impact Identify cost impacts Estimate costs (capital, operating & maintenance) of strategy (design, implementation, operation) Estimate revenue associated with additional riders Identify net cost
Implementation of Strategy(ies) Develop implementation plan
Implement service change, new service or amenity improvement Conduct public hearings (if necessary) Procure new equipment or locate/construct new facilities (if necessary) Hire additional personnel (if necessary) Develop informational/marketing materials regarding strategy(ies) Put strategy(ies) in place
Monitor performance of strategy Identify actual ridership impact Make any necessary operational adjustments
Table 5-2. Checklist—Developing and implementing operating/serviceadjustments.

Operating/Service Adjustments 55
Mode Service Environment Type of Strategy Bus Rail Large
Urban Medium Urban
Smal l Urban
Rural Suburb CBD
Increased route coverage + + + + + + + + Route restructuring + – + + + + + + Improved schedule/route coordination + + + + + + + + Increased service frequency + + + + + o + + Increased span of service + + + + + o + + Improved reliability/on-time performance + + + + + o + + Improved travel speed/reduced stops + + + + o o + o Targeted services + – + + + + + + Passenger facility improvements + + + + + o + + New/improved vehicles + + + + + o + + Increased security + + + + + + + + Increased safety + + + + + + + +
Key: — = not applicable or inappropriate; o = applicable, but may not be cost-effective; + = applicable and appropriate
Type of Measure Definition or Form of Measure Example of Guideline or ThresholdDesign Measures Coverage Recommended spacing between routes 90% of households in high density area (>3
household/acre) should be within 1⁄4 mi. of bus rte. Span of service Days/week, hours/day for each type of service Service 7am-7pm, 5 days/week for Express Routes
Frequency of service Maximum headway for each type of service Headway not greater than 30 min. for local (non-express) routes
Travel time Comparison of in-vehicle travel time to driving time (for same distance)
Ratio of end-to-end AM peak express bus running time to auto travel time 1.5 or less
Performance Measures Productivity Boardings per vehicle-revenue hour (or boardings
per trip) 30 boardings/VRH (local service, peak), 18 (local , off-peak)
Crowding Load factor (no. of passengers at peak load pt. divided by no. of seats)
Weekday peak load factor (avg. for consecutive trips) no higher than 1.2
Reliability Schedule adherence (i.e., percent on-time, as well as percent early and percent late)
At least 90% on-time departures for weekday trips
Table 5-4. Sample service design/performance measures.
Table 5-3. Applicable modes/settings for types of operating/service adjustments.
Problem Area Types of Strategy to Consider Types of Specific Actions to Consider Coverage Increased route coverage, Improved
schedule/route coordination, Targeted services Service expansion; Introduction of local circulators, Feeder services; Timed transfers; Transit centers; Regional integration; Employer-sponsored/reverse commute service
Span of service Increased span of service Longer service hours (e.g., late night/weekend) Frequency of service Increased service frequency Increased frequency on specific rtes. Travel time Improved schedule/route coordination, Improved
travel speed/reduced stops, Route restructuring Feeder services; Timed transfers; Transit centers; Introduction of express bus, BRT, rail; New crosstown rtes
Productivity Route restructuring, Improved schedule/route coordination, Improved travel speed/reduced stops
Reallocation to most productive rtes, New crosstown rtes (eliminating the need to transfer), Introduction of express bus, BRT, rail
Crowding Increased service frequency, Increased route coverage, Route restructuring, Improved travel speed/reduced stops
Comprehensive service expansion, Reallocation to most productive rtes; Introduction of express bus, BRT, rail
Reliability Improved reliability/on-time performance, Improved schedule/route coordination
Implementation of AVL, transit signal priority, transfer connection protection; Feeder services; Timed transfers
Table 5-5. Strategies associated with types of service problem areas.

56 Elements Needed to Create High Ridership Transit Systems
Cost Estimation Considerations
Types of Cost Impacts
The cost of implementing and operating these strategies varies considerably, depending on thespecific action(s) selected.1 The key factors determining the net cost impact include the following:
• What types of capital expenditures, if any, are needed? – Some of these strategies involve physical improvements (e.g., establishment of transit
centers or enclosure of bus shelters).– Some strategies may require additional vehicles (e.g., introduction of new types of service
such as BRT) or other purchase (e.g., AVL or vehicle tracking system).• What are the operating & maintenance (O&M) cost impacts associated with the strategy?
– Strategies that involve provision of additional service will likely entail increased O&M costs(e.g., expansion of service or introduction of new services).
– Some strategies may result in overall cost savings, or at least improved efficiency and/or effec-tiveness (e.g., reallocation of existing service or improved route/schedule coordination).
– Strategies that involve replacement of low-productivity fixed-route service with flexibleservice using smaller vehicles may result in lower costs; in a few cases, agencies have nego-tiated lower wage rates for demand-responsive or small vehicle community-based servicesusing small vehicles. Contracting out such service to a private operator may in some casesreduce costs as well.2
• Can a portion of the capital and/or operating costs be covered by partnerships or additionalfare revenue? – Some strategies may be subsidized (all or in part) by partner entities (e.g., targeted services
to major employment sites, tourist attraction, and college campus or airport).– Special service to sporting events or other special events typically allows the agency to
charge higher fares than it does for regular transit service.– In some cases, a strategy may generate sufficient additional fare revenue (i.e., by increasing
ridership) to offset much, if not all, of the additional O&M cost.
Methods for estimating costs are discussed below.
Cost Estimation Methods
Clearly, an agency planning for some type of operating/service adjustment will have to calculatethe cost requirements of the specific strategy(ies) under consideration. The capital cost associatedwith a strategy can be estimated based on average industry unit costs (e.g., for new vehicles or busshelters) or may require a full engineering analysis (e.g., for construction of transit centers).
The O&M costs associated with new or expanded services can be calculated in different ways,depending on the specific type and magnitude of the strategy in question. For instance, in esti-mating the O&M cost of a new type of service (e.g., BRT or a new light rail line), the FTA rec-ommends using a resource build-up approach. Resource build-up models estimate staffing, utility,and materials resources needed for a specific unit of service supply (i.e., a “productivity ratio”),defines unit costs for these resources, and calculates resulting costs in each cost category. Essen-tially, the cost of each item or category is computed through an equation of the following form:
O&M Cost � Unit of Service ∗ Productivity Ratio ∗ Unit Cost
1An order of magnitude assessment of the cost-effectiveness of various strategies, conducted as part of a previous TCRP study,is discussed in Chapter 3; the results of this assessment are summarized in Table 3-5.2The net cost impact of private contracting will depend on a number of factors, including (1) the amount of agency expenserequired to administer and monitor the contracted service, (2) the actual contract rate and payment basis (e.g., per hour ver-sus per passenger), and (3) whether the contractor is providing and/or maintaining vehicles.

Operating/Service Adjustments 57
These factors are typically defined as follows:
• Unit of service is typically expressed in terms of vehicle-miles, vehicle-hours, peak vehicles,garages, passengers, stations, track-miles, and so forth.
• Productivity ratio is expressed as a resource-required-per-unit-of-service, e.g., operatorsper vehicle hour, mechanics per vehicle mile, or gallon of diesel fuel per vehicle mile.For new services, these ratios are typically based on figures from similar operations inother locations, although all figures must be adjusted to reflect unique local conditions, asappropriate.
• Unit costs are expressed in such terms as average annual wages and fringes per mechanic, aver-age price per gallon of fuel, average cost per kwh of electricity, and so forth. These figures arebased on local cost data to the extent possible, using national productivity data where localsources do not provide a reliable base.
The resource build-up approach will yield the most accurate cost estimates, but is more time-consuming and data-intensive than other approaches. Alternatively, the cost of expanding orincreasing the span of existing service can be estimated more simply using some type of cost allo-cation or unit cost approach. The cost allocation method distributes all of the agency’s O&Mcosts among a set of factors; the standard three-variable model typically assigns costs to vehiclehours, vehicle miles, or peak vehicles, based on the closest causal relationship. The aggregate costin each category is divided by the quantity of that category to produce a unit cost. Given the unitcosts per factor, systemwide O&M costs can be allocated to specific routes or groups of routes.Incremental costs associated with expanding existing service may also be estimated using fixedversus variable cost figures; the latter typically represents a blended unit cost, based on theagency’s current costs per hour, mile, and peak vehicle. For any of these approaches, the agencywill have to identify the requirements for annual revenue vehicle-hours and vehicle-miles, as wellas the number (and type) of vehicles.
Expected Ridership Response
The most widely used indicator of the expected ridership response to a particular type ofchange (in level of service or price) is the elasticity measure.3 As explained in Chapter 2, TCRPReport 95: Traveler Response to Transportation System Changes summarizes the results of analysesof the nature of the impacts of various types of transit actions on demand. Chapters 9 (TransitScheduling and Frequency) and 10 (Bus Routing and Coverage) of that report review elasticitymeasures and other indicators for different types of operational/service adjustments. Keyfindings of these chapters include
• “The traveler response to service frequency changes varies substantially. Ridership increasesproportionately exceeding the frequency increases they are related to have been observed,reflecting an elasticity in excess of +1.0, but not often. Circumstances where frequencyimprovements failed to attract new ridership at all are also reported. The average response tofrequency changes, including both increases and decreases, approximates an elasticity of +0.5as measured in terms of response to service quality” (p. 9-4).
• “Ridership is typically most sensitive to frequency changes when the prior service was infre-quent, such as hourly or half-hourly, and when the transit line involved serves middle andupper income areas. Where transit headways are already short, and particularly when lowerincome service areas are involved, ridership tends to be less affected by frequency changes and
3For instance, a service elasticity of “+0.5”means that a 10% increase in service would be expected to result in a 5% ridership gain.

58 Elements Needed to Create High Ridership Transit Systems
may be more sensitive to fare changes. Otherwise, ridership is typically more responsive tofrequency changes than fares” (p. 9-4).
• “The mid-range of ridership response to expansions of bus transit, either acting alone or withfare changes, is bounded by service elasticities in the +0.6 to +1.0 range. Much broader varia-tions have been reported, including instances of ridership increases in the elastic range (over+1.0)” (p. 10-5).
• “There is evidence suggestive that packages of improvements, not only better routes andschedules but also new buses and/or fare reductions, do particularly well in attractingincreased ridership. Service expansion and restructuring, in conjunction with fare reductionsor new unlimited travel pass partnerships have led to a tripling of systemwide ridership ininstances of university towns, and to substantial ridership gains in larger cities with targeteduniversities” (p. 10-5).
Of course, it is important to keep in mind that these findings are based on analyses of individ-ual systems, each having its own service and demographic characteristics.As noted in TCRP Report95, Chapter 9, “The environment within which a transit service change takes place will affect theresults, and this places a special burden on the analyst seeking to judge the transferability of trav-eler response findings from one situation to another” (p. 9-4). Thus, such guidelines should beconsidered order-of-magnitude indicators only, rather than hard and fast planning rules.
The types of operating/service adjustment strategies are described below.
Routing/Coverage Adjustments
Routing and coverage adjustments are intended to improve service efficiency, effectiveness,and/or accessibility through one or more of the following types of actions:
• Increased route coverage (e.g., service expansion, introduction of local circulators, and expan-sion into rural service areas);
• Route restructuring (e.g., reallocation to most productive routes and revising operatingstrategies); and
• Improved schedule/route coordination (e.g., introduction of feeder services, timed transfers,and/or transfer centers).
Descriptions and agency examples of these types of strategies are provided below.
Increased Route Coverage
In response to gaps in service coverage, crowding on certain routes, or the need to extend ser-vice to newly developing areas, an agency may be able to generate additional ridership throughvarious forms of increased route coverage or route restructuring. The particular type of serviceexpansion warranted will depend on such factors as the density of the area to be served, the prox-imity to major trip attractors, the predominant types of trips to be served, and the nature of theexisting route structure in the area. Examples of specific types of increased route coverage includecomprehensive service expansion and the introduction of local circulator service. For increasingcoverage or expansion into rural service areas, a variety of types of service can be considered. Thedifferent approaches are discussed below.
Service Expansion
Expansion into unserved—or underserved—areas may involve extensions to existing routes,new routes, or route branching. Branching in particular may allow an agency to provide improved

Operating/Service Adjustments 59
coverage in suburban areas while economizing on the number of buses required.While extensionsto existing routes or route branching would presumably continue to utilize fixed-route service(local or express), new service may in some cases be more efficiently provided using some formof flexibly routed service; the different types of flexibly routed service are described below. Certaintypes of new services also fall under other operating/service adjustment categories or subcate-gories (e.g., Improved Schedule/Route Coordination and New Types of Service), and are discussedunder these sections; these include, for instance, introduction of feeder services, BRT andemployer-sponsored services, and other shuttles.
Introduction of Local Circulator Service
This represents one form of new service. Such services are designed to improve mobility withina local area or to provide connections to the urban and regional bus network—and rail lines, ifpresent. Circulators can be designed to serve all types of riders and trip purposes, or they maytarget particular markets. In fact, services for the general public that operate in suburban areastypically serve senior citizens, youth, low-income travelers, and work trip commuters accessingregional services. Three basic types of circulator services can be considered: community circula-tor (fixed) route, flexible route, and demand-responsive.
• Community circulator routes—Community circulator routes are designed to serve localcommunity trips, including stops at neighborhood commercial districts, employment centers,and shopping malls. These services can also provide connections to regional bus and rail net-works. By using small buses or vans, they can travel along neighborhood streets and enterdriveways and parking lots. In some communities, these circulators may be designed specifi-cally to accommodate the travel needs of seniors and persons with disabilities, with connec-tions to senior housing and health-care facilities; these specialized services are sometimesknown as service routes. Such routes may in some cases be able to reduce some riders’ depen-dency on more expensive ADA paratransit service and would offer these individuals servicewithout requiring advance reservations. (Note that, while service routes may be effective atserving some of the ADA paratransit demand, the ADA requires that complementary para-transit be offered wherever fixed routes operate; this would include service routes.)
• Flexible routes—Flexible routes can enhance service on local circulators and have been usedin a number of suburban settings around the country. There are several variations of thisgeneral concept. For example, route deviation services have a designated route and schedule,with specified stops and scheduled time points. The vehicles are allowed to leave the routea limited number of times to pick up or drop off passengers; the service is designed to ensurethat the driver can return to the defined route with enough time to meet the schedule.Passengers may board the bus at the designated stops (or in some cases, anywhere) along theroute, or they may call ahead to request a pick-up deviation off the route, which may requirean incremental fare. Some systems direct passengers to call the dispatcher, while others equipthe operators with cellular telephones so that passengers can contact the drivers en route;advance notice requirements vary. Passengers on board may request a drop-off deviationfrom the driver while on board. Other variations of flexible routes include point deviationand checkpoint deviation. Point deviation service offers a limited number of fixed stops, butthere is no fixed route between them; this gives the driver more flexibility and reduces thetime between designated stops. However, this system may encourage more deviationrequests since it does not allow passengers to flag the vehicle between formal stops, whichsome route deviation services do. Checkpoint deviation service limits deviations to specificon-call stops rather than deviating all the way to the passenger’s curbside; this reduces theimpact of deviations on the schedule. Offering certain types of deviation on local circula-tors can help transit operators meet ADA requirements in a cost-effective manner, with lessduplicative service.

60 Elements Needed to Create High Ridership Transit Systems
• Demand-responsive services—Demand-responsive curb-to-curb service is generally knownas dial-a-ride. Such service typically provides greater coverage in an area of low density thandoes a fixed-route network, but operates at much lower productivities. Dial-a-ride for the gen-eral public has been most successful where it provides access to fixed-route bus and rail ser-vices. Other factors that contribute to success include well-defined service zones and operatingrules that help create cost-effective services. Dial-a-ride does not require complementary ADAservice, but it effectively substitutes for it by providing paratransit for all riders.
Expansion into Rural Service Areas
For rural areas, several different types of service might be considered. Rural service conceptsinclude planned demand route, rural demand-responsive service, and volunteer ridesharing,described below. In addition to these services, vanpools and other ridesharing services wouldserve work trips, as described in separate sections. The basic concepts are as follows:
• Planned demand routes—Planned demand bus routes are designed to maximize servicecoverage given the scarce resources in low-density, rural areas. Since many of the users of ruralpublic transportation are retired senior citizens, they can often plan their travel to match theservice schedule. Planned demand routes—which can operate as fixed-route or route deviationservices—are scheduled to serve selected towns and activity centers on different days of the week.
• Rural demand-responsive service—Because rural population tends to be distributed over alarge area, demand-responsive service can be a more effective means than fixed-route serviceto meet local transportation needs. Demand-responsive or dial-a-ride service can be pro-vided with a taxi, van, or small bus. Passengers are typically required to make reservations,although the advance notice requirements could vary from 20 to 30 minutes (like a taxi) to24 hours or more (like many paratransit services). Dial-a-ride services can be designed totransport passengers curb-to-curb between origin and destination or to provide connectionsto regional fixed-route buses. Rural dial-a-ride would be similar to suburban dial-a-ride, butwith some different characteristics, such as a longer advance notice requirement and a slowerresponse time.
• Volunteer ridesharing—Volunteers have long been a resource in providing a variety of services,including transportation in rural areas. One option for expanding on volunteerism is to establisha pool of funds to be used for mileage reimbursement for volunteer drivers who use their ownvehicles to transport passengers. Other program costs would be associated with administration,additional insurance coverage, and volunteer recognition. A key to the success of volunteerprograms is providing organizational support, including training, enforcement of safety policies,coordination, supervision, and recognition of volunteer efforts. A volunteer program mightbe easily integrated with other mobility coordination and rideshare services. To capitalize onvolunteerism, it may also be best to maintain a social services agency as a sponsor or co-sponsor.
Estuary Transit District (ETD)Shoreline Shuttlerural area (under 50,000)
The Estuary Transit District, based in Old Say- brook, CT, replaced a costly and underperform- ing leg of its fixed route service with a point deviation shuttle service in 1996. The shuttle has designated stops with fixed times, but also allows for off route stops to be scheduled up to the same day, within a reasonable distance ofthe route. This has proven to be a very effective way of providing transit for seniors and persons with disabilities in the area. Shuttle ridership is currently 2 to 3 times higher than that of the old fixed route, and sees an annual growth of 10%.

Operating/Service Adjustments 61
Route Restructuring
Another type of routing/coverage adjustment is route restructuring, which might include, forinstance, reallocation of service to most productive routes or revising operating strategies. Asdefined in TCRP Report 95 (Chapter 10), “Restructuring is the strategy of reworking an existingbus network to rationalize or simplify service, accommodate new travel patterns, reduce routecircuitry, ease or eliminate transfers required for bus travel, or otherwise alter the service con-figuration. Restructuring may include through routing of separate bus routes, realignment andrecombination of routes, and the provision of trunkline, crosstown, express, and feeder services,generally in the context of a cohesive systemwide service plan.” (p. 10-2)
Rationalization of bus services in specific areas should begin with a close examination ofthe ridership and operating statistics—specifically productivity, load profiles, span, andfrequency by time of day (see Chapter 3). Using schematic maps and available stop-by-stopboarding and alighting data, relatively strong and weak segments of existing routes can beidentified. Routes can be classified according to their broad function, such as line-haul,feeder-distributor, and local circulator. In some cases, routes serve multiple functions simul-taneously or change their functions during the course of the day; these nuances need to berecognized.
An agency may wish to establish a set of principles or guidelines to apply to its routes in con-sidering restructuring opportunities. An example of the types of principles that could bedeployed is as follows:
• Line-haul routes ought to be as direct as possible while still serving areas that generate highnumbers of transit trips.
• Line-haul routes should stay on arterials and other major streets to the extent possible.• One-way travel times for line haul routes should generally be less than 60 minutes to make
schedule adherence easier.• Circulator routes may follow circuitous routings in order to provide maximum coverage; the
area covered by the route should be small, however, so that total one-way travel time is lessthan 30 minutes.
• Circulator routes can penetrate deep into neighborhoods if small vehicles (less than 30 feet inlength) are used.
• A single route should not attempt to serve too many markets or serve too many functions;routes operate more efficiently and effectively when they have an identifiable focused marketand purpose.
• Flexible-service routes may be more appropriate for areas with household densities below thethreshold of three households per acre identified in the Transit Capacity and Quality of ServiceManual.
City of Los Angeles, Department of Transportation (LADOT) DASH - Intracommunity Transit Changing to Meet Changing Need large urbanized (over 1,000,000)
In recent years, the L.A. Department of Trans- portation has seen the bulk of its ridership growth come from its community circulator program. The circulators provide a low-cost option for low- income, transit dependent residents. There is a process of routine monitoring of service in place, to ensure that changing travel needs are consis- tently met. This flexibility allows routes to be restructured as needed. Ridership increased 6.2% from 2002 to 2003.

62 Elements Needed to Create High Ridership Transit Systems
• Overlapping routes should be avoided, except in the following circumstances:– Two or more line-haul routes with moderate frequency and a common terminus share a
common segment beginning at that terminus; in such a case, the schedules should be coor-dinated to provide an effective headway that is twice as good as the routes individually.
– A line-haul route with limited-stop service is overlaid on a local service route.– The routes sharing the overlapping segment operate at different times of day or serve
different functions and can meet productivity standards.– There is only a single feasible roadway connection between two points, or a secondary
routing that would generate no ridership.• Routes should have consistent and understandable patterns at all times of operation.• Doubling back and retracing steps should be avoided whenever possible.• Transit centers can increase mobility in suburban areas by facilitating transfers between higher
frequency, shorter routes that would replace low-frequency direct routes.
Of course, principles such as these are general in nature and must be applied with care, takinginto account any special or unusual features of the subject area. Application of such principles toan area may result in a range of restructuring service strategies, including
• Splitting long routes;• Straightening line-haul routes;• Shifting coverage from line-haul routes to circulator routes;• Separating overlapping routes onto different streets;• Removing instances of doubling back;• Consolidating route patterns (or routes within a line);• Consolidating service along a segment into one line where service is now split among two or more;• Eliminating very low productivity routes (less than 10 boardings per vehicle revenue hour)
and reallocating resources elsewhere; and• Restructuring service around new transit centers (and extending routes to reach new activity
centers and to improve overall connectivity).
Overlapping and/or duplicative services may offer opportunities for improving efficiency,making service less confusing for passengers, and freeing up resources that could be used moreproductively elsewhere in the service area.
Grand Rapids Interurban Transit Partnership - The Rapid (ITP) Productivity Measures/Route Restructuring 'medium urbanized (200,000 - 1,000,000)
The Rapid, in Grand Rapids, Michigan, has devel- oped a comprehensive route evaluation system that produces monthly statistics for each bus route, in- cluding farebox recovery ratios and passengers per mile, hour, and day. The measures are used in a formula that assigns scores to each route on a monthly, as well as an annual basis. Staff members monitor each route on a regular basis; thus, low- performing segments are continually reviewed and improved. System ridership increased more than 4% between 2002 and 2003.
Improved Schedule/Route Coordination
Another general approach to improving an area’s service coverage and thereby increasingattractiveness to riders is improved schedule/route coordination. In a service area with dispersedorigins and destinations—as characterizes most regions today—this may involve, for example,establishing an integrated service network featuring feeder services (to line-haul routes) and timed

Operating/Service Adjustments 63
transfers, perhaps focused on a series of transit centers. Such a structure can help to addresscoverage, travel time, productivity, crowding, and reliability problems in an existing network.The key elements of this approach are discussed below.
Feeder Services
A key element of an integrated “hub and spoke”service design is local feeder routes that collectand deliver riders to a line-haul bus route or rail line. Such routes may also serve as communitycirculators, or they may simply provide a direct connection between a key residential or employ-ment center and the bus transfer point or rail station. The latter strategy is often referred to as ashuttle service.
Housatonic Area Regional Transit District (HART) Harlem Line Shuttle Services small urbanized (50,000 - 200,000)
HART, based in Danbury, CT, operates two shuttle services that deliver riders to stations along MTA Metro-North rail lines. This service helps Connecticut commuters bypass limited parking to reach trains heading into New York City. The service is timed to meet the most popular trains and was planned jointly by the Con- necticut and New York Departments of Transportation. The first shuttle consistently sees annual ridership increases of over 20%, and the second has enjoyed rapid success as well.
Timed Transfers
In an effort to minimize transfer wait times between connecting routes, agencies sometimesuse timed transfers. Timed transfers are often designed to occur at transit centers, although thisis not necessarily the case. Transfers may involve connections between a trunk route/line andlocal feeder routes at different stops or stations—or, especially in smaller cities, all routes may bescheduled to meet at a single transfer pulse point. As noted in TCRP Report 95 (Chapter 9),“Theconnecting transit routes must be designed within route running time parameters that facilitatetimed transfer scheduling. Route length, traffic conditions and passenger activity determine runtime, and run time determines ability to make a complete bus trip and still maintain timed trans-fer meets and bus layover time requirements.” (p. 9-17)
Transit Centers
Transit centers—also sometimes known as hubs—are designated locations where passengerscan access transit or transfer conveniently between modes. These modes might include rail, localbuses, express buses, private and not-for-profit buses and vans, local circulator services usingsmall buses or vans, paratransit service, automobiles, and bicycles. Transit centers, in conjunc-tion with timed transfer operating policies, can be used to facilitate route connectivity andimprove the overall level of service in an area.
A transit center-based system has the advantage of accommodating multi-centered anddispersed population and employment concentrations by connecting a very large number ofpossible origin-destination pairs through transfers at a few convenient, comfortable, well-littransit centers. These centers are typically connected by a network of direct, frequent principalroutes. Other routes provide the remaining coverage of the service area and connect to one ormore centers. Because routes are focused on the transit centers and transfers are convenient,there is less need for overlapping routes and the number of routes can be kept to a minimumallowing service to be more frequent than it could be with a system comprised of a larger num-ber of routes. The frequency of service, in turn, makes transferring less onerous for riders.

64 Elements Needed to Create High Ridership Transit Systems
Transit center functions range from facilitating operations by providing off-street layoverspace to supporting large numbers of transfers between automobiles and transit and betweendifferent transit services. A transit center serving local routes may have simple bus pull-outs,shelters, and detailed system information. Large-scale regional transit centers, in turn, can beregional focal points for the transit system and may include large-scale bus facilities, large-scaleparking facilities, additional passenger services, and information and may also be foundationsfor joint development.
The ideal location and design concept for a transit center will vary as a function of its intendedpurpose. For example, transit centers that provide park-and-ride access to express commuter busservices must relate well to freeways and other major highways, especially those with HOV orbus-only lanes. Other transit centers exist primarily to facilitate transfers between different buslines by providing a convenient, safe, secure, and attractive transfer environment. Having ade-quate space and good street and highway access and being at the focal point of many differentservices will be of paramount importance to this type of transit center. The criteria typically usedto site transit centers are outlined below. The relative emphasis placed on the different criteriadepends on the particular function of the transit center:
• High activity location—One of the keys to a transit center’s success is being sited in a highactivity location. These locations can provide a focal point for transit-oriented developmentand often generate their own transit trips. Examples of this type of location are regionalshopping centers/edge cities, traditional downtowns, suburban commercial concentrations,hospitals, and inter-city rail and bus stations.
• High transfer volumes—Ultimately, a transit center is a transfer point of some kind, whetherthat transfer is between automobiles and a rail line, between buses and rail, among two or morebus lines, between local transit and intercity bus and/or rail, or between pedestrians and bus.A transit center should be located where high numbers of passengers currently transfer or areexpected to transfer. This would be at the intersection of many routes and modes serving dif-ferent markets and functions.
• Accessibility to adjacent communities and the transportation system—A successful tran-sit center must be accessible to all modes, including pedestrians, bicycles, automobiles(especially for those centers that have a park-and-ride or kiss-and-ride element to them),and neighborhood circulators. For a transit center that will be predominantly servingautomobile access trips, high visibility from, and easy access/egress to, major roadways isimportant.
• Safety and security—A sense of security both for passengers and for parked cars and bicyclesis essential.
• Transit center spacing—The spacing of transit centers will be dependent on the type ofservice structure and markets they are meant to support. If the purpose is to support a systemof timed transfers, two key factors will play a role in their location. The first is that the transitcenters should be spaced at equal intervals, based on bus run times, ideally 30 minutes apart.A second factor is that its catchment area must have sufficient population and commercialdevelopment to support a reasonably high level of transit service through or originating at thecenter. General population standards would be a minimum of 25,000 residents within thelocation’s catchment area. Closer spacing than that suggested by the above criteria may beappropriate where the arterial grid is more closely spaced together, where there is a regionalmedical facility or university or a mega activity center or edge city.
• Relationship to congestion on the highway system—A transit center that is also a park-and-ride facility should be located in an accessible environment outside the point where highwaycongestion in the peak direction starts. It should also have a catchment area that represents 10to 15 minutes’ drive time to the center, adequate population to support express commuter bus

Operating/Service Adjustments 65
services in the peak period (assuming a reasonable work mode share), and demand for off-peak service at policy headways.
Because of the different functions transit centers play and the wide range of physical charac-teristics at potential transit center sites, identifying a single set of design elements that should beapplied throughout a region may not be feasible. However, it is possible to identify a range of pos-sible facility elements that could be incorporated into each transit center based on the center’sspecific function and site capabilities. These elements may include, for example
• Off-street bus bays—If feasible at a proposed site, off-street bus bays can provide a more com-fortable and efficient boarding area for riders and a layover space that does not negativelyimpact local traffic operations or create undue negative environmental impacts (e.g., noise andexhaust fumes) on adjacent land uses.
• Sheltered waiting areas—Sheltered waiting areas are an essential means of improving theriders’ overall transit experience. The design of these shelters can contribute to making thetransit center a focal point for the transit system and to the overall transit system identity.
• Pedestrian and bicycle access—A transit center, especially in an urbanized area, should be anintegral part of the pedestrian and bicycle circulation system. Safe and convenient walk andbicycle access to the transit center, including bicycle parking, will be essential to the center’ssuccess.
• Dynamic signage/information—Detailed information on transit options, service frequen-cies, and scheduled arrival times should be provided. Real-time information is also recom-mended. At larger transit centers and park-and-ride facilities, a kiosk could be used to providetimetables, system maps, and pass sales.
• Parking—Whether parking should be included at a transit center is directly related to thefunction each center will be serving. Parking is not recommended at transit centers servingheavily developed urbanized areas, but is recommended at transit centers that would supporthigh performance service, such as long distance express or BRT and generally would have amajority of riders who access the transit center via automobile.
• Kiss-and-ride and taxi facilities—These facility elements are another key component in sup-porting a transit center that is truly intermodal in nature.
• Other amenities—Depending on the scale and purpose of the proposed transit center, otheramenities, such as public telephones, vending machines, newspaper machines, and in someinstances, a small news and candy stand, may be considered.
Transit center-based systems can attract new riders in markets that have traditionally not beenwell served by transit. Such systems also can help develop new markets by providing access tojobs and other activities for transit-dependent populations that previously lacked such access.Such systems can improve service for some current transit users through improved frequency ofservice and by providing much more appealing environments for making transfers. Even forthose current riders who would be faced with an additional transfer, that transfer would be madeat a comfortable, well-lit transit center.
Scheduling/Frequency Adjustments
These types of revised operating strategies are typically deployed in an effort to seek a betterbalance between the demand for and the supply of service:
• Increased service frequency (e.g., increased frequency on specific routes) or increased span ofservice (e.g., longer service hours) and
• Improved reliability/on-time performance (e.g., implementation of AVL, transit signal prior-ity, or transfer connection protection capability).
Descriptions and agency examples of these strategies are provided below.

66 Elements Needed to Create High Ridership Transit Systems
Increased Service Frequency and Increased Span of Service
Adjusting headways (i.e., the amount of time between vehicles) to respond to differences in routeproductivity and passenger loading is a common response to routes with low productivity. Servicefrequencies may be increased to alleviate crowding or to fill in service gaps—or they may bedecreased to boost productivity. The span of service may be adjusted by adding (or subtracting ser-vice hours) each day—or by introducing (or removing) service on a particular day of the week (e.g.,Sunday). A typical service span change is to add late night service, sometimes called “Owl” service.
Increased Frequency
Based on an evaluation of routes against a set of measures and thresholds, an agency can deter-mine the need for frequency improvements. For example, as discussed in Chapter 3, an agencymay establish a goal of all routes operating every 15 minutes in the peak and every 30 minutes inthe off-peak in the urban areas, and perhaps every 30 minutes in the peak and every 60 minutesin the off-peak in suburban areas. This will result in shortening headways on some routes; in somecases, though, reducing the headway will cause a route to have a lower-than-acceptable produc-tivity. The agency may in that case decide not to change that route’s frequency.
Portland TriMet designed an entire ridership programaround increasing service frequency on major bus lines.The Frequent Service initiative was inaugurated in the late1990’s, and the frequency adjustments have been coupledwith improved amenities (see Exhibit 5-1) and improvedcustomer information systems; the initiative was alsoaccompanied by an extensive marketing and promotionaleffort.
Extended Span of Service
Improvements to service span should also be identifiedbased on an evaluation of routes against a set of measuresand thresholds. An agency may decide, for instance, toextend service later into the evening, earlier in the morning,and/or on Saturdays and Sundays.Ridership potential asso-ciated with extensions can be estimated based on the pro-ductivity of the service in the nearest time period withservice. As with frequency increases, though, in cases wherean extension to a particular route would not meet the rid-ership or productivity threshold, the agency may decideagainst an extension to that route.
Greater Bridgeport Transit Authority (GBTA)Route #11 Frequency Improvement medium urbanized (200,000 - 1,000,000)
In 2001, GBTA learned of a strong rider de- mand for more frequent service on its Route #11, which connects downtown Bridgeport with a large commercial area. Using funding from a local access to jobs collaborative, the Authority ran a trial, increasing service from hourly to 30-minutes during peak periods. This adjustment quickly attracted new riders and was made permanent.
Exhibit 5-1. TriMet FrequentService bus stop sign.

Washington Metropolitan Area Transit Authority (WMATA) Extended Late Night Weekend Hours on Metrorail large urbanized (over 1,000,000)
WMATA utilized funding from the District of Colum- bia to run a trial expansion of Metrorail hours, ex- tending the closing hour from 2 to 3 AM on Satur- day and Sunday mornings. The trial program, which ran for 18 months, was projected to draw an additional 3,000 riders to Metrorail during the extra hour. In reality, performance exceeded these ex- pectations by 20%. The WMATA Board has pro- posed to make the extension permanent.
Operating/Service Adjustments 67
Improved Reliability/On-Time Performance
Reliability and on-time performance are clearly important aspects of transit scheduling andperformance, as they affect passenger wait time, delay, and uncertainty. Reliability is measured interms of schedule adherence (i.e., percentage of trips that are on time, as well as percentage earlyor late, compared to the scheduled arrival/departure times; missed vehicle trips are also included).
Transit reliability problems can stem from “environmental” factors such as traffic signals andchanges in traffic conditions, as well as from fluctuations in boarding and alighting times. How-ever, operator and vehicle availability can also affect reliability on any given route and day.Improving reliability and on-time performance may therefore require a combination of strate-gies; these may include improved scheduling (i.e., to ensure that there is sufficient running timefor a route and account for fluctuations in both traffic and transit usage), as well as various tech-nological enhancements. Technology-based strategies include the following:
• Automated vehicle location (AVL)—AVL is the backbone of several other types of strategiesthat can improve operations and customer service (e.g., transfer connection protection andreal-time information system). Combined with specific design strategies, such as splittingroutes, agencies that have deployed AVL systems have reported as much as a 25% increase inon-time performance.
• Traffic signal priority (TSP)—This technology can be deployed on specific streets or corri-dors to improve service reliability (i.e., by allowing the transit vehicle to extend or advancegreen light times or to allow left turn “swaps.”) TSP also has the potential to improve traveltimes for BRT and other limited stop routes by ensuring that the vehicle stays on schedule. Thisstrategy requires coordination with the city’s traffic department, as intersections must haveTSP-capable equipment.
• Transfer connection protection (TCP) capability—Once AVL is deployed on an agency’sbuses, TCP capability can be deployed to ensure that passenger transfers are protected; this
Saint Cloud Metropolitan Transit Commission - Metro Bus (SCMTC) Transit Signal Priority Deployment small urbanized (50,000 - 200,000)
Using funds from a Minnesota DOT ITS initiative, St. Cloud MTC explored transit signal priority tech- nology as a solution to on-time performance and schedule adherence issues. The results of a one- route pilot study showed that TSP did indeed improve performance, as well as customer satis- faction. The study determined that buses with increased on-time schedule adherence produce a stronger likelihood of rider retention and potential growth through an increased competitiveness with the automobile.

68 Elements Needed to Create High Ridership Transit Systems
will improve service reliability from the passenger’s perspective. TCP also facilitates the split-ting of routes, creating a more seamless environment for transferring passengers. Passengersmay accept transfers more readily once TCP functionality is deployed. TCP might be consid-ered in particular on routes with low frequency of service and a high number of transfers. Ina multi-agency region, TCP capability can also be considered to include inter-agency trips.
In addition, other intelligent transportation system (ITS) applications that provide real-timeinformation to passengers can minimize the uncertainty associated with on-time performance;these applications are discussed in Chapter 7.
New Types of Service
Several strategies involving the introduction of new types of service might be considered in aneffort to improve service attractiveness and possibly cost-effectiveness; these strategies include
• Improved travel speed (e.g., introduction of express bus, BRT, and rail); and• Targeted services (e.g., university campus-oriented service, downtown circulators, or other
special purpose services).
Descriptions and agency examples of these types of strategies are provided below.
Improved Travel Speed
New types of service such as express bus, rail, or bus rapid transit (BRT) offer the potential togenerate additional ridership by improving service coverage, reducing travel time, reducingcrowding, and improving reliability. These strategies are discussed below.
Express Bus Services
Opportunities for new express bus service can be identified through a standard service evalu-ation process, including a review of changes in development patterns, demographics, and travelpatterns within the area or region. In particular, travel patterns from suburban residential areasinto the CBD or to major regional employment centers should be analyzed to identify potentialmarkets for limited-stop, higher speed service.
One key to making express service cost-effective is to avoid empty deadheading of the vehiclesback to the origin areas by identifying reverse commute markets that can use the services in theoutbound direction. Express services can help meet the commuting needs of city residents work-ing in suburban areas. An agency may therefore find it useful to work with employers and devel-opers—both downtown and suburban—to develop express services; employer-sponsoredservices are discussed in Chapter 6, Partnership/Coordination Initiatives.
Rail Service
New rail services (i.e., heavy, light, and commuter rail) require sufficiently high demand withinone or more well-defined corridors to be effective. Agencies typically consider the viability ofhigh-capacity modes (i.e., rail and BRT) through an alternatives analysis or corridor study. Thereare a limited number of U.S. cities with the population densities and development/travel patternsto support heavy rail, and all of these cities already have such systems. Thus, while a number ofthe existing systems have expanded their rail lines in recent years, there have been only a coupleof new heavy rail systems implemented in recent years (Los Angeles’ Red Line and San Juan’s TrenUrbano). The vast bulk of the new rail systems built over the past couple of decades—or nowbeing developed—are either light rail or commuter rail. In fact, several cities (e.g., Dallas, LosAngeles, and Seattle) have introduced both light and commuter rail lines in recent years.
Several other forms of rail service have also been implemented in limited numbers; these includedowntown people mover (i.e., Miami, Detroit, and Jacksonville), monorail (i.e., Las Vegas and

Operating/Service Adjustments 69
Seattle), cable car (i.e., San Francisco) and inclined plane (i.e., Pittsburgh). However, these modesare typically focused on a specific limited area (e.g., downtown) and tend to be relatively short inlength. An exception is the new monorail currently being developed in Seattle; the first line of whatis envisioned as a larger regional system is planned to be approximately 14 miles long and is seenas carrying the full range of types of passengers, including commuters as well as visitors to the city.
New light rail systems have been shown to be capable of generating significant ridership growth.While a certain portion of their demand is simply shifted from bus service (i.e., routes that havebeen restructured, truncated, or eliminated in favor of the new rail line), there is widespread agree-ment within the transit industry that rail attracts certain discretionary riders who would not ridea regular bus; this rail preference is attributed to characteristics such as a clearly identifiable routeand stops (and these are typically protected to a greater extent than are bus stops), as well as larger(and often more comfortable) vehicles. In fact, BRT, described below, represents an effort to createa bus service mode that has many of the characteristics typically associated with rail.
Bus Rapid Transit
BRT, also sometimes known as rapid bus, is a flexible, rubber-tired form of rapid transit thatcombines stations, vehicles, services, running way, and ITS elements into an integrated system witha unique identity. BRT includes a variety of features to minimize travel time and maximize con-venience for passengers. These features may include signal priority, dedicated right-of-way, auto-mated and off-vehicle fare collection, automated information systems, level boarding, modernvehicles, and stations/bus shelters with enhanced amenities. Buses can be painted with special
graphics to provide a system identity consistent withthe rest of the given line’s stations, running ways, etc.The concept of a unique identity is an important ele-ment of BRT, just as a rail line has an identity thatmakes it stand out from the local bus network. Phys-ical improvements to help provide this identityinclude unique bus shelters (see Exhibit 5-2), specialmarkings in the street such as a painted traffic lane orbus pad area, unique vehicles, unique signage, anddetailed schedule/route information (including real-time information) at the station/stop.
Running way improvements for BRT applications may include exclu-sive right-of-way (see Exhibit 5-3) or improvements to enhance roadwayoperations where exclusive right-of-way is not available.BRT applicationsare designed to be appropriate to the market they serve and their physi-cal surroundings and can be incrementally implemented in a variety ofenvironments, from rights-of-way totally dedicated to transit (surface,elevated, underground) to mixed traffic rights-of-way on streets andhighways. Guided rubber-tired systems—which require less lane-width—make exclusive lanes more feasible and have been implementedoverseas.
In virtually every fully integrated, full-feature BRT application to date,customer, community, and developer acceptance is comparable to thatof any high-quality rapid transit mode such as light rail. As indicated inthe description below, for instance, implementation of Metro Rapid inLos Angeles has resulted in substantial increases in total corridor busridership.4
Exhibit 5-2. Los Angeles’ RapidBusBRT station.
Exhibit 5-3. Exclu-sive lane for BRT inRouen, France.
4For extensive description of BRT characteristics and examples, see the following recent reports: TCRP Report 90, Volume I:Case Studies in Bus Rapid Transit (2003) and Vol. II: Bus Rapid Transit – Implementation Guidelines (2003); and FTA, Charac-teristics of Bus Rapid Transit for Decision-Making (2004).

70 Elements Needed to Create High Ridership Transit Systems
5These examples are all included in our database of examples, discussed in Appendix A and Chapter 4.
Los Angeles County Metropolitan Transportation Authority (LACMTA) Metro Rapid large urbanized (over 1,000,000)
In 2000, LACMTA implemented the Metro Rapid Program, which placed bus rapid transit (BRT) service in several of the Los Angeles area’s busiest corridors. The new buses used traffic signal priority, reduced stops, and head- way-based (rather than timetable-based) sched- ules to reduce passengers travel times by up to 29%. In the Wilshire-Whittier and Ventura Blvd. corridors, bus ridership has increased by 20% and 50%, respectively, since the implementa- tion of BRT. Significantly, up to one third of BRT riders were previously not transit users.
Targeted Services
Services targeted to specific market segments or service areas can be effective at generating addi-tional ridership. There is a wide range of targeted services, including employer-sponsored shuttlesand reverse commute services, university campus services, downtown circulators, airport shuttles,and special event shuttles.As these services are often subsidized—all or in part—by partner entities,this category overlaps with the Partnership/Coordination Initiatives category. Employer-sponsoredservices are discussed in that chapter; examples of other targeted services are described below.
University Campus-Oriented Service
Transit agencies in a number of locations provide services that focus on major universitycampuses. In fact, as noted in Chapter 4 and Appendix A, agencies that serve major universities tendto have significantly higher per capita ridership figures than do other comparably sized areas. In somecases, the campus service dominates the overall system, while in others, the campus routes representone element of a larger transit system. Examples of the former type of arrangement include agen-cies operating in Chapel Hill (NC),Gainesville (FL), State College (PA),and Champaign-Urbana (IL).Examples of the latter approachinclude agencies in Lansing (MI),Grand Rapids (MI), Lancaster(PA), Lafayette (IN), and Portage(OH).5 In some systems, the tran-sit agency operates the campus-oriented service under contract tothe university; in Lansing, for in-stance, CATA entered into a con-tract with Michigan State Uni-versity in 1999 under which theagency took over the formerly inde-pendently run MSU campus ser-vice; see Exhibit 5-4. (Of course,many transit agencies also have fareagreements with local universities;in fact, university pass-type ar-rangements represent the single Exhibit 5-4. CATA MSU campus route.

Operating/Service Adjustments 71
most common type of initiative instituted by the agencies reviewed in this study. These programsare discussed in Chapters 6 and 8, Partnership/Coordination Initiatives and Fare Collection/Struc-ture Initiatives.)
Downtown Circulators
While transit service is often focused on downtown areas, the existing routes are typicallydesigned to get people in and out of these areas; many cities lack an efficient circulator systemfor moving people around within the downtown. A well-designed and appropriately priceddowntown circulator service can address a number of travel needs, including improving bothvisitor and downtown worker mobility. Such a service can also reduce traffic congestion, improveair quality, and support economic development in the downtown. An examination of downtowncirculators in nine U.S. cities conducted as part of a feasibility study for a new service in Wash-ington, D.C., led to several conclusions regarding the design and implementation of circulators:6
• Direct, fast, and reliable service is an important factor in attracting the downtown workermarket. Several circulators offer peak service every 5 minutes and the majority operate at leastevery 10 minutes.
• Circulators should be low cost. Four of the nine circulator services reviewed are provided freeof charge. The remainder charge much less than a regular transit trip, with the highest at $0.50.
• Unique-looking vehicles are important in attracting the visitor market. Some operators haveopted for the unique look of diesel-powered trolleys, while the rest have gone with compressednatural gas (CNG), electric, or hybrid engines on low-floor buses that have a more innovativelook. None use conventional diesel buses.
• The public must be provided with adequate information about the service.
The downtown circulators included in the above study were in Austin, TX (‘Dillo routes);Chattanooga, TN (Downtown Electric Shuttle); Dallas, TX (M-Line Trolley Bus); Denver, CO(16th Street Mall Shuttle); Los Angeles (Downtown DASH routes); Miami Beach (Electrowave);Milwaukee, WI (Transit Trolley); Oklahoma City (Spirit Trolley); and Orlando (Lynx Lymmo).The number of circulator routes varies among these systems: four have a single route, while thegreatest number of routes is six (Los Angeles and Oklahoma City). All routes are less than 8.5 miles in length, with most around 3 miles round trip. Most of these agencies reported thattheir ridership is a mix of downtown workers, conventioneers, residents and visitors. The agen-cies invariably expressed the belief that different service characteristics are important to differ-ent market segments. The most important service characteristics for attracting the two majorsegments, based on that review, are shown in Table 5-6.
Dow nto wn Workers Tourists and Visitors
Most Important Frequenc y Directness of service Travel time Reliabilit y Simple schedule
Most Important Information/signage Uniqueness of the vehicles Serve tourist attractions
Also Important Cleanlines s Low Fare Perimeter seating
Also Important Friendliness of drivers Knowledgeable drivers Availability of a day pass
SOURCE: District of Columbia Downtown Circulator Implementation Plan, p. 38.
Table 5-6. Service characteristics for downtowncirculator markets.
6TranSystems Corp., District of Columbia Downtown Circulator Implementation Plan, prepared for National Capital PlanningCommission and others, July 2003 (p. 3)

72 Elements Needed to Create High Ridership Transit Systems
Other Targeted Services
Other targeted or special purpose services include airport shuttles, shuttles serving specialevents (e.g., sporting events), and tourist-oriented services (i.e., other than downtown circula-tors). Airport and special events services typically have premium fares. In contrast, tourist-oriented services often have the same fares as the rest of the system—or in some cases are free orhave lower fares than the rest of the system. In some locations, the entire transit systems areessentially tourist-oriented services. Systems such as Cape Cod (MA) RTA, Lake Tahoe (CA-NV)Regional Transit, and Island Explorer (serving Acadia National Park in Maine), for example, servewhat are principally tourist areas—although such services may well carry area workers and otherlocal residents as well as tourists. Funding for tourist services comes from a variety of sources,including local attractions and hotels, local governments, fares, the state, and the federalgovernment (e.g., for systems serving national parks).
Delaware Transit Corporation - DART Wilmington Trolley Investment large urbanized (over 1,000,000)
and tourists. Successful partnerships with downtown businesses and convention organizers have helped to increase ridership and tourism in the area. Trolley ridership is 14% higher than that of the fixed route it replaced.
In 2002, DART implemented the new Wilmington Trolley to serve both resi- dents and tourists in downtown Wilming- ton. The trolley replaced an existing fixed route that had served the same area in a loop pattern. The new service was heavily marketed towards business visitors, lunchtime downtown workers,
7TranSystems Corp. et al., Southeast Connecticut Intermodal Connections Study, prepared for Southeast Connecticut Council ofGovernments, 2005.
Based on a review of 20 U.S. tourist-oriented transit services, the keys to success in establishingsuch services include the following:7
• Free or minimal fare ($1 or less);• Frequent, reliable service;• Convenient/easy access to attractions;• Service span coordinated with hours of attractions;• Service perceived as tourist amenity (e.g., drivers act as regional “ambassadors”);• Disincentives to automobile use (e.g., constrained parking, traffic congestion); and• Cooperation of resorts, hotels, and attractions in marketing and/or funding.
Moreover, it is important to provide adequate marketing of these services; possible marketingstrategies include branding of vehicles, providing brochures and schedules at all lodgings in thearea, advertising in local media, bundling of transit access (and information) in package tours,and encouraging participation of local businesses and Chambers of Commerce.
Improved Amenities
Passenger amenities in the following areas can play a key role in attracting and retaining riders:
• Passenger facility improvements (e.g., improved bus stop, station, and transit center or park-and-ride amenities);

Operating/Service Adjustments 73
• New/improved vehicles (e.g., improved amenities and use of articulated buses); and• Increased security (e.g., increased agency security presence) and increased safety (e.g.,
promotion of safety features of vehicles).
Descriptions and agency examples of these types of strategies are provided below.
Passenger Facility Improvements
Facilities such as bus stops, stations, transit centers, and park-and-ride lots play an essentialrole in enhancing the waiting experience of passengers and supporting efficient bus operations.They also play a key role in facilitating convenient transfers between different bus lines as well asbetween bus services and other modes, providing access to the entire multimodal transit systemthrough the provision of parking capacity, inducing and supporting transit-friendly develop-ment, and establishing an identity for different services. Thus, the chief objectives of passengerfacility improvements might include
• Safe and secure access and facilities;• Improved access for pedestrians and bicyclists;• Real-time service information;• Basic customer amenities, including improved comfort;• Improved bus system image and visibility; and • Improved transfer environment.
Some agencies may wish to consider possible passenger facility improvements in a hierar-chical fashion based on facility scale. For instance, bus stop amenities would be at the first level.This would be followed by intermodal transfer facilities, including transit centers and park-and-ride lots. The latter group of facilities encompasses a wide range of facility type, from small on-street transfer facilities to large off-street transit centers that include layover facilities andpotentially additional passenger amenities such as small retail centers, transit pass sales outlets,and detailed transit information. Often these large off-street facilities will also be supported bypark-and-ride facilities. Transit center amenities are discussed above, under Improved Schedule/Route Coordination.
Bus Stops and Shelters
Bus stops are the entry point to the transit system for the large majority of transit riders, butoften these stops are of poor design, are inadequate for the number of passengers using them,have poor and sometimes misleading information, and are often not well maintained. A com-prehensive and consistent set of standards, based on daily boardings, can be applied regionwideas a means of upgrading this important element of the bus system. An example of such a set ofstandards is presented in Table 5-7. As indicated in Table 5-7, these standards suggest that all busstops regardless of passenger volume should have
• A level concrete pad for waiting passengers.• Reasonable pedestrian access, including a paved access path to the concrete waiting pad and
slope that does not exceed 6% over 100 feet. If reasonable access cannot be provided, the stopshould be removed.
• Adequate lighting, based on existing lighting standards.• Up-to-date and accurate bus stop signs, including an accurate listing of routes using the stop
and an accurate information telephone number.
The standards suggest that stops with more than 50 boardings per day (including transfers)should also have a standard shelter and a trash receptacle. Stops with more than 100 boardingsper day (including transfers) should also have

74 Elements Needed to Create High Ridership Transit Systems
• Detailed schedule information, including scheduled times of arrival for each line serving the stop;• A larger shelter, or alternatively, two standard shelters; and• One or more benches in the shelter.
Stops with more than 300 daily boardings (including transfers) should also have
• A system map and• Real-time travel information in the longer term.
Finally, the standards indicate that stops serving multiple routes with over 500 boardings perday (including transfers) should be examined in greater detail for conversion to a transit center.
A consistent design for bus stops across a region canhelp provide an improved regional transit identity.There should be a consistent shelter design theme forthe entire system (see Exhibit 5-5) and there should besafety standards that address shelter and stop locationand pedestrian access. Depending on the number ofshelters in question, it can prove most cost-effective forthe agency to pursue a regional franchise approach inwhich a contractor installs and maintains all shelters.
Beyond the types of amenities mentioned above, shel-ters should also offer protection from inclement weatherfor waiting passengers. At a minimum, a shelter shouldprovide shade and protection from rain or snow.However,a new generation of shelters is being designed to enhancewaiting passengers’ comfort in particularly hot environ-ments. In Phoenix, for example, a consulting firm has col-laborated with a local university architecture program todesign a modular shelter for the region’s bus system specif-ically intended to maximize protection from the intenseheat and the hot breezes that characterize local weather. The shelter design reduces heat buildup byminimizing the use of metal, relying instead on materials such as fiberglass that stay cooler.
SOURCE: WMATA Regional Bus Study
Route map and schedules
Customer Boarding Activity per Day
300- 50 0
Real time travel information
System map
Benches in shelter
Larger/Multiple shelter(s)
Detailed schedule
Trash receptacle
Standard shelter
Bus stop signs
Adequate lighting
Safe access
Level concrete pad
Ov er 50 0
100- 30 0
50 - 10 0
< 50 Amenity -
Potential conversion to transit center
- -
Table 5-7. Example of bus stop/shelter amenities standards.
Exhibit 5-5. TriMet bus shelter.

City of Fort Collins Transfort Transit Centers medium urbanized (200,000 - 1,000,000)
In 2002, Transfort created a new transit cen- ter in downtown Fort Collins, Colorado. The new facility helped to improve transfers be- tween routes, created a convenient location where passengers could obtain information, and served as an intermodal link to airport shuttles, taxis, and regional bus routes. The following year, a similar center was created at Colorado State University. System ridership increased 1.8% between 2002 and 2003.
Operating/Service Adjustments 75
New/Improved Vehicles
The vehicle environment also plays an essential role affecting the rider’s transit experience. Asexplained above, one of the reasons some people prefer railcars to buses is the greater amount ofroom and, in some cases, the greater comfort level of the rail vehicle. While railcars do not alwayspossess the clear advantage in these areas (e.g., a crush load on either type of vehicle is likely tofeel similarly uncomfortable to a rider), the message is clear: a more appealing vehicle environ-ment helps to attract and retain riders.
Improved Amenities
The vehicle environment includes the space and facilities on board (e.g., seating and circula-tion), but also how people board and alight the vehicle (including how they pay the fare andobtain information about upcoming stops). TCRP Report 46: The Role of Transit Amenities andVehicle Characteristics in Building Transit Ridership, 1999) notes that “Among the featuresand approaches to consider regarding vehicle environment are
• Circulation into and through the vehicle, including arrangement of doors and seating• Types of seating (degree of padding, height of the seat back, provision of armrest, type of
fabric or material)• On-vehicle passenger information displays (visual and audible information about route
number and name, next stop, key destination, upcoming stops and connecting route announce-ments, sometimes performed by a ‘talking bus,’ route maps and schedules)
• Better vehicle access using low-floor technology• Lighting (including the type of lighting as well as the ability of passengers to have individual
reading lamps)• Climate control and ventilation• Security cameras• A quieter and smoother ride resulting from enhanced insulation, particularly of the engine• Multi-modal features, such as bike racks• Driver courtesy and assistance.” (p. 6)
Among the key lessons learned from TCRP Report 46 are that
• “People react positively to amenities designed to improve their transit experience, both at the stopand on-board vehicles. Passengers especially appreciate these when they are well-placed andwell-designed, particularly when such basic service characteristics as frequency, efficiency,safety and reliability are perceived by passengers to be well under control. Amenities can helpto instill rider confidence in a transit agency, as well as raise passenger optimism regarding thequality of future transit improvements and service.
• Amenities impact a broad range of passenger experience and the ridership decisions of passengers.Infrequent or ‘transit choice’ riders, a major target audience for increasing ridership, showed sig-nificant interest in amenities in the case study cities surveyed. Amenities do not just help make

76 Elements Needed to Create High Ridership Transit Systems
transit more comfortable, but safer (with lighting and security cameras, for example) and moreefficient (with features such as low-floor buses that are shown to reduce dwell time). Amenitiesmay also impact new riders’ perception of transit as a mobility option for themselves.” (p. 2)
Thus, improved vehicle improvements amenities are an important consideration in any effortto raise ridership.
Use of Articulated Buses
Another potential bus-related improvement is the use of articulated buses to increasecapacity on certain routes. These vehicles offer the potential to (1) alleviate crowding on heav-ily utilized bus lines without increasing frequency or (2) reduce the number of buses neededon the most heavily utilized lines where frequency has already been increased to addresscrowding. This is a cost-effective way to address crowding in certain circumstances, particu-larly on bus lines that have very high frequencies. Articulated buses are also sometimes usedin BRT corridors.
Bangor Area Comprehensive Transportation System (BACTS)New Improved Community Connections: “Try Our New Buses”small urbanized (50,000 - 200,000)
As part of a larger effort to increase transit ridership, BACTS, serving Bangor, Maine, introduced a new fleet of low-floor buses. These buses provide for quicker and easier boardings and alightings, which in turn allow for more efficient service. The new vehicles serve the dual purposes of improving the passenger experience and attracting new riders to transit through distinctive branding. System ridership increased 8% between 2003 and 2004.
Increased Security and Safety
Perceived personal security (i.e., protection from crime and terrorism) and safety (i.e., pro-tection from vehicle-related injury) are both important mode choice decision factors. Thus,increased security and increased safety are both elements that must be considered in an effort toincrease—or even maintain—transit usage levels.
Increased Security
Promoting a sense of adequate security in transit systems (e.g., in stations/transit centers, invehicles, at bus stops and in park-and-ride lots) has always been considered important. This hasbeen accomplished in facilities such as stations/transit centers primarily through the presence ofclearly identified agency personnel, complemented by security cameras where feasible. Providinga sense of security at bus stops has been more problematic, but a key strategy is ensuring sufficientstreet lighting at and around stops. Location of bus stops in close proximity to other “active” landuses (e.g., retail, office, and residential sites) also helps, although this is not always feasible.
Prior to September 11, 2001, rider concerns primarily focused on the possibility of assault ortheft in facilities, or perhaps damage to cars in parking lots. However, these concerns have now beenjoined by broader concerns about the potential for terrorist attacks on transit systems. Indeed, ter-rorist acts in transit systems in London, Tokyo, Madrid, and throughout Israel have heightened theneed for all transit agencies to be able to assure riders—and would-be riders—that improved secu-rity measures are in place. Such measures should include, for instance, a clear evacuation plan (par-ticularly for subway systems and other systems with enclosed stations or transit centers). Increasedsecurity measures can be particularly important for attracting choice riders, including tourists.

University of Connecticut Transportation Services (UTS) Quick Reaction Checklists rural area (under 50,000)
mined that the sense of security which riders have about the system has contributed significantlyto its ridership success. Ridership has increased 30 – 55% over the past five years.
As part of an overall effort to increase safety and security, UConn Transportation Services created a “Quick Reaction Checklist” for dispatchers. The checklist provides concise step-by-step instructions to help dispatchers figure out what to do in an emer- gency (such as a bomb threat, a bus breakdown, or a hijacking). In addition, bus drivers are awarded “safe driving” pins for each year of operation without any preventable accidents. The agency has deter-
Operating/Service Adjustments 77
South Bend Public Transportation Corporation (TRANSPO) TRANSPO System Safety Program small urbanized (50,000 - 200,000)
TRANSPO recently implemented a compre- hensive operator training and safety program for its bus drivers. The program included safety awareness training as well as training on a bus operating simulator. The program served the dual goals of reducing vehicle accidents and insurance costs and increas- ing passenger satisfaction. System ridership increased 10.6% between 1999 and 2001.
A number of agencies have begun to improve the quality of their security monitoringprocedures by upgrading to digital security cameras systems that record—and transmit—highly-detailed color images, rather than the blurry black and white images common to mostexisting security systems. These new systems greatly enhance the ability of the agencies tomonitor—and later review—activity within rail stations and on buses. For example, SEPTA inPhiladelphia has installed such a camera system in its first “Smart Station.” The Smart Stationconcept is designed to coordinate all security and safety functions, including fire alarms andintrusion alarms; the agency plans to implement 21 additional Smart Stations by 2007. WMATAin Washington has installed digital cameras in all of its rail stations; these transmit images to botha central control room and to a monitoring kiosk located in each station. WMATA has also placeddigital cameras on 100 buses and plans to do so on another 125 buses. The MBTA in Boston isalso in the process of converting to digital security cameras as part of a major project to renovateits rail stations. In its major “hub” stations, the MBTA is installing glass-enclosed booths that willallow passengers to observe the surveillance images from the station.
Finally, TCRP Report 46 notes that “Amenities can also impact security indirectly. People oftenperceive a station as more dangerous than it really is because of a poor general appearance or lackof maintenance, or because it lacks the presence of official people, like ticket agents or retail ven-dors. These signs of deterioration are often equated with signs that a place is unsafe or ‘out ofcontrol.’” (p. 23)
Increased Safety
A sense of safety on board transit vehicles—and while boarding and alighting—is also impor-tant to riders and potential riders. Certain security measures such as evacuation plans also pertainto personal safety. Otherwise, an agency should promote its safety record (i.e., related to incidenceof vehicle accidents) as well as the safety features of its vehicles and any operator training programs in place.

78
C H A P T E R 6
Introduction
An increasingly important category of strategies, actions, and initiatives aimed at increasing rid-ership is partnerships and coordination initiatives. The types of strategies—and specific actions/examples—included this category are shown in Table 6-1. These types of strategies are generallyintended to attract and retain riders by improving the availability and/or affordability of transit serv-ice—or by making use of transit feasible at all. Thus, each strategy should address one or more of thefollowing mode choice factors:
• Availability of service,• Convenience,• Cost of using transit—and
ease of fare payment, and• Perceived “image” of the
system.
Descriptions and examplesof the various types of part-nership and coordinationstrategies are provided below.
Guidelines andExamples
As demonstrated via the examples in Chapter 4, various types of partnership/coordinationstrategies can be used in a range of service environments. However, some strategies or particu-lar types of initiatives are not well suited to certain settings or modes. Table 6-2 identifies whichenvironments and modes are generally appropriate for each type of strategy; obviously, though,each specific type of initiative must be designed to reflect the needs and opportunities that existwithin the agency’s environment.
The different types of partnerships and coordination initiatives are described on the followingpages, including examples of each type of strategy.
Partnerships
Transit agencies are increasingly entering into partnerships with other entities that effectivelypromote the use of transit by the partner entities’ constituents. While there may be various part-
Partnerships/Coordination Initiatives

Partnerships/Coordination Initiatives 79
nership opportunities in a given area, the major types of partnerships transit agencies have devel-oped are as follows:1
• University/school pass programs (e.g., reduced pass price or per trip reimbursement foruniversity or other school);
• Travel demand management strategies (e.g., employer pass/voucher programs, vanpooling,rideshare matching, flex-time, and parking cash-out); and
• Subsidized activity center service (e.g., subsidized service to office parks or other activity centers).
These types of arrangements/programs are described below, including agency examples of each.
University/School Pass Programs
Some universities provide their own campus area transit services, but many campuses areserved by the local transit operator. Where the latter is the case, many universities have established
Type of Strategy Specific Actions/Examples Partnerships University/school pass programs Reduced pass price or per trip reimbursement
to university (or other school) Travel demand management strategies Employer pass/voucher programs;
vanpooling; ride-matching; parking cash-out Subsidized activity center service Subsidized service to office parks or other
activity centers Coordination Initiatives Consistent regional operating policies Transfer agreements
Coordination with social service agencies Mobility manager; access-to-jobs programs
Coordination with other transportation agencies Roadway or parking management strategies
Promotion of transit-supportive design/TOD Requirements for bus stops/shelters at new developments
Mode Service Environment Type of Strategy Bus Rail Large
Urban Medium Urban
Small Urban
Rural Suburb CBD
University/school pass programs
+ + + + + + + + Travel demand management strategies
+ + + + + + + + Subsidized activity center service
+ – + + + + + + Consistent regional (inter- agency) operating policies
+ + + + + + + + Coordination with social service agencies
+ + + + + + + + Coordination with other transportation agencies
+ + + o – + + + Promotion of transit-supportivedesign/TOD
+ + + + + o + +
Key: – = not applicable or inappropriate; o = applicable, but may not be cost-effective; + = applicable and appropriate
Table 6-1. Types of partnerships and coordination initiatives.
Table 6-2. Applicable modes/settings for types of partnership/coordinationinitiatives.
1Certain other types of ridership strategies, though assigned in this report to other categories, can also clearly involve devel-opment of partnerships. Examples include introduction or expansion of a route serving a campus, or a cooperative marketingarrangement with a university.

80 Elements Needed to Create High Ridership Transit Systems
partnerships with the local transit agencies to provide specially priced passes or other paymentoptions to students. As discussed in Chapter 4 and Appendix A, such arrangements represent thesingle most common type of initiative instituted by the agencies reviewed in this study. Byproviding a low-cost and convenient form of transit payment to the university community, thetransit agency typically sees increased ridership. Agencies that serve—and have some type ofpayment arrangement with—major universities, by and large, have significantly higher per capitaridership figures than do other comparably sized areas. Meanwhile, the university benefits byimproving access for its students, faculty, and staff, and may ultimately be able to ease on-campusparking requirements by shifting some students and others to transit.2
The university pass/reduced fare arrangement represents one of the oldest types of fare-relatedtransit partnership, with some (e.g., University of Massachusetts-Amherst, University ofCalifornia-San Diego) dating back several decades. The pass programs, often called “U-Pass” orsomething similar, feature various formats, including the following:3
• The university pays the transit agency an annual lump sum per student in return for unlimitedtransit use for each participating student, faculty, and staff member; this type of arrangementhas been given the generic name “Unlimited Access.”4 In this option, the student typically needonly present his/her campus ID card to board a transit vehicle.
• The university purchases monthly (or perhaps semester or even full school year) passes fromthe transit agency, either at the regular price or at a reduced price, and then sells them to inter-ested students—usually at a significant price reduction. These maybe specially designed passes (either electronic or flash passes)issued by the agency or special stickers affixed to campus ID cards.(Exhibit 6-1 shows an example of a Upass issued by CT TRANSITin Hartford.)
• The transit agency actually reads the university’s student/faculty/staffID cards directly in the fare collection equipment. A predeterminedcost per ride is then billed to the university, based on the total uses ofthe cards during a month (or semester). Examples of this arrangementinclude OCTA (Orange Co., CA), which has agreements with University of California-Irvine andCalifornia State University-Fullerton; and Big Blue Bus (Santa Monica, CA), which has a part-nership with UCLA.
In some cases, arrangements involve a single university or college, while in others, the tran-sit agency provides the same basic deal to any interested institution. In Chicago, for instance,the CTA’s U-PASS program is available to any university/college in the area; 22 universitiesor colleges are participating. In Atlanta, the MARTA U-Pass program has expanded from4 colleges/universities when it was introduced in 1998 to 25.
Where implemented, university pass programs have typically proven quite successful atincreasing transit ridership, while also providing guaranteed revenue to the transit agency.5
Examples of the impacts are as follows:
• An analysis of unlimited access programs by researchers at UCLA’s Institute of TransportationStudies found that such programs seem to have resulted in a net average ridership increase of
2For additional discussion of university pass arrangements, see TCRP Report 94: Fare Policies, Structures and Technologies(Update), 2003.3Another strategy that has been introduced by some agencies whose service is focused on the university community is to offerlow (or free) fares on the entire system (i.e., rather than just to university students, faculty and staff). This strategy is discussedin Chapter 8, Fare Collection/Structure Initiatives.4J. Brown et al. “Unlimited Access,” Transportation (vol. 28, pp. 233–267), 2001.5Ibid.
Exhibit 6-1.Example of Upass.

Partnerships/Coordination Initiatives 81
over 7% per year at 13 transit agencies with university programs for the 2 years immediatelyfollowing introduction of the program.6 At five universities that collected ridership data beforethe initiation of the pass program, in the first year, student transit ridership increased between71% and 200%; in subsequent years, there were annual increases of 2–10%.
• In Chicago, more than 40,000 eligible college students are using the CTA’s U-PASS program,accounting for over 10 million rides per year; a quarter to a third of these are considered to be newtransit rides, and half of total U-PASS ridership is thought to take place in midday/evening hours.7
• In Seattle, 86% of eligible university students, faculty, and staff participate in the U-PASS pro-gram, accounting for over 8 million rides per year (more than 10% of all Metro and Commu-nity Transit rides); 45% of these are estimated to be new transit rides.8
Moreover, these programs can build “brand loyalty” to the transit system. In Chicago, forexample, the vast majority of survey respondents said that they would continue to use CTA aftergraduation.
Thus, university-transit agency partnerships are capable of generating significant increases inridership, while also building interest in continuing to use transit after graduation. However, itis important to recognize the cost and revenue implications of such programs; key concerns areas follows:
• Agencies must carefully design the pricing parameters of university pass programs so as tominimize the potential negative revenue impact. In particular, the agreement should be struc-tured so that it allows the agency to increase the amount paid per person so as to reflect actualusage rates.
• Depending on the success of the program (i.e., at attracting riders), there may be added coststo the agency (i.e., due to the need to provide additional service to meet the increaseddemand). In Seattle, Metro’s costs have risen considerably with the provision of additionalservice to the UW campus; however, UW pays a portion of the increased costs, and Metro’srevenue recovery rate for the new services has been comparable to its systemwide average.
Travel Demand Management Strategies
Travel demand management (TDM) comprises a range of strategies aimed at reducingsingle-occupant-vehicle (SOV) commuting and peak-period traffic congestion. Some of thesestrategies focus on encouraging transit use (e.g., pass/voucher programs) while others involvefacilitating ridesharing (i.e., vanpool programs or rideshare matching in private automobiles)or simply spreading out the commuting period (e.g., through allowing flex-time); finally, some
Santa Cruz Metropolitan Transit District - Metro Student Pass Program small urbanized (50,000 - 200,000)
The University of California at Santa Cruz worked with Santa Cruz METRO to establish a university transit pass program. A student ID entitles the holder to unlimited free rides on any METRO route, which encourages students to ride transit whenever possible. For UCSC staff and faculty, a quarterly bus pass provides the same benefit. The university makes payments to METRO on a per-student basis, the funds for which come from a transportation fee added to each student’s tuition. Ridership has increased on routes serving the university.
6Ibid.7TCRP Report 94.8Ibid.

82 Elements Needed to Create High Ridership Transit Systems
TDM strategies (e.g., parking “cash-out” arrangements or dedicated transit or high-occupancy-vehicle lanes) are generally intended to provide incentives to use some form of high-occupancymode. Transit agencies can promote TDM in general (both transit and non-transit aspects),often through coordination with other public agencies, and can also play a key role throughpartnerships with employers to facilitate—and possibly subsidize—employees’ use of transitto commute to/from work. Strategies involving coordination with other agencies are discussedbelow, under Coordination Initiatives. This section focuses on employer-oriented transit ben-efit programs.
Transit/employer programs were originally limited to the distribution of monthly passes byemployers to their employees, often with at least a partial subsidy of the pass price. The pro-grams subsequently became more flexible with the introduction of transit vouchers that theemployees could use to acquire the transit payment option of their choice. In the last decade,these basic approaches have evolved and broadened, fueled both by a steady increase in the tax-free transit benefit employees could receive and the emergence of electronic paymenttechnologies. Key types of employer-oriented transit benefit programs and strategies now inplace include the following:
• Pass programs—In these programs, employers buy passes for employees and distribute themat worksites. The passes are often subsidized, all or in part. In addition to monthly pass pro-grams, a number of agencies have adopted annual pass programs in which employers purchaseannual passes for employees (at significantly less than the normal monthly cost of passes)based on a predetermined formula set by the transit agency.
• Transit voucher programs—In these programs, employees receive vouchers that can then beredeemed for transit passes or other payment options. In some cases, the vouchers are in theform of stored-value farecards that can be used directly for fare pay-ment (see Exhibit 6-2).
• Automated benefits distribution programs—Other strategies for dis-tributing transit benefits to employees are emerging as well, includ-ing the ability to automatically download the value of the benefit toan employee’s smartcard.
Such programs are greatly facilitated by the existence of the “commuterchoice” benefits program.9 Commuter Choice allows employers to lettheir employees set aside up to $105 a month, or $1,260 a year, of theirpre-tax salary to pay for transit or vanpool commuting, and $200 amonth ($2,400 a year) for qualified parking expenses. Prior to TEA-21,commuter benefits had been allowed only in the form of a directemployer subsidy to an employee. A number of states have also intro-duced their own legislation providing state tax credits to employers who offer Commuter Choicebenefits to their employees; these states include Maryland, Delaware, Oregon, and Georgia.
The aforementioned approaches through which employers have worked with transit agenciesto provide transit benefits are reviewed below.
Annual Pass Programs
Annual pass programs are offered by several agencies, including Denver RTD (Eco Pass), Dal-las Area Rapid Transit (E Pass), Metro (Minneapolis) Transit (MetroPass), King County Metro(FlexPass), and Portland Tri-Met (PASSport). Such programs make participation convenient forboth employers and employees. However, it is important in establishing these programs that
9Commuter Choice is a provision of the Transportation Equity Act for the 21st Century (TEA-21) that was signed into law inJune 1998. TEA-21, along with the Taxpayer Relief Act of 1997, amended Internal Revenue Code Section 132(f) that alreadyprovided certain commuter program tax benefits. This tax code amendment significantly improved the status of employer-sponsored commute incentive programs.
Exhibit 6-2. Exam-ple of stored-valuevouchers.

Partnerships/Coordination Initiatives 83
transit agencies structure pricing in such a way that they protect themselves against losing rev-enue; the pricing should be able to capture at least some revenue from the new trips being gen-erated. Since all employees at a company receive an unlimited-use pass, the transit agency canexpect to see an increase in commuter ridership. However, since initial pass prices are normallybased on pre-program transit mode share, the pass may become under-priced if mode shareassumptions are not updated regularly. Denver RTD’s announced intention to discontinue itsEco Pass program due to excessive revenue loss demonstrates the danger of failing to adequatelyupdate the pricing assumptions and formula.
Transit Voucher Programs
Beyond the direct distribution of passes, employers can provide transit benefits for employeesthrough strategies such as voucher programs. In programs such as TransitCheck (New York Cityarea), CommuterCheck (San Francisco, Denver, Boston, elsewhere), and Metrochek (Washing-ton, DC), employees are given vouchers that can be redeemed for transit passes or other paymentoptions. In some cases (e.g., New York City and Washington), the vouchers are in the form ofstored-value farecards and can thus be used directly for fare payment where accepted—orredeemed for fare options for other agencies in the applicable region.
Automated Benefits Distribution Programs
The emergence of electronic payment media such as smartcards has created new strategiesfor distributing transit benefits to employees. One approach, mentioned above, is the directprovision of stored-value farecards, as is done in Washington, New York, and Chicago. Avariation introduced in 2000 in New York City is the Premium TransitChek designed for cityemployees and other large employers. In this program, TransitCenter issues employees specialMetroCards once a year. The City or employer deducts the cost of a 30-day pass from theemployees’ paychecks each month and transfers these funds—along with an active list—toTransitCenter; as long as an employee’s payment status remains active, his/her card will remainactive.
The use of smartcards further expands the ability to automatically distribute transit benefits.The existing examples of such a strategy are WMATA’s “SmartBenefits” program (launched inSeptember 2000), the CTA’s Chicago Card Plus (introduced in 2004), and the TransLink card inthe San Francisco Bay Area (pilot tested in 2002 and now being rolled out in the region). In theWMATA program, an employer establishes an account for each participating employee (and sub-sequently identifies any changes to an employee’s status) via a WMATA website. Each month, theemployee can then automatically download the value of the benefit to his/her SmarTrip smart-card at any WMATA farecard vending machine. As of 2003, over 550 employers and 17,000employees were participating in the SmartBenefits program; while participation was growing ata slower pace than the agency had anticipated, the concept should take greater hold as the num-ber of employees at each company using the SmarTrip card increases—and once SmarTrip isexpanded to other services in the region over the next few years. The Chicago Card Plus andTransLink programs also involve automated downloading of transit benefits. Chicago Card Plusis an account-based card system; those cardholders not receiving transit benefits directly fromtheir employers must establish a credit card-backed account with the CTA to use the card.
The combination of commuter choice legislation and the emergence of electronic paymenttechnologies has resulted in a range of distribution strategies that facilitate the provision of tran-sit benefits to employees. The major impacts on and benefits to transit agencies, employees, andemployers from these types of strategies include the following:
• Annual pass programs, provision of vouchers in the form of electronic farecards, and auto-mated download options (like SmartBenefits) are particularly convenient for employees, sincethey do not require them to go out of their way to purchase separate fare instruments.

84 Elements Needed to Create High Ridership Transit Systems
• These programs also represent convenient mechanisms for employers to manage the distri-bution of commute benefits to employees. Besides providing a tangible benefit to theiremployees, employers benefit from such programs through payroll tax savings, as well as thepotential to reduce parking requirements.
• Such programs help employers address state or local trip reduction ordinances; the existenceof such requirements was a key factor leading to the establishment of both King CountyMetro’s and Tri-Met’s annual pass programs.
• Such programs typically result in increased transit usage. For instance, in Seattle, FlexPass hasresulted in an average increase in employees’ transit use in the first year of the company’sparticipation of over 90%. In Portland, the average employee increase has been measured at57% during the first year; PASSport passes account for over 7% of Tri-Met’s overall systemridership. In New York, a 1994 survey indicated an average of over 240 additional transit ridesper year per TransitChek recipient.
Thus, employer pass and voucher programs have been shown to benefit employees, employers,and transit agencies. Clearly, the simpler—and less costly—it is for employers to administer theseprograms, the more likely they will be to participate. Similarly, the more convenient it is foremployees to take advantage of commuter benefits, the more likely they will be to use transit toget to and from work.
Minneapolis/St. Paul Metro Transit (MT) Metropass (Annual Employer-Based Pass Program) large urbanized (over 1,000,000)
Metro Transit in Minneapolis/St. Paul (MN) runs the Metropass program, under which area employers subsidize annual transit passes for their employees. This program helped to strengthen links between Metro Transit and the business community. The program has also significantly contributed to the agency’s recent ridership gains. Between 2000 and 2004, ridership rose 41%.
Subsidized Activity Center Service
As indicated in Chapter 5, employers (private or public), developers, or other entities mayalso be involved in partnerships with transit agencies through subsidizing transit serviceto/from key activity centers. The most common form of such an arrangement is a shuttle ser-vice that provides a link between a transit hub (e.g., a commuter rail station or an intermodalcenter) and an office park or other large employment site. In order to help attract and retainemployees—and possibly to minimize the amount of parking necessary—employers may bewilling to sponsor such services or at least participate in their funding. Some type of fare sub-sidy may be involved as well; for example, fares may be waived with an employee identifica-tion card or the employer may provide a transit pass or voucher, as discussed in the previoussection.
As noted in TCRP Report 55, such shuttle services “by their nature serve niche markets; that is,a small portion of the total travel market commuting to any one location. Thus, on a regionalbasis, the number of trips as a percentage of all trips is rather small; the key is to capture a rea-sonable mode share of the trips that originate within the corridor served by regional bus or rail.”(p. 54) TCRP Report 55 further points out that “Shuttle programs have to be carefully designedand tailored to the markets they serve in order to be effective. Given their relatively small mar-kets, they have to have hours and headways tailored to the travel patterns of the local market andcannot overextend schedules.” (p. 55)

10The two CCCTA examples come from TCRP Report 55: Guidelines for Enhancing Suburban Mobility Using Public Trans-portation, 1999 (p. 55).
Partnerships/Coordination Initiatives 85
Examples of privately sponsored shuttle services include the Metra “Shuttle Bug” (summa-rized in the inset) and the following, both operated by Central Contra Costa County (CA) TransitAuthority outside of San Francisco:10
• Route 960 connects Walnut Creek BART station and Bishop Ranch Business Park. BishopRanch is basically an “edge city,” with more than 60,000 employees. The developer, SubsetDevelopment, jointly sponsors the service with the California Department of Transportation.Bishop Ranch workers ride free, while the general public can ride for $1.25. The design andmarketing of the service have apparently been quite successful, as evidenced by the fact thatRoute 960’s productivity has been nearly 16 passengers per hour—compared to aproductivity of under 7 passengers per hour for the regular transit route that had served thecorridor prior to the implementation of Route 960. As of the late 1990s, ridership was over270 per day.
• Route 991 connects the BART Concord station to three business parks. Employers at thesebusiness parks agreed to help subsidize the route as a condition of their receipt of building per-mits. As is the case with Route 960, employees can ride for free (by presenting their employeeID card or a special farecard); the general public must pay the normal transit fare. The routeis relatively lightly used, about 80 passengers per day, but the employers are apparently satis-fied with the service.
Of course, such services can also be subsidized solely by public agencies, typically for employ-ees traveling to/from a particular local, state, or federal agency location. For example, theNashville MTA operates two shuttles under contract to the State of Tennessee. The MTA bills theState for vehicle hours of service at a specified contract rate. State employees ride the shuttles forfree, by presenting their state ID cards—and have priority access to the buses. However, the con-tract allows the MTA to carry paying passengers on a space-available basis; non-state employeeswishing to ride these buses currently pay a fare of $0.25, and this represents additional revenuefor the transit agency.
Northeast Illinois Regional Commuter Railroad Corporation – Metra (NIRCRC) Shuttle Bug & Other Linking Services large urbanized (over 1,000,000)
sures that the shuttles continue to meet the needs of the employees. Between 2003 and 2004,ridership in this program rose 12%.
In order to better serve the reverse commute and suburb-to-suburb commute markets of the Chicago area, Metra runs a program that seeks to link corporate campuses with suburban rail stations. Through public-private partnerships, over 30 employers help subsidize more than 17 shuttle routes. Employers have a large say in determining the schedule and routing of each shuttle, and on-going monitoring of service en-
Coordination Initiatives
Other types of strategies involve coordination with other entities—either other transit agen-cies in the region or non-transit entities—to better facilitate or promote the use of transit. Keytypes of strategies in this area include
• Consistent regional (inter-agency) operating policies (e.g., transfer agreements);• Coordination with social service agencies (e.g., mobility manager and access-to-jobs programs);

86 Elements Needed to Create High Ridership Transit Systems
• Coordination with other transportation agencies (e.g., roadway or parking managementstrategies); and
• Promotion of transit-supportive design (e.g., requirements for bus stops/shelters at new devel-opments) and transit-oriented development (e.g., creation of a “transit village” around a railstation).
These types of initiatives are described below, including agency examples.
Consistent Regional Operating Policies
Many regions in the United States are served by multiple transit agencies operating in adja-cent—and sometimes overlapping—service areas. Within these multi-agency regions, the extentof consistent operating policies varies significantly. In some areas, agencies have made concertedefforts to integrate one or more types of functions or policies with neighboring agencies, whilein others, the agencies each continue to operate independently and make unilateral decisions.
The most common functional area of regional integration to date has been fare policy and pay-ments. With travel patterns increasingly requiring transferring between adjoining transit agen-cies’ services, there has been a growing emphasis on the development of multi-agency agreementsand integrated regional payment arrangements. In fact, agencies are moving from simple inter-agency transfer agreements to more comprehensive integrated regional payment options. Anumber of agencies currently have some type of joint pass arrangement with at least one otheragency. In other cases, agencies have transfer—or fare upgrade—provisions with agencies withwhich they intersect.11 For example, in the Washington, DC, area, WMATA and eight neighbor-ing bus agencies offer a joint 1-day pass that can be used on WMATA’s Metrobus and the otherservices; WMATA and all but one of these agencies also has a regional bus transfer agreement. Inthe Los Angeles area, a regional pass—EZ Transit Pass—is accepted by LACMTA and 17 otheragencies; there is also an inter-agency transfer agreement in the region. In the Central PugetSound Region (Seattle, WA), a regional pass—the Puget Pass—is accepted by seven agencies(including the Washington State Ferry); five of these agencies also accept each other’s transfers.
Norwalk Transit District—Wheels (NTD)Coastal Link Service medium urbanized (200,000—1,000,000)
Easton
Shelton
Wilton
Redding
Stamford
Monroe
Fairfield
Ridgefield
Milford
Norwalk
Weston
Trumbull
Orange
Westport
Darien
Stratford
NewCanaan
Seymour
NewHaven
Woodbridge
Bridgeport
EastHavenWestHaven
Derby
Ansonia
No rw al kT ra ns itDi st ri ct
Gr eate rB ri dg ep or tTr an si t Au th or ityi
Mi lf or dTr an si tDi st ri ct
Greater BridgeportTransit Authority
Milford TransitDistrict
Norwalk Transit District
The Norwalk (CT) Transit District partnered with two neighboring transit agencies (Greater Bridgeport Transit Authority and Milford Transit District) to create the “Coastal Link” bus route, which travels along the U.S. 1 corridor through 6 different municipalities. The agen- cies agreed to operate in each other’s districts and accept each other’s fares in order to provide a seam- less service for the rider. This trip previously would have required two uncoordinated transfers among three different systems with three different fares. Ridership along this corridor has increased by more than 200% since introduction of the Coastal Link.
Of course, inter-agency integration can cover several other functional areas as well. A recentstudy completed by the California PATH Program, Transit Service Integration Practices: An Assess-ment of U.S. Experiences (2005), identified the following basic types of inter-agency integration:
11The emergence of electronic payment options, particularly smartcards, has facilitated an increasing focus on integrated multi-agency payment systems—i.e., introducing a regional farecard that is accepted at any participating agency. This strategy is dis-cussed in Chapter 8, Fare Collection/Structure Initiatives.

Partnerships/Coordination Initiatives 87
• Infrastructure integration (i.e., shared stops/stations, inter-agency joint operation of routes,coordinated route restructuring, or inter-agency joint equipment purchases);
• Schedule integration (i.e., inter-agency schedule coordination or timed transfers);• Fare integration (i.e., inter-agency free/reduced price transfers or regional pass);• Information integration (i.e., inter-agency trip itinerary planning, inter-agency real-time trip
information dissemination, inter-agency dissemination of maps/schedules, inter-agency mar-keting, or inter-agency sharing of operational/planning data); and
• Special events/emergency conditions integration (i.e., inter-agency planning for events oremergency conditions).
The PATH report identifies and discusses examples of each of these types of integration, basedon a literature review, survey, and case studies. Fifty-six of the sixty agencies that responded to thesurvey indicated that they had put in place—or were in the process of implementing—one ormore of these types of integration; moreover, nearly 75% of the respondents indicated some levelof involvement (past or present) in at least four of the areas. (Strategies associated with these func-tional areas are described further—and examples are provided—in other chapters of this report.)
Coordination with Social Services Agencies
Coordination between transit agencies and social services programs can benefit both parties,by increasing transit ridership and maximizing the effective use of ever tighter social servicesagency resources. Examples of such coordination include
• Mobility manager programs—A transit agency might act as the central manager or coordina-tor of a range of publicly and privately operated services.
• Access-to-jobs programs—Transit agencies can play a key role in providing access to jobs forformer welfare recipients.
These types of strategies are discussed below.
Mobility Manager Programs
Given that most areas feature a range of publicly and privately operated transportation services,there may well be opportunities to improve the overall cost-effectiveness and efficiency of servicedelivery. One approach to minimize duplication and gaps in services within a region is to establisha single entity to manage multiple services and/or to serve as an information clearinghouse. Thistype of structure is commonly known as a Mobility Manager or Coordinator. In many communi-ties, the transit agency may well be the most appropriate entity to carry out that function.
One of the general objectives of the Mobility Manager should be to continually look for waysto provide more cost-effective and appropriate types of transportation for each trip, on behalf ofthe sponsoring agencies. For example, vanpools and dedicated shuttle services offer lower costalternatives to advance-reservation, demand-responsive paratransit services. This is especially truewhere (1) a certain critical mass of riders makes roughly the same trip every day, and (2) wherethe users can either cover the cost of the service in a cooperative cost-sharing arrangement or havea sponsor (e.g., developer, employer, college, or human services agency) fund some or all of thecost. Such shifts are easier to effect, in terms of both administration and operations, if a singleentity has centralized oversight of a broad family of services. The Mobility Manager should be ableto assemble the critical mass of programs to generate savings worthy of the effort associated withcoordination and would reduce the marginal efforts needed to achieve efficiencies in eachprogram. The Mobility Manager should provide oversight and arrange for the provision of avariety of transportation services, including for example, local circulation services and other morespecialized services, which may be operated by a mix of private for-profit, not-for-profit, and/orpublic carriers.

Addressing welfare to work transportation issues has required creation of new collaborationsamong public agencies and private organizations, establishment of new transportation services,and development of innovative funding strategies. However, an important element of all access-to-jobs programs has been the provision of a mechanism for individuals to pay for these services,in terms of both subsidization of travel and furnishing the actual payment media. This hasresulted in various types of special transit payment arrangements. In some cases, welfare recipi-ents are directly provided with transit passes (or other fare media) for specified periods of time.In other cases, recipients must purchase their own fare media and then may be reimbursed (e.g.,by the responsible social services agency). Finally, where new services are created specifically toaddress access-to-jobs needs, the service may be free to eligible users—whereas members of thegeneral public using the service would have to pay a fare.
Access-to-jobs partnerships have been shown to increase transit ridership and to benefit eli-gible riders by providing affordable access to employment and training sites. However, since theseprograms often involve participation by a number of different entities, it is important that theparticipants clearly understand—and be sensitive to—each other’s goals and concerns in devel-oping and implementing the program.
Coordination with Other Transportation Agencies
As discussed in Chapter 2, existing transportation conditions related to factors such as park-ing availability/pricing and traffic levels can have a major impact on transit demand. Conversely,transit can play a key role in controlling congestion. Therefore, it should be of mutual benefit fortransit agencies to coordinate wherever possible with local, regional, or state agencies (e.g., cityor county traffic/highway departments, MPOs, or state DOTs) in the planning/development ofthe following types of efforts:13
12The Personal Responsibility and Work Opportunity Reconciliation Act (1996) replaced the Aid for Families with DependentChildren program with block grant funding and mandatory work requirements. The new welfare program imposed a 5-yearlifetime limit on welfare benefits and a 2-year deadline for placing most recipients in jobs, job training, or vocational educa-tion programs.13Other types of strategies requiring such coordination include transit-supportive design (discussed in the next section) andtransit signal priority systems (discussed in Chapter 5).
Access-to-Jobs Programs
Federal welfare reform legislation, passed in 1996, radically changed the American welfare sys-tem, emphasizing the move of individuals from welfare to work.12 In implementing the resultingwelfare reform programs, states and localities quickly realized the importance of ensuring accessto reliable and affordable transportation services for those residents attempting to make thistransition.
MTA Long Island Bus (LIB) Transit and Social Service Agency Collaboration to Enhance Access to Jobs large urbanized (over 1,000,000)
New York’s Long Island Bus worked with the Department of Social Services and other state agencies to identify transit needs relating to reverse commuters and the welfare-to-work program. Through joint collaboration on grants, the agencies were able to fund new routes, as well as service extensions on existing routes. To date, over 1.5 million passenger trips have been generated through these efforts. System ridership increased nearly 3% from 2002 to 2003.
88 Elements Needed to Create High Ridership Transit Systems

• Roadway management strategies include establishment of various types of dedicatedHOV/transit lanes or rights-of-way.
• Parking management strategies tend to focus on the establishment of downtown parkingrestrictions and/or parking surcharges.
Such efforts are discussed below.
Roadway Management Strategies
Specific forms of these strategies that should contribute to increased demand for transitinclude
• Downtown transit malls and bus lanes,• Exclusive busways and BRT rights-of-way, and • Dedicated HOV lanes (for buses as well as carpools and vanpools).
There has been considerable coordination of transit and other transportation agency effortsin the roadway management area. For instance, transit malls have been established in a numberof U.S. cities, including Denver, Minneapolis, Dallas, and Portland (OR). Exclusive busways havebeen implemented in Pittsburgh, Miami, and northern New Jersey, while BRT systems with ded-icated rights-of-way (for at least a portion of the total system) are in place or under developmentin such locations as Boston, Orlando, and Las Vegas. Finally, many highways have dedicated HOVlanes; examples include major arterials in Washington (DC), Houston, and Seattle. While HOVlanes can also be used by carpools and vanpools, all of these types of efforts offer transit usersdistinct travel time advantages over driving alone and thus serve to enhance the relative attrac-tiveness of transit service.
Parking Management Strategies
Examples of possible forms of parking-related initiatives that should contribute to increaseddemand for transit include
• Establishment of a cap on downtown parking spaces;• Allowance of maximum parking ratios for new commercial developments;• Prohibition of construction of new freestanding garages;• Increase in parking meter rates, reduction in maximum allowable meter stay, or expansion of
short-term metering; and • Establishment of a residential parking permit program (i.e., with substantial fines for parking
without a permit).
While a number of U.S. cities have at one time or another implemented one or more of thesestrategies—typically in an effort to control downtown traffic congestion—the actual coordina-tion of transit agency and other transportation agency efforts in their development has beenlimited. The most notable example of parking-transit policy coordination is in Portland, OR,where combined transit and parking initiatives have been in place for over 30 years; transit mea-sures developed in combination with a range of parking restrictions include the aforementionedtransit mall and a fare-free zone (Fareless Square). Another notable example is in Bellevue, WA,where the city has initiated a series of transit, parking, and other demand management initia-tives in response to growing downtown traffic congestion.
Thus, while traffic levels and parking availability/pricing are generally considered external fac-tors affecting transit usage, transit agencies should seek to coordinate with other transportationagencies that are developing approaches to manage local transportation conditions. Strategiessuch as dedicated bus lanes or parking restrictions combined with transit improvements can helpto control traffic congestion while generating increased demand for transit.
Partnerships/Coordination Initiatives 89

90 Elements Needed to Create High Ridership Transit Systems
Promotion of Transit-Supportive Design and TOD
The integration of transit and land use/development planning represents another form ofcoordination intended to promote transit usage. Two related types of strategies have beenemployed by transit agencies and local governments in an effort to ensure that new developmentsare conducive to the use of transit:
• Transit-supportive design guidelines are promulgated by transit agencies to guide developersin designing and constructing “transit-friendly” buildings and sites.
• Transit-oriented development (TOD) generally refers to compact mixed-use development inthe vicinity of a transit station or transfer center that has been designed to facilitate transitusage.
These strategies are discussed briefly below.
Transit-Supportive Design
As many as a quarter of U.S. transit agencies have developed or adopted some form of transit-supportive design guidelines.14 TCRP Report 55 says of these guidelines,“Beside imparting tech-nical design information, guidelines promote coordination among stakeholders, encourage long-range planning for transit, emphasize the importance of transit design considerations duringproject review, and educate the general public about transit issues. Some of the more effectiveguidelines provide examples of ‘good design practices’ that developers can emulate.” (p. 19) Suchguidelines typically suggest and describe design features that will (1) help to make developmentsites conducive to pedestrian access to transit facilities or bus stops, and (2) facilitate efficient busoperations within or approaching the site. Notable examples of comprehensive design guidelinesdocuments include the following:
• Snohomish County (WA) Transit—A Guide to Land Use and Public Transportation; there isalso an accompanying videotape;
• Portland Tri-Met—Planning and Design for Transit; and• Central Contra Costa County Transit Authority—Coordination of Property Development and
Improvements (this was one of the first such documents, produced in 1982).
Transit-Oriented Development
Transit-oriented development is defined differently in different locations. Indeed, as noted inTCRP Report 102: Transit-Oriented Development in the United States: Experiences, Challenges andProspects,“There is no universally accepted definition of TOD, because development that would beconsidered dense, pedestrian-friendly, and transit-supportive in a middle-size city in the Midwestwould be viewed quite differently in the heart of Manhattan or the District of Columbia.” (p. 5)TCRP Report 102 presents the definitions of TOD adopted by 10 different transit agencies; they varyin their details, although “. . . most focus on the design characteristics of transit-supportiveenvironments.” (p. 7) The most frequently cited characteristics among these definitions are high-quality walking environments and mixed land uses; moreover, several definitions link TOD toincreased transit ridership. As noted in the TCRP report, there is general “. . . agreement within theprofessional transit community as to what constitutes a TOD: a pattern of dense, diverse,pedestrian-friendly land uses near transit nodes that, under the right conditions, translates intohigher patronage.” (p. 7)
14TCRP Report 55, p. 19

CityBus of Greater Lafayette Transit-Oriented Development for Small Cities small urbanized (50,000 - 200,000)
The City of Lafayette, Indiana, created the James Riehle Plaza as an intermodal station serving trains as well as local and regional bus service. Since it opened in 1995, a significant amount of transit- oriented development has emerged in the area, including a childcare center, retail, offices, and residential development. Ridership on the system has increased 117% in four years.
Partnerships/Coordination Initiatives 91
There are many examples of TOD around the United States. While most examples are focusedon rail stations, a considerable number are associated with bus service. TCRP Report 102 identi-fied more than 100 TODs, based primarily on a survey of transit agencies. The regions respond-ing to the survey featuring the largest numbers of examples are San Francisco, Washington (DC),Portland (OR), Atlanta, and Dallas.15
While TOD can have a variety of benefits to a community or a region, TCRP Report 102points out that “The most direct benefit of TOD is increased ridership and the associatedrevenue gains. Research shows that residents living near stations are five to six times morelikely to commute via transit than are other residents in a region.” (p. S-6) The mixed-useaspects of many TODs are also important in their potential to generate transit trips duringoff-peak periods (i.e., for restaurants, stores, and entertainment attractions), as well as duringthe peak commute periods.
15TCRP Report 102: Transit-Oriented Development in the United States: Experiences, Challenges and Prospects (2004)

92
C H A P T E R 7
Introduction
A widely used set of strategies and projects aimed at increasing ridership is marketing/promotional and information initiatives. The types of strategies—and specific actions/examples—included in this category are shown in Table 7-1. These types of strategies aregenerally intended to attract and retain riders by (1) informing them of the availability andbenefits of using transit, (2) offering special incentives to try transit, and/or (3) informingthem of service schedules and changes (both in advance and in real time). Thus, these strate-gies should address one or more of the following mode choice factors:
• Cost of using transit,• Convenience,• Service reliability,• Perceived personal secu-
rity/safety, and• Perceived “image” of the
system.
Guidance on the selection,design, and implementationof appropriate marketing/promotional and information strategies is provided below. This is followed by a section describ-ing each type of strategy, including agency examples.
Design/Implementation Guidelines
Marketing, promotion, and information dissemination strategies are important in attractingriders to transit, educating them as to how to use it, and keeping them informed of any changesto the service. Thus, in addition to their role in promoting the usage of transit in general, thesestrategies should be key elements of all efforts to implement any other types of ridership strategy(e.g., introducing new service, adjusting existing service, changing fare levels, or introducing newpayment options). Table 7-2 presents a checklist of the recommended steps an agency shouldconsider in identifying and developing marketing, promotional, and information strategies.
Applicable Settings
As shown in the examples in Appendix A, various types of marketing/promotional and infor-mation strategies can be used in a range of service environments. However, some strategies or
Marketing & Information Initiatives

Marketing & Information Initiatives 93
Type of Strategy Specific Actions/Examples Marketing/promotional initiatives Targeted marketing/promotions New resident promotion; college student promotion,
individualized marketing, tourist-oriented marketing General marketing/promotions agency image advertising, special promotions, cooperative
advertisingInformation improvements Improved printed informational materials Easier to read printed system and route maps/schedules,
newsletters/brochures Improved customer information and assistance Transit information center, in-station customer assistants
Automated transit traveler information Pre-trip planning and en-route information, including real-time information
Key Steps/Activities to Consider Evaluation of Existing Programs/Systems Evaluate current marketing and information materials and programs
Identify goals, issues and constraints Assess effectiveness of existing materials (e.g., maps/schedules, brochures) Assess effectiveness of existing programs (e.g., campaigns, promotions, fare incentives) Conduct peer agency review Identify areas/opportunities for improvement
Evaluate current information dissemination systems/procedures Identify goals, issues and constraints Conduct peer agency review Identify areas/opportunities for improvement
Identification of Strategy Options I dentify potential improvements to materials and programs Identify market segments for potential targeted marketing campaigns and promotions Identify types of improvements to printed materials (e.g., re ease of understanding) Identify potential for cooperative advertising (e.g., with local media outlets)
I dentify potential information improvements Identify new methods/technologies (e.g., Internet-based trip planning, real time info at stops) Identify other distribution options (e.g., on-board, in-station) Identify customer service/assistance improvements
Market Research and Public Outreach C onduct surveys/focus groups Conduct survey of current riders (e.g., on-board/in-station) Conduct survey of non-riders or infrequent riders (e.g., telephone) Conduct focus groups of riders and non-riders Analyze results of market research
C onduct public outreach/input Meet with stakeholder groups (e.g., civic, government, business, institutional interest groups) Conduct public meetings or open house sessions
Selection of Strategy(ies) S elect and design strategy(ies) Evaluate options and select most appropriate strategy or combination of strategies Design new materials or programs
I dentify costs Estimate costs (capital, operating & maintenance) of strategies (design, implementation, operation)
Implementation of Strategy(ies) Develop implementation plan
I mplement strategy(ies) Procure/install new software or equipment (if necessary) Hire additional personnel (if necessary) Develop new materials (do in-house or contract out) Put strategy(ies) in place
Monitor effectiveness of strategy(ies) Identify actual ridership impact Conduct follow-up market research
Table 7-1. Types of marketing/promotional & information initiatives.
Table 7-2. Checklist—developing and implementing marketing/promotional/information initiatives.

94 Elements Needed to Create High Ridership Transit Systems
particular types of initiatives may not prove cost-effective in certain settings. Table 7-3 identifieswhich environments and modes are generally appropriate for each type of strategy; obviously,though, each specific type of initiative must be designed to reflect the needs, opportunities, andconstraints that exist within the agency’s environment.
Planning Activities
When thinking about any marketing or promotional initiative, it is important to develop acomprehensive plan. The plan should, at a minimum, include the following elements:
• The message and goals,• The intended audience,• The method of delivery, and• A process for evaluating the success of the initiative.
The last element, though often neglected, is important. Knowing what works for its audienceand what does not will save an agency time and money in future marketing efforts. As TCRPReport 50: A Handbook of Proven Marketing Strategies for Public Transit points out, even smallagencies with few resources can follow some very basic evaluation procedures that greatlyincrease the value of the marketing effort. The agency should examine changes in ridership—and revenue—before, during, and following, the marketing campaign. For existing services,agencies can compare campaign-time ridership levels to those during the same time in theprevious year. For a new service, ridership and revenue can be evaluated against the projectedlevels. If possible, the success of the campaign should also be evaluated based on changes inpublic perception of the agency. Through consistent surveying, changes in the perceived imageof the agency can be detected.
Expected Ridership Response
As explained earlier in Chapter 2 of this report, TCRP Report 95: Traveler Response toTransportation System Changes summarizes the results of analyses of the nature of the impactsof various types of transit actions on demand. Chapter 11 of that report (Transit Information andPromotion) discusses the nature of the impacts on demand of marketing, information, andpromotion efforts. The report notes, first of all, the limited data available on the ridership impactof specific marketing programs; despite the aforementioned importance of evaluating suchinitiatives, few agencies actually undertake comprehensive consumer tracking efforts, and “it isalso difficult to monitor, measure and take into account the impact of other system changes and
Mode Service Environment Type of Strategy Bus Rail Large
UrbanMediumUrban
SmallUrban
Rural Suburb CBD
Targeted marketing/promotions + + + + + o + + General marketing/promotions + + + + + + + + Improved printed informational materials
+ + + + + + + + Improved customer information/assistance
+ + + + + o + + Automated transit traveler information
+ + + + o o + +
Key: – = not applicable or inappropriate; o = applicable, but may not be cost-effective; + = applicable and appropriate
Table 7-3. Applicable modes/settings for types of marketing/promotionaland information initiatives.

Marketing & Information Initiatives 95
external events that may be occurring at the same time as the transit information and promotionprograms” (p. 11-5).
Based on studies that have been conducted, the authors conclude that “the traveler responseto transit information and promotion varies widely, both in extent and duration of ridershipgains. Results are influenced by the utility and quality of the transit service product beingmarketed, by external circumstances, and by the type of promotion. While all types of transitinformation and promotion activities may help raise awareness of public transportation services,increases in ridership are most likely to occur within specific populations as the result of targetedprograms, especially individualized efforts designed on the basis of market research findings,delineating particular needs and opportunities” (p. 11-5).
The different types of marketing, promotional, and information strategies are described in thefollowing pages.
Marketing/Promotional Initiatives
Transit agencies use a range of types of marketing and promotional strategies in an effort toattract—and retain—riders; the basic types of efforts include the following:
• Targeted marketing/promotions (e.g., new resident promotion, college student promotion,individualized marketing, tourist-oriented marketing)
• General marketing/promotions (e.g., agency image advertising, special promotions, coopera-tive advertising)
The success of either of these types of initiatives can be enhanced by combining them with spe-cial fare incentives.These types of initiatives are described below, including agency examples of each.
Targeted Marketing/Promotions
Targeted marketing and promotions focus on a specific customer audience. The message orpromotion is packaged to appeal to a particular market or market segment. The intended marketmight be defined by location of work or residence, occupation, leisure activity, age, and so forth.College students, new residents, seniors, employees at a particular worksite, shoppers, users of aparticular transit service, and non-users of transit are common subjects for targeted marketing.Common methods of disseminating targeted messages include direct mailings and one-on-onepromotions at work sites, events, and college campuses.
New Resident Promotions
New residents represent a great opportunity for transit agencies to increase ridership. Whena person has just moved to a new area, he/she has neither established commuting patterns nordeveloped a perception of the local transit agency. Transit agencies can seize this potential bytargeting new residents with a targeted marketing campaign. Agencies use direct mail to reachindividuals at their new homes. Packets often include information about the transit system,and, typically, coupons for free rides that encourage people to try transit. Depending on theresources available, the agency can also tailor the information to focus on services available inthe recipient’s particular area. For example, Tri Delta Transit, in the San Francisco Bay area,took advantage of the rapid pace of local development to ensure that transit was automaticallyintroduced to new residents. The agency convinced local government staff to require develop-ers to provide new homeowners with a welcome packet that includes tailored transit informa-tion. The agency also distributes the packets to new renters in the area. Relocation packets

96 Elements Needed to Create High Ridership Transit Systems
distributed in San Jose (pictured in Exhibit 7-1) feature tran-sit information along with other items.
Several transit agencies have also implemented a different typeof strategy targeted to home buyers, by participating in FannieMae’s “Smart Commute Initiative.” This strategy, which can alsobe categorized as a partnership, involves the provision of financialincentives for the purchase of houses located in close proximity totransit service. Cities such as Nashville (TN), Columbus (OH),and Charlotte (NC) are participating in the program, which wasinitiated in July 2003. Essentially, a portion of the prospectivehome buyer’s potential transportation savings can be added tohis/her qualifying income; this allows the borrower to qualify fora higher mortgage. The transit agencies in each city offer differenttypes of additional incentives as well; for instance,COTA (Colum-bus) provides free passes to participating home buyers.
Chicago Transit Authority New Mover program large urbanized (over 1,000,000)
mately 1 to 3 % of new ridership results from this program.
Chicago Transit Authority implemented a program to encourage new resi- dents to use CTA’s services. Each new resident receives a package con- taining a guide to CTA, timetables for the nearest rail station, and a transit card preloaded with fares for a roundtrip. CTA estimates that approxi-
College Student Promotions
College students are a great potential market for transit agencies for a variety of reasons. Manystudents do not have private automobiles and are thus dependent on alternative means oftransportation. Students are also more likely to use transit at under-utilized times (e.g., non-commuting daytime hours or late evening hours). In addition, college students typically have verylimited budgets and find free or discounted services very appealing. Finally, students are young andmay not have formed the same attitudes toward transit that older generations have. By getting col-lege students “hooked”on transit, there is a great potential to create lifetime transit users.Many agen-cies recognize these facts and engage in targeted marketing campaigns directed at college students.
If the transit agency has established a relationship with a univer-sity, it can seek the university’s help in marketing transit to the stu-dents.As discussed in other chapters, many agencies provide servicespecifically targeted to the university community, as well as reducedfare or pass arrangements. If a transit agency redesigns an existingroute to better serve a university campus, for instance, it should takeadvantage of the university’s pre-existing information dissemi-nation network to market that service. Through e-mail, bulletinboards, and school papers, the new service can be marketed directlyto the target audience at little cost to the transit agency. Obviously,any special promotional materials should highlight the availabilityof transit to students. Some agencies therefore provide a rider’sguide and transit service information for distribution to freshmenat orientation. (The cover of UCLA’s commuting guide for students,which alerts them to the many available transportation alternatives,is pictured in Exhibit 7-2).
Exhibit 7-2. UCLACommuter Guide.
Exhibit 7-1. San Joserelocation packet.

Greater Portland Transit District University of Southern Maine Student Awareness Program small urbanized (50,000 - 200,000)
In 2000, the Greater Portland Transit District launched an awareness cam-paign to introduce the students of the University of Southern Maine to transit.The campaign featured an 8-month introductory period of free rides, advertise-ments in the campus paper, and a substantial on-campus presence at events throughout the period. The University contributed substantially to the cost of advertising and promoting the program. After the introductory period, a 50-cent student fare was introduced, and ridership remained high. Ridership continues to increase on the University routes by 2 to 3% annually.
Marketing & Information Initiatives 97
Individualized Marketing
A technique that can be used to target transit non-users is individualized marketing. This methodtakes a personalized approach and informs individuals of what their alternative transportationoptions are for the trips that they typically make. While this technique may require more resourcesthan others described here, it has the potential to be very effective. The FTA conducted a pilot proj-ect in Portland, OR, and found that as a result of the effort, use of transit and other “environmen-tally friendly” modes in the targeted area increased by 27%. The FTA is now sponsoring four moreindividualized marketing demonstrations: WTA in Bellingham, WA; TTA in Durham, NC; Sacra-mento (CA) RTD; and GCRTA in Cleveland,OH.This basic technique has been applied more widelyin Europe and Australia; TCRP Report 95 notes that participating transit operators in Germany sawridership transit increases between 10 and 30% among the targeted market segments.
Tourist-Oriented Marketing
In many locations, tourists represent a key potential market segment. Transit can be an attrac-tive local travel option for out-of-town visitors: it is generally less costly than rental cars or taxisand may well offer easier access to local attractions. The tourist market also represents a greatopportunity for partnerships. Many local businesses, such as restaurants, hotels, and retail outletsare seeking business from tourists as well. If transit can bring more tourists to these destinations,the businesses may be willing to share the costs of promotion.
When DART introduced the downtown trolley to Wilmington (mentioned in Chapter 5), itperceived that a key segment of the market for this service would be tourists. In anticipation ofthis, DART created the “Trolley Ambassador” relationship with forty local businesses. Tourists
can pick up the credit card-sized route maps (picturedin Exhibit 7-3) at any of these locations. The routemaps display both the trolley route and the tourist des-tinations along the route. Local hotels feature the trol-ley in the area guides they provide to guests, andconvention venues pass out the trolley guide to atten-dees. This partnership promotion has proven very suc-cessful in drawing tourists to the downtown area.
General Marketing/Promotions
General marketing and promotions are designed toappeal to a broad audience, rather than any particular
market segment. Goals may include providing information about transit, improving the pub-lic image of the transit agency, encouraging non-riders to try transit, and building public sup-port for transit. A wide variety of methods may be used to disseminate general marketingmessages, including mass mailings, newspapers (inserts or ads), television ads, radio ads, andthe internet (e.g., the agency’s website, as well as links to other sites such as local government orchambers of commerce). Examples of types of general marketing initiatives are described below.
Exhibit 7-3. Credit card-size routemap.
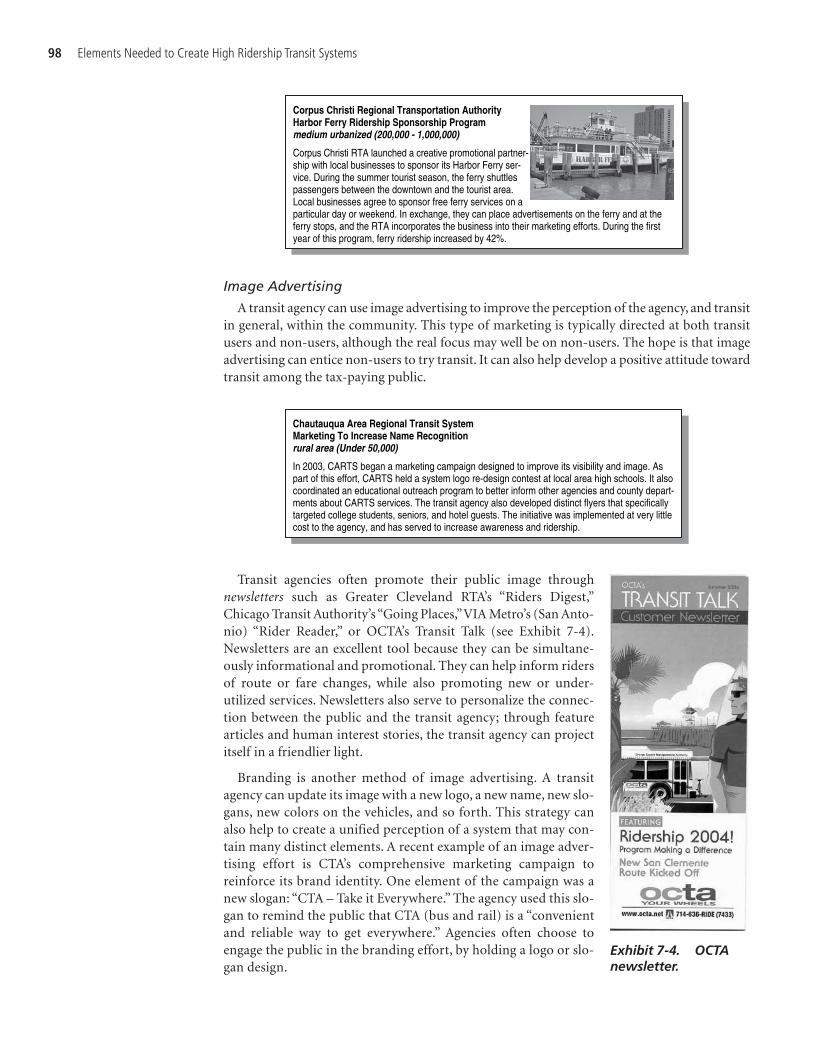
98 Elements Needed to Create High Ridership Transit Systems
Image Advertising
A transit agency can use image advertising to improve the perception of the agency, and transitin general, within the community. This type of marketing is typically directed at both transitusers and non-users, although the real focus may well be on non-users. The hope is that imageadvertising can entice non-users to try transit. It can also help develop a positive attitude towardtransit among the tax-paying public.
Chautauqua Area Regional Transit System Marketing To Increase Name Recognition rural area (Under 50,000)
In 2003, CARTS began a marketing campaign designed to improve its visibility and image. As part of this effort, CARTS held a system logo re-design contest at local area high schools. It also coordinated an educational outreach program to better inform other agencies and county depart-ments about CARTS services. The transit agency also developed distinct flyers that specifically targeted college students, seniors, and hotel guests. The initiative was implemented at very little cost to the agency, and has served to increase awareness and ridership.
Transit agencies often promote their public image throughnewsletters such as Greater Cleveland RTA’s “Riders Digest,”Chicago Transit Authority’s “Going Places,”VIA Metro’s (San Anto-nio) “Rider Reader,” or OCTA’s Transit Talk (see Exhibit 7-4).Newsletters are an excellent tool because they can be simultane-ously informational and promotional. They can help inform ridersof route or fare changes, while also promoting new or under-utilized services. Newsletters also serve to personalize the connec-tion between the public and the transit agency; through featurearticles and human interest stories, the transit agency can projectitself in a friendlier light.
Branding is another method of image advertising. A transitagency can update its image with a new logo, a new name, new slo-gans, new colors on the vehicles, and so forth. This strategy canalso help to create a unified perception of a system that may con-tain many distinct elements. A recent example of an image adver-tising effort is CTA’s comprehensive marketing campaign toreinforce its brand identity. One element of the campaign was anew slogan: “CTA – Take it Everywhere.” The agency used this slo-gan to remind the public that CTA (bus and rail) is a “convenientand reliable way to get everywhere.” Agencies often choose toengage the public in the branding effort, by holding a logo or slo-gan design.
Corpus Christi Regional Transportation Authority Harbor Ferry Ridership Sponsorship Program medium urbanized (200,000 - 1,000,000)
Corpus Christi RTA launched a creative promotional partner-ship with local businesses to sponsor its Harbor Ferry ser-vice. During the summer tourist season, the ferry shuttles passengers between the downtown and the tourist area. Local businesses agree to sponsor free ferry services on a particular day or weekend. In exchange, they can place advertisements on the ferry and at the ferry stops, and the RTA incorporates the business into their marketing efforts. During the first year of this program, ferry ridership increased by 42%.
Exhibit 7-4. OCTAnewsletter.

Connecticut Department of Transportation Statewide Transit Branding Project (Unified Paint Scheme) medium urbanized (200,000 - 1,000,000)
In the late 1990s, the Connecticut Department of Transportation launched a branding campaign to unify services statewide under the name CTTRANSIT. As part of this effort, all new buses were painted with the CTTRANSIT logo and distinctive colors. As a result of the unified look, system identity and visibility has improved dramatically. This is an ongoing effort that will eventu-ally incorporate other public transportation modes and enhanced customer service.
Marketing & Information Initiatives 99
Special Promotions
Transit agencies often use special promotional efforts to get non-riders to try their services. Onthe national level, for instance, the American Public Transportation Association (APTA) has pro-
moted “Try Transit Week,”which encourages people to use transit at leastonce during the week, instead of driving alone in a car. Agencies acrossthe country use such opportunities to raise awareness about the benefitsof transit in their own communities. Agencies often offer special pro-motions (such as reduced or free fares) during these events to encouragenon-users to try transit. More recently, APTA has encouraged the cele-bration of “Communities in Motion Day” (see Exhibit 7-5). This effortwas designed to build support for public transportation by promotingthe benefits transit provides for communities. On this day, agencies heldinformation sessions, community discussions, raffles, fare-free days, andother promotional activities to raise transit awareness.
Utah Transit AuthorityFive Free Rides Campaign medium urbanized (200,000 – 1,000,000)
In an effort to boost summer ridership, the Utah Transit Authority introduced the “Five Free Rides” promotion. By contacting a call center or visiting the transit agency’s website, citizens could request five free all-day passes to ride the system’s buses. This promotion was successful in getting non-users of transit to try the buses; over 1/3 of coupon requests came from citizens who were not regular bus riders. Overall bus ridership rose by more than 2%
Independent of such events, agencies have successfully advertised the overall benefits (partic-ularly economic and environmental) of using transit in their own promotional efforts. Recently,
agencies have found that rising gas prices have produced“free” marketing for transit. Media coverage of the highcost of private automobile usage has naturally turned thespotlight on the public transportation alternative. Asreported in a recent Passenger Transport article, manyagencies have used this to their advantage in attractingnew riders.1 For example, the Greater Cleveland RTA (seeExhibit 7-6) has launched a marketing campaign entitled
1Michael Salmon, “As Fuel Prices Climb, Transit Ridership Grows,” Passenger Transport, April 25, 2005, p. 1.
Exhibit 7-5. APTApromotional ad.
Exhibit 7-6. GCRTA ad.
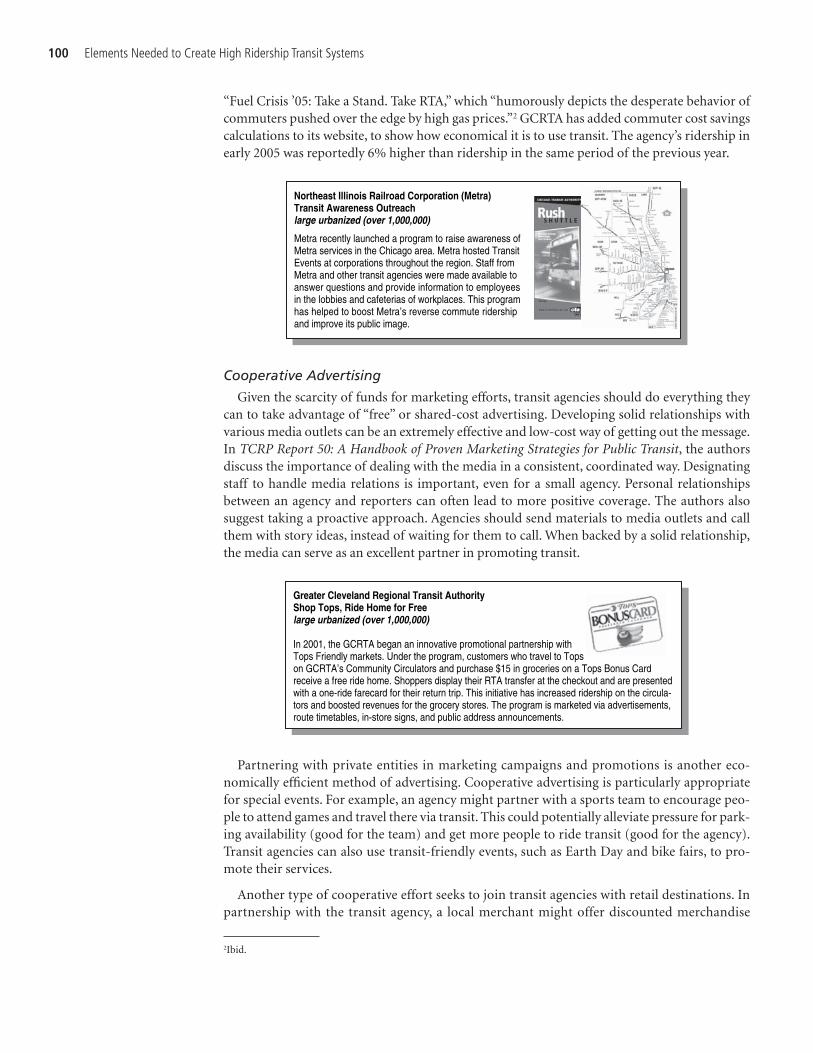
100 Elements Needed to Create High Ridership Transit Systems
Cooperative Advertising
Given the scarcity of funds for marketing efforts, transit agencies should do everything theycan to take advantage of “free” or shared-cost advertising. Developing solid relationships withvarious media outlets can be an extremely effective and low-cost way of getting out the message.In TCRP Report 50: A Handbook of Proven Marketing Strategies for Public Transit, the authorsdiscuss the importance of dealing with the media in a consistent, coordinated way. Designatingstaff to handle media relations is important, even for a small agency. Personal relationshipsbetween an agency and reporters can often lead to more positive coverage. The authors alsosuggest taking a proactive approach. Agencies should send materials to media outlets and callthem with story ideas, instead of waiting for them to call. When backed by a solid relationship,the media can serve as an excellent partner in promoting transit.
“Fuel Crisis ’05: Take a Stand. Take RTA,” which “humorously depicts the desperate behavior ofcommuters pushed over the edge by high gas prices.”2 GCRTA has added commuter cost savingscalculations to its website, to show how economical it is to use transit. The agency’s ridership inearly 2005 was reportedly 6% higher than ridership in the same period of the previous year.
Greater Cleveland Regional Transit Authority Shop Tops, Ride Home for Free large urbanized (over 1,000,000)
In 2001, the GCRTA began an innovative promotional partnership with Tops Friendly markets. Under the program, customers who travel to Tops on GCRTA’s Community Circulators and purchase $15 in groceries on a Tops Bonus Card receive a free ride home. Shoppers display their RTA transfer at the checkout and are presented with a one-ride farecard for their return trip. This initiative has increased ridership on the circula-tors and boosted revenues for the grocery stores. The program is marketed via advertisements, route timetables, in-store signs, and public address announcements.
Partnering with private entities in marketing campaigns and promotions is another eco-nomically efficient method of advertising. Cooperative advertising is particularly appropriatefor special events. For example, an agency might partner with a sports team to encourage peo-ple to attend games and travel there via transit. This could potentially alleviate pressure for park-ing availability (good for the team) and get more people to ride transit (good for the agency).Transit agencies can also use transit-friendly events, such as Earth Day and bike fairs, to pro-mote their services.
Another type of cooperative effort seeks to join transit agencies with retail destinations. Inpartnership with the transit agency, a local merchant might offer discounted merchandise
2Ibid.
Northeast Illinois Railroad Corporation (Metra) Transit Awareness Outreach large urbanized (over 1,000,000)
Metra recently launched a program to raise awareness of Metra services in the Chicago area. Metra hosted Transit Events at corporations throughout the region. Staff from Metra and other transit agencies were made available to answer questions and provide information to employees in the lobbies and cafeterias of workplaces. This program has helped to boost Metra’s reverse commute ridership and improve its public image.

Marketing & Information Initiatives 101
to holders of atransit pass orticket. For exam-ple, when EatonCounty Transpor-tation Authority
in Michigan launched its Summer Fun Pass program (seeExhibit 7-7) for youth, it sought out partnerships with 14 localbusinesses. These businesses agreed to offer discounts or give-aways to pass holders and, in exchange, the names of the busi-nesses were printed on the pass. The businesses alsocontributed funds toward advertising the program. This type ofprogram is beneficial to both parties, as it simultaneouslyencourages people to use transit and draws them into the des-tination retail area.
Finally, employers can be valuable promotional partners.Employers have built-in information distribution systems (such ase-mail and company newsletters) that can be very effective meansof informing employees about transit services—as well as otherTDM strategies (see Chapter 6). An example of a marketing pro-gram tailored to the commuter market is a Guaranteed-Ride-Home program (the cover to a guide for such a program is shownin Exhibit 7-8).
Information Improvements
Transit agencies use a range of types of informational materials and dissemination methods;the basic types of strategies include the following:
• Improved printed informational materials (e.g., printed system and route maps/schedules andon-board flyers or newsletters);
• Improved customer information and assistance (e.g., transit information center and in-stationcustomer assistants); and
• Automated transit traveler information (e.g., pre-trip planning and en-route information,including real-time information).
These types of initiatives are described below, including agency examples.
Improved Printed InformationalMaterials
Printed informational materials are designed toinform and educate the public about the availability oftransit services and how to use them. The informationcan be very specific (i.e., route maps and schedules) ormore general (e.g., on-board flyers or newsletters asdescribed above). Materials can be posted or distrib-uted at information or customer centers (such asHART’s information center, shown in Exhibit 7-9) ordistributed to passengers on board or in stations.
Exhibit 7-7. EATRAN ad.
Exhibit 7-8. Guaranteedride home guide.
Exhibit 7-9. HART information center.

102 Elements Needed to Create High Ridership Transit Systems
There are many ways to improve printed informational materials. Agencies can make theinformation usable by a wider range of potential riders by printing in multiple languages andusing recognizable symbols. Agencies must also ensure that materials are accessible to individu-als who have visual impairment, by providing (on request) Braille, large print, and even audiotape versions.3 Materials can also be improved to show connections between different modes ofservice (even when that service comes from a different provider). This allows riders to more eas-ily see how to make many potential trips using transit.
Printed materials are useful on their own, but are also needed to provide information aboutother types of strategies, including service changes or fare-related initiatives. Obviously, manyof the above types of marketing and promotional strategies also involve some type of printedmaterial.
3In fact, U.S. DOT’s Transportation for Individuals with Disabilities (Final Rule), Part 37, states that “The entity shall make avail-able to individuals with disabilities adequate information concerning transportation services. This obligation includes mak-ing adequate communications capacity available, through accessible formats and technology, to enable users to obtaininformation and schedule service.” Federal Register, Vol. 56, No. 173, p. 45640.
District of Columbia, Department of Transportation Bus Route Maps medium urbanized (200,000 - 1,000,000)
In 2004, Washington D.C.’s Department of Transportation began installing more than 300 new maps at bus shelters throughout the city. The new large scale maps are custom- ized for each individual shelter’s location. The maps display all the routes serving that particu- lar stop, as well as city-wide bus routes. Passengers can easily see the many destina- tions that can be reached by bus. It is hoped that the maps will also encourage transit non-users to try riding the buses.
Santa Maria Area Transit Bi-lingual Route Brochures medium urbanized (200,000 - 1,000,000)
Santa Maria Area Transit recently revised its informational materials to encourage more ridership among the Spanish-speaking population. The three elements of this initiative were: revised route brochures featuring bilingual infor-mation, a comprehensive new bilingual Bus Book containing all route maps and timetables as well as rider information, and satura-tion of the Spanish mass media market including TV, radio, and print media.

Orange County Transportation Authority OCTA: Putting Customers First - Customer Service Changes large urbanized (over 1,000,000)
In 2003, the Orange County Transportation Authority launched a comprehensive campaign to improve customer service. Many elements of the initiative focused on improv-ing the personal interactions between riders and customer information assistants. The improvements included expand-ing Customer Information Center hours and advertising information staff employment opportunities to transit riders, to increase the number of staff who are regular transit users.The agency also provided hands-on transit route training for customer information staff, toensure that staff could successfully advise customers in the event that the automated trip plan-ning system was unavailable. These improvements have contributed to an overall system rider-ship increase of 8.6% in the past year.
Marketing & Information Initiatives 103
Improved Customer Information and Assistance
In addition to printed materials and automated information distribution methods (see thenext section), the provision of “live” customer information and assistance services continues tobe an important strategy. Typically, an individual can call a customer service line or visit an infor-mation center to inquire about service availability, schedules, and fares. Many transit agencies,
when creating new transit centers or updating old ones, havesought to incorporate customer service operations into thedesign.
Some agencies, particularly those with rail stations, alsoprovide in-station (or transit center) customer assistants. Incities such as New York City and Chicago, for example, thetransit agencies have taken advantage of the introduction ofautomated fare collection to improve in-station customerassistance. Since both the NYMTA and the CTA have elimi-nated tokens in favor of automated farecards, many of the for-mer token clerks have been converted to station customerassistance agents. They wear distinctive uniforms and assistpassengers by answering questions and helping with the auto-mated fare machines. (An in-station customer information
agent for the MBTA in Boston, which is in the process of installing an AFC system, is pictured inExhibit 7-10).
4Additional information on TTI is available in several recent reports, including: TCRP Report 92: Strategies for Improved TravelerInformation (2003) and TCRP Synthesis Report 48: Real Time Bus Arrival Information Systems (2003), and TCRP Project J-09—eTransit: Electronic Business Strategies for Public Transportation—Advanced Features of Transit Web Sites (2003).
Exhibit 7-10. MBTA cus-tomer information agent.
Automated Transit Traveler Information
Transit agencies’ ability to deliver transit information has improved significantly over the pastdecade with the advent of (1) new technologies, such as automatic vehicle location (AVL) andadvanced communications; and (2) new/improved dissemination mechanisms and media, suchas the Internet, wireless application protocol (WAP), mobile telephones, and personal digitalassistants (PDAs). The various automated forms of transit information are collectively referredto as transit traveler information or simply TTI. TTI can provide riders—and those consideringusing transit—comprehensive information about multiple modes (including traffic informa-tion) in one place or from one source and on a variety of media.4

104 Elements Needed to Create High Ridership Transit Systems
The information provided via TTI can either be static (i.e., information on routes, schedules,or fares that may be updated periodically, but does not represent current service operating status)or real-time (i.e., depicting the current operational status of service). There are different ways tocategorize TTI, including the type of information or the particular communication medium.However, the most common classification scheme is one that simply groups TTI services accord-ing to the stage of the journey at which the information is received: pre-trip versus en-route;in-vehicle strategies are also often categorized separately. Strategies of each type are delivered viatechnologies such as the Internet, dynamic message signs (DMS), and wireless mobile devices.
Pre-Trip Transit Information
Pre-trip information is accessed by riders before embarking on their trips. It covers an arrayof areas such as route alignments, schedules, arrival times, delays, itinerary planning (i.e., tripplanning), and multi-modal information. This information includes timetables for individualtrain and bus routes and system maps and schematics. Hence, pre-trip transit information playsa critical role in the user’s decision on which mode to take, what route(s) to take, when to makethe trip, and how to get to his/her destination.
Automated pre-trip information can be accessed in a number of ways, including personalcomputer (i.e., to access the Internet), telephones (either land line or mobile), pagers, PDAs, andkiosks (i.e., in transit facilities or elsewhere; these can either contain pre-installed informationor can be used to access the Internet). Websites accessible by customers using screen reader soft-ware facilitates transit usage by individuals with visual impairments.5 Examples of web pagesfrom two agencies’ trip planning websites are shown in Exhibits 7-11 and 7-12.
5Examples of screen reader software include such products as JAWS Screen Reader Software (Freedom Scientific), Window-Eyes (GW Micro) and Window Bridge (Syntha Voice).
Exhibit 7-11. San Diego Transit’s itinerary planning input page.

Exhibit 7-12. SEPTA TransitQuest itinerary details.
Marketing & Information Initiatives 105
En-Route (and In-Terminal/Wayside) Transit Information
The importance of providing transit information does not stop once the traveler embarks onhis/her trip. Quite often, and for various reasons, transit vehicles do not run according to thepre-trip information the traveler has received. En-route travelers may experience anxiety if theirvehicles do not arrive on time according to the schedule, they are not sure where to go to catchtheir intended vehicle, or if they have missed the last vehicle (or do not know if they missed thelast vehicle). Providing en-route transit information plays a significant role in keeping travelersinformed about the status of their vehicle, reducing their anxiety, and directing them to the rightstops, platforms, and bays.
Real-Time Information
Real-time or dynamic information informs riders of the current status of a particular route orline, including updates on service delays or diversions, as well as estimated vehicle arrival anddeparture times for stops along the routes. Obviously, such information must be updatedfrequently. At bus stops and in rail stations, real-time updates can be delivered to riders via DMSs,video monitors, and/or public address systems. However, updated vehicle arrival time and delayinformation can also be included on the agency’s website or automated telephone answeringsystem—or perhaps a local cable television channel. As these systems become increasinglyinteractive, an agency might consider disseminating updates or alerts to subscribing passengersvia e-mail to personal computers or text messages to pagers, mobile phones, or PDAs.
The majority of real-time bus arrival information systems are based on the use of data fromglobal positioning system (GPS) based AVL systems, although other types of AVL systems (e.g.,signpost and transponder systems) are also being used in some real-time systems. The locationdata generated from an AVL system is used together with other information, such as current andhistorical traffic conditions, as well as real-time operations data from the last several buses thatpassed a particular stop, to predict the arrival time of the next bus at a particular stop.

In-vehicle Transit Information
In-vehicle transit information provides important information to travelers while they are ona bus or train. In-vehicle information provided by automated annunciator systems helps transitagencies comply with the Americans with Disabilities Act (ADA) by informing passengers ofupcoming stations and major bus-stop locations in both text and audio formats. Furthermore,in-vehicle information reassures passengers that they have taken the right vehicle and route.On-board displays are also used for informing passengers about transfer points, service disrup-tions, or other events.
Most transit operators that are implementing these systems are supplying some combinationof audible and visual information on next stop, major intersection, and transfer points to achieveboth objectives. Two primary media are used: automated audible annunciators and in-vehicledisplays. Both can communicate location-related information to customers based on locationdata from the AVL system, typically processed using an on-board microprocessor that is oftenused to support other on-board systems.
Another development is integrating bus destination signs with AVL systems to ensure thatdestination information display for waiting passengers is accurate. This is particularly importanton multi-route corridors or multiple-branch routes. This integration takes the responsibilityaway from the vehicle operator by automating destination sign changes with the AVL/CADsystem. Perhaps the most sophisticated examples of in-vehicle information involve transitagencies that are enhancing their fleet management systems so that passengers who are alreadyon board can request and get confirmation on transfers to other transit services. This technol-ogy, called transfer connection protection (TCP) is being deployed in several agencies in theUnited States.
The technologies that can be used for accessing TTI can be categorized as follows:
• Non-Interactive Displays—These devices can be divided into DMSs at bus stops and trainstations, DMSs on board vehicles (automated annunciation system signage), and videomonitors. DMSs are morepopular than video moni-tors as they come in avariety of shapes and sizesand are more versatile.Video monitors and way-side DMSs are mainlyused to display arrivaltimes, bay information,and service delays, whileon-board DMSs are mainlyutilized for announcingand displaying next-stop information. (An example of a DMS, from LACMTA, is shown inExhibit 7-13)
• Kiosks—Kiosks are being deployed at major bus centers, train stations, and other public placessuch as hotels, airports, and commercial centers. The single most important advantage ofkiosks is that they are interactive devices. This feature allows the users to access the informa-tion they need in a relatively short time. Moreover, kiosks can provide an infinite amount ofinformation when they are connected to the Internet, by providing links to a host of sites likeweather, traffic, and other local information sites. (An example of a kiosk, from Denver RTD,is shown in Exhibit 7-14.)
106 Elements Needed to Create High Ridership Transit Systems
Exhibit 7-13. LACMTA dynamic message sign.

• Personal Communications Devices—This category includes tra-ditional land-line phone and wireless devices such as cellularphones, pagers, and PDAs. Wireless devices are not limited toaccessing real-time information but are also being used to providestatic schedule information (e.g., providing transit schedules thatcan be downloaded to a subscriber’s PDA, or enabling use of a cellphone to receive a trip itinerary).
• Internet and E-mail Services—Through the Internet, users can access a variety of TTI at any time to obtain schedules, real-time arrival information, itineraries, and other TTI. E-mail services, on the other hand, are usually limited to informationon delays, incidents, emergencies, or real-time arrival infor-mation. Furthermore, unlike the Internet, e-mails are not in-teractive and are one-way messages. (An example of a page from Portland Tri-Met’s Transit Tracker website, is shown inExhibit 7-15.)
While many transit agencies lack the resources to considerimplementing the more sophisticated information options, a grow-ing number are automating at least the basic types of informationon routes, schedules, and fares (e.g., through establishment of an
Marketing & Information Initiatives 107
Exhibit 7-14. Den-ver RTD kiosk.
Exhibit 7-15. Tri-Met transit tracker website dynamic message sign.

108 Elements Needed to Create High Ridership Transit Systems
VISTA Implementation of a Countywide Bus Tracking and Arrival Prediction System medium urbanized (200,000 - 1,000,000)
The Ventura Intercity Service Transit Authority recently implemented a countywide bus tracking and arrival pre-diction system. 100 buses were equipped with GPS tracking devices to monitor loca-tions. Riders can check bus progress and estimated arrival times via the web. Riderswaiting at transfer points throughout the county can see predicted arrival times on electronic signs. This service contributedto a 15% ridership increase in 2004.
Tompkins Consolidated Area Transit TCAT Trip Planning Interactive Website rural area (Under 50,000)
In 2002, Tompkins Consolidated Area Transit of Ithaca, NY, added trip planning features to its website. Riders select their origin and destination,as well as date and time of travel. Riders can also choose from a number of preferences, including mode and accessibility. The system will displaythe best options available, which can be sorted bytime, fare, and number of transfers. This project contributed to 3.8% increase in fixed route ridershipbetween 2002 and 2003.
agency website or perhaps including their information on a municipal or county website). Asmore and more agencies are able to take advantage of these emerging applications to dissem-inate up-to-date—and even real-time—information on the services they offer, they will clearlyimprove their ability to attract and retain riders.

109
C H A P T E R 8
Introduction
A widely used set of strategies, actions and initiatives that can contribute to efforts to increaseridership is fare collection/fare structure initiatives. The types of strategies—and specificactions/examples—included in this category are shown inTable 8-1. These types of strategies are generally intendedto attract and retain riders by improving the quality of tran-sit service or by making the price of transit use more com-petitive with the costs of using an automobile or othermodes. Thus, each strategy should address one or more ofthe following mode choice factors:
• Convenience,• Cost of using transit, and• Perceived “image” of the system.
Guidance on the development of appropriate fare-related strategies is provided below. This is followed by asection describing each type of strategy, including agencyexamples.
Design/Implementation Guidelines
The basic planning activities and types of considerations for fare-related initiatives aredescribed below. Table 8-2 presents a checklist of the recommended steps an agency should con-sider in identifying and developing strategies within this category.
Applicable Settings
As indicated in Table 8-3, most fare collection/structure strategies are potentially applicablewithin any type of mode or service environment. One strategy, regional payment integration,will not be applicable in all locations (i.e., if the agency does not directly interface with any otheragencies) and may not prove cost-effective in most rural areas. Moreover, smaller agencies maynot find it cost-effective to provide expanded fare media distribution/reload options. As withother types of strategies, each specific action must be designed to reflect the agency’s particularneeds and constraints.
Fare Collection/Structure Initiatives

110 Elements Needed to Create High Ridership Transit Systems
Type of Strategy Specific Actions/Examples Fare collection improvements Improved payment convenience Automated fare collection, new prepaid fare options, expanded fare media
distribution/reload options Regional payment integration Regional smart card program
Fare structure changes Fare structure simplification Elimination of fare zones; elimination of express or rail surcharge
Fare reduction Deeply discounted options; reduced base fare; free transfers, free fare zone
Table 8-1. Types of fare collection/fare structure initiatives.
Planning Activities
In identifying possible fare collection and fare structure changes, an agency must separatelyconsider each of these areas (as indicated in Table 8-2), but it is also useful to consider the inter-relationships between the two: the nature of the fare structure can affect decisions regarding aparticular type of fare collection technology and, conversely, the selection of automated farepayment facilitates consideration of a range of new types of payment options. Ideally, policy goalsand constraints should guide decisions in both areas, and planning for changes should be aniterative process.
Realistically, though, the most common approach is to make decisions on fare collectionand fare structure independent of each other. Typically, an agency procures a new farecollection system and then reevaluates the fare structure and types of payment optionsoffered. The key review/design processes an agency might follow in each area are summarizedbelow.
Fare Collection System Design Process
The following process is often used by transit agencies in selecting a new fare collection tech-nology and developing a conceptual design for a new/modified fare collection system. (This listrepresents an expansion of the fare collection aspects of the checklist shown in Table 8-2):
• Identify agency goals, issues and constraints—Gather input through review of any policystatements and working memoranda, as well as interviews with management/staff repre-senting various agency functions (including administration, operations, finance, revenuemanagement/accounting, planning, analysis, marketing/communications, customer service,and maintenance), and possibly with key Board members.
• Conduct peer agency review—Review experiences of selected other transit agencies that havepreviously implemented various technologies and methods that might be considered here.
• Identify problem areas and opportunities for improvement—Conduct an assessment of thecurrent fare system and, based on the findings of the above tasks, identify potential areas ofimprovement.
• Identify and evaluate payment/collection, technology, and equipment options (includingfare media distribution/reload options)—Develop screening criteria and conduct a review/assessment of the alternative types of payment methods, technologies (e.g., paper media,magnetic farecards, and smartcards) and equipment (e.g., fareboxes, ticket vending machines,and faregates) the agency could consider.
• Develop conceptual design—Based on the above tasks, develop a conceptual design for a newsystem that addresses the agency’s needs and goals. This should include a comparison ofthe benefits/costs of purchasing a totally new system versus upgrading the existing system

Fare Collection/Structure Initiatives 111
Mode Service Environment Type of Strategy Bus Rail Large
UrbanMediumUrban
SmallUrban
Rural Suburb CBD
Improved payment convenience + + + + + o + + Regional payment integration + + + + + o + + Fare structure simplification + + + + + + + + Fare reduction + + + + + + + +
Key: – = not applicable or inappropriate; o = applicable, but may not be cost-effective; + = applicable and appropriate
Table 8-3. Applicable modes/settings for types of fare collection/structure initiatives.
Key Steps/Activities Fare Collection System Design Process
C onduct needs assessment of fare collection system Identify goals, issues and constraints Conduct peer agency review Identify problem areas and opportunities for improvement
I dentify/evaluate fare collection options Identify payment/collection options (e.g., proof-of-payment, off-board payment) Identify technology options (e.g., magnetic farecard and smart card) Identify fare media distribution/reload options (e.g., autoload) Evaluate options
S election of strategy Develop conceptual design Identify costs of new/upgraded system Develop implementation plan
I mplement selected strategy Procure new equipment Hire additional personnel (if necessary) or train existing personnel Develop informational/marketing materials regarding strategy(ies)
Fare Structure Development Process Evaluate current fare structure
Identify goals, issues and constraints Identify ridership and revenue trends Conduct peer agency review Identify problem areas and opportunities for improvement
I dentify fare structure options Identify fare strategy options (e.g., elimination of zones or surcharges) Identify pricing options (e.g., reduction of base fare, free fare area, free transfers, discounts)
C onduct market research/public outreach Conduct survey of current riders (e.g., on-board/in-station) Conduct survey of non-riders or infrequent riders (e.g., telephone) Conduct focus groups of riders and non-riders Meet with stakeholder groups (e.g., civic, government, business, institutional interest groups) Conduct public meetings or open house sessions
E valuate fare structure scenarios Develop fare ridership/revenue model Develop & evaluate alternative fare structure scenarios Select fare policy/structure modifications Develop implementation plan
I mplement selected strategy Procure new equipment or materials (if any) Hire additional personnel (if necessary) or train existing personnel Develop informational/marketing materials regarding strategy(ies)
Monitor performance of strategy Identify actual ridership impact Make any necessary operational adjustments
Table 8-2. Checklist—Developing and implementing fare-related initiatives.

112 Elements Needed to Create High Ridership Transit Systems
(e.g., replacing outmoded components and perhaps adding automated technology capabili-ties). The conceptual design should address such issues as data requirements, software/communications requirements, and labor/organizational implications of the new system.
• Identify costs of new/upgraded system—Develop detailed estimates of the operating andmaintenance and capital costs of the new system; this should include annualized and lifecyclecosts for both the upgrade and new purchase options.
• Develop implementation plan—Identify the steps needed for procurement and installationof the new/upgraded system, including final design, specifications, selection and award,installation, marketing, and training.
Once the agency has decided on a particular strategy, it can proceed with procurement andimplementation.
Fare Structure Development Process
The following process is often used by transit agencies in developing fare policy/structurechanges (This list represents an expansion of the fare structure aspects of the checklist shown inTable 8-2):
• Identify agency goals, issues,and constraints—Gather input through review of any policy state-ments and working memoranda, as well as interviews with management/staff representingvarious agency functions (including administration, operations, finance, revenue management/accounting, planning, analysis, marketing/communications, and customer service) and possiblywith key Board members.
• Identify ridership and revenue trends—Review data and identify the agency’s ridership andrevenue trends over the past several years; also identify the impacts of past fare structurechanges.
• Conduct peer agency review—Review fare structures of selected other transit agencies withsimilar operating characteristics.
• Identify problem areas and opportunities for improvement—Conduct an assessment of thecurrent fare structure and, based on the findings of the above tasks, identify potential areas ofimprovement.
• Identify fare strategy and pricing options—Identify options for each fare structure element(e.g., base fare, transfers, pass types, multi-ride options, and reduced fare options) and therange of price levels that could be considered for each element.
• Conduct market research/public outreach—In order to identify potential reactions of riders(and possibly non-riders) to possible fare changes (e.g., to develop elasticity figures for inclu-sion in a fare model), it may be useful to conduct surveys. An alternative is to conduct focusgroups and/or other types of public outreach (e.g., stakeholder meetings, public meetings, oropen houses).
• Develop fare ridership/revenue model—In order to estimate the ridership and revenueimpacts of alternative fare structure scenarios, develop an elasticity-based fare model (devel-opment of elasticity figures is discussed below, under Expected Ridership Response).
• Develop and evaluate alternative fare structure scenarios—Develop alternative farestructure scenarios (i.e., combinations of fare strategies, payment methods, and pricing levelsfor each fare structure element). Evaluate the scenarios based on ridership/revenue impacts(from the fare model) and qualitative criteria (based on fare policy goals).
• Select fare policy/structure modifications—Based on the above evaluation, select farestructure modifications that best address the agency’s fare policy goals and needs.
• Develop implementation plan—Identify the steps needed for implementation of the recom-mended changes, including design/production of new payment options,marketing,and training.
Once the agency has decided on a particular strategy, it can proceed with implementation.

Fare Collection/Structure Initiatives 113
Cost/Revenue Considerations
Fare Collection Changes
Fare collection equipment is often a customized product, with many factors influencing cost.Much fare collection equipment is built in response to specific orders, partly because eachagency’s requirements impose somewhat different design constraints—even if major modulesor subassemblies are the same among several orders. Final configurations of even very similarequipment for different agencies are rarely identical. The price for any type of equipment is there-fore sensitive to such factors as
• The equipment specifications for the individual agency, including performance requirementsand features; this affects the amount of customization required for a product, and this cus-tomization can represent a substantial portion of the overall price;
• The quantities of the particular equipment being ordered;• The extent to which the new equipment will have to interface with other types of equipment
(e.g., automated passenger counters or automated vehicle location systems);• The nature of the vendor selection and negotiation process (e.g., type of contract: low-bid,
two-step, or negotiated);• The timing of the procurement (relative to the procurement of similar equipment by other
agencies—and therefore the extent of refinement of the technology);• Warranty terms: warranties are generally for 1 year, but this period can be extended based on
other clauses associated with equipment performance;• Documentation requirements (i.e., striking a balance between what is offered as manufac-
turer’s “standard” and degree of customization for the agency);• Software requirements: some software customization is expected, but requests for additional
functions, features, and reports will be considered extra and will increase the cost;• Vehicle/facility modifications: the cost of modifications to vehicles, bus garages, or other
facilities also need to be considered; and• Americans with Disabilities Act (ADA) requirements: fare collection equipment must address
ADA requirements; these include provision of sufficient room on buses to pass the farebox ina wheelchair, compliance with height requirements for buttons on vending machines, andaccommodation of needs of riders with visual impairments in purchasing and using fare media.
While farebox system costs tend to vary much less than systems involving extensive infra-structure modification (e.g., rail systems with faregates and large numbers of TVMs), the abovefactors can still result in a range of costs.
The ultimate cost of a fare collection system change to an agency will also be affected by suchissues as the following:
• Will there be any additional labor costs associated with the change (e.g., additional mainte-nance, revenue accounting, or customer service personnel)?
• Will there be any cost savings associated with the change (e.g., lower overall maintenance costsdue to replacement of outmoded equipment or lower fare media distribution costs)?
• Will there be additional revenue due to better revenue accounting and control of fare evasion?
Fare Structure Changes
While there may be some costs associated with fare structure changes (e.g., designing andprinting new fare media), the principal financial impact any agency must be concerned with isthe potential loss of revenue. Fare structure strategies designed to produce increased ridershiptypically result in reduced revenue. However, as explained below, under Fare Reduction, acarefully designed deep discounting strategy, if paired with a base fare increase, can result inincreases in both ridership and revenue.

114 Elements Needed to Create High Ridership Transit Systems
Expected Ridership Response
The most widely used indicator of the expected ridership response to a particular type of farechange is elasticity.1 Chapter 12 (Transit Pricing and Fares) of TCRP Report 95: Traveler Responseto Transportation System Changes) notes that “practically all the known observed values of fareelasticities fall in the range between 0 and −1.0, which, in economic terms, means rider responseto fare changes is inelastic. Thus, if a transit system wants to increase total fare revenues, it shouldincrease fare levels, but expect some ridership loss” (p. 12-7). In fact, while elasticities have beenfound to display considerable variation in different locations and for different market groups,general fare elasticity “exhibits relative consistency when expressed as averages. The effect of busfare increases and decreases equates on average to an arc fare elasticity about −0.40. The effect ofheavy rail transit fare changes is typically much less: short-run HRT fare elasticities average about−0.17 to −0.18, or about half the bus fare elasticities in the same cities” (p. 12-6).
While many agencies use systemwide elasticity figures, others use a different elasticity for eachmode or even different figures for individual submarkets. Elasticities can be estimated fromseveral sources and using different types of formulas. The key types of sources include
• Times series analysis of an agency’s historical ridership data; this often includes a regressionanalysis to isolate the effects of fare changes from other factors such as service changes,employment levels, or fuel prices;
• Before-after (“shrinkage”) analysis for a particular fare change;• Use of a demand function often on the basis of the results of stated preference surveys; and• Review of industry experience, particularly for agencies of similar size and with similar
characteristics.
The most common types of elasticity formulas are those known as point elasticity, shrinkageratio, midpoint arc elasticity, and constant arc elasticity. For small fare changes (i.e., less than10%), each formula should produce roughly the same elasticity. However, where larger changesare involved—or where there may be a decrease in the fare level—the midpoint or constant arcelasticity formulas are generally preferable. As mentioned above, elasticity is a key element of afare ridership/revenue model.
The different types of fare-related strategies, actions, and initiatives are described on thefollowing pages.
Fare Collection Improvements
As transit agencies increasingly adopt automated fare payment technologies, they are recog-nizing the potential to attract—and retain—riders by improving fare payment convenience,offering a broader range of payment options, and facilitating seamless travel within the region;the major types of improvements that agencies have deployed are
• Improved payment convenience (e.g., automated fare collection, new/expanded prepaid fareoptions, and expanded fare media distribution/reload options); and
• Regional payment integration (e.g., regional smartcard program).
These types of actions and initiatives are described below, including agency examples of each.
Improved Payment Convenience
As the fare system is the means by which a rider gains access to any transit service, it is impor-tant to make fare payment as convenient as possible. There are several aspects to fare paymentconvenience, including the types of available payment options, the methods for purchasing and
1For instance, a fare elasticity of “−0.3” means that a 10% increase in fare would be expected to result in a 3% ridership loss.

Fare Collection/Structure Initiatives 115
reloading these payment options, and the ease of use of the fare col-lection system. This section discusses the types and capabilities ofautomated fare collection technologies (i.e., magnetic farecards andsmartcards) and the various types of fare media distribution/reloadoptions. (Exhibit 8-1 shows the Go Ventura smartcard from VenturaCounty, CA)
Automated Fare Collection
An increasing number of transit agencies are implementing auto-mated fare collection (AFC) systems based on magnetic farecard and/orsmartcard technologies. The technologies can be described as follows:
• A magnetic farecard carries a magnetic stripe, although there are twodifferent types of magnetic media: read-only swipe cards and read-write stored-value cards. The read-only technology is similar to that used for credit or debit cardsand allows the automatic determination of the validity of an unlimited-ride pass. In contrast,read-write technology,used with a ticket processing unit (TPU) or bus ticket validator (BTV),canaccommodate stored-value and other automated payment options. A TPU can process an exist-ing farecard,and some bus TPUs can be configured to issue some types of fare media (e.g., a trans-fer or a 1-day pass or even stored value). (The remainder of this discussion focuses on read-writetechnologies.)
• A smartcard carries a small computer chip and is thus capable of storing and processing aconsiderable amount of information. While there are two basic types of smartcards, contactand contactless, only the latter is considered appropriate for use in transit settings; contactlesscards need not be inserted into a reader, but rather need only be held in close proximity—within an inch or so. Like the magnetic read-write technology, smartcards can accommodatestored-value and other automated payment options.
Both technologies can accommodate a wide range of payment options (discussed below).There are differences, however, in a number of parameters, including the cost of the cardsthemselves (magnetic media are much less expensive on a unit basis, although the cost ofsmartcards continues to drop), the cost of the card processing equipment (magnetic units tendto be more expensive to purchase and to maintain), data capacity and processing capability(considerably greater in the smartcard), ease of vending (magnetic media can be dispensedmore readily, as discussed below), and ease of use (smartcards are particularly easy to use,especially for individuals with fine motor problems).
An agency considering implementing AFC should evaluate the relative advantages anddisadvantages of the two technologies.2 Most agencies opt for magnetics, although an increas-
ing number of agencies are deciding to also include smartcard capa-bilities when they purchase new equipment. A few agencies have madethe decision to forego magnetics when they implement new AFC sys-tems. For instance, MARTA (Atlanta) is implementing an all-smart-card system; WMATA, which accepts both technologies on its railsystem, has installed new fareboxes on its buses that read smartcardsonly; Exhibit 8-2 shows the WMATA SmarTrip card).
New/Expanded Prepaid Fare Options
The use of AFC in general has influenced fare policy and has facili-tated the introduction of a range of new payment options, as well as
2For additional discussion of the relative advantages and disadvantages of the technologies, as well as case studies of agencies thathave adopted different types of systems, the reader is directed to TCRP Reports 32 and 94.
Exhibit 8-1. GoVentura smartcard.
Exhibit 8-2.WMATA SmarTripcard.

116 Elements Needed to Create High Ridership Transit Systems
the opportunity for establishment of new types of fare media distribution methods; the latter arediscussed below. Some agencies have used electronic media to essentially automate their existingoptions, while others have totally revamped their fare structures withthe installation of electronic technology. The CTA, for example, tookthe former approach, replacing its discounted tokens with stored value(with a purchase bonus) and converting its passes from fixed calendarperiods to a “rolling” (i.e., activate on first use) basis. The NYMTA rep-resents the most graphic example of the latter approach, as it movedfrom the most basic fare structure in the industry—featuring no multi-ride discounts, prepaid passes, or discounted transfers—to an auto-mated system (MetroCard; see Exhibit 8-3) that includes stored value(with a purchase bonus), several types of rolling passes, and free intermodal transfers; as discussedat the end of this chapter, these changes combined to result in a substantial ridership increase.
The basic payment options possible with electronic fare media and their purchase parameterscan be summarized as follows:
• Value-based or trip-based options—These can be either user-encoded or pre-encoded (with afixed amount). Agencies vary in their requirements for a minimum initial payment for user-encoded cards.
• Time-based options—These can either allow unlimited-rides (during the specified period) orbe capped at a certain number of rides (during the specified period). The key pass developmentrelated to automated payment has been the conversion of fixed time period passes (e.g.,“September” or “September 16–30”) to rolling passes good for a specified number of days(e.g., “31 days” or “14 days”), or perhaps even a certain number of hours(e.g., “24 hours” or “4 hours”); an example of a rolling pass is shown inExhibit 8-4. Such passes are activated the first time they are used. Thisincreases the rider’s flexibility considerably; for example, a rider can buy 4 weeks’ worth of 7-day passes, rather than a single 30-day pass if he/she willbe on vacation for a week during the month. The use of rolling passes canalso reduce the administrative burden on the agency, since pass purchasesno longer occur solely within a short time period (e.g., at the end of a monthor during the first few days of the next month). Agencies are increasinglyutilizing this approach as they introduce electronic payment.
• Combined value and time-based options—Automated payment mediaare capable of carrying both stored-value and pass options. This may bein the form of stored value for use on one mode or operator’s service,along with a time-based pass that can be used on another mode or servicein the region. In an integrated regional payment system, a rider could have a farecard that hasstored value for occasional use on all participating agencies’ services, as well as a period passspecifically for the service he/she uses on a regular basis.
• An automated payment system can also automatically facilitate a fare differential (by time ofday, mode or distance) or a transfer discount that would otherwise have to be handled using aseparate paper transfer.
The other key parameter for farecards is the type and level of discount or bonus provided asan incentive to purchase and use the card (and to use transit in general). The basic types ofdiscount/bonus options that might be considered are as follows:
• Initial purchase bonus—This is the most common form of stored-value bonus, as describedabove.
• Frequency-based per-ride discount (above a threshold number)—In this approach, areduced fare is charged for each ride above a certain minimum number of rides taken with aparticular farecard.
Exhibit 8-3.NYMTA MetroCard.
Exhibit 8-4.Rolling Pass(CT Transit).

Fare Collection/Structure Initiatives 117
• Farecard discount relative to use of cash—A farecard can carry a lower per trip fare than ifpaying cash. For instance, the CTA recently (January 2006) changed its fares such that, on bus,riders pay a lower fare if they use either a smartcard or a magnetic farecard than if they paywith cash ($1.75 versus $2.00). On rail, the discount is available only with a smartcard; usersof magnetic farecards must pay the full $2.00. In addition, riders receive reduced-pricetransfers (on bus and rail) only with a smartcard or magnetic farecard; a rider paying cashmust pay a second full fare if transferring to another vehicle.
While the above strategies can be used with any type of electronic payment, the greatermemory and processing capabilities of smartcards—coupled with the fact that they are intendedto be used for a much longer period—make it possible to consider additional pricing innova-tions that would be infeasible with magnetic media; these include
• Guaranteed last ride (or negative balance)—In this option, a ride is guaranteed, regardless ofthe remaining value on the farecard. In other words, if a rider boards a bus or enters a faregateand the farecard is revealed to have insufficient value for that trip, a “negative balance” (up tothe value of a single ride) is permitted. The next time the cardholder adds value to the card, theamount of that ride is deducted from the total value added. This strategy, being considered ina number of other programs, is attractive to riders in that it addresses concerns about runningout of farecard value where it may be inconvenient to add value (i.e., on most bus routes).
• Guaranteed lowest fare—This option is a variation on the frequency-based per-ride discountmentioned above. It can take various forms, but the basic approach is to assure riders that theywill automatically be charged the lowest fare for which they are eligible (i.e., based on their extentof usage of their farecards). A counter on the card would keep track of each card’s use within acertain time period, and the fare system would be programmed so that the rider pays the lowestpossible fare, based on his/her usage. For instance, once a cardholder has taken a certain mini-mum number of rides during a day, his/her card would automatically become treated like anunlimited-use day pass, and all subsequent rides that day would become free. Even at this point,however, rides would continue to be tracked; thus, if the cardholder used the card a sufficientnumber of times in a 7-day period, the card would become treated like a weekly pass (and subse-quently a 2-week pass, and ultimately a monthly pass—assuming these are offered by the agency).Such an approach has yet to be tried in the United States; it is now being tested in London.
• A variation on this basic strategy is to use it in conjunction with post payment (i.e., in anaccount-based system; this is described below). Such an approach has not been tried in theUnited States; it is in place in Groningen, Netherlands, and is being tested in the Frankfurtregion of Germany.
All of these strategies are intended to provide incentives to purchase and/or use a farecard—as opposed to paying with cash or using a token or paper ticket. With any of the strategies, theimpacts on both revenue and ridership will ultimately depend on the exact nature of the bonusor discount relative to the full fare—and compared to the discount offered by other prepaidoptions (if any). A guaranteed lowest fare option in particular must be evaluated carefully, as ithas the potential to result in some revenue loss: it converts rides that would otherwise have beenpaid for to free rides. An agency will thus have to balance the possible revenue loss against thelikely gain in ridership—and general marketing benefit—associated with the strategy. A morestraightforward frequency-based per-ride discount would presumably have a smaller revenueimpact—since it charges for each ride—although it may not offer an agency quite as compellinga marketing angle.
Other types of prepaid fare media an agency might consider include short-term passes (i.e.,good for 1 or more days, but less than a week) and multi-month or annual passes. The use ofshort-term passes, particularly day passes, is growing, and they are increasingly being targeted toboth regular riders and tourists. Such passes have traditionally been provided primarily for out-

118 Elements Needed to Create High Ridership Transit Systems
of-town visitors, as many agencies have sold/distributed them only through hotels, conventioncenters, and other off-site locations. However, as discussed further under Fare Structure Changes,below, agencies are beginning to view day passes as alternatives to low-priced transfers, andseveral are now selling them on board buses and in rail stations. With the growth of electronicpayment, we can expect to see an increase in the types of passes offered to riders.
Finally, multi-month or even annual passes are offered by a number of agencies, typically inconjunction with employers and universities. Such programs are discussed in Chapter 6,Partnerships/Coordination Initiatives.
Expanded Fare Media Distribution/Reload Options
A key to maximizing usage of prepaid fare media of any type—and thus maximizing theirridership potential—is to provide convenient card distribution and reload options. This is not amajor issue for rail systems, as riders can conveniently obtain and reload farecards at ticketvending machines in stations. Other channels used by agencies for distribution of fixed value orpre-encoded fare media (e.g., monthly passes, packages of tokens, multi-ride ticket books, or pre-valued stored-value farecards) include the following:
• Purchasing at agency customer service centers or “ride stores”;• Purchasing at third-party sales outlets such as grocery stores;• Ordering via mail or telephone;• Ordering via the Internet (i.e., from the agency’s website);• Distribution by employers, educational institutions or social service agencies; and• Purchasing on board buses.
Sale—and facilitating reloading—of automated payment media is more complicated thansimply distributing fixed-value or pre-encoded payment options. Any third-party location wouldhave to be equipped with a special card initialization and reloading device, and all employees whomight have to operate the device would have to be trained. Many such outlets would likely resistadding another card-processing device on or near the counter, and training would be problem-atic, given the often high turnover rate at many retail outlets. Thus, this is not likely to be a viableoption for most agencies. On-board dispensing (i.e., of magnetic stored-value farecards, daypasses or transfers) and/or reloading requires that an agency’s vehicles have the requisiteprocessing capabilities (e.g., fareboxes equipped with some type of ticket processing unit).
Chicago Transit Authority (CTA) Visitor Pass Program large urbanized (over 1,000,000)
The Chicago Transit Authority started a Visitor Pass program in 1997. Prior to this time, visitors had to pay the full base fare for any ride on CTA. The new program allows visitors to buy unlimited ride passes, valid for 1, 2, 3, or 5 days. While overall system ridership has slightly declined, Visitor Pass usage has grown significantly since its inception.
Santa Clarita Transit (SCT) Online Pass Sales large urbanized (over 1,000,000)
Santa Clarita Transit, in the LA region, has an online pass purchas- ing program. Riders can create an online account, and use a credit card to purchase monthly passes. The passes are mailed to the purchaser at his or her home. Customers also have the option ofreceiving online notification (via e-mail) when it is time to purchase the next month’s pass. The Frequent Rider program allows the customer to receive one monthly pass for free after purchas- ing eleven monthly passes online. Participation in the program has increased 37% over the last five years.

Fare Collection/Structure Initiatives 119
Employers, schools, and social service agencies, on the other hand, could be more willing toaccommodate such functions. An employer, for instance, could directly issue a farecard to itsemployees who use transit. Alternatively, employees could be directed to obtain a farecardthrough another channel, and the employer would revalue its employees’ cards; this wouldrequire the employer being equipped with a card sales/revaluing device.
Alternatively, an agency could establish an “autoload” program that facilitates automaticdownloading of passes or value to a smartcard. In this approach, currently used by WMATA(Washington, DC) in its “SmartBenefits” program, the employer provides the agency with a listof employees to be provided passes. This list is downloaded into the fare collection system suchthat when the employee tags any smartcard reader (in a rail station or on a bus) with his/hersmartcard near when the current pass is to expire, the next month’s pass is automatically loadedonto the smartcard. At WMATA, the employee accounts are maintained via a special Internet site.Thus, the employer authorizes employee participation via the site; reauthorization can berequired each month. Or, once an employee’s information has been entered, the employer mightonly be required to enter any changes to an employee’s account (e.g., to indicate that theemployee is no longer employed or no longer eligible to receive a transit benefit.)
An alternative approach to offering prepaid passes to employees (or students) would be toimplement a post-payment program whereby employers or schools would register employees forsmartcards and be billed by the agency based on actual system usage. In other words, if anemployee made only 10 commute trips in a month, the employer would pay only for thosetrips—rather than the cost of a full month’s pass. A similar approach could be utilized forindividuals (rather than employers/institutions) who establish a credit/debit card-based accountwith the agency. In an account-based system, a customer pre-authorizes the agency to initiate acredit or debit card transaction whenever the smartcard’s stored value (or value in the activetransit “account”) falls below a designated threshold (e.g., $10 or $20). The value on the card orin the active account is then automatically replenished—or a specified period pass is activated—the next time the customer touches the smartcard to a smartcard reader (i.e., similar to manyelectronic toll payment systems).
The account-based/autoload approach represents increased convenience for customers (i.e.,once they have established accounts and acquired the smartcards), since they subsequently donot have to worry about reloading their cards or obtaining newcards. Of course, this approach requires that an updated list of activecard accounts be downloaded to every farebox on a daily basis. TheCTA has instituted the first individual account-based transit pay-ment system in the United States: the Chicago Card Plus program(See Exhibit 8-5).
Finally, while transit AFC projects have thus far focused on inter-nal (i.e., transit agency) issuance and acceptance of cards, the use ofthe type of contactless smartcard technology being adopted for transit has now spread beyondtransit and thus introduces new opportunities for card issuance/acceptance partnerships in thecoming years. In particular, a number of financial institutions (including MasterCard, Visa,American Express and banks such as Citigroup, Chase, KeyBank, HSBC, and MBNA) have begunto introduce contactless credit and debit cards (and smaller payment forms such as key fobs) tar-geted to use for quickly making small purchases. The emergence of bank-issued contactless cardscreates the potential for transit agencies to equip their faregates and/or fareboxes (and possiblyhand-held readers on commuter rail) to directly accept these cards for fare payment (i.e., not justfor purchase of other fare media, as is currently the case). While this approach may not see wide-spread use on transit for at least several years, a trial of the concept was planned for New YorkCity in mid-2006: the plan was for the NYMTA to accept contactless Citigroup MasterCards atfaregates in select stations on one of its busiest subway lines. This type of arrangement is not
Exhibit 8-5.Chicago Card Plus.

120 Elements Needed to Create High Ridership Transit Systems
likely to eliminate the need for transit agencies to issue their own farecards in the foreseeablefuture, but it would improve the convenience of fare payment—and thus using transit—as some-one wishing to use transit would no longer be required to obtain a separate payment instrument.This could expand the potential transit market, particularly for occasional users.
Regional Payment Integration
With travel patterns increasingly requiring transferring between adjoining transit agencies’services, there has been a growing emphasis on the development of multi-agency agreements andintegrated regional payment arrangements. As discussed in Chapter 6, agencies are increasinglymoving from simple inter-agency transfer agreements to more comprehensive integratedregional payment systems. The emergence of electronic payment options, particularly smart-cards, has facilitated the increasing focus on integrated multi-agency payment systems—i.e.,introducing a regional farecard that is accepted at any participating agency.
The objective is to facilitate seamless travel within a region. True regional fare integrationentails all agencies adopting a common fare policy, based on regional passes along with free ordiscounted inter-operator transfers. However, the use of electronic fare media effectively permitseach agency to retain its own fare structure (i.e., passes, base fare levels, and discounts) whileagreeing to accept a common fare medium. A rider can thus pay for rides on multiple systemswith value from a common e-purse.
In a smartcard system, the rider typically would also have the option to load individual paymentinstruments (e.g., a pass) from one or more agencies onto the same card. Of course, a smartcardcan readily support a regional pass as well; the card would track the use of the pass on the differentservices, permitting allocation of revenue from pass sales among the participating agencies. Finally,with regard to inter-operator transfers, a regional smartcard can facilitate linked-trip discounts forsuch transfers; the previous trip transaction record stored on a card would automatically indicatethat the rider should receive this discount when he/she boards the second vehicle.
Of course, establishing a regional payment system is a complicated undertaking. As explainedin the FTA’s National Guidelines and Technical Specifications for Electronic Payment Systems,“Implementing a regional multiple agency payment system will require fundamental changesfrom the way each individual agency operates on its own. The integration of card/revenuemanagement functions from several agencies can be challenging. Complex partnershipagreements must be developed to address responsibilities, ownership, and allocation of costs andrevenues. A clearinghouse or payment settlement process can be established to manage theseprocesses, but all participating agencies must come to agreement on revenue management policiesand procedures.”3 The types of issues/requirements that must be considered in developing aregional fare system generally fall under the following categories:4
• Overall Policy and Business Rules—includes establishing the business structure, includingthe financial and governance framework and system procurement strategy; addressing cus-tomer concerns; and setting fare policy for the region.
• Technical Requirements—includes developing system architecture and technology standards,and identifying effective implementation staging.
• Administrative and Customer Support Functions—includes establishing revenue settlementand data-sharing procedures, as well as customer service functions.
3USDOT/Volpe Center and Multisystems, Inc. National Guidelines and Technical Specifications for Electronic Payment Systems—Regional Fare Integration Requirements (Summary), August 2000, p. 2.4Ibid. (See this document for a description of these requirements. Regional fare system requirements are also discussed in TCRPReport 32: Multipurpose Transit Payment Media, 1998.)

Fare Collection/Structure Initiatives 121
Smartcard-based regional payment programs are currently being developed or implemented inseveral regions in the United States, including the San Francisco Bay Area, Washington-Baltimorearea, and Central Puget Sound (Seattle) area, and Los Angeles, San Diego, and Atlanta. A regionalsystem has been in place in Ventura County (CA) for several years (see text box). The potentialscope of such programs is demonstrated by the plan to eventually expand the TransLink programin the San Francisco Bay Area to as many as 26 transit agencies in the region. A number of theseprograms are also pursuing smartcard-based partnerships with non-transit entities (e.g., parkingauthorities, toll operators, financial institutions, universities, employers, and social serviceagencies).5
Fare Structure Changes
Transit agencies sometimes use fare structure modifications to increase ridership; the types ofchanges that can be considered include the following:
• Fare structure simplification (e.g., elimination of fare zones, elimination of express or rail sur-charge) and
• Fare reduction (e.g., introduction of deeply discounted options, reduced base fare, free trans-fers, or free fare zone/area).
These types of actions are described below, including agency examples of each.
Fare Structure Simplification
Basic fare strategies fall into two general categories: flat and differential. In a flat fare structure,riders are charged the same fare, regardless of the length of the trip, time of day, speed or qualityof service. Alternatively, fares can be differentiated by one or more of those parameters, resultingin distance-based or zonal fares, time-based (e.g., peak/off-peak) differential, and/or service-baseddifferential (e.g., express surcharge or bus-rail differential). Each of these approaches has certainadvantages and disadvantages, mainly related to relative ease of use and administration versusridership/revenue impacts; however, the principal arguments in favor of differentiation havefocused on issues related to efficiency and equity. In particular, it has been argued that a higherfare should be charged to cover the higher operating costs associated with serving longer trips,operating peak-period service, and providing “premium” service such as express bus or rail;otherwise, the users of the higher cost services are effectively cross-subsidized by the users of
5For further discussion of such programs, including case studies of the SF, Washington, Ventura County systems, see TCRPReport 94: Fare Policies, Structures and Technologies (Update), 2003.
Ventura Intercity Service Transit Authority (VISTA) Go Ventura Regional Smart Card Program medium urbanized (200,000 - 1,000,000)
In 2001, VISTA and five other municipal transit operators in Ventura County (CA) implemented a countywide smart card program that allows residents to travel easily on any of the systems. This follows completion of an earlier regional smart card demonstration, theSmart Passport project. Like the earlier Smart Passport system, the new system includes contact- less cards. The cards are available for purchase and renewal at many sites throughout the county, as well as by mail. Riders can use the Go Ventura card as either a pre-purchased pass or an electronic purse (money added to the card is deducted each time the rider travels). With the e-purse option, a light will flash on the card reader when the amount remaining is below $5. Riders can easily add money to their e-purse smart cards on most buses. System ridershipincreased over 15% between 2003 and 2004.
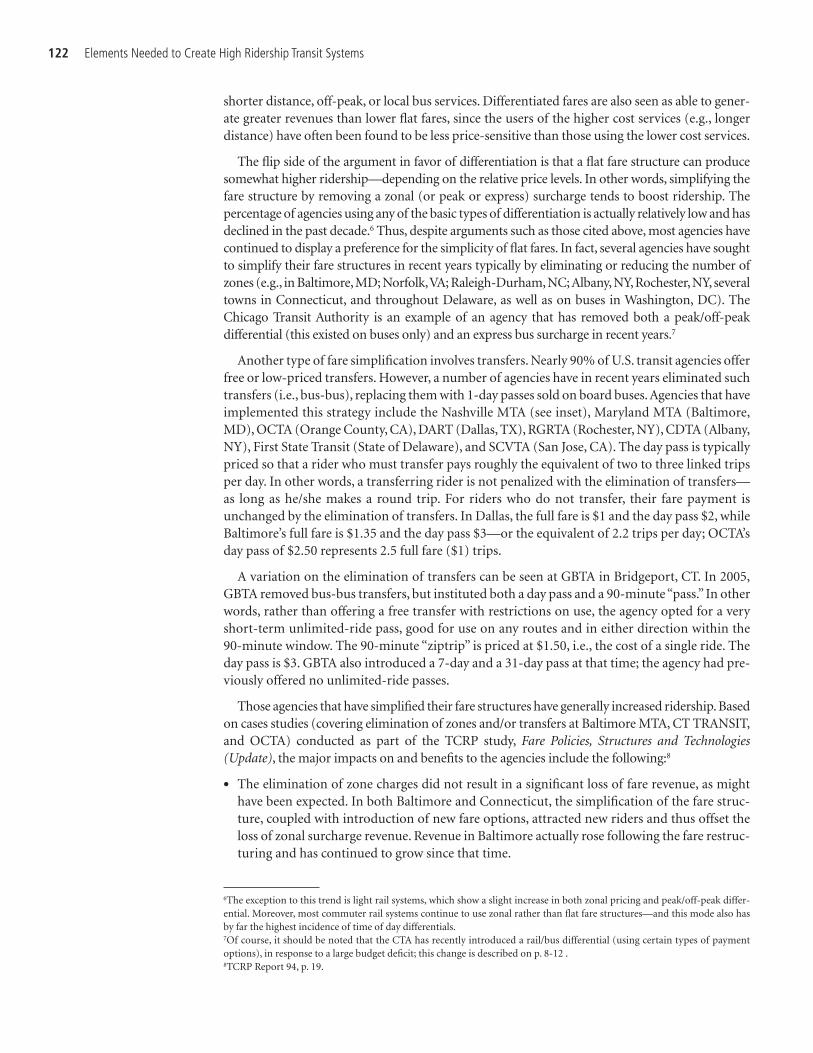
122 Elements Needed to Create High Ridership Transit Systems
shorter distance, off-peak, or local bus services. Differentiated fares are also seen as able to gener-ate greater revenues than lower flat fares, since the users of the higher cost services (e.g., longerdistance) have often been found to be less price-sensitive than those using the lower cost services.
The flip side of the argument in favor of differentiation is that a flat fare structure can producesomewhat higher ridership—depending on the relative price levels. In other words, simplifying thefare structure by removing a zonal (or peak or express) surcharge tends to boost ridership. Thepercentage of agencies using any of the basic types of differentiation is actually relatively low and hasdeclined in the past decade.6 Thus, despite arguments such as those cited above, most agencies havecontinued to display a preference for the simplicity of flat fares. In fact, several agencies have soughtto simplify their fare structures in recent years typically by eliminating or reducing the number ofzones (e.g., in Baltimore,MD; Norfolk,VA; Raleigh-Durham,NC;Albany,NY,Rochester,NY,severaltowns in Connecticut, and throughout Delaware, as well as on buses in Washington, DC). TheChicago Transit Authority is an example of an agency that has removed both a peak/off-peakdifferential (this existed on buses only) and an express bus surcharge in recent years.7
Another type of fare simplification involves transfers. Nearly 90% of U.S. transit agencies offerfree or low-priced transfers. However, a number of agencies have in recent years eliminated suchtransfers (i.e., bus-bus), replacing them with 1-day passes sold on board buses. Agencies that haveimplemented this strategy include the Nashville MTA (see inset), Maryland MTA (Baltimore,MD), OCTA (Orange County, CA), DART (Dallas, TX), RGRTA (Rochester, NY), CDTA (Albany,NY), First State Transit (State of Delaware), and SCVTA (San Jose, CA). The day pass is typicallypriced so that a rider who must transfer pays roughly the equivalent of two to three linked tripsper day. In other words, a transferring rider is not penalized with the elimination of transfers—as long as he/she makes a round trip. For riders who do not transfer, their fare payment isunchanged by the elimination of transfers. In Dallas, the full fare is $1 and the day pass $2, whileBaltimore’s full fare is $1.35 and the day pass $3—or the equivalent of 2.2 trips per day; OCTA’sday pass of $2.50 represents 2.5 full fare ($1) trips.
A variation on the elimination of transfers can be seen at GBTA in Bridgeport, CT. In 2005,GBTA removed bus-bus transfers, but instituted both a day pass and a 90-minute “pass.” In otherwords, rather than offering a free transfer with restrictions on use, the agency opted for a veryshort-term unlimited-ride pass, good for use on any routes and in either direction within the 90-minute window. The 90-minute “ziptrip” is priced at $1.50, i.e., the cost of a single ride. Theday pass is $3. GBTA also introduced a 7-day and a 31-day pass at that time; the agency had pre-viously offered no unlimited-ride passes.
Those agencies that have simplified their fare structures have generally increased ridership. Basedon cases studies (covering elimination of zones and/or transfers at Baltimore MTA, CT TRANSIT,and OCTA) conducted as part of the TCRP study, Fare Policies, Structures and Technologies(Update), the major impacts on and benefits to the agencies include the following:8
• The elimination of zone charges did not result in a significant loss of fare revenue, as mighthave been expected. In both Baltimore and Connecticut, the simplification of the fare struc-ture, coupled with introduction of new fare options, attracted new riders and thus offset theloss of zonal surcharge revenue. Revenue in Baltimore actually rose following the fare restruc-turing and has continued to grow since that time.
6The exception to this trend is light rail systems, which show a slight increase in both zonal pricing and peak/off-peak differ-ential. Moreover, most commuter rail systems continue to use zonal rather than flat fare structures—and this mode also hasby far the highest incidence of time of day differentials.7Of course, it should be noted that the CTA has recently introduced a rail/bus differential (using certain types of paymentoptions), in response to a large budget deficit; this change is described on p. 8-12 .8TCRP Report 94, p. 19.

Fare Collection/Structure Initiatives 123
• The sale of day passes on board buses effectively offset the expected loss of ridership—as wellas rider complaints—that might be expected with the elimination of free or low-priced trans-fers. Moreover, these initiatives resulted in significant revenue increases in both Baltimore andOrange County.
• These initiatives greatly reduced the extent of transfer abuse and the incidence of rider-operator arguments regarding the validity of transfers.
In short, all three of these agencies thought that they have benefited considerably from thesefare strategy initiatives. However, it should be kept in mind that, while none of these strategieshave any specific technology requirements, the on-board distribution of day passes requires sometype of pass-issuing unit if the agency is to avoid having operators be responsible for manualdistribution of the passes.
Fare Reduction
As explained above, under Fare Structure Simplification, some agencies have effectively reducedfares by eliminating surcharges. However, another means of increasing ridership is to simplyreduce the base fare or to offer some other form of fare reduction such as making transfers free,increasing the discount associated with prepaid options (i.e., passes and multi-ride options), orintroducing a free (or reduced) fare zone or area. These types of strategies are discussed below.
Base Fare Reduction
Base fare reductions are relatively rare, given the general concern with maximizing revenue.Effective reductions have been widely introduced through prepaid discounts, but these typicallyaccompany cash fare increases. However, several agencies have lowered the base fare in order toincrease ridership. For example, Chapel Hill Transit eliminated its fare in 2002 (see inset); asexplained in the inset, system ridership has grown considerably as a result, although operatingand capital costs have increased as well as a result of the need to accommodate the additionalriders. The other examples of base fare reduction within the past decade are also at relativelysmall agencies (e.g., in Ames, IA; Great Falls, MT; Savannah, GA; LaCrosse, WI; and Huntington,WVA). As explained above, Nashville MTA lowered its base fare late in 2005, but this was accom-panied by the elimination of the reduced-price transfer. A few larger agencies earlier experi-mented with fare reductions, but the fares were subsequently restored to higher levels in thesecases; examples include DART (Dallas), which lowered the cash fare from $0.70 to $0.50 in 1984but subsequently reversed that change (due to excessive revenue loss), and SCRTD (the prede-cessor agency to LACMTA in Los Angeles), which lowered the cash fare from $0.85 to $0.50 in
Metropolitan Transit Authority (MTA) Fare Restructuring medium urbanized area (200,000—1,000,000)
Following a comprehensive fare study, the Nashville (TN) MTA made several significant changes to its fare structure. Beginning in January 2005, the MTA reduced its base fare from $1.45 to $1.10, eliminated the $0.10 transfers and began to sell 1-day passes ($3.25) on board the buses.The agency had previously installed validating fareboxes capable of dispensing magnetic fare media, making the issuance of the 1-day pass feasible. As part of the fare change, paratransit fares were increased from $1.75 to $2.20 and the Downtown $0.25 Zone was eliminated. Pass and stored value farecard prices were also modified. The MTA had presented two alternative fare structures to the public, and this one was favored by nearly a 2-1 margin over a structure featuring an increase in the base fare to $1.60 (with retention of the $0.10 transfer, and no 1-day pass). The new structure has been readily accepted by MTA riders, and both ridership and revenue grew following the change. However, a larger than anticipated revenue shortfall later in the year forced MTA to raise fares: the cash fare was increased to $1.25 and the 1-day pass to $3.75.

124 Elements Needed to Create High Ridership Transit Systems
Transfer Price Reduction
Lowering the cost of transferring represents another type of fare reduction. As indicated above,most transit agencies already offer at least reduced-price transfers. However, a third of agenciesdo charge something for transfers to/from vehicles in the same system. A handful of agencies haveimplemented transfer reductions in recent years, although there has been a greater trend to movein the other direction—i.e., to charge the full fare (see Fare Structure Simplification). Examplesof recent transfer reductions include the MBTA (Boston), which introduced free bus-bus trans-fers in 2000 in response to strong community opposition to a proposed fare increase, and theNYMTA, which introduced free bus-rail transfers in 1997 as part of the roll-out of its MetroCardautomated fare system. An agency can thus consider lowering its transfer charge or making itstransfers free if it currently charges something. However, as with any of these approaches, theresulting loss of revenue must be considered carefully.
Increased Discounting of Prepaid Options
The use of discounting, particularly “deep discounting” (i.e., offering discounts of 20% ormore compared to the base fare) has been shown to increase ridership—or at least minimize the
1982, and then reversed the reduction in 1985.9 Ridership impacts of these efforts aresummarized below.
A second approach to reducing the base fare is to do so in conjunction with the elimination oflow-price transfers. Rather than essentially replacing transfers with day passes (see Fare StructureSimplification, above), some agencies have considered the possibility of eliminating transfers infavor of a significantly lower full fare (e.g., reducing the fare from $1.25 to $0.75, but eliminatingfree transfers). While this will remove the administrative/operational issues with transfers, it canresult in a substantial loss of either revenue or ridership (i.e., depending on the specific pricing andthe extent of transferring). It can also result in major fare increases for those riders making morethan one transfer on each journey. For these reasons, very few, if any, agencies have opted for suchan approach to this point. As explained in the inset, Nashville MTA reduced its base fare in con-junction with the elimination of transfers, but also opted to introduce an on-board day pass.
Chapel Hill Transit (CHT) Free Fares medium urbanized (200,000 - 1,000,000)
Chapel Hill Transit (CHT) operates public transportation ser- vices within the towns of Chapel Hill and Carrboro, NC and on the campus of the University of North Carolina-Chapel Hill. The Town of Carrboro and the University of North Carolina are part- ners with the Town of Chapel Hill in the operation of the transit system. With the primary goal of addressing on-campus park- ing shortages, the University (and its students) pushed to createa free fare policy. Fares prior to the implementation of the free fare initiative were only $0.75, with various discounted fare mechanisms. However, the towns recognized that accessibility to free public transportation would permit easy access to jobs, educational and recreational ventures to students and the public alike. Thus, the three funding partners agreed to make all regular routes fare free as of January 2002. System ridership has increased considerably since the elimination of fares, monthly ridership in the initial year was as much as 50% higher than for the same month the previous year, reaching a high of roughly 400,000 rides in April 2002. However, service was also increased on some routes that were already at carrying capacity, and both capital and oper- ating costs have increased due to the need for additional vehicles and drivers.
9SCRTD was obligated to offer the $0.50 fare for a period of three years under the terms of the passage of a $0.05 transit salestax initiative in 1980. Thus, once the three-year period was up, the agency reversed the fare change.
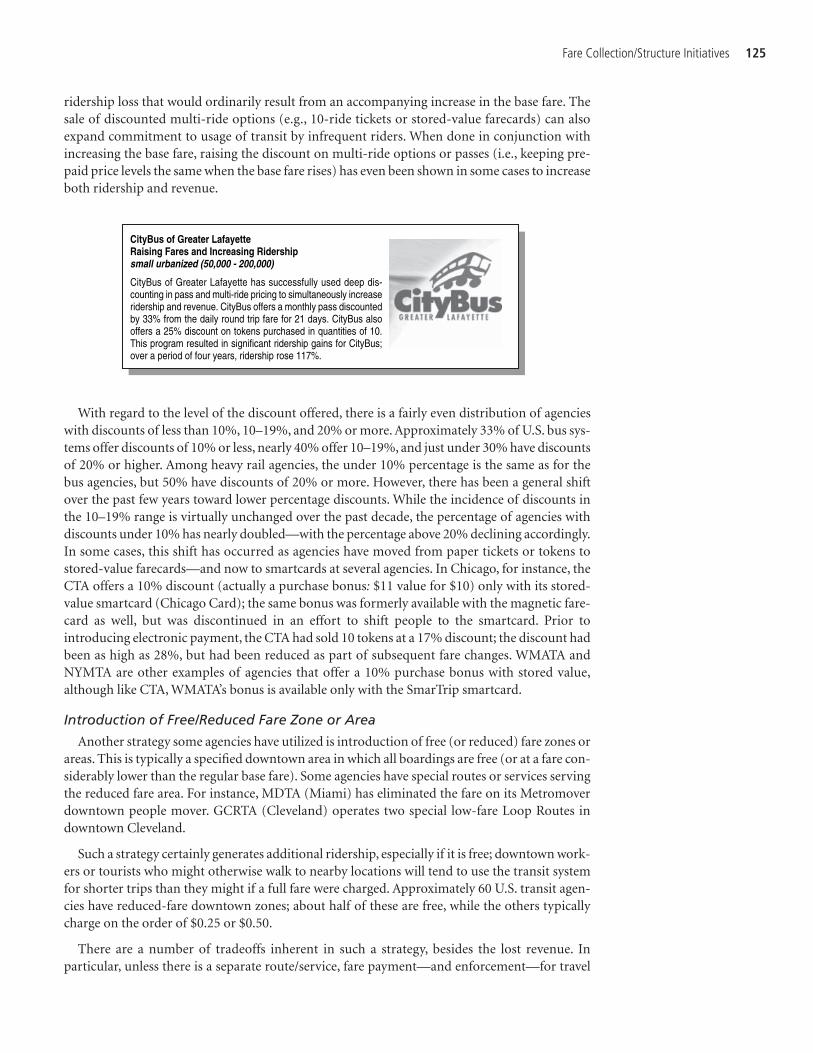
Fare Collection/Structure Initiatives 125
With regard to the level of the discount offered, there is a fairly even distribution of agencieswith discounts of less than 10%, 10–19%, and 20% or more. Approximately 33% of U.S. bus sys-tems offer discounts of 10% or less, nearly 40% offer 10–19%, and just under 30% have discountsof 20% or higher. Among heavy rail agencies, the under 10% percentage is the same as for thebus agencies, but 50% have discounts of 20% or more. However, there has been a general shiftover the past few years toward lower percentage discounts. While the incidence of discounts inthe 10–19% range is virtually unchanged over the past decade, the percentage of agencies withdiscounts under 10% has nearly doubled—with the percentage above 20% declining accordingly.In some cases, this shift has occurred as agencies have moved from paper tickets or tokens tostored-value farecards—and now to smartcards at several agencies. In Chicago, for instance, theCTA offers a 10% discount (actually a purchase bonus: $11 value for $10) only with its stored-value smartcard (Chicago Card); the same bonus was formerly available with the magnetic fare-card as well, but was discontinued in an effort to shift people to the smartcard. Prior tointroducing electronic payment, the CTA had sold 10 tokens at a 17% discount; the discount hadbeen as high as 28%, but had been reduced as part of subsequent fare changes. WMATA andNYMTA are other examples of agencies that offer a 10% purchase bonus with stored value,although like CTA, WMATA’s bonus is available only with the SmarTrip smartcard.
Introduction of Free/Reduced Fare Zone or Area
Another strategy some agencies have utilized is introduction of free (or reduced) fare zones orareas. This is typically a specified downtown area in which all boardings are free (or at a fare con-siderably lower than the regular base fare). Some agencies have special routes or services servingthe reduced fare area. For instance, MDTA (Miami) has eliminated the fare on its Metromoverdowntown people mover. GCRTA (Cleveland) operates two special low-fare Loop Routes indowntown Cleveland.
Such a strategy certainly generates additional ridership, especially if it is free; downtown work-ers or tourists who might otherwise walk to nearby locations will tend to use the transit systemfor shorter trips than they might if a full fare were charged. Approximately 60 U.S. transit agen-cies have reduced-fare downtown zones; about half of these are free, while the others typicallycharge on the order of $0.25 or $0.50.
There are a number of tradeoffs inherent in such a strategy, besides the lost revenue. Inparticular, unless there is a separate route/service, fare payment—and enforcement—for travel
ridership loss that would ordinarily result from an accompanying increase in the base fare. Thesale of discounted multi-ride options (e.g., 10-ride tickets or stored-value farecards) can alsoexpand commitment to usage of transit by infrequent riders. When done in conjunction withincreasing the base fare, raising the discount on multi-ride options or passes (i.e., keeping pre-paid price levels the same when the base fare rises) has even been shown in some cases to increaseboth ridership and revenue.
CityBus of Greater Lafayette Raising Fares and Increasing Ridership small urbanized (50,000 - 200,000)
CityBus of Greater Lafayette has successfully used deep dis- counting in pass and multi-ride pricing to simultaneously increase ridership and revenue. CityBus offers a monthly pass discounted by 33% from the daily round trip fare for 21 days. CityBus also offers a 25% discount on tokens purchased in quantities of 10. This program resulted in significant ridership gains for CityBus; over a period of four years, ridership rose 117%.

starting in the zone and ending in a full fare area tends to be an issue: riders boarding a vehiclewithin the reduced fare zone may not realize that they have to pay if they ride outside the zone,or they may purposely evade the fare in that way. Such concerns have led some agencies to elim-inate their reduced fare zones; Nashville MTA, for instance, decided to end its Downtown $0.25Zone as part of its recent fare restructuring, due to the combination of fare enforcement issuesand the need for additional revenue.
Reducing fare levels through one of the above strategies clearly offers the potential toincrease ridership. However, the magnitude of the ridership impacts obviously depend largelyon the size and nature of the reduction; for instance, is the base fare itself being lowered or isthe reduction only for multi-ride prepaid options? Impacts from several fare reduction effortscan be summarized as follows:
• In 1984, DART reduced its cash fare from $0.70 to $0.50 and the monthly pass price from $26to $20, while removing the $0.10 transfer fee (in favor of free transfers). Ridership rose by 16%following this change, and by 1986, the combination of the fare change and a significant ser-vice expansion resulted in a ridership gain of nearly 50%. However, the fare reduction—as wellas many of the service improvements—were subsequently reversed due to the resulting sig-nificant decline in the fare recovery ratio.
• In early 1990, the CTA introduced a new fare structure that featured an increase in the cashfare from $1 to $1.25, but a reduction in the unit price of ten tokens from $0.95 to $0.90. Thiscreated a multi-ride discount of 28%. By the end of the year revenue had grown (exceedingthe target for the change) with no loss of ridership.
• As part of the introduction of MetroCard, NYMTA introduced free bus-rail transfers (only withuse of the MetroCard) in 1997; previously, a second full fare was required to transfer. While theagency also subsequently introduced a stored value purchase bonus and unlimited-ride passes,the free transfer was considered to be a major contributor to a 15% ridership increase by 1998.This change was accompanied by a 4% revenue loss, as well as a significant increase in operatingand capital costs—as the higher ridership required substantial expansion of the bus fleet.
126 Elements Needed to Create High Ridership Transit Systems

Abbreviations and acronyms used without definitions in TRB publications:
AAAE American Association of Airport ExecutivesAASHO American Association of State Highway OfficialsAASHTO American Association of State Highway and Transportation OfficialsACI–NA Airports Council International–North AmericaACRP Airport Cooperative Research ProgramADA Americans with Disabilities ActAPTA American Public Transportation AssociationASCE American Society of Civil EngineersASME American Society of Mechanical EngineersASTM American Society for Testing and MaterialsATA Air Transport AssociationATA American Trucking AssociationsCTAA Community Transportation Association of AmericaCTBSSP Commercial Truck and Bus Safety Synthesis ProgramDHS Department of Homeland SecurityDOE Department of EnergyEPA Environmental Protection AgencyFAA Federal Aviation AdministrationFHWA Federal Highway AdministrationFMCSA Federal Motor Carrier Safety AdministrationFRA Federal Railroad AdministrationFTA Federal Transit AdministrationIEEE Institute of Electrical and Electronics EngineersISTEA Intermodal Surface Transportation Efficiency Act of 1991ITE Institute of Transportation EngineersNASA National Aeronautics and Space AdministrationNASAO National Association of State Aviation OfficialsNCFRP National Cooperative Freight Research ProgramNCHRP National Cooperative Highway Research ProgramNHTSA National Highway Traffic Safety AdministrationNTSB National Transportation Safety BoardSAE Society of Automotive EngineersSAFETEA-LU Safe, Accountable, Flexible, Efficient Transportation Equity Act: A Legacy for Users (2005)TCRP Transit Cooperative Research ProgramTEA-21 Transportation Equity Act for the 21st Century (1998)TRB Transportation Research BoardTSA Transportation Security AdministrationU.S.DOT United States Department of Transportation