tdr pressure cell for monitoring water content retention...
TRANSCRIPT

TDR pressure cell for monitoring water content retention and bulk electrical
conductivity curves in undisturbed soil samples
1
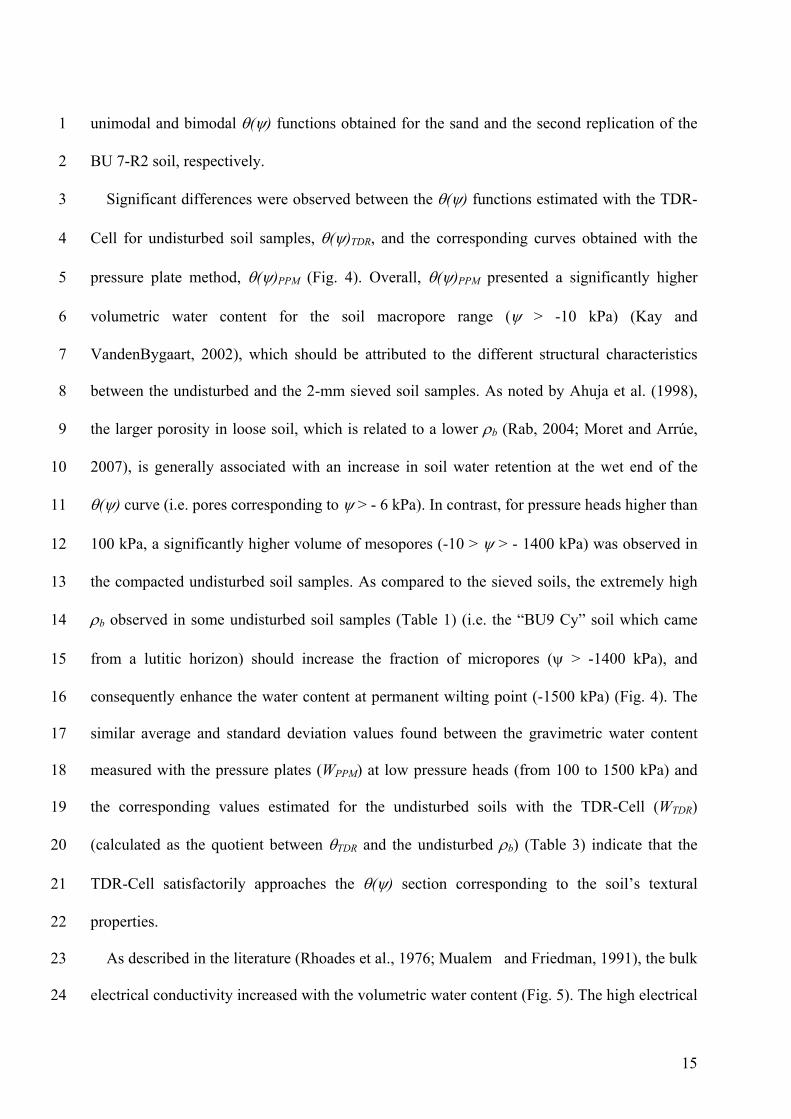
2
3
4
5
6
7
8
9
10
11
12
13
14
15
16
17
18
D. Moret-Fernández a *, J. Vicente b, B. Latorre a, F. Lera c, C. Castañeda a, M.V. López a, J.
Herrero a.
a Departamento de Suelo y Agua, Estación Experimental de Aula Dei, (CSIC), PO Box 13034,
50080 Zaragoza, Spain.
b Departamento de Ingeniería Electrónica y Comunicaciones,Universidad de Zaragoza, I3A -
Edificio I+D, C/ Mariano Esquillor S/N, Despacho 4.0.05, 50018 Zaragoza, Spain.
c Departamento de Ingeniería Electrónica y Comunicaciones, (ICMA-CSIC) - Universidad de
Zaragoza, C/ María de Luna 1, 50018 Zaragoza, Spain
* Corresponding author. Tel.: (+34) 976 716140; Fax: (+34) 976 716145
E-mail address: [email protected] 19
20
1

Acknowledgments 1
2
3
4
5
6
This research was supported by the Ministerio de Ciencia e Inovación (Grants: AGL2007-
66320-CO2-02/AGR), CSIC (Grants: PIE-200840I214 and 2008401246) and DGA- Obra
social La Caixa (Grants: GA-LC-010/2008; GA-LC-006-2008). The authors are grateful to E.
Paracuellos, A. Bielsa, J. Salvador and R. Gracia for technical help in several aspects of this
study.
2

TDR pressure cell for monitoring water content retention and bulk electrical
conductivity curves in undisturbed soil samples
1
2
3
4
5
6
7
8
9
10
11
12
13
14
15
16
17
18
19
20
21
22
23
Abstract
The water retention curve (θ(ψ)), which defines the relationship between soil volumetric
water content (θ) and matric potential (ψ), is of paramount importance in characterizing the
hydraulic behaviour of soils. However, few methods are so far available for estimating θ(ψ) in
undisturbed soil samples. We present a new design of TDR-pressure cell (TDR-Cell) for
estimating θ(ψ) in undisturbed soil samples. The TDR-Cell consists of a 50-mm-long and 50-
mm internal diameter stainless steel cylinder (which constitutes the outer frame of a coaxial
line) attached to a porous ceramic disc and closed at the ends with two aluminium lids. A 49-
mm-long and 3-mm-diameter stainless steel rod, which runs longitudinally through the centre
of the cylinder, constitutes the inner rod of a coaxial TDR probe. The TDR-Cell was used to
determine the θ(ψ) curves of a packed sand and seven undisturbed soil samples from three
profiles of agricultural soils. These θ(ψ) curves were subsequently compared to those obtained
from the corresponding 2-mm sieved soils using the pressure plate method. Measurements of
bulk electrical conductivity, σa, as a function of the water content, σa(θ), of the undisturbed
soil samples were also performed. An excellent correlation (R2 = 0.988) was found between
the θ values measured by TDR on the different undisturbed soils and the corresponding θ
obtained from the soil gravimetric water content. A typical bimodal θ(ψ) function was found
for most of the undisturbed soil samples. Comparison between the θ(ψ) curves measured with
the TDR-Cell and those obtained from the 2-mm sieved soils showed that the pressure plate
method overestimates θ at low ψ values. The σa(θ) relationship was well described by a
3

simple power expression (R2 > 0.95), in which the power factor, defined as tortuosity, ranged
between 1.18 and 3.75.
1
2
3
4
5
Keywords: Time Domain Reflectometry; Volumetric water content; Pressure plate extractor;
Coaxial cell.
4

1. Introduction 1
2
3
4
5
6
7
8
9
10
11
12
13
14
15
16
17
18
19
20
21
22
23
24
The relationship between the soil volumetric water content (θ) [m3m-3] and the matric
potential (ψ) [kPa], i.e. the water retention function, θ(ψ), has become crucial for
characterizing the soil hydraulic properties, the key feature for planning and managing new
irrigation schemes. The water retention curve is very dependent upon the particle-size
distribution, which determines the soil texture, and the arrangement of the solid particles,
which refers to the soil structure. The shape of the water retention curve is also dependent on
the soil organic matter and the soil water composition (Dane and Hopmans, 2002).
Common approaches for estimating θ(ψ) require paired ψ and θ measurements. The water
retention information is commonly obtained by bringing the soil sample to equilibrium by
applying a constant pressure gradient across the soil, driving water movement while
preventing air entering into a pressurized chamber (Dane and Hopmans, 2002). The θ is
generally calculated from the gravimetric water content and the dry bulk density of the soil
sample, or in cases where the sample is an undisturbed soil contained in a cylinder, by using
the cylinder volume directly. The most common laboratory technique for estimating θ(ψ) is
the pressure plate extractor. A pressure plate extractor referred to as a “Temple cell” is
commonly used for suctions up to -100 kPa. For higher matric suctions (typically -1500 kPa)
more robust pressure cells are used (Wand and Benson, 2004). Depending on the dimensions
of the pressure plate extractor, disturbed or intact soil samples can be used. Measurements of
θ(ψ) in undisturbed soil samples are highly desirable because changes in pore-size distribution
caused by sieving soil samples produce substantial changes in θ(ψ) with respect to its original
shape.
Time Domain Reflectometry (TDR) is a non-destructive technique that allows simultaneous
estimations of the volumetric water content and the bulk electrical conductivity (σa). TDR
5

1
2
3
4
5
6
7
8
9
10
11
12
13
14
15
16
17
18
19
20
21
22
23
employs a fast-rise signal propagating through a porous medium in order to determine
permittivity from travel time, and electrical conductivity from signal attenuation. Water
content is inferred from the dielectric measurements due to the large contrast in the
permittivity of water compared to the soil and air (Topp and Ferré, 2002). The characteristics
of the TDR technique provide a flexible means of measuring θ at multiple locations without
requiring soil-specific calibration in many cases. These properties make it possible to combine
this technique with a classical pressure plate extractor to estimate θ(ψ). For instance, Wraith
and Or (2001) measured θ(ψ) of different soils using a combination of a 15-bar pressure plate
and a 20-cm-long TDR probe. Jones et al. (2005) designed a 19.6-cm-long TDR coaxial cell to
measure water content at adjustable pressure heads without repacking or disturbing the soil
sample. More recently, Moret-Fernández et al. (2008) developed a type of pressure cell
associated with a zigzag-shaped TDR probe for determining the soil water retention curve in
disturbed thin soil samples. However, although this last design reduces the length of the soil
cores and, consequently, reduces the risk of soil compression (Grossman and Reinsch, 2002),
the zigzag-shaped wires limit the TDR application to disturbed soil samples.
The bulk electrical conductivity of soil depends mainly on three variables: (a) the effective
θ, (b) the electrical conductivity of the soil solution, and (c) a geometric factor, which
accounts for the complex geometry of the soil matrix (Mualem and Friedman, 1991). For
unsaturated soils, Rhoades et al. (1976) found that the σa(θ) relationship could be satisfactorily
described with a polynomial function. However, as subsequently observed by Rhoades et al.
(1989), this equation was only valid for σa values close to 0.1 S m-1. On the basis of the
hypothesis that the tortuosity factor affecting the bulk electrical conductivity is identical to that
defined for predicting the soil hydraulic conductivity, Mualem and Friedman (1991) showed
6

that σa(θ) could be satisfactorily described using a simple power expression, in which the
calibration coefficient was, for most soils, equal to 2.5.
1
2
3
4
5
6
7
8
9
10
11
12
13
14
15
16
17
18
The objective of this paper is to present a new design of TDR-pressure cell (TDR-Cell) for
estimating θ(ψ) and σa(θ) curves in thin undisturbed soil samples (5-cm high). The TDR-Cell
was calibrated in water and soils with different water content and tested in packed sand and in
seven different soil samples. The undisturbed θ(ψ) curves were subsequently compared to
those obtained in the corresponding 2-mm sieved soils using a conventional pressure plate
method. This comparison will make possible to value the strengths of the TDR-Cell regarding
to the pressure plate extractor with disturbed soil samples, which is incorrectly used in many
research laboratories to estimate, for instance, the soil water retention curve or the plant
available soil water content.
2. Theory
Description of TDR
A TDR system launches an electromagnetic pulse along a transmission line and records a
signal or TDR waveform, which is expressed by the voltage (V) or reflection coefficient (ρ) as
a function of time (t). The transit time of the TDR pulse propagating one return trip in a
transmission line of length L (m) tL, is represented by
c
Lt a
L
ε2= (1) 19
20
21
22
where c is the velocity of light in free space (3x10⁸ m s-1) and εa is the apparent permittivity of
the medium (Topp and Férre, 2002). Estimations of θ from εa values are calculated by the
Topp and Reynolds (1998) linear calibration form
761161 .tt.θair
s −⎟⎟⎠
⎞⎜⎜⎝
⎛= (2) 23
7

where ts and tair are the travel time in soil and air, respectively 1
2
3
The voltage reflection coefficient of the TDR waveform, ρ, as a function of time, t, is
typically defined as
( ) ( )iVV
VtVt
−−
=0
0ρ -1 ≤ ρ ≤ +1 (3) 4
5
6
7
8
9
10
11
12
13
where V(t) is the measured voltage at time t, V0 is the voltage in the cable just prior to entering
the probe (standard impedance value of 50 Ω), and Vi is the incident voltage of the cable tester
prior to the pulse rise. The Vi has a constant value over time and, for our case, it will be
assumed to be equal to zero.
As an electromagnetic signal propagating in conductive media, the TDR waveform
undergoes attenuation. On the basis of the Giese and Tiemann (1975) thin-layer model, Lin et
al., (2008) showed that the sample electrical conductivity, σ (S m-1), recorded with an
uncoated twin-rod TDR probe, can be related to the long-time attenuation of the TDR signal
according to
⎟⎟⎠
⎞⎜⎜⎝
⎛+−
=∞
∞
Scale,
Scale,
r
P
ρρ
ZKσ
11
(4) 14
15
16
17
18
19
20
where ρ∞,Scale, is the scaled steady-state reflection coefficient corresponding to the ideal
condition in which there is no instrument error o cable resistance. Zr is the output impedance
of the TDR cable tester (50 Ω), and KP (m−1) is the probe-geometry-dependent cell constant
value, which can be determined from the probe geometries characteristics or by immersing the
probe in different electrolyte solutions of known conductivity (Wraith, 2002). The ρ∞,SC to be
used in the usual Giese–Tiemann equation is calculate according to
( )( )( )( ) ( )( ) 1
112 +
+−+−+−−
=∞∞∞∞∞
∞∞∞∞
air,SC,air,air,SC,
air,SC,air,Sclae, ρρρρρρ
ρρρρρ (5) 21
8

where ρ, ρ∞,air and ρ∞,SC are the steady-state reflection coefficient of the sample under
measurement, open in air and short-circuited, respectively
1
2
3
4
5
6
Soil water retention curves
The most common function used to describe the soil water retention curve is the unimodal
van Genuchten (1980) equation
( )
m
nrsat
r
αψθθθθ
⎥⎦
⎤⎢⎣
⎡
+=
−−
11 (6) 7
8
9
10
11
12
where n is the pore-size distribution parameter, m = 1-(1/n), α [kPa] is the scale factor, and θsat
and θr are the saturated and residual volumetric water contents, respectively. Water retention
curves for soil with multiple porosity are better approached using the model proposed by
Durner (1994), which involves the linear superposition of van Genuchten (1980) subcurves
and is expressed as
( )( )
im
ini
k
iirsatr ψα
wθθθθ ⎥⎦
⎤⎢⎣
⎡
+−+= ∑
= 11
1
(7) 13
14
15
16
17
18
19
20
21
0 < wi < 1
∑wi = 1
αi > 0, mi > 0, ni > 1
where k is the total number of i “subsystems” that form the total pore-size distribution, and wi
is a weighting factor for the subcurves.
9

Water content vs. bulk electrical conductivity curves 1
2
3
4
The σa of a soil can be considered to consist of two components: (i) the contribution of ions
in soil particles, and (ii) the contribution of ions in the soil solution (Nadler and Frenkel,
1979). The σa(θ) relationship was first described by Rhoades et al. (1976) as
( ) swa σTθσθσ += (8) 5
6
7
8
9
10
11
where σw and σs are the electrical conductivity of the soil solution and the solid phase
conductivity, respectively, and T = aθ + b, with a and b being empirical coefficients.
Alternatively, on the basis of the hypothesis that the tortuosity factor accounting for the
reduction in hydraulic conductivity is identical to the tortuosity factor reducing the soil
solution electrical conductivity, Mualem and Friedman (1991) found that σa(θ) could be
described with a simple power function (neglecting σs) as
β
satsataa θ
θσσ ⎟⎟⎠
⎞⎜⎜⎝
⎛= − (9) 12
13
14
15
16
17
18
19
20
21
22
23
where σa-sat is the soil bulk electrical conductivity at saturation and β is a tortuosity factor that,
dependent on the soil’s water transmission porosity, defines the rate of decrease between σa
and θ.
3. Material and methods
Description of the TDR-Cell
The pressure head TDR-Cell consists of a commercially available stainless steel cylinder
(50-mm long and 50-mm in internal diameter), commonly used to estimate soil bulk density,
joined through the base to a commercially available porous ceramic disc (7-mm thick and 50-
mm in diameter) and hermetically closed at the ends with two aluminium single-hole drilled
lids (Fig. 1). A 49-mm-long and 3-mm-diameter stainless steel rod, which was vertically
10

1
2
3
4
5
6
7
8
9
10
11
12
13
14
15
16
17
18
19
20
21
22
inserted in the upper lid of the TDR-Cell, runs longitudinally along the axis at the centre of the
stainless steel cylinder. This rod is connected to the inner wire of a female BNC connector,
which is glued onto the upper lid of the TDR pressure cell. The two elements, the stainless
steel rod and the cylinder, form a cylindrical coaxial line of 49-mm length and 50-mm internal
diameter. Two aluminium rings attached to several rubber joints hermetically close the lids of
the TDR-Cell against the stainless steel cylinder (Fig. 1). The TDR-Cell is connected to a TDR
cable tester (Campbell TDR100) by a 1.2-m-long RG 58 coaxial cable of 50 Ω nominal
impedance, and the TDR signals are transferred to a computer that records and analyses the
TDR waveforms using the software TDR-Lab V.1.0 (Moret-Fernández et al., 2010). The TDR
volumetric water content (θTDR) and the bulk electrical conductivity (σa) are estimated using
the Topp and Reynolds (1998) (Eq. 2) and Lin et al. (2008) (Eq. 4) models, respectively.
TDR-Cell testing and experimental design
A first laboratory experiment was performed to calibrate the effective length and the cell
constant (Kp) (Eq. 4) of the TDR coaxial probe. The effective length was calculated with the
TDR-Lab software by immersing the coaxial probe in distilled water, and the Kp was
determined by immersing the probe in different electrolyte solutions of known conductivity
(Moret-Fernández et al., 2010). Additionally, the theoretical Kp value was also calculated.
Although the probe constant for a purely coaxial cell can be calculated analytically, the
specific geometry of the TDR-Cell, in which the effect of the top and bottom metallic flanges
are not negligible, makes necessary to calculate Kp by means of numerical methods. To this
end a commercial finite elements modelling software (COMSOL Multiphysics
http://www.comsol.com/) was used. In a two-dimensional axisymmetric mode, the cell
nominal geometry was finely meshed to approximately 40000 nodes and the subsequent DC
conductivity problem was solved. The viability of the TDR-Cell for estimating water retention
23
24
25
11

curves (θ(ψ)) was tested in sand (average grain size of 80-160 μm) and in seven different
undisturbed soil samples. The gypsum of the soil samples was titrated by the loss of crystal
water from the gypsum, in accordance with Artieda et al. (2006). The undisturbed soil samples
were taken, using the core method (Grossman and Reinsch, 2002), from the genetic horizons
of three different pits (Table 1) opened for soil profile study. Two replications were performed
per soil horizon. The preparation of the soil samples required the following phases. In a first
step, the surfaces of the undisturbed soil core were carefully levelled with a scraper. The
bottom of the core was covered with a nylon base (20-μm mesh) which, glued to a stainless
steel open ring, was inserted at the bottom of the cylinder. Using a power drill, a 3-mm-
diameter and 45-mm-long hole was drilled longitudinally through the top and down the centre
of the undisturbed soil sample. The stainless steel rod of the TDR-Cell was inserted in the
drilled hole, and the top of the TDR-Cell was hermetically closed by screwing the upper
aluminium ring to the upper TDR-Cell lid (Fig. 1). A dry ceramic disc was placed on the
bottom lid of the TDR-Cell, and the stainless steel core plus the upper TDR-Cell lid were
attached to the ceramic disc. The system was finally hermetically closed by screwing the lower
aluminium ring to the bottom lid of the TDR-Cell. A first measurement of θTDR was performed
in air-dry soil conditions, which have been calculated to correspond to a soil pressure head of
about 166 MPa (Munkholm and Kay, 2002). Next, the soil sample was saturated by injecting
distilled water through the base of the TDR-Cell, and the soil was considered saturated when
the water started to leave via the top of the pressure cell. Once the soil was saturated, pressure
steps were sequentially applied at 1.7, 3, 5, 10, 50, 100, 500, and 1500 kPa. Ceramic plates
(Soil Moisture Inc. UK) with bubbling pressures of -0.5, -3 and -5 bar (Soil Moisture Inc. UK)
were used to regulate the outlet water flow for pressure heads up to 50, 100 and 500 kPa,
respectively. The outlet water flow at a pressure head of 1500 kPa was regulated using a
cellophane membrane plus a -0.5 bar ceramic plate system. Values of θTDR and σa were
1
2
3
4
5
6
7
8
9
10
11
12
13
14
15
16
17
18
19
20
21
22
23
24
25
12

recorded at soil saturation, and 24, 48 and 72 hours after starting each pressure head step for ψ
values up to -100, -500 and -1500 kPa, respectively. Preliminary measurements of θTDR
performed in the BU7-Ap and BU7-R1 soil cores at 500 and 1500 kPa of pressure heads and
24 h of time intervals during 4 days showed that 48 and 72 h were enough to reach the soil the
respective water equilibrium.
1
2
3
4
5
6 The θ(ψ) curves were fitted to the unimodal (van Genuchten, 1980) or bimodal functions
(Durner, 1994) using SWRC Fit Version 1.2 software (http://seki.webmasters.gr.jp/swrc/)
(Seki, 2007). The gravimetric water content (W) of the different undisturbed soil samples was
measured in air-dry conditions and at pressure heads up to -50 kPa, and the corresponding
volumetric water contents (θW) were calculated from W and the undisturbed soil dry bulk
density (ρb). The dry bulk density of the undisturbed soil samples was calculated as the soil
weight dried at 50 ºC for 72 hours divided by the soil volume. Since gypsum content was
relevant in the studied soils, the 50ºC temperature was used to avoid the constitutional water
release by the gypsum crystal because of the transformation of gypsum into bassanite or
anhydrite at temperatures > 50ºC (Nelson et al., 1978; Artieda et al., 2006; Lebron et al., 2009;
Herrero et al., 2009). Accounting these water molecules as moisture would be erroneous;
moreover the “dry” weight of the “cooked” soil at 105ºC would also differ from the true
weight of the naturally dry gypsum, flawing further determinations related to weight.
7
8
9
10
11
12
13
14
15
16
17
18
19
20
21
22
23
24
The different undisturbed soil θ(ψ) curves estimated with the TDR-Cell were compared to
the corresponding curves measured for disturbed soil samples using a conventional pressure
plate method (Table 1). The air-dry soil samples were ground, sieved at 2-mm diameter, and
poured into 5-cm internal diameter and 0.4-cm thick rubber rings, which were placed on the
ceramic plate of the pressure plate apparatus. The soil samples were wetted to saturation and
pressure steps were sequentially applied at 1.7, 3, 5, 10, 50, 100, 500, and 1500 kPa. A new
13

1
2
3
4
5
6
7
8
9
10
11
12
13
14
15
16
17
18
19
20
21
22
23
24
disturbed soil sample was used for each pressure head, and W was measured 24 hours after
starting each pressure head step. The volumetric water content of the disturbed soil samples
was calculated as the gravimetric water content (W) multiplied by the ρb of the sieved soil
samples (Table 1). Two replications of the water content measurements were performed per
pressure head and sampling point.
4. Results and discussion
The effective length and theoretical and experimental KP values calculated for the coaxial
probe used in the TDR-Cell were 5.14 cm, and 7.29 and 6.38 m-1, respectively. The 12%
discrepancy between the experimental and theoretical KP values can be considered as a good
approximation for a calculation derived from nominal simplified geometry parameters. The
good correlation (R2 = 0.988) and the low RMSE (RMSE = 0.017) found between the θTDR
values measured for the packed sand and for the different undisturbed soil samples and
pressure heads (in air-dry soil conditions and with ψ ranging between 0 and -0.5 bar) and the
corresponding θW indicate that the coaxial TDR probe used in this experiment is accurate
enough to estimate the volumetric water content (Fig. 2).
The ρb measured in the sand sample was 1.47 g cm-3 and the θ(ψ) obtained with the TDR
pressure cell showed a typical van Genuchten (1980) unimodal function (Fig. 3), with an
excellent fit between the measured and modelled θ(ψ) (Table 2). The undisturbed soil samples
used in the experiment had loam to silty clay loam textures, and ρb ranged from 1.21 g cm-3
for the upper soil horizons to 1.70 g cm-3 for the deeper ones (Table 1). Assuming a θr = 0, the
θ(ψ) estimated with the TDR-Cell shows a double hump for all the undisturbed samples,
which indicates that the soils presented a relevant double pore-size distribution. In these cases,
a significant w1 value (Eq. 7) was observed (Table 2). Figure 3 shows an example of the
14
unimodal and bimodal θ(ψ) functions obtained for the sand and the second replication of the
BU 7-R2 soil, respectively.
1
2
3
4
5
6
7
8
9
10
11
12
13
14
15
16
17
18
19
20
21
22
23
24
Significant differences were observed between the θ(ψ) functions estimated with the TDR-
Cell for undisturbed soil samples, θ(ψ)TDR, and the corresponding curves obtained with the
pressure plate method, θ(ψ)PPM (Fig. 4). Overall, θ(ψ)PPM presented a significantly higher
volumetric water content for the soil macropore range (ψ > -10 kPa) (Kay and
VandenBygaart, 2002), which should be attributed to the different structural characteristics
between the undisturbed and the 2-mm sieved soil samples. As noted by Ahuja et al. (1998),
the larger porosity in loose soil, which is related to a lower ρb (Rab, 2004; Moret and Arrúe,
2007), is generally associated with an increase in soil water retention at the wet end of the
θ(ψ) curve (i.e. pores corresponding to ψ > - 6 kPa). In contrast, for pressure heads higher than
100 kPa, a significantly higher volume of mesopores (-10 > ψ > - 1400 kPa) was observed in
the compacted undisturbed soil samples. As compared to the sieved soils, the extremely high
ρb observed in some undisturbed soil samples (Table 1) (i.e. the “BU9 Cy” soil which came
from a lutitic horizon) should increase the fraction of micropores (ψ > -1400 kPa), and
consequently enhance the water content at permanent wilting point (-1500 kPa) (Fig. 4). The
similar average and standard deviation values found between the gravimetric water content
measured with the pressure plates (WPPM) at low pressure heads (from 100 to 1500 kPa) and
the corresponding values estimated for the undisturbed soils with the TDR-Cell (WTDR)
(calculated as the quotient between θTDR and the undisturbed ρb) (Table 3) indicate that the
TDR-Cell satisfactorily approaches the θ(ψ) section corresponding to the soil’s textural
properties.
As described in the literature (Rhoades et al., 1976; Mualem and Friedman, 1991), the bulk
electrical conductivity increased with the volumetric water content (Fig. 5). The high electrical
15

1
2
3
4
5
6
7
8
9
10
11
12
13
14
15
16
17
18
19
20
21
22
23
24
conductivity around saturation found in the BU 7-R2, BU 9-Cy, and BU 10-Ap and By soil
samples can be related to the high gypsum content measured in these soil horizons (Table 1).
The electrical conductivity of the air-dry soils, which would correspond to the apparent
electrical conductivity of the solid phase of the soil (σs) (Eq. 8) (Rhoades et al., 1976), was in
all cases negligible. Preliminary analysis of the σa(θ) relationship showed that the polynomial
function proposed by Rhoades et al. (1976) (Eq. 8), which presented incongruent negative b
coefficients in some cases (i.e. BU 9-Cy, BU 10-Ap, and BU 10-By), was not appropriate for
describing the relationship between the bulk electrical conductivity and the volumetric water
content. These results agree with Rhoades et al. (1989), who concluded that the simplified
polynomial model (Eq. 8) was valid for σa values above approximately 0.1 S m-1. However, an
excellent fit was found between the experimental and the modelled Mualem and Friedman
(1991) σa(θ) curves (Eq. 9) (neglecting σs) (Table 4). However, unlike Mualem and Friedman
(1991), who found a β value close to 2.5 for both consolidated and unconsolidated coarse
soils, the β parameter obtained in this study ranged between 1.18 and 3.75. Since all
measurements have been performed on undisturbed soil samples, with bulk densities ranging
from 1.24 to 1.70 g cm-3, these results indicate that the β factor was largely affected by the
structural characteristics of the soils. No clear correlation (R2 = 0.17) between the β factor and
the soil bulk density was found.
5. Conclusions
This paper presents a new design of TDR-pressure cell (TDR-Cell) for estimating θ(ψ) and
σa(θ) curves on 5-cm-high undisturbed soil samples. The TDR-Cell was tested with different
soils, and the θ(ψ) curves were compared with the corresponding curves obtained with 2-mm
sieved soils using the conventional pressure plate method. The results show that the TDR-Cell
16

measures θ satisfactorily. Thus, these results indicate that the proposed TDR-Cell is, in
comparison to the pressure plate extractor, a significant advance in estimating the θ(ψ) and
σa(θ) functions in undisturbed soil samples. However, some caution is due for the time
selected to achieve the water equilibrium in the soil bulk at the largest pressure heads, since
the 48 and 72 h used at 500 and 1500 kPa of pressure head may be insufficient for fixed clayey
soils. On the other hand, further efforts should be made to improve the TDR-Cell design, using
a single ceramic plate for all ranges of pressure heads. This could be achieved by replacing the
different ceramic plates that regulate the outlet water flow by a single -0.5 bar ceramic disc
plus an adjustable valve running up to a pressure head of -15 bar. In addition, these results
open the door to further research studying the relationship between the β factor and the
tortuosity parameter of the hydraulic conductivity curves.
1
2
3
4
5
6
7
8
9
10
11
12
13
14
15
16
17
18
19
20
21
22
23
References
Ahuja, L.R., Fiedler, F., Dunn, G. H., Benjamin, J. G., Garrison, A., 1998. Changes in soil
water retention curves due to tillage and natural reconsolidation. Soil Science Society of
America Journal 62: 1228-1233.
Artieda, O., Herrero, J., Drohan, P.J. 2006. A refinement of the differential water loss method
for gypsum determination in soils. Soil Science Society of America Journal 70: 1932-1935.
Artieda, O., Herrero, J., Drohan, P.J., 2006. A refinement of the differential water loss method
for gypsum determination in soils. Soil Science Society of America Journal 70: 1932-1935.
Dane, J.H., Hopmans, J.W., 2002. Water retention and storage. In, Methods of Soil Analysis.
Part 4. (Ed. J.H. Dane and G.C. Topp), SSSA Book Series No. 5. Soil Science Society of
America, Madison WI.
17

1
2
3
4
5
6
7
8
9
10
11
12
13
14
15
16
17
18
19
20
21
22
23
Durner, W., 1994. Hydraulic conductivity estimation for soils with heterogeneous pore
structure. Water Resources Research 30: 211-223.
Giese, K., Tiemann, R., 1975. Determination of the complex permittivity from thin-sample
time domain reflectometry: Improved analysis of the step response waveform. Advances in
Molecular Relaxation Processes 7: 45-49.
Grossman, R.B., Reinsch, T.G., 2002. Bulk density and linear extensibility. In, Methods of
Soil Analysis. Part 4. (Eds. J.H. Dane and G.C. Topp), SSSA Book Series No. 5. Soil
Science Society of America, Madison WI.
Herrero, J., Artieda, O., Hudnall, W.H. 2009. Gypsum, a tricky material. Soil Science Society
of America Journal 73: 1757-1763.
Jones, S.B., Mace, R.W., Or, D., 2005. A time domain reflectometry coaxial cell for
manipulation and monitoring of water content and electrical conductivity in variable
saturated porous media. Vadose Zone Journal 4: 977-982.
Kay, B.D., VandenBygaart, A.J., 2002. Conservative tillage and depth stratification of
pororsity and soil organic matter. Soil and Tillage Research 66: 107-118.
Lebron, I., Herrero, J., Robinson, D.A. 2009. Determination of gypsum content in dryland
soils exploiting the gypsum-bassanite phase change. Soil Science Society of America
Journal 73: 403-411.
Lin, C-P., Chung, C.C., Huisman, J.J., Tang, S.H., 2008. Clarification and calibration of
reflection coefficient for electrical conductivity measurement by Time Domain
Reflectometry. Vadose Zone Journal 72: 1033-1040.
Moret, D., Arrúe, J.L., 2007. Dynamics of soil hydraulic properties during fallow as affected
by tillage. Soil and Tillage Research 96: 103-113.
18

1
2
3
4
Moret-Fernández, D., Arrúe, J.L., Pérez, V., López, M.V., 2008. A TDR-pressure cell design
for measuring the soil water retention curve. Soil and Tillage Research 100: 114-119.
Moret-Fernández, D., Vicente, J., Lera, F., Latorre, B., López, M.V., Blanco, N., González-
Cebollada, C., Arrúe, J.L., Gracia, R., Salvador, M.J., Bielsa, A., 2010. - TDR-Lab
Version 1.0 Users Guide (http://digital.csic.es/handle/10261/35790). 5
6
7
8
9
10
11
12
13
14
15
16
17
18
19
20
21
22
23
24
Mualem, Y., Friedman, S.P., 1991. Theoretical prediction of electrical conductivity in
saturated and unsaturated soil. Water Resources Research 27: 2771-2777.
Munkholm, L.J., Kay, B.D., 2002. Effect of Water Regime on Aggregate-tensile Strength,
Rupture Energy, and Friability. Soil Science Society of America Journal 66: 702-709.
Nadler, A., Frenkel, H., 1979. Determination of soil solution electrical conductivity from bulk
soil electrical conductivity measurements by the four-electrode method. Soil Science
Society of America Journal 44: 1261-1221.
Nelson, R.E., L.C. Klameth, Nettleton, W.D. 1978. Determining soil gypsum content and
expressing properties of gypsiferous soils. Soil Science Society of America Journal
42:659–661.
Rab, M.A., 2004. Recovery of soil physical properties from compaction and soil profile
disturbance caused by logging of native forest in Victorian Central Highlands, Australia.
Forest Ecology Manag. 191, 329–340.
Rhoades, J.D., Manteghi, N.A., Shouse, P.J., Alves, W.J., 1976. Soil electrical conductivity
and soil salinity: new formulations and calibrations. Soil Science Society of America
Journal 53: 433-439.
Rhoades, J.D., Manteghi, N.A., Shouse, P.J., Alves, W.J., 1989 Soil electrical conductivity
and soil salinity:new formulations and calibration. Soil Science Society of America Journal
52: 433-439.
19

1
2
3
4
5
6
7
8
9
10
11
12
13
14
15
16
17
18
Seki, K., 2007. SWRC fit – a nonlinear fitting program with a water retention curve for soils
having unimodal and bimodal pore structure. Hydrological and Earth System Science 4:
407-437.
Topp, G.C., and W.D. Reynolds. 1998. Time domain reflectometry: A seminal technique for
measuring mass and energy in soil. Soil Tillage Research 47:125-132
Topp, G.C., Ferré, T.P.A., 2002. Water content, In, Methods of Soil Analysis. Part 4. (Ed. J.H.
Dane and G.C. Topp), SSSA Book Series No. 5. Soil Science Society of America,
Madison WI.
Wand, X., Benson, C.H., 2004. Leak-free pressure plate extractor for measuring the soil water
characteristic curve. Geotechnical Testing Journal 27: 1-9.
van Genuchten, M.T., 1980. A closed-form equation for predicting the hydraulic properties of
unsaturated soils. Soil Science Society of America Journal 44: 892-898.
Wraith, J.M., 2002. Time Domain Reflectometry. p. 1289-1297. In J.H. Dane and G.C. Topp
(eds.) Methods of Soil Analysis: Part IV Physical Methods. SSSAJ Madison, WI.
Wraith J.M., Or, D., 2001. Soil water characteristic determination from concurrent water
content measurements in reference porous media. Soil Science Society of America Journal
65: 1659-1666.
20

21
1
2
3
4
5
6
7
8
9
10
11
12
13
14
15
16
17
18
19
20
21
22
23
Figure captions
Figure 1. Schematic diagram of the proposed TDR pressure cell.
Figure 2. Correlation between the volumetric water content measured with the TDR-Cell
(θTDR) in sand samples and in different undisturbed soil samples and the corresponding values
calculated from the soil gravimetric water content and the dry bulk density of the undisturbed
soil (θW).
Figure 3. Water retention curves measured with the TDR-Cell (points) in sand and in the
second replication of the BU 7-R2 soil and the corresponding modelled unimodal and bimodal
functions (lines).
Figure 4. Comparison between the water retention curves measured with the TDR-Cell in the
two replications of undisturbed soil samples, and the corresponding average curves measured
in the 2-mm sieved soil samples using the pressure plate method (PPM).
Figure 5. Comparison between the measured (points) and modelled (lines) (Eq. 8) soil
volumetric water content vs. bulk electrical conductivity relationships obtained for different
undisturbed soil samples (Table 1).

1 2 3 4
Table 1. Characteristics of the 2-mm sieved and undisturbed soil samples used to test the pressure head TDR-Cell Trench Genetic
horizon Depth 2-mm sieved soil
bulk density Undisturbed soil
bulk density
Gypsum content
Sand Silt Clay Texture
cm g cm-3 %
BU-7 AP 0-30 1.07 1.23 5.0 6.6 30.1 63.3 Silty clay loam R1 40-60 1.22 1.59 10.5 35.8 23.3 40.9 Loam R2 60-160 1.15 1.70 20.0 1.7 28.2 70.1 Silty clay loam BU-9 AP 0-30 1.03 1.21 6.1 7.4 35.8 56.9 Silty clay loam Cy 30-160 1.11 1.68 22.2 1.7 34.4 63.9 Silty clay loam BU-10 AP 0-30 1.00 1.24 17.3 7.4 35.7 56.9 Silty clay loam By 30-100 1.00 1.52 26.8 3.1 36.7 60.3 Silty clay loam
5 6 7
22

Table 2. Parameters defining the unimodal (Eq. 5) and bimodal (Eq. 6) water retention curves estimated in packed sand and in different
undisturbed soil samples (Table 1), and the coefficient of determination (R2) for the best fit between the measured and modelled volumetric
water content vs. soil pressure head.
1
2
3
Soil sample Soil horizon Replication Model θS θr
w1 α1
n1 α2 n2 R2
m3 m-3 kPa kPa
Sand 1 Unimodal 0.39 0.09 - 0.41 5.48 0.99 BU 7 AP 1 Bimodal 0.43 ≈ 0 0.47 0.31 1.90 6.7 10-4 1.32 0.99 2 Bimodal 0.48 ≈ 0 0.42 0.25 1.88 6.0 10-4 1.33 0.99 R1 1 Bimodal 0.46 ≈ 0 0.20 3.36 1.27 0.012 1.19 0.97 2 Bimodal 0.44 ≈ 0 0.45 0.41 1.19 1.4 10-5 3.14 0.99 R2 1 Bimodal 0.47 ≈ 0 0.33 0.10 1.27 2.4 10-4 1.56 0.99 2 Bimodal 0.39 ≈ 0 0.26 0.34 1.91 9.8 10-4 1.31 0.99 BU 9 AP 1 Bimodal 0.51 ≈ 0 0.66 1.44 1.24 6.8 10-4 1.29 0.99 2 Bimodal 0.49 ≈ 0 0.38 0.33 2.92 9.4 10-3 1.21 0.99 C
B
y 1 Bimodal 0.43 ≈ 0 0.04 27.87 38.97 1.4 10-3 1.22 0.99 2 Bimodal 0.44 ≈ 0 0.20 0.03 1.23 1.4 10-4 1.32 0.99 BU 10 AP 1 Bimodal 0.49 ≈ 0 0.30 0.15 3.07 8.9 10-4 1.35 0.99 2 Unimodal 0.48 ≈ 0 0.19 0.086 3.03 1.0 10-4 1.52 0.99 y 1 Bimodal 0.51 ≈ 0 0.25 0.085 3.21 7.4 10-5 1.74 0.99 2 Bimodal 0.49 ≈ 0 0.59 0.63 1.15 2.4 10-4 3.17 0.99
4
23

1 2
3
4
5
Table 3. Average and standard deviation (SD) values of the gravimetric
water content measured in all soil samples with the pressure plate method
(WPPM) and corresponding values calculated with the TDR-Cell (WTDR).
Pressure head WPPM WTDR
Average
SD
Average
SD
kPa m3 m-3
0.01 0.615 0.067 0.358 0.0881.7 0.498 0.063 0.331 0.0843 0.488 0.048 0.329 0.0885 0.447 0.044 0.308 0.08210 0.416 0.050 0.291 0.07650 0.332 0.056 0.257 0.059100 0.268 0.057 0.240 0.062500 0.217 0.048 0.234 0.0611500 0.192 0.057 0.214 0.079
6
24

Table 4. Parameters defining the simple power equation (Eq. 7) relating the volumetric water content with the bulk electrical conductivity for
the first (R1) and the second (R2) soil replications of the different undisturbed soil samples (Table 1). R2 and RMSE: coefficient of
determination and root mean square error for the best fit between the measured and modelled volumetric water content vs. bulk electrical
conductivity.
1
2
3
4
Trench Genetic horizon σsat β θsat R2 RMSE
R R
1 R2 1 R2 R1 R2 R1 R2 R1 R2
S m-1 m3 m-3
BU 7 Ap 0.045 0.055 1.180 1.381 0.45 0.47 0.99 0.98 0.005 0.001 R1 0.110 0.099 1.609 1.615 0.45 0.45 0.98 0.98 0.002 0.001 R2 0.220 0.073 3.267 1.900 0.46 0.39 0.91 0.94 0.015 0.002 BU 9 Ap 0.053 0.039 1.350 1.397 0.51 0.49 0.96 0.98 0.001 0.001 Cy 0.133 0.190 2.770 3.753 0.43 0.44 0.99 0.98 0.002 0.031 BU 10 Ap 0.400 0.649 2.133 2.322 0.50 0.49 0.96 0.97 0.008 0.017 By 0.472 0.699 2.421 3.594 0.52 0.49 0.95 0.96 0.013 0.017
5 6
25

Ceramic plate
Rubber rings
BNC connector
Inner rod
Stainless steel core
Upper lid
Bottom lid
Fig. 1
26

θW
0.0 0.2 0.4 0.6
θ TD
R
0.0
0.2
0.4
0.6
y = 1.010x - 0.005R2 = 0.987RMSE = 0.018
1:1
Fig. 2
27

Pressure head (kPa)
1e-2 1e-1 1e+0 1e+1 1e+2 1e+3 1e+4 1e+5
Volu
met
ric w
ater
con
tent
(m3 m
-3)
0.0
0.1
0.2
0.3
0.4
0.5
SandBU 7 R2
Fig. 3
28

R1
Volu
met
ric w
ater
con
tent
(m3 m
-3)
0.0
0.2
0.4
0.6
Ap
0.0
0.2
0.4
0.6
BU-7
R2
Pressure head (kPa)
10-2 10-1 100 101 102 103 104 105 1060.0
0.2
0.4
0.6
Ap
Cy
10-2 10-1 100 101 102 103 104 105
BU-9
Ap
By
10-2 10-1 100 101 102 103 104 105
BU-10
TDR-Cell 1rst Repl TDR-Cell 2nd ReplPPM
Fig. 4
29

0.1 0.2 0.3 0.4 0.5 0.60.0
0.2
0.4
0.6
0.8
0.1 0.2 0.3 0.4 0.5 0.6
Volumetric water content (m3 m-3)
0.0 0.1 0.2 0.3 0.4 0.5 0.60.00
0.05
0.10
0.15
0.20Bul
k el
ectri
cal c
ondu
ctiv
ity (S
m-1
)
0.00
0.05
0.10
0.15
0.20
0.00
0.05
0.10
0.15
0.20
0.25Ap
BU 7
R1
R2
BU 9
Ap
Cy0.0
0.2
0.4
0.6
0.8
1.0
Ap
By
BU 10
1rst replication2nd replication
Fig. 5
30