te in tone - lb finance | best retail finance company in sri … · · 2014-05-30hatton national...
TRANSCRIPT

Etched in Stone...Annual Report 2010/11

Corporate InformationName of CompanyL B Finance PLC
Legal FormPublic Limited Liability Company incorporated in Sri Lanka under the provisions of the Companies’ Ordinance No. 51 of 1938 (Cap 145) and Quoted in the Colombo Stock Exchange in January, 1998.
A Finance Company registered under the Finance Companies Act No. 78 of 1988.
A registered Finance Leasing Establishment in terms of Finance Leasing Act No. 56 of 2000.
Date of Incorporation30th May, 1971
Company Registration NumberPQ 156
Registered Office / Head OfficeNo. 275/75 OPA Building,Prof. Stanely Wijesundara Mawatha, Colombo 07.
VAT Registration No.104033431 7000
Telephone011-4521000
Facsimile011-5345327
Websitewww.lbfinance.com
SecretariesP W Corporate Secretarial (Pvt) LtdNo. 3/17, Kynsey Road, Colombo 08Telephone: 4640360-3Fax: 4740588Email: [email protected]
External AuditorsErnst & Young
Internal AuditorsBDO PartnersKPMG Ford Rhodes Thornton & Company
LawyersNithya PartnersMessrs. Paul Ratnayake Associates
BankersSeylan Bank PLCCommercial Bank of Ceylon PLCHatton National Bank PLCSampath Bank PLCNDB Bank PLCUnion Bank of Colombo LimitedPan Asia Banking Corporation PLCBank of CeylonPeoples Bank
Design and concept: Copyline (Pvt) Ltd Photography: Taprobane Street Digital Plates: Imageline (Pvt) Ltd Printing: Gunaratne Offset Ltd Production: Copyline (Pvt) Ltd

Etched in Stone...Here at L B Finance, we believe in longevity and it is evident in how far we have come in the last seven years. Our investments and strategy during these years have bolstered our foundations and we are able to look towards the next stage in our process in providing, as always, exceptional products and services which has made us a trusted name in Sri Lanka. Our achievements and performance in the financial sector have been carved into the annals of history and we will continue to make history in the years ahead.
At L B Finance, our success is etched in stone.

| L B Finance PLC | Annual Report 2010/112
ContentsVision 3Mission 3Values 3Goals 3Financial Highlights 4Chairman’s Review 6Managing Director’s Review 10Board of Directors 16Senior Management 20Management Discussion and Analysis 22Financial Performance Review 38Corporate Governance 44Risk Management 46Sustainability Report 50
Financial ReportsAnnual Report of the Board of Directors on the Affairs of the Company 62Report of the Remuneration Committee 66Report of the Audit Committee 67Statement of Directors Responsibilities 68Auditor’s Report 69Balance Sheet 70Income Statement 71Statement of Changes in Equity 72Cash Flow Statement 73Notes to the Financial Statements 74
Capital Adequacy 100Ten Year Summery 102Share Information 104Glossary of Financial Terms 106Branch Network 108Notice of Annual General Meeting 112Notes 113Form of Proxy 115

Annual Report 2010/11 | L B Finance PLC | 3
VisionTo contribute to the quality of life experienced by our depositors, customers, employees and
the general public through partnerships that fuel the growth of our Company and to create
shareholder value both in the short and long term.
MissionTo mobilise public funds by innovating investment products that will enhance the value
delivered to our depositors. To engage in prudent lending to entrepreneurs to assist them in
the creation of wealth. To embark on investments in which results can be clearly assessed
and seize new opportunities in the market. To offer a caring and personalised service that will
form the foundation for developing lasting partnerships with our stakeholders, employees
and the general public. To use training and career development to create an empowered and
committed group of employees who will drive the Company to high levels of achievement.
ValuesExcellence. Ethics. Professionalism. Transparency. Innovation. Quality
GoalsTo be a major player in the financial services sector in Sri Lanka.

| L B Finance PLC | Annual Report 2010/114
Financial Highlights 2011 12 Months to 12 Months to % Change 31.03.11 31.03.10 Rs.’000s Rs.’000s
Results of OperationsGross Income 33% 5,501,885 4,130,993Interest Income 30% 5,138,718 3,953,032Interest Expense 7% 2,418,480 2,249,805Net Interest Income 60% 2,720,239 1,703,227Net Profit Before Income Tax 90% 1,667,820 878,290Income Tax on Profits 71% 647,452 378,129Net Profit After Income Tax 104% 1,020,368 500,161Gross Dividends 40% 242,400 173,143Net Profit After Income Tax and Dividends 138% 777,968 327,018
Financial PositionTotal Assets 63% 28,097,320 17,199,943Advances 63% 23,875,238 14,634,143Deposits From Public 57% 19,619,681 12,489,789Borrowings 231% 3,526,374 1,065,377Total shareholders’ Equity 49% 2,613,718 1,756,433Market Capitalization 465% 12,126,926 2,146,971
Information Per Ordinary ShareEarnings - Basic (Rs.) 104% 14.73 7.22Dividends (Rs.) 40% 3.50 2.50Net Assets Value (Rs.) 49% 37.74 25.36Market Value at The End of the Period (Rs.) 182% 175.10 62.00Price Earnings (times) - Ordinary shares 38% 11.88 8.59
RatiosReturn on Average Assets (%) 41% 4.51 3.21Return on Average Shareholders’ Funds (%) 45% 46.70 32.20Efficiency Ratio (%) -15% 38.10 44.71Interest Spread (%) 25% 11.63 9.32Net Interest Margin (%) 12% 12.96 11.60Interest Cover (times) 22% 1.69 1.39Dividend cover (times) 46% 4.21 2.89Dividend Payout Ratio (%) -31% 23.76 34.62Equity to Assets (%) -9% 9.30 10.21
Compliance RatiosCore Capital to Risk Weighted Asset Ratio (%) -10% 12.90 14.39Total Capital to Risk Weighted Assets Ratio (%) -18% 14.23 17.34Liquid Assets to Total Assets (%) -22% 8.15 10.51Liquid Assets to Deposits (%) -20% 11.58 14.47Non Performing Loans (Net) (%) 60% 1.68 1.05
Island wide OperationNumber of Branches 26% 34 27Number of Gold Loan Centres 23% 92 75

Annual Report 2010/11 | L B Finance PLC | 5
PAT doubled During the year to Rs. 1 billionPBT reached Rs. 2 billion compared to previous year’s Rs. 1 billionInterest income for the year rose to Rs. 5 billion from previous year’s Rs. 4 billion
Company’s total a Assets base increased significantly from Rs. 17 billion
in 2009/10 to Rs. 28 billion in 2010/11 recording an YoY around of 63 per cent
Fixed deposit which account for 98 per cent of the deposit base recorded a remarkable increase
of 57 per cent to Rs. 19 billion
0
30,000Rs. Mn
10,000
15,000
20,000
25,000
07 08 09 10 11
5,000
Trend in Total Assets Base
0
6,000Rs. Mn
2,000
3,000
4,000
5,000
07 08 09 10 11
1,000
Trend in Interest Income
0
2,000Rs. Mn
1,000
1,500
07 08 09 10 11
500
Trend in Profit Before Tax
0
2,000Rs. Mn
1,000
1,500
07 08 09 10 11
500
Trend in Profit After Tax

| L B Finance PLC | Annual Report 2010/116
Chairman’s Review
“For L B Finance, the year 2010/11 has been a remarkable year where our profits exceeded a billion rupees and we grew in strength and stability.”
K D D PereraChairman

Annual Report 2010/11 | L B Finance PLC | 7

| L B Finance PLC | Annual Report 2010/118
Chairman’s Review
On behalf of the Board of Directors, it gives me great pleasure to welcome all of you, our valued shareholders to the 38th Annual General Meeting of L B Finance and present to you the Annual Report and audited financial statements for the year ended 31 March 2011. For L B Finance, the year 2010/11 has been a remarkable year where our profits exceeded a billion rupees and we grew in strength and stability.
Economic Background and Performance of L B FinanceSri Lanka recorded the highest annual GPD growth rate for the past three decades. External reserves reached historically high levels. The nation has displayed its true potential, recording significant macroeconomic achievements, when the major economies and regional economies continue to battle with various economic imbalances.
The country’s economic growth of 8 per cent in 2010, reflects a fast recovery from the setback suffered in 2009. All sectors of the economy contributed towards this expansion with agriculture sector, industry sector and services sector growing by 7.0 per cent, 8.4 per cent and 7.5 per cent respectively. The external sector rebound strongly, with the growth in export earnings and import expenditure; the latter expanding at a higher rate largely due to the hike in crude oil prices and the rise in import of motor vehicles and
electronic goods following tariff reductions. A brisk increase in inward workers’ remittances and higher inflows to the capital and financial account created a surplus in the overall Balance of Payment (BOP). The external reserves of the country reached a record high level, equivalent to 5.9 months of imports. The rupee gradually appreciated against the US dollar and strengthened against hard currencies.
Sri Lanka’s stock market thrived and emerged as one of the best performing markets in the world, reflecting economic stability and the restoration of high level of business confidence in the nation. The All Share Price Index (ASPI) rose by 96 per cent and the Milanka Price Index (MPI) increased by 83 per cent with the contribution from all sub sector price indices which were on the rising trend. Approximately, Rs. 24.3 billion was raised through Initial Public Offerings and Rights Issues during the year and the total market capitalization reached a staggering Rs. 2.2 trillion by end 2010.
The credit demand was weak early this year but it gathered momentum towards the second quarter of 2010, with the recovery of economic activity (especially in the North and the East) and drop in market lending rates. Inflation remained low throughout the year with Central Bank easing its monetary policy stance. Interest rates continued to climb down in line with the policy rate reductions and the overall growth of monetary aggregates remained consistent with the growth momentum. The conducive economic environment had a positive impact on the financial sector as indicated by the expansion in credit and accommodations, increase in profitability, enhanced capital adequacy and reduction in non-performing loans. As demand for credit picked up, the asset base of your Company increased by 83 per cent YoY, with the gold loans, hire purchase and term and trade finance loans recording high growth rates.
The leasing operations of Registered Finance Companies (RFC) performed well during the year as the leasing industry headed towards rapid growth. The reduction of import duty on motor vehicles and the tax incentives for diversifying the leasing business facilitated a constructive platform for industry growth. The opening up of the liberated areas for business and the anticipated massive Government and private sector investment in infrastructure spurred the demand for leasing. In this backdrop, the lease grantings of L B Finance grew by a whopping 150 per cent to reach Rs. 8 billion while leasing income and lease asset value grew by 40 per cent and 83 per cent respectively. It is noteworthy to mention that the growth in lease portfolio of your Company surpassed the industry growth rate due to the effective lease structuring techniques and implementation of key strategies. Going forward the increase in tax depreciation rate from 12.5 per cent to 33 1/3 per cent for equipment through the fiscal budget 2011 would rejuvenate the SME equipment market and diversify the leasing market from being heavily concentrated on the vehicle portfolio.
0
1,200Rs. Mn
600
900
07 08 09 10 11
300
Trend in Profit After Tax
Lease PortfolioInterest Income on Leases
0
16,000Rs. Mn
8,000
12,000
07 08 09 10 11
4,000
Lease Portfolio Vs Interest Income on Leases
0
2,000Rs. Mn
1,000
1,500
500Le
ase
Por
tfolio
Inte
rest
Inco
me
on L
ease
“Going forward, in the context of emerging economy status and transforming Sri Lanka as a regional financial hub immense opportunities would open up for finance sector.”

Annual Report 2010/11 | L B Finance PLC | 9
The recent hike in gold prices which increased the gold sovereign rate to over Rs. 42,000, coupled with the reduction of high interest rates charged for gold loans imposed by the Central Bank spurred the demand for gold loans in 2010. In this context, as mentioned earlier the gold loan portfolio of L B Finance rose by 82 per cent YoY while the respective interest income recorded a growth of 58 per cent.
The RFCs gradually recovered after experiencing liquidity problems in 2009. The dawning of peace and surge in domestic economic activities spurred the business opportunities of the sector. Transparency and corporate governance are expected to improve with the RFCs compliance with the regulatory listing requirements by June 2011 and boost capital levels through greater access to funds. The more frequent quarterly financial reporting by the Colombo Stock Exchange and the proposed amendments to the Finance Business Act would bring in greater prudence in operations. The regulatory aspects of the business are expected to be enhanced, providing the Central Bank of Sri Lanka with greater authority to regulate RFCs. Further, the introduction of a mandatory deposit insurance scheme would strengthen the financial safety net to protect small depositors. Tax savings such as the easing of the financial value-added tax and reduction in income tax from 35 per cent to 28 per cent based on the new budget would boost the industry lending base and profitability of the sector. These tax incentives would greatly assist the financial institutions to make a greater contribution to the Government’s development efforts and induce more people to transact with financial institutions.
Financial HighlightsIn the backdrop of, declining interest rates, restoration of public confidence and increase in domestic economic activity, many opportunities opened up for L B Finance to expand its operations and record outstanding results in 2010/11. I am proud to announce that the profit after tax of your Company reached the Rs. 1 billion mark and recorded a 104 per cent growth. Turnover grew by 33 per cent to Rs. 6 billion and total assets increased by 63 per cent to Rs. 28 billion. The deposit base rose by 57 per cent to Rs. 20 billion. Return on Assets and Return on Equity increased by 41 per cent and 45 per cent respectively.
In order to reward our shareholders we declared a 1:1 bonus share issue during the year issuing 34,628,571 new shares. It is pertinent to mention that our share price peaked at Rs. 340 per share before the bonus issue and at Rs.198 after the bonus issue. This is a substantial rise compared to the previous year’s peak price, thus reflecting the profitability, stability and the sustained investor confidence in the Company. Please refer the financial review on page 38 of this annual report for more information on the performance of the Company.
Strategic IntentTaking advantage of the country’s strategic location the Government plans to develop Sri Lanka as a naval, aviation, commercial, energy and knowledge hub and has already set itself the task of improving the business environment and building on its ranking in global competitiveness league tables. Going forward, in the context of emerging economy status and transforming Sri Lanka as a regional financial hub immense opportunities would open up for finance sector.
In this scenario, your Company makes every effort to capitalize on the opportunities to create a superior stakeholder value. We will harness the growth potential of our existing product portfolio of hire purchase, leasing and gold loans which are expected to perform well in the upcoming year. While focusing on strategies that has served us well in the past, we will introduce new and effective business solutions to offer an unparalleled service to our valued customers.
We will also expand our customer reach to benefit from post war opportunities and assist in the development process of the nation by opening up more branches in strategic locations. Factoring, Islamic finance and margin trading will be key areas of focus due to their high growth potential.
We will develop and our human resources by providing exciting growth opportunities and career development plans and make L B Finance one of the most sought after employers in Sri Lanka.
Information Technology will be a key area of investment as we continue to maintain the edge we already hold.
AppreciationOn behalf of the Board of Directors, I wish to express my deep appreciation to our former chairman, Mr. B. M. Amarasekera, who resigned from his position after serving the Company for over six years. My colleagues
and I gratefully acknowledge his leadership, guidance and oversight in steering L B Finance to be one of the leading financial institutions in Sri Lanka.
I am also grateful for the loyalty and patronage of our customers and gratefully extend my appreciation to our shareholders and depositors for the trust and confidence placed in us.
We have grown in strength and achieved remarkable results. My gratitude goes out to all our employees for their dedication, commitment and untiring efforts; they all share the credit for our achievement. My appreciation goes out to the L B Finance management team whose enthusiasm and efforts enabled the Company to forge ahead with exemplary achievements. Mr. Sumith Adhihetty continues to bring out the best in the L B Finance team and plays a dynamic role in steering the Company to stand above the rest. The entire Board appreciates his efforts and dynamism.
My gratitude also goes out to my colleagues on the Board for their unstinted support and cooperation.
I am confident that your Company will continue to forge ahead delivering value to all its stakeholders.
K D D PereraChairman

| L B Finance PLC | Annual Report 2010/1110
Managing Director’s Review

“We have maintained an unparalleled competitive edge and grown as a trusted and reputed organization strengthened by a highly competent team of professionals and state of the art technology.”
Sumith AdhihettyManaging Director
Annual Report 2010 | L B Finance PLC | 11

| L B Finance PLC | Annual Report 2010/1112
33% Gross Income Growth
60% Net Interest Income Growth
104% PAT Growth
Managing Director’s Review
As we step into our 40th year of serving the nation, we are proud of our achievements and what we have become; a solid financial institution, backed by reliability and strength. We have maintained an unparalleled competitive edge and grown as a trusted and reputed organization strengthened by a highly competent team of professionals and state of the art technology.
Economic OverviewIn analyzing the performance of the Company, it is imperative to assess the macroeconomic environment in which the company operated in.
Sri Lanka achieved an outstanding growth rate of 8 per cent in 2010, the highest in the last three decades. The growth was underpinned by the restoration of peace, improved domestic and external conditions, gradual recovery of the global economy and renewed investor confidence. Inflation was contained at a mid single digit and remained low throughout the year. The annual average inflation as measured by the Colombo Consumers’ Price Index was 5.9 per cent in December 2010. The overall deficit was reduced to 7.9 per cent of Gross Domestic Product (GDP) in 2010 from 9.9 per cent recorded in 2009 consequent
to the recovery in Government revenue, addressing of persistent structural issues in the tax system and containment of recurrent expenditure.
External sector rebound strongly in 2010 aided by the gradual recovery of the global economy, improved international financial market conditions and enhanced investor confidence. Earnings from exports reached a record high, surpassing the previous peak performance in 2008, with imports recovering strongly and expanding the trade deficit in 2010, compared to the contraction in 2009. Sri Lanka was able to project itself strongly in the international markets and the International Monetary Fund (IMF) graduated the status of Sri Lanka to a “middle-income economy” in 2010.
Market interest rates continued to adjust downwards in 2010 in response to the easing of the Central Bank’s monetary policy stance. Both the average weighted deposit rate (AWDR), which reflects the movement of interest rates pertaining to all interest bearing deposits held by the public with commercial banks and the weighted fixed deposit rate (AWFDR) which is computed in respect of fixed deposits maintained by the public with commercial banks declined during the year.
The stability of the financial system strengthened, while the soundness and resilience of domestic financial institutions was maintained with adequate capital and liquidity buffers and improvements in asset quality and earnings. The regulatory framework was strengthened with prudential safeguards to mitigate excessive
“The improvement in the business environment and the revival of activities in the economy will expand opportunities for financial institutions.”

Annual Report 2010/11 | L B Finance PLC | 13
risk-taking resulting in the decline of the overall credit risk, market risk and liquidity risk in financial institutions. In the milieu of better macroeconomic environment all financial institutions strived to regain their position during 2010.
Our performanceL B Finance thrived during 2010. The Company continued to perform commendably through the challenging years of the past and has evolved into a solid financial institution etched in stone. Over the past seven years we embarked on seven timely strategies which enabled us to achieve outstanding results over the years and empowered us to expand ourselves further. These strategies encompassed a multitude of areas varying from enhancing volumes, sustaining growth, improving portfolio quality, exploring opportunities, strengthening our business fundamentals to aggressively expanding our reach. In 2011 our strategy was centered on product development. In this context we introduced an array of products such as factoring, working capital and Islamic finance the significant details of which are given under Management Discussion and Analysis, in this Report. Our exposure to the tourism and construction sector increased significantly during the year, consequent to the boom in these two sectors.
As a result of the decline in interest rates, the lending rates became more affordable to our customers, thus increasing our lending base by 59 per cent YoY to Rs. 30 billion. Our deposits grew tremendously during the year to reach Rs. 20 billion as our deposit rates continued to remain attractive despite the decline in general interest rates. We adopted a conservative approach in assigning the deposit interest rates by continuing to offer rates above the market trend, at a time when other financial institutions continued to reduce their rates in tandem with the dip in the market rates. This exerted a downward pressure on our interest margins, hence we made a conscious decision to shift our focus from margin base to volume base to increase our bottom line during the year.
L B Finance recorded impressive results in 2010/11. The company’s Profit Before Tax (PBT) reached Rs. 2 billion, recording an impressive YoY growth of 90 per cent. Interest income rose by 30 per cent to Rs. 5 billion whilst interest expensed grew by
a marginal 7 per cent to Rs. 2 billion and other income grew by a whopping 103 per cent. Total assets reached Rs. 28 billion recording a growth of 63 per cent. Deposit base rose by a staggering Rs. 20 billion (57%), while shareholders funds rose by 49 per cent to Rs. 3 billion. We continued to expand our reach and extend our services to customers in all regions of the country. During the year we opened 7 branches and 17 Gold Loan Centres thus increasing our branch network to 34 and Gold Loan Centres to 92 during 2010/11.
Our staff strength increased by 374 employees in this year and now stands at 1264. Branch recruitments were made from the locality of the branches. L B comprises of a relatively young work force with a high energetic and dedicated working attitude. We continued to provide an environment for our employees to grow with the company by training and developing our young employees to absorb them to higher positions. Comprehensive training is provided to our staff at all levels on diverse aspects based on the need. To gear our staff to face the challenges ahead we have imbued a knowledge gaining culture to the daily operations of the organization. Further, our incentive scheme which includes increments, bonuses and other rewards are based solely on the performance evaluation process where high achievers are given due recognition, thus motivating the staff to be high performers.
0
2,000Rs. Mn
1,000
1,500
07 08 09 10 11
500
Trend in Profit Before Tax
0
30,000Rs. Mn
10,000
20,000
25,000
15,000
07 08 09 10 11
5,000
Trend in Total Asset Base

| L B Finance PLC | Annual Report 2010/1114
Managing Director’s Review To obtain a competitive edge, the Company continued to upgrade and invest in new sophisticated IT systems. A state of the art end-to-end leasing, hire purchase and loan management system and a sophisticated factoring system was implemented during the year, while the gold loan management system was developed in-house by our expertise team at LBIT. Further, the fixed deposit and lending systems were upgraded to cater to the dynamic growth of the Company.
The FutureThe economic outlook of Sri Lanka for 2011 is optimistic and is projected to grow by approximately 8.0 per cent in 2011. The growth of tourism is likely to gain momentum and contribute to growth in the services sector that is expected to show the most promising growth performance with tourism, communication, transport and banking showing high growth rates. The North East reconstruction and development of major roads, ports and power generation projects will stimulate economic growth further. Domestic inflation is expected to be subdued within single digits. The budget deficit is expected to come down to 6.8 per cent of GDP from 8 per cent in 2010. The external sector is expected to improve further in 2011 recording a surplus in the BOP, thereby increasing the country’s external reserves further. The improvement in the business environment and the revival of activities in the economy will expand opportunities for financial institutions. Several new laws to improve financial regulation are expected to be enacted 2011.In this context RFCs will be required to list on the Colombo Stock Exchange by June 2011 which will facilitate mobilization of capital funds, broad-basing of ownership and enhancing governance standards and disclosure requirements.
In the backdrop of a promising macroeconomic environment the company will make every effort to reap maximum benefits of the post war economic revival. Going forward, we will focus
on developing new and innovative products while continuing to implement the strategies which have served us well in the past. In an environment of low interest rates, we will continue to focus on volumes than margins. We will develop and empower our frontline staff to act as decision makers than mere sales staff. We will also focus on basic fundamentals of financing, proper credit procedures and recovery systems.
IT will continue to be a core area of investment. We will continue with our IT standardization and centralizing initiatives and also focus on adding value to existing products and services in order to provide a superior service and achieve productivity gains.
We will continue to maintain a high level of professional skills by developing and motivation our staff . We will provide attractive career advancement plans and pave the way for organic growth opportunities for our workforce.Since our company is expanding rapidly we will develop a credit evaluation system which is meaningful crossing the conventional boundaries, eliminating the mundane non value adding procedures.
We will offer a superior service to our customers and continue to maintain an open door policy which has made us one of the most accessible and approachable institutions in the RFC sector. We will also expand our reach by opening up more branches in strategic locations in 2011.
“While continuing to operate as a good corporate citizen, we will deliver results exceeding the expectations of all our stakeholders in 2011.”
0
20,000Rs. Mn
10,000
15,000
07 08 09 10 11
5,000
Trend in Deposit Base
Annual Report 2010/11 | L B Finance PLC | 15
63% Total Assets Growth
57% Deposit Base Growth
7Branches
17 Gold Loan Centres
While continuing to operate as a good corporate citizen, we will deliver results exceeding the expectations of all our stakeholders in 2011.
AcknowledgementsI gratefully acknowledge the guidance and support provided by our former chairman, Mr. B.M. Amarasekera who resigned from his position after serving the Company for over six years.
I extend my deep appreciation to the Chairman and my fellow Board members for their magnanimous support and encouragement during the year. I sincerely thank our management and staff for their tireless pursuits and dedication at all times. I also wish to thank our shareholders and customers for their loyalty and confidence placed in us throughout the years. I close my message looking forward to an exciting 2011/12 with immense opportunities, assuring you all that we will continue to forge ahead recoding exemplary results, creating value to all our shareholders.
Sumith AdhihettyManaging Director
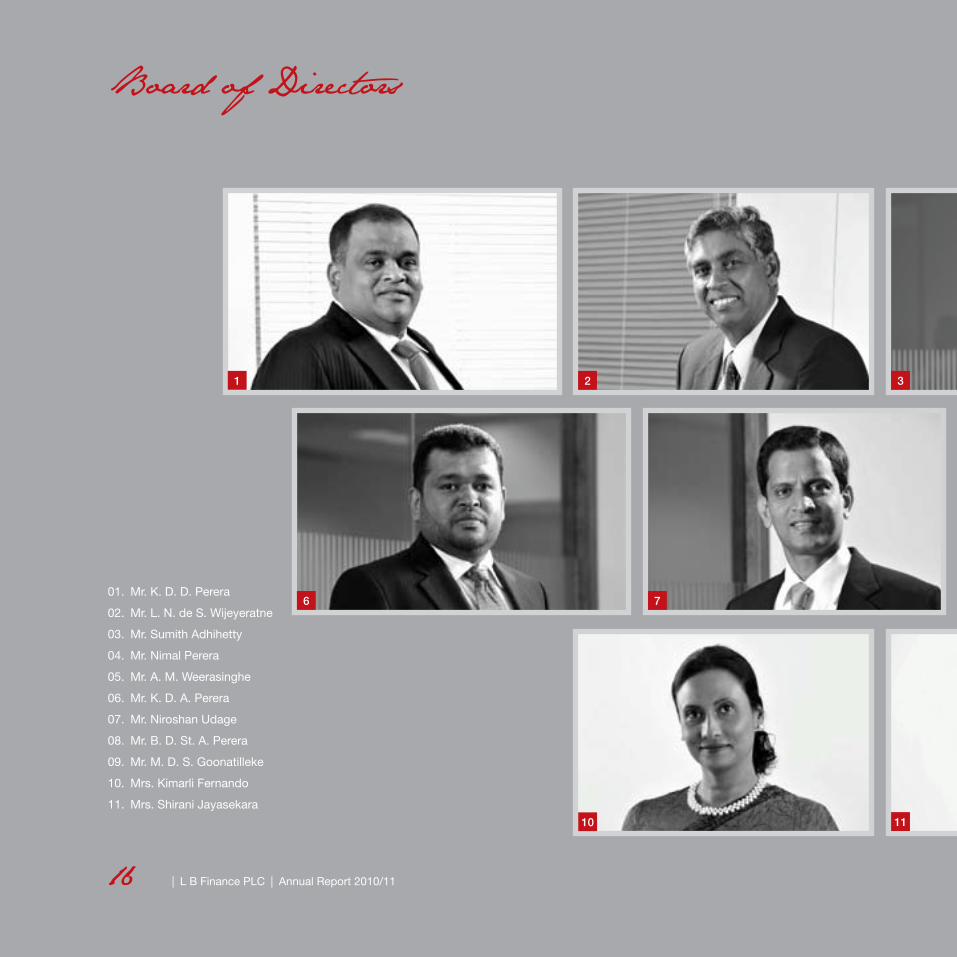
Board of Directors
01. Mr. K. D. D. Perera
02. Mr. L. N. de S. Wijeyeratne
03. Mr. Sumith Adhihetty
04. Mr. Nimal Perera
05. Mr. A. M. Weerasinghe
06. Mr. K. D. A. Perera
07. Mr. Niroshan Udage
08. Mr. B. D. St. A. Perera
09. Mr. M. D. S. Goonatilleke
10. Mrs. Kimarli Fernando
11. Mrs. Shirani Jayasekara
1
6 7
10 11
2 3
16 | L B Finance PLC | Annual Report 2010/11

8 9
4 5
17Annual Report 2010/11 | L B Finance PLC |

| L B Finance PLC | Annual Report 2010/1118
Board of DirectorsMr. K. D. D. Perera Chairman Appointed to the Board on 22nd October 2002 , Mr. Dhammika Perera is the Secretary to the Ministry of Transport, Sri Lanka whilst also being a well-recognized entrepreneur and investor whose business interests include Hydropower Generation, Manufacturing, Hospitality, Entertainment, Banking and Finance.
He serves as the Chairman of L B Finance PLC, The Fortress Resorts PLC, Vallibel Power Erathna PLC, Vallibel Finance PLC, Vallibel Holdings (Pvt) Ltd and holds directorships in his other private sector companies. He is the Deputy Chairman of Royal Ceramics Lanka PLC and Amaya Leisure PLC. Director Sampath Bank PLC, Sri Lanka Insurance Corporation Ltd, Hayleys PLC, Haycarb PLC, Hayleys-MGT Knitting Mills PLC, Hotel Services (Ceylon) PLC which owns Ceylon Continental Hotel, Colombo, Hunas Falls Hotels PLC, Nirmalapura Wind Power Pvt Ltd, Dipped Products PLC, Alutec Anodising & Machine Tools (Private) Ltd and Greener Water Ltd.
Mr. Perera is also a Member of the Board of Directors of Strategic Enterprise Management Agency (SEMA).
Mr. L. N. de S. Wijeyeratne Deputy ChairmanMr. Lalit N. de Silva Wijeyeratne who was appointed to the Board of L B Finance PLC on 1st November 2008 is a Fellow of the Institute of Chartered Accountants in Sri Lanka and counts more than thirty six (36) years experience in finance and general management both in Sri Lanka and Overseas. He was the Group Finance Director of Richard Pieris PLC from January 1997 to June 2008 and also held senior management positions at Aitken Spence & Company PLC, Brooke Bonds Ceylon Ltd and Zambia Consolidated Copper Mines Ltd. He is presently a Director of several listed and unlisted Companies.
Mr. Sumith AdhihettyManaging DirectorA veteran Marketer who started his career as a trainee at KPMG Ford Rhodes Thornton & Company and later joined Mercantile Investments Limited, where he served for a period of 26 years. He was formerly the Deputy Managing Director of Mercantile Investments Limited and served as a Director of Nuwara Eliya Hotels Limited, Grand Hotel (Pvt) Limited, Royal Palm Beach Hotels Limited, Tangerine Beach Hotels Limited, Nilaveli Beach Hotels Limited, Mercantile Fortunes (Pvt) Limited, Tangerine Tours Limited and Security Ceylon (Pvt) Limited. He also serves Director of Pan Asia Banking Corporation Limited since 15th June 2005.
Mr. Nimal PereraDirectorMr. Nimal Perera who joined the Board of L B Finance PLC on 2nd September 2003, is a member of the Sri Lanka Institute of Marketing and counts over 29 years of experience in fields of Finance, Capital Market Operations, Manufacturing, Marketing and Management Services.
Mr. Perera is the Deputy Chairman of Pan Asia Banking Corporation PLC, Managing Director of Royal Ceramics Lanka PLC, Group Finance Director of Amaya Leisure PLC. He also serves as a Director of Hayleys PLC, L B Finance PLC, The Fortress Resorts PLC, Vallibel Power Erathna PLC, Vallibel Finance PLC and Sathosa Motors PLC.
Mr. A. M. WeerasingheDirectorA Gem Merchant by profession and he presently serves as the Chairman of Royal Ceramics Lanka PLC and its subsidiaries.Mr. Weerasinghe joined the Board of L B Finance PLC on 6th January 2004.
Mr. K. D. A. Perera Director Mr. Anuradha Perera is a Director of Vallibel Holdings (Pvt) Ltd, Vallibel Lanka (Pvt) Ltd and also of several other Vallibel Companies.
Mr. Niroshan UdageExecutive DirectorMr. Udage holds a Bachelor’s Degree in Science from the University of Colombo. He possesses 21 years experience in the field of Leasing and Finance, including 10 years at Lanka Orix Leasing Co. PLC and 3 years at Mercantile Investments Limited prior to joining L B Finance PLC in 2004. Mr. Udage was appointed as a Director of L B Finance PLC on 1st January 2007.
Mr. B. D. St. A. PereraExecutive DirectorMr. Perera holds a BSc. (Business Administration) Special Degree from the University of Sri Jayewardenapura and is an Associate Member of the Chartered Institute of Management Accountants. Mr. Perera who was appointed a Director of L B Finance PLC on 1st January 2007, holds 14 years experience in the Leasing Industry that includes positions at Commercial Leasing Co. Limited, LankaOrix Leasing Co. PLC and a Merchant Bank in Bangladesh.

Annual Report 2010/11 | L B Finance PLC | 19
Mr. M. D. S. GoonatillekeDirectorMr. Goonatilleke joined the Board of L B Finance PLC on 19th February 2008. He is a financial professional with over 26 years of post qualification experience and has held Senior Managerial positions in Financial Management, Credit Management, Treasury, Export & Import Trade, General Management & Operations in leading private sector organizations in Sri Lanka.
He is a Group Director of Douglas & Sons Ltd., Group of Companies. In addition, he serves as a Director, Pan Asia Banking Corporation PLC and Vallibel Finance Ltd.
Mr. Goonatilleke possesses a Post Graduate Diploma in Business Administration, PIM, University of Sri Jayawardenapura and an Associate Member of Institute of Chartered Management Accountants (UK) and is a passed finalist of Institute of Chartered Accountants, Sri Lanka.
Mrs. Kimarli FernandoDirectorMrs. Kimarli Fernando who holds a LLB (Hons) from the London School of Economics and Political Science , London, U.K. (1986) is a Barrister-at-Law, Lincoln’s Inn, U.K. (1987) and an Attorney-at-Law, Sri Lanka (1988).
She joined the Board of L B Finance PLC on 26th August 2008. She has more than 21 years experience in the field of banking and had held senior positions at Pan Asia Banking Corporation PLC, Standard Chartered Bank, Sri Lanka and Deutsche Bank AG, Sri Lanka. She has also served Deutsche Bank, AG Frankfurt, Germany and had been the first Asian to be transferred from Asia to Frankfurt.
Mrs. Kimarli Fernando is the author of “Company Law of Sri Lanka, 2nd Edition” the definitive reference book for students and practitioners of Company Law in Sri Lanka, published in 1992 and was responsible for the publication of the Handbook, “Barrier Free Access” for Standard Charted Bank, a guide for business to comply with the law and spirit of inclusion of those with disabilities in the workplace.
Mrs. Shirani JayasekaraDirectorMrs. Shirani Jayasekara was appointed to the Board of L B Finance PLC as a Non Executive Director on 25th August 2010.
She has over 30 years experience combining; Finance and IT, Audit and Risk Management in Sri Lanka, Zambia and Bahrain. She is currently employed by Carson Cumberbatch PLC, with oversight of the Group Internal Audit Function, covering group interests in Sri Lanka, Indonesia and Malaysia.
She has been selected to serve on committees of the Institute of Chartered Accountants of Ceylon such as; the Annual Reports Awards Committee (Social Reporting) and Audit Committee of the Institute. She was a member of the Corporate Governance Committee which contributed to the process of developing a Code of Best Practice of Corporate Governance – issued jointly by SEC and the Institute of Chartered Accountants of Sri Lanka in 2008.
She is also a non Executive Director at Asian Hotels & Properties PLC, a subsidiary of John Keells Holdings PLC.
She is a Fellow member of the Institute of Chartered Accountants of Sri Lanka and a Fellow Member of the Chartered Institute of Management Accountants UK.

01. Mr. Ravi Yatawara General Manager
02. Mr. Manjula Gooneratne Deputy General Manager - Credit & Operations
03. Mr. Ransith Karunanratne Deputy General Manager - Factoring, Corporate Lending & Investments
04. Mrs. Sandhya Silva Hasthimuni General Manager - Administration
05. Mrs. Shyamalie Weerasooriya Chief Financial Officer
06. Mr. Marlon Perera Assistant General Manager - Deposits
07. Mr. Athula Jayasekera Assistant General Manager - Business Development
Senior Management
1
4 5
8
11 12
2
20 | L B Finance PLC | Annual Report 2010/11

08. Mr. Chethana Kahandugoda Assistant General Manager - IT
09. Mr. Amal Silva Senior Manager - Recoveries
10. Mr. Roshan Jayewardena Senior Manager - Marketing
11. Ms. Harshani Mapatuna Senior Manager - Legal
12. Mrs. Nirosha Amanulla Senior Manager - Kandy Branch
13. Mr. Wiraj De Mel Senior Manager - National Sales
14. Mr. Lakshman Wanniarachchi Senior Manager - Microfinance
13 14
109
6 7
3
21Annual Report 2010/11 | L B Finance PLC |

| L B Finance PLC | Annual Report 2010/1122
Management Discussion and Analysis
OverviewL B Finance PLC (LBF) was incorporated as a private company on 30th May 1971 under the Companies Ordinance No. 51 of 1938 and was subsequently converted to a public company on 29th September 1982. The Company was listed on the Colombo Stock Exchange on 30th December 1997 and was registered as a finance company as defined in the Finance Companies Act of No. 78 of 1988.
LBF is a leading player in the registered finance companies sector offering a gamut of products such as leasing, hire purchase, factoring, Islamic leasing and project financing to name a few. LBF has a wide distribution network of 34 Branches and 92 Gold Loan Centres islandwide and is the third largest Registered Finance Company (RFC) in Sri Lanka, accounting for nearly 10.47 per cent of the industry assets as at September 2010.
Macro - EconomyThe operations of the Company are highly sensitive to the macroeconomic factors. Hence it is critical to analyze the macroeconomic environment when assessing the performance of the company.
Global EconomyYear 2010 was a year of broad recovery from the crash of 2007- 2009.The emerging markets grew strongly, while the advanced markets struggled with deleveraging and high levels of unemployment. According to the World Economic Outlook (WEO) of the IMF, the world economy has expanded by an estimated 5.0 per cent in 2010, compared to its contraction by 0.6 per cent in 2009. Emerging economies expanded by 7.1 per cent and continued to be the engine of economic recovery in 2010. Asia expanded at an estimated 9.3 per cent, while advanced economies were estimated to have expanded by a modest
“In 2010, the first full year of operation subsequent to the cessation of the three decade long conflict, the economy of Sri Lanka has displayed its true potential, recording impressive macroeconomic achievements.”
3.0 per cent in 2010 consequent to the weak private domestic demand and high unemployment levels.
Due to increase in food prices as a result of adverse weather conditions in several major food commodity producing countries and hike in crude oil prices due to geopolitical instability, the inflation in advanced economies rose from 0.1 per cent in 2009 to 1.5 per cent during 2010. In emerging and developing economies, inflation increased from 5.2 per cent in 2009 to 6.3 per cent during the year. The relaxed monetary policy stance in many advanced and emerging economies enabled short term interest rates to remain low during the year. Equity and debt markets in many emerging and developing economies improved with increased foreign investment flows during 2010.
The economic growth in 2011 is expected to be encouraging, with the expectation of emerging economies driving the global economic recovery in the short to medium term. As per the IMF projections the global growth in 2011 is estimated to be approximately 4.4 per cent, emerging and developing economies around 6.5 per cent while advanced economies is projected to grow by 2.5 per cent. Going forward the prevailing high unemployment rate, high fiscal deficits, financial imbalances, geopolitical developments in the Northern African and Middle Eastern regions as well as more recent developments in Japan caused by natural disasters would pose challenges to global economic recovery.
Sri Lankan EconomyIn 2010, the first full year of operation subsequent to the cessation of the three decade long conflict, the economy of
Sri Lanka has displayed its true potential, recording impressive macroeconomic achievements. Sri Lankan economy grew by 8.0 per cent supported by improved performance in all key sectors of the economy. The agriculture sector grew by 7 per cent compared to 3.2 per cent in 2009 consequent to increased production of paddy, tea, rubber, minor export crops and expansion in the fisheries sector. The Industry sector grew by 8.4 per cent supported by increased performance in industries, such as food and beverages; rubber based products, textiles and garments and increased performance in the construction sector and hydropower generation. The Services sector grew by 8 per cent consequent to the expansion in the wholesale and retail sub sector, enhanced performance in both domestic and external trading activities and growth in sub sectors such as hotels and restaurants, transport, communications, banking, insurance and real estate.
Inflation continued to remain low at around mid-single digit levels due to the absence of significant demand pressures, improved domestic supply conditions, downward adjustments of certain administered prices and the reduction of import duties on several consumer items. The benign outlook for inflation enabled the Central Bank of Sri Lanka (CBSL) to ease its monetary policy stance further in 2010 by reducing the Repurchase rate and the Reverse Repurchase rate by 25 basis points each, in July 2010 and the Reverse Repurchase rate by a further 50 basis points in August 2010. This narrowed the policy corridor while in January 2011 the policy rates were further reduced, thus narrowing the corridor even further.

Annual Report 2010/11 | L B Finance PLC | 23
Supported by the expansion of economic activities and revisions to the tax structure, the overall deficit was trimmed down to 7.9 per cent of GDP in 2010 from 9.9 per cent in 2009.
The external sector of the country improved further in 2010 with favorable developments in domestic and external fronts. The International Monetary Fund (IMF) graduated Sri Lanka to a middle income economy. Long term capital inflows increased with the upgrading of the sovereign credit rating of the country by international rating agencies, the successful continuation of the Standby Arrangement (SBA) with the IMF, issuance of the third international sovereign bond in October 2010 and the increased inflows to the private sector. External trade rebounded strongly with earnings from exports increasing by 17.3 per cent and expenditure on imports growing by 32.8 per cent. This caused the trade deficit to widen to US dollars 5,205 million in 2010. However, a substantial increase in inward workers’ remittances of US dollars 4.1 billion offset the trade deficit to a great extent during the year. Higher inflows to the capital and financial account, which exceeded the current account deficit, generated the surplus in the overall balance of the BOP. The external reserves of the country further improved to record US dollars 6,610 million (equivalent to 5.9 months of imports) the highest level recorded. The exchange rate policy in 2010 focused mainly on maintaining stability in the domestic foreign exchange market with the Central Bank regularly absorbing foreign exchange, in order to mitigate excessive volatility in the exchange rate and further strengthen the reserve position. The issue of the sovereign bond in October to international investors, net foreign investments in Treasury bonds
Key Economic Indicators 2009 2010 (a)
GDP (percentage change) 3.5 8
GNP (percentage change) 4.8 7.9
Sectoral Classification of GDP (percentage change)
Agriculture 3.2 7
Industry 4.2 8.4
Services 3.3 8
Inflation (percentage change)
CCPI Annual Average 3.4 5.9
CCPI Year on Year - end period 4.8 6.9
External Trade
Trade Balance (USD Millions) -3122 -5205
Overall Balance (USD Millions) 2725 921
Exchange Rate (Rs./US$) Year end 114.38 110.95
Interest Rates (per cent per annum at year end)
Repurchase rate (overnight) 7.5 7.25
Reverse Repurchase rate (overnight) 9.75 9
91 days 7.73 7.24
364 days 9.33 7.55
Lending Rates
Commercial banks’ average weighted prime lending rate (AWPR)
10.91 9.29
Commercial banks’ average weighted lending rate (AWLR)
17.41 14.8
Deposit Rates
Commercial banks' Average Weighted Deposit Rate (AWDR)
8.01 6.23
Commercial banks’ 12 month fixed deposit rate (max.)
19 17
Source: Central Bank of Sri Lanka (a) provisional
CCPI Annual AverageCCPI Year on Year
0
10%
4
6
8
06 07 08 09 10a
2
Inflation
and Treasury bills, and other inflows of foreign funds to both the Government and the private sector, resulted in an excess of foreign exchange in the domestic foreign exchange market during the first three quarters of the year. The overall excess liquidity in the money market amounted to Rs.124.3 billion in 2010 compared to Rs. 159.6 billion at end 2009.
0
10%
4
6
8
06 07 08 9 10a
2
GDP

| L B Finance PLC | Annual Report 2010/1124
Stock MarketSri Lanka’s stock market continued to surge upwards in 2010, emerging as one of the best performing markets in the world. Investor sentiments were bullish during the year, propelling the market to record high turnover levels, price indices and market price earnings ratios. As indicated in the table below, the All Share Price Index (ASPI) rose by 96 per cent and the Milanka Price Index (MPI) increased by 83 per cent while market capitalization reached Rs. 2.2 trillion by end 2010.
Capital Market 2009 2010 (a)
All share price index (ASPI)(1985=100)
3,385.6 6,635.9
Milanka price index (MPI) (1998 Dec =1,000)
3,849.4 7,061.5
Value of shares traded (Rs. million) 142,463.0 570,327.0
Net purchases by non nationals (Rs. million)
(789.0) (26,335.0)
Market capitalisation (Rs. billion) 1,092.1 2,210.5
Source: Central Bank of Sri Lanka (a) provisional
FutureGoing forward, supported by post-conflict optimism and strengthening of the global demand, the Sri Lankan economy is projected to grow by 8 – 9 per cent per annum in the medium term. Greater capacity utilization, expansion in the agriculture sector with an increased contribution from the North and East, improved productivity, product and market diversification and expansion of industries, trade and services sectors including tourism, ports, transportation, banking and insurance would provide the required impetus for the higher growth prospects.
Inflation in the medium term is expected to be maintained at a mid single digit level, owing to supply side improvements and prudent demand management policies of the CBSL. Fiscal strategy will continue to focus on a gradual reduction of the overall fiscal deficit and public debt.
Sri Lanka’s exports have the potential to reach a new growth trajectory, with value addition, development of a range of new products and market diversification. Tourism sector will flourish in 2011 with the increased influx of tourist during the year. This will have a positive effect on tourism related areas of the economy through the creation of new jobs in tourism and related sectors.
Taking advantage of Sri Lanka’s strategic location and resources, the Government has planned to transform Sri Lanka into a strategically important economic centre by developing five strategic hubs; a knowledge hub, a commercial hub, a naval hub, an aviation hub and an energy hub. The vision of the Government of Sri Lanka is to double the country’s per capita income to US dollars 4,000 by 2016 and to turn Sri Lanka into the “Wonder of Asia”.
RFC SectorHaving been affected by liquidity problems in 2009, RFCs showed signs of gradual recovery in 2010. The resurgence of domestic economic activity, lower interest rate environment and the restoration of public confidence enabled the RFCs to expand. The performance of finance companies in distress also improved rapidly, while financial markets continued to remain liquid. As at the end of the year, along with the issuance of two new licenses, the total number of RFCs in business increased to 37, while the branch network increased by 98 to 376. The asset base of RFCs reached Rs. 234 billion recording an Year on Year (YoY) increase of 26 per cent compared to the marginal increase of 6 per cent recorded the previous year. This is consequent to the growth in accommodations which soared by 38 per cent YoY. The main sources of accommodations were hire purchase, finance leases and gold loans which accounted for 35 per cent, 30 per cent and 10 per cent respectively. Leasing and hire purchase contributed to 57 per cent of this growth while gold loan advances doubled during the year to be the fourth largest category of accommodations. Loans against real estate contracted by 15 per cent during 2010.
MPIASPI
0
10%
4
6
8
06 07 08 09 10a
2
ASPI and MPI
Management Discussion and Analysis

Annual Report 2010/11 | L B Finance PLC | 25
Composition of Assets and Liabilities of RFCs
Item 2009 2010 (a) % of Change
Rs. Bn % of Total Rs. Bn % of Total 2009 2010
AssetsLoans and Advances 113.5 61.2 156.2 66.9 1.5 37.6Investments 15.2 8.2 20.7 8.9 3.8 35.9Others 56.6 30.6 56.7 24.3 15.2 0.0LiabilitiesDeposits 119.8 64.6 146.1 62.6 15.8 22.0Borrowings 19.2 10.4 34.2 14.7 -26.8 78.2Capital 20.6 11.1 21.6 9.3 -18.4 4.8Total Funds 159.6 86.1 202.0 86.5 3.0 26.5Other 25.8 13.9 31.6 13.5 25.0 22.6Total Assets/Liabilities 185.4 100 233.6 100 5.6 26.0
Source: Central Bank of Sri Lanka (a) provisional
Key Financial Soundness Indicators
RFC Sector Excluding Distresses Companies RFC Sector
2007 2008 2009 2010 Sep 2010
2007 2008 2009 2010 Sep 2010
Total Capital Adequacy Ratio
14.2 14.5 14.2 11.3 8.5 15.9 16.5 17.7 19.71 17.5
Tier 1 Capital Adequacy Ratio
13.1 12.5 12.6 9.8 7.4 14.8 14.5 16.2 17.4 15.7
Gross Non-Performing Loans Ratio
4.4 6.5 8.0 9.7 12.6 4.5 6.0 5.3 6.2 7.8
Return on Assets (Before Tax)
3.2 2.5 0.8 0.1 2.4 3.7 3.3 2.8 2.9 4.8
Return on Equity (After Tax)
17.8 12.5 1.3 -7.4 11.3 19.8 17.9 17.5 19.6 21.1
Liquid Assets to Short-Term Liabilities
17.2 14.9 13.8 14.1 11.3 17.8 20.9 20.0 19.5 14.8
Liquid Assets to Total Assets
9.1 10.9 8.0 9.0 7.2 8.3 10.2 10.5 11.5 8.7
Source: Central Bank of Sri Lanka
Fuelled by the strong growth in deposits and borrowings, total liabilities of the RFCs grew by 26 per cent compared to 6 per cent in 2009. Deposits were the main source of funding constituting 72 per cent of the fund base and 63 per cent of the total liabilities. Borrowings rose by 78 per cent compared to the decline of 27 per cent in 2009. Capital funds increased marginally by 5 per cent during 2010, reversing the negative growth of 18 per cent reported in the previous year.
Profitability of RFC SectorExcept the five distress finance companies, the profitability of the RFC companies escalated significantly due to the decline in interest rates, restoration of public confidence and improved economic activity. Driven by the rise in net interest income, profit before tax reached Rs. 2.2 billion compared to the loss of Rs. 1.2 billion in the previous year. Consequently, Return on Assets and Return on Equity ratios, stood at 2.9 per cent and negative 19.6 per cent, (excluding distresses companies) respectively, in 2010.
The sector benefited from the declining interest rate regime that enabled RFCs to increase margins due to deposits repricing faster than loans as the latter is generally long term in nature. Accordingly, the margins widened considerably to 5 per cent in 2010 from 3 per cent the previous year and net interest income increased by a staggering 132 per cent YoY to Rs. 10.6 billion in 2010 compared to Rs. 5 billion in 2009.
Although capital funds in the balance sheet improved marginally, the regulatory capital defined for the maintenance of capital adequacy ratios continued to erode during the year. Total regulatory capital declined from Rs. 15 billion to Rs. 12 billion as at

| L B Finance PLC | Annual Report 2010/1126
end 2010. The ratio of regulatory capital funds to total deposits, declined from 16 per cent to 12 per cent YoY while the core capital ratio (as a percentage of risk weighted assets) declined from 9 per cent to 5 per cent. The listing of the all RFCs on the Colombo Stock Exchange by June 2011 will facilitate the injection of much needed capital funds into the sector.
There was no significant improvement in credit risk management of RFC during 2010. However, the exposure to non-performing accommodations as a percentage of total accommodations outstanding declined, as reflected in the reduction in the ratio of non-performing accommodations to total accommodations from 10 per cent in 2009 to 9 per cent in 2010. The total provision coverage for non-performing accommodations increased from 49 per cent to 54 per cent.
Regulatory FrameworkFinancial system stability is defined as the ability of the financial system to perform its key functions of resource mobilization and allocation, risk management and the settlement of payments, effectively at all times and even under stressful circumstances.
In this context , the CBSL has taken several policy measures to improve the public confidence in the sector and to improve the liquidity position of the distressed companies. During the first nine months of 2010, following actions were taken by the CBSL to strengthen the RFC sector.
• Imposition of limits on deposit liabilities of some RFCs (distressed companies).
• Introduction of a Credit Guarantee Scheme in January 2010 in respect of loan facilities provided by banks to distressed RFCs and SLCs
• Removal of executive powers of certain Directors in certain RFCs while requiring all such Directors to continue as members of the respective boards thereby holding them responsible for the overall risk management of the companies concerned.
To strengthen the regulatory framework and overcome existing deficiencies in the Finance Companies Act (FCA),the Ministry of Finance and Planning will be presenting the new Finance Business Act to the Parliament to repeal and replace the FCA.
A new law to regulate finance business and to combat unauthorized deposit-taking will be introduced which will make both unauthorized finance business and deposit-taking, an offence. The definition of “deposits” will be widened to cover a broad range of fund mobilization activities. The powers of the CBSL relating to the investigation and examination of unauthorized deposit-taking entities will be strengthened and offenses will carry more severe penalties.
Progress was made in resolving the problems of the distressed finance and leasing companies in the Ceylinco group with the adoption of restructuring and recapitalization schemes, recovery of dues from related companies and the introduction of the Credit Guarantee Scheme by the Central Bank. In addition, the Monetary Board of the CBSL issued a direction to distressed RFCs to recapitalize the company by way of a fresh issue of ordinary shares.
In order to protect the small depositors, CBSL is to operate a mandatory Deposit Insurance Scheme for Licensed Banks and RFCs, where demand, time and savings deposits will be insured.
It was made mandatory for all RFCs to list on the Colombo Stock Exchange by June 2011 to enable these companies to mobilize capital funds and to improve market discipline. This would strengthen corporate governance practices and bring in greater transparency to RFCs. The minimum capital requirements of finance companies was enhanced from Rs. 200 million to Rs. 500 million on a phased basis over three years.
The FutureGoing forward, the proposed regulations would enhance the transparency and corporate governance of each player in the sector and tax savings such as the easing of the financial value-added tax (“VAT”) based on the new budget is expected to deliver higher profits. Due to the inherent mismatches in its long-term investments and shorter-tenured deposits, the industry is exposed to funding risks which will be mitigated with increased access to long-term banking lines in the upcoming year.
ROAROEInterest Margin
-10
20%
0
5
15
10
06 07 08 09 10a
-5
Profitability Indicators of RFC
Management Discussion and Analysis

Annual Report 2010/11 | L B Finance PLC | 27
“LBF has expertise in the local leasing industry and provides leasing solutions for a range of vehicles and equipment including private vehicles, commercial vehicles, machinery, three wheelers and motor bikes, agricultural equipment, trucks and trailers and construction vehicles. The lease portfolio rose by 83 per cent YoY to reach Rs. 14 billion”

| L B Finance PLC | Annual Report 2010/1128
Business PerformanceLeasing and Hire PurchaseLeasing and hire purchase are the two key components of LBFs portfolio on which the Company’s reputation and identity has been built on. The gradual improvement of these two products has enabled the Company to build a solid foundation over the years. LBF has almost 40 years of expertise in the local leasing industry and provides leasing solutions for a range of vehicles and equipment including private vehicles, commercial vehicles, machinery, three wheelers and motor bikes, agricultural equipment, trucks and trailers and construction vehicles.
PerformanceThe performance of the Company’s leasing and hire purchase operations during the year was phenomenal. Total leasing and hire purchase granting increased by 150 per cent and 64 per cent YoY respectively, while the lease portfolio rose by 83 per cent YoY to reach Rs. 14 billion and the hire purchase portfolio climbed by 22 per cent YoY to reach Rs. 9 billion. The corresponding leasing income increased by 40 per cent to Rs. 1.7 billion while hire purchase income rose by 16 per cent to Rs. 1.5 billion.
Competitive EdgeLBF holds a competitive edge, in terms of speed of service, dedication to customer care, ease of processing the transaction and the frequent monitoring and dialog with customers which has enabled the Company to achieve a high recover ratio.
Strategies ImplementedLBF implemented several key strategies as mentioned below which enabled Company to record a remarkable performance in the leasing and hire purchase segment.
• Extending credit facilities to lower and middle income customers, in the agricultural sector especially in the North and East.
• Introducing fresh, practical and realistic credit procedures to the Jaffna Peninsula.• Setting up new units for identified diverse segments (corporate and retail).• Extending facilities for commercial vehicles remained a key area of focus as there was a
spur in demand for such vehicles following acceleration of economic activities in Sri Lanka.
Future OutlookGoing forward, LBF will concentrate on expanding its leasing and hire purchase facilities to the Jaffna Peninsula, due to the high growth potential in the area and also expand its services to the tourism and construction sectors which are expected to be key areas of growth in the upcoming year.
Management Discussion and Analysis
Composition of Executions in 2009/10
Leasing 18%Hire Purchase 15%Gold Loans 64%Mortgage Loans 1%Term Loans &Trade Finance 2%
Composition of Executions in 2010/11
Leasing 23%Hire Purchase 13%Gold Loans 60%Mortgage Loans 0%Term Loans &Trade Finance 4%
0
5,000Rs. Mn
2,000
3,000
4,000
07 08 09 10 11
1,000
Trend in Total Advances

Annual Report 2010/11 | L B Finance PLC | 29
“Hire Purchase portfolio climbed by 22 per cent YoY to reach Rs. 9 billion.”

| L B Finance PLC | Annual Report 2010/1130
LeasingHire Purchase
0
16,000Rs. Mn
12,000
8,000
07 08 09 10 11
4,000
Trend in Lease & Hire Purchase Portfolio
MicrofinanceThe business objective of microfinance is to provide financial support to individuals who have limited access to credit facilities. Special focus is given to self employed and low and middle income earners who are eager and has sufficient income level to repay the loan. Microfinance products include leasing of three wheelers and motor bikes.
PerformanceAccommodations on microfinance grew significantly by 80 per cent YoY to Rs. 5 billion and represented 34 per cent of total lease accommodations in the financial year 2010/11.
Competitive EdgeLBF holds a competitive edge in terms of the dynamic and friendly service provided by the well trained and competent staff members of the Company. The island wide branch network has enabled LBF to reach customers across the country.
Strategies ImplementedThe specific strategies implemented by LBF include new product development and market penetration which enabled the Company to expand microfinance operations while the promotional activities implemented under the market development strategy enhanced the profitability and growth of the product during the year under review.
Specific AchievementsLBF became one of the leading players in microfinance (three wheelers) lending market and granting was expanded to northern and eastern provinces during the year.
Future OutlookGoing forward, LBF would promote microfinance in the rural areas and engage in new product development.
0
5,000Rs. Mn
2,000
3,000
4,000
07 08 09 10 11
1,000
Trend in Microfinance Accommodations
Management Discussion and Analysis

Annual Report 2010/11 | L B Finance PLC | 31
“Accommodations on microfinance grew significantly by 80 per cent YoY to Rs.5 billion and represented 56 per cent of total lease accommodations in the financial year 2010/11.”

| L B Finance PLC | Annual Report 2010/1132
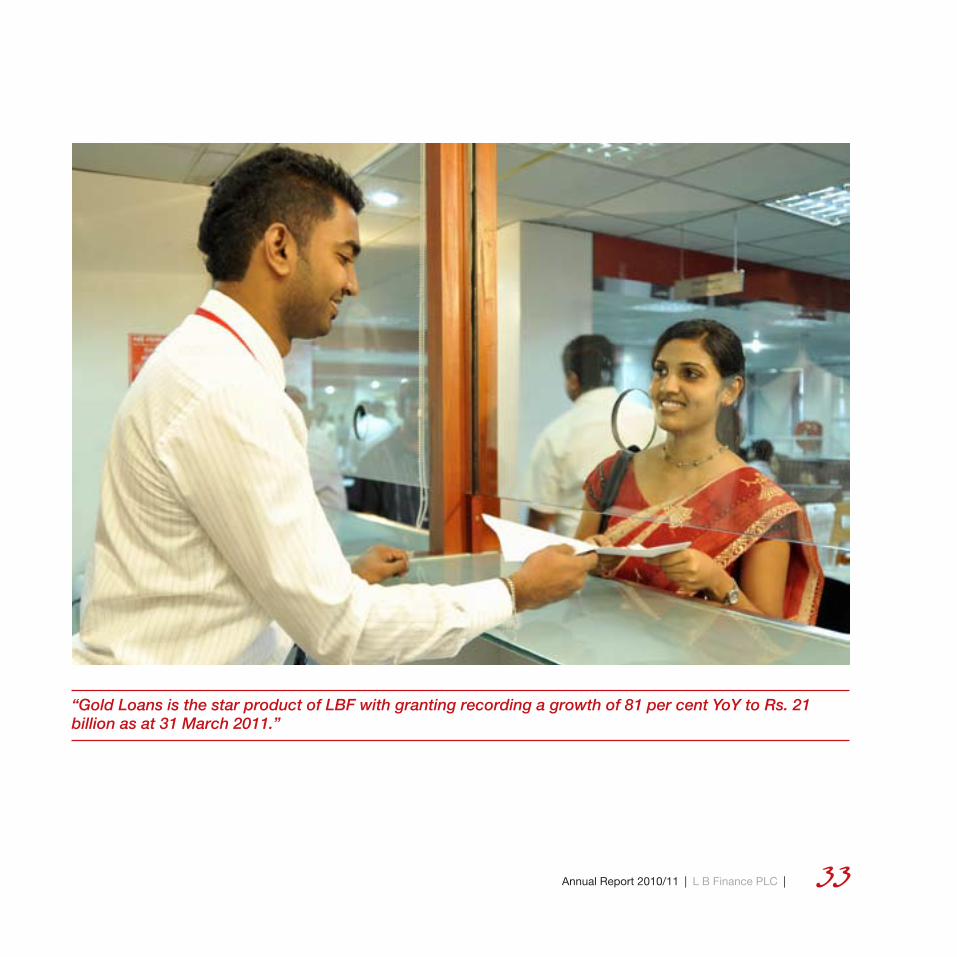
Gold LoansGold Loans is the star product of LBF with granting recording a growth of 81 per cent YoY to Rs. 21 billion as at 31 March 2011. Market penetration was done through the Company’s branch network in strategic locations. This attractive short term small ticket financing by its nature require certain features in the product, which LBF has recognized and adhered in a timely manner. Though the facility is backed by gold where the risk is minimal, the operational and control aspects have to be looked into.
PerformanceThe Performance was remarkable. The portfolio base increased by a whopping 82 per cent YoY to Rs. 6 billion while the corresponding interest income increased by 58 per cent YoY to Rs. 1.1 billion during the year ended 31 March 2011.
Strategies Implemented• Implementing measures to provide
easy access to Gold Loan customers.• Providing flexible repayment schemes
to customers via monthly installments.• Granting highest advance value to
customers.• Making available LBF’s Gold Loan
service all 7 days of the week.• Offering extra time period to redeem
the articles.
Future OutlookLBF intends to transform the Gold Loan product to a more vibrant credit tool in the year ahead.
Mortgage LoansMortgage Loans is a high margin product which takes a considerable amount of time for credit evaluation. Mortgage Loans constitutes 0.44 per cent of the Company’s lending portfolio.
PerformanceTotal granting for Mortgage Loans increased by Rs. 4 million to Rs. 159 million during the year.
Strategies ImplementedMeasures were taken to capture the daily collection market and lower interest rates were offered to customers.
Future OutlookTo penetrate the untapped informal market in a grater measure in the upcoming year.
Islamic FinanceLBF launched Islamic Finance operations on 22 June 2010 and opened up a window named ‘Al Salamah Islamic Finance Unit’. The operations of Islamic Finance are governed by the Islamic Sharia Law and all transactions closely monitored by a qualified Sharia Supervisory Council. This product which is free of interest is based on the principal of profit sharing. The cost of funds depends on the credit policies while lending is primarily asset based. The products available under Islamic Finance are:• Mudharabah – Investment accounts based on profit sharing• Ijarah – Islamic Leasing• Murabaha – Cost plus mark-up sales contracts
PerformanceThe performance during the first year operations was commendable. Total grantings of Ijarah and Murabaha products as at 31 March 2011 amounted to Rs. 574 million.
Competitive EdgeThe competitive advantage of LBF Islamic Unit includes a speedy service of one day executions and the availability of the service through the entire branch network and centres of LBF.
Strategies Implemented• Providing comprehensive training for the marketing and the
back office staff.• Introduction of a centralized Sharia approval process.• Establishing an ‘In House Monitoring Unit’ on 01st of March
2011 in addition to the independent Sharia Supervisory Council.
• Opening of a dedicated Islamic finance branch in Maradana on 25th of November 2010.
• Establishing strategic tie-ups with other Islamic Financial Institutions (Amana Takaful PLC).
0
20,000Rs. Mn
10,000
15,000
07 08 09 10 11
5,000
Trend in Gold Loan Portfolio
0
1,200Rs. Mn
600
800
1,000
07 08 09 10 11
200
400
Trend in Interest Income - Gold Loans
Management Discussion and Analysis
Annual Report 2010/11 | L B Finance PLC | 33
“Gold Loans is the star product of LBF with granting recording a growth of 81 per cent YoY to Rs. 21 billion as at 31 March 2011.”

| L B Finance PLC | Annual Report 2010/1134
Specific achievements during the year• Highest Mudharabah profit payer
among all the Islamic Financial Institutions in the country for the quarter ended 30th September 2010.
• Achieved a growth rate of approximately 300 per cent in lending during the quarter ended 31st December over the previous quarter.
• Achieved a ten fold growth in the Mudharabah Fund during the last quarter of the financial year (ending 31st March 2011).
Future OutlookIn the year 2011/2012, Islamic Financing Unit would enhance its product range by introducing an array of new products, station dedicated Islamic Finance marketing staff regionally, establish a specially trained recovery team and migrate to a more advanced and user friendly software system.
Factoring and Working CapitalAs a part of LBF’s product development strategy, the factoring and working capital financing business unit was launched in December 2010.
Factoring, or Accounts Receivable Financing, is selling the invoices of a company at a discount to a factoring company for immediate capital. As a business grows the need for working capital increases. Companies need cash to finance expansion, fund larger inventories and payrolls and meet increasing overhead costs. Regardless of the industry, location or size of the company effective cash management is critical for business success. Factoring moves the cash flow of a business forward, creating immediate cash to improve its financial position and
enhance its purchasing power, provides a company with the economic strength to expand production, sales and profits.
PerformanceWithin three months of operations granting amounted to Rs. 188 million and the factoring and working capital asset base reached Rs. 119 million. The recorded interest income for 3 months ended 31 March 2011 was Rs. 2 million.
Competitive EdgeFlexibilityLBF Factoring provides its customers customized working capital solutions to meet their specific business requirements. LBF Factoring takes a creative approach to problem solving, building solutions based on its financial strength and experience.
The quantum of funding provided by LBF Factoring will naturally grow with the customers business thus providing greater flexibility. The more successful the business, the more funding that will be made available to its customers.
Personalized ServiceLBF Factoring has a dedicated relationship management team who provide ongoing support to its customers. Based on the understanding that running a business requires hard work and dedication LBF Factoring devotes the same commitment and dedication to its customers.
Cutting-Edge TechnologyLBF is supported by a custom built state of the art factoring and working capital management solution. This latest streamlined system means that its clients will never be left behind; speed is often the key in making decisions and winning new business. LBF Factoring gives its clients
the confidence, information and technology to make the right choices.
Peace of MindThe LBF Factoring Management Team has experience in supporting SMEs to successfully grow their businesses thus giving its customers the confidence to develop and continue their success.
Future OutlookThe end of the war has created immense opportunities and the capacity for greater economic growth for Sri Lanka. In this context the financial services sector will play a crucial role in supporting this growth momentum. LBF Factoring will target the specific needs of SME’s that are currently overlooked by the existing players and provide a comprehensive service.
Fixed DepositsFixed Deposits are the Company’s primary source of funding where investors are rewarded with an interest payment for the investment made. The funds raised through deposits are streamed towards various forms of lending of the Company.
PerformanceDeposits grew rapidly during the year despite the declining interest rates regime. Fixed deposits grew by a whopping 57 per cent to reach Rs. 20 billion while certificates of deposits rose by 42 per cent YoY.
Competitive Edge• Expansion of Branch network including
North and East, enabled LBF to anchor the Company brand and mobilize more deposits.
• Offering higher interest rates than the industry average despite the decline in interest rates enabled the Company to
Management Discussion and Analysis

Annual Report 2010/11 | L B Finance PLC | 35
“Deposits grew rapidly during the year despite the declining interest rates regime. Fixed deposits grew by a whopping 57 per cent to reach Rs. 19 billion while certificates of deposits rose by 42 per cent YoY.”

| L B Finance PLC | Annual Report 2010/1136
retain existing depositors and attract new depositors. A sense of goodwill and warmth was promoted where customers perceived LBF to be a considerate organization.
• The re-payments made to the customer have always been on time, thus increasing the credibility of the Company.
• Providing a tailor made service to the customers and being vigilant towards their concerns and issues.
• Enhanced level of customer commitment in the organization.
• Being totally committed to the customers
Strategies ImplementedCash Back loans is a new strategy implemented towards the enhancement of the Company’s services. The loans were granted to the customers with minimal formalities and lesser documentation. The customers were able to obtain loans over the counter in a short span of time.
PerformanceAn outstanding achievement of a net flow of Rs. 1 billion was achieved during the Avurudu campaign. This boosted the commitment level within the Company, to draw in funds and circulate it vigilantly for the many other services offered to the customers.
Mudarabah Investment Accounts has been successfully implemented under Sharia compliance.
Future OutlookLBF hope to expand innovative products, to conquer the untapped services in the financial service sector.
The primary initiative is to implement savings accounts which would hold a portfolio of schemes, catering to different age groups, diverse life styles, genders etc.
The Company intends to promote more deposits in the form of savings, to attract a diverse customer base nationwide.
We also plan to introduce Foreign Currency accounts to cater to our foreign customer base and attract new customers across the borders.
Information Technology (IT)At LBF we have recognized the role of ICT and IT systems as indispensable business tools providing a foundation for the company’s efforts to improve and expand customer service, as well as boost efficiency. Utilizing the latest ICT available, LBF currently functions fully browser based system with inter-connected modules for Leasing, Hire Purchase, Fixed Deposits, Power draft, Pawning, Factoring and General Ledger to provide end to end solutions. System integration has allowed LBF to experience a seamless sharing of information and knowledge, enhancing the business functions through precise decision making capabilities.
Technologies Implemented• A state of the art end-to-end leasing,
hire purchase and loan management system was implemented as of December 2010. The system was developed using industry leading Microsoft Net technologies compiled with Microsoft SQL Server 2008 data base technology.
• With the commencement of factoring business a highly sophisticated fully browser based system was implemented, which was tailor made for high volume transaction processing.
• Gold Loans, the strongest product portfolio at LBF with over 90 service centers island wide. The Gold Loan management system was developed in-house. The system supports all the advanced features which facilitate a highly secured environment for high value business. The latest version of the product is fully browser based and developed using multi tier architecture.
• LBF is continuously improving its ICT infrastructure to cater to the dynamic growth of the Company. In this context, the fixed deposit and lending systems were upgraded from legacy system to multi tier architecture. Further, the Company is in the process of upgrading its data centre to meet the demanding business requirements. Most of the existing servers will be consolidated in to an environment which would reduce the operational cost.
Strategies ImplementedLBF IT department strives to be the best service providing unit catering to all ICT related needs in the organization. In this regard the following strategies were implemented.• Standardization of areas where IT security policy was
implemented. All desktop PC’s are now operating on a standard set of software and normal users do not have authority to implement any unauthorized software.
• ICT Procurement was streamlined and standardized so that LBF would obtain the best products and services at a lesser cost.
• Web portal was implemented to ease staff communication.• Disaster recovery and backup strategy was strengthened and
is reviewed on routine basis.
Future OutlookVision of LBF IT is to become the most reliable ICT service provider to LBF and its subsidiaries. In order make this a reality, LBF IT is in the process of setting up new standards in IT helpdesk and delivery management.
Management Discussion and Analysis

Annual Report 2010/11 | L B Finance PLC | 37
LBF IT is setting up a state-of-the-art Data Centre at the proposed new office complex in Colombo 03, The Data Centre will be the primary location for all branch access while the existing infrastructure will be used as the co-location, with both being connected via Metro Ethernet.
Human ResourcesCompany staff strength consists of 1264 employees including the 372 new recruits during the year.
LBF offers a wide range of benefits and welfare activities to the employees. A knowledge gaining culture is imbued to the daily operation of the organization while comprehensive training is provided to staff at all levels.
LBF is an equal opportunity employer. The Company’s incentive scheme which includes increments, bonuses and other rewards are solely based on the performance evaluation.
Further details on employee relations are provided in the Sustainability Report on page 50.

| L B Finance PLC | Annual Report 2010/1138
Financial Performance Review Impeccable PerformanceProfitabilityThe company performed impressively in terms of profitability during the year under review. The profit after tax doubled during the year to Rs. 1 billion recording a growth of 104 per cent. This is a commendable achievement after allocating a considerable tax component of Rs. 882 million to the Government. The profit before tax reached Rs. 2 billion compared to previous years Rs. 1 billion. The improvement in the net interest income and the surge in the other operating income resulted in the increase in profitability.
The earnings per share (EPS) available to shareholders for the year, amounted to Rs. 14.73. This includes the effects of the change in the share base (numerator) due to the one for one bonus share issue which took place during the year. As a result the company’s issued capital increased from 35 million to 69 million. In the financial year 2009/10 Company’s EPS stood at Rs. 7.22. The growth in earnings (numerator) was compromised due to the increase in the issued capital (denominator).
The growing trend in the revenue anchored the expansive performance in the profitability. The gross income for the year rose to Rs. 6 billion from previous year’s Rs. 4 billion, recording an Year on Year (YoY) increase of 33 per cent . The branch expansion and product development strategies facilitated the growth in the top line. In analyzing the constituents of gross income, 94 per cent represented interest generating activities whilst non operating income represented a marginal 6 per cent.
Interest IncomeAmidst the pressure of declining interest rates, LBF surpassed the previous year’s benchmarks in a commendable manner. The company’s interest income in 2010/11 amounted to Rs. 5 billion compared to Rs. 4 billion in 2009/10. During the year under review leasing emerged the highest interest income generator, surpassing hire purchase. Lease segment which accounted for 34 per cent of the interest income earned Rs. 2 billion against previous year’s Rs. 1 billion while the hire purchase segment which accounted for 30 per cent of the interest income contributed Rs. 2 billion compared to Rs. 1 billion the previous year. Further LBF’s star product, gold loans which accounted for 21 per cent of the interest income witnessed a remarkable growth of 58 per cent and increased to Rs. 1 billion.
Income TaxProfit Before TaxProfit After Tax
1,000
0
6,000Rs. Mn
4,000
5,000
3,000
07 08 09 10 11
2,000
Trend in Gross Income, Profit Before Tax and Profit After Tax
0
16Rs.
8
12
07 08 09 10 11
4
Trend in Earnings Per Share
0
6,000Rs. Mn
2,000
3,000
4,000
5,000
07 08 09 10 11
1,000
Trend in Interest Income
Analysis of Interest Income 2009/10
Leases 31% Hire Purchase 34%Gold Loan 17%Treasury Bills & Bank Deposits 7% Other 11%
Analysis of Interest Income 2010/11
Leases 34% Hire Purchase 30%Gold Loan 21%Treasury Bills & Bank Deposits 4% Other 11%

Annual Report 2010/11 | L B Finance PLC | 39
Interest ExpensesDuring the year under review the management of the Company focused on maintaining competitive deposit rates by offering the highest deposit interest rates in the industry. The total interest expenditure for the year reached Rs. 2.4 billion compared to previous year’s Rs. 2.2 billion recording a growth of 7 per cent YoY. Interest expense on fixed deposits decreased by a marginal 3 per cent to Rs. 2 billion.
LBF identifying the importance of other sources of financing, increased its exposure on borrowings strategically to take advantage of reduced interest rates. The interest expense on loans increased to Rs. 351 million during the year under review from Rs. 123 million the previous year. The funds raised from borrowing were mainly used to finance the investment of key lending assets. Public deposits attributed to 80 per cent of the total interest expense while loans and debentures attributed to 15 per cent and 4 per cent respectively.
Net interest income for the year amounted to Rs. 3 billion against previous years Rs. 2 billion recording a phenomenal growth of 60 per cent.
Analysis of the Interest Margin and Interest SpreadInterest spread increased to 12 per cent during the year compared to previous year’s benchmark of 9 per cent. This is consequent to sizable increase in the net interest income compared to the expansion in the interest earning asset base. This was further confirmed by the improvement in net interest margin ratio which moved up to 13 per cent from 12 per cent. This was consequent to the benefit received from the larger drop in the interest expenditure to interest bearing liabilities ratio of 12.9 per cent compared to the decrease in the Interest income to interest earning assets ratio of 24.5 per cent. The significant growth in the interest bearing liabilities, especially the rise in deposits and borrowings, resulted in the broadening of net interest margin.
The asset liability gap improved during the year under review leaving only the 3-12 months category on the negative side. Importantly, the company succeeded in covering the portions of liabilities in all the other categories including less than 3 months, 1 to 3 months and over three years. The loans taken during the year enabled the Company to distribute a portion of liabilities in the 1 to 3 year category. However, due to the hike in the lending, the asset liability gap increased positively for the 1 to 3 year category and over three year category.
Analysis of Interest Expenses
Interest On Public Deposits 80%Interest On Loans 15%Interest On Debentures 4%
0
2,500Rs. Mn
1,000
1,500
2,000
07 08 09 10 11
500
Trend in Interest Expenditure
0
0.15Rs. Mn
0.06
0.09
0.12
07 08 09 10 11
0.03
Trend in Net Interest Margin and Interest Spread
Net Interest MarginInterest Spread
Less than 1 Month
3-12 Months
1- 3 Years
Over 3 Years
Years
1,500 700 7500 1,500
Maturity of Assets and Liabilities
AssetsLiabilities

| L B Finance PLC | Annual Report 2010/1140
Analysis of Non Interest IncomeAs reflected in income which doubled to Rs. 354 million a significant improvement in non interest income was observed in 2010/11 compared to 2009/10, Disposal of investments earned profits during the year after several loss making years. On the other hand profit from appreciation of market value of quoted shares and sundry income increased dramatically, boosting the overall operating income of the Company. In analyzing the constituents of non interest income, 69 per cent represented fee based income, 25 per cent income from market value appreciation in quoted shares and profit on disposal of investments and 6 per cent other income.
Analysis of Non Interest ExpensesThe Non interest expense which has been increasing over the years, improved by 39 per cent to reach Rs. 1 billion in the year under review. Due to the rapid expansion of the Company during 2010/11, the general and administrative expenses rose by 63 per cent to Rs. 539 million while staff costs increased by 58 per cent to Rs. 488 million consequent to recruitments and employment benefits. The efficiency ratio which calculates the ratio of overheads to total income decreased from 45 per cent to 38 per cent reflecting better management of overheads.
Taxation and Net ProfitIn the year under review the total taxation of the Company amounted to Rs. 882 million compared to previous year’s Rs. 538 million. The two components of total taxation; VAT on financial services and provision for income tax increased from Rs. 160 million to Rs. 235 million and from Rs. 378 million to Rs. 647 million respectively.
Profitability RatiosThe considerable higher growth in profits enabled the Company to record higher profitability ratios. The return on assets which measures the Company’s profitability against the asset base increased to 5 per cent from 3 per cent in 2009/10. Return on Equity ratio which indicates the profitability per rupee of shareholders wealth improved significantly from 32 per cent in 2009/10 to 47 per cent in 2010/11.
0
400Rs. Mn
200
300
07 08 09 10 11
100
Trend in Non Interest Income
Non Interest ExpenditureEfficiency Ratio
0 0
1,500 60Rs. Mn %
600
900
1,200
36
48
07 08 09 10 11
300 12
24
Trend in Non Interest Expense & Efficiency Ratio
Analysis of Non Interest Expense 2010/11
Staff Costs 42% Provision For Staff Retirement Benefits 1% General & Administration Expenses 45% Provision for Fall in Value of Investments, Bad and Doubtful Loans and Write Offs 12%
Financial Performance Review

Annual Report 2010/11 | L B Finance PLC | 41
Total AssetsCompany’s asset base increased significantly from 17 billion in 2009/10 to Rs. 28 billion in 2010/11 recording a YoY growth of 63 per cent. This remarkable increase was due to the improvement in the customer base in conjunction with the rise in business volumes during the year. Interest earning assets which represent 92 per cent of the total asset base of the Company rose by 60 per cent YoY to Rs. 26 billion. Lending AssetsLending portfolio base of the company increased to Rs. 30 billion in 2010/11 compared to Rs. 19 billion in the previous year, recording a YoY rise of 59 per cent. Gold Loan assets recorded an impressive growth of 82 per cent to Rs. 6 billion in 2010/11 compared to Rs. 3 billion in 2009/10. Leasing portfolio soared by 83 per cent to Rs. 14 billion in the year under review, while hire purchase assets increased to Rs. 9 billion from Rs. 7 billion the previous year.
Asset Quality and Provision for Loan LosesIn order to maintain the quality of the portfolio, we contained the Non Performing Loans (NPL) ratio at healthy levels. The NPL ratio for the current financial year increased to 1.68 per cent from previous year’s 1.1 per cent due to stringent regulatory requirements imposed by the Central Bank of Sri Lanka. However, the absolute values of the NPL improved during the year under review. The provision for bad debts for the same period increase to Rs. 530 million from previous year’s Rs. 422 million consequent to the significant rise in the lending portfolio which stood at Rs. 30 billion.
0
30,000Rs. Mn
10,000
15,000
20,000
25,000
07 08 09 10 11
5,000
Trend in Total Assets Base
Net Non Performing AdvancesProvision for Bad Debts (Specific)NPL Ratio
0
600Rs. Mn %
300
400
500
200
07 08 09 10 11
100
Trend in Non Performing Loans and Provisions
0
0.06
0.03
0.04
0.05
0.02
0.01
LeaseHire PurchaseGold Loans
0
16,000Rs. Mn
12,000
8,000
07 08 09 10 11
4,000
Trend in Portfolio Base - Lease, Hire Purchase and Gold Loans
LeaseHire PurchaseGold Loans
0
25,000Rs. Mn
20,000
10,000
15,000
07 08 09 10 11
5,000
Trend in Accomadations - Lease, Hire Purchase and Gold Loans

| L B Finance PLC | Annual Report 2010/1142
Total LiabilitiesThe total value of liabilities increased by 65 per cent to Rs. 25 billion as at 31 March 2011 compared to Rs. 15 billion the previous financial year. Deposited from non banking customers was the major component of liabilities which accounted for 77 per cent compared to 81 per cent the previous year, followed by borrowings and other liabilities which amounted to 14 per cent and 9 per cent respectively.
Deposit BaseIn a regime of declining interest rates, LBF acquired a competitive edge and consolidated its position in the finance industry. The Company’s deposit base which comprise of fixed deposits and certificate of deposits increased by 57 per cent YoY and stood at Rs. 20 billion. Out of the total deposits, fixed deposits accounted for 98 per cent while certificate of deposits contributed to a marginal 2 per cent.
Fixed Deposits & Certificate of Deposits (CDs)Fixed deposits which account for 98 per cent of the deposit base recorded a remarkable increase of 57 per cent to Rs. 19 billion compared to Rs. 12 billion in the previous financial year. CDs which account for 2 per cent of the deposit base rose significantly by 42 per cent to Rs. 333 million compared to Rs. 235 million in the previous financial year. This is a significant improvement compared to the declined in value experienced in 2009/10.
Shareholder’s FundsTotal shareholders’ funds increased by 49 per cent and stood at Rs. 3 billion as at the financial year ended 2010/11 compared to Rs. 2 billion the previous year. The increase in the Share Capital by 70 per cent YoY to Rs. 838 million from Rs. 492 million coupled with the 40 per cent increase in reserves which rose by to Rs. 2 billion from Rs. 1 billion last year contributed to the increase in Total Shareholders’ Funds.
DividendsThe proposed dividend of Rs. 242 million in current financial year 2010/11 is a 40% YoY increase compared to the previous year Rs. 173 million. Dividend per share stood at Rs. 3.50 in comparison of the last year’s Rs. 2.50. Dividend payout ratio is being 24% in 2010/11 compared to 35% in previous year revealing viable investments have increased and its profits are yet to be delivered.
Deposits From Non-Bank CustomersBorrowingsOther LiabilitiesTotal Liabilities
0
30,000Rs. Mn
20,000
25,000
10,000
15,000
07 08 09 10 11
5,000
Trend in Total Liabilities Deposits, Borrowings, Other Liabilities
Certificates of DepositsGrowth
0 0
400 50Rs. Mn %
200
300
30
40
07 08 09 10 11
10010
20
Trend in Certificates of Deposits
Financial Performance Review
Fixed DepositsGrowth
0 0
25,000 70Rs. Mn %
10,000
20,000
15,000 40
60
50
30
07 08 09 10 11
5,00010
20
Trend in Fixed Deposit Base
Shareholders Funds Earnings Per Share
0 0
3,000 16Rs. Mn Rs.
1,000
2,000
2,500
1,500
12
07 08 09 10 11
5004
8
Shareholders Funds and Earnings Per Share

Annual Report 2010/11 | L B Finance PLC | 43
Treasury Bills & Other Bills eligible For Re-Discounting Wit Central Bank reservesPlacements With Other BanksCash And Amounts Due From Banks
0
2,500Rs. Mn
1,000
1,500
2,000
07 08 09 10 11
500
Analysis of Liquid Assets
Liquidity PositionLiquid assets of the company improved by 26 per cent to Rs. 2 billion during the year under review. The liquid cash and amounts due from bank exceeded Rs. 347 million with a growth of 25 per cent YoY. This gave the company a comfort buffer for temporary liquidity shortfalls. Placements with other banks which include interest bearing deposits in banks decreased during the year to Rs. 303 million from Rs. 365 million. The investment in treasury bills and other bills eligible for re-discounting with Central Bank expanded during the year end from Rs. 1 billion to Rs. 2 billion. This was consequent to the increase in the investment threshold of Government securities due to the expansion in the deposit base.
Capital AdequacyIn line with the Central Bank directives, the two key capital adequacy ratios namely the Core Capital ratio and Total Risk Weighted Capital ratio hovered well above the statutory standards of 5 per cent and 10 per cent respectively. As at the end of March 2011 the Core Capital ratio stood at 12.90 per cent and Total Risk Weighted Capital ratio amounted to 14.23 per cent compared to previous year’s ratios of 14.39 per cent and 17.34 per cent respectively.
Company RatingDue to Company’s improvement in assets and healthy financial performance as reflected by wider margins and improved profitability indicators, the RAM Ratings upgraded the long term and short term financial institutions rating to BBB+ and P2, from BBB and P2 respectively. With this year’s ratings upgrade, LBF has received ratings upgrades in the investment grade for two consecutive years.
Financial Institution's Rating
Long term Short Term Ratings Outlook
2009/10 BBB P3 Stable2010/11 BBB+ P2 Stable
L B Finance Rs. 450Mn Unsecured Subordinated Debenture Redeemable Debenture Rating
Long Term Short Term
2009/10 BBB- P32010/11 BBB P3
Ratings DefinitionsBBBA financial institution rated BBB has a moderate capacity to meet its financial obligations. The financial institution is more likely to be weakened by adverse changes in circumstances, economic conditions and/or operating environments than those in higher-rated categories. This is the lowest investment grade category.
The sign plus (+) indicates that the financial institution ranks at the higher end of its generic rating category; the sign flat indicates a mid-ranking; and the sign minus (-) indicates that the financial institution ranks at the lower end of its generic rating category.
P2A financial institution rated P2 has an adequate capacity to meet its short-term financial obligations. The financial institution is more susceptible to the effect of deteriorating circumstances than those in the highest-rated category.
P3A financial institution rated P3 has a moderate capacity to meet its short-term financial obligations. The financial institution is more likely to be weakened by the effects of deteriorating circumstances than those in the higher-rated category. This is the lowest investment-grade category.

| L B Finance PLC | Annual Report 2010/1144
Corporate GovernanceCorporate Governance is popularly understood as the system by which Companies are directed and controlled. The Board of Directors is responsible for the governance of the Company. Your Board has placed considerable emphasis on developing rules, structures and processes to ensure integrity and transparency in all of Company’s dealings and on making the best effort in achieving performance and quality profits. We have continuously refined our structure and systems to ensure governance on the lines as defined, aware all the time that we are accountable to our stakeholders and the general public.
This statement describes the application of the Corporate Governance practices within the Company during the year under review.
Board of DirectorsThe Board is the topmost body of L B Finance PLC that carries the responsibilities of directing the Company and of supervision. The responsibilities of the Board includes making an accurate assessment of the Company’s position, making strategic decisions, attending Board meetings and Board sub committees, ensuring good governance and overseeing the risk management of the Company.
CompositionThe Board comprises eleven (11) members, eight (8) of whom including the Chairman are Non Executive Directors with a balance of skills and experience which is appropriate for the business carried out by the Company. The Board has determined that four (4) Non Executive Directors are ‘independent’ as per the criteria set out in the Listing Rules of the Colombo Stock Exchange.The names of the Directors who served during the year under review are disclosed in the Annual Report of the Board of Directors on the Affairs of the Company on pages 62 and 63.
Tenure, Retirement and Re-election of DirectorsAt each Annual General Meeting one-third (1/3 rd) of the Directors for the time being, who are subject to retirement, or, if their number is not a multiple of three (3), the number nearest to (but not greater than) one-third (1/3 rd), retire and are seek re-election by the shareholders
The provisions of the Company’s Articles of the Association also require Directors appointed by the Board to hold office until the next Annual General Meeting and seek appointment by the shareholders at that meeting.
Appointments to the BoardThe Nominations Committee recommends the appointments to the Board as per the Articles of Association of the Company.
Board MeetingsThe results of the Company are regularly considered and monitored against the budgets at Board meetings at which a standard agenda is discussed together with any other matters that require the attention of the Board. The Board meets once a month, and wherever necessary Special Meetings of the Board are held.
During the year ended 31st March 2011, eleven (11) meetings of the Board were held. The attendance at the meetings was
Name of Director Executive/Non-Executive/ Independent Non-Executive
Attendance
Mr. B M Amarasekera- Chairman (Resigned with effect from 07th October 2010)
Independent Non-Executive 05/05
Mr. K D D Perera Non-Executive 08/11Mr. L N de S Wijeyeratne Independent Non-Executive 10/11Mr. J A S S Adhihetty Executive 11/11Mr. Nimal Perera Non-Executive 08/11Mr. A M Weerasinghe Non-Executive 10/11Mr. K D A Perera Non-Executive 08/11Mr. Niroshan Udage Executive 10/11Mr. B D St A Perera Executive 10/11Mr. M D S Goonatilleke(Resigned with effect from 20th May 2011)
Independent Non-Executive 08/11
Mrs. Kirmali Fernando Independent Non-Executive 08/11Mrs. Shirani Jayasekara(Appointed with effect from 25th August 2010)
Independent Non-Executive 06/06
Following the best practices of good Corporate Governance the two positions of the Chairman and the Managing Director are held by separate persons which enable balance of power, better accountability and enhance the independence of the Board.
The ChairmanMr. B M Amarasekera, an Attorney-at-Law by profession, who retired as the precedent partner of the Law Firm of Julius & Creasy in 1999 with over 50 years in the practice of law, served as the Chairman of the Board of Directors upto 7th October 2010. On his resignation, Mr. K D D Perera, the Deputy Chairman, a Non-Independent Non Executive Director, assumed office as the Chairman of the Company. Mr. L N de S Wijeyeratne, an Independent Non-Executive Director, who was appointed the Deputy Chairman was designated the Senior Director to ensure a greater independent element as required by the Finance Companies (Corporate Governance) Direction No. 03 of 2008.

Annual Report 2010/11 | L B Finance PLC | 45
Compliance with Central Bank RegulationsAs a registered Finance Company and a registered Finance Leasing establishment, the Company is governed by the Non-Bank Financial Institutions Directions & Rules issued by the Monetary Board of the Central Bank of Sri Lanka.
Accordingly, the Company has to carry out and maintain business activities in compliance with the Directions from time to time issued by the Central Bank of Sri Lanka.
Accountability and DisclosureIn the year ended 31st March 2011, the members of the Board of Directors have reviewed in detail the Quarterly Financial Statements and Annual Financial Statements in order to satisfy themselves that they present a true and fair view of the Company’s affairs, and these practices have been further strengthened as per the Code of Best Practice on Corporate Governance, Listing Rules of the Colombo Stock Exchange and Directions issued under the Finance Companies Act.
A summary of Directors’ Responsibilities in respect of Financial Statements is given on page 68.
Investor Rights and RelationsThe Company is bound to safeguard the rights of all shareholders and secure equal treatment for all shareholders. The Company provides its Annual Financial Statements within the mandatory period to all shareholders and debentureholders and the unaudited provisional Financial Statements are released to the Colombo Stock Exchange (CSE) in accordance with the Listing Rules of CSE.
All shares carry equal voting rights and the shareholders are informed of the Annual General Meeting before the mandatory period. The Board, Senior Management and the Auditors attend the Annual General Meeting to answer the questions of shareholders.
By Order of the BoardL B Finance PLC
P W Corporate Secretarial (Pvt) LtdSecretaries
6th June 2011
The Managing DirectorMr Sumith Adhihetty has been the Managing Director of the Company since January 2004.
The Managing Director is responsible for the effective running of the Company and the implementation of the policies approved by the Board.
Board Sub-CommitteesAn Audit Committee, a Remuneration Committee, an Integrated Risk Management Committee, a Management Committee and a Nomination Committee function as Sub-Committees of the Board. The above Committees consist of a majority of Non-Executive Directors and their names are given on pages 16 and 17.
The Chief Financial Officer functions as the Compliance Officer to ensure compliance with the Regulatory and Statutory requirements and the laws and regulations governing Finance Companies, Public Listed Companies and, generally, in business activities undertaken by the Company. Besides, the Company had identified Committees in-house for recoveries, credit and asset and liability management to regulate the relevant areas thereby ensuring that decision-making is on a participatory basis.
The Reports of the Remuneration Committee and Audit Committee are given on pages 66 and 67.
The ManagementThe day-to-day operations of the Company are entrusted to the Corporate and Senior Management headed by the Managing Director. They ensure that risks and opportunities are identified and steps are taken to achieve targets within defined time frames and budgets.
Financial Disclosures and TransparencyFinancial Statements are prepared in accordance with the Sri Lanka Accounting Standards, the Companies Act, the Finance Companies Act and the directions and rules issued thereunder. The unaudited provisional quarterly statements of accounts are released to the Colombo Stock Exchange (CSE) in compliance with the Listing Rules of the CSE.
Messrs Ernst & Young act as external auditors of the Company. The Auditors are allowed to act independently and without intervention from the Management or the Board of the Company to express an opinion on the financial statements of the Company. All the required information is provided for examination to the Auditors.
Ethical StandardsThe Company requires that all its employees maintain the highest standards of integrity in the performance of their duties and dealings on behalf of the Company.
The Company focuses on the training and career development of employees for the creation of an empowered and committed group of employees, who will drive the Company to higher levels of achievement in keeping with its mission, vision, goals and values.
Statutory PaymentsAll statutory payments due to the Government, which have fallen due, have been made or where relevant provided for, except for certain assessments against which appeals have been lodged. Retirement gratuities have been provided for in accordance with the Sri Lanka Accounting Standards, No. 16, Employee Benefits (Revised 2006).

| L B Finance PLC | Annual Report 2010/1146
Risk Management
Risk is an important component which is inherent to any type business operation, especially to the financial services industry. Risk can be defined as the volatility that surrounds the expected outcome or the probability of a negative occurrence caused by external or internal vulnerabilities. Risk could be neutralized through pre emptive actions. Therefore the implementation of an effective risk management structure is of essence for business survival considering the volatility in today’s financial markets.
Risk AppetiteThe following factors are taken in to account in defining the Company’s overall risk appetite. • Maintaining a well-balanced portfolio to
ensure earning streams.• The risk/reward structure of the
Company’s activities.• Potential risk from unforeseen events
such as natural disasters, earth quakes, tsunami etc.
• Sensitivity of earnings to diverse market conditions and economic scenarios.
LBF’s Approach to Risk ManagementDuring the year we effected improvements to the Company’s risk management functions in line with regulatory requirements, business needs, environmental factors and international best practices. A proactive approach was adopted for risk management by conducting gap analysis between the Company’s risk management practices and the regulatory recommendations. We ensured the implementation of the optimal strategy to counter risk while continuously monitoring the risks faced by the Company. We adopted an integrated approach to manage risks having identified and understood the individual types of risks and their interrelationships. Over the years, considerable resources have been devoted to activate the process of risk management in the Company. Our risk management process ensures that the risk we take up does not exceed the level of our risk appetite.
The Risk Management ProcessOur risk management process includes a comprehensive, transparent and objective risk disclosures to the senior management, Board of Directors, shareholders and other stakeholders of the Company. We also ensure that all critical elements of risks the Company is exposed to are addressed in a comprehensive and a holistic manner. We adopt an egalitarian approach to risk management where each employee of the corporate hierarchy has a well defined role and a responsibility so that risk is shared among all. Senior management and the line managers are held accountable for maintaining a sound risk response strategy while each employee in the Company is held responsible for the maintenance of an effective risk response strategy.
As depicted below the risk management process of the Company contains three main elements namely risk assessment, risk reporting and risk treatment.
RiskAssessment
• IdentifyRisk• EstimateRisk• PrioritiesRisk
RiskReporting
Reports to the Boards & to relevant stakeholders
RiskAssessment
• RiskControl• RiskAvoidance• RiskTransfer
“During the year we effected improvements to the Company’s risk management functions in line with regulatory requirements, business needs, environmental factors and international best practices.”

Annual Report 2010/11 | L B Finance PLC | 47
Risk Assessment comprises of analysis and evaluation of risk through the processes of identification, description and estimation. Risk Reporting is concerned with submitting regular reports to the Board and to the relevant stakeholders of the Company, enabling the monitoring of the effectiveness of the policies which are in practice. Risk Treatment or the Risk Response is the process of implementing measures to modify the risks through risk control/mitigation, risk avoidance and risk transfer. Board’s Role in Risk ManagementWe adopt a top down approach to risk management where the Board approves the strategies and polices, monitors compliance and the activities of the senior management through the setting up of various Board approved committees. These committees consist of members of the Board, senior management and industry specialists who bring in a wide range of knowledge in the best practices of risk management. Three committees are in existence in order to ensure an effective risk management policy is in practice. Integrated Risk Management Committee (IRMC)The committee was set up in 2009 and comprises of the Executive Director (Asset Finance), the Executive Director (Asset Management) and is headed by the Managing Director. The main responsibility of the committee is to improve the credit risk management and interest rate risk management. In order to ensure the above, the committee reviews the risk management functions and makes recommendations to improve the risk management framework. Additionally, the responsibility of reviewing and monitoring the credit operations lies with the IRMC.
Audit CommitteeThis is a formally constituted subcommittee of the main Board. Audit Committee comprises of individuals who are independent of the company. The appointment of the members to the committee is done by the Board. The primary function of the committee is to assist the Board to fulfill its stewardship responsibilities by reviewing the systems of internal controls and risk management systems. However, responsibility of managing the risk still lies with the Board.
Asset & Liability Management Committee (ALCO)ALCO is headed by the Managing Director of the company and comprise of selected members of the senior management and executives representing finance, treasury, deposits, credit and marketing and experienced external consultants. The Committee is responsible for the management of the Balance Sheet items including asset and liability management, capital structure management, fund management and liquidity management. This is supported by cash flow forecasts, gap reports, variance analysis and sensitivity analysis. The committee meets on a regular basis to develop long term strategies to maintain the balance sheet structure in an optimal manner and to ensure that controls which are currently in place address the risks we are exposed to in an effective manner.
Description of Risks and its ManagementIn achieving its strategic objectives the Company is exposed to different types of risks broadly categorized as Business Risk (Operational Risk), Market Risk, Environment Risk and Reputation Risk.
Business/ Operational Risk arise due to human activities, technology and natural incidents. The sources of business risks include fraud, staff negligence, technology failure, technology obsolescence, management systems failure, model failure and inadequate internal controls. We are exposed to operational risk due to the nature of business we are in and also in the ordinary course of operations.
The fundamental tools of operational risk management include segregation of duties, having well defined, demarcated responsibilities for each employee, internal and external audit, strict monitoring facilitated by the technology platform and backup facilities for information. We also place special emphasis on training our employees to ensure they possess the required knowledge and skills to perform the particular job assigned to them. Authority limits are assigned to employees based the role he/she plays in the corporate hierarchy and it is clearly communicated to the staff ensuring that each employee follows the process.
The Market Risk we face can be sub categorized as Credit Risk, Interest Rate Risk and Liquidity Risk.
Credit Risk is the potential financial loss that could arise due to borrower’s or a counter party’s inability to honour the contractual obligations. This risk arises from the different activities of the Company such as lending, leasing and hire purchase operations etc. and is an inherent risk from the daily operational functions of the business.
Our credit risk management strategy is not to eliminate but to contain risk within reasonable limits. We carry out a thorough evaluation of the credit worthiness of the client by obtaining necessary internal and external information on collateral, guarantors etc. We also set exposure limits for individual borrowers to manage concentration risk and obtain sufficient collateral which has been made mandatory
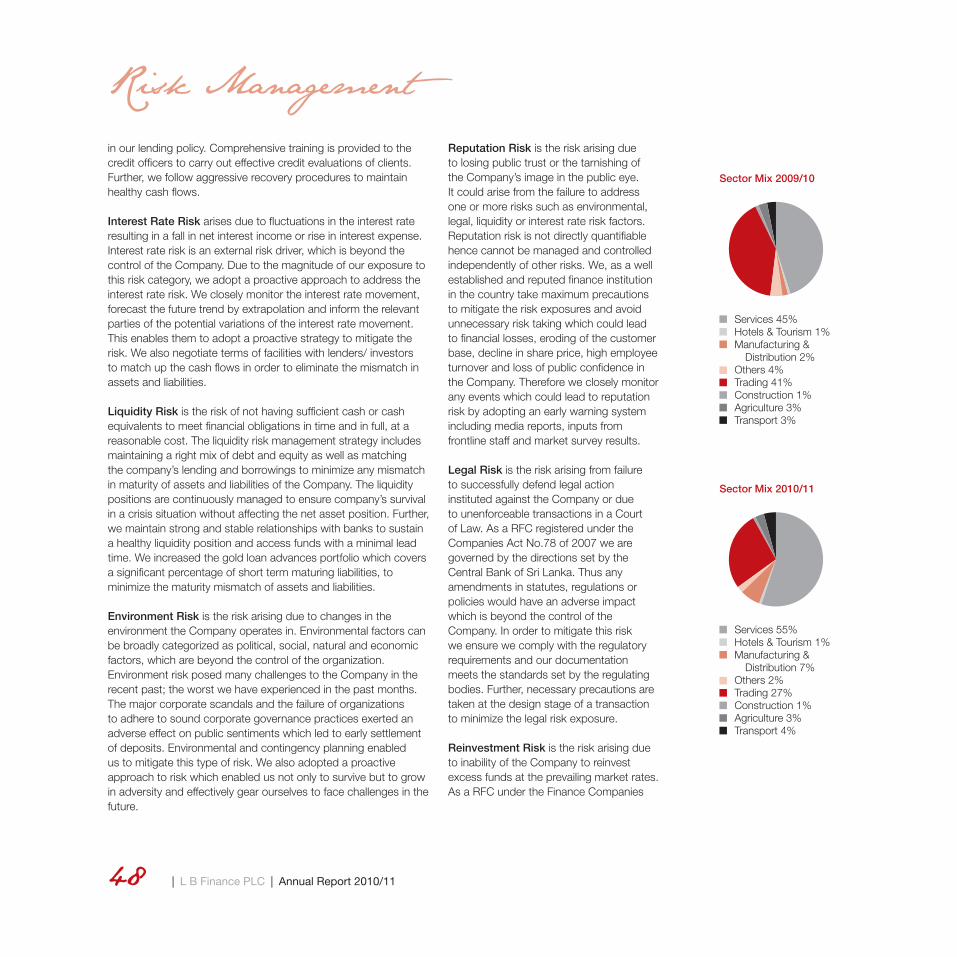
| L B Finance PLC | Annual Report 2010/1148
in our lending policy. Comprehensive training is provided to the credit officers to carry out effective credit evaluations of clients. Further, we follow aggressive recovery procedures to maintain healthy cash flows.
Interest Rate Risk arises due to fluctuations in the interest rate resulting in a fall in net interest income or rise in interest expense. Interest rate risk is an external risk driver, which is beyond the control of the Company. Due to the magnitude of our exposure to this risk category, we adopt a proactive approach to address the interest rate risk. We closely monitor the interest rate movement, forecast the future trend by extrapolation and inform the relevant parties of the potential variations of the interest rate movement. This enables them to adopt a proactive strategy to mitigate the risk. We also negotiate terms of facilities with lenders/ investors to match up the cash flows in order to eliminate the mismatch in assets and liabilities.
Liquidity Risk is the risk of not having sufficient cash or cash equivalents to meet financial obligations in time and in full, at a reasonable cost. The liquidity risk management strategy includes maintaining a right mix of debt and equity as well as matching the company’s lending and borrowings to minimize any mismatch in maturity of assets and liabilities of the Company. The liquidity positions are continuously managed to ensure company’s survival in a crisis situation without affecting the net asset position. Further, we maintain strong and stable relationships with banks to sustain a healthy liquidity position and access funds with a minimal lead time. We increased the gold loan advances portfolio which covers a significant percentage of short term maturing liabilities, to minimize the maturity mismatch of assets and liabilities.
Environment Risk is the risk arising due to changes in the environment the Company operates in. Environmental factors can be broadly categorized as political, social, natural and economic factors, which are beyond the control of the organization. Environment risk posed many challenges to the Company in the recent past; the worst we have experienced in the past months. The major corporate scandals and the failure of organizations to adhere to sound corporate governance practices exerted an adverse effect on public sentiments which led to early settlement of deposits. Environmental and contingency planning enabled us to mitigate this type of risk. We also adopted a proactive approach to risk which enabled us not only to survive but to grow in adversity and effectively gear ourselves to face challenges in the future.
Reputation Risk is the risk arising due to losing public trust or the tarnishing of the Company’s image in the public eye. It could arise from the failure to address one or more risks such as environmental, legal, liquidity or interest rate risk factors. Reputation risk is not directly quantifiable hence cannot be managed and controlled independently of other risks. We, as a well established and reputed finance institution in the country take maximum precautions to mitigate the risk exposures and avoid unnecessary risk taking which could lead to financial losses, eroding of the customer base, decline in share price, high employee turnover and loss of public confidence in the Company. Therefore we closely monitor any events which could lead to reputation risk by adopting an early warning system including media reports, inputs from frontline staff and market survey results.
Legal Risk is the risk arising from failure to successfully defend legal action instituted against the Company or due to unenforceable transactions in a Court of Law. As a RFC registered under the Companies Act No.78 of 2007 we are governed by the directions set by the Central Bank of Sri Lanka. Thus any amendments in statutes, regulations or policies would have an adverse impact which is beyond the control of the Company. In order to mitigate this risk we ensure we comply with the regulatory requirements and our documentation meets the standards set by the regulating bodies. Further, necessary precautions are taken at the design stage of a transaction to minimize the legal risk exposure.
Reinvestment Risk is the risk arising due to inability of the Company to reinvest excess funds at the prevailing market rates. As a RFC under the Finance Companies
Risk Management
Sector Mix 2009/10
Services 45%Hotels & Tourism 1%Manufacturing & Distribution 2%Others 4%Trading 41%Construction 1%Agriculture 3%Transport 3%
Sector Mix 2010/11
Services 55%Hotels & Tourism 1%Manufacturing & Distribution 7%Others 2%Trading 27%Construction 1%Agriculture 3%Transport 4%
Annual Report 2010/11 | L B Finance PLC | 49
Act No.78 of 2007, we are required to maintain 10 per cent of our assets and 10 per cent of our deposits in liquid assets. The professional relationships we maintain with our lenders have positioned us well to obtain better terms when negotiating for funds.
Capital Risk is the risk of losses arising from uncovered loans which would affect the Company’s capital base. Capital risk management strategy includes obtaining sufficient collateral greater than the value of the loan granted by the Company. This would enable the Company to recover the value of the loan in the case of default, by the borrower.
Technology Risk is the risk arising from heavy reliance on information systems which makes the Company vulnerable to system failures, interruptions, breaches in security and technology obsolesce. Technology risk could damage the Company’s reputation, expose the Company to financial liabilities and unnecessary litigation, and lead to loss of business. Technology risk management strategy is intertwined with other risk management processes and overall business strategy of the Company. System upgrades, developing an up-to-date and comprehensive system and network diagram, reviewing controls over data transfer points, having comprehensive service provider contracts are some of the measures we have taken to mitigate this risk.
Competitor Risk is the probability of loss from a decline in a firm’s competitiveness. As a RFC the Company faces stiff competition from other finance companies, commercial banks, registered leasing companies and mortgage companies.
To mitigate competitor risk we adopt a proactive approach to assess and satisfy the varying needs of the customers, offer competitive rates for deposits and lending, maintain a superior customer service and a high credit quality backed by state of the art technology.

| L B Finance PLC | Annual Report 2010/1150
Sustainability Report
Dear Stakeholder,I take great pleasure in presenting to you the Sustainability Report for the financial year ended 31 March 2011.
Over the years, L B Finance has demonstrated its strong commitment to society and environment in which it operates. We have dedicated ourselves to invest all our efforts and practices to achieve a sustainable growth and create a greater value to all our stakeholders. We have maintained our respect to our stakeholders through conducting numerous community investment programmes, increasing shareholder wealth, delighting our customers, conducting business in a transparent manner and developing and motivating our staff. The Sustainability Report will provide an in-depth account of the manner in which we have succeeded in fulfilling our commitment to sustainability.
Over the years our corporate priorities have been defined taking into account the impact they exert not only on profitability, but also the economy, community and environment we operate in.
The world witnessed much calamity and devastation caused by many ecological and natural disasters during the year. Still many nations struggle to extricate themselves from the repercussions of these catastrophes. As a responsible corporate entity, we recognize the importance of conducting our operations in a responsible manner and we are fully committed to this task.
As Sri Lanka has stepped into a new phase of development with a favorable business climate, immense opportunities has opened up for us to maximize stakeholder wealth. While making use of these opportunities, we will continue to seek more ways to operate as responsible corporate citizen in the coming years.
Sumith AdhihettyManaging Director
Managing Director’s Message Our ApproachWhilst envisioning to be a major player in the financial services sector, we understand our responsibility in operating as a good corporate citizen, delivering value to all our stakeholders and being an active partner in the nation’s development process.
Our stakeholders form the integral part of our organization, on whom our existence lies on. Our past, present and future revolves around them. For us sustainability means consistently adding value to all our other stakeholders whilst keeping our customers happy and satisfied.
The Company’s approach to sustainable reporting focuses on the following stakeholders:
Customers: Fostering mutually rewarding customer relationships, providing superior products with highest service standards.
Shareholders and potential investors: Maximizing shareholder wealth by delivering consistent and satisfactory returns while ensuring fairness and transparency.
Employees: Creating a conducive environment which foster a greater team spirit, with high level of motivation and excellent management and staff relationships.
Community: Provide excellent services across the nation and empowering disadvantaged communities.
Environment: Maintaining highest ethical values and ensuring that every facet of our business complies with industry accepted best practices.
Suppliers: Maintaining fair procurement practices and protecting the rights of the suppliers.
Customer ResponsibilityWe cater to a diverse range of customers who have chosen us as their financial partner and we consider it our utmost importance to provide a service exceeding their expectations.
SME CustomersRecognising the importance of the Small and Medium Enterprises (SME) Sector to the nation’s economic development, we have placed a greater emphasis on lending to this segment. Our lending portfolio largely represents the SME sector, deviating from the conventional and stereotype credit approach and adopting a realistic credit mechanism to satisfy the diverse needs of this segment.
Customer Satisfaction SurveysWe continually strive to delight our customers by offering superior products and services. In this context we attempt to create a product and service portfolio that augment our positioning in the financial services industry by identifying customer expectations and satisfying them. We emphasise on providing affordable customised solutions with speed and flexibility, backed by state of the art technology. We also maintain an open door policy where customer interactions are promoted and encouraged. This has made us one of the most accessible organisations in the financial services sector.

Annual Report 2010/11 | L B Finance PLC | 51
We carry out customer satisfaction surveys to gauge customer requirements. Some of the techniques we use are as follows:
Mystery Shopper : This is a popular method used for market research purposes where we acquire information about our products and services using this tool. We develop our future plans based on the findings. This concept has become a useful method of evaluating the overall performance of our branches and Gold Loan Centres. The practical application of this concept has helped us to assess the operational aspects of our business including the performance of our staff and the quality of the service we offer to the customers and thereby improve our quality of service.
Product and service enhancementsRegular telephone research is conducted to improve service and product quality by research executives. Some of the research techniques used to gather information from customers include :• Face-to-face interviews• Telephone interviews• Mailing questionnaires• E-mailing customer satisfaction surveys
Expanding Our ReachWe are able to serve our customers through our network totaling 34 branches and 92 Gold Loan Centres island wide. Our branches are spread in all districts in order to provide all citizens of this nation, equal opportunity to access our services. During the year under review 7 branches and 17 Gold Loan Centres were opened in strategic locations.
Product DevelopmentTo offer our customers with a wider spectrum of products and services, we launched factoring, working capital and Islamic Finance during the year. This is in keeping with our strategic focus of product development. Please refer pages 32 to 34 in the annual report for more details on these products.
Employee ResponsibilityOur team of employees are our most valuable asset. Their commitment, positive attitude and dedication has enabled us tide over adversities and record a steady growth in performance throughout the years. We believe that developing and retaining our human capital is critical for our future growth. During the year, we recruited a total of 374 persons into our carder thus raising our staff strength to 1264 by end 2010/11.
As tabulated below, the profit before tax per employee has increased by 29 per cent YoY to Rs. 1.5 million from Rs 1.2 million the previous year.
31.03.06 31.03.07 31.03.08 31.03.09 31.03.10 31.03.11
Human ROI (Rs.) 3,018,031 3,352,409 5,364,599 5,280,490 4,641,566 4,352,757
PBT Per Employee (Rs.) 672,103 842,447 812,390 985,055 1,166,330 1,505,428
No of Employees 303 391 518 678 890 1,264
RecruitmentPotential employees are selected based on skills, qualifications, experience, values and attitudes that would best fit the organisation. Existing employees are encouraged to introduce new employees who would fit the job profile.
Recognising the long term prospects, the management has recruited and given responsibilities to the young dynamic workforce in the company. They are being recognised and accepted as an important facet of the organisation where their performance is evaluated and rewarded on monthly basis, while providing comprehensive training on and off the field. Advise and direction is provided on areas of career prospects and personal development.
RemunerationWe provide a competitive remuneration package aligned with the industry standards to all our staff members. Our recruitment, remuneration, special rewards and career advancement are based solely on performance. Remuneration across the board is determined based on an employee’s level of experience and contribution to the Company. The Remuneration Committee determines the salary structure of the key management personnel.
Staff DevelopmentWe provide comprehensive training to develop our human capital. A knowledge gaining culture is imbued to the daily operation of the organization in order to gear our employees for the challenges ahead. On the job training is provided in-house by management and external resource personnel. The skills required to perform the job is developed through knowledge management and hands-on-experience. We believe that employees who fulfill their own goals and aspirations will deliver better results. Hence, we support and encourage our staff to acquire academic and professional qualifications. Special attention is also given to promote the corporate values and ethics among our employees. In this regard, new recruits are given a comprehensive induction about the
“Whilst envisioning to be a major player in the financial services sector, we understand our responsibility in operating as a good corporate citizen, delivering value to all our stakeholders and being an active partner in the nation’s development process.”

| L B Finance PLC | Annual Report 2010/1152
Company, culture and values. Issues and best practices, especially on areas of risk management and compliance requirements are shared across the organization to make all business practices transparent and fundamentally sound.
Details of the training programmes during the year are given below.
Training Program Kandy Kurunegala Amapara Galle Colombo
Date 30th January 2011 17th February 2011 25th February 2011 13th March 2011 19th March 2011
Venue Sri Pushpadana Hall Seasons Hotel K G A Ariyawan Rest Hasra Hall Somro Maharagama
Participants Cashiers and Gold Loan staff
Trainers (senior mgt) CFO, Assistant Manager-Finance, Assistant Manager-IT, 3 Executives
Training Objective Training on overall cashier and Gold Loan process, L B Money Transfer system and the New Financial System
Training hours 8.00 a.m. to 5.00 p.m.
Evaluating and Recognizing PerformanceAn employee is evaluated based on targets achieved and value creation. While recognising individual performance, more weightage is added to team led performance. We maintain an open door policy where employees and supervisors engage in constant dialogue to create a healthy work culture. The Company’s incentive scheme which includes increments, bonuses and other rewards are based on the performance evaluation process. High achievers are given due recognition and this has increased the level of motivation of the employees, while making them feel that they are an integral part of the success of the organisation.
Work EthicsWe are an equal opportunity employer, wherein gender, race, religion, caste or any other discriminatory criteria are not in our mandate. We ensure that we follow all relevant human resource standards and regulations very stringently. We do not condone child or underage labour nor have any bias within our organisation.
Statutory Payments and Defined Benefit PlanThe Company has continually fulfilled all statutory obligations on behalf of the employees, while the Defined Benefit Obligation and related provision for the year is based on actuarial valuation using the ‘Projected Unit Credit Method’ as per the Sri Lanka Accounting Standard No. 16.
Work Life BalanceCreating a healthy work life balance is an integral component of improving productivity of the staff members. This is facilitated through numerous welfare initiatives and encouraging our staff to engage in extracurricular activities such as sports, religious and cultural events organized by the Company. We also implement health and safety measures, a clear process for grievance handling, health insurance schemes and encourage interaction of our staff and family members through regular annual events.
Achievements in SportsWe encourage our staff to actively participate in sports and other recreational facilities. The achievements of our staff members are detailed below.
The LBF cricket team once again entered the semi finals of the Mercantile Cricket Tournament 2011 under Division B conducted by Mercantile Cricket Association (MCA). Dilhan Cooray of LBF was awarded “Player of the tournament” for his all-round performance. There were 8 teams in this division and LBF played 7 matches to qualify for the semi finals.
Sustainability Report
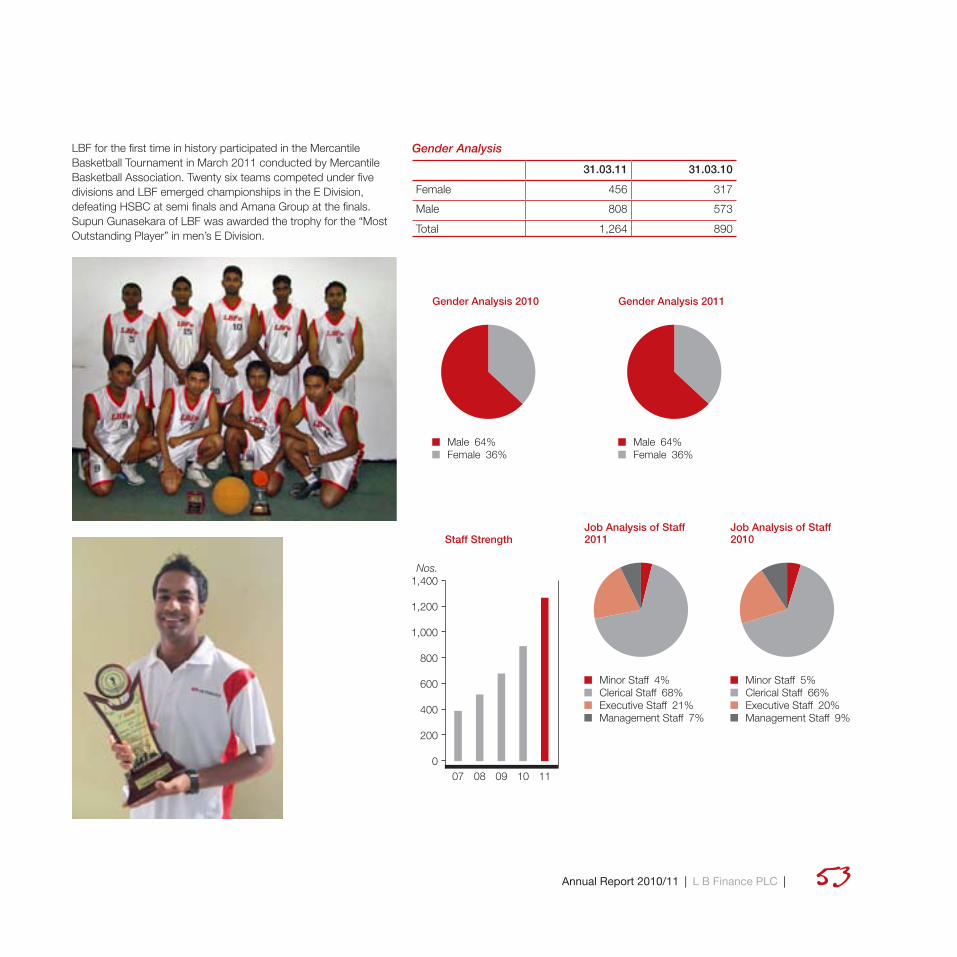
Annual Report 2010/11 | L B Finance PLC | 53
LBF for the first time in history participated in the Mercantile Basketball Tournament in March 2011 conducted by Mercantile Basketball Association. Twenty six teams competed under five divisions and LBF emerged championships in the E Division, defeating HSBC at semi finals and Amana Group at the finals. Supun Gunasekara of LBF was awarded the trophy for the “Most Outstanding Player” in men’s E Division.
Gender Analysis
31.03.11 31.03.10
Female 456 317
Male 808 573
Total 1,264 890
Gender Analysis 2011
Male 64%Female 36%
Gender Analysis 2010
Male 64%Female 36%
0
1,400Nos.
600
1,000
1,200
800
400
200
07 08 09 10 11
Staff StrengthJob Analysis of Staff 2011
Minor Staff 4%Clerical Staff 68%Executive Staff 21%Management Staff 7%
Job Analysis of Staff 2010
Minor Staff 5%Clerical Staff 66%Executive Staff 20%Management Staff 9%

| L B Finance PLC | Annual Report 2010/1154
Age Analysis of Staff
31.03.11 Total Male Female
0 to 2 Years 766 471 295
2 to 5 Years 345 238 107
5 to 10 Years 108 72 36
More than 10 Years 45 27 18
1264 808 456
31.03.10 Total Male Female
0 to 2 Years 553 350 203
2 to 5 Years 222 153 69
5 to 10 Years 71 44 27
More than 10 Years 44 26 18
890 573 317
Shareholder ResponsibilityWe strive to maintain a sustainable growth while enhancing shareholder value. Our commitment to shareholders include, managing operations to deliver consistent growth, achieving profitability targets, implementing an effective risk management framework, sound internal control systems and good governance practices, providing a balanced and transparent assessment of the Company’s positioning, performance and prospects and ensuring adequate and timely communication.
We follow sound business fundamentals and effective strategies to increase our shareholder wealth. The Company’s PAT recorded a YoY growth of 104 per cent to reach Rs. 1 billion while the total assets grew by 63 per cent to Rs. 28 billion. Consequently, EPS increased to Rs. 14.7 while ROE and ROA soared to 47 per cent and 5 per cent respectively.
Return on Assets Return on Equity
0
10
50%
40
30
07 08 09 10 11
20
Return on Assets Vs Return on Equity
Earnings per ShareNo. of Shares
0 0
16 80Rs. No of Shares
8
12
40
60
07 08 09 10 11
4 20
Earnings Per Share Vs No of Shares
MaleFemale
0
100
500Nos.
300
400
0 to
2 Y
ears
Mor
e th
an10
Yea
rs
5 to
10
Year
s
2 to
5 Y
ears
200
Service Analysis of Staff 2011
MaleFemale
0
100
500Nos.
300
400
0 to
2 Y
ears
Mor
e th
an10
Yea
rs
5 to
10
Year
s
2 to
5 Y
ears
200
Service Analysis of Staff 2010
Sustainability Report

Annual Report 2010/11 | L B Finance PLC | 55
Key Performance Indicators – Shareholder Responsibility
31.03.06 31.03.07 31.03.08 31.03.09 31.03.10 31.03.11
Earnings Per Share 5.71 8.9 6.8 10.4 7.2 14.73
Return on Average Assets (%) 1.91 3.07 2.32 2.91 3.21 4.51
Return on Average Shareholders’ Funds (%) 27.20 37.95 26.35 30.93 32.2 46.69
Net Assets Per Share 26.27 29.08 32.18 38.99 25.36 37.74
Compliance with Regulatory BodiesWe comply with all regulations, guidelines, circulars and rules issues by relevant regulatory bodies and submit all regulatory reports.
Share PriceOur share price soared during the year to peak at Rs. 340 per share (before bonus issue) thus reflecting the profitability and stability of the Company.
L B Finance Share Price
Before Bonus Issue
After Bonus Issue
Bonus Issue Date (Effective)
07.03.2011
No of Shares 34,628,571 69,257,142 Closing Price 31.03.2011
N/A 175.1
Beginning Price 31.03.2010
62 N/A
High Price 340 198.00Low Price 62 131.10
We declared a 1:1 bonus issue in March 2011, issuing 34,628,571 shares.
DepositorsDepositors are our key source of finance and we always take decisions to optimise their value. For an example, when interest rates were declining significantly during 2010/11, we did not reduced our deposit interest rates in tandem with the dip in lending rates. Our deposit base increased by 57 per cent to Rs. 20 billion during the year.
Community ResponsibilityCommunity is an import stakeholder of the LBF. We interact with community organizations to improve the well being of the people’s of our nation. We have demonstrated our commitment towards the community through our efforts to enrich people lives. We are proud of the many strong relationships we have built with many communities over the years. Details of the CSR projects undertaken by us during the financial year are as follows:.
Distributing school bags and Sports equipmentsApproximately 2000 School bags and sports equipment were distributed to several schools in Vauniya district, to mark the ceremonial opening of the LBF branch in Vauniya. This CSR project was done targeting the children of poor families in the district.
Sports items such as volleyballs, net ball, footballs, badminton sets and tennis balls were donated to several schools in the district.
Share Price Trend (Rs.)No. of Shares (Nos)
0 0
200 80,000Rs. Nos (‘000)
100
150
40,000
60,000
07 08 09 10 11
50 20,000
Share Price Trend vs No of Shares

| L B Finance PLC | Annual Report 2010/1156
The schools which received our donation of school bags are:
School Name School Name
Sinnadappan maha vidyalaya Periya puliyangulam maha vidyalaya
Karuppukutti maha vidyalaya Guri sudhagulam maha vidyalaya
Vingnanagulam maha vidyalaya Sri pannidaman maha vidyalaya Ailadi maha vidyalaya Nedungeran maha vidyalaya Periyamadhu maha vidyalaya Olumadhu maha vidyalaya Sri ramakrishnan maha vidyalaya
Senapilam maha vidyalaya
Periyagulam GTM maha vidyalaya
Welam gulam maha vidyalaya
Kunchigulam maha vidyalaya Marailuppe maha vidyalaya Kanagaraigulam maha vidyalaya
Mamadhu maha vidyalaya
Alangulam maha vidyalaya Kulam suddan maha vidyalaya
Villages that were benefited through this project:
Village Name
Palam mudei Nevi Udayar Mail kulam Kutti kulam Paratta gal
Renovation and Maintenance of Subramanium Park, JaffnaThe Subramanum Park in Jaffna was renovated and was ceremoniously opened to the public on 21st October 2010 by Ajith Nivard Cabraal, Governor of Central Bank and Dhammika Perera, Chairman of LBF in conjunction with the opening of the Company’s branch in the North. The park named in honour of Dr. P. Subramaniam, a popular Western medical practitioner and generous benefactor in Jaffna, is a landmark close to the hearts of Jaffna citizens. This is centrally located in proximity to famous clock tower and the Jaffna library. The company white washed the walls, renovated the fountain and carried out all necessary tasks to facelift beauty and restore tranquility to the park. The
Sustainability Report

Annual Report 2010/11 | L B Finance PLC | 57
Donation of eye lensesThis project commenced in June 2010, in response to a request made by the eye hospital to donate 200 eye lenses to needy patients. These lenses which are expensive and not affordable to poor patients greatly improves the vision of the eye patients. Already 178 lenses have been handed over to the recommended
Company has undertaken to upkeep and maintain the park on a regular basis. As a second phase of the project, in response to the request made by the Honorable Mayor of Jaffna, we have undertaken to repair the cement chairs in the children’s park and supply sports equipment to be used in the park.
patients of the eye hospital. A certification of appreciation was awarded by the hospital in appreciation of the contribution made by LBF.

| L B Finance PLC | Annual Report 2010/1158
Donation of a Wheel ChairA wheel chair was donated to a disabled person and school bags were distributed to poor school children in the Kalutara district.
Helping an OrphanageThe Panadura Branch organized a care giving event at ‘Gothama Children’s Development Centre,’ in Nalluruwa, Panadura.
Environment ResponsibilityThe environment has a huge impact on business operations as natural disasters caused by environmental factors have immense devastation to human life and property. Recognizing our responsibility to safeguarding the environment we attempt to minimize the use of paper and conserve electricity and water. Usage is monitored monthly to assess reasons for any increase and measures are taken to eliminate waste.
Supplier ResponsibilityWe maintain standard procurement practices based on principals of transparency and accountability. We make a conscious effort to source suppliers from the vicinity of branches, especially for work related to maintenance and repairs. We also ensure that our relationships with suppliers are with service providers who are registered with LBF. A comprehensive and transparent tender procedure is in place to select potential suppliers for various supplies. We respect the rights of the suppliers through timely payments and long lasting relationships.
Value Added StatementThe Value Added Statement portrays the principal sources of income, and the manner in which the income was distributed among thye stakeholders of the Company.
The value generated by the company increased to Rs. 2 billion in 2010/11 from Rs. 1 billion the previous year. It is noteworthy to mention that we have paid Rs. 882 million as taxes to the Government during the year.
Sustainability Report
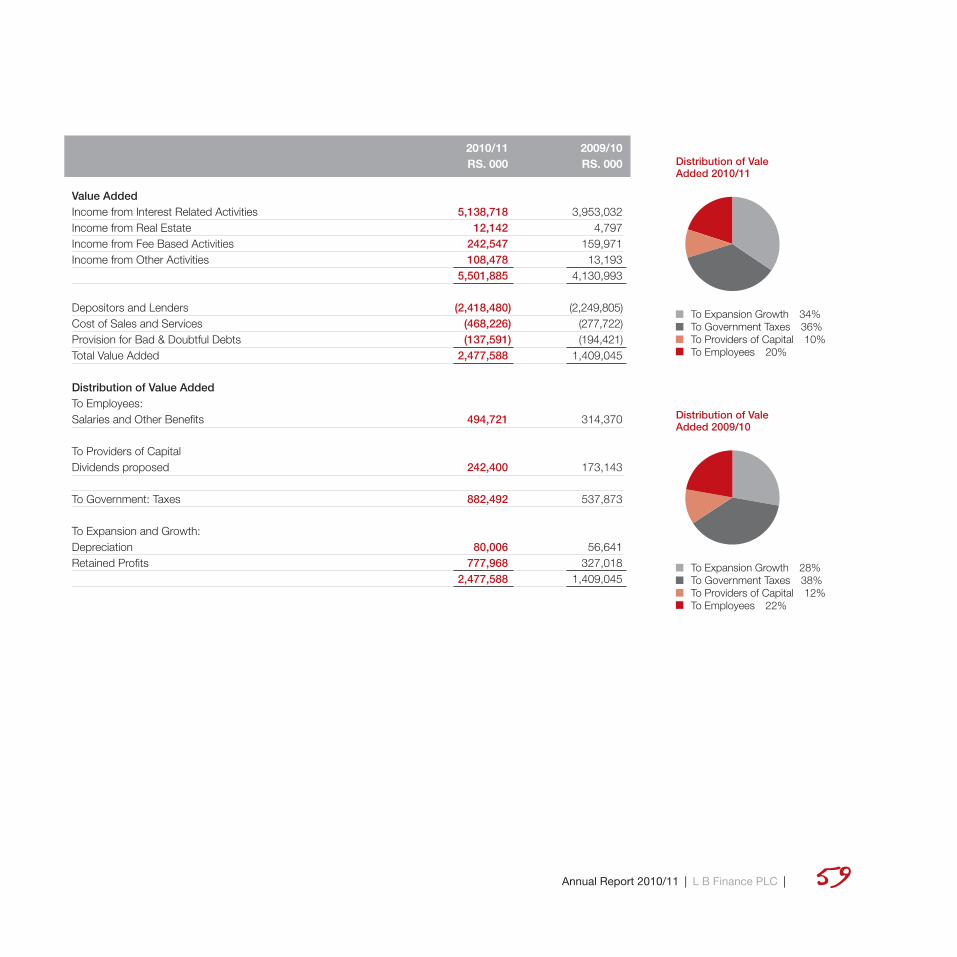
Annual Report 2010/11 | L B Finance PLC | 59
2010/11 2009/10 RS. 000 RS. 000
Value AddedIncome from Interest Related Activities 5,138,718 3,953,032Income from Real Estate 12,142 4,797Income from Fee Based Activities 242,547 159,971Income from Other Activities 108,478 13,193 5,501,885 4,130,993 Depositors and Lenders (2,418,480) (2,249,805)Cost of Sales and Services (468,226) (277,722)Provision for Bad & Doubtful Debts (137,591) (194,421)Total Value Added 2,477,588 1,409,045
Distribution of Value Added To Employees: Salaries and Other Benefits 494,721 314,370 To Providers of Capital Dividends proposed 242,400 173,143 To Government: Taxes 882,492 537,873 To Expansion and Growth: Depreciation 80,006 56,641Retained Profits 777,968 327,018 2,477,588 1,409,045
Distribution of Vale Added 2009/10
To Expansion Growth 28%To Government Taxes 38%To Providers of Capital 12%To Employees 22%
Distribution of Vale Added 2010/11
To Expansion Growth 34%To Government Taxes 36%To Providers of Capital 10%To Employees 20%

| L B Finance PLC | Annual Report 2010/1160
Financial Reports

Annual Report 2010/11 | L B Finance PLC | 61
Financial Reports Statement Of Directors’ Responsibilities 110Annual Report Of The Board OfDirectors On The State Of Affairs111Directors’ Interests In Contracts 115Report Of The Auditor General 119Income Statement 120Balance Sheet 121Statement Of ChangEs In Equity 122Cash Flow Statement 123Significant Accounting Policies 125Notes To The Financial Statements 138Capital Adequacy 195Investor Information 199Board Of Directors 209Corporate Management Team 210Executive Management Team 212Historical Overview 213Group Structure 214Subsidiaries & Associates 215Corporate Offices & Overseas Branches 219Service Points As At 31 December 2009 220Correspondent Banks By Country 229Exchange Companies By Country 234Glossary Of Financial/Banking Terms 235Corporate Information 237
Annual Report of the Board of Directors on the Affairs of the Company 62Report of the Remuneration Committee 66Report of the Audit Committee 67Statement of Directors Responsibilities 68Auditor’s Report 69Balance Sheet 70Income Statement 71Statement of Changes in Equity 72Cash Flow Statement 73Notes to the Financial Statements 74Capital Adequacy 100Ten Year Summery 102Share Information 104Glossary of Financial Terms 106Branch Network 108Notice of Annual General Meeting 112Form of Proxy 115

| L B Finance PLC | Annual Report 2010/1162
Annual Report of the Board of Directorson the Affairs of the CompanyThe Directors of L B Finance PLC have pleasure in presenting their Annual Report together with the Audited Financial Statements of the Company for the year ended 31st March 2011.
General L B Finance PLC is a public limited liability company, which was incorporated under the Companies Ordinance, No.51 of 1938 as a private limited liability company on 30th May 1971, converted to a public limited liability company on 29th September 1982, listed on the Colombo Stock Exchange in January 1998 and re-registered as per the Companies Act, No.7 of 2007 on 6th June 2008 with PQ 156 as the new number assigned to the Company.
L B Finance PLC is a finance company registered under the Finance Companies Act No.78 of 1988 and is a registered finance leasing establishment in terms of the Finance Leasing Act, No.56 of 2000.
Principal activities of the Company and review of performance during the year The Company’s principal activities during the year were acceptance of deposits, granting lease and hire purchase facilities, micro and agro finance facilities, gold loans, mortgage loans, factoring, Islamic finance facilities and other credit facilities.
The Company also has an interest in the leisure sector through its investment in The Fortress Resorts PLC.
A review of the business of the Company and its performance during the year, with comments on financial results, future strategies and prospects are contained in the Managing Director’s Report on pages 12 and 15, which form an integral part of this Report.
This Report, together with the Financial Statements, reflect the state of affairs of the Company.
Financial StatementsThe complete Financial Statements of the Company duly signed by two Directors on behalf of the Board and the Auditors are given on pages 69 to 99
Auditors’ ReportThe Report of the Auditors on the Financial Statements of the Company is given on page 69
Accounting PoliciesThe accounting policies adopted by the Company in the preparation of financial statements given on pages 74 to 80 are consistent with those of the previous period.
DirectorsThe names of the Directors, who held office as at the end of the accounting period are given below and their brief profiles appear on pages 74 to 80
Executive DirectorsMr. J A S S Adhihetty - Managing DirectorMr. Niroshan Udage - Executive DirectorMr. B D St A Perera - Executive Director Non Executive DirectorsMr. K D D Perera - Chairman*Mr. L N de S Wijeyeratne - Deputy Chairman/ Senior DirectorMr. Nimal Perera - DirectorMr. A M Weerasinghe - DirectorMr. K D A Perera - Director*Mr. M D S Goonatilleke - Director (resigned with effect from 20th May 2011)*Mrs. Kimarli Fernando - Director*Mrs. Shirani Jayasekara - Director
*Independent Non Executive Directors
Mr. B M Amarasekera who served as the Chairman since 3rd February 2004 resigned on 7th October 2010, whereupon, the Deputy Chairman Mr. K D D Perera was appointed the Chairman
of the Company, with Mr. L N D de S Wijeyeratne being appointed the Deputy Chairman. In accordance with the Finance Companies (Corporate Governance) Direction No.03 of 2008, Mr. L N de S Wijeyeratne was designated the Senior Director.
Mr. A M Weerasinghe retires by rotation at the conclusion of the Annual General Meeting in terms of Articles 85 and 86 of the Articles of Association and being eligible is recommended by the Directors for re-election.
Mrs. Shirani Jayasekara who was appointed a Director during the year under review, holds office until the forthcoming Annual General Meeting, and being eligible, is recommended for re-election in terms of Article 93 of the Articles of Association.
Mr. M D S Goonatilleke resigned with effect from 20th May 2011.
Messrs K D D Perera and K D A Perera are siblings.
Interests Register The Company maintains an Interests Register in terms of the Companies Act, No. 7 of 2007, which is deemed to form part and parcel of this Annual Report and available for inspection upon request.
All related party transactions which encompasses the transactions of Directors who were directly or indirectly interested in a contract or a related party transaction with the Company during the accounting period are recorded in the Interests Register in due compliance with the applicable rules and regulations of the relevant Regulatory Authorities.

Annual Report 2010/11 | L B Finance PLC | 63
The relevant interests of Directors in the shares of the Company as at 31st March 2011 as recorded in the Interests Register are given in this Report under ‘Directors’ shareholding’.
Directors’ RemunerationThe Directors’ remuneration is disclosed under ‘key management personnel compensation’ in Note 34 to the Financial Statements on page 98
Directors’ responsibility for Financial ReportingThe Directors are responsible for the preparation of Financial Statements of the Company to reflect a true and fair view of the state of its affairs. A further statement in this regard is included on page 68
AuditorsMessrs Ernst & Young, Chartered Accountants served as the Auditors during the year under review and also provided non audit/ consultancy services. They do not have any interest in the Company other than that of Auditor and provider of tax related services.
A total amount of Rs.1,710,000/- is payable by the Company to the Auditors for the year under review, comprising Rs.1,580,000/- as audit fees and Rs. 130,000/- for non audit services.
The Auditors have expressed their willingness to continue in office. The Audit Committee at a meeting held on 14th March 2011 recommended that they be re-appointed as Auditors. A resolution to re-appoint the Auditors and to authorise the Directors to determine their remuneration will be proposed at the Annual General Meeting.
Stated CapitalThe Stated Capital of the Company is Rs.838,282,159/- [Rs.491,996,449/- as at 31st March 2010].
The number of shares issued by the Company stood at 69,257,142 fully paid ordinary shares as at 31st March 2011 (34,628,571 fully paid ordinary shares as at 31st March 2010).
Capitalization of ReservesIn pursuance of a resolution passed by the shareholders on 4th March 2011, a sum Rs.346,285,710/- from and out of Rs 1,209,436,499/- standing to the credit of the Revenue Reserve Account in the books of the Company as at 30th November 2010 (unaudited) was appropriated as Stated Capital to and amongst the Shareholders as at the end of trading on 4th March 2011 and 34,628,571 ordinary shares were issued and distributed as fully paid-up ordinary shares amongst such shareholders in the proportion of one (01) new ordinary share for every existing ordinary share held as at the said date.
Accordingly, pursuant to such capitalization of reserves, the Stated Capital of the Company increased from Rs.491,996,449/- to Rs.838,282,159/-.
Directors’ ShareholdingThe relevant interests of Directors in the shares of the Company as at 31st March 2011 and 31st March 2010 are as follows.
Shareholding Shareholding as at as at 31/3/2011 31/03.2010 Mr. K D D Perera 14,078,762 24,699,981Mr. L N de S Wijeyeratne - -Mr. J A S S Adhihetty 53,060 26,530 Mr. Nimal Perera 1,148,598 408,949 Mr. A M Weerasinghe 148,850 74,425 Mr. K D A Perera - - Mr. Niroshan Udage 4,200 2,100 Mr. B D St A Perera - - Mr. M D S Goonatilleke 1,600 45(resigned on 20th May 2011) Mrs. Kimarli Fernando 1,600 800Mrs. Shirani Jayasekara (appointed on 25th August 2010) - - Messrs K D D Perera, Nimal Perera, A M Weerasinghe and M D S Goonatilleke (who resigned w.e.f. 20th May 2011) are Directors of Royal Ceramics Lanka PLC, which held 3,818,694 shares as at 31st March 2011.
Messrs K D D Perera, J A S S Adhihetty, Nimal Perera and Mrs. Kimarli Fernando are Directors Vallibel One Limited which held 35,321,200 shares as at 31st March 2011
Directors’ transactions with the Company / Related Party DisclosuresFixed Deposits accepted by the Company from Directors and their relatives (as defined in the Finance Companies Act No.78 of 1988) during the year under review were
Mr. J A S S Adhihetty Rs.538,527.40Mrs A R P Adhihetty (spouse of Mr J A S S Adhihetty) Rs.1,650,000.00 Mr. N Udage Rs. 10,989,026.06 Mrs M C P Perera (spouse of Mr. B D St A Perera) Rs.14,011,506.85Mrs. Shirani Jayasekara Rs.3,100,000

| L B Finance PLC | Annual Report 2010/1164
Annual Report of the Board of Directorson the Affairs of the Company
A fixed deposit held in the name of Mr K D A Perera for Rs.5,000,000 accepted on 6th March 2009 for a period of two years was repaid during the year under review.
These deposits were accepted in compliance with the Finance Companies (Deposits) Direction No. 01 of 2005 and Finance Companies (Interest) Direction No. 02 of 2005 and on terms and conditions that were for the time being applicable to the other depositors of the Company.
Transactions with entities that are controlled, jointly controlled or significantly influenced by key managerial personnel or their close members of family or shareholders who have either control, significant influence or joint control over entity are set out in Note 34.1.3 of the Financial Statements.
Shareholders There were 1,849 shareholders registered as at 31st March 2011 (1,552 shareholders as at 31st March 2010). The details of distribution are given on page 104 of this Report.
Major Shareholders, Distribution Schedule and other informationInformation on the distribution of shareholding, analysis of shareholders, market values per share, twenty largest shareholders of the Company, percentage of shares held by the public as per the Listing Rules of the Colombo Stock Exchange are given on page 104 to 105 under Share Information.
Employment PolicyThe Company’s employment policy is totally non-discriminatory which respects individuals and provides carrier opportunities irrespective of the gender, race or religion.
As at 31st March 2011, 1,264 persons were in employment (890 persons as at 31st March 2010).
ReservesThe reserves of the Company with the movements during the year are given in Note 21 to the Financial Statements on page 92
Land holdingsThe Company’s land holdings referred to in Note 13 of the accounts comprise a land of an extent of 7.06 perches with a building situated in Kandy, which is carried at it’s book value of
Rs.11.5 million (the current market value being Rs.30Mn.) and a land in extent 50 perches situated in Balagolla which was acquired during the year 2009/10 for Rs.7.5 million.
Property, Plant & EquipmentDetails and movements of property, plant and equipment are given under Notes12 and 13 to the Financial Statements on page 86 to 88
InvestmentsDetails of the Company’s quoted and unquoted investments as at 31st March 2011 are given in Notes 11 and 11.1 to the Financial Statements on pages 84 to 86
DonationsThe Company made donations amounting to Rs.3,281,413/- in total, during the year under review.
DividendThe Directors have recommended a first and final dividend of Rs. 3.50 per share for the year under review subject to obtaining a certificate of solvency from the Auditors.As required by section 56 of the Companies Act, the Directors have certified that they are satisfied that the Company will, immediately after the said distribution is made, satisfy the solvency test in accordance with the Companies Act.
The said dividend will, subject to approvalby the shareholders, be payable on the 5th market day from the date of the Annual General Meeting.
Compliance The Company has established a permanent and effective compliance function. A Compliance Officer appointed by the Board independently monitors
adherence with all applicable laws, regulations and statutory requirements and reports to the Board and the Integrated Risk Management Committee. Monthly and quarterly compliance reports are submitted confirming compliance with laws and regulations as applicable to the Company.
The Compliance Officer also ensures that compliance reports are submitted to the Central Bank of Sri Lanka confirming Company’s compliance with the directions, rules, determinations, notices and guidelines issued under the Finance Companies Act, No. 78 of 1988.
Internal ControlsThe Board of Directors have taken steps to ensure the implementation of an effective and comprehensive system of internal controls covering financial, operational and compliance controls. The Internal Auditors are responsible to review and report on the efficacy of the internal control system and other regulations and the Company’s accounting and operational policies, which are subject to further review by the Audit Committee as elaborated in the report of the Audit Committee on page 67
Risk Management An ongoing process is in place to identify and manage the risks that are associated with the business and operations of the Company. The Directors review this process through the Audit Committee and the Integrated Risk Management Committee.
Specific steps taken by the Company in managing the risks are detailed in the section on Risk Management on pages 46 to 49.

Annual Report 2010/11 | L B Finance PLC | 65
Statutory PaymentsThe Directors confirm that to the best of their knowledge, all taxes, duties and levies payable by the Company, all contributions, levies and taxes payable on behalf of, and in respect of employees of the Company and all other known statutory dues as were due and payable by the Company as at the Balance Sheet date have been paid or, where relevant provided for, except for certain assessments where appeals have been lodged.
Contingent LiabilitiesExcept as disclosed in Note 30 to the Financial Statements on page 97, there were no material Contingent Liabilities as at the Balance Sheet date.
Events occurring after the Balance Sheet dateExcept for the matters disclosed in Note 33 to the Financial Statements on page 98 there are no material events as at which require adjustment to, or disclosure in the Financial Statements.
Corporate Governance The Board of Directors are responsible for the governance of the Company. The Board has placed considerable emphasis on developing rules structures and processes to ensure integrity and transparency in all the dealings of the Company and its best effort in achieving performance and quality profits, adopting good governance in managing the affairs of the Company. The Board in the discharge of its responsibilities aforesaid had been guided by the Code of Best Practice on Corporate Governance issued jointly by the Institute of Chartered Accountants of Sri Lanka and the Securities and Exchange Commission of Sri Lanka and the Listing Rules of the Colombo Stock Exchange and Finance Companies (Corporate Governance) Direction No. 03 of 2008 .
The Board of Directors confirm that the Company is compliant with section 7.10 of the Listing Rules of the CSE and the said Direction No. 03 of 2008.
An Audit Committee, Remuneration Committee, an Integrated Risk Management Committee, Management Committeee and a Nominations Committee function as Board sub committees, with Directors who possess the requisite qualifications and experience. The composition of the said committees is as follows.
Audit CommitteeMr. L N de S Wijeyeratne (Chairman)Mr. M D S Goonatilleke (resigned with effect from 20th May 2011)Mrs. Shirani JayasekaraMr A M Weerasinghe (appointed with effect from 2nd June 2011)
Remuneration CommitteeMr. K D D Perera (Chairman)Mr. L N de S WijeyeratneMrs. Kimarli Fernnado
Integrated Risk Management CommitteeMr. M D S Goonatilleke (Chairman) (resigned with effect from 20th May 2011)Mrs. Shirani Jayasekera (appointed Chairperson with effect from 2nd June 2011)Mrs. Kimarli FernandoManaging DirectorExecutive Director – Asset FinanceExecutive Director – Asset ManagementHead of TreasuryHead of Finance
Management CommitteeMr. K D D Perera (Chairman)Mr. A M Weerasinghe
Nominations CommitteeMr K D D Perera (Chairman)Mr. L N de S WijeyeratneMrs. Kimarli Fernando
The corporate governance of the Company is reflected in its strong belief in protecting and enhancing stakeholder value in a sustainable manner, supported by a sound system of policies and practices. Prudent internal controls ensure professionalism, integrity and commitment of the Board of Directors, Management and employees.
The Corporate Governance Statement on pages 44 to 45 explains the measures adopted by the Company during the year.
Corporate Social Responsibility The Company as hitherto continued the Corporate Social Responsibility Programme, details of which are set out on pages 50 to 58 of this Report.
Annual General MeetingThe Notice of the Thirty Eighth (38th) Annual General Meeting appears on page 112.
This Annual Report is signed for and on behalf of the Board of Directors by
K D D Perera Chairman
Sumith Adhihetty Managing Director
P W Corporate Secretarial (Pvt) Ltd Secretaries
6th June 2011

| L B Finance PLC | Annual Report 2010/1166
Report of the Remuneration CommitteeThe Remuneration Committee consists of three non-Executive Directors, of whom two are Independent. The Managing Director and the Executive Directors as well as the Senior Management (wherever necessary) attend meetings of the Committee by invitation and provide relevant information and their views to the Committee for its deliberations, except when the Executive Directors’ own remuneration packages and other matters relating to them are discussed.
The functions of the Committee include making recommendations to the Board on the compensation and benefits of the Managing Director, Executive Directors and Key Management personnel.
A primary objective of the remuneration policy of the Company is to attract and retain a highly qualified and experienced workforce and reward their performance commensurate with each employee’s level of experience and contribution, bearing in mind the business performance and long term shareholder return.
The Committee meets as often as necessary and make recommendations on compensation structures and bonuses, increments, and also on matters pertaining to recruitment of Key Management personnel to ensure that the management and staff at all levels are adequately rewarded for their performance and commitment to the Company’s goals on a competitive basis.
The total of Directors’ remuneration paid during the year under review is set out in Note 34.1 to the Financial Statements.
K D D PereraChairman, Remuneration Committee
6th June 2011

Annual Report 2010/11 | L B Finance PLC | 67
Report of the Audit Committee Role of the Audit CommitteeThe main objectives of the Audit Committee is to assist the Board of Directors in fulfilling its oversight responsibilities in the financial reporting process and audit of the financial statements by monitoring the; a) integrity and reliability of the financial statements b) effectiveness of the system of internal controls and risk managementc) independence and performance of the external auditorsd) compliance with relevant laws, and regulations with a view to safeguarding the interests
of all stakeholders of the Company .
Composition The Composition of the Audit Committee during the year was as follows
Upto 31st October 2010Mr. L N de S Wijeyeratne - Chairman – Independent/ Non Executive DirectorMr. M D S Goonatilleke - Independent/ Non Executive DirectorMr. Nimal Perera - Non Executive Director (Resigned as an Audit Committee member on 26th October 2010) From 1st November 2010Mr. L N de S Wijeyeratne - Chairman – Independent/ Non Executive DirectorMr. M D S Goonatilleke - Independent/ Non Executive DirectorMrs. Shirani Jayasekara - Independent/ Non Executive Director (Appointed on 25th August 2010)
The Chairman, Mr L N de S Wijeyeratne, is a Fellow member of the Institute of Chartered Accountants of Sri Lanka, with more than 25 years of post-qualification experience in finance. The other members of the Committee are also qualified Accountants with extensive experience in finance and other related fields.
MeetingsThe Committee met on twelve (12) occasions during the year under review and the attendance of the members at such meetings was
Name of Director Executive/Non Executive
Independent/Non-Independent Attendance
Mr. L N de S Wijeyeratne Independent Non- Executive 12/12Mr. Nimal Perera Non- Executive Director 02/06Mr. M D S Goonatilleke Independent Non Executive 12/12Mrs. Shirani Jayasekara Independent Non Executive 06/06
The Managing Director, the Executive Directors and the Chief Financial Officer (CFO) attended the meetings by invitation. The members of the management team, the internal audit consultants and the external auditors were invited to participate at the meetings as and when required. P W Corporate Secretarial (Pvt) Ltd acted as Secretaries to the Audit Committee. The proceedings of the Audit Committee were reported to the Board of Directors on a regular basis.
Financial Reporting System The Committee reviewed the financial reporting system adopted by the Company with particular reference to the following • The preparation, presentation and adequacy of the disclosures in the Company’s annual
and interim financial statements in accordance with Sri Lanka Accounting Standards,
• The rationale and basis for the significant estimates and judgments underlying the financial statements
• The systems and procedures in place to ensure that that all transactions are accurately recorded in books of accounts
• The effectiveness in the financial reporting systems including the management accounts to ensure the reliability of information provided to the Board and other stakeholders of the Company.
Internal AuditThe Internal Audit function is outsourced to Messrs KPMG Ford Rhodes Thornton & Company and BDO Partners. The internal auditors are responsible to review and report on the efficacy of the internal control system and compliance with statutory and other regulations and the Company’s accounting and operational policies. During the year a risk rating matrix for identifying and assessment of the operational risks of branches and other business units was introduced. Internal audit reports are regularly tabled at Audit Committee meetings. Control weaknesses highlighted in the internal audit reports are critically examined by the Committee and follow up action taken by the management on the audit recommendations are also reviewed. Internal Audit representatives are present at Audit Committee meetings during the discussion of their respective reports.
External AuditDuring the year the Committee met with the Messrs Ernst & Young, External Auditors to discuss the Auditors’ management letter pertaining to the previous year’s audit and the Management’s response thereto. Follow up action was taken to ensure that the recommendations contained in the management letter were implemented by the management. Discussions were also held in regard to the nature, scope and approach of the audit for 2010/11 prior to commencement of the audit.
The Committee reviewed the non audit services provided by the auditors to ensure that the provision of these services do not impair their independence.
The Audit Committee has recommended to the Board of Directors that Messrs Ernst & Young be reappointed as Auditors for the financial year ending 31st March 2012, subject to the approval of the shareholders at the Annual General Meeting.
Conclusion Finally I would like to thank all the members who served on the Audit Committee during the year for their valuable contribution to the deliberations of the Committee.
L N de S Wijeyeratne Chairman Audit Committee

| L B Finance PLC | Annual Report 2010/1168
Statement of Directors ResponsibilitiesThe Directors are required by the Companies Act, No. 7 of 2007 to prepare financial statements for each financial year, which give a true and fair view of the statement of affairs of the Company as at the end of the financial year and the income and expenditure of the Company for the financial year.
The Directors are also responsible to ensure that the financial statements comply with any regulations made under the Companies Act which specifies the form and content of financial statements and any other requirements which apply to the Company’s financial statements under any other law.
The Directors consider that the financial statements presented in this Annual Report have been prepared using appropriate accounting policies, consistently applied and supported by reasonable and prudent judgments and estimates and in compliance with the Sri Lanka Accounting Standards, Companies Act, No. 7 of 2007, Sri Lanka Accounting and Auditing Standards Act No. 15 of 1995 and Finance Companies Act, No. 78 of 1988 and the Directions issued thereunder.
The Directors are responsible for ensuring that the Company keeps sufficient accounting records, which disclose the financial position of the Company with reasonable accuracy and enable them to ensure that the financial statements have been prepared and presented as aforesaid. They are also responsible for taking measures to safeguard the assets of the Company and in that context to have proper regard to the establishment of appropriate systems of internal control with a view to prevention and detection of fraud and other irregularities.
The Directors continue to adopt the going concern basis in preparing the financial statements. The Directors, after making inquiries and review of the Company’s Business Plan for the financial year 2011/2012, including cash flows and borrowing facilities, consider that the Company has adequate resources to continue in operation.
By Order of the BoardL B Finance PLC
P W Corporate Secretarial (Pvt) LtdSecretaries
6th June 2011

Annual Report 2010/11 | L B Finance PLC | 69
Auditor’s Report
INDEPENDENT AUDITORS’ REPORTTO THE SHAREHOLDERS OF L B FINANCE PLC
Report on the Financial StatementsWe have audited the accompanying financial statements of L B Finance PLC (“Company”), which comprise the balance sheet as at 31 March 2011, and the income statement, statement of changes in equity and cash flow statement for the year then ended, and a summary of significant accounting policies and other explanatory notes.
Management’s Responsibility for the Financial StatementsManagement is responsible for the preparation and fair presentation of these financial statements in accordance with Sri Lanka Accounting Standards. This responsibility includes: designing, implementing and maintaining internal control relevant to the preparation and fair presentation of financial statements that are free from material misstatement, whether due to fraud or error; selecting and applying appropriate accounting policies; and making accounting estimates that are reasonable in the circumstances.
Scope of Audit and Basis of OpinionOur responsibility is to express an opinion on these financial statements based on our audit. We conducted our audit in accordance with Sri Lanka Auditing Standards. Those standards require that we plan and perform the audit to obtain reasonable assurance whether the financial statements are free from material misstatement.
An audit includes examining, on a test basis, evidence supporting the amounts and disclosures in the financial statements. An audit also includes assessing the accounting policies used and significant estimates made by management, as well as evaluating the overall financial statement presentation.
We have obtained all the information and explanations which to the best of our knowledge and belief were necessary for the purposes of our audit. We therefore believe that our audit provides a reasonable basis for our opinion.
OpinionIn our opinion, so far as appears from our examination, the Company maintained proper accounting records for the year ended 31 March 2011 and the financial statements give a true and fair view of the Company’s state of affairs as at 31 March 2011 and its profit and cash flows for the year then ended in accordance with Sri Lanka Accounting Standards.
Report on Other Legal and Regulatory RequirementsIn our opinion, these financial statements also comply with the requirements of Section 151(2) of the Companies Act No. 07 of 2007.
6th June 2011Colombo

| L B Finance PLC | Annual Report 2010/1170
Balance SheetAs at 31st March 2011 Note 2011 2010 Rs. Rs.
ASSETSCash and amounts due from banks 347,445,557 277,083,322Treasury Bills & other bills eligible for re-discounting with Central Bank 3 1,622,157,957 1,165,157,110Placements with other banks 4 302,583,827 364,917,827Loans and Advances 5 1,876,253,903 1,057,836,149Gold Loans 6 5,666,977,116 3,135,978,651Lease rentals receivable & Stock out on hire 7 16,332,007,003 10,440,328,525Real Estate Stock 9 237,520,182 246,927,852Advance for Vehicle Stock 519,705,851 156,501,801Other Debtors, Deposits and Prepayments 10 510,215,800 104,271,087Investment Potfolio 11 28,593,629 5,994,009Trading Potfolio 11.1 211,818,144 -Intangible assets 12 9,681,837 7,332,847Property, Plant & Equipment 13 432,358,758 237,613,462Total Assets 28,097,319,566 17,199,942,642
LIABILITIESDeposits from non-bank customers 14 19,619,680,724 12,489,788,897Borrowings 15 3,526,373,819 1,065,377,056Accrued charges 17 1,529,034,565 916,728,612Debentures 18 450,000,000 450,000,000Retirement Benefit Liability 19 33,869,659 27,261,881Tax Liability 231,393,335 352,625,948Deferred Taxation 27 93,249,397 141,727,639Total Liabilities 25,483,601,500 15,443,510,033
SHAREHOLDERS’ FUNDSStated Capital 20 838,282,159 491,996,449Reserves 21 1,775,435,908 1,264,436,160Total Equity 2,613,718,067 1,756,432,609 28,097,319,566 17,199,942,642Commitments and Contingencies 30 1,367,202,862 136,857,328
These Financial Statements are in compliance with the requirements of the Companies Act No.07 of 2007 .
Chief Financial Officer
The Board of Directors is responsible for the preparation and presentation of the Financial Statements signed for and on behalf of the board by ;
Chairman Managing Director
The Accounting Policies and notes on pages 74 through 99 form an integral part of the Financial Statements.
Colombo,6th June 2011

Annual Report 2010/11 | L B Finance PLC | 71
Income StatementFor the year ended 31st March 2011 Note 2011 2010 Rs. Rs.
Income 22 5,501,885,318 4,130,993,392
Interest Income 23 5,138,718,469 3,953,032,428
Interest Expense 24 2,418,479,631 2,249,805,216
Net Interest Income 2,720,238,838 1,703,227,212
Other Operating Income 25 353,646,967 174,285,171
Less: Operating Expenses
Staff Costs 487,960,402 308,400,606
Provision for Staff Retirement Benefits 6,760,729 5,969,466
General & Administration Expenses 538,712,905 330,687,449
Provision for fall in value of Investments, Bad and Doubtful Loans and Write Offs 137,591,289 194,421,207
Profit from Operations 26 1,902,860,480 1,038,033,655
Value Added Tax on Financial Services 235,040,462 159,743,547
Profit before Taxation 1,667,820,018 878,290,108
Provision for Income Taxation 27 647,451,640 378,128,984
Profit for the year 1,020,368,379 500,161,124
Earnings Per Share 28 14.73 7.22
The Accounting Policies and notes on pages 74 through 99 form an integral part of the Financial Statements.
Colombo,6th June 2011
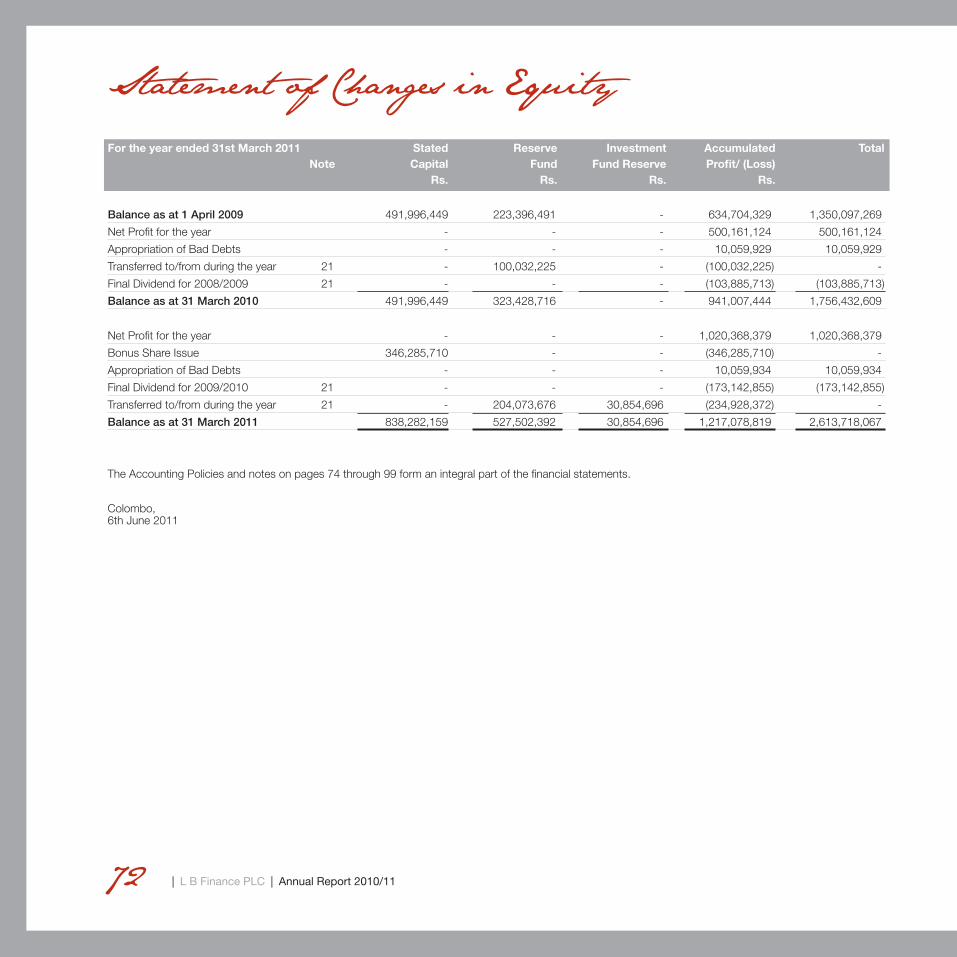
| L B Finance PLC | Annual Report 2010/1172
For the year ended 31st March 2011 Stated Reserve Investment Accumulated Total Note Capital Fund Fund Reserve Profit/ (Loss) Rs. Rs. Rs. Rs.
Balance as at 1 April 2009 491,996,449 223,396,491 - 634,704,329 1,350,097,269
Net Profit for the year - - - 500,161,124 500,161,124
Appropriation of Bad Debts - - - 10,059,929 10,059,929
Transferred to/from during the year 21 - 100,032,225 - (100,032,225) -
Final Dividend for 2008/2009 21 - - - (103,885,713) (103,885,713)
Balance as at 31 March 2010 491,996,449 323,428,716 - 941,007,444 1,756,432,609
Net Profit for the year - - - 1,020,368,379 1,020,368,379
Bonus Share Issue 346,285,710 - - (346,285,710) -
Appropriation of Bad Debts - - - 10,059,934 10,059,934
Final Dividend for 2009/2010 21 - - - (173,142,855) (173,142,855)
Transferred to/from during the year 21 - 204,073,676 30,854,696 (234,928,372) -
Balance as at 31 March 2011 838,282,159 527,502,392 30,854,696 1,217,078,819 2,613,718,067
The Accounting Policies and notes on pages 74 through 99 form an integral part of the financial statements.
Colombo,6th June 2011
Statement of Changes in Equity

Annual Report 2010/11 | L B Finance PLC | 73
For the year ended 31st March 2011 Note 2011 2010 Rs. Rs.
Cash Flows From / (Used in) Operating ActivitiesProfit before Tax 1,667,820,018 878,290,108
Adjustments forDepreciation 13 76,293,634 53,451,586Amortization of computer software 12 3,712,725 3,189,361Provision for doubtful debts 137,591,289 194,421,207Interest cost on Finance Lease 24 1,992,374 1,463,286Loss from Sale of Investments 25 (89,542,189) 192,162Loss/(Profit) from Sale of Property , Plant & Equipment 25 (42,381) (8,036)Provision/(reversal) for Defined Benefit Plans 19 6,760,729 5,969,466Dividend Received 25 (487,723) (249,816)Notional Tax Credit on Interest on Treasury Bills 23.1 (9,632,738) (13,107,912)Withholding Tax attributed to Fixed Deposit & professional fees (13,538,249) (13,692,701) 1,780,927,489 1,109,918,712
Profit from operation before Working Capital Changes(Increase)/ Decrease in Real Estate Stock 9,407,670 (21,006,854)(Increase)/ Decrease in Lease Rentals Receivable and Stock out on hire (6,001,211,786) (1,615,160,702)(Increase) /Decrease in Government of Sri Lanka Treasury Bills 348,300,340 (117,308,884)(Increase)/ Decrease in Loans and Advances (828,194,620) (111,064,316)(Increase)/ Decrease in Gold Loans (2,539,578,070) (1,249,887,152)(Increase) /Decrease in Other Debtors, Deposits, Prepayments (405,944,713) 37,348,078(Increase) /Decrease in Advance for Vehicle Stock (363,204,050) (114,562,831)(Increase)/ Decrease in Placements with Banks 62,334,000 185,578,596Increase/ (Decrease) in Deposits from Non Bank Customers 7,129,891,827 2,931,418,828Increase/ (Decrease) in Borrowings 1,976,780,291 (122,564,373)Increase/ (Decrease) in Accrued Charges 440,097,466 69,654,163Cash Generated from Operations 1,609,605,843 982,363,264
Retirement Benefit Liabilities Paid 19 (152,951) (272,600)Net Cash From/(Used in) Operating Activities before Income Tax Payments 1,609,452,892 982,090,664Taxes Paid (623,775,390) (129,321,866)Net Cash used in Operating Activities 985,677,502 852,768,798
Cash Flows from / (Used in) Investing ActivitiesAcquisition of Property, Plant & Equipment 13.1 (242,198,433) (101,145,402)Acquisition of Intangible Assets 12.1 (6,061,715) (1,210,911)Acquisition of Investments (368,782,663) -Proceeds from Sales of Other investments 224,265,508 862,801Proceeds from Sales of Property , Plant & Equipment 78,167 8,036Dividend Received 25 487,723 249,816Net Cash Flows from/(Used in) Investing Activities (392,211,413) (101,235,660)
Cash Flows from / (Used in) Financing ActivitiesPayment under Finance Lease Liabilities 15.3 (4,088,916) (3,041,281)Dividends Paid (173,142,855) (103,885,713)Net Cash Flows from/(Used in) Financing Activities (177,231,771) (106,926,994)Net Increase/(Decrease) in Cash and Cash Equivalents 416,234,318 644,606,144Cash and Cash Equivalents at the beginning of the year 479,603,138 (165,003,006)Cash and Cash Equivalents at the end of the year 16 895,837,456 479,603,138
The Accounting Policies and notes on pages 74 through 99 form an integral part of the Financial Statements.
Cash Flow Statement

| L B Finance PLC | Annual Report 2010/1174
1. CORPORATE INFORMATION1.1 General L B Finance PLC is a public limited liability company incorporated and domiciled in Sri Lanka. The registered office of the Company is located at 275/75 Prof. Stanley Wijesundera Mawatha, Colombo 7 and the principal place of business is situated at the same place.
1.2 Principal Activities and Nature of OperationsDuring the year, the principal activities of the Company were Acceptance of Deposits, Granting Lease facilities, Hire Purchase, Mortgage Loans, Gold Loans and other credit facilities, Real Estate Development and related services Factoring.
1.3 Parent Enterprise and Ultimate Parent EnterpriseThe immediate and ultimate holding company is Vallibel One Limited, which is incorporated in Sri Lanaka.
1.4 Date of Authorization for IssueThe Financial Statements of L.B. Finance PLC for the period ended 31 March 2011 was authorized for issue in accordance with a resolution of the board of directors on 6th June 2011.
2.1 BASIS OF PREPARATIONThese financial statements presented in Sri Lankan Rupees have been prepared on a historical cost basis and prepared in Sri Lanka Rupees except when otherwise stated.
The preparation and presentation of financial statements is in compliance with the Companies Act No.7 of 2007 and Finance Companies Act No.78 of 1988.
2.1.1 Statement of compliance The Financial Statements of L B Finance PLC has been prepared in accordance with Sri Lanka Accounting Standards.
These Financial Statements are presented in accordance with Sri Lanka Accounting Standard No. 33 Revenue Recognition and Disclosures in Financial Statements of Finance Companies.
2.1.2 Going ConcernThe Directors have made an assessment of the Company’s ability to continue as a going concern and they do not intend either to liquidate or to cease trading.
2.1.3 Comparative InformationThe accounting policies have been consistently applied by the Company and, are consistent with those used in the previous year.
2.2 SIGNIFICANT ACCOUNTING ESTIMATES AND ASSUMPTIONSIn the process of applying the Company’s Accounting Policies, management is required to make judgments, apart from those involving estimations, which may have a significant effect on the amounts recognized in the Financial Statements. Further, the management is required to consider, key assumptions concerning the future and other key sources of estimation of uncertainty at the Balance Sheet date that may have a significant risk of causing material adjustments to the carrying amounts of assets and liabilities. The respective carrying amounts of assets and liabilities are given in the related Notes to the Financial Statements. The key items which involve these judgments, estimates and assumptions are discussed below:
Impairment Losses on Leases Stock out on Hire and Loans and Advances In addition to the provisions made for possible loan losses based on the parameters and directives for specific provisions on Leases Stock out on Hire and Loans and Advances by the Central Bank of Sri Lanka, the Company reviews its Loans and Advances portfolio at each reporting date to assess whether a further allowance for impairment should be provided in the Income Statement. The judgments by the management is required in the estimation of these amounts and such estimations are based on assumptions about a number of factors and actual results may differ, resulting in future changes to the allowances.
Notes to the Financial Statements

Annual Report 2010/11 | L B Finance PLC | 75
Review of Impairment Losses on Non-Financial AssetsThe Company assesses whether there are any indicators of impairment for all non-financial assets at each reporting date or more frequently if events or changes in circumstances require doing so. This requires the estimation of the ‘value in use’ of the cash generating units. Estimating value in use requires management to make an estimate of the expected future cash flows from the cash generating units and also to select a suitable discount rate in order to calculate the present value of the relevant cash flows. This valuation requires the Company to make estimates about expected future cash flows and discount rates, and hence, they are subject to uncertainty.
Useful lives of Property, Plant & Equipment The Company reviews the assets’ residual values, useful lives and methods of depreciation at each reporting date. Judgment by the management is exercised in the estimation of these values, rates, methods, and hence they are subject to uncertainty. Estimates and AssumptionsThe key assumptions concerning the future and other key sources of estimation uncertainty at the balance sheet date , that have a significant risk of causing a material adjustments to the carrying amounts of assets and liabilities within the next financial year are discussed below. Value of Unquoted Equity Investments The unquoted equity investments have been accounted at cost and were valued by Directors by considering the recoverability of the investment.
Defined Benefit PlansThe Defined Benefit Obligation and the related charge for the year is determined using actuarial valuation. The actuarial valuation involves making assumptions about discount rates, future salary increase, mortality rates etc. Due to the long term nature of such obligation these estimates are subject to significant uncertainty. Further details are given in Note 19 to these financial statements.
Real Estate StocksReal Estates Stocks have been accounted at cost as disclosed under accounting policy 2.3.9 the Directors have evaluated the recoverability considering the current market prices of respective stocks.
2.3 SUMMARY OF SIGNIFICANT ACCOUNTING POLICIES 2.3.1 Taxationa) Current TaxesIncome tax assets and liabilities for the current and prior periods are measured at the amount expected to be recovered from or paid to the Commissioner General of Inland Revenue. The tax rates and tax laws used to compute the amount are those that are enacted or substantively enacted by the balance sheet date.
The provision for income tax is based on the elements of income and expenditure as reported in the financial statements and computed in accordance with the provisions of the Inland Revenue Act.

| L B Finance PLC | Annual Report 2010/1176
b) Deferred TaxationDeferred income tax is provided, using the liability method, on temporary differences at the balance sheet date between the tax bases of assets and liabilities and their carrying amounts for financial reporting purposes.
Deferred income tax liabilities are recognised for all taxable temporary differences except where the deferred income tax liability arises from the initial recognition of an asset or liability in a transaction that is not a business combination and, at the time of the transaction, affects neither the accounting profit nor taxable profit or loss.
Deferred income tax assets are recognised for all deductible temporary differences, carry-forward of unused tax assets and unused tax losses, to the extent that it is probable that taxable profit will be available against which the deductible temporary differences, and the carry-forward of unused tax assets and unused tax losses can be utilised except where the deferred income tax asset relating to the deductible temporary difference arises from the initial recognition of an asset or liability in a transaction that is not a business combination and, at the time of the transaction, affects neither the accounting profit nor taxable profit or loss; and
The carrying amount of deferred income tax assets is reviewed at each balance sheet date and reduced to the extent that it is no longer probable that sufficient taxable profit will be available to allow all or part of the deferred income tax asset to be utilised.
Deferred income tax assets and liabilities are measured at the tax rates that are expected to apply to the year when the asset is realised or the liability is settled, based on tax rates (and tax laws) that have been enacted or substantively enacted at the balance sheet date.
Deferred income tax relating to items recognised directly in equity is recognised in equity and not in the income statement.
2.3.2 Borrowing Costs Borrowing costs are recognised as an expense in the period in which they are incurred.
2.3.3 Intangible AssetsIntangible assets acquired separately are measured on initial recognition at cost. Following initial recognition, intangible assets are carried at cost less any accumulated amortisation and any accumulated impairment losses.
Intangible assets with finite lives are amortised over the useful economic life and assessed for impairment whenever there is an indication that the intangible asset may be impaired. The amortisation period and the amortisation method for an intangible asset with a finite useful life is reviewed at least at each financial year end. Changes in the expected useful life or the expected pattern of consumption of future economic benefits embodied in the asset is accounted for by changing the amortisation period or method, as appropriate, and treated as changes in accounting estimates. The amortisation expense on intangible assets with finite lives is recognised in the income statement in the expense category consistent with the function of the intangible asset.
Computer SoftwareComputer software is amortized over 5 years from the month of acquisition.
2.3.4 Loans and AdvancesLoans and advances to customers are stated net of provision for bad and doubtful loans and interest not accrued to revenue.
2.3.5 Lease Rentals Receivable & Stock Out on HireAssets leased to customers under agreements, which transfer substantially all the risks and rewards associated with ownership other than legal title, are classified as finance leases. Lease rentals receivable represents the total minimum lease payments due net of unearned income and allowance for doubtful recoveries.
Notes to the Financial Statements

Annual Report 2010/11 | L B Finance PLC | 77
Assets sold to customers under fixed rate hire agreements, which transfer all the risks and rewards as well as the legal title at the end of such contractual period are classified as stock out on hire. Such assets are accounted for in a similar manner as finance leases.
2.3.6 Operating LeaseAssets leased to customers under agreements by which all the risk and rewards incident to ownership of an asset remains with lessor, are classified as operating leases. Lease rentals receivable are recognized on a straight line basis over the term of the lease.
2.3.7 Provisions for Bad and Doubtful DebtsAmounts are set a side with regard to possible losses on loans, advances hire purchase, finance leases and operating leases in line with Finance Companies (Provision for Bad and Doubtful Debts) Direction No. 3 of 2006 issued by the Central Bank of Sri Lanka.
2.3.8 Real Estate StockReal estate stock comprises all costs of purchase, cost of conversion and other costs incurred in bringing the real estate to its saleable condition.
Purchase Cost - Land cost with legal charges.Cost of conversion - Actual Development costs
2.3.9 Cash and Cash EquivalentsCash and cash equivalents are defined as cash in hand, demand deposits and short-term highly liquid investments, readily convertible to known amounts of cash and subject to insignificant risk of changes in value.
For the purpose of cash flow statement, cash and cash equivalents consist of cash in hand and deposits in banks net of outstanding bank overdrafts. Investments with short maturities i.e. three months or less from the date of acquisition are also treated as cash equivalents.
2.3.10 Property, Plant and EquipmentPlant and equipment is stated at cost, excluding the costs of day to day servicing, less accumulated depreciation and accumulated impairment in value. Such cost includes the cost of replacing part of the plant and equipment when that cost is incurred, if the recognition criteria are met.
Depreciation is calculated on a straight line basis over the useful life of the assets as follows.
Furniture & Fittings 15% p.a.Equipment 20% p.a.Motor Vehicles 25% p.a.Computer Hardware 20% p.a.Air Conditioning 20% p.a.Telephone System 20% p.a.Fire Protection Equipment 20% p.a.Fixtures & Fittings 33.33% p.a.
2.3.11 Leasesa) Finance Leases – where the Company is the LesseeProperty, plant and equipment on finance leases, which effectively transfer, to the Company substantially all of the risk and benefits incidental to ownership of the leased item are capitalized at the inception of the lease at the fair value of the leased property or, if lower, at the present value of the minimum lease payments. Lease payments are apportioned between the finance charges and reduction of the lease liability so as to achieve a constant rate of interest on the remaining balance of the liability. Finance charges are charged reflected in the income statement.

| L B Finance PLC | Annual Report 2010/1178
Capitalised leased assets are depreciated over the shorter of the estimated useful life of the asset and the lease term, if there is no reasonable certainty that the Company will obtain ownership by the end of the lease term. The depreciation policy for depreciable leased assets is consistent with that for depreciable asset that are owned as described in 2.4.11.
The cost of improvements to or on leasehold property is capitalized, disclosed as leasehold improvements, and depreciated over the unexpired period of the lease or the estimated useful lives of the improvements, whichever is shorter.
Operating lease payments are recognised as an expense in the income statement on a straight line basis over the lease term.
2.3.12 Investmentsa) Current Investments - Government Securities Current investments include Government of Sri Lanka Treasury Bills which are stated at cost plus a portion of discount or premium.
The cost of an investment is the cost of acquisition inclusive of brokerages, fees, duties and bank fees.
b) Current Investments - Trading Securities Current investments are carried at market value.
Unrealized gains and losses on current investments carried at market value are recognised as income or expense.
c) Long Term Investments - Investment SecuritiesLong term investments are stated at cost
The cost of the investment is the cost of acquisition inclusive of brokerage fees, duties and bank fees.
The carrying amount of long-term investments is reduced to recognise a decline other than temporary in the value of investments, determined on an individual investment basis.
Disposal of InvestmentOn disposal of an investment, the difference between net disposals and proceeds and the carrying amounts is recognised as income or expense. 2.3.13 Retirement Benefit Obligationsa) Defined Benefit Plan - Gratuity The Company measures the present value of the promised retirement benefits for gratuity, which is a defined benefit plan with the advice of an independent professional actuary using the Projected Unit credit Method (PUC) as required by Sri Lanka Accounting Standards No.16, Employee Benefit (Revised 2006). The item stated under Retirement Benefit Liability in the Balance Sheet.
Recognition of Actuarial Gains and LossesActuarial gains & losses are recognized as income or expenses when the net cumulative unrecognized actuarial gains & losses at the end of the previous reporting period exceeded 10% of the higher of the defined benefit obligation and the fair value of plan assets at the date.
The gains/losses are recognized over the expected average remaining working lives of the employees participating in the plan.
Recognition of Past Service Cost (Applicable only when a plan has been changed)Past Service Cost are recognized as an expense on a straight line basis over the average period until the benefits become vested. If the benefits have already been vested, immediately following the instruction of, or changes to the plan, past service costs are recognized immediately.
Notes to the Financial Statements

Annual Report 2010/11 | L B Finance PLC | 79
Funding ArrangementThe Gratuity liability is not externally funded.
b) Defined Contribution Plans - Employees’ Provident Fund & Employees’ Trust FundEmployees are eligible for Employees’ Provident Fund Contributions and Employees’ Trust Fund Contributions in line with respective Statutes and Regulations. The Company contributes 15% and 3% of gross emoluments of employees to Employees’ Provident Fund and Employees’ Trust Fund respectively.
2.3.14 ProvisionsProvisions are recognized when the company has a present obligation (legal or constructive) as a result of a past event, where it is probable that an outflow of resources embodying economic benefits will be required to settle the obligation and a reliable estimate can be made of the amount of the obligation. If the effect of the time value of money is material, provisions are determined by discounting the expected future cash flows at a pre-tax rate that reflects current market assessments of the time value of money and, where appropriate, the risks specific to the liability. Where discounting is used, the increase in the provision due to the passage of time is recognized as an interest expense.
2.3.15 Revenue RecognitionRevenue is recognised to the extent that it is probable that the economic benefits will flow to the Company and the revenue and associated costs incurred or to be incurred can be reliably measured. Revenue is measured at the fair value of the consideration received or receivable net of trade discounts and sales taxes. The following specific criteria are used for the purpose of recognition of revenue.
a) Income from leasing activities and hire purchase agreementsIncome from Finance leases is recognised on the basis of the financing method. The excess of aggregate rental receivable over the cost of the leased assets constitute the total unearned income at the commencement of the contract. The earned income is taken into revenue over the term of the lease, commencing from the month in which the lease is executed, in proportion to the declining receivable balance of the lease.Income from operating leases is recognised on a straight line basis over the term of the lease.
Income arising from the residual interest in hire purchase agreements is credited to the profit and loss account as it accrues in proportion to the declining receivable balance of the agreement.
However, accrual of income both from leases and hire purchase agreements ceases when the account is overdue for more than six months in compliance with Direction No. 15 of 1991 (Accrued Interest) and thereafter recognised on a cash basis.
b) Interest Income from Loans and AdvancesInterest income from loans and advances is recognised on an accrual basis. However, income from loans and advances ceases when the account is overdue for more than six months in compliance with Direction No. 15 of 1991 (Accrued Interest) and thereafter recognised on a cash basis.
c) Interest income from other sourcesInterest income from Government of Sri Lanka Treasury Bills is recognised on a time proportion basis, and discounts on purchase are amortised to income on a straight line basis over periods to maturity.
Income from all other interest bearing investments is recognised as revenue on an accrual basis.
d) Dividend IncomeDividend income is recognised on a cash received basis.
e) Insurance agency feesAgency Fees received in respect of insurance is recognized on accrued basis.

| L B Finance PLC | Annual Report 2010/1180
f) Overdue InterestsOverdue interest income from leasing and other loans have been accounted for on a cash received basis.
g) Real Estate SalesRevenue is recognised when properties are sold and the buyer has taken possession of such properties. However, when there is insufficient assurance as to the receipt of the total consideration, income is accounted for on a cash received basis.
h) OthersOther income is recognised on an accrual basis
Net Gains and losses of a revenue nature on the disposal of property, plant & equipment and other non current assets including investments have been accounted for in the income statement, having deducted from proceeds on disposal, the carrying amount of the assets and related selling expenses.
2.3.16 Expenditure RecognitionExpenses are recognised in the income statement on the basis of a direct association between the cost incurred and the earning of specific items of income. All expenditure incurred in the running of the business and in maintaining the property, plant & equipment in a state of efficiency has been charged to income in arriving at the profit for the year.
2.4 Effect of Sri Lanka Accounting Standard issued but not yet effective: a) The following standards have been issued by the Institute of Chartered Accountants of Sri Lanka. - Sri Lanka Accounting Standard 44 Financial Instruments; Presentation (SLAS 44) - Sri Lanka Accounting Standard 45 Financial Instruments; Recognition and Measurement (SLAS 45) - Sri Lanka Accounting Standard 39 Share Based Payments (SLAS 39)
The effective date of SLAS 44, 45 and 39 was changed during the year to be effective for financial periods beginning on or after 01 January 2012. These three standards have been amended and forms a part of the new set of financial reporting standards mentioned under note (b) below.
b) Following the convergence of Sri Lanka Accounting Standards with the International Financial Reporting. Standards, the Council of the Institute of Chartered Accountants of Sri Lanka has adopted a new set of financial reporting standards that would apply for financial periods beginning on or after 01 January 2012. The application of these financial reporting standards is substantially different to the prevailing standards.
Notes to the Financial Statements

Annual Report 2010/11 | L B Finance PLC | 81
As at 31st March 2011 2011 2010 Rs. Rs.
3. TREASURY BILLS & OTHER BILLS ELIGIBLE FOR RE-DISCOUNTING WITH CENTRAL BANKGovernment of Sri Lanka Treasury Bills - Face Value 152,842,298 390,796,998Less : Income allocated for future periods (1,874,306) (13,316,344)Re-Purchase Agreements 1,471,189,965 787,676,456 1,622,157,957 1,165,157,110
4. PLACEMENTS WITH OTHER BANKSFixed Deposits 302,583,827 364,917,827 302,583,827 364,917,827
5. LOANS AND ADVANCESReal Estate Loans 6,345,247 10,014,681Term Loans 739,199,381 698,315,008Trade Finance 28,780,422 9,716,503Quick Loan 525,000 -Factoring Receivable 115,217,728 -Power Drafts 27,544,834 -Vehicle Loans 1,006,569,945 395,222,026 1,924,182,557 1,113,268,218
Less : Provision for Bad debts - Charged against Profit & Loss Account 15,270,060 4,062,357 - Appropriations 8,228,088 18,288,022 23,498,148 22,350,379Finance charges in suspense 24,430,506 33,081,690 1,876,253,903 1,057,836,149
5.1 Term Loans include loans granted to Company Officers, the movement of which is as follows:As at the beginning of the year 3,019,248 4,304,894Add : Loans granted during the year 6,557,242 5,129,795Less : Repayments during the year (6,652,698) (6,415,441)As at the end of the year 2,923,791 3,019,248

| L B Finance PLC | Annual Report 2010/1182
As at 31st March 2011 2011 2010 Rs. Rs.
6. GOLD LOANSGold Loan Capital 5,413,773,876 2,982,317,321Gold Loan Interest Receivable 302,910,972 155,565,064 5,716,684,848 3,137,882,385Provision for Bad Debts 8,579,606 -Finance Charges in suspense 41,128,126 1,903,734 5,666,977,116 3,135,978,651
7. LEASE RENTALS RECEIVABLE AND STOCK OUT ON HIRE
Within one year 1 - 5 years Over 5 years Total
2011 2010 2011 2010 2011 2010 2011 2010
Rs. Rs. Rs. Rs. Rs. Rs. Rs. Rs.
Gross Investment
- Lease Rentals 5,688,308,999 3,420,335,883 7,810,265,744 3,962,633,219 5,097,136 182,567 13,503,671,879 7,383,151,669
- Amounts receivable from hirers 3,958,112,478 3,390,936,626 4,879,467,974 3,870,265,681 24,947,099 16,089,413 8,862,527,551 7,277,291,720
9,646,421,477 6,811,272,509 12,689,733,718 7,832,898,900 30,044,235 16,271,980 22,366,199,430 14,660,443,389
Less: Unearned Income 2,984,680,849 2,148,044,191 2,372,195,307 1,529,900,783 2,238,480 1,051,010 5,359,114,636 3,678,995,984
Net Investment 6,661,740,628 4,663,228,318 10,317,538,411 6,302,998,117 27,805,755 15,220,970 17,007,084,794 10,981,447,405
Less : Provision for bad & doubtful debts
- Charged against Profit & Loss Account 527,712,403 420,285,783
- Appropriations 1,831,384 1,831,835
529,543,787 422,117,618
Rentals received in advance 20,986,896 21,246,706
Finance charges in suspense 124,547,108 97,754,556
16,332,007,003 10,440,328,525
7.1 Lease & Hire Purchase receivable granted to Company Officers, the movement of which is as follows:
As at the beginning of the year 73,588,454 76,685,327
Add : granted during the year 74,644,523 36,162,407
Less : Repayments during the year (41,484,365) (39,259,280)
As at the end of the year 106,748,612 73,588,454
Notes to the Financial Statements
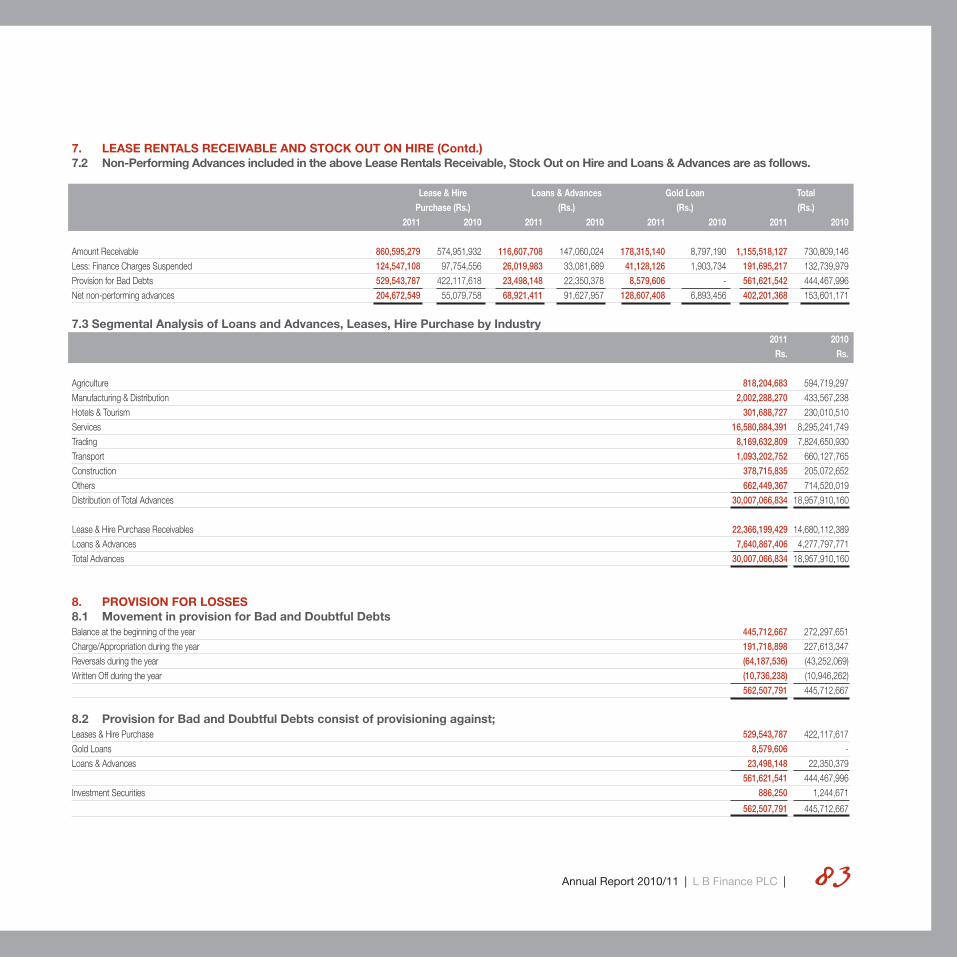
Annual Report 2010/11 | L B Finance PLC | 83
7. LEASE RENTALS RECEIVABLE AND STOCK OUT ON HIRE (Contd.) 7.2 Non-Performing Advances included in the above Lease Rentals Receivable, Stock Out on Hire and Loans & Advances are as follows.
Lease & Hire Loans & Advances Gold Loan Total Purchase (Rs.) (Rs.) (Rs.) (Rs.) 2011 2010 2011 2010 2011 2010 2011 2010
Amount Receivable 860,595,279 574,951,932 116,607,708 147,060,024 178,315,140 8,797,190 1,155,518,127 730,809,146Less: Finance Charges Suspended 124,547,108 97,754,556 26,019,983 33,081,689 41,128,126 1,903,734 191,695,217 132,739,979Provision for Bad Debts 529,543,787 422,117,618 23,498,148 22,350,378 8,579,606 - 561,621,542 444,467,996Net non-performing advances 204,672,549 55,079,758 68,921,411 91,627,957 128,607,408 6,893,456 402,201,368 153,601,171
7.3 Segmental Analysis of Loans and Advances, Leases, Hire Purchase by Industry 2011 2010 Rs. Rs.
Agriculture 818,204,683 594,719,297Manufacturing & Distribution 2,002,288,270 433,567,238Hotels & Tourism 301,688,727 230,010,510Services 16,580,884,391 8,295,241,749Trading 8,169,632,809 7,824,650,930Transport 1,093,202,752 660,127,765Construction 378,715,835 205,072,652Others 662,449,367 714,520,019Distribution of Total Advances 30,007,066,834 18,957,910,160
Lease & Hire Purchase Receivables 22,366,199,429 14,680,112,389Loans & Advances 7,640,867,406 4,277,797,771Total Advances 30,007,066,834 18,957,910,160
8. PROVISION FOR LOSSES8.1 Movement in provision for Bad and Doubtful DebtsBalance at the beginning of the year 445,712,667 272,297,651Charge/Appropriation during the year 191,718,898 227,613,347Reversals during the year (64,187,536) (43,252,069)Written Off during the year (10,736,238) (10,946,262) 562,507,791 445,712,667
8.2 Provision for Bad and Doubtful Debts consist of provisioning against;Leases & Hire Purchase 529,543,787 422,117,617Gold Loans 8,579,606 -Loans & Advances 23,498,148 22,350,379 561,621,541 444,467,996Investment Securities 886,250 1,244,671
562,507,791 445,712,667

| L B Finance PLC | Annual Report 2010/1184
As at 31st March 2011 2011 2010 Rs. Rs.
9. REAL ESTATE STOCKSReal Estate Stocks 210,336,921 218,376,950Lands Transferred from Mortgaged Loans 27,183,261 28,550,902 237,520,182 246,927,852
10. OTHER DEBTORS, DEPOSITS & PREPAYMENTSSundry Debtors 406,414,226 30,313,445Deposits & Prepayments 103,801,574 73,957,642 510,215,800 104,271,087
11. INVESTMENT SECURITIESQuoted Shares 11 (a) 3,159,909 5,689,309Unquoted Shares 11 (b) 25,433,720 304,700 28,593,629 5,994,009
11(a) INVESTMENT IN SHARESINVESTMENT PORTFOLIO Number of Cost Market Value Number of Cost Market Value Shares as at as at Shares as at as at 2011 2011 2011 2010 2010 2010 Rs. Rs. Rs. Rs.
Bank Finance and InsuranceCommercial Bank Of Cey. PLC 40 5 10,632 27 5 5,447Merchant Bank PLC 61 6,027 2,818 61 6,027 1,144Seylan Bank PLC 2,500 155,396 188,000 2,500 155,396 117,500Seylan Bank PLC (Non Voting Shares) - - - 90,700 1,685,000 2,358,200Union Bank of Colombo PLC 7,900 280,880 282,820 - - - 442,308 484,270 1,846,428 2,482,291
Beverages, Food and TobaccoKeells Food Products PLC 500 21,420 75,000 549 21,420 34,500Lanka Milk Foods PLC 5,500 249,732 642,950 5,500 249,732 452,375Soy Foods (F&W) LTD 22 880 8,914 22 880 3,179Bairaha Farms PLC - - - 17,600 424,979 598,40 272,032 726,864 697,011 1,088,454
Hotels and TravelsAitken Spence Hotel Holdings PLC 308 5,672 30,184 44 5,672 16,940Hotel Sigiriya PLC 700 30,333 53,270 700 30,333 36,575Riverina Hotels PLC 72 3,467 9,266 72 3,467 6,264Fortress Resort - - - 2,500 26,048 48,125 39,472 92,720 65,520 107,904
Notes to the Financial Statements

Annual Report 2010/11 | L B Finance PLC | 85
Number of Cost Market Value Number of Cost Market Value Shares as at as at Shares as at as at 2011 2011 2011 2010 2010 2010 Rs. Rs. Rs. Rs.
11(a) INVESTMENT IN SHARESManufacturingBlue Diamond Jewellery PLC 74 848 222 74 848 59Central Industries PLC 4,092 149,805 393,241 1,364 149,805 300,080Ceylon Grain Elevators PLC 44 5,214 7,396 344 40,766 5,848Dankotuwa Porcelain PLC 14,450 867,938 865,555 14,450 867,938 151,725Royal Ceramics PLC 31,320 843,225 4,917,240 15,660 843,225 1,769,580Samson International PLC 5,363 929,800 536,300 5,363 929,800 465,240Lanka Walltiles PLC - - - 16,450 789,882 1,233,750 2,796,830 6,719,955 3,622,264 3,926,282Stores and SuppliesHunter Ltd 10 2,767 14,900 10 2,767 6,000 2,767 14,900 2,767 6,000TradingHayleys PLC - - - 1,222 207,240 274,950 - - 207,240 274,950Provisions for reduction in share value other than temporary (393,501) - (751,921) - 3,159,909 8,038,709 5,689,309 7,885,881
Number of Cost Directors Number of Cost Directors Shares as at Valuation Shares as at Valuation as at as at 2011 2011 2011 2010 2010 2010 Rs. Rs. Rs. Rs.
11(b) INVESTMENTS IN UNQUOTED SHARESSamual Sons & Company Ltd 16,000 492,750 - 16,000 492,750 -Credit Information Bureau 1,047 104,700 104,700 1,047 104,700 104,700Finance House Association 20,000 200,000 200,000 20,000 200,000 200,000Free Lanka Capital Holdings (Pvt) LTD 5,320,000 25,129,020 25,129,020 - - - 25,926,470 25,433,720 797,450 304,700Less: Fall in Value of Investment (492,750) - (492,750) -Net Investment in Unquoted shares 25,433,720 25,433,720 304,700 304,700
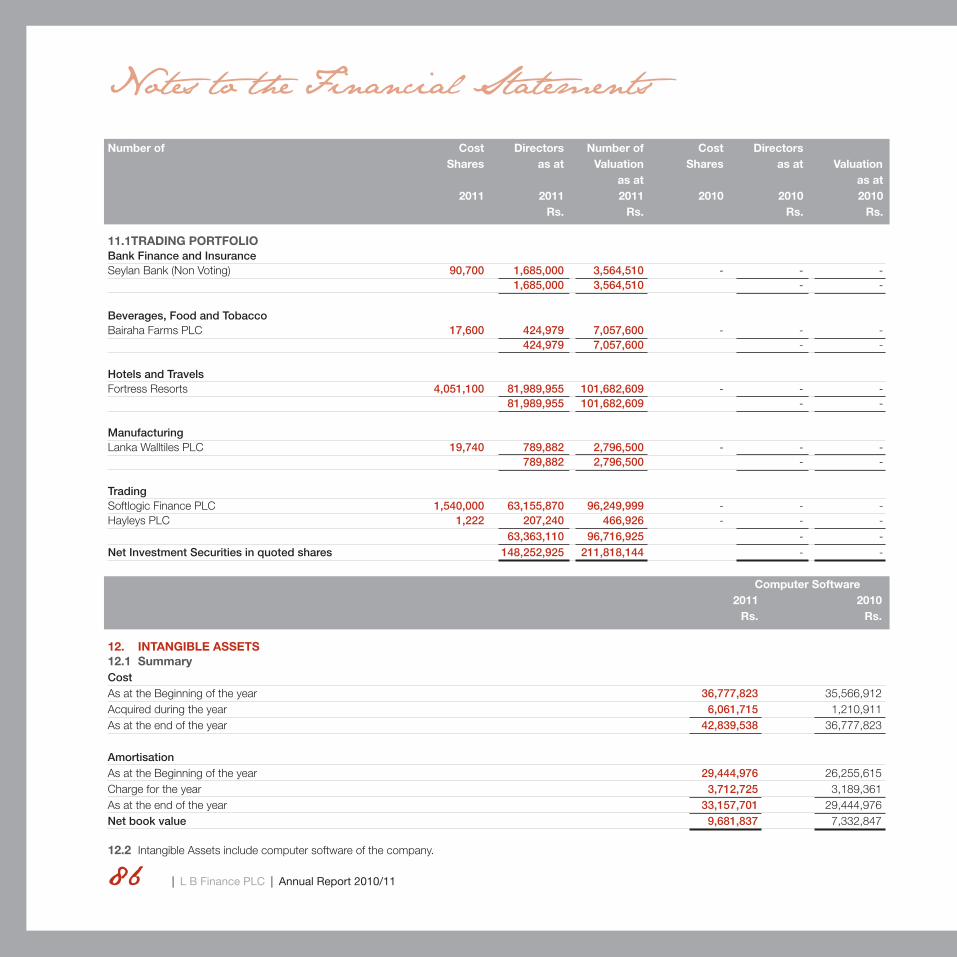
| L B Finance PLC | Annual Report 2010/1186
Number of Cost Directors Number of Cost Directors Shares as at Valuation Shares as at Valuation as at as at 2011 2011 2011 2010 2010 2010 Rs. Rs. Rs. Rs. 11.1TRADING PORTFOLIOBank Finance and InsuranceSeylan Bank (Non Voting) 90,700 1,685,000 3,564,510 - - - 1,685,000 3,564,510 - - Beverages, Food and TobaccoBairaha Farms PLC 17,600 424,979 7,057,600 - - - 424,979 7,057,600 - -
Hotels and TravelsFortress Resorts 4,051,100 81,989,955 101,682,609 - - - 81,989,955 101,682,609 - -
ManufacturingLanka Walltiles PLC 19,740 789,882 2,796,500 - - - 789,882 2,796,500 - -
TradingSoftlogic Finance PLC 1,540,000 63,155,870 96,249,999 - - -Hayleys PLC 1,222 207,240 466,926 - - - 63,363,110 96,716,925 - -Net Investment Securities in quoted shares 148,252,925 211,818,144 - -
Computer Software 2011 2010 Rs. Rs.
12. INTANGIBLE ASSETS12.1 SummaryCostAs at the Beginning of the year 36,777,823 35,566,912Acquired during the year 6,061,715 1,210,911As at the end of the year 42,839,538 36,777,823
AmortisationAs at the Beginning of the year 29,444,976 26,255,615Charge for the year 3,712,725 3,189,361As at the end of the year 33,157,701 29,444,976Net book value 9,681,837 7,332,847
12.2 Intangible Assets include computer software of the company.
Notes to the Financial Statements
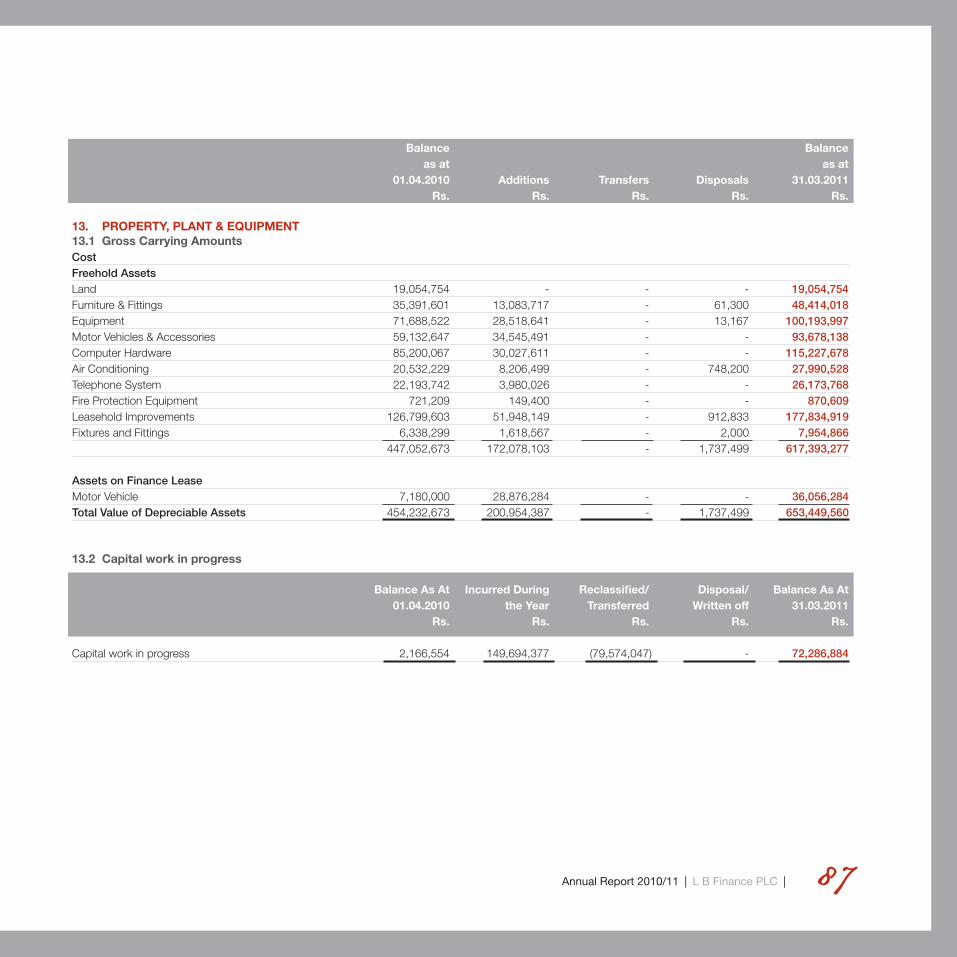
Annual Report 2010/11 | L B Finance PLC | 87
Balance Balance as at as at 01.04.2010 Additions Transfers Disposals 31.03.2011 Rs. Rs. Rs. Rs. Rs.
13. PROPERTY, PLANT & EQUIPMENT13.1 Gross Carrying AmountsCostFreehold AssetsLand 19,054,754 - - - 19,054,754Furniture & Fittings 35,391,601 13,083,717 - 61,300 48,414,018Equipment 71,688,522 28,518,641 - 13,167 100,193,997Motor Vehicles & Accessories 59,132,647 34,545,491 - - 93,678,138Computer Hardware 85,200,067 30,027,611 - - 115,227,678Air Conditioning 20,532,229 8,206,499 - 748,200 27,990,528Telephone System 22,193,742 3,980,026 - - 26,173,768Fire Protection Equipment 721,209 149,400 - - 870,609Leasehold Improvements 126,799,603 51,948,149 - 912,833 177,834,919Fixtures and Fittings 6,338,299 1,618,567 - 2,000 7,954,866 447,052,673 172,078,103 - 1,737,499 617,393,277
Assets on Finance LeaseMotor Vehicle 7,180,000 28,876,284 - - 36,056,284Total Value of Depreciable Assets 454,232,673 200,954,387 - 1,737,499 653,449,560
13.2 Capital work in progress
Balance As At Incurred During Reclassified/ Disposal/ Balance As At 01.04.2010 the Year Transferred Written off 31.03.2011 Rs. Rs. Rs. Rs. Rs.
Capital work in progress 2,166,554 149,694,377 (79,574,047) - 72,286,884

| L B Finance PLC | Annual Report 2010/1188
Balance Charge Balance as at for the as at 01.04.2010 Period Transfers Disposals 31.03.2011 Rs. Rs. Rs. Rs. Rs.
13.3 DepreciationFreehold Assets Furniture & Fittings 15,121,950 5,368,758 - 61,300 20,429,408Equipment 34,418,844 13,093,135 - 13,167 47,498,813Motor Vehicles & Accessories 44,964,937 10,690,923 - - 55,655,860Computer Hardware 50,007,073 14,426,348 - - 64,433,421Air Conditioning 12,313,533 3,374,070 - 712,413 14,975,190Telephone System 7,805,959 5,639,432 - - 13,445,391Fire Protection Equipment 437,096 179,704 - - 616,800Leasehold Improvements 45,600,476 19,206,843 - 912,833 63,894,486Fixtures and Fittings 5,005,063 951,792 - 2,000 5,954,855 215,674,931 72,931,005 - 1,701,713 286,904,223
Assets on Finance LeaseMotor Vehicle 3,110,834 3,362,629 - - 6,473,463 218,785,765 76,293,634 - 1,701,713 293,377,687
Net Book Value At Cost 231,377,742 330,489,053On Finance Leases 4,069,166 29,582,820Capital work in progress 2,166,554 72,286,884 237,613,462 432,358,758
13.4 During the financial year, the Company acquired Property, Plant & Equipment to the aggregate value of Rs.271,074,717 (2010 - Rs.101,145,400) . Cash payments amounting to Rs.242,198,433 ( 2010 - Rs.101,145,400) was paid during the year for purchases of Property , Plant & Equipment .
13.5 There aren’t any temporarily idling assets as at 31st March 2011.
13.6 Property, Plant & Equipment includes fully depreciated assets having a gross carrying amount of Rs.143,788,433. (2010 - Rs.126,668,932)
2011 2010 Rs. Rs.
14. DEPOSITS FROM NON BANK CUSTOMERSFixed Deposits 19,286,476,186 12,254,915,013Certificates of Deposit (14.1) 333,204,538 234,873,884 19,619,680,724 12,489,788,897
Notes to the Financial Statements

Annual Report 2010/11 | L B Finance PLC | 89
2011 2010 Rs. Rs.
14.1 Certificates of DepositCertificates of Deposit - Face Value 353,200,000 247,900,000Less : Interest allocated for future periods (19,995,462) (13,026,116) 333,204,538 234,873,884
15. BORROWINGSBank Loans (15.1) 2,772,869,189 796,931,004Bank Overdrafts 722,798,066 263,368,962Finance Lease (15.3) 30,706,564 5,077,090 3,526,373,819 1,065,377,056
As at Loans Repayments As at Terms of Security 01.04.2010 Obtained 31.03.2011 the Loan Offered Rs. Rs. Rs. Rs.
15.1 Bank LoansSeylan Bank 5,106,595 - 1,972,509 3,134,086 48 months VehicleCentral Bank Loan 44,200 - 44,200 - 63 monthsBank of Ceylon 100M 18,750,000 - 18,750,000 - 48 months Book Debts/sharesBank of Ceylon 100M 25,000,000 - 25,000,000 - 48 months Book Debts/sharesBank of Ceylon 150M 41,666,667 - 41,666,667 - 36 months Book Debts/sharesDeutsche Bank Securitization 201.5 M 3,600,000 - 3,600,000 - 48 months Book DebtsDeutsche Bank Securitization 150 M 3,800,000 - 3,800,000 - 47 months Book DebtsDeutsche Bank Securitization 158 M 55,900,000 - 42,700,000 13,200,000 48 months Book DebtsDeutsche Bank Securitization 50 M 32,000,000 - 20,000,000 12,000,000 37 months Book DebtsDeutsche Bank Securitization 49.99 M 22,221,237 - 16,666,668 5,554,569 36 months Book DebtsDeutsche Bank Securitization 216 M 185,200,000 - 74,700,000 110,500,000 48 months Book DebtsDeutsche Bank Securitization 199.78 M - 199,789,390 98,068,674 101,720,716 9 months Book DebtsDeutsche Bank Securitization 408 M - 408,000,000 146,417,808 261,582,191 6 months Book DebtsDeutsche Bank Securitization 450 M - 450,000,000 123,000,000 327,000,000 48 months Book DebtsDeutsche Bank Securitization 804 M - 804,167,626 198,590,000 605,577,626 46 months Book DebtsDeutsche Bank Securitization 903.8 M - 903,800,000 56,400,000 847,400,000 48 months Book DebtsDeutsche Bank Securitization 400 M 392,400,000 - 129,700,000 262,700,000 48 months Book DebtsPublic Bank - 10M 8,266,401 - 8,266,401 - 48 months VehiclePublic Bank - 3.6M 2,975,904 - 2,975,904 - 48 months VehiclePABC Short Term Loan - 900,000,000 900,000,000 - 01 month Book DebtsCeylon Income Fund - 22,500,000 - 22,500,000 48 months Promissory NotesCey Lease - 200,000,000 200,000,000 -NDB - 400,000,000 200,000,000 200,000,000 01 month Book Debts 796,931,004 4,288,257,016 2,312,318,830 2,772,869,189
15.2 The Company has unutilized borrowing facilities of Rs. 673,572,298/- as at 31st March 2011. (2010 Rs. 55,890,812)

| L B Finance PLC | Annual Report 2010/1190
As at New Leases Repayments As at 01.04.2010 Obtained 31.03.2011 Rs. Rs. Rs. Rs.
15.3 Finance LeasesFinance Leases 5,077,090 29,718,390 4,088,916 30,706,564 5,077,090 29,718,390 4,088,916 30,706,564
Gross Liability 6,729,396 37,558,902Finance Charges allocated for future periods (1,501,813) (6,701,845)Down payment (150,493) (150,493)Net Liability 5,077,090 30,706,564
16. CASH AND CASH EQUIVALENTS IN THE CASH FLOW STATEMENTCash & Bank Balances 347,445,557 277,083,322Re-Purchase Agreements ( less than 3 months) 1,271,189,966 465,888,778Bank Overdrafts (722,798,066) (263,368,962)Total Cash and Cash Equivalents for the Purpose of Cash Flow Statements 895,837,456 479,603,138
2011 2010 Rs. Rs.
17. ACCRUED CHARGESAccrued Interest 941,879,276 607,352,880Accrued Expenses 571,778,456 294,695,794Less: Advances received against Real Estate Stocks 15,376,833 14,679,938 1,529,034,565 916,728,612
18. DEBENTURESUnsecured Debentures 450,000,000 450,000,000
The Rs.450,000,000 Unsecured Redeemable Subordinated listed Debentures were issued at following rates and will mature on 20 th September 2013.
Notes to the Financial Statements

Annual Report 2010/11 | L B Finance PLC | 91
Catergory Interest payable Amount (Rs. ) Interest rate
Type ‘ A ‘ Monthly 149,480,000 21% p.aType ‘ B ‘ Annually 296,570,000 24% p.aType ‘ C ‘ Variable quarterly 2,500,000 Simple Average of the weighted average three months gross Treasury Bill rate published by the Central Bank of Sri Lanka at the primary auctions during the month immediately preceding the end of the Quarter plus 3.5% p.aType ‘ D ‘ Variable anually 1,450,000 Simple Average of the weighted average one year gross Treasury Bill rate published by the Central Bank of Sri Lanka at the primary auctions during the month immediately preceding the end of the Quarter plus 3.5% p.a
2011 2010 Rs. Rs.
19. RETIREMENT BENEFIT LIABILITYRetirement Benefit Obligations - GratuityBalance at the beginning of the year 27,261,881 21,565,015Amount Charged/(Reversed) for the year (19.1) 6,760,729 5,969,466Payments made during the year (152,951) (272,600)Balance at the end of the year 33,869,659 27,261,881
An actuarial valuation of the gratuity was carried out as at 31st March 2011 by Piyal S Goonetilleke and Associates, a firm of professional actuaries. The valuation method used by the actuary to value the Fund is the “Projected Unit Credit Method”, recommended by SLAS No.16.
19.1 Expenses on Defined Benefit PlanCurrent Service Cost for the year 3,577,269 3,222,765Interest cost for the year 3,183,460 2,746,701 6,760,729 5,969,466

| L B Finance PLC | Annual Report 2010/1192
2011 2010
19.2 Actuarial assumptionsDiscount Rate 11% 11%Salary scale 10% 10%Staff Turnover20 years25 years30 years 35 years 25% 25%40 years45 years 1% 1%50 years 1% 1%Mortality - GA 1983 Mortality TableRetirement age - Normal retirement Age, or age on valuation date, if greater.
2011 2010 Number Rs. Number Rs.
20. STATED CAPITAL20.1 Fully paid ordinary shares 69,257,142 838,282,159 34,628,571 491,996,449
20.2 Rights of ShareholdersThe holders of ordinary shares confer their right to receive dividends as declared from time to time and are entitled to one vote per share at the meeting.
All shares rank equally with regard to the Company’s residual assets. Reserve Investment Retained Total Fund Fund Reserve Profits Rs. Rs. Rs. Rs.
21. RESERVESAt the beginning of the year 323,428,716 - 941,007,444 1,264,436,160Profit for the year - - 1,020,368,379 1,020,368,379 323,428,716 - 1,961,375,823 2,284,804,539Appropriation of Bad debts - - 10,059,934 10,059,934Final Dividend ( 2009/10) - - (173,142,855) (173,142,855)Bonus Share Issue - - (346,285,710) (346,285,710)Transfers to/(from) during the year 204,073,676 30,854,696 (234,928,372) -At the end of the year 527,502,392 30,854,696 1,217,078,819 1,775,435,908
Reserve Fund is a capital reserve which contains profits transferred as required by Section 3(b)(ii) of Central Bank Direction No. 1 of 2003.
The Investment Fund Reserve is credited in accordance with the Central Bank guidelines issued to create and Investment Fund Reserve 8% of the profit liable for VAT on Financial Services is transferred to this reserve monthly when the payment of VAT on Financial Services for such month becomes due.In accordance with the guidelines issued, the company maintains government securities equivalent to the value of the reserve. These government securities are included in the Treasury Bills value presented on balance sheet.
Notes to the Financial Statements
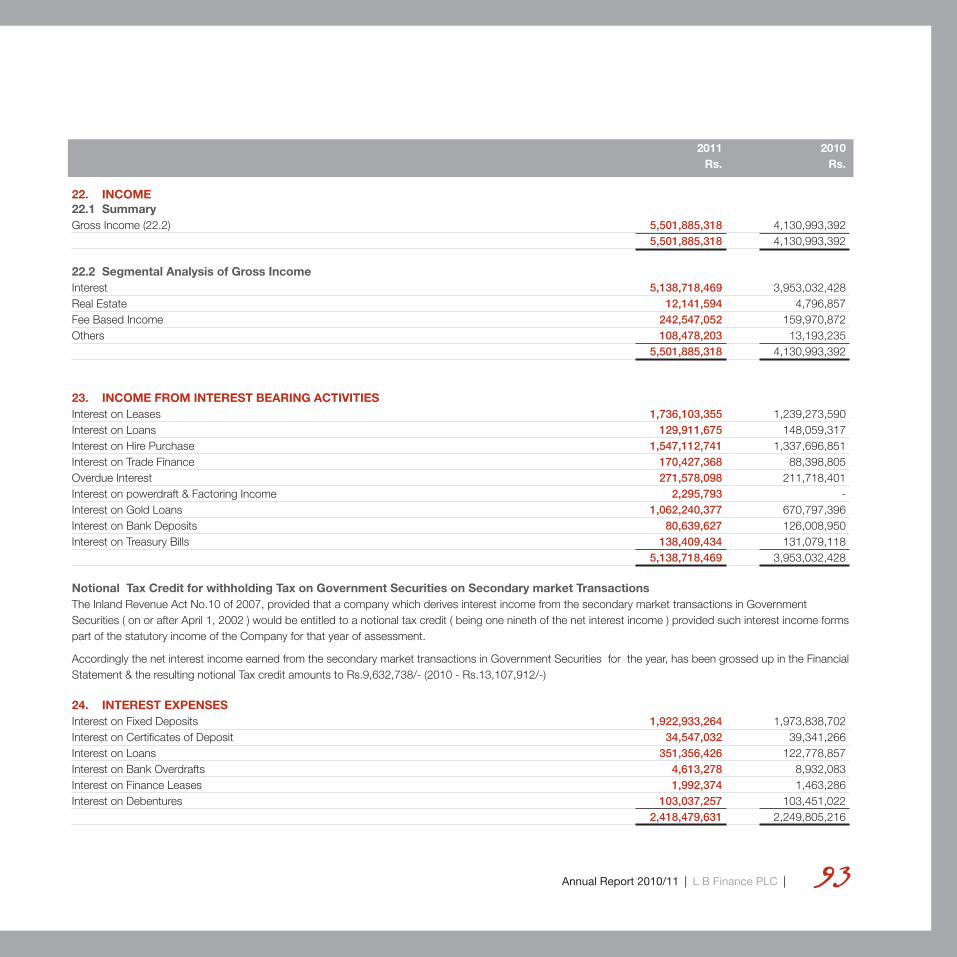
Annual Report 2010/11 | L B Finance PLC | 93
2011 2010 Rs. Rs.
22. INCOME22.1 SummaryGross Income (22.2) 5,501,885,318 4,130,993,392 5,501,885,318 4,130,993,392
22.2 Segmental Analysis of Gross IncomeInterest 5,138,718,469 3,953,032,428Real Estate 12,141,594 4,796,857Fee Based Income 242,547,052 159,970,872Others 108,478,203 13,193,235 5,501,885,318 4,130,993,392
23. INCOME FROM INTEREST BEARING ACTIVITIESInterest on Leases 1,736,103,355 1,239,273,590Interest on Loans 129,911,675 148,059,317Interest on Hire Purchase 1,547,112,741 1,337,696,851Interest on Trade Finance 170,427,368 88,398,805Overdue Interest 271,578,098 211,718,401Interest on powerdraft & Factoring Income 2,295,793 -Interest on Gold Loans 1,062,240,377 670,797,396Interest on Bank Deposits 80,639,627 126,008,950Interest on Treasury Bills 138,409,434 131,079,118 5,138,718,469 3,953,032,428
Notional Tax Credit for withholding Tax on Government Securities on Secondary market TransactionsThe Inland Revenue Act No.10 of 2007, provided that a company which derives interest income from the secondary market transactions in Government Securities ( on or after April 1, 2002 ) would be entitled to a notional tax credit ( being one nineth of the net interest income ) provided such interest income forms part of the statutory income of the Company for that year of assessment.
Accordingly the net interest income earned from the secondary market transactions in Government Securities for the year, has been grossed up in the Financial Statement & the resulting notional Tax credit amounts to Rs.9,632,738/- (2010 - Rs.13,107,912/-)
24. INTEREST EXPENSESInterest on Fixed Deposits 1,922,933,264 1,973,838,702Interest on Certificates of Deposit 34,547,032 39,341,266Interest on Loans 351,356,426 122,778,857Interest on Bank Overdrafts 4,613,278 8,932,083Interest on Finance Leases 1,992,374 1,463,286Interest on Debentures 103,037,257 103,451,022 2,418,479,631 2,249,805,216

| L B Finance PLC | Annual Report 2010/1194
2011 2010 Rs. Rs.
25. OTHER OPERATING INCOMEIncome from Investments - quoted 487,723 249,816Profit/(Loss) on Disposal of Investments 25,976,970 (192,162)Appreciation in Market Value of Quoted Shares 63,565,218 -Profit/(Loss) on Sale of Fixed Assets 42,381 8,036Real Estate Income (net of cost) 2,621,712 1,121,064Profit from Fee based activities 242,547,052 159,970,872Commission on sale of vehicles 2,149,266 2,250,873Other Income on Factoring & Power Drafts 1,827,309 -Hiring Income 4,403,849 1,977,200Recoveries of Bad Debts on write offs 9,646,789 8,543,972Sundry Income 378,696 355,500 353,646,967 174,285,171
26. PROFIT FROM OPERATION STATED AFTER CHARGING THE FOLLOWING EXPENSESTransport Costs 14,558,720 11,558,329Advertising Costs 42,594,574 32,740,583Auditors’ Remuneration (Fees and Expenses) 1,710,000 1,056,100Depreciation 72,931,005 53,451,590Amortization of Intangible Assets- Software 3,712,725 3,189,361Staff Cost includes Defined Contribution Plan Costs - EPF & ETF 46,410,094 30,911,819
27. PROVISION FOR INCOME TAXThe major components of income tax expense for the years ended 31 March are as follows:Income Statement
Current Income TaxCurrent Income Tax charge 695,929,882 423,104,424
Deferred Income TaxDeferred Taxation Charge (27.2) (48,478,242) (44,975,440)Income tax expense reported in the Income Statement 647,451,640 378,128,984
The above Tax is a provisional computation.
Notes to the Financial Statements

Annual Report 2010/11 | L B Finance PLC | 95
27.1 A reconciliation between tax expense and the product of accounting profit multiplied by the statutory tax rate is as follows :
2011 2010 Rs. Rs.
Accounting Profit before Income Tax 1,667,820,018 878,290,108
Income Tax Expense at the statutory income tax rate of 35% 583,737,006 307,401,538
Tax Effect of Other Allowable Credits (957,959) (933,798)Non deductable expenses 54,387,915 65,408,469Social Security Levy at 1.5% of Tax ( 2010 - 1.5% ) 10,284,678 6,252,775Income Tax Expense at the effective income tax rate of 39% (2010- 43%) 647,451,640 378,128,984
The Company’s operations were taxed at the rate of 35% during the year.
27.2 Deferred Tax Assets , Liabilities and Income Tax relates to the followings Balance sheet Income Statement 2011 2010 2011 2010 Rs. Rs. Rs. Rs.
Deferred Tax LiabilityCapital allowances for tax purposes 102,732,902 151,269,297 (78,790,255) (42,981,537)Effect of rate change - - 30,253,859 - 102,732,902 151,269,297 (48,536,396) (42,981,537)
Deferred Tax AssetsDefined Benefit Plans (9,483,505) (9,541,658) 1,966,486 (1,993,903)Effect of rate change - - (1,908,332) - (9,483,505) (9,541,658) 58,154 (1,993,903)Deferred tax Expense (48,478,242) (44,975,440)Net Deferred Tax Liability 93,249,397 141,727,639
28. EARNINGS PER SHARE28.1 Basic Earnings Per Share is calculated by dividing the net profit for the period attributable to ordinary shareholders by the weighted average number of
ordinary shares outstanding during the year.
28.2 The following reflects the Income & Share data used in the Basic Earnings Per Share computation.
2011 2010 Rs. Rs.
Amounts Used as the Numerators:Net Profit Attributable to Ordinary Shareholders for Basic Earnings Per Share 1,020,368,379 500,161,124

| L B Finance PLC | Annual Report 2010/1196
2011 2010 Number Number
Number of Ordinary Shares Used as Denominators for Basic Earnings per shareWeighted Average number of Ordinary Shares in issueApplicable to Basic Earnings Per Share 69,257,142 69,257,142
29. MATURITY OF ASSETS AND LIABILITIESAn analysis of the total assets employed and total liabilities at the year end , based on the remaining at the balance sheet date to the respective contractual maturity dates are given below.
Less than 3 3-12 1-3 over 3 Total months months years years Rs. Rs. Rs. Rs. Rs.
AssetsCash and Bank 347,445,557 - - - 347,445,557Treasury Bills & other bills eligible for re-discounting with Central Bank 1,422,157,957 200,000,000 - - 1,622,157,957Deposits with Banks 153,070,000 134,513,827 - 15,000,000 302,583,827Loans and Advances 692,183,643 492,236,482 564,005,220 127,828,558 1,876,253,902Lease Rental Receivable and Stock out on Hire 1,897,578,497 4,138,692,205 8,474,800,091 1,820,936,211 16,332,007,004Gold Loans 5,145,538,682 521,438,435 - - 5,666,977,117Real Estate Stock 59,380,046 178,140,137 - - 237,520,182Advance for Vehicle Stock 519,705,851 - - - 519,705,851Other Debtors, Deposits and Prepayments 298,513,137 26,896,712 39,850,293 144,955,658 510,215,800Investment Portfolio - - - 28,593,628 28,593,628Trading Portfolio 211,818,144 - - - 211,818,144Intangible assets - - - 9,681,837 9,681,837Property, Plant & Equipment - - - 432,358,758 432,358,758As at 31.03.2011 10,747,391,514 5,691,917,798 9,078,655,604 2,579,354,650 28,097,319,566As at 31.03.2010 5,568,699,809 4,703,352,954 5,646,000,536 1,281,889,343 17,199,942,642
LiabilitiesDeposits from Non-Bank Customers 6,873,266,857 10,259,429,459 2,214,092,560 272,891,847 19,619,680,724Borrowings 1,263,455,131 911,459,738 1,278,029,316 73,429,635 3,526,373,819Accrued Charges 1,095,690,260 283,804,086 136,848,147 12,692,072 1,529,034,565Debentures - - - 450,000,000 450,000,000Retirement Benefit Liability - - - 33,869,659 33,869,659Tax Liability (148,317,670) 379,711,005 - - 231,393,335Deferred Taxation - - - 93,249,397 93,249,397As at 31.03.2011 9,084,094,578 11,834,404,289 3,628,970,023 936,132,610 25,483,601,500As at 31.03.2010 6,878,368,722 6,169,394,992 1,425,557,442 970,188,877 15,443,510,033
Notes to the Financial Statements

Annual Report 2010/11 | L B Finance PLC | 97
2011 2010 Rs. Rs.
30. COMMITMENTS AND CONTINGENCIES30.1 Contingent LiabilitiesGuarantees issued to Banks and other Institutions 6,200,000 6,060,000Cases pending against the Company 9,053,210 22,073,457Import LC & Ordinary Guarantees 181,581,795 - 196,835,005 28,133,457
30.2 CommitmentsThe Company has purchase commitments for acquisition of Property , Plant & Equipment & Vehicle Stocks incidental to the ordinary course of business are, Contracted but not provided for 899,664,152 108,723,871Unutlised facilities 170,703,705 -
31. ASSETS PLEDGEDThe following assets have been pledged as security for liabilities.
Carrying Amount PledgedNature of assets Nature of Liability 2011 2010 Included Under Rs. Rs.
Lease Receivables Loans & Overdrafts 5,014,164,870 1,590,113,086 Lease Rentals Receivables & Stock out on hireReal Estate Overdraft 65,000,000 65,000,000 Real Estate StockFreehold Land Overdraft 8,000,000 8,000,000 Property, Plant & EquipmentVehicles Loan 3,134,083 16,348,897 Property, Plant & Equipment 5,090,298,953 1,679,461,983

| L B Finance PLC | Annual Report 2010/1198
32. FINANCIAL REPORTING BY SEGMENT
Lease & Stock out on Hire Term Loans Real Estate Gold Loans Others Total
2011 2010 2011 2010 2011 2010 2011 2010 2011 2010 2011 2010
Rs. Rs. Rs. Rs. Rs. Rs. Rs. Rs. Rs. Rs. Rs. Rs.
Interest 3,554,794,195 2,788,688,843 301,094,218 153,179,833 1,540,619 3,099,598 1,062,240,377 670,797,396 219,049,061 337,266,758 5,138,718,469 3,953,032,428
Real Estate - - - - 12,141,594 4,796,857 - - - - 12,141,594 4,796,857
Fee Based Income & others 69,309,506 58,522,664 - - - - 172,672,258 101,500,138 109,043,491 13,141,305 351,025,255 173,164,107
Total Revenue 3,624,103,700 2,847,211,507 301,094,218 153,179,833 13,682,212 7,896,455 1,234,912,635 772,297,534 328,092,552 350,408,063 5,501,885,318 4,130,993,392
Segmental Result 1,534,553,304 915,551,977 71,275,322 53,244,905 (22,288,975) (30,183,230) 619,660,866 299,680,229 (108,237,809) (113,845,742) 2,094,962,708 1,124,448,139
Unallocated Expenses 427,142,690 246,158,031
Profits from operations 1,667,820,018 878,290,108
Income tax expenses (647,451,640) (378,128,984)
Net profit for the period 1,020,368,378 500,161,124
Segment Asset 17,049,758,982 10,671,676,576 1,924,202,919 1,087,528,234 215,984,865 228,425,468 5,755,888,564 3,163,918,371 2,163,969,788 1,536,068,945 27,109,805,118 16,687,617,594
Unallocated Assets 987,514,448 512,325,048
Total Assets 28,097,319,567 17,199,942,642
Segment Liabilities 1,920,354,338 635,408,034 213,598,529 64,753,103 20,533,736 12,804,176 638,939,541 188,384,565 450,000,000 450,000,000 3,243,426,144 1,351,349,878
Unallocated Liabilities 22,240,175,355 14,092,160,155
Total Liabilities 25,483,601,500 15,443,510,033
33. EVENTS OCCURRING AFTER THE BALANCE SHEET DATEThere have been no material events occurring after the Balance Sheet date that require adjustments to or disclosure in the Financial Statements.The Board of Directors has declared and interim dividends of Rs. 3.50 per share totalling to Rs.242,399,997 on 6th June 2011.
34. RELATED PARTY DISCLOSURES34.1 Transactions with Key Managerial personsThe Key Managerial personnel of the Company are the members of its Board of Directors. Following transactions are entered between the company and its Key Management Personnel and their close family members.
2011 2010 Rs’000’s Rs’000’s
34.1.1 Compensation to Key Managerial PersonnelShort Term Employment Benefits Paid 61,836 43,270
Notes to the Financial Statements

Annual Report 2010/11 | L B Finance PLC | 99
2011 2010 Rs’000’s Rs’000’s
34.1.2 Other transactions with Key Managerial Personnel Personal Guarantees Received - 85,416Fixed Deposits Accepted during the year 30,289 4,227
34.1.3 Transactions with entities that are controlled, jointly controlled or significantly influenced by Key Managerial Personnel or their close member of family , or shareholders who have either control, significant influences or joint control over entity.
Nature of TransactionFixed Deposits Accepted during the year 3,455,000 253,979Fixed Deposits held at the end of the year 3,055,414 24,055Interest payable on Fixed Deposits 61,196 1,568Interest paid on Fixed Deposits 19,397 20,916Dividend Paid on Share Holdings 230,206 126,065Lease Facilities Granted during the year - 2,790Bank Balance 5,588 4,985Letter of Credits opened during the year 39,792 6,087Short Term Loans 900,000 50,000Short Term Loans Repayment 900,000 50,000Fixed Deposits and REPO opened during the year 8,306,000 1,939,241Purchases during the year 3,151 2,715Leasing Interest Income during the year 1,438 2,618
34.1.4 The Company entered into an Agreement with Mr K D D Perera dated 15th January 2011 for the purchase of a land in extent One Rod and Twelve decimal Eight Two Perches (1 Rood 12.82 Perches) with the building thereon of a total floor area of 65,000 sq ft situated at Dharmapala Mawatha, Colombo 3 for a total consideration of Rs.700,000,000/- on or before 15th July 2011 subject to the terms and conditions stipulated therein inclusive of the relevant regulatory approvals.
Mr K D D Perera held 14,078,762 shares (20.2%) of the Company as at 31st March 2011. He is also the major shareholder of Vallibel One Limited which held 35,321,200 shares (51%) of the Company as at 31st March 2011. 35. DIVIDEND PROPOSEDInterim dividend paid on 18th May 2010 for 2009/10 - Rs.5 per share - 173,142,855 Dividend proposed after the balance sheet date (Rs. 3.50 per share) 242,399,997 -

| L B Finance PLC | Annual Report 2010/11100
Constituents of Capital Amount (In Rupees Thousand)Code 2009 2010 2011
TIER 1: CORE CAPITAL20 Issued and paid-up ordinary shares/ Common stock 346,286 346,286 692,57121 Non-cumulative, Non-redeemable preference shares22 Share premium 145,710 145,710 145,71023 Statutory reserve fund 223,396 223,396 558,35724 General and other free reserves25 Published retained profits/ (Accumulated losses) 634,704 1,041,041 1,217,07926 Surplus/ loss after tax arising from the sale of fixed and long term investments27 Unpublished current tear’s profits/ losses28 Sub total 1,350,097 1,756,433 2,613,71829 Deductions
Goodwill30 TOTAL TIER 1 CAPITAL 1,350,097 1,756,433 2,613,718
TIER 2: SUPPLEMENTARY CAPITAL31 Eligible revaluation reserves32 General provisions33 Approved hybrid (debt/ equity) capital instruments34 Approved unsecured subordinated term debt (Actual amount is Rs. 450,000,000) (Eligible amount is Rs.270,000,000) 450,000 360,000 270,00035 TOTAL TIER 2 CAPITAL 450,000 450,000 450,00036 Eligible Tier 2 capital 450,000 360,000 270,00037 TOTAL CAPITAL 1,800,097 2,116,433 2,883,718
38 Deductions38.01 Equity investments in unconsolidated financial and banking subsidiaries38.02 Investments in capital of other financial/ banks39 Capital Base 1,800,097 2,116,433 2,883,71840 Total Tier i (core capital) 1,350,097 1,756,433 2,613,71841 Total Risk Weighted Assets 10,426,416 12,208,331 20,259,175
Capital Adequacy

Annual Report 2010/11 | L B Finance PLC | 101
0
15.00%
9
12.00
09 10 11
3
6
Core Capital Ratio
Minimum 5% Minimum 10%
0.00
20.00%
15.00
09 10 11
5.00
10.00
Total Risk Weighted Capital Ratio
Core Capital Ratio (Minimum requirement 5%) Core Capital 12.95% 14.39% 12.90% Risk- Weighted Assets
Total Risk Weighted Capital Ratio (Minimum Ratio 10%) Capital Base 17.26% 17.34% 14.23% Risk- Weighted Assets

| L B Finance PLC | Annual Report 2010/11102
12 Months 12 Months 12 Months 15 Months 12 Months 12 Months 12 Months 12 Months 12 Months 12 Months
31.12.01 31.12.02 31.12.03 31.03.05 31.03.06 31.03.07 31.03.08 31.03.09 31.03.10 31.03.11
Rs ‘000 Rs ‘000 Rs ‘000 Rs ‘000 Rs ‘000 Rs ‘000 Rs ‘000 Rs ‘000 Rs ‘000 Rs ‘000
Balance Sheet
Cash And Amounts Due From Banks 40,873 22,909 40,062 24,242 57,232 90,555 152,581 217,642 277,083 347,446
Placements With Other Banks 99,630 110,386 95,101 140,940 171,786 247,918 415,918 550,496 364,918 302,584
Treasury Bills & other bills eligible 115,411 147,860 185,702 234,323 297,939 361,369 476,877 799,698 1,165,157 1,622,158
for re-discounting with Central Bank
Amounts due from Department
of Inland Revenue - - - - - 14,099 8,377 - - -
Real Estate Stock 102,254 107,319 184,457 161,755 170,963 238,641 218,198 211,241 246,928 237,520
Loans And Advances 338,652 671,042 861,373 997,211 977,435 1,100,386 1,805,471 2,834,414 4,193,815 7,543,231
Lease Rentals Receivable &
Stock Out On Hire 838,071 999,803 995,656 1,726,591 2,830,052 4,641,290 7,256,655 9,006,955 10,440,329 16,332,007
Investment Securities 16,024 15,744 18,328 12,945 9,021 9,032 9,032 6,226 5,994 28,594
Other Debtors, Deposits and Prepayments 109,279 100,923 75,399 43,874 32,768 129,921 142,570 141,619 104,271 510,216
Deferred Taxation - - - - 35,650 - - - - -
Vehicle Stock - - - - 15,620 58,242 118,686 41,939 156,502 519,706
Intangible Assets - - - - 4,760 11,289 9,959 9,311 7,333 9,682
Property, Plant & Equipment 31,989 54,007 47,242 58,957 63,117 87,773 129,775 189,920 237,613 432,359
Total Assets 1,692,183 2,229,993 2,503,321 3,400,838 4,666,343 6,990,516 10,744,099 14,009,461 17,199,943 28,097,320
Deposits From Non-Bank Customers 1,345,311 1,824,406 2,006,061 2,606,792 3,344,671 4,561,445 7,309,101 9,558,370 12,489,789 19,619,681
Borrowings 73,964 113,233 86,585 314,197 561,612 1,401,839 1,658,593 1,527,997 1,065,377 3,526,374
Debentures - - 100,000 100,000 100,000 100,000 100,000 450,000 450,000 450,000
Trade Payables & Accrued Charges 118,839 139,264 139,166 147,566 230,727 303,445 559,993 846,978 916,729 1,529,035
Tax Payable - - - 11,375 48,972 - - 67,751 352,626 231,393
Deferred Taxation - - - - - 16,993 114,615 186,703 141,728 93,249
Dividends Payable - - - - 13,500 - - - - -
Provision and Other Liabilities 4,982 6,236 7,987 8,978 12,207 19,367 26,778 21,565 27,262 33,870
Total Liabilities 1,543,096 2,083,139 2,339,799 3,188,908 4,311,689 6,403,090 9,769,080 12,659,364 15,443,510 25,483,601
Share Capital 135,000 135,000 135,000 135,000 135,000 202,000 418,411 491,996 491,996 838,282
Reserves 14,087 21,766 28,522 76,930 219,654 385,426 556,608 858,101 1,264,436 1,775,436
Total Shareholders’ Funds 149,087 156,766 163,522 211,930 354,654 587,426 975,019 1,350,097 1,756,433 2,613,718
Total Liabilities & Funds Employed 1,692,183 2,239,905 2,503,321 3,400,838 4,666,343 6,990,516 10,744,099 14,009,461 17,199,943 28,097,320
Income Statement
Gross Income 362,909 501,671 541,873 779,175 914,463 1,310,792 2,778,862 3,580,173 4,130,993 5,501,885
Interest Income 300,659 375,197 425,837 677,403 849,978 1,229,406 2,082,418 3,431,950 3,953,032 5,138,718
Interest Expenditure 208,154 268,896 297,083 383,401 432,856 655,624 1,318,058 2,238,847 2,249,805 2,418,480
Net Interest Income 92,505 106,301 128,754 294,002 417,122 573,782 764,361 1,193,103 1,703,227 2,720,239
Ten Year Summery

Annual Report 2010/11 | L B Finance PLC | 103
12 Months 12 Months 12 Months 15 Months 12 Months 12 Months 12 Months 12 Months 12 Months 12 Months
31.12.01 31.12.02 31.12.03 31.03.05 31.03.06 31.03.07 31.03.08 31.03.09 31.03.10 31.03.11
Rs ‘000 Rs ‘000 Rs ‘000 Rs ‘000 Rs ‘000 Rs ‘000 Rs ‘000 Rs ‘000 Rs ‘000 Rs ‘000
Other Operating Income 11,007 42,765 33,000 42,784 29,917 65,247 165,682 122,326 174,285 353,647
Operating Expenditure 98,291 137,840 158,545 251,929 243,391 309,632 509,225 647,561 839,479 1,171,025
Profits Before taxation 5,221 11,226 3,209 73,344 173,108 282,401 355,214 555,315 878,290 1,667,820
Provision For Taxation - - - 24,936 96,051 103,625 149,381 195,707 378,129 647,452
Dividends - - - - 13,500 - 68,175 103,886 173,143 242,400
Net profits 5,221 11,226 3,209 48,408 77,056 178,776 205,833 359,608 500,161 1,020,368
Decade at a Glance
Ratios
Earning Per Share (Rs.) 0.39 0.83 0.24 3.59 5.71 8.85 6.79 10.38 7.22 14.73
Net Assets Per Share (Rs) 11.04 11.61 12.11 15.70 26.27 29.08 32.18 38.99 25.36 37.74
Return On Average Shareholders’ Funds (%) 3.56 7.34 2.00 25.79 27.20 37.95 26.35 30.93 32.20 46.70
Return On Average Assets (%) 0.32 0.57 0.14 1.64 1.91 3.07 2.32 2.91 3.21 4.51
Total Assets to Shareholders’ Funds (Times) 11.35 14.22 15.31 16.05 13.16 11.90 11.02 10.38 9.79 10.75
Interest Spread (%) 6.80 6.58 6.56 11.16 10.73 10.11 8.12 7.92 9.32 11.63
Net Interest Margin (%) 6.88 6.40 6.33 11.23 11.31 10.80 9.38 10.31 11.60 12.96
Efficiency Ratio (%) 94.96 92.47 98.02 74.80 54.45 48.45 54.75 49.23 44.71 38.10
Growth In Gross Income (%) (13.48) 38.24 8.01 43.79 17.36 43.34 112.00 28.84 15.39 33.19
Growth In Interest Income (%) (0.20) 24.79 13.50 59.08 25.48 44.64 69.38 64.81 15.18 29.99
Growth In Interest Expense (%) 5.36 29.18 10.48 29.06 12.90 51.46 101.04 69.86 0.49 7.50
Growth In Net Interest Income (%) (10.79) 14.91 21.12 128.34 41.88 37.56 33.21 56.09 42.76 59.71
Growth In Profit Before Taxes (%) 16.54 115.02 (71.41) 2,185.58 136.02 63.14 25.78 56.33 58.16 89.89
Growth In Net Profit (%) 16.54 115.02 (71.41) 1,408.51 59.18 132.01 15.13 74.71 39.09 104.01
Growth In Total Assets (%) 11.19 31.78 12.26 35.85 37.21 49.86 53.64 30.39 22.77 63.36
Growth In Total Advances (%) 3.92 41.99 11.14 46.68 39.79 50.80 57.83 30.67 23.58 63.15
Growth In Deposits (%) 15.97 35.61 9.96 29.95 28.31 36.38 60.24 30.77 30.67 57.09
Growth In Shareholders’ Funds (%) 3.63 5.15 4.31 29.60 67.34 65.63 65.98 38.47 30.10 48.81
No. Of Branches 5 5 5 5 7 9 15 21 27 34
No. Of Pawning Centres 8 12 14 22 26 32 40 57 75 92

| L B Finance PLC | Annual Report 2010/11104
20 MAJOR SHAREHOLDERS as at 31/03/2011 as at 31/03/2010 No of No of Shares (%) Cum.% Shares (%)
1. Vallibel One Limited 35,321,200 51.000 51.0002. Mr. K D D Perera 14,078,762 20.328 71.328 22,001,088 63.5343. Esna Holdings (Pvt) Ltd 7,000,200 10.108 81.436 2,582,400 7.4574. Commercial Bank of Ceylon PLC/Royal } 2,348,000 3,818,694 5.514 86.950 3,363,497 9.713 Ceramics Lanka PLC Royal Ceramics Lanka PLC } 1,470,6945. Mr. Nimal Perera 1,148,598 1.658 88.608 408,949 1.1816. Pan Asia Banking Corporation PLC/Emagewise (Pvt) Ltd 936,400 1.352 89.9607. Amaya Leisure PLC 300,020 0.433 90.3938. Environmental Resources Investment PLC 251,000 0.362 90.7559. Mr. H A M P Algama 200,000 0.289 91.044 100,000 0.28910. Mr. A M Weerasinghe 148,850 0.215 91.259 74,425 0.21511. Mrs. P C Cooray 147,304 0.213 94.472 61,252 0.17712. Waldock Mackenzie Ltd / Mrs G Soysa 111,252 0.161 91.633 63,626 0.18413. Seylan Bank PLC/Tharana Gangul Thoradeniya 95,800 0.138 92.77114. Mr. C M Samarathunga 81,800 0.118 92.88915. Mr. P A J Kumara 80,000 0.116 93.00516. Mr. M J D Peiris 79,000 0.114 93.119 49,000 0.14217. Mr. T Jeremiah 77,582 0.112 93.231 38,791 0.11218. Mr. P Somadasa 76,972 0.111 93.342 61,836 0.17919. Mr. K Karunanayake and Miss. P N Karunanayake 74,162 0.107 93.449 37,581 0.10920. Mr. J H Leanage 70,000 0.101 93.550 64,097,596 92.550 5,159,746 7.450 Total 69,257,142 100.000
DISTRIBUTION OF SHAREHOLDINGS AS AT 31ST MARCH 2011
From To No. of Holders No. of Shares %
1 - 1,000 1,163 408,471 0.59 1,001 - 10,000 552 1,942,681 2.81 10,001 - 100,000 121 3,481,630 5.03 100,001 - 1,000,000 7 2,094,826 3.02 Over 1,000,000 6 61,329,534 88.55 1,849 69,257,142 100.00
Share Information

Annual Report 2010/11 | L B Finance PLC | 105
ANALYSIS OF SHAREHOLDERS AS AT 31ST MARCH 2011
Category No. of Shareholders No. of Shares %
Local Individuals 1,721 19,103,190 27.58Local Institutions 104 49,843,490 71.97Foreign Individuals 21 236,562 0.34Foreign Institutions 3 73,900 0.11Total 1,849 69,257,142 100
DIRECTORS’ SHAREHOLDING AS AT 31ST MARCH 2011
Names of Directors No. of shares Percentage (%)
Mr. K D D Perera ] 14,078,762 20.328Mr. L N de Silva Wijeyeratne - -Mr. J A S S Adhihetty 53,060 0.077Mr. Nimal Perera } 1,148,598 1.66Seylan Bank PLC/Mr. Nimal Perera}Mr. A M Weerasinghe 148,850 0.215Mr. K D A Perera - -Mr. N Udage 4,200 0.006Mr. B D St. Auburn Perera - -Mr. M D S Goonatilleke 1,600 -Mrs. K Fernando 1,600 -
SHARE PRICES FOR THE YEAR 31.03.2011 31.03.2010 Rs. Rs.
Market price per share Highest during the period 340.00 69.00Lowest during the period 61.00 17.75As at end of the period 175.10 62.00
31.03.2011 31.03.2010
No. of transactions 19,588 7,932No. of Shares traded 40,378,100 7,856,300
PUBLIC HOLDINGThe percentage of shares held by the public as at 31st March 2011 is 16.58%.

| L B Finance PLC | Annual Report 2010/11106
Glossary of Financial TermsEarning AssetsIncome earning assets held by the company. Typically include interest bearing balances, investment securities and loans.
Interest Bearing LiabilitiesLiabilities on which the Company is paying interest.
Efficiency RatioNon interest expenses divided by the sum of net interest income and non interest income.
Investment SecuritiesSecurities acquired and held for yield or capital growth purposes and are usually held to maturity.
Net Interest MarginRatio of net interest income to earning assets.
Interest SpreadRepresents the difference between the average interest rate earned and the average interest rate paid on funds.
NPL RatioThe net Non Performing Loans as a percentage of the total portfolio.
Equity MultiplierThe total assets divided by the shareholders funds.
Liquid AssetsAssets that are held in cash or in a form that can be converted to cash readily, such as deposits with other banks, bills of exchange, treasury bills.
Provision for Bad DebtsAmounts set aside against possible losses on financial leases hire purchases advances and other credit facilities according to finance companies Direction 3 of 2006.
Market CapitalisationNumber of ordinary shares in issue multiplied by the market value of a share as at the year end.
MaterialityThe relative significance of a transaction or an event the omission or mistatement of which could influence the economic decisions of users of financial statements.
Net Assets Value per Ordinary ShareShareholders’ funds excluding Preference Shares divided by the number of ordinary shares in issue.
Risk Weighted AssetsOn balance sheet assets and the credit equivalent of off balance sheet assets multiplied by the relevant risk weighting factors.
Segmental AnalysisAnalysis of financial information by segments of an enterprise specifically, the different industries and the different geographical areas in which it operates.
Repurchase AgreementContract to sell and subsequently repurchase securities at a specified date and price.
Return on Average Equity (ROE)Net income, less preference share dividends if any, expressed as a percentage of average ordinary shareholders’ equity.
Revenue ReserveReserves set aside for future distribution and investment.
Shareholders’ FundsTotal of issued and fully paid share capital and capital and revenue reserves.
Net Interest IncomeThe difference between what a bank earns on assets such as loans and securities and what it pays on liabilities such as deposits, refinance funds and inter-bank borrowings.
Non-Performing LoansA loan advances and hire purchase/lease finance of which interest or capital is in arrears six months or more.
Price Earnings Ratio (P/E Ratio)Market price of a share divided by earnings per share.
PrudenceInclusion of a degree of caution in the exercise of judgement needed in making the estimates required under conditions of uncertainty, such that assets or income are not overstated and liabilities or expenses are not understated.
Related PartiesParties where one party has the ability to control the other party or exercise significant influence over the other party in making financial and operating decisions.

Annual Report 2010/11 | L B Finance PLC | 107
Return on Average Assets (RoA)Profit after tax divided by the average assets.
Substance Over FormThe consideration that the accounting treatment and the presenting in financial statements of transactions and the events should be governed by their substance and financial reality and not merely by legal form.
Tier I CapitalCore capital representing permanent shareholders’ equity and reserves created or increased by appropriations of retained earnings or other surpluses.
Tier II CapitalSupplementary capital representing revaluation reserves, general provisions and other capital instruments which combine certain characteristics of equity and debt such as hybrid capital instruments and subordinated term debts.
Value AddedValue of wealth created by providing financial and other related services less the cost of providing such services.
Debt to Equity RatioLong term Borrowings of the Company including Debentures divided by shareholders funds.
Interest CoverEarnings before interest and taxes divided by interest cost.
Liquid Assets RatioLiquid Assets divided by public Deposits.

| L B Finance PLC | Annual Report 2010/11108
Branch Network
“Milton House” No. 115, Kotugodella Veediya Kandy
No. 26, Anagarika Dharmapla Mawatha, Badulla.
No. 80, Greens Road, Negombo
No. 150, Main Street, Galle.
No. 21, Dambulla Road, Kurunegala.
No. 508, Galle Road, Panadura.
Chunnakam
Bandarawela
Embilipitiya
Maradana
Kandana
No. 92, Stanley Thilakaratne Mawatha, Nugegoda.
No. 49, Senanayaka Mawatha, Ratnapura.
No. 334, Main Street, Kalutara.
No. 2, Ratnapura Road, Horana.
No. 13, Station Road, Matara.
No. 1 B, Bauddhaloka Mawatha, Gampaha.
No. 96/2, New Galle Road, Ambalangoda.
No. 137, Main Street, Anuradhapura.
No. 12, Main Street, Kuliyapitiya.
No. 19, Rest House Approach Road, Balangoda.
No. 315, Main Street, Kegalle.
“Rajarata Building” Main Street, Kaduruwela.
No. 25, Yatiyantota Road, Awissawella.
No. 71, City Lite Building, Queen Eiisabath Drive, Nuwara-Eliya.
No 84 A, Galle Road, Dehiwala.
No 275, Central Road, Trincomalee.
No 175, Trinco Road, Batticaloa.
No 40/1, Colombo Road, Chilaw.
No 02, Kandy Road, Kiribathgoda.
No 04, Opposite Clock Tower, Ampara.
No 187, Main Street, Bandarawela.
No 55, K.K.S Road, Chunnakam.
No 6, Station Road, Kandana.
No 43, Main Street, Pallegama, Embilipitiya.
No 440, Hospital Road, Jaffna.
No 32 B, 2nd Cross Street, Vavuniya.
No 538 A, 2nd Division, Maradana.

Annual Report 2010/11 | L B Finance PLC | 109
Branch Address Telephone Fax Email Contact Person
Kandy
“Milton House” No. 115 Kotugodella Veediya Kandy
081-2225765 081-2238931 081-2238932 081-4476235
081-2232226
Mrs. Nirosha Amanulla Senior Manager
Badulla
No. 26, Anagarika Dharmapla Mawatha, Badulla.
055-2231965 055-4499744 055-4499523
055-2231964
Mr. Chintaka ChandrasenaManager
Negombo
No. 80, Greens Road, Negombo
031-4872513 031-4872514 031-4874574
031-2231266
Mr. Tephan Sosa Head of Branch
Galle
No. 150, Main Street, Galle.
091-4385065 091-4380451
091-4381644
Mr. Jagath Hettiarchchi Head of Branch
Kurunegala
No. 21, Dambulla Road, Kurunegala.
037-4690464
037-4690138
Mr. Rasika Tennakoon Head of Branch
Panadura
No. 508, Galle Road, Panadura.
038-4282500 038-4282111
038-2243525
Mr. Mahesh Gulawita Head of Branch
Nugegoda
No. 92, Stanley Thilakaratne Mawatha, Nugegoda.
011-4541333
011-4541735
Mr. Chanaka Alexander Head of Branch
Ratnapura
No. 49,Senanayaka Mawatha, Ratnapura.
045-4641010 045-4641011 045-4641012
045-4641013
Mr. Wimal Ratnayake Head of Branch
Kalutara
No. 334, Main Street, Kalutara.
034-4936065 034-4929520
034-4280952
Mr. Dishan Fernando Head of Branch
Horana
No. 2, Ratnapura Road, Horana.
034-4286255 034-4286120
034-4286120
Mr. Hirantha JayasingheManager
Matara
No. 13, Station Road, Matara.
041-4390847 041-4390848
041-4390849
Mr. Anoj Wedage Head of Branch
Gampaha
No. 1 B, Bauddhaloka Mawatha, Gampaha.
033-4670464 033-4670650
033-4670464
Mr. Sanjaya Galgamuwa Head of Branch
Ambalangoda
No. 96/2, New Galle Road, Ambalangoda.
091-4382588 091-4933948
091-4382590
Mr. Chamila Wanniarachchi Head of Branch

| L B Finance PLC | Annual Report 2010/11110
Branch Network
Branch Address Telephone Fax Email Contact Person
Anuradhapura
No. 137, Main Street, Anuradhapura.
025-4926029 025-4926041
025-4580943
Mr. Chanaka Pemruwan Head of Branch
Kuliyapitiya
No. 12, Main Street, Kuliyapitiya.
037-4931664 037-4931076
037-4696319
Mr. Anura Jayasinghe Head of Branch
Balangoda
No. 19, Rest House Approach Road, Balangoda.
045-4932546 045-4932547
045-4640000
Mr. Sanath Kumara Head of Branch
Kegalle
No. 315, Main Street, Kegalle.
035-4932340 035-4932341
035-4932339
Mr. Prabath Neelawala Head of Branch
Polonnaruwa
“Rajarata Building” Main Street, Kaduruwela.
027-4926590 027-4926599
027-4599119
Mr. Nalin Jayasinghe Head of Branch
Awissawella
No. 25, Yatiyantota Road, Awissawella.
036-4929910 036-4929911
036-4270790
Mr. Vipula Gunaratne Head of Branch
Nuwara-Eliya
No. 71, City Lite Building, Queen Eiisabath Drive, Nuwara-Eliya.
052-4924362 052-4924363
052-4490030
Mr. D.M.P.C. Dissanayake Head of Branch
Dehiwala No 84 A, Galle Road,Dehiwala.
011-4361869011-4361870
011-2722446 [email protected] Mr. Damintha Jayawardana Head of Branch
Trincomalee No 275, Central Road,Trincomalee.
026-4924294026-4924295
026-2226737 [email protected] Mr. Tuder LuvastonHead of Branch
Batticloa No 175, Trinco Road,Batticaloa.
065-4923930065-4923931065-4923932
065-2224329 [email protected] Mr. Suresh KumarOfficer In Charge
Chilaw No 40/1, Colombo Road,Chilaw.
032-4929638032-4929639032-4929640
032-2224725 [email protected] Mr. Prasad Surendra Head of Branch
Kiribathgoda No 02, Kandy Road,Kiribathgoda.
011-4334550011-4334551
011-4818192 [email protected] Mr. Asanka Abesinghe Head of Branch
Ampara No 04, Opposite Clock Tower,Ampara.
063-4925110063-4925111
063-2223504 [email protected] Mr. Prabath Asmadala Head of Branch
Bandarawela No 187, Main Street, Bandarawela.
057-4926386057-4926387
057-2225424 [email protected] Mr. Lakshman WanniarachchiSenior Manager
Chunnakam No 55, K.K.S Road,Chunnakam.
021-4920331021-4920339
021-2241334 [email protected] Mr. K. Kajan Head of Branch

Annual Report 2010/11 | L B Finance PLC | 111
Branch Address Telephone Fax Email Contact Person
Kandana No 6, Station Road, Kandana.
011-4380250011-4380251
011-2231925 [email protected] Muditha Dammika SilvaManager
Embilipitiya No 43, Main Street, Pallegama,Embilipitiya.
047-4924423047-4924424
047-2261990 [email protected] Mr. Chinthaka Senewerathne Head of Branch
Jaffna No 440, Hospital Road, Jaffna.
021-4920311021-4920310
021-2220249 [email protected] Mr. S.D. Niranjan Head of Branch
Vavuniya No 32 B, 2nd Cross Street,Vavuniya.
024-4925127024-4925136
024-2226043 [email protected] Mr. B. Sudharan Head of Branch
Maradana # 538 , Maradana Road, Colombo - 10.
011-4021679011-4380277
011-2685359 [email protected] Mohamed Zakir SalyHead of Branch
| L B Finance PLC | Annual Report 2010/11112
Notice of Annual General MeetingNOTICE IS HEREBY GIVEN that the Thirty Eighth (38th) Annual General Meeting of L B Finance PLC will be held at No. 275/75, Prof. Stanley Wijesundera Mawatha Colombo 7 on Thursday, the 30th day of June 2011 at 10.30 a.m. for the following purposes:
1. To receive and consider the Annual Report of the Board of Directors on the affairs of the Company and the Statement of Accounts for the year ended 31st March 2011 and the Report of the Auditors thereon.
2. To declare a Dividend as recommended by the Directors
3. To re-elect Mr. A M Weerasinghe who retires by rotation in terms of Articles 86 and 87 of the Articles of Association, as a Director of the Company
4. To re-elect Mrs. Shirani Jayasekara as a Director in terms of Article 93 of the Articles of Association of the Company
5. To re-appoint Messrs Ernst & Young, Chartered Accountants, the retiring Auditors and to authorise the Directors to determine their remuneration.
6. To authorise the Directors to determine donations for the year ending 31st March 2012 and up to the date of the next Annual General Meeting.
By Order of the BoardL B Finance PLC
P W Corporate Secretarial (Pvt) LtdSecretaries
At Colombo
6th June 2011
Notes:
1. A shareholder entitled to attend and vote at the meeting is entitled to appoint a proxy to attend and vote on behalf of him/her.
2. A proxy need not be a shareholder of the Company.
3. The Form of Proxy is enclosed for this purpose.
4. The completed Form of Proxy must be deposited at the Registered Office of the Company, No. 275/75, Prof. Stanley Wijesundera Mawatha, Colombo 7 by 10.30 a.m. on 28th June 2011.

Annual Report 2010/11 | L B Finance PLC | 113
Notes

| L B Finance PLC | Annual Report 2010/11114
Notes

Annual Report 2010/11 | L B Finance PLC | 115
Form of ProxyI/We*………………………………………………………………………………………….………………………………………………………………………….……......of …………………………………………………………………………………………………..…………………………………………………………………………..…shareholder/s of L B FINANCE PLC hereby appoint ……………………………………………...…………………………………………………………………………..………………………………………….. (holder of NIC No………………………………… .) of …………………….…….………………………………………………..…………………………………………………………………………..………………………………………………………………………….…………… or failing him*
Mr. Kulapurachchige Don Dhammika Perera of Colombo or failing him*Mr. Lalit Nihal de Silva Wijeyeratne of Colombo or failing him*Mr. John Anthony Sunil Sumith Adhihetty of Colombo or failing him*Mr. Nimal Perera of Colombo or failing him*Mr. Amarakoon Mudiyanselage Weerasinghe of Colombo or failing him*Mr. Kulapuarachchige Don Anurada Perera of Colombo or failing him*Mr. Niroshan Udage of Colombo or failing him*Mr. Biyawalage Dudley St. Auburn Perera of Colombo or failing him*Mrs. Kimarli Fernando of Colombo or failing her *Mrs. Shirani Jayasekara of Colombo
as my/our* proxy to represent me/us* to speak and to vote as indicated hereunder for me/us* and on my/our* behalf at the Thirty Eighth (38th ) Annual General Meeting of the Company to be held on 30th June 2011 and at every poll which may be taken in consequence of the aforesaid meeting and at any adjournment thereof.
For Against1. To receive and consider the Report of the Directors and the Statement of Accounts for the year ended 31st March 2011 with the Report of the Auditors thereon.
2. To declare a Dividend as recommended by the Directors
3. To re-elect Mr. A M Weerasinghe who retires by rotation in terms of Articles 86 and 87 of the Articles of Association, as a Director of the Company. 4. To re-elect Mrs. Shirani Jayasekara as a Director in terms of Article 93 of the Articles of Association of the Company. 5. To re-appoint Messrs Ernst & Young, Chartered Accountants the retiring Auditors and to authorise the Directors to determine their remuneration.
6. To authorise the Directors to determine donations for the year ending 31st March 2012 and up to the date of the next Annual General Meeting.
In witness my/our* hand(s) this ……………… day of …………………. Two Thousand and Eleven.
………………………………. Signature of Shareholder
*Please delete what is inapplicable.Note : Instruction as to completion appear overleaf.

| L B Finance PLC | Annual Report 2010/11116
Instructions for completion
1. The instrument appointing a Proxy shall be in writing under the hand of the appointer or of his/her Attorney duly authorised in wiring or if such appointer is a company/ corporation, either under its Common Seal, or under the hand of an Officer/s or Attorney duly authorised in terms of the Articles of Association/ Statute.
2. In the case of a proxy signed by an Attorney, the original Power of Attorney must be deposited at the Secretaries’ Office (i.e. P W Corporate Secretarial (Pvt) Ltd, No. 3/17, Kynsey Road, Colombo 08 – Telephone: 011-4640360/3) for registration.
3. In perfecting the Form of Proxy please ensure that all details are legible.
4. If you wish to appoint a person other than the Chairman (or failing him, one of the Directors) as your Proxy please insert the relevant details in the space provided.
5. Please indicate with an X in the space provided how your proxy is to vote on the resolution. If no indication is given, the proxy in the discretion will vote as he thinks fit.
6. To be valid, this Form of Proxy must be deposited at the Registered Office, No.275/75, Prof. Stanley Wijesundera Mawatha, Colombo 7, by 10.30 a.m, on 28th June 2011.

Corporate InformationName of CompanyL B Finance PLC
Legal FormPublic Limited Liability Company incorporated in Sri Lanka under the provisions of the Companies’ Ordinance No. 51 of 1938 (Cap 145) and Quoted in the Colombo Stock Exchange in January, 1998.
A Finance Company registered under the Finance Companies Act No. 78 of 1988.
A registered Finance Leasing Establishment in terms of Finance Leasing Act No. 56 of 2000.
Date of Incorporation30th May, 1971
Company Registration NumberPQ 156
Registered Office / Head OfficeNo. 275/75 OPA Building,Prof. Stanely Wijesundara Mawatha, Colombo 07.
VAT Registration No.104033431 7000
Telephone011-4521000
Facsimile011-5345327
Websitewww.lbfinance.com
SecretariesP W Corporate Secretarial (Pvt) LtdNo. 3/17, Kynsey Road, Colombo 08Telephone: 4640360-3Fax: 4740588Email: [email protected]
External AuditorsErnst & Young
Internal AuditorsBDO PartnersKPMG Ford Rhodes Thornton & Company
LawyersNithya PartnersMessrs. Paul Ratnayake Associates
BankersSeylan Bank PLCCommercial Bank of Ceylon PLCHatton National Bank PLCSampath Bank PLCNDB Bank PLCUnion Bank of Colombo LimitedPan Asia Banking Corporation PLCBank of CeylonPeoples Bank
Design and concept: Copyline (Pvt) Ltd Photography: Taprobane Street Digital Plates: Imageline (Pvt) Ltd Printing: Gunaratne Offset Ltd Production: Copyline (Pvt) Ltd

L B Finance PLC275/75, OPA BuildingProfessor Stanley Wijesundere Mawatha,Colombo 07Sri Lanka.