tea house, naivasha road, off ngong road p.o. box … fisheries and food authority tea house,...
TRANSCRIPT

Agriculture, Fisheries and Food Authority
Tea house, Naivasha Road, off Ngong Road
P.O. Box 37962 – 00200 Nairobi
Tel.: 3872421/3872497/3874445/6
Mobile: 0722-200556/0734-600994; Wireless: 020-2536869/2536886
Website: www.agricultureauthority.go.ke, Email: [email protected]

Page 2 of 12
1. Economy
In the first two months of the current fiscal year,
our country`s public/government debt rose by Kshs.
90 billion amidst a weakening shilling to hit a record
Kshs. 2.93 trillion. Kenya`s total debt now
constitutes approximately 51 per cent of the Gross
Domestic Product, this means that more than half
of the country’s annual earnings is effectively
mortgaged in debt. Treasury secretary Henry Rotich
has maintained that the level of Kenya’s public debt
is sustainable at just above 50 per cent of GDP.
According to the National Treasury latest update,
public debt stood at Kshs.2.844 trillion at the end of
the last financial year (2014/15) 49.75 per cent of
GDP, compared to Kshs. 2.934 trillion or 51 per cent
of GDP recorded at the end of August 2015. This
increase is attributed to increased disbursements on
external debt and depreciation of Kenya shilling
against all major foreign currencies.
This is the Third (3) e-news quarterly
publication of the Agriculture,
Fisheries and Food Authority. It gives
insights into how the period (July –
September 2015) performed, focusing
on the economy, agricultural
performance and commodity price
indicators.
In the first quarter of this year, we used all our tax
revenues to service public debt leading to the
current funding crisis for government. The
government has announced plans to borrow Kshs.
80 billion from abroad which, depending on the
exchange rate, could push public debt to Kshs. 3
trillion.
The Treasury further said that it increased external
debt because it is cheaper or concessional with a
grace period beyond 6 years. Kenya’s domestic debt
market has no grace period, while the cost has been
rising swiftly in the past few months due to high
interest rates.
Treasury secretary Henry Rotich has recently said
the cash crunch is only a temporary problem relating
to the difficult borrowing and economic conditions.
The agricultural sector is still a key driver in Kenya’s
economic growth. As such, there is need to focus on
smart innovative agriculture to cushion Kenyans
from the harsh realities of a tight economy.
1st Quarter e-news Bulletin
(July - September 2015)

Page 3 of 12
2. Weather
In Kenya, the period October - December is an
important season mainly characterized by the short
rains. But according to the weather forecasts, it is
expected that most parts of the country will receive
enhanced rainfalls during the quarter which may
extend into January 2016 in some parts of the country.
The Kenya Meteorological Department has issued a
warning of possible El Niño from October 2015 -
January 2016. It is likely that extreme events related
to heavy rainfall like floods, land and mud slides might
occur in areas with increased likelihood of enhanced
rainfall.
Many people leaving in flood prone areas have been
advised to move to higher grounds to avoid the
negative effects of heavy downpour.
Adverse effects of the climatic change worldwide
According to the Oxfam`s report entitled Entering
Uncharted Waters, millions of poor people will face
starvation and poverty this year and next year due to
droughts and erratic rainfall as global temperatures
reach new records. The situation will be further
worsened by the onset of a powerful El Niño expected
to commence in the coming months to last until early
January 2016.
The report further says that Ethiopia is facing a major
crisis in that; 4.5 million people are in need of food aid
because of successive poor rains this year.
Floods, followed by drought, have cut Malawi’s
maize between two and three million people may
face a food security crisis by February 2016, at the
peak of the lean season.
In Zimbabwe, drought has reduced the maize
harvest by 35 per cent, and it is estimated that 1.5
million people will need assistance in early 2016.
Farmers across the ‘dry corridor’ of Central America
have been hit by drought for two years running,
with huge harvest losses. Disruption to maize
production in both Southern Africa and Central
America is driving a surge in the price of maize on
local markets, making it increasingly hard for
people living in poverty to afford sufficient food.
Over the next few months the El Niño will attain
maximum strength. This will coincide with the rainy
season in Southern Africa, due from November.
Meteorologists predict a high probability of below -
average rains again as a result.
A second successive poor rainy season across
Southern Africa will bring serious food security
problems next year. The next rains in northern
Ethiopia from March may also be affected.
Page 4 of 12
El Niño has also already reduced the Asian monsoon
over India, and is raising the odds of a prolonged
drought in East Asia, coinciding with the planting and
early development of the main rice crop in Indonesia,
if world prices for rice increase there could be knock
-on effects on poor dependent West African
countries.
The report came just one week after world leaders
adopted an historic new goal of eradicating hunger by
2030, as part of the package of Sustainable
Development Goals (SDGs), this unfolding crisis
shows the scale of threat that climate change poses
to its realization. For those leaders, the first test of
their commitment will be to strike an agreement at
the UN climate talks in Paris in December 2015 that
delivers for the women, men and children on the
frontlines of climate change.
3. Agriculture
Tea: The Kenya Tea Development Agency Holdings
Limited (KTDA), has announced Ksh 63.6 billion in
farmers’ earnings for the 2014/15 FY, which
represents a 21 per cent increment from the Ksh. 52.6
billion earned in the 2013/14 FY. The increase was
attributed to low tea supply in the 2nd half of the FY
as well as improved tea prices and favorable
exchange rates. The reduction in supply especially in
the 1st half of 2015 was caused by a prolonged dry
spell earlier in the year, where production reduced by
6 per cent, pushing up the auction prices.
Of the Kshs 63.6 billion, Ksh 43.25 billion will be paid
out to smallholder tea farmers as bonuses. The
weakening of the Kenyan currency against the dollar
has also boosted farmers’ earnings.
Sugarcane: Sugarcane farmers got a reprieve
through President Uhuru Kenyatta’s announcement
that the Kshs. 40 billion debt owed by sugar factories
be written off.
“My Government has had to take a hard decision to
support the sector. In this regard, we approved the
writing-off of up to KSh 39.7 billion owed to the Sugar
Development Levy Fund by the sugar companies
earmarked for privatization. In return, I expect to see
accountability and diligence from those who run the
sugar companies,” President Kenyatta said.
He further iterated that the government would
do everything within its power to help cane farming
get back on its feet in order to improve the livelihoods
of the cane farmers’ people.
The sugar millers are ridden in massive debt and are
in need of modernisation if they are to survive
competition from cheap sugar imports by
from Common Market for Eastern and Southern
Africa (COMESA) and other countries such as India
and Brazil. Already, Muhoroni and Miwani are under
receivership.
Page 5 of 12
4. Agricultural Performance
(i) Selected Food Crops Prices
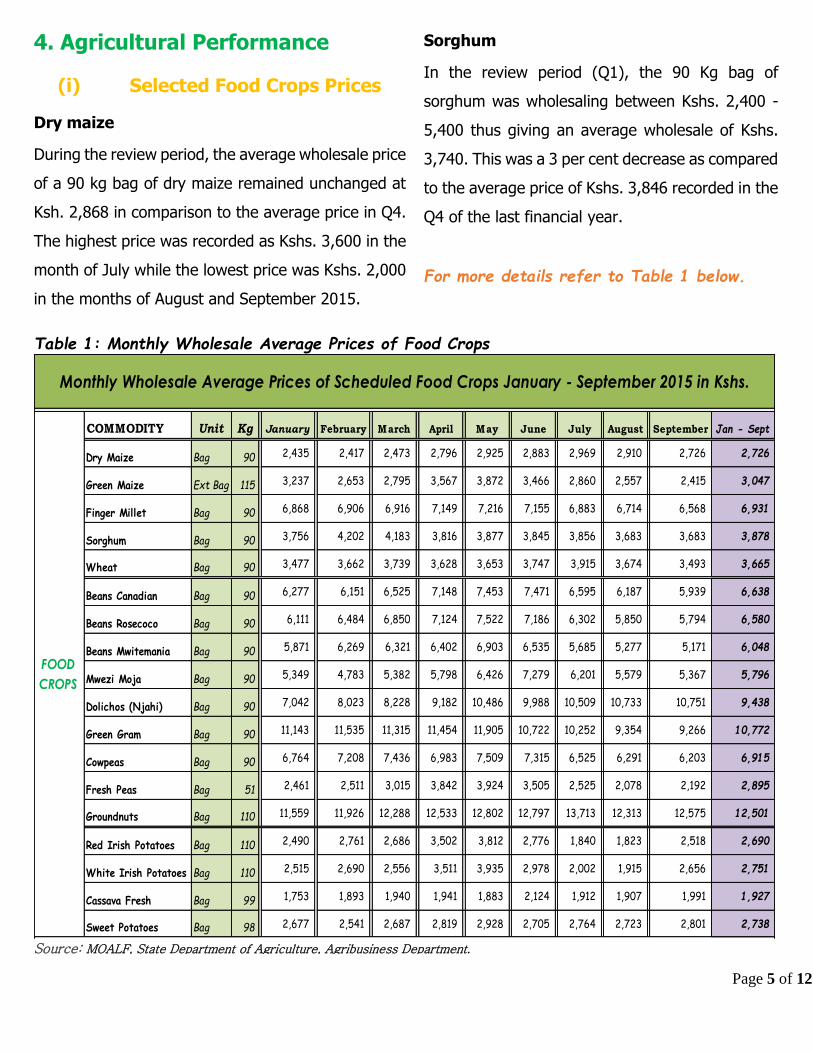
Dry maize
During the review period, the average wholesale price
of a 90 kg bag of dry maize remained unchanged at
Ksh. 2,868 in comparison to the average price in Q4.
The highest price was recorded as Kshs. 3,600 in the
month of July while the lowest price was Kshs. 2,000
in the months of August and September 2015.
Sorghum
In the review period (Q1), the 90 Kg bag of
sorghum was wholesaling between Kshs. 2,400 -
5,400 thus giving an average wholesale of Kshs.
3,740. This was a 3 per cent decrease as compared
to the average price of Kshs. 3,846 recorded in the
Q4 of the last financial year.
For more details refer to Table 1 below.
Table 1: Monthly Wholesale Average Prices of Food Crops
Source: MOALF, State Department of Agriculture, Agribusiness Department.
COMMODITY Unit Kg January February March April May June July August September Jan - Sept
Dry Maize Bag 90 2,435 2,417 2,473 2,796 2,925 2,883 2,969 2,910 2,726 2,726
Green Maize Ext Bag 115 3,237 2,653 2,795 3,567 3,872 3,466 2,860 2,557 2,415 3,047
Finger Millet Bag 90 6,868 6,906 6,916 7,149 7,216 7,155 6,883 6,714 6,568 6,931
Sorghum Bag 90 3,756 4,202 4,183 3,816 3,877 3,845 3,856 3,683 3,683 3,878
Wheat Bag 90 3,477 3,662 3,739 3,628 3,653 3,747 3,915 3,674 3,493 3,665
Beans Canadian Bag 90 6,277 6,151 6,525 7,148 7,453 7,471 6,595 6,187 5,939 6,638
Beans Rosecoco Bag 90 6,111 6,484 6,850 7,124 7,522 7,186 6,302 5,850 5,794 6,580
Beans Mwitemania Bag 90 5,871 6,269 6,321 6,402 6,903 6,535 5,685 5,277 5,171 6,048
Mwezi Moja Bag 90 5,349 4,783 5,382 5,798 6,426 7,279 6,201 5,579 5,367 5,796
Dolichos (Njahi) Bag 90 7,042 8,023 8,228 9,182 10,486 9,988 10,509 10,733 10,751 9,438
Green Gram Bag 90 11,143 11,535 11,315 11,454 11,905 10,722 10,252 9,354 9,266 10,772
Cowpeas Bag 90 6,764 7,208 7,436 6,983 7,509 7,315 6,525 6,291 6,203 6,915
Fresh Peas Bag 51 2,461 2,511 3,015 3,842 3,924 3,505 2,525 2,078 2,192 2,895
Groundnuts Bag 110 11,559 11,926 12,288 12,533 12,802 12,797 13,713 12,313 12,575 12,501
Red Irish Potatoes Bag 110 2,490 2,761 2,686 3,502 3,812 2,776 1,840 1,823 2,518 2,690
White Irish Potatoes Bag 110 2,515 2,690 2,556 3,511 3,935 2,978 2,002 1,915 2,656 2,751
Cassava Fresh Bag 99 1,753 1,893 1,940 1,941 1,883 2,124 1,912 1,907 1,991 1,927
Sweet Potatoes Bag 98 2,677 2,541 2,687 2,819 2,928 2,705 2,764 2,723 2,801 2,738
FOOD
CROPS
Monthly Wholesale Average Prices of Scheduled Food Crops January - September 2015 in Kshs.
Page 6 of 12
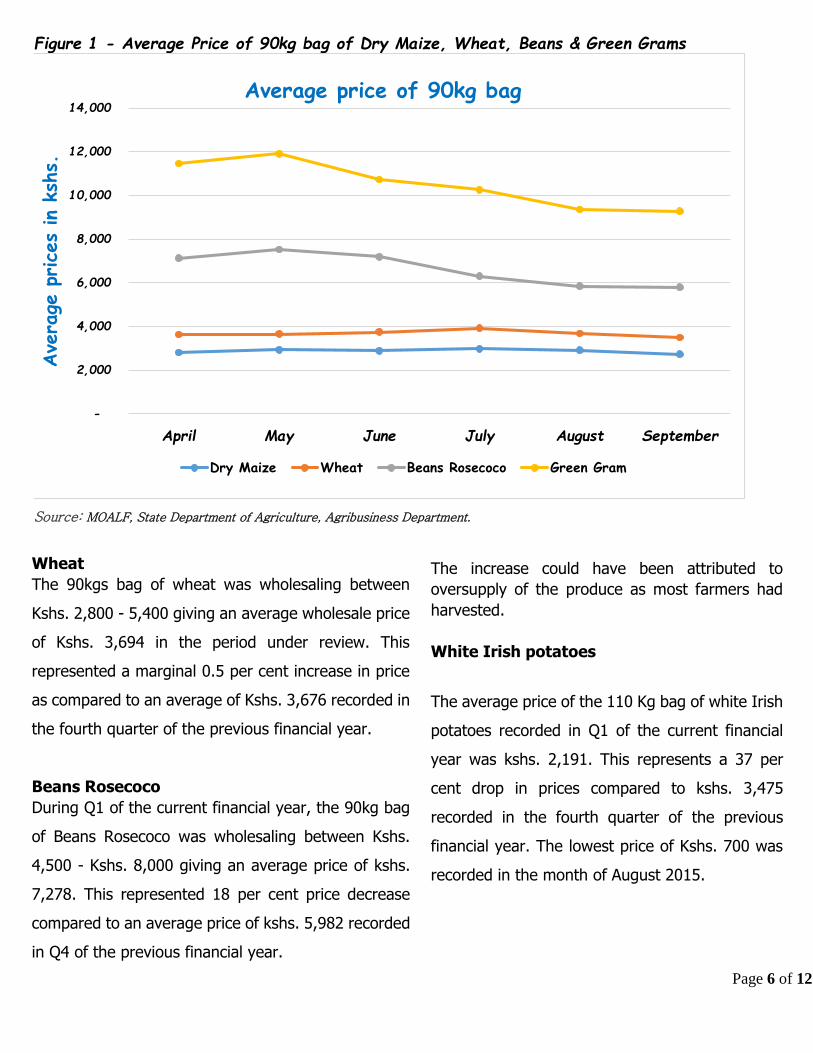
Wheat
The 90kgs bag of wheat was wholesaling between
Kshs. 2,800 - 5,400 giving an average wholesale price
of Kshs. 3,694 in the period under review. This
represented a marginal 0.5 per cent increase in price
as compared to an average of Kshs. 3,676 recorded in
the fourth quarter of the previous financial year.
Beans Rosecoco
During Q1 of the current financial year, the 90kg bag
of Beans Rosecoco was wholesaling between Kshs.
4,500 - Kshs. 8,000 giving an average price of kshs.
7,278. This represented 18 per cent price decrease
compared to an average price of kshs. 5,982 recorded
in Q4 of the previous financial year.
Figure 1 - Average Price of 90kg bag of Dry Maize, Wheat, Beans & Green Grams
Source: MOALF, State Department of Agriculture, Agribusiness Department.
-
2,000
4,000
6,000
8,000
10,000
12,000
14,000
April May June July August September
Ave
rage
price
s in k
shs.
Average price of 90kg bag
Dry Maize Wheat Beans Rosecoco Green Gram
The increase could have been attributed to
oversupply of the produce as most farmers had
harvested.
White Irish potatoes
The average price of the 110 Kg bag of white Irish
potatoes recorded in Q1 of the current financial
year was kshs. 2,191. This represents a 37 per
cent drop in prices compared to kshs. 3,475
recorded in the fourth quarter of the previous
financial year. The lowest price of Kshs. 700 was
recorded in the month of August 2015.
Page 7 of 12
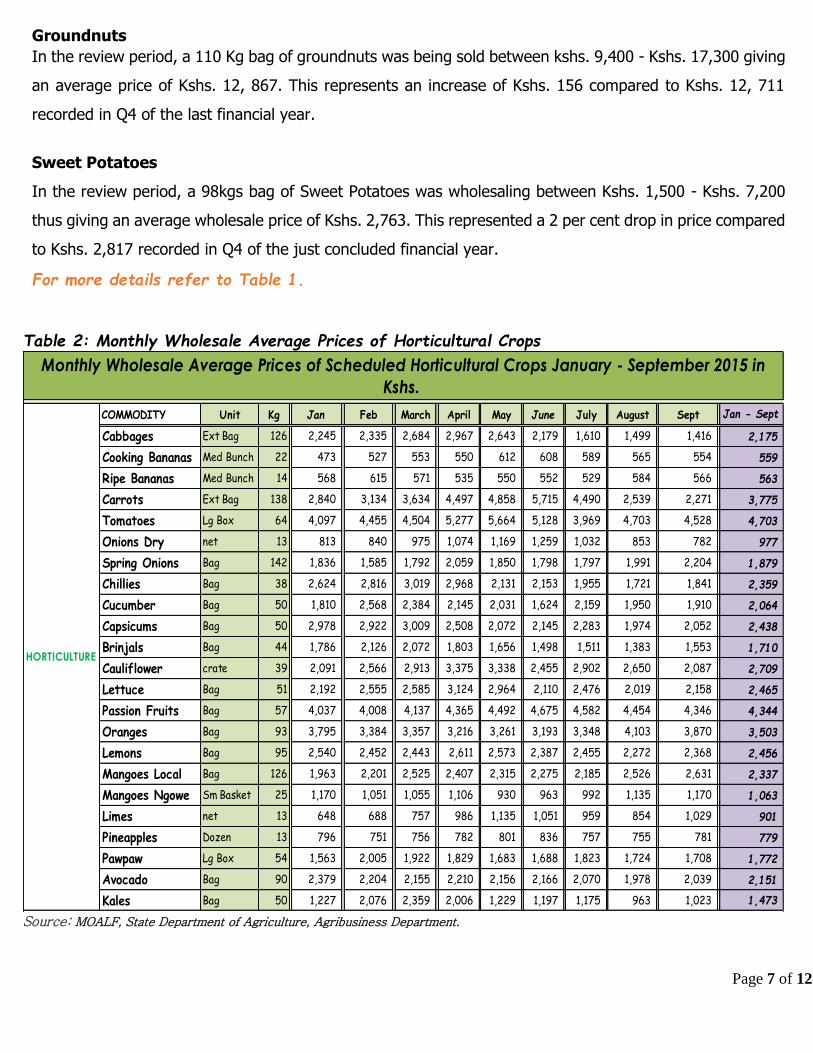
Groundnuts
In the review period, a 110 Kg bag of groundnuts was being sold between kshs. 9,400 - Kshs. 17,300 giving
an average price of Kshs. 12, 867. This represents an increase of Kshs. 156 compared to Kshs. 12, 711
recorded in Q4 of the last financial year.
Sweet Potatoes
In the review period, a 98kgs bag of Sweet Potatoes was wholesaling between Kshs. 1,500 - Kshs. 7,200
thus giving an average wholesale price of Kshs. 2,763. This represented a 2 per cent drop in price compared
to Kshs. 2,817 recorded in Q4 of the just concluded financial year.
For more details refer to Table 1.
Table 2: Monthly Wholesale Average Prices of Horticultural Crops
Source: MOALF, State Department of Agriculture, Agribusiness Department.
COMMODITY Unit Kg Jan Feb March April May June July August Sept Jan - Sept
Cabbages Ext Bag 126 2,245 2,335 2,684 2,967 2,643 2,179 1,610 1,499 1,416 2,175
Cooking Bananas Med Bunch 22 473 527 553 550 612 608 589 565 554 559
Ripe Bananas Med Bunch 14 568 615 571 535 550 552 529 584 566 563
Carrots Ext Bag 138 2,840 3,134 3,634 4,497 4,858 5,715 4,490 2,539 2,271 3,775
Tomatoes Lg Box 64 4,097 4,455 4,504 5,277 5,664 5,128 3,969 4,703 4,528 4,703
Onions Dry net 13 813 840 975 1,074 1,169 1,259 1,032 853 782 977
Spring Onions Bag 142 1,836 1,585 1,792 2,059 1,850 1,798 1,797 1,991 2,204 1,879
Chillies Bag 38 2,624 2,816 3,019 2,968 2,131 2,153 1,955 1,721 1,841 2,359
Cucumber Bag 50 1,810 2,568 2,384 2,145 2,031 1,624 2,159 1,950 1,910 2,064
Capsicums Bag 50 2,978 2,922 3,009 2,508 2,072 2,145 2,283 1,974 2,052 2,438
Brinjals Bag 44 1,786 2,126 2,072 1,803 1,656 1,498 1,511 1,383 1,553 1,710
Cauliflower crate 39 2,091 2,566 2,913 3,375 3,338 2,455 2,902 2,650 2,087 2,709
Lettuce Bag 51 2,192 2,555 2,585 3,124 2,964 2,110 2,476 2,019 2,158 2,465
Passion Fruits Bag 57 4,037 4,008 4,137 4,365 4,492 4,675 4,582 4,454 4,346 4,344
Oranges Bag 93 3,795 3,384 3,357 3,216 3,261 3,193 3,348 4,103 3,870 3,503
Lemons Bag 95 2,540 2,452 2,443 2,611 2,573 2,387 2,455 2,272 2,368 2,456
Mangoes Local Bag 126 1,963 2,201 2,525 2,407 2,315 2,275 2,185 2,526 2,631 2,337
Mangoes Ngowe Sm Basket 25 1,170 1,051 1,055 1,106 930 963 992 1,135 1,170 1,063
Limes net 13 648 688 757 986 1,135 1,051 959 854 1,029 901
Pineapples Dozen 13 796 751 756 782 801 836 757 755 781 779
Pawpaw Lg Box 54 1,563 2,005 1,922 1,829 1,683 1,688 1,823 1,724 1,708 1,772
Avocado Bag 90 2,379 2,204 2,155 2,210 2,156 2,166 2,070 1,978 2,039 2,151
Kales Bag 50 1,227 2,076 2,359 2,006 1,229 1,197 1,175 963 1,023 1,473
HORTICULTURE
Monthly Wholesale Average Prices of Scheduled Horticultural Crops January - September 2015 in
Kshs.
Page 8 of 12
(ii) Selected Horticultural Crops Prices
Cabbages
The 126 kgs bag of cabbage was selling at an
average wholesale price of Kshs. 1,508 in the period
under review. This represented a 42 per cent
decrease in price as compared to an average of Kshs.
2,596 recorded in the fourth quarter of the previous
financial year.
Tomatoes
In the review period, a 64 Kg large box of tomatoes
was being sold an average wholesale price of Kshs.
4,400. This represented a decrease of Kshs. 956
from Kshs. 5,356 recorded in Q4 of the last financial
year.
Carrots
In the quarter, the 138 kgs bag of carrots was selling
at an average wholesale price of kshs. 3,100. This
represented 38 per cent price decrease from an
average price of kshs. 5,023 recorded in Q4 of the
previous financial year.
Onions Dry
In the review period, a 13 Kgs Net of onions dry was
wholesaling at an average price of Kshs. 1,167 23
per cent drop from Kshs. 889 recorded in Q4 of last
year.
Kales
A 50 Kg bag of Kales was wholesaling at Kshs. 1,054
a decrease of Kshs. 423 from that recorded in Q4 of
the last financial year.
Oranges
A 93kg bag of oranges was selling at an average
wholesale price of kshs. 3,774, 17 per cent price
increase from kshs. 3,223 recorded in Q4 of the
previous financial year.
For more details refer to Table 2.
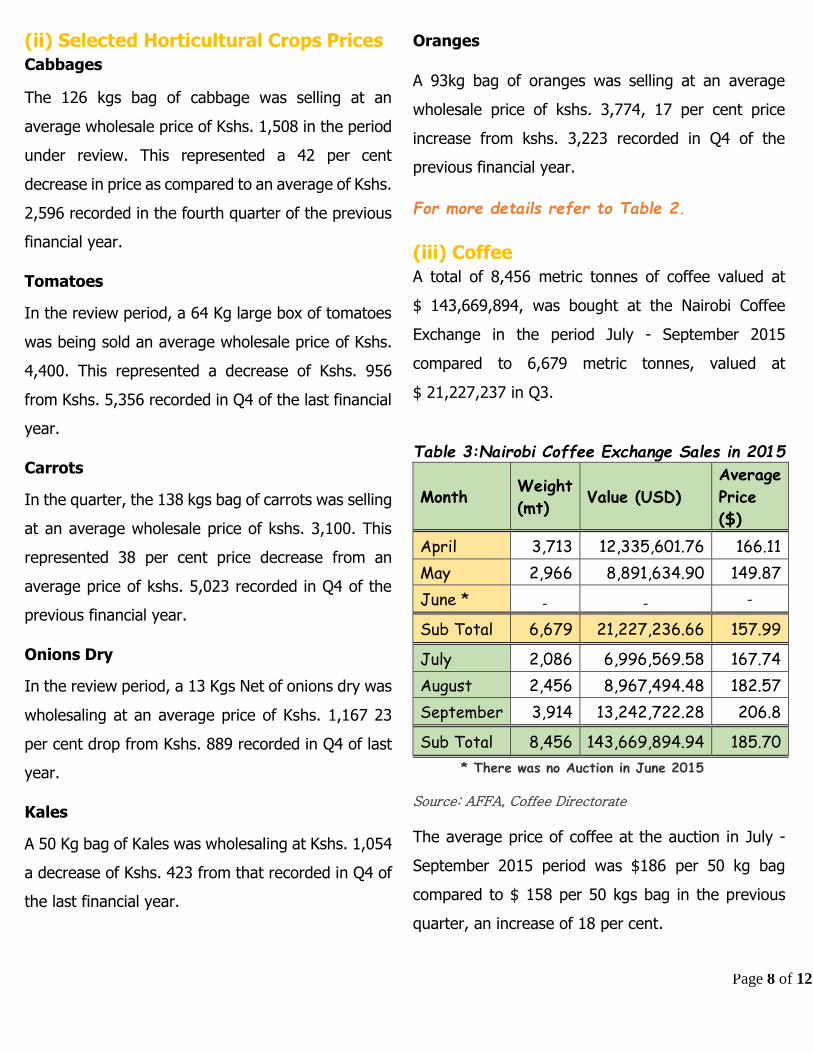
(iii) Coffee
A total of 8,456 metric tonnes of coffee valued at
$ 143,669,894, was bought at the Nairobi Coffee
Exchange in the period July - September 2015
compared to 6,679 metric tonnes, valued at
$ 21,227,237 in Q3.
Table 3:Nairobi Coffee Exchange Sales in 2015
Month Weight
(mt) Value (USD)
Average
Price
($)
April 3,713 12,335,601.76 166.11
May 2,966 8,891,634.90 149.87
June * - - -
Sub Total 6,679 21,227,236.66 157.99
July 2,086 6,996,569.58 167.74
August 2,456 8,967,494.48 182.57
September 3,914 13,242,722.28 206.8
Sub Total 8,456 143,669,894.94 185.70
* There was no Auction in June 2015
Source: AFFA, Coffee Directorate
The average price of coffee at the auction in July -
September 2015 period was $186 per 50 kg bag
compared to $ 158 per 50 kgs bag in the previous
quarter, an increase of 18 per cent.
Page 9 of 12
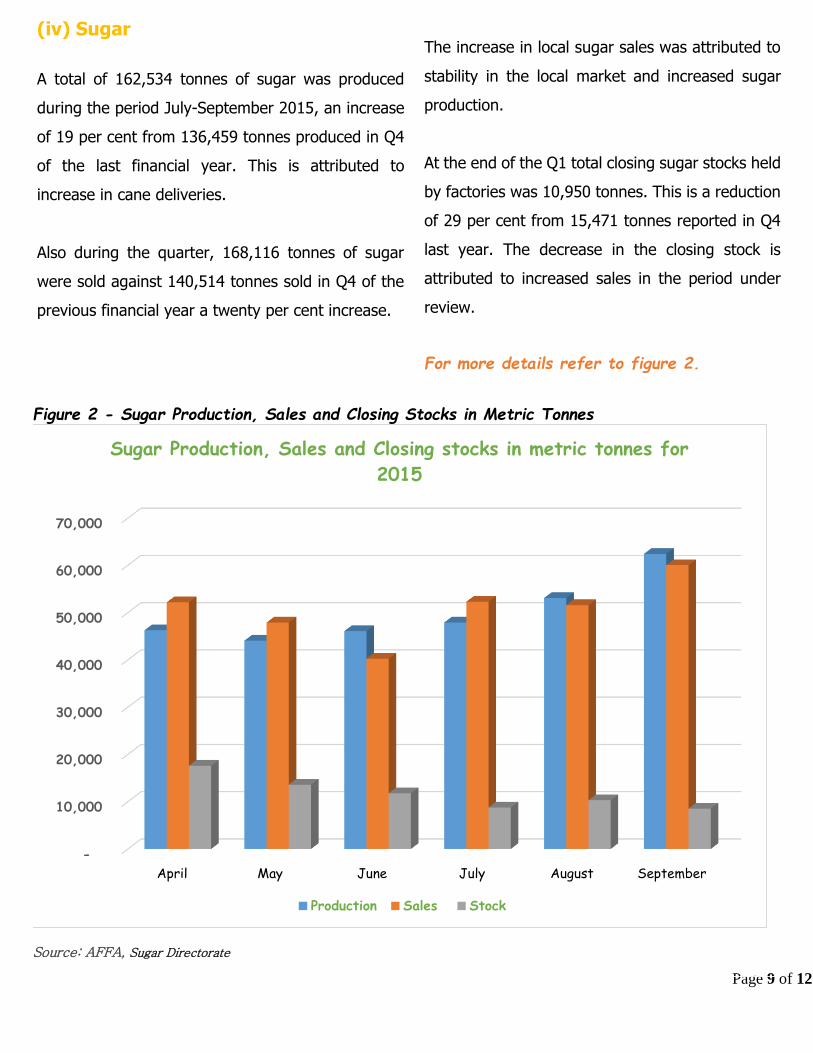
(iv) Sugar
A total of 162,534 tonnes of sugar was produced
during the period July-September 2015, an increase
of 19 per cent from 136,459 tonnes produced in Q4
of the last financial year. This is attributed to
increase in cane deliveries.
Also during the quarter, 168,116 tonnes of sugar
were sold against 140,514 tonnes sold in Q4 of the
previous financial year a twenty per cent increase.
The increase in local sugar sales was attributed to
stability in the local market and increased sugar
production.
At the end of the Q1 total closing sugar stocks held
by factories was 10,950 tonnes. This is a reduction
of 29 per cent from 15,471 tonnes reported in Q4
last year. The decrease in the closing stock is
attributed to increased sales in the period under
review.
For more details refer to figure 2.
Figure 2 - Sugar Production, Sales and Closing Stocks in Metric Tonnes
Source: AFFA, Sugar Directorate
-
10,000
20,000
30,000
40,000
50,000
60,000
70,000
April May June July August September
Sugar Production, Sales and Closing stocks in metric tonnes for
2015
Production Sales Stock
Page 10 of 12
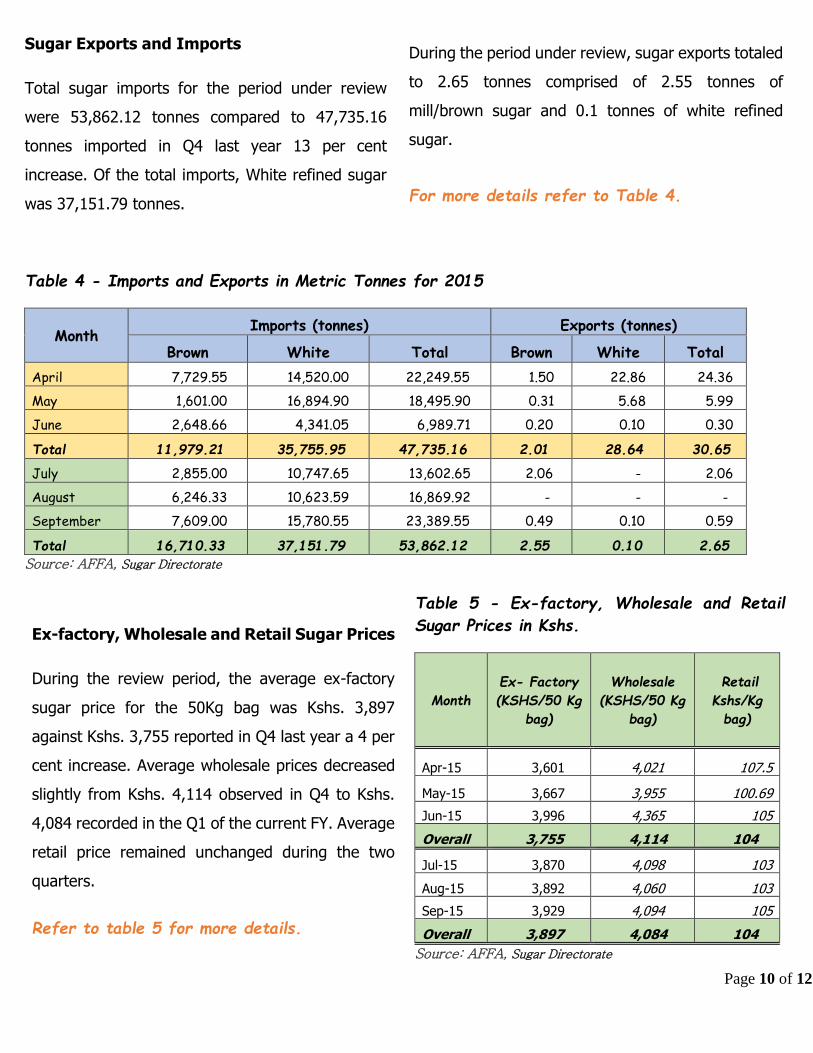
Ex-factory, Wholesale and Retail Sugar Prices
During the review period, the average ex-factory
sugar price for the 50Kg bag was Kshs. 3,897
against Kshs. 3,755 reported in Q4 last year a 4 per
cent increase. Average wholesale prices decreased
slightly from Kshs. 4,114 observed in Q4 to Kshs.
4,084 recorded in the Q1 of the current FY. Average
retail price remained unchanged during the two
quarters.
Refer to table 5 for more details.
Table 5 - Ex-factory, Wholesale and Retail
Sugar Prices in Kshs.
Month
Ex- Factory
(KSHS/50 Kg
bag)
Wholesale
(KSHS/50 Kg
bag)
Retail
Kshs/Kg
bag)
Apr-15 3,601 4,021 107.5
May-15 3,667 3,955 100.69
Jun-15 3,996 4,365 105
Overall 3,755 4,114 104
Jul-15 3,870 4,098 103
Aug-15 3,892 4,060 103
Sep-15 3,929 4,094 105
Overall 3,897 4,084 104
Source: AFFA, Sugar Directorate
Sugar Exports and Imports
Total sugar imports for the period under review
were 53,862.12 tonnes compared to 47,735.16
tonnes imported in Q4 last year 13 per cent
increase. Of the total imports, White refined sugar
was 37,151.79 tonnes.
Table 4 - Imports and Exports in Metric Tonnes for 2015
Month Imports (tonnes) Exports (tonnes)
Brown White Total Brown White Total
April 7,729.55 14,520.00 22,249.55 1.50 22.86 24.36
May 1,601.00 16,894.90 18,495.90 0.31 5.68 5.99
June 2,648.66 4,341.05 6,989.71 0.20 0.10 0.30
Total 11,979.21 35,755.95 47,735.16 2.01 28.64 30.65
July 2,855.00 10,747.65 13,602.65 2.06 - 2.06
August 6,246.33 10,623.59 16,869.92 - - -
September 7,609.00 15,780.55 23,389.55 0.49 0.10 0.59
Total 16,710.33 37,151.79 53,862.12 2.55 0.10 2.65
Source: AFFA, Sugar Directorate
During the period under review, sugar exports totaled
to 2.65 tonnes comprised of 2.55 tonnes of
mill/brown sugar and 0.1 tonnes of white refined
sugar.
For more details refer to Table 4.
Page 11 of 12
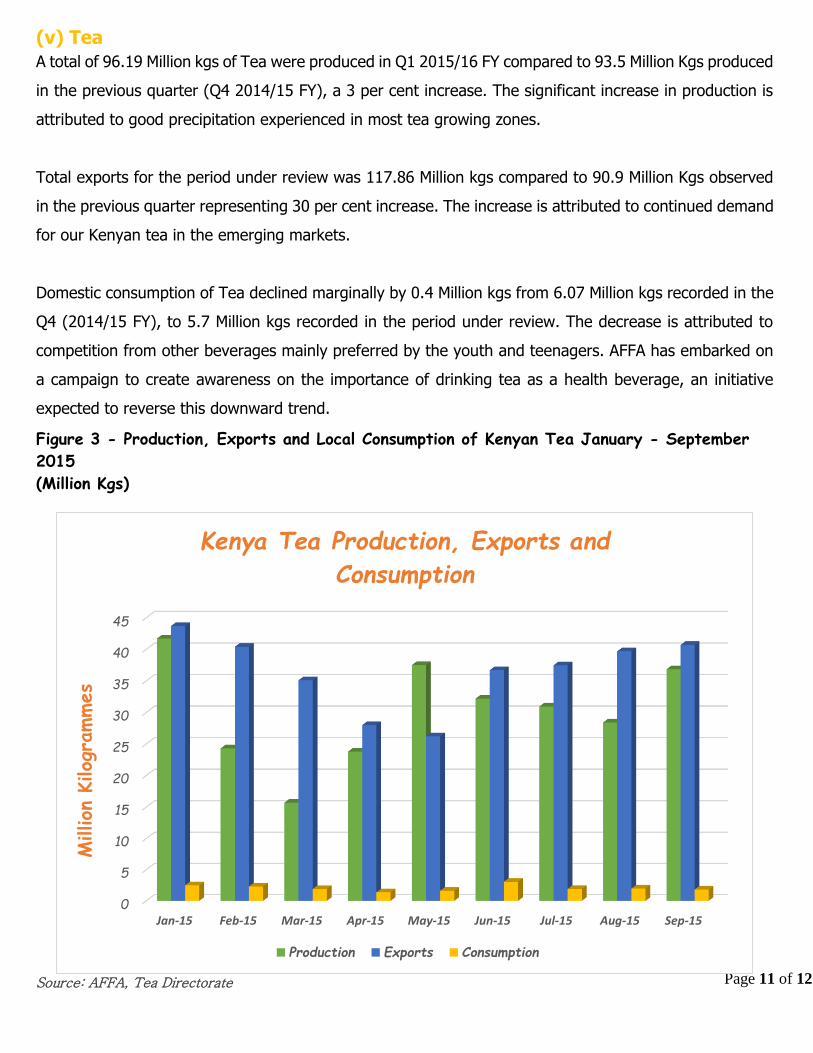
(v) Tea
A total of 96.19 Million kgs of Tea were produced in Q1 2015/16 FY compared to 93.5 Million Kgs produced
in the previous quarter (Q4 2014/15 FY), a 3 per cent increase. The significant increase in production is
attributed to good precipitation experienced in most tea growing zones.
Total exports for the period under review was 117.86 Million kgs compared to 90.9 Million Kgs observed
in the previous quarter representing 30 per cent increase. The increase is attributed to continued demand
for our Kenyan tea in the emerging markets.
Domestic consumption of Tea declined marginally by 0.4 Million kgs from 6.07 Million kgs recorded in the
Q4 (2014/15 FY), to 5.7 Million kgs recorded in the period under review. The decrease is attributed to
competition from other beverages mainly preferred by the youth and teenagers. AFFA has embarked on
a campaign to create awareness on the importance of drinking tea as a health beverage, an initiative
expected to reverse this downward trend.
Figure 3 - Production, Exports and Local Consumption of Kenyan Tea January - September
2015
(Million Kgs)
Source: AFFA, Tea Directorate
0
5
10
15
20
25
30
35
40
45
Jan-15 Feb-15 Mar-15 Apr-15 May-15 Jun-15 Jul-15 Aug-15 Sep-15
Million
Kilog
rammes
Kenya Tea Production, Exports and
Consumption
Production Exports Consumption

Page 12 of 12
(Vi) Pyrethrum
A total of 84,614 kilograms of dry pyrethrum flowers were collected in the review period compared to
59,634 kilograms collected in the previous quarter a 42 per cent increase. The significant increase is
attributed to good precipitation experienced in most pyrethrum growing zones.
Figure 4 – Dry Flowers Collected in 2015
Source: AFFA, Pyrethrum & Other Industrial Crops Directorate
Strategies in place to increase the acreage under pyrethrum
During the month of June 2015, the government allocated the Directorate Kshs. 30 million for distribution
of planting material across all the pyrethrum growing areas in the country. A total of 998,683 plantlets have
been distributed so far which has led to an overall expansion by 227 acres as shown in Table 6 below.
Table 6: No. of Pyrethrum Plantlets Distributed
Period No. of plantlets distributed
As at August 2015 939,263
September 2015 59,420
Total 998,683 Source: AFFA, Pyrethrum & Other Industrial Crops Directorate
However, it is important to note that pyrethrum plantlets distribution process is still on going.
-
5,000
10,000
15,000
20,000
25,000
30,000
35,000
40,000
45,000
Kgs
2015
Dry flowers collected