teacher and principal diversity and the representation of students of color in gifted programs
DESCRIPTION
This paper was presented at this month's meeting of the American Educational Research Association.TRANSCRIPT

1
Teacher and Principal Diversity and the Representation of Students of Color in Gifted Programs: Evidence from National Data
Jason A. Grissom Luis A. Rodriguez
Emily C. Kern Vanderbilt University
Prepared for the annual meeting of the American Educational Research Association
April 2015
ABSTRACT Students of color are significantly underrepresented in gifted programs relative to their white peers. Drawing on political science research suggesting that public organizations more equitably distribute policy outputs when service providers share characteristics with their client populations, we investigate whether the representation of students of color in gifted programs is higher in schools with racially/ethnically diverse principals and teachers. In a nationally representative sample of elementary schools created by merging two waves of data from the Civil Rights Data Collection and the Schools and Staffing Survey, we find that schools with larger numbers of black teachers or a black principal have greater representation of black students in their gifted programs. We find a similar relationship for Hispanic teachers and representation of Hispanic students. Further evidence suggests that a critical mass of teachers of color is necessary for teacher race/ethnicity to be associated with higher minority representation in gifted programs.
***
Since at least the late 1960s, research has consistently documented the substantial
underrepresentation of students of color in gifted programs (Ford, 1998). Recent data show, for
example, that black students are only 59% as likely to receive gifted services as would be
predicted if their gifted participation was proportionate to their presence in the broader student
population.1 To receive gifted services, students must go through multiple steps, including
identification as potentially gifted, referral for evaluation, and the evaluation itself, and research
suggests that students of color are less likely to pass through each of these stages than their white
peers (McBee, 2006; National Research Council, 2002). Reasons for these disparities are
complex but include unequal teacher perceptions of student giftedness across student groups

2
(Ford, Grantham, & Whiting, 2008; Hargrove & Seay, 2011) and the use of single, potentially
culturally biased tests to assess giftedness as a unidimensional construct (Ford, Grantham, &
Whiting, 2008; Harris, Brown, Ford, & Richardson, 2004). Less often discussed is the fact that
gifted representation among students of color can vary markedly from school to school, even
among schools with similar student demographic compositions. Some differences are attributable
to state-to-state differences in gifted definitions and identification processes, but even within
states (and even districts), variation in implementation of policy can lead to considerable
disparity in rates of gifted identification (National Research Council, 2002).
Relatively few studies, however, have examined the school-level factors influencing the
rates of placement in gifted programs across different student racial and ethnic groups (Ford,
1998; McBee, Shaunessy, & Matthews, 2012; McBee, 2006). Motivated by the long literature on
what is termed bureaucratic representation in political science, this study focuses on one
particular set of potentially important factors: the demographic characteristics of the school’s
teachers and principal. Bureaucratic representation theory suggests that more descriptively
representative public organizations—i.e., those whose employees share demographic
characteristics with client populations—tend to more equitably distribute policy outputs among
client groups (see AUTHOR, 2015; Kennedy, 2014; Meier, 1993). The potential mechanisms are
varied and include behavioral responses to descriptive representation by both bureaucrats—in
this case, educators—and the clients (students and parents) themselves, including greater
sensitivity of minority bureaucrats to minority client needs, advocacy by minority bureaucrats for
organizational policies that ameliorate past disparities between minority and nonminority clients,
and increased likelihood that minority clients seek out organizational services in the presence of
bureaucrats “like them” (Lim, 2006). Research suggests that often these mechanisms only
3
surface when a “critical mass” of bureaucrats from a minority group are present in the
organization (Henderson, 1979; Kanter, 1977; Thompson, 1976).
Assignment to gifted services may be a particularly likely place to observe the effects of
representation because of the roles subjectivity and discretion play in the assignment process.
Except in the case of universal screening, which is employed in some systems (e.g., Card &
Giuliano, 2014), gifted assignment begins with referral for evaluation, typically by a classroom
teacher, on the basis of the teacher’s perception of the student’s potential for giftedness (McBee,
2006). We may expect teacher race or ethnicity to matter for which students are referred for
testing because, for example, teachers of color may be more attuned to giftedness among racially
and ethnically diverse students due to heightened sensitivity to cultural differences among
students from different groups. This consideration may be especially important given evidence
that teachers are less likely to perceive giftedness among students of color than among white
students even when presented with evidence about the students that is otherwise similar
(Elhoweris, Mutua, Alsheikh, & Holloway, 2005). At the same time, parents from minority
populations may feel more comfortable communicating with teachers from similar backgrounds
and thus more likely to request that students be evaluated for gifted services. Once referred,
students are formally tested using standardized assessments and other metrics, then often a
placement committee, again consisting of teachers and other personnel, such as school
psychologists, reviews the information gathered during evaluation and makes a final
determination of whether the student should be officially designated as gifted (National Research
Council, 2002). Evaluation and placement decisions may present additional opportunities for
teacher representation effects for students of color. For example, teachers of color may be more
likely to express concern about evaluation procedures that disadvantage nonwhite students (e.g.,
4
IQ tests) and advocate for the use of multiple measures of giftedness or other changes to
evaluation and placement procedures that improve the likelihood of the recognition of giftedness
among students of color (Ford, Grantham, & Whiting, 2008;; Joseph & Ford, 2006).
Bureaucratic representation research has also found evidence that the race and ethnicity
of managers in a public organization can affect the distribution of policy outputs (Grissom &
Keiser, 2011; Meier & Stewart, 1992), suggesting that principal race/ethnicity may have effects
on the representation of students of color in a school’s gifted programs as well. Although
principals are less likely than teachers to be directly involved in gifted referral, evaluation, and
placement decisions, recognition of inequities in assignment patterns among white and nonwhite
students may make nonwhite principals more likely to shape school assignment practices to
increase minority gifted representation. By implementing policies such as allowing gifted
nominations from non-teachers, using multiple measures to evaluation giftedness, and providing
multicultural training to teachers to help circumvent biases in the identification process,
principals are positioned to influence minority representation within gifted programs (Harris et
al., 2004; Joseph & Ford, 2006; Matthews & Shaunessy, 2010; McBee, Shaunessy, & Matthews,
2012).
Investigation of connections between the diversity of a school’s educators and the
representation of students of color in gifted programs is particularly important in light of the
growing mismatch between teacher and student demographics in American schools (AUTHOR,
2015; Boser, 2014). Some earlier bureaucratic representation research has linked teacher
workforce diversity to greater rates of gifted participation among black and Hispanic students,
though this research has been published outside of education and remains unfamiliar to education
scholars (e.g., Nicholson-Crotty, Grissom, & Nicholson-Crotty, 2011; Rocha & Hawes, 2009).

5
The purpose of this study is to build on and extend this prior work in several key ways. First, we
investigate connections between teacher racial/ethnic diversity and gifted representation using
the most recently available national data (from the 2011-12 school year) to test whether
associations between teacher demographic characteristics and gifted composition observed with
earlier data remain relevant and how they may have changed. More specifically, we ask: to what
extent are the proportions of black and Hispanic teachers in a school associated with the racial
composition of students assigned to gifted programs? Second, we investigate the critical mass
phenomenon observed in representation studies in other organizational settings. That is, we ask:
is there evidence that a critical number of teachers of color must be present in a school before
teacher race/ethnicity becomes associated with the racial/ethnic composition of the school’s
gifted program? Third, we explore whether the race/ethnicity of the school’s principal is
associated with gifted representation, even after controlling for the characteristics of the teacher
workforce, a possibility not considered in prior empirical work. Specifically, we ask whether
schools with black or Hispanic principals have gifted programs that are more representative of
students from those racial/ethnic backgrounds and, furthermore, whether principal race/ethnicity
moderates the connection between teacher diversity and the composition of the school’s gifted
programs.
We begin by discussing bureaucratic representation theory as a framework for
understanding the connection between the demographic diversity of a school’s faculty and
differential gifted placement rates for white students and students of color. We then discuss our
data and methods before turning to a presentation of the study’s results. The final section
concludes with a discussion of the implications of the findings for policy and practice in the area

6
of gifted education and efforts to increase equity in the provision of school services more
generally. We also discuss study limitations and ideas for future work.
Bureaucratic Representation Theory and Application to Gifted Placement
We draw on bureaucratic representation theory, a well-established theoretical framework
in the fields of political science and public administration literature, to guide our investigation
into how teacher and principal roles in the identification, referral, and evaluation processes for
gifted programs may connect educator diversity to disparate rates of gifted placement across
different racial groups. Representation scholarship begins from the observation that the
composition of the public bureaucracy influences the implementation of public policy; that is,
who the providers of government services are matters for how policy outputs are distributed. In
particular, scholars examining a variety of contexts have repeatedly made empirical connections
between descriptive representation in the bureaucratic workforce—that is, the degree to which
public sector workers share demographic characteristics such as race, ethnicity, or gender with
the populations they serve—and greater access to policy outputs for traditionally disadvantaged
groups (AUTHOR, 2015). As one example, in one study, Equal Employment Opportunity
Commission field offices employing more black and Hispanic investigators were shown to bring
a greater number of charges on behalf of black and Hispanic complainants (Hindera, 1993).
These connections have also been made in prior research on representation in schools
(see AUTHOR, 2015, for a review). Bureaucracy scholars have long looked towards teachers as
quintessential street-level bureaucrats—government professionals who, like police officers or
social workers, work directly with client populations (i.e., students and their families) in roles
with substantial discretion and autonomy (Lipsky, 1980)—and thus viewed schools as verdant
ground for testing many areas of bureaucratic theory. Work in this tradition has linked a larger
7
presence of black and Hispanic teachers to improved treatment or outcomes for black and
Hispanic students along a variety of dimensions, including lower rates of exclusionary discipline
(Meier & Stewart, 1992; Grissom, Nicholson-Crotty, & Nicholson-Crotty, 2009), lower
likelihood of placement in special education (Fraga, Meier, & England, 1986; Rocha & Hawes,
2009), and higher pass rates on standardized tests (Meier, Wrinkle, & Polinard, 1999; Weiher,
2000). Researchers also have linked teacher racial and ethnic diversity to placement rates for
nonwhite students in gifted programs (Grissom, Nicholson-Crotty, & Nicholson-Crotty, 2009;
Rocha & Hawes, 2009), particularly in schools where nonwhite students are assigned very
infrequently relative to their proportion in the overall school population (Nicholson-Crotty,
Grissom, & Nicholson-Crotty, 2011).
Researchers have put forth a number of mechanisms through which descriptive
representation provides substantive benefits for underserved client populations, including both
direct actions by the minority bureaucrat and indirect effects minority bureaucrats may have on
the behaviors of their colleagues or the client population itself (Lim, 2006). We illustrate the
main hypothesized mechanisms in the context of assignment to gifted services.
The mechanism most commonly set forth in the literature is that descriptive
representation benefits minority clients because minority bureaucrats exercise discretion towards
them in beneficial ways. Some scholars have expressed concern that this beneficial exercise of
discretion simply reflects bias (Mosher, 1968), as would be the case if an African American
teacher, presented with a white and an African American student of similar capacities, was more
inclined to refer the African American student for gifted evaluation. Others have suggested
instead that shared demographic characteristics proxy for shared background, values, beliefs, or
understanding, which may lead to discretionary actions by minority bureaucrats that benefit
8
minority clients (Lim, 2006). As an example, a Hispanic teacher may be more likely to refer a
Hispanic student to gifted services because linguistic or cultural sensitivity better equips her to
recognize giftedness in Hispanic students.
Other mechanisms linking bureaucratic diversity to improved outcomes for minority
client populations are indirect, operating through changes in the behaviors of others. A minority
teacher may be more attuned to practices within the organization that disadvantage minority
students and thus advocate for changes to those practices, either informally or formally. An
example of the informal case is the nonwhite teacher who pushes her white colleagues to look
closely at nonwhite students for signs of giftedness or provides them with some tips or ideas for
assessing giftedness in culturally diverse students. In the more formal case, a nonwhite teacher
may be more likely to recognize bias towards nonwhite students in tests used for gifted
evaluation and advocate for the school to use a different test (Ford, Grantham, & Whiting, 2008).
In both instances, the presence of nonwhite teachers in the school benefited nonwhite students by
nudging the environment in a direction that increased their probability of success.
Descriptive representation may also benefit minority clients indirectly by changing the
behaviors of the clients themselves. A Hispanic parent may be more likely to approach her
child’s Hispanic teacher to request that the student be referred for gifted services, for example, if
shared language or culture increases the parent’s comfort in making the request. Students with
teachers of similar demographic backgrounds may also perform better on assessments that make
gifted identification more likely. This demographic similarity may improve testing outcomes via
a role modeling effect, wherein students work harder to gain approval from teachers like them
(Lim, 2006), or by reducing stereotype threat, a psychological impediment to performance based

9
on anxiety around stereotypes, which may be more salient in the presence of other-race teachers
(Dee, 2005).
Other research on representation in organizations suggests that the impact of descriptive
representation on outcomes for diverse clients is unlikely in the absence of a critical mass, or
numerical threshold, of bureaucrats from the minority group (Henderson, 1979; Kanter, 1977;
Thompson, 1976). These scholars focus on the impact minority bureaucrats can have on
organizational policies or practices, suggesting that only when minorities have enough of a
presence can they build internal support to effect change (Henderson, 1979; Thompson, 1976).
Representation effects will thus be nonlinear, and in fact a pattern consistent with a critical mass
condition was observed in Hindera’s study of EEOC complaints (see Hindera & Young, 1998).
The threshold for when descriptive representation is likely to matter is unclear. Kanter (1977)
proposed that the minority group must comprise 15% of the organizational workforce before
descriptive representation would produce substantive effects. Critical mass effects have largely
gone ignored in studies of schools, with the exception of one study by Meier (1993), which
found some evidence that the presence of Hispanic principals (but not teachers) begins to have a
positive association with student disciplinary and achievement outcomes only once they
comprise between 16 and 26 percent of school leaders. No studies of which we are aware have
examined the critical mass idea in the context of gifted assignment.
Studies similarly have overlooked the potential for representation effects on gifted
outcomes for school principals. Principals may influence gifted assignments in their schools by
implementing referral and evaluation policies that may increase rates of placement for
underrepresented groups. For example, students in Florida who attended schools with alternative
policies in place to increase gifted representation by nonwhite students had nearly twice the

10
probability of being identified as gifted as students attending schools without these plans
(McBee, Shaunessy, & Matthews, 2012), illustrating a school-level policy change via which
principals might affect the gifted participation of students of color. It is also possible that
nonwhite principals could encourage referral of students of color by providing professional
development to teachers on recognizing giftedness for underserved groups or implementing a
systematic screening process to increase opportunities for identification. A nonwhite principal’s
presence could also make the parent of a student of color more comfortable in requesting a
referral form for their child. Some limited empirical evidence suggests that minority principals
are associated with improved schooling outcomes for minority students in such areas as referral
to special education or graduation rates (Meier, 1993; Meier & Stewart, 1992; Pitts, 2005). This
work suggests that attention to possible principal representation effects in gifted assignments is
warranted as well.
Data
We pair two years of nationally representative data from two sources: the Schools and
Staffing Survey (SASS) and survey data collected by the Office for Civil Rights (OCR) in the
2003-04 school year and again in 2011-12, referred to in the remainder of the study as 2004 and
2012, respectively. We supplement these data with additional district- and school-level
information from the Common Core of Data (CCD). SASS uses a stratified sampling method to
gather information on demographic characteristics, organizational processes, and attitudes of
principals and a random selection of teachers for each school. We merge the SASS data with
survey data administered by the Department of Education’s Office for Civil Rights (OCR),
which also uses a stratified random sampling method to collect information on academic
grouping, discipline, and educational attainment disaggregated by gender and race from
11
approximately schools. Given that students are substantially more likely to be identified for
gifted services in elementary school, we restrict our sample to U.S. public elementary schools
with gifted programs that can be matched between the two samples, then further restrict the
analytic sample to non-charter, non-magnet schools. The final sample size is 2,170 schools.
Approximately 6.2% of elementary students were designated as gifted in the matched sample in
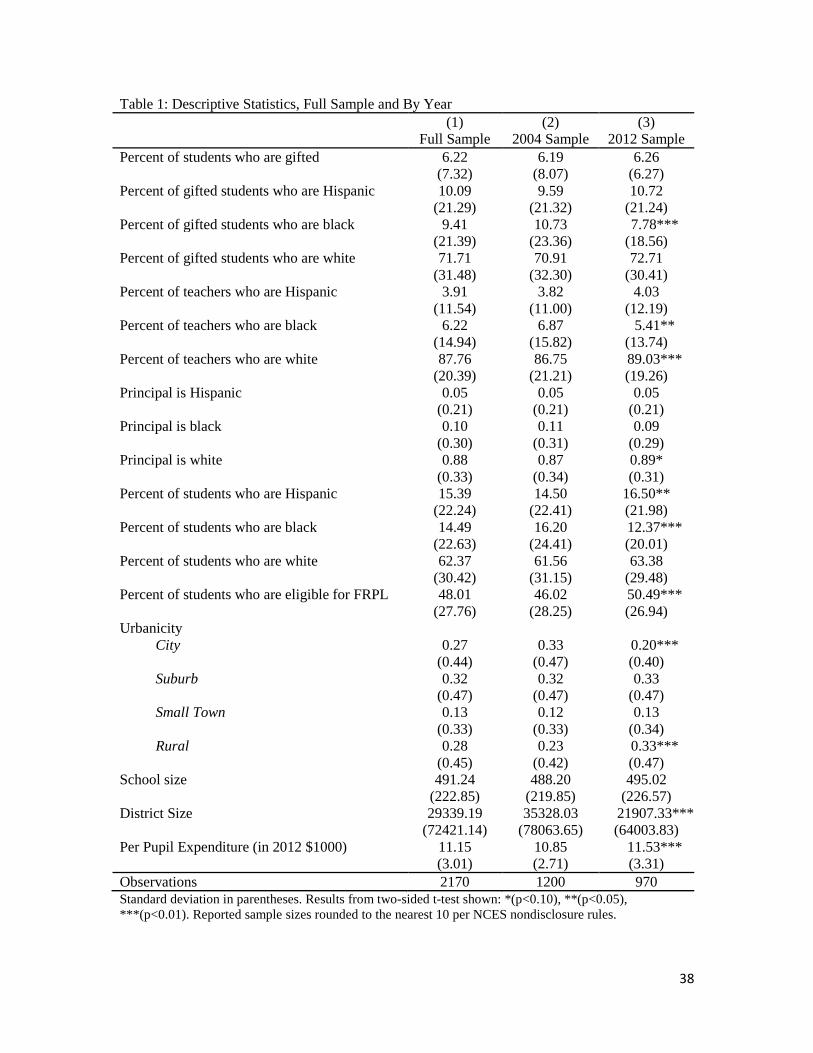
both waves of data. Table 1 provides descriptive statistics for the pooled sample and for each
wave separately, with asterisks in the rightmost column indicating statistically significant
differences between the 2004 and 2012 waves from two-sided t-tests.
Dependent Variables
To measure the presence of students from different racial and ethnic backgrounds in
gifted programs, we follow prior disproportionality work (e.g., McBee, 2006; National Research
Council, 2002) and use a series of composition indices calculated, for each racial/ethnic group,
as the number of students from that group in the school’s gifted program divided by the total
number of gifted students. The composition index of Hispanic students, for example, is simply
the number of Hispanic gifted students in the school divided by the total number of gifted
students. Using OCR data, we calculate composition indices for white, black, and Hispanic
students. As Table 1 shows, the composition of the average elementary school gifted population
within the pooled sample is approximately 72% white, 9% black, and 10% Hispanic, in contrast
to the composition of the average elementary school population at large, which in these data is
62% white, 14% black, and 15% Hispanic.2 These pooled averages, however, mask important
changes between the samples over the two waves. In particular, the fraction of the average
school’s gifted population that is black fell from nearly 11% in 2004 to only about 8% in 2012 (p
< 0.01), perhaps reflecting a similar decline in the average school’s overall student population,

12
which was 16% black in 2004 but only 12% black in 2012. At the same time, the percent of
elementary students who are Hispanic significantly increased from 14.5% in 2004 to 16.5% in
2012 (p < .05), although the percentage of gifted students who are Hispanic did not change
significantly. Both the proportion of elementary students who are white and the proportion of
gifted students who are white remained constant over the two waves of data.
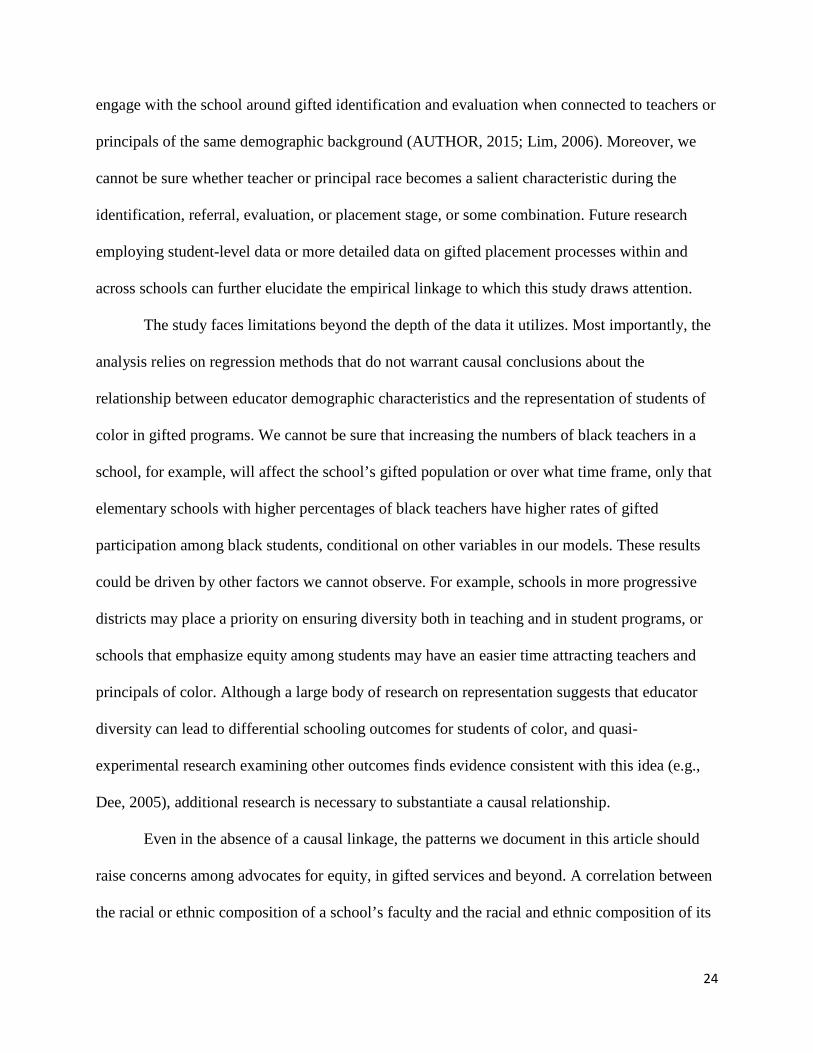
An alternative means of illustrating the underrepresentation of black and Hispanic
students in gifted programs appears in Figure 1, which shows the percentage of each racial/ethnic
group in gifted programs separately for 2004 and 2012. The figure demonstrates that whereas
nearly 8% of white students are identified for gifted services, only 3–4% of black and Hispanic
students are similarly identified, percentages that remained very stable over the two waves of
data. This stability suggests that the changes in the proportions of students in gifted programs
from black and Hispanic groups between 2004 and 2012 shown in Table 1 indeed reflect changes
in school composition rather than changes in the allocation of slots in gifted programs across
different groups of students.
Independent Variables
The main independent variables for this study capture the racial/ethnic composition of the
teacher workforce and the race/ethnicity of the principal in each school in the pooled sample. In
particular, we use SASS school questionnaire data to calculate the percentage of teachers in each
school who are Hispanic, black, or white. These percentages are, on average, 4%, 6%, and 88%,
respectively. The percentage of teachers who are black dropped from approximately 7% in 2004
to above 5% in 2012 (p < 0.05). The percentage of Hispanic teachers remained similar between
the two waves, but the percent of teachers who are white increased from approximately 87% in
2004 to 89% in 2012 (p < 0.01). From SASS principal questionnaire data we also create two

13
separate binary indicator variables for whether the school’s principal is Hispanic, black, or white.
Approximately 5% of principals in the sample are Hispanic, 10% are black, and 88% are white.
Principal race stayed constant across both waves of data for Hispanic and black principals, but
the percentage of white principals increased slightly from 87% to 89% (p < 0.10).
Control Variables
Models include control variables to account for other factors that might explain variation
in assignment to gifted programs. Aside from the fraction of all students in the school assigned to
gifted programs—which comes from OCR data—and locale (e.g., urban) and expenditure
information—which are from the CCD—control variables are primarily taken from SASS. We
include the percentage of all students who are black and the percentage who are Hispanic
because the proportion of these populations should be highly correlated with the proportion of
students in gifted programs. We also include the percentage of students within a school that are
eligible for free or reduced-price lunch (FRPL) because these students are less likely to be placed
in gifted programs (McBee, 2006). The percentage of students who are eligible for FRPL
increased significantly from approximately 46% in 2004 to 50% in 2012 (p < 0.01). We control
for school size, district size, and locale type because these factors may be associated with
standardization of gifted identification, referral, and testing processes and different levels of
discretionary academic grouping. We note that the percent of students who attended schools in
various locales changed significantly between the two waves of data. The percentage of students
attending schools in cities declined from 33% to 20% (p < 0.01) while the percentage of students
in rural areas increased from 23% to 33% (p < 0.01). The percentage of students attending
schools in suburban areas or small towns remained relatively constant across both waves of data.
The observable differences likely stem from changes in urban locale codes within the CCD
14
across 2004 and 2012.3 In addition, the average district size decreased significantly between the
two waves, from more than 35,000 students to just less than 22,000 (p < 0.01). Per pupil
expenditure in constant 2012 dollars is included as a control for school resources, which may
influence the size of a school’s gifted program; this value significantly increased from
approximately $10,850 in 2004 to $11,530 in 2012 (p < 0.01).
Methods
We estimate a series of ordinary least squares regression models where the dependent
variable is the percentage of gifted students in one of three different race or ethnicity groups
(Hispanic, black, or white). The main independent variables of interest are the proportion of
teachers who are Hispanic, black, or white, and two binary variables representing if the principal
is Hispanic or black.
Each model incorporates state-level and year fixed effects in order to account for
differences in state procedures related to gifted program funding and assignment and for
descriptive differences across the two waves of data. We cluster standard errors at the district-
level to correct for correlated errors within districts. Samples used for estimation for each
dependent variable are limited to schools with a student race group between 1% and 99% of the
total population.
If gifted assignment is approximately zero-sum, as Nicholson-Crotty, Grissom, and
Nicholson-Crotty (2011) argue, then a larger percentage of teachers from one racial group should
be associated with a decrease in the composition index from other racial groups to the gifted
program. Therefore, to observe the zero-sum trade-off, we also model the relationship between
black and Hispanic teachers on the composition index of white students in gifted programs.
Additionally, we test for the moderating influence of the principal’s race, investigating

15
the hypothesis that teachers of a certain race will have a stronger influence over the racial
composition of the school’s gifted program when the principal is also from a minority group. To
do so, interactions between the percentage of teachers who are of a certain race (black or
Hispanic) and the dummy for whether the principal is of that same race or (black or Hispanic)
are included in the model.
Finally, we test for critical mass effects by entering teacher race/ethnicity percentages as
a series of categorical variables defined over discrete ranges (e.g., 1–5%, 6–10%, and so forth).
These dummy variables allow us to examine whether the association between the percentage of
teachers who are of a certain race and the placement of students of color into gifted programs is
nonlinear. A critical mass hypothesis would predict little or no association when the fraction of
teachers of color in a school was very low, with an association only becoming apparent beyond
some critical threshold of nonwhite teachers in the school.
Results
Teacher Race/Ethnicity and Gifted Assignments
We begin by estimating the racial/ethnic composition of the school’s gifted program in
the pooled sample as a function of the fraction of black and Hispanic teachers in the school, plus
controls. For consistency with prior research (e.g., Nicholson-Crotty, Grissom, & Nicholson-
Crotty, 2011), initially principal race/ethnicity is not included. Models for Hispanic, black, and
white gifted student composition were run separately. Results are shown in Table 2. The first
column shows the results for the model with the percentage of gifted students who are Hispanic
as the dependent variable. The second and third columns show results for black students and
white students, respectively.

16
Our results confirm findings from these earlier studies. The percentage of Hispanic
teachers is positively related to the percentage of gifted students who are Hispanic. As shown in
column 1, the coefficient on percent of teachers who are Hispanic (β = 0.31, p < 0.01) means that
a 10% increase in Hispanic teachers is associated with a 3.1% increase in Hispanic gifted
students. This increase is meaningful, given that the sample average of gifted students who are
Hispanic is just 10%. The percent of black teachers has no detectable relationship with the
percentage of gifted students who are Hispanic. The relationship between Hispanic teachers and
Hispanic students exists when controlling for the student body makeup, urbanicity, per-pupil
expenditure, and year.4
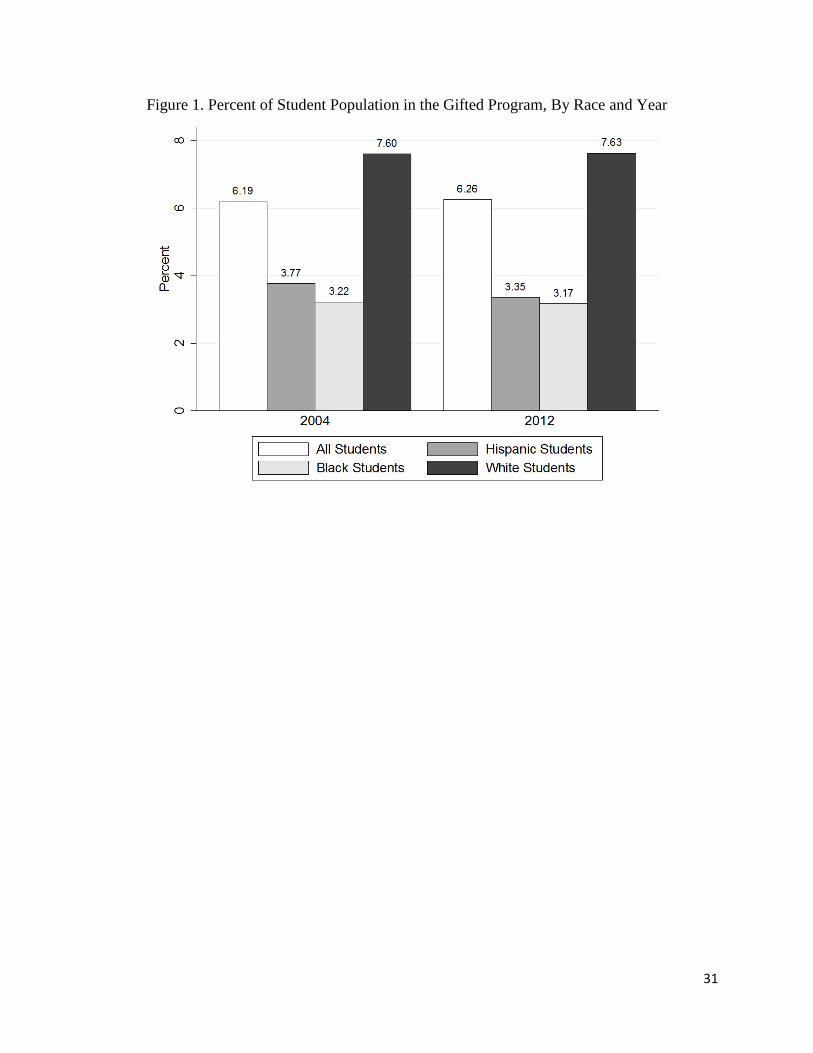
The association between percent Hispanic teachers and the percentage of gifted students
who are Hispanic is shown in Figure 2. The solid line represents the relationship between
Hispanic teachers and Hispanic students in 2004, and the dotted line represents the same
relationship in 2012. Light grey lines represent the 95% confidence intervals for the predicted
margins. Figure 2 shows that the percentage of gifted students who are Hispanic is predicted to
increase as the percent of Hispanic teachers increases. The nearly overlapping year lines in this
figure show that the relationship between Hispanic teachers and Hispanic gifted students
remained constant between the two waves of data.
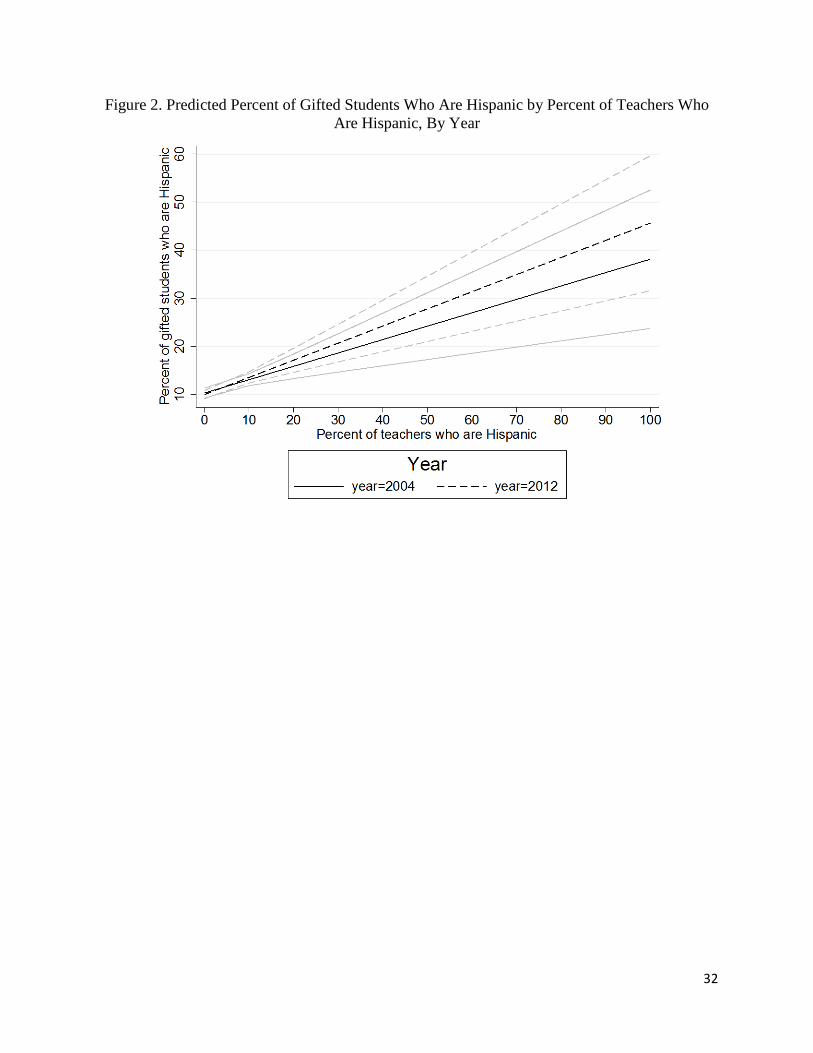
Column 2 of Table 2 reports the results from the model with the black gifted composition
index as the dependent variable. These results show that, even after controlling for various
school and district characteristics, a 10% increase in the percentage of black teachers in a school
is associated with an increase in the representation of black students in gifted programs of about
3.2% (p < 0.01). Considering that the sample average percent of gifted students who are black is
9.4%, a 3.2 percentage point change is substantively significant, representing an increase of 34%,

17
on average. The proportion of Hispanic teachers has no detectable relationship with the
composition index of black gifted students. Figure 3 shows predicted composition index values
for black students according to the percentage of black teachers in the school, again separately
for 2004 and 2012 (the two are statistically indistinguishable).
The results from the model with the percentage of gifted students who are white as the
dependent variable are shown in column 3 of Table 2. Schools with larger proportions of
minority teachers are associated with less white representation in gifted programs (p < 0.01). A
10% increase in the proportion of either Hispanic or black teachers is related to approximately
4% or 3% drop in the percent of gifted students who are white, respectively. These results are
consistent with the idea that assignment of a student to gifted services approximates a zero-sum
game (Nicholson-Crotty, Grissom, & Nicholson-Crotty, 2011); increases in the percentages of
gifted students who are Hispanic or black are associated with a decrease in the percentage of
gifted students who are white, holding other factors constant.
Although not our main focus, before moving on it is worth pointing out a few notable
patterns from the control variables found in Table 2. The percentage of students in the school
who are Hispanic or black is positively associated with the percentage of gifted students in the
school that is Hispanic or black, respectively, and negatively related to the percentage of gifted
white students. Also, the total percentage of gifted students in a school is positively related to the
composition index for Hispanic students (β = 0.09, p < 0.01). Additionally, as the percentage of
student eligible for FRPL increases by 10%, the percent of gifted students who are white is
predicted to decrease by 0.8% (p < 0.01). Small town schools are negatively associated with the
composition index of Hispanic students (β = -3.21, p < 0.01) but positively related to the percent
of gifted students who are white (β = 4.27, p < 0.01). District size (logged) is negatively
18
correlated with the percentage of gifted students who are white (β = -1.39, p < 0.01) but
positively correlated with the percentage of gifted students who are black (β = 0.66, p < 0.10).
Finally, the percentage of gifted students who are white was smaller in 2012 than in 2004 (β = -
0.29, p < 0.01).
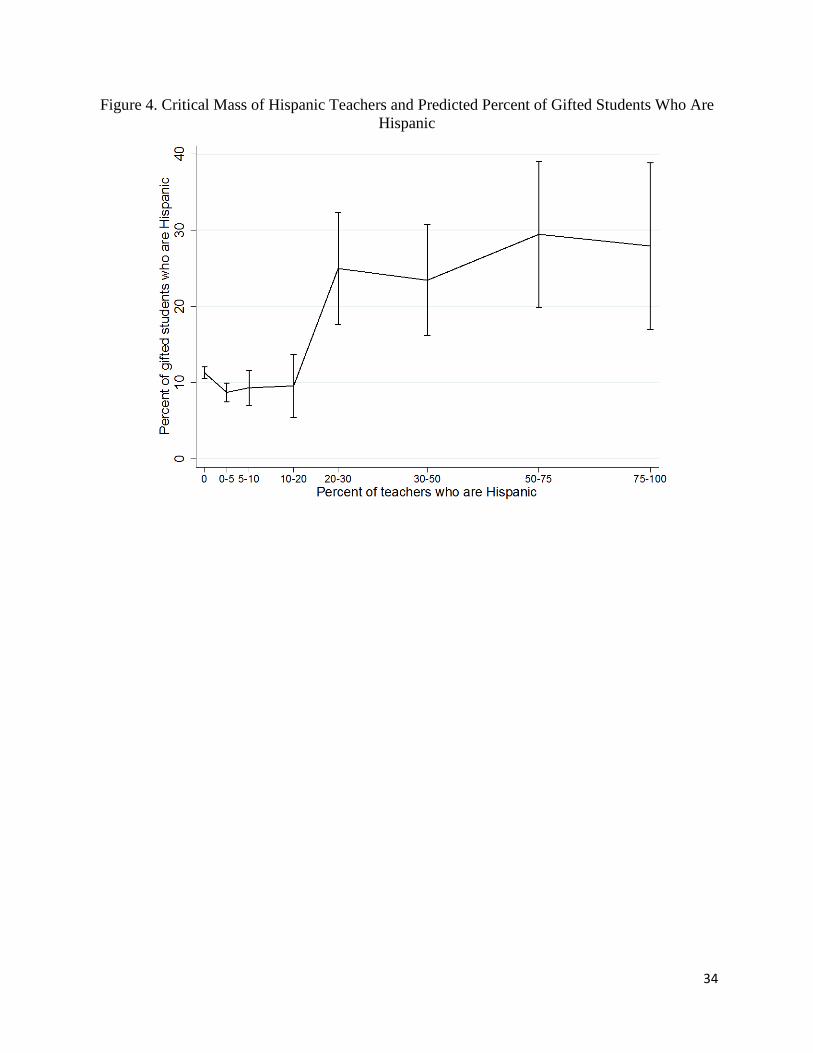
Critical Mass Analysis
To test for evidence that a critical mass of teachers from a racial/ethnic group is required
in a school before there is an association between teacher race/ethnicity and the composition of
the school’s gifted program, we re-estimated Table 2 with a series of indicators representing
varying percentages of teachers who are Hispanic and black. Results are shown in Table 3. As in
Table 2, the three columns represent the results from three models run with the dependent
variable as the composition index of the gifted program for each of Hispanic, black, and white
students.
Coefficients in Table 3 generally show evidence of a critical mass requirement. Model 1
indicates a large jump in the percentage of students in gifted programs who are Hispanic once the
fraction of teachers who are Hispanic reaches between twenty and thirty percent. This evidence
is easier to see in Figure 4, which graphs the results from this model. The figure shows that
Hispanic representation in gifted programs hovers around 10% when the school has fewer than
20–30% Hispanic teachers but jumps to around 25% once that threshold is reached, with no
evidence that the fraction continues to climb as the percentage of Hispanic teachers increases
beyond that point.
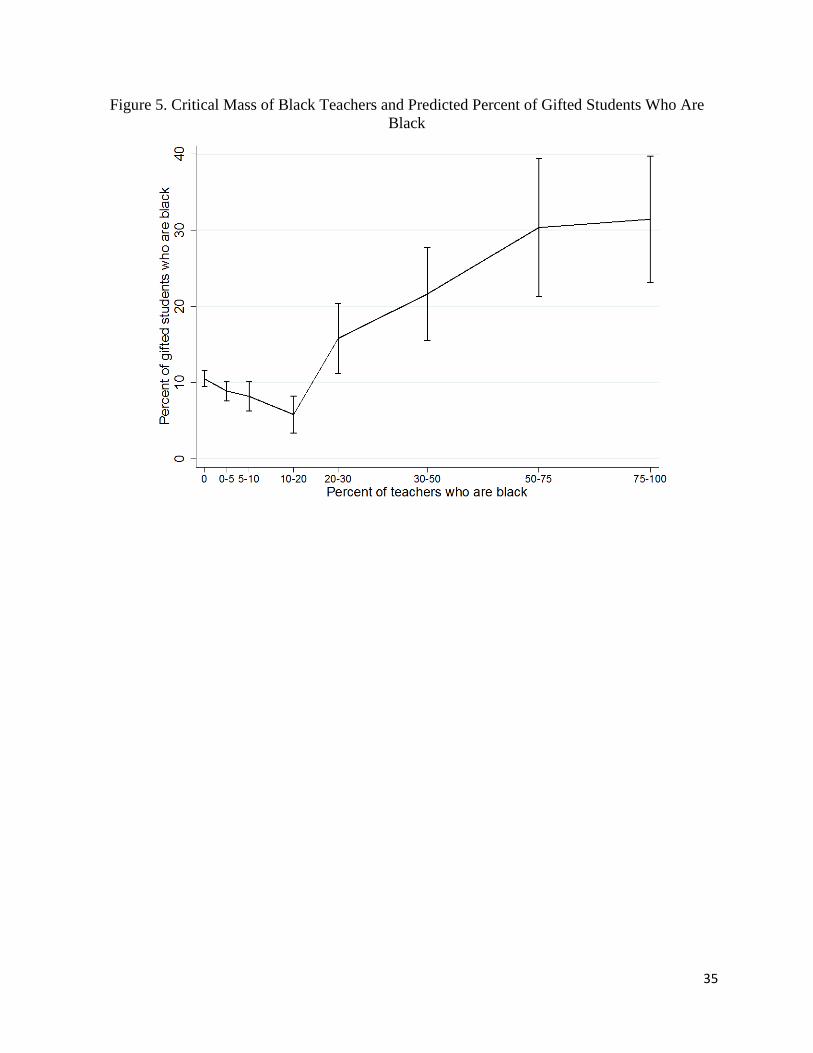
The results from the model with black students as the dependent variable are shown in
column 2 of Table 3. Turning to the coefficients lower in the table that categorize the percentage
of black teachers into bins, we see a relationship that is similar to the Hispanic student–Hispanic

19
teacher result. Figure 5, which graphs the predictions from these coefficients, shows the same
jump at around 20–30% black teachers, with some evidence of further increases for higher
values.
The results for the model with white student as the dependent variable are shown in
column 3 of Table 3. The results indicate that there is a tradeoff with the percent of gifted
students who are white with those who are Hispanic or black. The significantly positive
relationships for minority gifted students and minority teachers are inversely related to the
relationships between minority teachers and white students. As the percent of Hispanic or black
teachers reaches between 20-30%, the percent of gifted students decreases at nearly the same
magnitude as the increases for students of color.
Examining Principal Race/Ethnicity
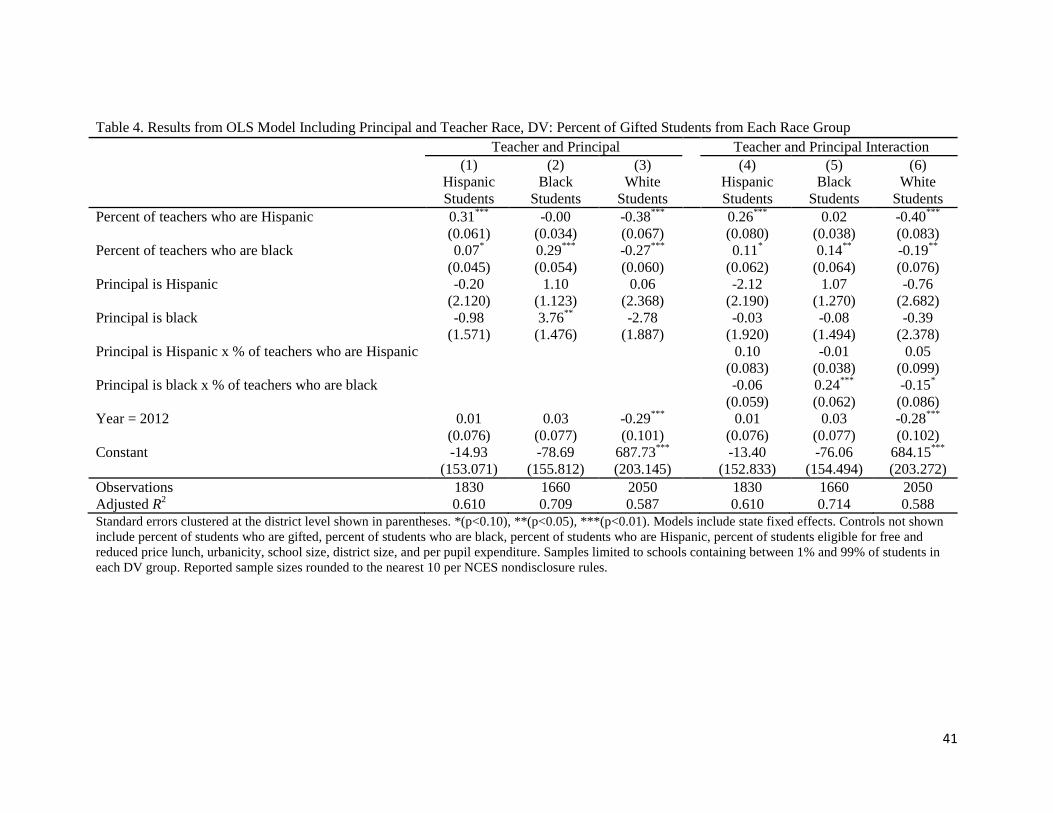
The next set of models, reported in the first three columns of Table 4, add principal race
and ethnicity measures as covariates. As in Tables 2 and 3, each of these columns represents a
different race/ethnicity composition variable as the dependent variable (Hispanic, black, and
white). The first column shows that the coefficients for the percentage of Hispanic and black
teachers are similar in magnitude to those shown for Hispanic students in Table 2. The
race/ethnicity of the principal, however, shows no evidence of a relationship with the proportion
of gifted students who are Hispanic.
Column 2 shows results for black students, and again the coefficients for Hispanic and
black teachers are similar to those in the related model in Table 2. Here, the presence of a black
principal has a significantly positive association with the percent of gifted students who are black
(β = 3.76, p < 0.05), meaning that the presence of a black principal is associated with
approximately a 3.8 percentage point increase in the share of gifted students who are black. This
20
shift is roughly equivalent to the one associated with a 10% increase in the percentage of
teachers who are black in the school.
The results for white students are shown in column 3. The magnitude of the coefficients
for percent Hispanic and percent black teachers are nearly identical to those in Table 2 (with both
coefficients statistically significant at the 0.01 level). The presence of a Hispanic or black
principal is not statistically associated with the proportion of gifted students who are white at
conventional levels, though the coefficient on the black principal variable is relatively large in
magnitude and negatively signed.
Columns 4 through 6 of Table 4 report the results of adding interactions between (a) the
binary indicator for having a black principal and percent of black teachers and (b) the binary
indicator for having a Hispanic principal and percent of Hispanic teachers. Column 4 represents
the results when the dependent variable is the percent of gifted students who are Hispanic. The
takeaway from this column is that neither of the interaction terms is statistically significant. The
predictive margins from this model are shown in Figure 6. The dotted line represents the
predicted percentage of gifted students who are Hispanic across increasing percentages of
teachers who are Hispanic for schools with a Hispanic principal. The solid line represents that
relationship for non-Hispanic principals. The lighter-colored lines represent the 95% confidence
intervals for those predictions. The figure shows that while the predicted percentage of gifted
students who are Hispanic is predicted to increase as the percent of Hispanic teachers increases,
there is no moderating influence of a Hispanic principal on that relationship, evidenced by the
substantially overlapping confidence intervals.
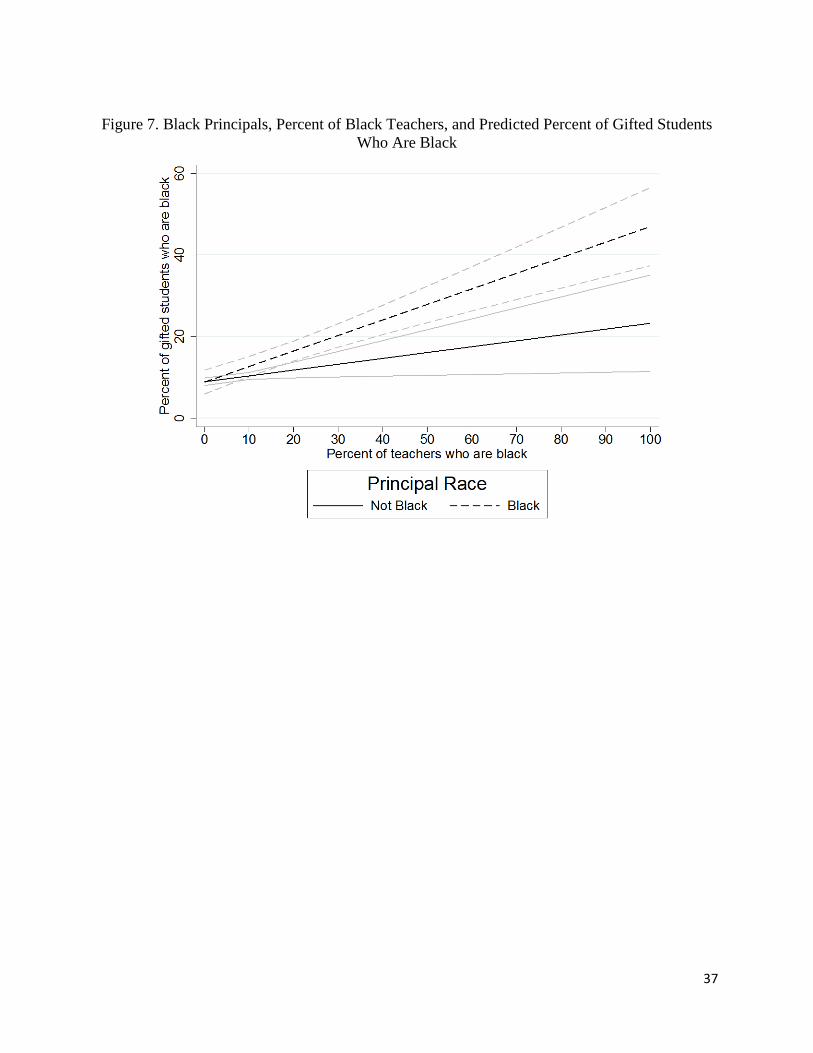
The results from the model for black students as the dependent variable are shown in
column 5. For black students, there is evidence of an important interaction. The coefficient on

21
the interaction of black principal with black teachers is quite large (β = 0.24, p < 0.01),
suggesting that the association between the proportion of black teachers in the school and the
assignment of black students to gifted programs is magnified in the presence of a black principal.
Figure 7 illustrates this result by plotting the predictive margins. The dotted line represents the
predicted percent of black gifted students across increasing percentages of black teachers in
schools with a black principal, and the solid line represents the same relationship for schools
with a non-black principal. The light gray lines represent the 95% confidence intervals. At low
percentages of black teachers in a school, the predicted black composition index for gifted
students is similar for schools with black and non-black principals. The slopes of the two lines
are different, however, so that increasing proportions of black teachers have a larger positive
effect in schools with black principals. When the percentage of teachers who are black is 30%,
schools with black principals have approximately 20% of gifted students who are black,
compared to only 13% under non-black principals. When the percentage of teachers who are
black is 80%, the difference is even larger: 40% of gifted students are predicted to be black under
black principals, compared to only 20% under non-black principals.
Discussion and Conclusions
Traditionally disadvantaged students who often are excluded from gifted programs
perhaps benefit most academically from receiving gifted services (Card & Giuliano, 2014), so
identifying why some school are more likely than others to provide students of color with these
services is an important endeavor for educational research. Consistent with prior research outside
education (e.g., Rocha & Hawes, 2009), our analysis shows that descriptive representation
among an elementary school’s faculty and leadership is associated with greater access to gifted
programs for black and Hispanic students. In a large, national data set spanning two time points,

22
larger percentages of black teachers in the school correlate to increased gifted representation
among black students. The relationship between Hispanic teacher representation and Hispanic
student presence in the school’s gifted program is of an almost identical magnitude. At the same
time, gains for blacks and Hispanics in schools with more diverse teaching faculties appear to
come at the expense of white students, though prior research suggests that this tradeoff only
occurs in schools where nonwhite students are very underrepresented (Nicholson-Crotty,
Grissom, & Nicholson-Crotty, 2011). We also find evidence of non-linearities in these
relationships; a critical mass of racial ethnic minority teachers—in the range of 20% to 30%—
may be necessary before descriptive representation translates into differences in outcomes for
students in assignment to gifted programs.
Our results also demonstrate an association between principal race and the composition
of gifted programs. Schools with black principals have significantly higher gifted representation
among black students. The presence of a black principal is associated with a 3.8% increase in
black representation in the school’s gifted program, equivalent to the gain associated with
increasing the school’s cadre of black teachers by 13%. Associations between teacher
representation and assignment of black students to gifted programs are stronger in these schools
as well. However, we uncovered no parallel results for Hispanic principals and students, though
we note that only about 5% of the schools in our sample were led by a Hispanic principal,
potentially limiting the power to distinguish such relationships.
These results point towards a greater need to understand the implications of teacher
workforce diversity in American education, particularly in light of shifting demographics of the
U.S. student population. Among all elementary schools sampled by SASS, for example, the
average school’s Hispanic student population grew by approximately 4 percentage points

23
between the 2003-04 and 2011-12 administrations. Yet over that same time period, teacher and
principal diversity changed much more slowly, with the fraction of Hispanic teachers in the
average elementary school increasing by less than one percent, and the percentage of Hispanic
principals actually slightly decreasing. In other words, the different pace of these trends suggests
that, for Hispanic students, descriptive representation in the educational workforce is, in fact,
declining. An implication of this study is that failure of the public school system to recruit
Hispanic teachers and principals at increasing rates may have consequences for the educational
services provided to Hispanic students, at least in the area of gifted programs.
Of course, diversification of the educator workforce is not the only means for ensuring
greater access to gifted services for students of color. Universal screening and the use of multiple
measures of giftedness are examples of strategies that can help increase equity in access to gifted
programs (Ford, 1995). Such strategies are unlikely to eliminate the role of teacher discretion in
the gifted assignment, evaluation, and placement processes, however, which means that training
and professional development aimed at breaking the connection between teacher race/ethnicity
and differential access for students by, for example, helping teachers recognize giftedness among
students from diverse cultural backgrounds, may be necessary for combatting gifted
underrepresentation among students of color.
This last point speculative, however, highlighting the need for additional research to
understand why teacher and principal race are associated with differential assignment. Certainly
different capacities for teachers to identify giftedness among students of the same race or
ethnicity is a potential mechanism, but there are many others, including different assignment
practices employed by schools with more diverse teachers, role modeling effects that elicit
greater evidence of giftedness among students of color, and greater propensities for parents to
24
engage with the school around gifted identification and evaluation when connected to teachers or
principals of the same demographic background (AUTHOR, 2015; Lim, 2006). Moreover, we
cannot be sure whether teacher or principal race becomes a salient characteristic during the
identification, referral, evaluation, or placement stage, or some combination. Future research
employing student-level data or more detailed data on gifted placement processes within and
across schools can further elucidate the empirical linkage to which this study draws attention.
The study faces limitations beyond the depth of the data it utilizes. Most importantly, the
analysis relies on regression methods that do not warrant causal conclusions about the
relationship between educator demographic characteristics and the representation of students of
color in gifted programs. We cannot be sure that increasing the numbers of black teachers in a
school, for example, will affect the school’s gifted population or over what time frame, only that
elementary schools with higher percentages of black teachers have higher rates of gifted
participation among black students, conditional on other variables in our models. These results
could be driven by other factors we cannot observe. For example, schools in more progressive
districts may place a priority on ensuring diversity both in teaching and in student programs, or
schools that emphasize equity among students may have an easier time attracting teachers and
principals of color. Although a large body of research on representation suggests that educator
diversity can lead to differential schooling outcomes for students of color, and quasi-
experimental research examining other outcomes finds evidence consistent with this idea (e.g.,
Dee, 2005), additional research is necessary to substantiate a causal relationship.
Even in the absence of a causal linkage, the patterns we document in this article should
raise concerns among advocates for equity, in gifted services and beyond. A correlation between
the racial or ethnic composition of a school’s faculty and the racial and ethnic composition of its

25
gifted program suggests that a child’s access to gifted services is a function of a school
characteristic over which he or she has little control and which bears little apparent relationship
to whether or not the child is indeed gifted. This study lays a foundation for education
researchers to dig more into this important empirical connection and for policymakers to begin to
consider steps that might be taken to ensure that gifted students receive gifted services regardless
of such school contextual variables.

26
Appendix Table A.1. Results from OLS Regression Testing Year Interactions with Teacher Variables, DV: Percent of Gifted Students from Each Race Group (1) (2) (3) Hispanic
Students Black
Students White
Students Year=2012 -0.19 0.89 -1.85** (0.626) (0.607) (0.903) Percent of teachers who are Hispanic 0.29*** 0.04 -0.33*** (0.074) (0.042) (0.083) Percent of teachers who are Hispanic x Year=2012 0.03 -0.05 -0.10 (0.076) (0.041) (0.089) Percent of teachers who are black 0.06 0.34*** -0.29*** (0.050) (0.059) (0.067) Percent of teachers who are black x Year=2012 0.02 -0.05 -0.02 (0.043) (0.052) (0.065) Percent of students who are gifted 0.09*** 0.03 -0.07 (0.029) (0.025) (0.045) Percent of students who are Hispanic 0.73*** -0.00 -0.56*** (0.040) (0.027) (0.047) Percent of students who are black 0.03 0.69*** -0.68*** (0.035) (0.043) (0.043) Percent of students who are eligible for FRPL -0.00 0.03 -0.08*** (0.019) (0.017) (0.026) Suburb -0.83 0.09 1.24 (0.818) (0.837) (1.159) Small Town -3.19*** -0.91 4.23*** (1.161) (1.018) (1.513) Rural -0.89 1.00 1.69 (0.913) (0.983) (1.245) School size (in 100s) -0.04 -0.21 -0.23 (0.162) (0.156) (0.202) District Size (Logged) -0.09 0.64* -1.40*** (0.315) (0.377) (0.473) Per Pupil Expenditure (in 2012 $1000) -0.07 0.15 -0.41** (0.120) (0.147) (0.206) Constant -1.11 -12.01*** 115.91*** (3.628) (4.020) (5.124) Observations 1830 1660 2050 Adjusted R2 0.609 0.707 0.587 Standard errors clustered at the district level shown in parentheses. *(p<0.10), **(p<0.05), ***(p<0.01). Models include state fixed effects. Samples limited to schools containing between 1% and 99% of students in each DV group. Reported sample sizes rounded to the nearest 10 per NCES nondisclosure rules.

27
Appendix Table A.2. Results from OLS Regression Testing Year Interactions with Teacher and Principal Variables, DV: Percent of Gifted Students from Each Race Group (1) (2) (3) Hispanic
Students Black
Students White
Students Year = 2012 -0.22 0.90 -1.76* (0.626) (0.591) (0.903) Percent of teachers who are Hispanic 0.28*** 0.00 -0.31*** (0.076) (0.044) (0.087) Percent of teachers who are Hispanic x Year = 2012 0.08 -0.01 -0.15 (0.087) (0.046) (0.095) Percent of teachers who are black 0.09 0.30*** -0.29*** (0.058) (0.062) (0.073) Percent of teachers who are black x Year = 2012 -0.04 -0.04 0.04 (0.055) (0.064) (0.084) Principal is Hispanic 2.26 2.79 -2.46 (2.959) (1.750) (2.880) Principal is Hispanic x Year = 2012 -5.98 -4.00* 6.24 (3.953) (2.105) (4.276) Principal is black -3.04 4.35** -0.68 (2.359) (2.096) (2.577) Principal is black x Year = 2012 4.59 -1.48 -4.91 (3.195) (2.756) (3.754) Constant -0.77 -11.01*** 115.07*** (3.617) (3.914) (5.158) Observations 1830 1660 2050 Adjusted R2 0.611 0.709 0.588 Standard errors clustered at the district level shown in parentheses. *(p<0.10), **(p<0.05), ***(p<0.01). Models include state fixed effects. Controls not shown include percent of students who are gifted, percent of students who are black, percent of students who are Hispanic, percent of students eligible for free and reduced price lunch, urbanicity, school size, district size, and per pupil expenditure. Samples limited to schools containing between 1% and 99% of students in each DV group. Reported sample sizes rounded to the nearest 10 per NCES nondisclosure rules.

28
References
Boser, U. (2014). Teacher diversity revisited: A new state-by-state analysis. Washington, DC: Center for American Progress.
Card, D., & Giuliano, L. (2014). Does gifted education work? For which students? National Bureau of Economic Research Working Paper No. 20453.
Dee, T. S. (2005). A teacher like me: Does race, ethnicity, or gender matter? American Economic Review, 95(2), 158-165.
Elhoweris, H., Mutua, K., Alsheikh, N., & Holloway, P. (2005). Effect of children’s ethnicity on teachers' referral and recommendation decisions in gifted and talented programs. Remedial and Special Education, 26(1), 25–31.
Ford, D. Y. (1998). The underrepresentation of minority students in gifted education: Problems and promises in recruitment and retention. The Journal of Special Education, 32(1), 4–14.
Ford, D. Y., Grantham, T. C., & Whiting, G. W. (2008). Culturally and linguistically diverse students in gifted education: Recruitment and retention issues. Exceptional Children, 74(3), 289–306.
Fraga, L. R., Meier, K. J., & England, R. E. (1986). Hispanic Americans and educational policy: Limits to equal access. Journal of Politics, 48(04), 850-876.
Grissom, J. A., & Keiser, L. R. (2011). A supervisor like me: Race, representation, and the satisfaction and turnover decisions of public sector employees. Journal of Policy Analysis and Management, 30(3), 557–580.
Grissom, J. A., Nicholson-Crotty, J., & Nicholson-Crotty, S. (2009). Race, region, and representative bureaucracy. Public Administration Review, 69(5), 911–919.
Hargrove, B. H., & Seay, S. E. (2011). School teacher perceptions of barriers that limit the participation of African American males in public school gifted programs. Journal for the Education of the Gifted, 34(3), 434–467.
Harris, J. J., Brown, E. L., Ford, D. Y., & Richardson, J. W. (2004). African Americans and multicultural education: A proposed remedy for disproportionate special education placement and underinclusion in gifted education. Education and Urban Society, 36(3), 304–341.
Henderson, L. J. (1979). Administrative advocacy: Black administrators in urban bureaucracy. Palo Alto, CA: R&E Research Associates.
Hindera, J. J. (1993). Representative bureaucracy: Further evidence of active representation in the EEOC district offices. Journal of Public Administration Research and Theory, 3(4), 415–429.

29
Hindera, J.J., & Young, C.D. (1998). Representative bureaucracy: The theoretical implications of statistical interaction. Political Research Quarterly, 51(3), 655-671.
Joseph, L. M., & Ford, D. Y. (2006). Nondiscriminatory Assessment: Considerations for Gifted Education. Gifted Child Quarterly, 50(1), 42–51.
Kanter, R. (1977). Men and women of the corporation. New York: Basic.
Kennedy, B. (2014). Unraveling representative bureaucracy: A systematic analysis of the literature. Administration & Society, 46(4), 395-421.
Lim, H. (2006). Representative bureaucracy: Rethinking substantive effects and active representation. Public Administration Review, 66(2), 193–204.
Lipsky, M. (1980). Street-level bureaucracy: Dilemmas of the individual in public services. New York: Russell Sage Foundation.
Matthews, M. S., & Shaunessy, E. (2010). Putting standards into practice: Evaluating the utility of the NAGC Pre-K--Grade 12 Gifted Program Standards. Gifted Child Quarterly, 54(3), 159–167.
McBee, M. T. (2006). A descriptive analysis of referral sources for gifted identification screening by race and socioeconomic status. The Journal of Secondary Gifted Education, 17(2), 103–111.
McBee, M. T., Shaunessy, E., & Matthews, M. S. (2012). Policy matters: An analysis of district-level efforts to increase the identification of underrepresented learners. Journal of Advanced Academics, 23(4), 326–344.
Meier, K. J. (1993). Representative bureaucracy: A theoretical and empirical exposition. In J. Perry (Ed.), Research in Public Administration (pp. 1–35). Greenwich, CT: JAI Press.
Meier, K. J., & Stewart, J. (1992). The impact of representative bureaucracies: Educational systems and public policies. American Review of Public Administration, 22(3), 151–171.
Meier, K. J., Wrinkle, R. D., & Polinard, J. L. (1999). Representative bureaucracy and distributional equity: Addressing the hard question. Journal of Politics, 61(04), 1025-1039.
Mosher, F. (1968). Democracy and the public service. New York: Oxford University Press.
National Research Council (2002) Minority Students in Special and Gifted Education. Committee on Minority Representation in Special Education, M. Suzanne Donovan and Christopher T. Cross, editors. Division of Behavioral and Social Sciences and Education. Washington, DC: National Academy Press.

30
Nicholson-Crotty, J., Grissom, J. A., & Nicholson-Crotty, S. (2011). Bureaucratic representation, distributional equity, and democratic values in the administration of public programs. Journal of Politics, 73(2), 582–596.
Pitts, D. W. (2005). Diversity, representation, and performance: Evidence about race and ethnicity in public organizations. Journal of Public Administration Research and Theory, 15(4), 615–631.
Rocha, R. R., & Hawes, D. P. (2009). Racial diversity, representative bureaucracy, and equity in multiracial school districts. Social Science Quarterly, 90(2), 326–344.
Thompson, F. (1976). Minority groups in public bureaucracies: Are passive and active representation linked? Administration & Society, 8, 201-226.
Weiher, G. R. (2000). Minority student achievement: Passive representation and social context in schools. Journal of Politics, 62(3), 886–895.
31
Figure 1. Percent of Student Population in the Gifted Program, By Race and Year
32
Figure 2. Predicted Percent of Gifted Students Who Are Hispanic by Percent of Teachers Who Are Hispanic, By Year
33
Figure 3. Predicted Percent of Gifted Students Who Are Black by Percent of Teachers Who Are Black, By Year
34
Figure 4. Critical Mass of Hispanic Teachers and Predicted Percent of Gifted Students Who Are Hispanic
35
Figure 5. Critical Mass of Black Teachers and Predicted Percent of Gifted Students Who Are Black

36
Figure 6. Hispanic Principals, Percent of Hispanic Teachers, and Predicted Percent of Gifted Students Who Are Hispanic
37
Figure 7. Black Principals, Percent of Black Teachers, and Predicted Percent of Gifted Students
Who Are Black
38
Table 1: Descriptive Statistics, Full Sample and By Year
(1) (2) (3) Full Sample 2004 Sample 2012 Sample
Percent of students who are gifted 6.22 6.19 6.26 (7.32) (8.07) (6.27) Percent of gifted students who are Hispanic 10.09 9.59 10.72 (21.29) (21.32) (21.24) Percent of gifted students who are black 9.41 10.73 7.78*** (21.39) (23.36) (18.56) Percent of gifted students who are white 71.71 70.91 72.71 (31.48) (32.30) (30.41) Percent of teachers who are Hispanic 3.91 3.82 4.03 (11.54) (11.00) (12.19) Percent of teachers who are black 6.22 6.87 5.41** (14.94) (15.82) (13.74) Percent of teachers who are white 87.76 86.75 89.03*** (20.39) (21.21) (19.26) Principal is Hispanic 0.05 0.05 0.05 (0.21) (0.21) (0.21) Principal is black 0.10 0.11 0.09 (0.30) (0.31) (0.29) Principal is white 0.88 0.87 0.89* (0.33) (0.34) (0.31) Percent of students who are Hispanic 15.39 14.50 16.50** (22.24) (22.41) (21.98) Percent of students who are black 14.49 16.20 12.37*** (22.63) (24.41) (20.01) Percent of students who are white 62.37 61.56 63.38 (30.42) (31.15) (29.48) Percent of students who are eligible for FRPL 48.01 46.02 50.49***
(27.76) (28.25) (26.94) Urbanicity
City 0.27 0.33 0.20*** (0.44) (0.47) (0.40) Suburb 0.32 0.32 0.33 (0.47) (0.47) (0.47) Small Town 0.13 0.12 0.13 (0.33) (0.33) (0.34) Rural 0.28 0.23 0.33***
(0.45) (0.42) (0.47) School size 491.24 488.20 495.02 (222.85) (219.85) (226.57) District Size 29339.19 35328.03 21907.33*** (72421.14) (78063.65) (64003.83) Per Pupil Expenditure (in 2012 $1000) 11.15 10.85 11.53*** (3.01) (2.71) (3.31) Observations 2170 1200 970 Standard deviation in parentheses. Results from two-sided t-test shown: *(p<0.10), **(p<0.05), ***(p<0.01). Reported sample sizes rounded to the nearest 10 per NCES nondisclosure rules.

39
Table 2. Results from OLS Model Testing Race of Teachers, DV: Percent of Gifted Teacher Race/Ethnicity Only
(1) (2) (3) Hispanic Students Black Students White Students
Percent of teachers who are Hispanic 0.31*** 0.01 -0.38*** (0.059) (0.034) (0.065) Percent of teachers who are black 0.07 0.32*** -0.30*** (0.042) (0.053) (0.058) Percent of students who are gifted 0.09*** 0.04 -0.07 (0.028) (0.024) (0.045) Percent of students who are Hispanic 0.73*** -0.00 -0.56*** (0.040) (0.027) (0.048) Percent of students who are black 0.03 0.68*** -0.68*** (0.035) (0.043) (0.043) Percent of students who are eligible
for FRPL -0.00 0.03 -0.08***
(0.019) (0.017) (0.026) Suburb -0.85 0.11 1.29 (0.813) (0.839) (1.160) Small Town -3.21*** -0.87 4.27*** (1.158) (1.018) (1.516) Rural -0.93 1.09 1.78 (0.912) (0.986) (1.252) School size (in 100s) -0.04 -0.22 -0.23 (0.162) (0.156) (0.202) District Size (Logged) -0.10 0.66* -1.39*** (0.313) (0.376) (0.473) Per Pupil Expenditure (in 2012
$1000) -0.07 0.15 -0.40*
(0.120) (0.147) (0.206) Year 0.01 0.04 -0.29*** (0.076) (0.078) (0.101) Constant -11.55 -87.23 695.61*** (153.490) (157.138) (202.581) Observations 1830 1660 2050 Adjusted R2 0.610 0.706 0.587 Standard errors clustered at the district level shown in parentheses. *(p<0.10), **(p<0.05), ***(p<0.01). Models include state fixed effects. Controls not shown include percent of students who are gifted, percent of students who are black, percent of students who are Hispanic, percent of students eligible for free and reduced price lunch, urbanicity, school size, district size, and per pupil expenditure. Samples limited to schools containing between 1% and 99% of students in each DV group. Reported sample sizes rounded to the nearest 10 per NCES nondisclosure rules.

40
Table 3: Results from OLS Model Testing Critical Mass Theory, DV: Percent of Gifted Students from Each Race Group (1) (2) (3) Hispanic Students Black Students White Students Percent of teachers who are Hispanic >0% and ≤ 5% -2.58*** 0.61 0.51 (0.689) (0.717) (1.070) >5% and ≤ 10% -1.99 0.79 -1.91 (1.238) (1.121) (2.117) >10% and ≤ 20% -1.73 2.80 -5.65* (2.241) (1.902) (3.029) >20% and ≤ 30% 13.66*** -0.30 -12.33*** (3.877) (2.701) (4.247) >30% and ≤ 50% 12.13*** 1.37 -16.24*** (3.847) (2.079) (4.681) >50% and ≤75% 18.16*** -0.40 -23.05*** (5.015) (2.008) (5.248) >75% and ≤100% 16.62*** 3.14 -25.16*** (5.695) (2.471) (7.255) Percent of teachers who are black >0% and ≤ 5% 1.84** -1.60** -1.71 (0.840) (0.718) (1.209) >5% and ≤ 10% -0.81 -2.30* 0.29 (1.193) (1.175) (1.771) >10% and ≤ 20% 3.47** -4.69*** -0.63 (1.550) (1.438) (1.976) >20% and ≤ 30% 2.54 5.29** -6.45** (1.969) (2.537) (2.590) >30% and ≤ 50% 4.39 11.14*** -13.57*** (3.230) (3.386) (3.881) >50% and ≤75% 1.97 19.84*** -18.25*** (3.355) (4.911) (5.295) >75% and ≤100% 4.89 20.94*** -20.67*** (4.242) (4.523) (5.017) Year = 2012 0.03 0.01 -0.29*** (0.074) (0.074) (0.101) Constant -54.44 -26.75 693.35*** (148.516) (149.374) (201.567) Observations 1830 1660 2050 Adjusted R2 0.620 0.716 0.586 Standard errors clustered at the district level shown in parentheses. *p<0.10, **p<0.05, ***p<0.01. Models include state fixed effects. Controls not shown include percent of students that are gifted, percent of students that are black, percent of students that are Hispanic, percent of students eligible for free and reduced price lunch, urbanicity, school size, district size, and per pupil expenditure. Samples limited to schools containing between 1 and 99 of students in each DV group. Reported sample sizes rounded to the nearest 10 per NCES nondisclosure rules.
41
Table 4. Results from OLS Model Including Principal and Teacher Race, DV: Percent of Gifted Students from Each Race Group Teacher and Principal Teacher and Principal Interaction
(1) Hispanic Students
(2) Black
Students
(3) White
Students
(4) Hispanic Students
(5) Black
Students
(6) White
Students Percent of teachers who are Hispanic 0.31*** -0.00 -0.38*** 0.26*** 0.02 -0.40*** (0.061) (0.034) (0.067) (0.080) (0.038) (0.083) Percent of teachers who are black 0.07* 0.29*** -0.27*** 0.11* 0.14** -0.19** (0.045) (0.054) (0.060) (0.062) (0.064) (0.076) Principal is Hispanic -0.20 1.10 0.06 -2.12 1.07 -0.76 (2.120) (1.123) (2.368) (2.190) (1.270) (2.682) Principal is black -0.98 3.76** -2.78 -0.03 -0.08 -0.39 (1.571) (1.476) (1.887) (1.920) (1.494) (2.378) Principal is Hispanic x % of teachers who are Hispanic 0.10 -0.01 0.05 (0.083) (0.038) (0.099) Principal is black x % of teachers who are black -0.06 0.24*** -0.15* (0.059) (0.062) (0.086) Year = 2012 0.01 0.03 -0.29*** 0.01 0.03 -0.28*** (0.076) (0.077) (0.101) (0.076) (0.077) (0.102) Constant -14.93 -78.69 687.73*** -13.40 -76.06 684.15*** (153.071) (155.812) (203.145) (152.833) (154.494) (203.272) Observations 1830 1660 2050 1830 1660 2050 Adjusted R2 0.610 0.709 0.587 0.610 0.714 0.588 Standard errors clustered at the district level shown in parentheses. *(p<0.10), **(p<0.05), ***(p<0.01). Models include state fixed effects. Controls not shown include percent of students who are gifted, percent of students who are black, percent of students who are Hispanic, percent of students eligible for free and reduced price lunch, urbanicity, school size, district size, and per pupil expenditure. Samples limited to schools containing between 1% and 99% of students in each DV group. Reported sample sizes rounded to the nearest 10 per NCES nondisclosure rules.

42
Notes
1 Authors’ calculations from the 2009-10 Civil Rights Data Collection, which can be accessed at http://ocrdata.ed.gov/StateNationalEstimations/Projections_2009_10.
2 Note that these percentages are not weighted by the number of students in the school and thus are not the same as the percentages in the gifted or total student population.
3 CCD uses locale codes as defined by the National Center for Education Statistics (NCES). In 2005 and 2006, NCES supported work by the Census Bureau to redesign the original locale codes in light of changes to the U.S. population and the definition of key geographic concepts. As a result, locale codes from a 8-value system to a more detailed 12-value system, with some schools designated to different levels of urbanicity across both locale code schemes. We chose to collapse locale codes across both waves into larger categories representing city, suburban, small town, and rural locales. Where possible, we use the 2004 locale codes for all schools within our sample and 2012 locale codes for schools that do not appear in the 2004 CCD, however, regression results are not sensitive to alternate methods of construction for our urbanicity control.
4 We interacted the year 2012 with both the teacher percentage (Hispanic and black) variables and the principal (Hispanic and black) variables to explore whether the relationship between percentage of teachers of a minority racial/ethnic group and percentage of gifted students who share the same racial/ethnic group remains relatively constant across the two years, controlling for district and school factors. The results for these separate regressions are shown in Table A.1 (teachers only with covariates) and Table A.2 (teachers and principals with covariates). We used an F test to examine the joint statistical significance of these interaction terms. The null hypothesis that all were 0 could generally not be rejected for either set of regressions at conventional levels (with the exception of the white student model that included both teacher and principal interactions, which was marginally significant (p = .09). Overall, these results point to little evidence that the associations we examine differ between 2004 and 2012 (see also Figures 2 and 3). Therefore, we chose to proceed with a pooled sample for our analyses and include year fixed effects in our main models.