teacher retirement system of texas documents/actuarial_experience_study_2018.pdfretirement system of...
TRANSCRIPT

TEACHER RETIREMENT SYSTEM OF TEXAS Actuarial Experience Study As of August 31, 2017

July 27, 2018
Board of Trustees
Teacher Retirement System of Texas
1000 Red River Street
Austin, TX 78701-2698
Dear Members of the Board
Subject: Results of 2017 Experience Study
We are pleased to present our report on the results of the 2017 Experience Study for the Teacher
Retirement System of Texas (TRS). It includes our recommendations for new actuarial assumptions
to be effective for the August 31, 2018 actuarial valuation, and it describes the actuarial impact
produced by these recommendations as though they had been effective for the August 31, 2017
actuarial valuation.
With the Board's approval of the recommendations in this report, we believe the actuarial condition
of the System will be more accurately portrayed. The Board’s decisions should be based on the
appropriateness of each recommendation, not on their collective effect on the funding period or the
unfunded liability.
This study was conducted in accordance with generally accepted actuarial principles and practices,
and with the Actuarial Standards of Practice issued by the Actuarial Standards Board. The undersigned
meet all of the Qualification Standards of the American Academy of Actuaries. In addition, both of the
undersigned have extensive experience as retained public sector actuaries for several large, statewide
public retirement systems.
We wish to thank the TRS staff for their assistance in providing data for this study.
Respectfully submitted,
Gabriel, Roeder, Smith & Company
Lewis Ward
Consultant
Joseph P. Newton, FSA, EA Daniel Siblik, ASA
Pension Market Leader and Actuary Consultant

Table of Contents
Teacher Retirement System of Texas
Page
COVER LETTER
SECTION I EXECUTIVE SUMMARY 1
SECTION II INTRODUCTION 4
SECTION III ANALYSIS OF EXPERIENCE AND RECOMMENDATIONS 7
SECTION IV ACTUARIAL IMPACT OF RECOMMENDATIONS 27
SECTION V SUMMARY OF ASSUMPTIONS AND METHODS, INCORPORATING RECOMMENDED
ASSUMPTIONS 28
SECTION VI SUMMARY OF DATA AND EXPERIENCE 37

Teacher Retirement System of Texas 1
Section I – Executive Summary
Overall, most of the assumptions are currently reasonable or need minor adjustments. The items below that have a material impact to the funding requirements are the change to inflation, the change to the individual salary and total payroll growth assumptions, and finally most notably, the reduction in the investment return assumption. Our recommended changes to the current actuarial assumptions may be summarized as follows:
Economic Assumptions
1. We recommend decreasing the inflation assumption from 2.50% to 2.30%. This will have an impact on the nominal values of all other economic assumptions.
2. We recommend decreasing the nominal investment return assumption from the current 8.00% to no more than 7.25%. Based on the current capital market assumptions from Aon, TRS’ investment consultant, and the System’s target asset allocation, the median expected geometric returns over a 10 and 30 year time horizon are 7.14% and 7.34%, respectively. To verify those estimates we used eleven other independent sources and the average result from that survey was 7.07% and 7.32%. Based on the current duration of the liabilities of TRS and recognizing the impact cash flow has on the accumulation of assets, we believe the preferable time horizon for setting this assumption to be approximately 20-25 years. 7.25% would be very close to the midpoint of the 10 and 30 year results above.
3. The valuation currently assumes administrative expenses will be 0.12% of covered payroll, and this expense is included in the required contribution rate. We recommend lowering this assumption to 0.11%.
4. We recommend a general wage inflation (GWI) assumption of 3.00%, made up of price inflation
(2.30%) and general productivity (0.70%). This assumption is used primarily to index each cohort of new entrants used in projections and as a starting point for the individual salary scales and the payroll growth assumption (amortization payment growth rate).
5. We recommend decreasing the ultimate salary increase assumption for long-service employees from 1.00% to 0.75% above inflation. This means we will assume members with more than 25 years of service will receive nominal increases equal to 3.05% per year. This is a net decrease of 0.45% per year compared to the current assumption set. This recommendation reflects a reduction in inflation as well as a reduction in the spread between inflation and salary increases experienced in the overall economy. 3.05% is slightly higher than the 3.00% GWI assumption, which reflects a small provision for promotions and other forms of individual merit increases continuing throughout the member’s career.
6. In accordance with the observed experience, we are recommending small adjustments in the service-based promotional/longevity component of the salary scale.
7. We recommend setting the payroll growth assumption equal to the 3.00% GWI assumption. This assumption is used to project amortization payments that will be received by the System to

Teacher Retirement System of Texas 2
amortize the UAAL and thus has a direct impact on the calculated funding period.
8. We currently assume there will be no cost of living increases or supplemental payments provided to retirees. At this time, we recommend no change to this assumption.
Mortality Assumptions
9. We recommend updating the post-retirement mortality tables for non-disabled retirees to reflect recent TRS member experience. These tables will be labeled the 2018 TRS of Texas Healthy Pensioner Mortality Tables. We also recommend continuing to assume mortality rates will improve in the future using a fully generational approach, but with the ultimate rates of the most recently published projection scale (“U–MP”).
10. We recommend updating post-retirement mortality tables for disabled retirees to reflect recent TRS member experience, with no change to the current procedures. We also recommend continuing to assume mortality rates will improve in the future using a fully generational approach, but with the ultimate rates of the most recently published projection scale (“U–MP”).
11. We recommend no change to the current pre-retirement mortality tables for active employees. We also recommend continuing to assume mortality rates will improve in the future using a fully generational approach, but with the ultimate rates of the most recently published projection scale (“U–MP”).
Other Demographic Assumptions
12. We recommend increasing the termination rates for members consistent with experience and future expectations.
13. We recommend small decreases to the retirement rates for members consistent with experience and future expectations. We have explicitly lowered the patterns at all ages below 65 by 15% to reflect the changes to TRS-CARE in the 2017 legislative session. We recommend no change to the current assumption that active members will work a full year and then retire.
14. We recommend small adjustments to the disability patterns for members consistent with experience and future expectations. We are proposing a 1% additive increase on top of the proposed pattern for members in cohorts that reach rule of 80 but are not eligible for unreduced benefits.
15. For members that become disabled in the future, no change to the assumption that 20% of them will choose a 100% joint and survivor annuity option.
16. We recommend no change to the current marriage assumption and spousal age difference.
Actuarial Methods and Policies
17. We recommend no change to the current process of estimating the valuation payroll for the upcoming fiscal year, which is to use the actual known covered payroll for the previous fiscal year and increase it by one year’s payroll growth (3%).

Teacher Retirement System of Texas 3
18. We recommend a modification in how the contributions from employers on non-OASDI payroll are projected. Currently it is assumed that 60% of covered payroll will be eligible for the 1.5% contribution, and thus we model 0.9% of future total covered payroll. We will no longer make an explicit assumption on what percentage of total covered payroll will be eligible, but instead will use the actual amount of contribution from the previous fiscal year divided by the actual total payroll from the previous fiscal year to reset the effective rate annually. This change will increase the projected total contribution based on the current funding policy, and thus will decrease the funding period.
19. We recommend no change to the current asset smoothing method or the smoothing period.
20. We recommend changing to the Individual Entry Age (IEAN) actuarial cost method. The Ultimate Entry Age Normal cost method (UEAN) is the current funding method being used to allocate the actuarial costs of the System. Changing the method will allow for one set of liabilities to be used for funding and accounting purposes but will not have an impact on the funding period or the actuarially determined contribution requirements. The Individual Entry Age Normal method will generally produce level contribution amounts for each member as a percentage of salary from year to year, but in a plan with benefit tiers, will produce a normal cost for the plan as a whole that changes over time. Thus, for a plan that receives its contribution as a fixed percent of payroll, the IEAN method does not allow for a simple and algebraic calculation of the funding period and contribution requirements. Prospectively, the funding period will be determined based on an open group projection. In an open group projection, the demographic assumptions are applied to the current active members and any members that are assumed to leave employment are replaced with new members. Over time this results in the change of the membership to mostly members hired into the less expensive benefit structure and incorporates the fact that the normal cost rate will trend down over time when determining the funding period. The projection is built to assume no gains or losses on the actuarial accrued liability, the actuarial value of assets, the plan demographics, or the change in payroll over time.
21. We recommend continuing to use individual data records in the valuation process. However, the use of individual data extends the computer run time dramatically. Thus, we will continue to use celled data in legislative analyses and adjust for any difference between the two data sets.
Impact of all recommended changes:
Item 2017
Valuation Recommended
Assumptions
(1) (2) (3)
Total Normal Cost % 10.06% 11.65%
Unfunded Actuarial Accrued Liability ($ in Billions)
$35.5 $45.9
Funded Ratio 80.5% 76.1%
30 Year Actuarially Determined Contribution (employee plus employer)
15.55% 17.38%

Teacher Retirement System of Texas 4
Section II – Introduction
A periodic review and selection of the actuarial assumptions is one of many important components of understanding and managing the financial aspects of the Teacher Retirement System of Texas (TRS). Use of outdated or inappropriate assumptions can result in understated costs which will lead to higher future contribution requirements or perhaps an inability to pay benefits when due; or, on the other hand, produce overstated costs which place an unnecessarily large burden on the current generation of members, employers, and taxpayers.
A single set of assumptions is typically not expected to be suitable forever. As the actual experience unfolds or the future expectations change, the assumptions should be reviewed and adjusted accordingly.
It is important to recognize that the impact from various outcomes and the ability to adjust from experience deviating from the assumption are not symmetric. Due to compounding economic forces, legal limitations, and moral obligations outcomes from underestimating future liabilities are much more difficult to manage than outcomes of overestimates, and that un-symmetric risk should be considered when the assumption set, investment policy and funding policy are created. As such, the assumption set used in the valuation process needs to represent the best estimate of the future experience of the System and be at least as likely, if not more than likely, to overestimate the future liabilities versus underestimate them.
Using this strategic mindset, each assumption was analyzed compared to the actual experience of TRS and general experience of other large public employee retirement systems. Changes in certain assumptions and methods are suggested upon this comparison to remove any bias that may exist and to perhaps add in a slight margin for future adverse experience where appropriate. Next, the assumption set as a whole was analyzed for consistency and to ensure that the projection of liabilities was reasonable and consistent with historical trends.
The following report provides our recommended changes to the current actuarial assumptions.
S U M M A R Y O F P R O C E S S
In determining liabilities and contribution rates for retirement plans, actuaries must make assumptions about the future. Among the assumptions that must be made include:
• Retirement rates
• Mortality rates
• Turnover rates
• Disability rates
• Investment return rate
• Salary increase rates
• Inflation rate

Teacher Retirement System of Texas 5
For some of these assumptions, such as the mortality rates, past experience provides important evidence about the future. For others, such as the investment return assumption, the link between past and future results is much weaker. In either case, actuaries should review the plan’s assumptions periodically and determine whether these assumptions are consistent with actual past experience and with anticipated future experience.
The last such actuarial experience investigation was performed immediately following the August 31, 2014 actuarial valuation. For this experience study, we have added TRS’ experience for the three-year period from August 31, 2014 through August 31, 2017 (FY 2015 – FY 2017).
In conducting experience studies, actuaries generally use data over a period of several years. This is necessary in order to gather enough data so that the results are statistically significant. In addition, if the study period is too short, the impact of the current economic conditions may lead to misleading results. It is known, for example, that the health of the general economy can impact salary increase rates and termination rates. Using results gathered during a short-term boom or bust will not be representative of the long-term trends in these assumptions. Also, the adoption of legislation, such as plan improvements or changes in salary schedules, will sometimes cause a short-term distortion in the experience. For example, if an early retirement window was opened during the study period, we would usually see a short-term spike in the number of retirements followed by a dearth of retirements for the following two-to-four years. Using a longer period prevents giving too much weight to such short-term effects. On the other hand, using a much longer period could water down real changes that may be occurring, such as mortality improvement or a change in the ages at which members retire.
For this analysis, we used between three and twenty years of data, depending on the assumption being studied as follows:
Assumption Data Used Comment
Payroll Growth 20 Years Long term trends are needed, also prospective changes must be considered
Individual Salary Increases 10 Years Longer period will capture a longer economic cycle
Termination 10 Years Longer period will capture a longer economic cycle
Post-Retirement Mortality 3 Years Shorter period captures the most recent improvement.
All other 5 Years The assumptions react quicker to changing trends and are less correlated with the economic cycle
In an experience study, we first determine the number of deaths, retirements, etc. that occurred during the period. Then we determine the number expected to occur, based on the current actuarial assumptions. The number of “expected” decrements is determined by multiplying the probability of

Teacher Retirement System of Texas 6
the occurrence at the given age, by the “exposures” at that same age. For example, let’s look at a rate of retirement of 15% at age 55. The number of exposures can only be those members who are age 55 and eligible for retirement at that time. Thus they are considered “exposed” to that assumption. Finally, we calculate the A/E ratio, where "A" is the actual number (of retirements, for example) and "E" is the expected number. If the current assumptions were “perfect”, the A/E ratio would be 100%. When it varies much from this figure, it is a sign that new assumptions may be needed. (However, in some cases we prefer to set our assumptions to produce an A/E ratio a little above or below 100%, in order to introduce some conservatism.) Of course we not only look at the assumptions as a whole, but we also review how well they fit the actual results by gender, by age, and by service.
If the data leads the actuary to conclude that new tables are needed, the actuary may "graduate" or smooth the results, since the raw results can be quite uneven from age to age or from service to service.
O R G A N I Z A T I O N O F R E P O R T
Section III contains our findings and recommendations for each actuarial assumption. The impact of adopting our recommendations on liabilities and contribution rates is shown in Section IV. Section V presents a summary of all the actuarial assumptions and methods, including the recommended changes.
S E C T I O N V I E X H I B I T S
The exhibits in Section VI should generally be self-explanatory. For example, on page 54, we show an exhibit analyzing the termination rates for females with 10 or more years of service. The second column shows the total number of female members with at least 10 years of service who terminated during the study period. This excludes members who died, became disabled or retired. Column (3), labeled “Total Termination Liability” shows the total exposures of this group. This is the liability associated with members who meet the criteria who could have terminated during any of the years. On this exhibit, the exposures exclude anyone eligible for unreduced retirement. A member is counted in each year they could have terminated, so the total shown is the total liability for the ten-year period of members exposed to termination decrements. Column (4) shows the probability of termination based on the raw data. That is, it is the result of dividing the actual termination liability (col. 2) by the termination liability exposed (col. 3). Column (5) shows the current termination rates and column (6) shows the new recommended termination rates. Columns (7) and (8) show the expected termination liability based on the current and proposed termination assumptions over the ten-year period. Columns (9) and (10) show the Actual-to-Expected ratios under the current and proposed termination assumptions.

Teacher Retirement System of Texas 7
Section III - Analysis of Experience and Recommendations
We will begin by discussing the economic assumptions: inflation, the investment return rate, the salary increase assumption, the cost-of-living increases, and the payroll growth rate. Then we will discuss the demographic assumptions: mortality, disability, termination and retirement. Finally we will discuss the actuarial methods used.
Actuarial Standards of Practice for Setting Economic Assumptions
Actuarial Standards of Practice (ASOP) No. 27, Selection of Economic Assumptions for Measuring Pension Obligations, provides guidance to actuaries on giving advice on selecting economic assumptions for measuring obligations for defined benefit pension plans. ASOP No. 27 was revised and adopted by the Actuarial Standards Board (ASB) in September 2013 and supplements ASOP 4, Measuring Pension Obligations and Determining Plan Costs or Contributions.
As no one knows what the future holds, it is necessary for an actuary to estimate possible future economic outcomes. Recognizing that there is not one right answer, the current standard calls for an actuary to develop a reasonable economic assumption. A reasonable assumption is one that:
1. Is appropriate for the purpose of the measurement,
2. reflects the actuary’s professional judgment,
3. takes into account historical and current economic data that is relevant as of the measurement date,
4. is an estimate of future experience; an observation of market data; or a combination thereof, and
5. has no significant bias except when provisions for adverse deviation or plan provisions that are difficult to measure are included.
However, the standard explicitly advises an actuary not to give undue weight to recent experience.
Each economic assumption should individually satisfy this standard. Furthermore, with respect to any particular valuation, each economic assumption should be consistent with every other economic assumption over the measurement period. Generally, the economic assumptions are much more subjective in nature than the demographic assumptions.
I N F L A T I O N A S S U M P T I O N
“Inflation” refers to price inflation, as measured by annual increases in the Consumer Price Index (CPI). This inflation assumption underlies all of the other economic assumptions we employ. It not only impacts investment return, but also salary increase rates, and the payroll growth assumption. The current annual inflation assumption is 2.50%. We are proposing to lower this assumption to 2.30%.

Teacher Retirement System of Texas 8
Over the five-year period from August 2012 through August 2017, the CPI-U has increased at an average rate of 1.28%. However, the prospective inflation rate is only weakly tied to past results.
The table below shows the average inflation over various periods, ending August 2017:
Periods Ending August 2017 Average Annual Increase in CPI-U
Last five (5) years 1.28%
Last ten (10) years 1.68%
Last fifteen (15) years 2.06%
Last twenty (20) years 2.14%
Last twenty-five (25) years 2.25%
Last fifty (50) years 4.06%
Since 1913 (first available year) 3.13%
Source: Bureau of Labor Statistics, CPI-U, all items, not seasonally adjusted
The chart on the following page shows the average annual inflation in each of the ten consecutive five-year periods over the last fifty years:
As the table shows, inflation has been relatively low over the last twenty-five years and historically low over the past 10 years.

Teacher Retirement System of Texas 9
Forecasts from Investment Consulting Firms
Most of the investment consulting firms in our survey, in setting their capital market assumptions, currently assume that inflation will be less than 2.50%. We examined the 2017 capital market assumption sets for several investment consulting firms and found the average assumption for inflation was 2.29%, with a range of 2.00% to 2.50%. TRS’ investment consultant, Aon, has a prospective assumption of 2.30%.
Forecasts from Social Security Administration
In the Social Security Administration’s 2017 Trustees Report, the Office of the Chief Actuary is projecting a long-term average annual inflation rate of 2.6% under the intermediate cost assumption. The low cost and high cost scenarios are 2.0% and 3.2%, respectively. All three of these numbers are unchanged from the prior year’s report.
Expectations Implied in the Bond Market
Another source of information about future inflation is the market for US Treasury bonds. For example, the November 30, 2017 yield for 20-year inflation indexed Treasury bonds was 0.82% plus actual inflation. The yield for 20-year non-indexed US Treasury bonds was 2.75%. Simplistically, this means that on that day the bond market was predicting that inflation over the next twenty years would average 1.93% (2.75% – 0.82%) per year. The difference in yield for 30 year bonds implies 2.06% inflation over the next 30 years. This is consistent with most forecasts of inflation and overall economic growth being lower over the next decade. The chart below shows the historical market implied inflation from January 2003 through November 2017
0.00
0.50
1.00
1.50
2.00
2.50
3.00
3.50
Jan2003
Jan2004
Jan2005
Jan2006
Jan2007
Jan2008
Jan2009
Jan2010
Jan2011
Jan2012
Jan2013
Jan2014
Jan2015
Jan2016
May2017
Market Implied Inflation - US Treasury Bond Market
Implied Inflation 20-year Bonds Implied Inflation 30-Year Bonds.

Teacher Retirement System of Texas 10
Historically, this has been a consistent predictor of future inflation. However, this analysis is known to be imperfect as it ignores the inflation risk premium that buyers of US Treasury bonds often demand as well as possible differences in liquidity between US Treasury bonds and TIPS.
Survey of Professional Forecasters and Fed Policy
The Philadelphia Federal Reserve conducts a quarterly survey of the Society of Professional Forecasters. Their most recent forecast (fourth quarter of 2017) was for inflation over the next ten years (2018 to 2027) to average 2.20%.
Additionally, the Fed has openly stated recently that they have a target 2.00% inflation rate.
Recommendation
Using these sources, we recommend reducing the current 2.50% assumption to 2.30%, placing it closer to recent inflation levels and closer to the levels expected in the financial markets. TRS has more risk exposure to inflation being lower than assumed compared to higher as much of the liability is not correlated to inflation. As you will see, this change also affects other economic assumptions as it is the building block added to other economic assumption components to get the total nominal assumptions.
I N V E S T M E N T A N D A D M I N I S T R A T I V E E X P E N S E S
Since the trust fund pays expenses in addition to member benefits and refunds, we must make some assumption about these. Almost all actuaries treat investment expenses as an offset to the investment return assumption. That is, the investment return assumption represents expected return after payment of investment expenses.
In regards to investment expenses, investment consulting firms periodically issue reports that describe their capital market assumptions. The estimates for core investments (i.e., fixed income, equities, and real estate) are generally based on anticipated returns produced by passive index funds that are net of investment related fees. The investment return expectations for the alternative asset class such as private equity and hedge funds are also net of investment expenses. Therefore, we did not make any adjustments to account for investment related expenses. Some of the retirement systems may also employ active management investment strategies that result in higher investment expenses compared to strategies that invest in passive index funds. We have assumed that active management strategies would result in the same returns, net of investment expenses, as passive management strategies.
On the other hand, for TRS, the practice for administrative expenses has been to explicitly add a load onto the normal cost. This is also our preferred approach and we recommend continuing this practice. Using an explicit load onto the normal cost maximizes transparency, aligns better with the standards of the Governmental Accounting Standards Board, and maintains a parallel between the investment returns used by the investment consultant and the actuary.
The following table provides the actual administrative expenses as a percentage of covered payroll for the last four years, along with our recommended assumptions.

Teacher Retirement System of Texas 11
FY17 FY16 FY15 FY14 Average Current
Assumption Recommended
Assumption
TRS 0.105% 0.109% 0.092% 0.114% 0.105% 0.12% 0.11%
I N V E S T M E N T R E T U R N R A T E
The investment return assumption is one of the principal assumptions used in any actuarial valuation of a retirement plan. It is used to discount future expected benefit payments to the valuation date in order to determine the liabilities of the plan. Even a small change to this assumption can produce significant changes to the liabilities and contribution rates. Currently, it is assumed that future investment returns will average 8.00% per year, net of investment expenses.
Similar to the inflation assumption, past performance is not a reliable indicator of future performance, even when averaged over a long time period. Also, the actual asset allocation of the trust fund will significantly impact the overall performance, so returns achieved under a different allocation may not be meaningful.
Assumption Comparison to Peers
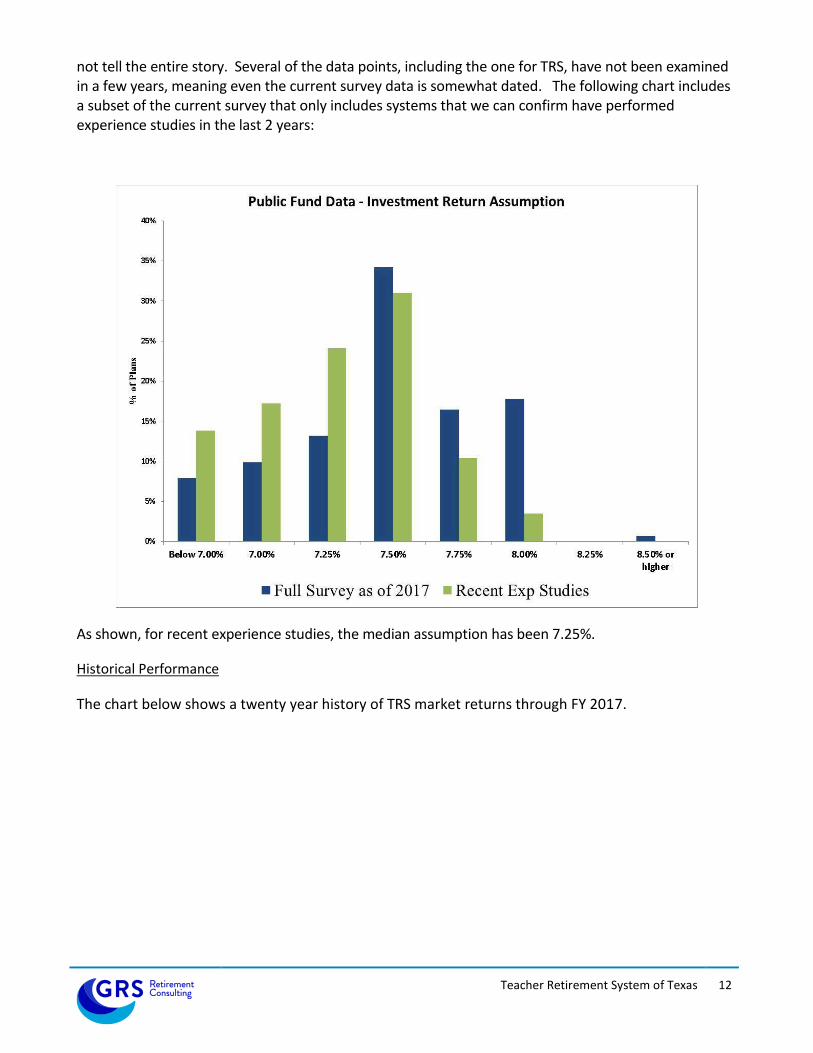
We do not recommend the selection of an investment return assumption based on prevalence information. However, it is still informative to identify where the investment return assumption for TRS is compared to its peers. The chart below shows the distribution of the investment return assumptions in the NASRA Public Fund Data as of February 2017.
We have included the same information from the 2011 survey to show the national trends in this assumption. The median rate of return is 7.50% and the average is 7.54%. However, this chart does
Current Assumption for TRS
Teacher Retirement System of Texas 12
not tell the entire story. Several of the data points, including the one for TRS, have not been examined in a few years, meaning even the current survey data is somewhat dated. The following chart includes a subset of the current survey that only includes systems that we can confirm have performed experience studies in the last 2 years:
As shown, for recent experience studies, the median assumption has been 7.25%.
Historical Performance
The chart below shows a twenty year history of TRS market returns through FY 2017.

Teacher Retirement System of Texas 13
The returns in the chart above are market returns as reported in the actuarial valuations on a dollar weighted basis. TRS did exceed the expected 8.00% return assumption in twelve of the last twenty years, but the average market return during this period was approximately 7.00%.
However, for this assumption, past performance, even averaged over a twenty-year period, is not a reliable indicator of future performance. The actual asset allocation of the trust fund will significantly impact the overall performance, so returns achieved under a different allocation may not be meaningful. More importantly, the real rates of return for many asset classes, especially equities, vary so dramatically from year to year that even a twenty-year period is not long enough to provide reasonable guidance.
A S S E T A L L O C A T I O N
We believe the most appropriate approach to selecting an investment return assumption is to identify expected returns given the funds’ asset allocation mapped to forward-looking capital market assumptions. We view the investment return assumption as having two components: the assumed rate of (price) inflation plus the real return net of inflation. This “building block” approach is one explicitly permitted under ASOP 27. The inflation assumption has already been discussed, so we will proceed with the analysis of the real rate of return assumption.
To do this, we will examine the results of applying a set of capital market assumptions to the plan’s target asset allocation. Because GRS is a benefits consulting firm and does not develop or maintain our own capital market assumptions, we typically will utilize the forward-looking return expectations developed by several investment consulting firms. The following is an excerpt from ASOP 27 on the topic of using experts:
Section 3.5.6 Views of Experts—Economic data and analyses are available from a variety of sources, including representatives of the plan sponsor and administrator, investment advisors, economists, and other professionals. When the actuary is responsible for selecting or giving
7.8%
21.1%
14.0%
-10.5%-7.8%
11.0%11.9%14.4%
9.6%
14.4%
-4.18%
-13.49%
10.73%
15.49%
7.41%8.90%
16.81%
-0.34%
7.26%
12.93%
-20.0%
-15.0%
-10.0%
-5.0%
0.0%
5.0%
10.0%
15.0%
20.0%
25.0%
20-Year Historical Return On a Market Value Basis(Dollar Weighted)
Teacher Retirement System of Texas 14
advice on selecting economic assumptions within the scope of this standard, the actuary may incorporate the views of experts but the selection or advice should reflect the actuary’s professional judgment.
In our professional judgement, the consulting firms we included in our survey are experts with specialized knowledge and it is appropriate to incorporate their outlooks in our analysis.
We will give a higher emphasis to the estimates produced by Aon, TRS’ investment consultant as they are more familiar with TRS’ specific investments, but we will also verify with other independent sources.
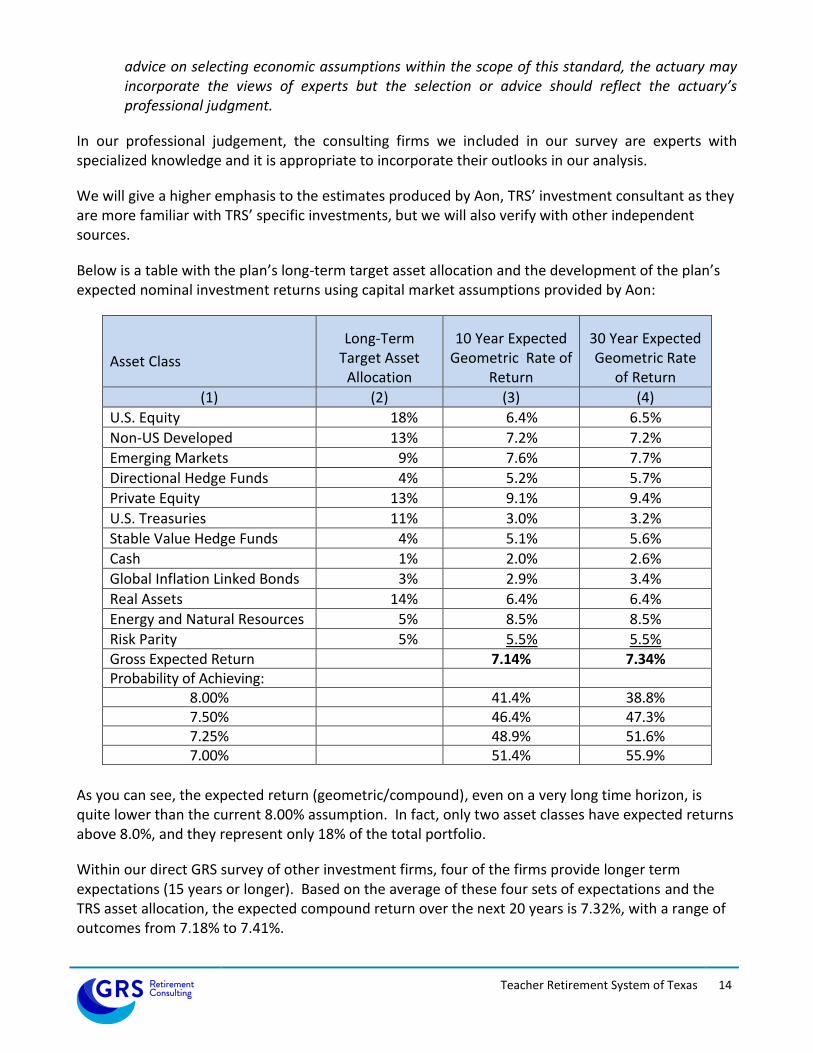
Below is a table with the plan’s long-term target asset allocation and the development of the plan’s expected nominal investment returns using capital market assumptions provided by Aon:
Asset Class
Long-Term Target Asset
Allocation
10 Year Expected Geometric Rate of
Return
30 Year Expected Geometric Rate
of Return
(1) (2) (3) (4)
U.S. Equity 18% 6.4% 6.5%
Non-US Developed 13% 7.2% 7.2%
Emerging Markets 9% 7.6% 7.7%
Directional Hedge Funds 4% 5.2% 5.7%
Private Equity 13% 9.1% 9.4%
U.S. Treasuries 11% 3.0% 3.2%
Stable Value Hedge Funds 4% 5.1% 5.6%
Cash 1% 2.0% 2.6%
Global Inflation Linked Bonds 3% 2.9% 3.4%
Real Assets 14% 6.4% 6.4%
Energy and Natural Resources 5% 8.5% 8.5%
Risk Parity 5% 5.5% 5.5% Gross Expected Return 7.14% 7.34% Probability of Achieving:
8.00% 41.4% 38.8% 7.50% 46.4% 47.3% 7.25% 48.9% 51.6% 7.00% 51.4% 55.9%
As you can see, the expected return (geometric/compound), even on a very long time horizon, is quite lower than the current 8.00% assumption. In fact, only two asset classes have expected returns above 8.0%, and they represent only 18% of the total portfolio.
Within our direct GRS survey of other investment firms, four of the firms provide longer term expectations (15 years or longer). Based on the average of these four sets of expectations and the TRS asset allocation, the expected compound return over the next 20 years is 7.32%, with a range of outcomes from 7.18% to 7.41%.
Teacher Retirement System of Texas 15
Our survey also includes seven sets of expectations based on a 7-10 year time horizon. Based on the average of these sets of expectations and the TRS asset allocation, the expected compound return over the next 10 years is 7.07%. This shows much of the investment community is anticipating lower returns over the next decade compared to longer time frames.
In our opinion, the process above meets all of the requirements needed to use that as a basis for our analysis. The results were appropriate for the purpose of the measurement as the estimates were medium to longer term forecasts of market expectations, they took into account historical and current economic data that is relevant as of the measurement date, they represent an estimate of future experience and an observation of market data, and they had no significant bias (i.e., it is not significantly optimistic or pessimistic).
R E C O M M E N D A T I O N
If the liability stream of TRS were compared to a portfolio of bonds, it would behave similarly to a bond with 24 year duration. Or put another way, the average interest discounted benefit payment will occur 24 years from the valuation date. Also, in Board education sessions, we have shown that order matters when a System has negative cash flows, with scenarios that underperform first accumulating less assets over time even if returns are met over the longer term.
Based on the current duration of the liabilities of TRS and recognizing the impact cash flow has on the accumulation of assets, we believe the preferable time horizon for setting this assumption to be approximately 20 years.
In our professional judgement, we believe a 7.25% assumption meets the requirements under ASOP 27 for being a reasonable assumption. It is very close to the 30 year numbers provided by Aon (and verified by other sources), but a little lower to reflect the lower expectations over the short term.
This original analysis was performed in early Spring of 2018 using Aon’s 1st quarter 2018 capital market expectations. Just prior to the Board adopting the new assumptions at the July Board meeting, Aon had published their 3rd quarter assumptions, and the shorter term assumptions had increased from 7.14% to 7.21%, while the longer term assumptions had decreased from 7.34% to 7.27%. We believe both data points point towards 7.25% being the best estimate of future experience.
C O S T - O F - L I V I N G I N C R E A S E A S S U M P T I O N
TRS does not provide automatic post-retirement cost of living adjustments (COLAs) to retired members. It has been past practice for the legislature to periodically grant ad hoc COLAs, when it is determined that the system can afford to absorb the cost. As we have seen over the last decade, the COLAs are certainly not automatic. We recommend continuing to assume no future COLAs in the annual valuations.
G E N E R A L W A G E I N F L A T I O N
A General Wage Inflation (GWI) assumption represents the real wage growth over time in the general economy, or, is the assumption on how much the pay scales themselves will change year to year, not necessarily how much the pay increases received by individuals are, or even necessarily how the payroll in total may change, which can be impacted by population changes, etc. This assumption should be

Teacher Retirement System of Texas 16
applicable to a local economy, not necessarily one group inside a retirement system. This assumption is used primarily to index the pay of each group of new entrants used in the open group projections. In an open group projection, projected terminations from the current active population are replaced with projected new entrants.
Historically, General Wage Inflation has almost always exceeded price inflation. This is because wage inflation is in theory the result of (a) price inflation, and (b) productivity gains being passed through to wages. Since 1951, for the national economy as a whole, wage inflation has been about 1.00% larger than price inflation on average. For the last 10 years, for the national economy as a whole, wage inflation has been 2.67%, outpacing price inflation by about 0.61%.
We are recommending a 0.70% real productivity growth assumption, which is slightly higher than the last ten years but lower than the longer historical values. Combined with our core inflation assumption, this produces a nominal 3.00% GWI assumption.
S A L A R Y I N C R E A S E R A T E S
In order to project future benefits, the actuary must project future salary increases for individuals. Salaries may increase for a variety of reasons:
Across-the-board increases for all employees;
Across-the-board increases for a given group of employees;
Increases to a minimum salary schedule;
Additional pay for additional duties;
Step or service-related increases;
Increases for acquisition of advanced degrees or specialized training;
Promotions; or
Merit increases, if available.
Our salary increase assumption is meant to reflect all of these types of increases.
The actuary should not look at the overall increases in payroll in setting this assumption, because payroll can grow at a rate different from the average pay increase for individual members. To analyze salary increases, we examine the actual increase in salary for each member who is active in two consecutive fiscal years.
Most actuaries recommend salary increase assumptions that include an element that depends on the member’s age or service, especially for large, public retirement systems. It is typical to assume larger pay increases for younger or shorter-service employees. This is done in order to reflect pay increases that accompany step increases, changes in job responsibility, promotions, demonstrated merit, etc. The experience shows salaries have been more closely correlated to service (rather than age), as promotions and productivity increases tend to be greater in the first few years of a career, even if the new employee is older than the average new hire.
We analyzed the salary increases based on the change in the member’s reported pay from one year to the next. That is, we looked at each member who appeared as an active member in two

Teacher Retirement System of Texas 17
consecutive valuations individually, and measured his/her salary increase. Then we grouped the increases for all members with the same service, and determined their average increase.
The current assumption is composed of the general wage inflation assumption plus a merit and promotion component that is based on the service of an individual. The current schedule ranges from 9.50% for new members to 3.50% for members with 25 or more years of service.
Salary increases for governmental employees can vary significantly from year to year. When the employer’s tax revenues stall or increase slowly, salary increases often are small or nonexistent. During good times, salary increases can be larger. Our experience across many governmental plans also shows several occasions in which salary increases will be low for a period of several years followed by a significant increase in one year. Therefore, for this assumption in particular, we prefer to use data over a longer period in establishing our assumptions. We used a ten-year period for this analysis (but also looked back at older studies). The average pay increases for members active in both valuations with two years of service or more are as follows:
Period Increase Inflation Increase Above Inflation
FY 2007 to FY 2008 4.25% 5.37% -1.12% FY 2008 to FY 2009 4.24% -1.48% 5.72% FY 2009 to FY 2010 3.27% 1.15% 2.12% FY 2010 to FY 2011 1.85% 3.77% -1.92% FY 2011 to FY 2012 1.22% 1.69% -0.47% FY 2012 to FY 2013 2.05% 1.52% 0.53% FY 2013 to FY 2014 3.68% 1.70% 1.98% FY 2014 to FY 2015 3.14% 0.20% 2.94% FY 2015 to FY 2016 4.76% 1.06% 3.70% FY 2016 to FY 2017 3.14% 1.94% 1.20%
Average 3.35% 1.68% 1.67%
The average increase is 3.35%, or 1.67% above inflation. The expected increase above inflation was 1.86%, meaning the actual increases have been lower than expected, even on real terms when the difference in inflation has been removed.
To separate the steps, or promotional component of the schedule, we segregated out members with more than 25 years of service. Most of these members should be past the promotional and step portions of their careers and therefore, only receive the general increases granted. The actual productivity increase during the ten year period was 0.59%, much lower than the assumed 1.00%, and close to national averages.
Period Overall Increase for Long Service
Members
Inflation Increase Above Inflation
FY 2007 to FY 2008 2.98% 5.37% -2.39% FY 2008 to FY 2009 3.20% -1.48% 4.68% FY 2009 to FY 2010 2.15% 1.15% 1.00%
Teacher Retirement System of Texas 18
FY 2010 to FY 2011 1.35% 3.77% -2.42% FY 2011 to FY 2012 1.03% 1.69% -0.66% FY 2012 to FY 2013 1.38% 1.52% -0.14% FY 2013 to FY 2014 2.75% 1.70% 1.05% FY 2014 to FY 2015 2.32% 0.20% 2.12% FY 2015 to FY 2016 3.44% 1.06% 2.38% FY 2016 to FY 2017 2.18% 1.94% 0.24%
Average 2.27% 1.68% 0.59%
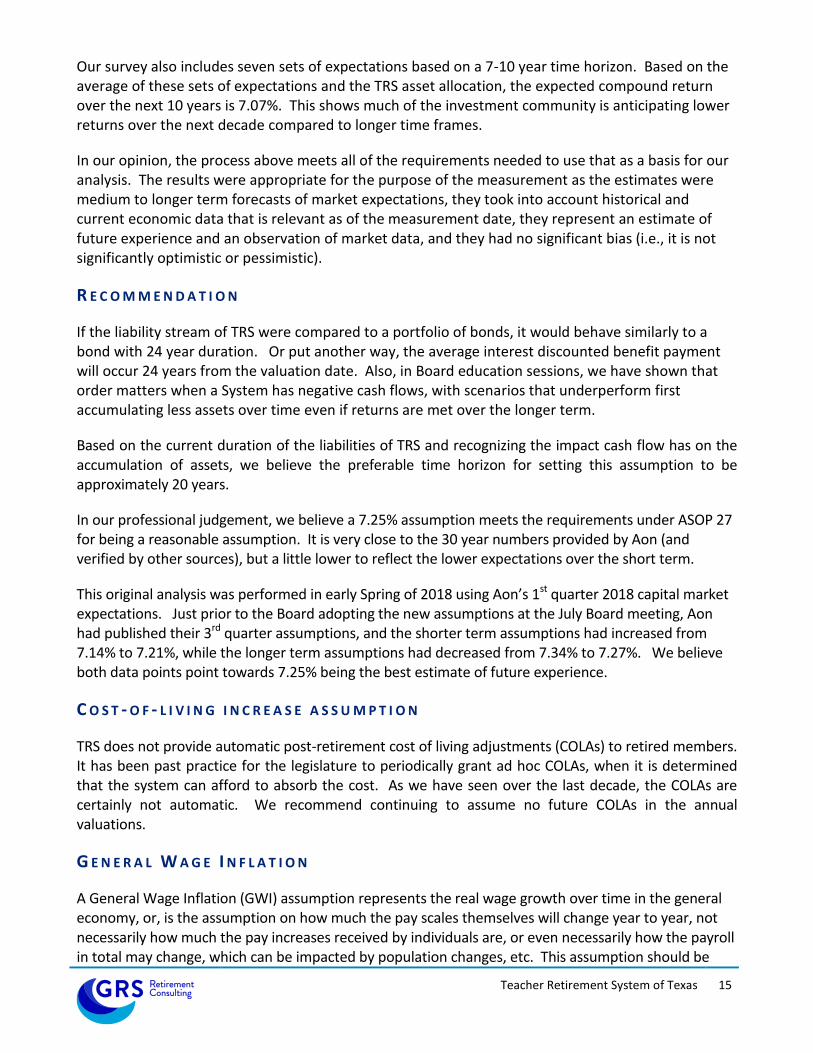
Based on this trend, we are recommending a change to the current assumption to lower the long term productivity assumption from the current 1.00% to 0.75%. While recent experience has been even lower, over the past 20 years long service members have had increases of 0.79%.
The net impact of lowering the inflation assumption from 2.50% to 2.30% and decreasing the long service real productivity and merit from 1.00% over inflation to 0.75% over inflation computes to a net decrease of 0.45% in the assumed salary increases for long service members. This change would decrease the projected liabilities of current active members and materially decrease the normal cost as a percentage of salaries.
The above exhibit models the portion of the salary increases for short term members that exceeded the salary increases for long term members based on the current assumptions, the actual experience, and a set of new proposed assumptions. You can see that the actual increases were slightly lower than the current assumption for lower years of service. Based on this experience, we are recommending a slight overall decrease to the salary increase assumptions.
Based on the new schedule, the cumulative increases from service 1 to 25 decreases approximately 10%, meaning for a new member, the projected salary at the end of 25 years is expected to be 10%

Teacher Retirement System of Texas 19
lower under the new assumptions. This would create a decrease in the normal cost and unfunded liability.
P A Y R O L L G R O W T H R A T E
The salary increase rates discussed above are assumptions applied to individuals. They are used in projecting future benefits. We also use an overall payroll growth assumption, currently 2.50%, in determining the contributions needed to amortize the unfunded actuarial accrued liability. The “Funding Period” determined in the valuation is answering the question: “when is the current UAAL expected to be reduced to $0.” This calculation reflects the fact that contributions are received as a percentage of payroll, so as payroll increases over time, these contributions do too. Thus, the funding period is dependent on the rate at which payroll is assumed to increase.
The default should be that the Payroll Growth Rate is equal to the GWI assumption. And over the longer term, it will. However, the payroll growth rate used to determine the funding period should reflect how fast payroll is expected to grow over that specific period if the demographics of the group are not uniform. For example, due to the baby boom generation, the current demographic of many pension plans has an abnormally high number of people eligible to retire. When those people retire, they will be replaced by members at the beginning of the pay scale. Thus, even if salary increases for individuals are changing as expected, overall payroll growth can be dampened over the short to medium term.
One way to estimate this assumption is to produce an open group projection assuming increases in the pay of the new entrants changes at the GWI assumption and compare the rates of growth. We have performed open group projections that show payroll will grow over the next couple of decades at approximately 2.92% per year as the baby boom generation reaches retirement, and then drifts up to 3.00%. We believe this is close enough to the 3.00% GWI assumption and are recommending the payroll growth assumption be set equal to the default 3.00%.
D E M O G R A P H I C A S S U M P T I O N S
Actuaries are guided by the Actuarial Standards of Practice (ASOP) adopted by the Actuarial Standards Board (ASB). One of these standards is ASOP No. 35, Selection of Demographic and Other Noneconomic Assumptions for Measuring Pension Obligations. This standard provides guidance to actuaries giving advice on selecting noneconomic assumptions for measuring obligations under defined benefit plans. We believe the recommended assumptions in this report were developed in compliance with this standard.
P O S T - R E T I R E M E N T M O R T A L I T Y R A T E S
TRS’ actuarial liabilities and retirement contribution rates depend on how long retirees live. If members live longer, benefits will be paid for a longer period of time and the liability and ultimate retirement contribution rates will be larger.
The issue of future mortality improvement is one that the governing bodies of our profession have increasingly become more focused on studying and ensuring that the actuarial profession remains on the forefront of this issue. This has resulted in recent changes to the relevant Actuarial Standard of

Teacher Retirement System of Texas 20
Practice, ASOP 35, and published practice notes. This ASOP now requires pension actuaries to make and disclose an assumption as to expected mortality improvement after the valuation date.
To meet this standard, a recent trend in actuarial models is to use mortality tables that explicitly incorporate projected mortality improvements over time. This type of table (or series of tables) is called “generational mortality.” Specifically, mortality rates are assumed to decline each year in the future so that life expectancies for each annual cohort of retirees will be slightly higher than the previous year’s. Therefore, the life expectancy at age 60 for someone reaching 60 now will not be as long as the life expectancy for someone reaching 60 in 2025, and their life expectancy will not be as long as someone reaching 60 in 2040, etc.
Because of this assumption of continuous improvement, life expectancies for today’s younger active members are expected to be materially longer than those of today’s retirees. By utilizing generational mortality, the improvement over time is built into the contributions for individual members while they
are employed.
Credibility
When choosing an appropriate mortality assumption, actuaries typically use standard mortality tables, unlike when choosing other demographic assumptions. They may choose to adjust these standard mortality tables, however, to reflect various characteristics of the covered group, and to provide for expectations of future mortality improvement (both up to and after the measurement date). If the plan population has sufficient credibility to justify its own mortality table, then the use of such a table also could be appropriate. Factors that may be considered in selecting and/or adjusting a mortality table include the demographics of the covered group, the size of the group, the statistical credibility of its experience, and the anticipated rate of future mortality improvement.
We first measured the credibility of the dataset to determine whether standard, unadjusted tables should be used or if statistical analysis of TRS specific data was warranted. Based on a practice note issued by the American Academy of Actuaries in the fall of 2011, a dataset needs 96 expected deaths for each gender to be within +/- 20% of the actual pattern with 95% confidence. We believe +/- 20% is a rather large range to be considered fully credible. Other sources state higher requirements, such as 1,000 deaths per gender. The following table gives the number of deaths needed by gender to have a given level of confidence that the data is +/- X% of the actual pattern.
Confidence99% –
101%
97% –
103%
95% –
105%
90% –
110%
80% –
120%
0.674 75% 4,543 505 182 45 11
1.282 80% 16,435 1,826 657 164 41
1.645 90% 27,060 3,007 1,082 271 68
1.96 95% 38,416 4,268 1,537 384 96
2.576 99% 66,358 7,373 2,654 664 166
Standard Score

Teacher Retirement System of Texas 21
Using this information, 1,082 deaths are needed by gender to have 90% confidence that the data is within +/- 5% of the actual pattern. Just in fiscal year 2017, TRS experienced 2,753 male and 5,477 female deaths, clearly indicating it is a highly credible group.
Considering there is no published table based on data similar to TRS in geography or occupation, and that the data from this experience study is much more recent than even the data used to create the RP2014 mortality tables, we will continue to develop client specific mortality tables utilizing the TRS data.
TRS specific analysis
The mortality table currently being used for non-disabled retirees and for beneficiaries receiving benefits is the 2015 TRS of Texas Healthy Pensioner Mortality Tables, which is a TRS specific table created in the 2015 Experience Study. The table has separate rates for males and females. Our strategy is to update this table with each experience study to ensure that our Base tables are as current as possible. This strategy allows for making minor, frequent adjustments instead of large adjustment every decade or so.
For this analysis, we have weighted the analysis by the amount of the member’s monthly annuity. This is consistent with the development of all recent national tables as data shows a clear correlation between income and longevity. By weighting the data by annuity values, we are giving more weight to members who have larger annuities (and thus have larger liabilities).
We begin by determining the expected number of deaths in each year at each age for males and females. Then we compare the actual number to the expected number. The ratio of the actual deaths to the expected deaths (the A/E ratio) tells us whether the assumptions are reasonable. When using a generational approach for mortality improvement, an A/E of 100% is targeted. We will discuss this in two parts, the recommended base mortality assumption, and the recommended mortality improvement assumption.
The actual rate of improvement slightly outpaced the current assumed rate since the previous experience study. The A/E ratios in total (across all ages) for males and females were 99% and 96%, respectively, but these A/E ratios overstate the deviation in the experience as the data is over weighted towards members who have retired in the last 5 years, who will have lower mortality experience than a member who has been retired for a longer time.
Recommended Base Mortality Assumption
Since TRS has enough experience to credibly model post-retirement mortality, we have developed and
recommended base mortality assumptions that are specific to TRS.
The proposed base mortality assumptions are based on TRS’s experience for the three-year period ending August 31, 2017. We intentionally used a three-year period for developing a morality assumption because this is the most recent experience and reflects the most recent improvements in longevity. Using a larger experience period would provide slightly more credibility to the data, but could temper real changes that have occurred in the mortality assumption due to changes, or improvements, observed in this assumption.

Teacher Retirement System of Texas 22
To develop the recommended mortality assumptions, mortality rates for ages after 60 are based on the System’s experience, using an exponential model to provide a smooth fit to the experience. This produced an R2 of .998 and .999 for males and females, respectively when compared to the underlying data. Mortality rates for ages under 50, are equal to the most recently published RP-2014 mortality assumptions (adjusted forward to the central point of the experience period). Finally, the mortality rates for the transitional age ranges, ages 50 to 59, were developed to orderly transition between the mortality rates between the core and outlier age ranges. For the new assumptions, the A/E ratios in total (across all ages) for males and females would have been 101% at the core ages.
The final step in the creation of the base mortality assumption was to project the preliminary table from the center point of the analysis period (i.e., 2015) to the year 2018 using the recommended projection scale below. We will refer to this new table as the 2015 TRS of Texas Healthy Pensioner Mortality Table.
The following is a chart that shows the actual mortality experience assumption for females.
Another way to examine the best table is to compare the life expectancies created at various ages. The
following table provides the life expectancies calculated from the given age based on the actual data, the
current assumption, and the recommended tables.
Life Expectancy, in years – Females with Base Year 2018
Retiree Age Actual in Data Current
Assumption Proposed
Table
60 27.0 26.6 27.1
65 22.4 22.1 22.6
0%
2%
4%
6%
8%
10%
12%
14%
62 63 64 65 66 67 68 69 70 71 72 73 74 75 76 77 78 79 80 81 82 83 84 85 86 87 88 89 90
Age
Base Mortality AssumptionsFemale Retirees
Actual Experience Current Assumption New Assumption

Teacher Retirement System of Texas 23
70 18.1 17.9 18.2
75 14.1 13.8 14.2
80 10.5 10.2 10.6
Recommended Mortality Improvement Assumption Currently, mortality is assumed to improve in accordance with Scale BB which was published in 2012 by the Society of Actuaries.
There are currently three commonly discussed mortality improvement assumptions used by pension actuaries for valuating pension plan liabilities, each released by the Society of Actuaries. These mortality improvement assumptions include: Scale AA, Scale BB, and Scale MP (which has had four releases in 2014, 2015, 2016, and 2017).
Scale AA is based upon a blend of mortality improvement trends among Civil Service Retirement System (CSRS) and Social Security Administration participants between 1977 and 1993. Since its official release in 1995, it has become the most widely adopted improvement scale for use by both public and private institutions within the United States.
The Society of Actuaries’ Retirement Plans Experience Committee (RPEC) initiated a pension mortality study in 2010. At an early stage of its analysis, RPEC noticed that mortality experience since 2000 has improved at a faster rate than anticipated by Scale AA. As a result, RPEC issued another mortality improvement scale, Scale BB, in the year 2012 as an alternative mortality improvement assumption for pension actuaries to use.
In October 2014, RPEC issued final reports of the mortality study that was originally initiated in 2010. These final reports included the release of another mortality improvement assumption, Scale MP-2014. A significant difference between the MP-2014 improvement scales and the prior improvement scales is that the MP tables are a two-dimensional improvement assumption that is a function of the age and calendar year, whereas prior scales were only a function of age.
In 2015, 2016, and 2017, the RPEC issued updates to the mortality improvement assumption called Scale MP-2015, Scale MP-2016, and Scale MP-2017. In all three updates, rates of projection were materially decreased, meaning the original MP-2014 table was found to be too conservative. In addition, it has been stated that new projection scales are going to be published each year.
After approximately 15 years, all of the versions of the MP tables reflect the same improvement rate at each future calendar year (the ultimate mortality improvement rates). In order to balance the two objectives of reflecting the most recent data available, while maintaining stability of results from year to year, GRS is recommending the use of the ultimate mortality improvement rates in the MP tables for all years.
Net Actuarial Impact
The net impact from the changes to the mortality assumptions will be an increase in the UAAL, a decrease in the funded ratio, and increase in the funding period of TRS; but the impact on each is

Teacher Retirement System of Texas 24
minor. For example, the total impact on the 30 year actuarially determined contribution rate is less than 0.05%.
D I S A B L E D M O R T A L I T Y R A T E S
This is a minor assumption, and it has little impact on the liabilities of TRS. The experience produced A/E ratios of 107% and 120% for males and females, respectively, which are reasonable matches in total considering this data has much less credibility. We currently assume members that live past normal retirement age will use the same table as healthy retirees, with a 3-year set-forward, meaning a disabled member age 70 will use the same mortality rate as a healthy member age 73. For ages prior to normal retirement age, we will assume the same 3-year set forward, but we are applying a minimum rate of 4% for males and 2% for females to reflect impaired mortality during those ages. Aside from the updating of the underlying healthy table, we are recommending no changes to these procedures.
A C T I V E M O R T A L I T Y R A T E S
A separate mortality table is used for active members. It is typical for active mortality to be much lower than the retiree mortality. The current mortality assumption is the RP-2014 mortality table for active employees, and applying a 90% multiplier. We recommend no change to the base table and updating the projection scale to the same as used for post-retirement mortality.
D I S A B I L I T Y R A T E S
Disability is also a minor assumption, relative to other more significant assumptions. We currently separate this assumption between members who have achieved 10 years of service and thus are eligible for a lifetime annuity and those with less than 10 years who would only receive a temporary annuity. Overall, the number of members qualifying for disability continues to decline, thus we have lowered the expectations prospectively. However, we have added in a 1% load for members who reach the Rule of 80, but based on their benefit tier, are not eligible for unreduced benefits to reflect the fact that some members in our historical data would have qualified for disability but were eligible for unreduced retirement and thus did not apply.
R E T I R E M E N T R A T E S
We currently use retirement rates that vary by age, sex, reduced versus unreduced retirement. When we examine the core retirement ages (55 – 69) for unreduced retirement, there were 75,877 retirements during the five-year period compared to 82,541 expected. For this analysis, we weighted the experience by the potential liability of the member should they retire. This way, a member with 30 years of service would be reflected more in the probability than a member with 10 years of service. Using the weighted analysis, the A/E ratio for the core ages was approximately 94%, which is in the preferred range. However, the ratios were lower at the younger ages and higher at the later ages.
We have lowered our probabilities for retirement for ages below 65. The following exhibit shows the analysis of the female experience.

Teacher Retirement System of Texas 25
In addition to the changes above, we are modifying the prospective assumptions for the recent changes to TRS-CARE. We are decreasing the rates of probability by 15% (multiplying by 85%) for all ages prior to age 65, and then adding a 5% (+5%) load at age 65 for members who had already reached normal retirement prior to age 65. The new provisions of TRS-CARE, namely the removal of the no-cost option and the change to a high-deductible program, will likely cause some members to delay retirement.
These changes will slightly lower the liabilities and contribution requirements.
T E R M I N A T I O N R A T E S
Termination rates reflect members who leave for any reason other than death, disability or service retirement. They apply whether the termination is voluntary or involuntary, and whether the member takes a refund or keeps his/her account balance on deposit in TRS. The current termination rates are composed of two distinct assumptions, one for the first ten years of service called the “select” period and a separate assumption for terminations after the ten year period called the “ultimate.” The select assumption reflects the members’ service and gender and we want to continue this practice. The ultimate assumption is based on the member’s time from retirement eligibility and service, and we would also recommend continuing that practice. We have analyzed the two assumption periods separately.
For this assumption, we used 10 years of data. In addition, we have weighted the experience by salary, meaning instead of counting members and the number of members that terminate, we have counted payrolls and the portion of the payroll that terminates. A higher paid member has more liability than a lower paid member, and thus the termination pattern for the higher paid member will have more impact on the future liabilities of the plan. Also, in school districts, higher paid members are hired in to positions that have lower turnover (teachers, school administrators, etc.) versus lower paid members (support staff, teacher aids, etc.).
10.00%
15.00%
20.00%
25.00%
30.00%
35.00%
40.00%
50 51 52 53 54 55 56 57 58 59 60 61 62 63 64 65 66 67 68 69 70 71 72 73 74
RA
TES
AGE
FEMALE RETIREMENT EXPERIENCE - AGE BASEDNormal Retirement
Actual Experience Present Assumptions Proposed Assumptions

Teacher Retirement System of Texas 26
For the select period, the current assumptions produce an A/E ratio for males of 108% and an A/E ratio for females of 116%. For this assumption, A/E ratios over 100% are conservative, and we prefer to be in the 103%-105% range.
For the ultimate period, the current assumptions produce an A/E ratio for males of 110% and an A/E ratio for females of 122%, both quite higher than expected. We have recommended adjustments to the slope and the magnitude of the assumption to better match experience.
These changes will slightly lower the liabilities and contribution requirements.
O T H E R A S S U M P T I O N S A N D R E F U N D S
There are other assumptions made in the course of a valuation, such as the percentage of members who are married, the age difference between members and spouses, the likelihood that a terminating employee will take a refund, etc. We reviewed these, and believe these are generally realistic or conservative, so we decided to recommend no changes to these other assumptions.
A C T U A R I A L M E T H O D S
We recommend a modification in how the contributions from employers on non-OASDI payroll are projected. Currently it is assumed that 60% of covered payroll will be eligible for the 1.5% contribution, and thus we model 0.9% of future total covered payroll. We will no longer make an explicit assumption on what percentage of total covered payroll will be eligible, but instead will use the actual amount of contribution from the previous fiscal year divided by the actual total payroll from the previous fiscal year to reset the effective rate annually. This change will increase the projected total contribution based on the current funding policy, and thus will decrease the funding period.
We recommend no change to the current asset smoothing method or the smoothing period.
We recommend changing to the Individual Entry Age (IEAN) actuarial cost method. The Ultimate Entry Age Normal cost method (UEAN) is the current funding method being used to allocate the actuarial costs of the System. Changing the method will allow for one set of liabilities to be used for funding and accounting purposes but will not have an impact on the funding period or the actuarially determined contribution requirements. The Individual Entry Age Normal method will generally produce level contribution amounts for each member as a percentage of salary from year to year, but in a plan with benefit tiers, will produce a normal cost for the plan as a whole that changes over time. Thus, for a plan that receives its contribution as a fixed percent of payroll, the IEAN method does not allow for a simple algebraic calculation of the funding period and contribution requirements. Prospectively, the funding period will be determined based on an open group projection. In an open group projection, the demographic assumptions are applied to the current active members and any members that are assumed to leave employment are replaced with new members. Over time this results in the change of the membership to mostly members hired into the less expensive benefit structure and incorporates the fact that the average normal cost rate will trend down over time when determining the funding period. The projection is built to assume no gains or losses on the actuarial accrued liability, the actuarial value of assets, the plan demographics, or the change in payroll over time.
We recommend continuing to use individual data records in the valuation process. However, the use of individual data extends the computer run time dramatically. Thus, we will continue to use celled data in legislative analyses and adjust for any difference between the two data sets.

Teacher Retirement System of Texas 27
SECTION IV – ACTUARIAL IMPACT OF RECOMMENDATIONS
Valuation Results as of 8/31/17 Change
Item
Current Assumptions
Recommended Assumptions
Amount
Percent
(1) (2) (3) (4) (5)
1. Normal cost % * 10.06% 11.65% 1.59% 15.8%
2. Present value of future benefits for retired members
$97.0
$103.2
$6.2
6.4%
3. Present value of future benefits for active members
$119.1
$129.0
$9.9
8.3%
4. Total present value of future benefits
$216.1 $232.2 $16.1 7.5%
5. Actuarial accrued liability $181.8 $192.2 $10.4 5.7%
6. Actuarial value of assets $146.3 $146.3 $0.0 0.0%
7. Unfunded actuarial accrued liability $35.5 $45.9 $10.4 29.3%
8. Funding period (years) 32.2 86.0
9. Funded ratio 80.5% 76.1% (4.4%) (5.5%)
10. 30 Year Actuarially Determined Contribution (employee + employer)
15.55% 17.38% 1.83% 11.8%
All dollar amount in $ billions Funding period is based on member, employer, and state contribution rates for fiscal year 2017 and beyond as specified by statute.
*Includes load for administrative expenses

Teacher Retirement System of Texas 28
Section V – Summary of Assumptions and Methods Incorporating the Recommended Assumptions
1. Investment Return Rate 7.25% per annum, compounded annually, composed of an assumed 2.30% inflation rate and a 4.95% real rate of return, net of investment expenses
2. Mortality, Termination, Disability Retirement, and Service Retirement Rates:
Rates and scales developed in the actuarial investigation as August 31, 2017, with values at specimen ages shown in the tables below:
a. Active Mortality: RP-2014 Employee Mortality Tables for male and female multiplied by 90%, with full generational projection using the ultimate calendar (i.e.2027) of rates in the mortality projection scale MP-2014, 2D for male and female. Below are the samples rates for 2018 and 2048.
2018 Mortality Rates
Age
Male
Female
20
0.000351
0.000140 30
0.000391
0.000188
40
0.000543
0.000342
50
0.001458
0.000953
60
0.004053
0.002111 70
0.011977
0.005454
80
0.033554
0.015890 90
0.119209
0.089535
2048 Mortality Rates
Age
Male
Female
20
0.000260
0.000104 30
0.000289
0.000139
40
0.000402
0.000253
50
0.001078
0.000705
60
0.002998
0.001562 70
0.008860
0.004035
80
0.024820
0.011754 90
0.090069
0.067649
b. Rates of Termination
Probability of Decrement Due to Termination
Years of Service Male Female
1
0.155507 0.162296
2
0.124963 0.133070
3
0.100839 0.111030
4
0.075417 0.087064
5
0.065169 0.077625
6
0.057971 0.068467
7
0.049227 0.056290
8
0.043267 0.048891
9
0.038586 0.043639
10
0.035246 0.039995

Teacher Retirement System of Texas 29
The following table is used for all years after the first ten years of employment.
Probability of Decrement Due to Termination Based on Years from Normal Retirement
Years from NR Male Female
Years from NR Male Female
1 0.012969 0.012300
17 0.026491 0.030497
2 0.015445 0.015360
18 0.026876 0.031061
3 0.017108 0.017491
19 0.027245 0.031604
4 0.018394 0.019181
20 0.027599 0.032128
5 0.019459 0.020603
21 0.027941 0.032634
6 0.020374 0.021843
22 0.028270 0.033125
7 0.021181 0.022949
23 0.028589 0.033600
8 0.021907 0.023952
24 0.028897 0.034061
9 0.022567 0.024874
25 0.029196 0.034510
10 0.023174 0.025728
26 0.029486 0.034947
11 0.023738 0.026526
27 0.029768 0.035372
12 0.024264 0.027276
28 0.030042 0.035787
13 0.024759 0.027985
29 0.030309 0.036191
14 0.025226 0.028658
30 0.030570 0.036587
15 0.025668 0.029298
31 0.030823 0.036973
16 0.026089 0.029911
32 0.031071 0.037351
c. Rates of Disability Retirement
The disability retirement rates for members once they reach the Rule of 80 but not eligible for unreduced retirement are adjusted by an additional 1%.
Probability of Decrement Due to Disability
For Service >= 10 For Service < 10
Age
Male Female Male Female
20
0.000147 0.000262 0.000018 0.000028
30
0.000147 0.000262 0.000018 0.000028
40
0.000344 0.000446 0.000043 0.000047
50
0.001594 0.001726 0.000199 0.000182
60
0.002804 0.002616 0.000351 0.000275

Teacher Retirement System of Texas 30
d. Rates of Retirement
Age
Normal Retirement
Age Early Retirement
Male
Female
Male
Female
50
0.1300
0.1400
45 0.0100
0.0100 51
0.1300
0.1400
46 0.0100
0.0100
52
0.1300
0.1400
47 0.0100
0.0100 53
0.1300
0.1400
48 0.0100
0.0100
54
0.1300
0.1400
49 0.0100
0.0100 55
0.1300
0.1500
50 0.0100
0.0100
56
0.1400
0.1600
51 0.0100
0.0100 57
0.1500
0.1700
52 0.0100
0.0100
58
0.1600
0.1800
53 0.0100
0.0100 59
0.1700
0.1900
54 0.0100
0.0100
60
0.1800
0.2000
55 0.0100
0.0100 61
0.1900
0.2100
56 0.0100
0.0100
62
0.2000
0.2200
57 0.0100
0.0100 63
0.2100
0.2300
58 0.0100
0.0100
64
0.2200
0.2400
59 0.0100
0.0100 65
0.2500
0.2500
60 0.0100
0.0200
66
0.2500
0.2500
61 0.0200
0.0200 67
0.2500
0.2500
62 0.0400
0.0400
68
0.2500
0.2500
63 0.0500
0.0500 69
0.2500
0.2500
64 0.0500
0.0500
70
0.2500
0.2500
65 0.0500
0.0500 71
0.2500
0.2500
72
0.2500
0.2500 73
0.2500
0.2500
74
0.2500
0.2500 75
1.0000
1.0000
Rates for members younger than age 65 will be reduced by 15% to reflect anticipated behavior changes stemming from the modifications to TRS CARE in the 2017 legislature. 5% will be added to the rate at age 65 for members who reach normal retirement age prior to age 65.
For members hired after August 31, 2007 and who are vested as of August 31, 2014, the retirement rates for members once they reach unreduced retirement eligibility at age 60 are increased 10% for each year the member is beyond the Rule of 80 (i.e. if the member reached the Rule of 80 at age 58 then the probability of retirement at age 60 is 120% of the rate shown above).
For members hired after August 31, 2007 and who are not vested as of August 31, 2014, or, for members hired after August 31, 2014, the retirement rates for members once they reach unreduced retirement eligibility at age 62 are increased 10% for each year the member is beyond the Rule of 80 (i.e. if the member reached the Rule of 80 at age 58 then the probability of retirement at age 62 is 140% of the rate shown above).

Teacher Retirement System of Texas 31
3. Rates of Salary Increase
Inflation rate of 2.30%, plus a merit and productivity component of 0.75%, plus step-rate/promotional component as shown:
Years of Service
Merit, Promotion, Longevity
General
Total
1
6.00 % 3.05 % 9.05 %
2
2.50
3.05
5.55
3
1.90
3.05
4.95
4
1.50
3.05
4.55
5
1.40
3.05
4.45
6
1.20
3.05
4.25
7
1.10
3.05
4.15
8
1.00
3.05
4.05
9
1.00
3.05
4.05
10
1.00
3.05
4.05
11
0.90
3.05
3.95
12
0.90
3.05
3.95
13
0.80
3.05
3.85
14
0.70
3.05
3.75
15
0.60
3.05
3.65
16
0.50
3.05
3.55
17
0.50
3.05
3.55
18
0.40
3.05
3.45
19
0.30
3.05
3.35
20
0.30
3.05
3.35
21
0.20
3.05
3.25
22
0.20
3.05
3.25
23
0.10
3.05
3.15
24
0.10
3.05
3.15
25 & up
0.00
3.05
3.05

Teacher Retirement System of Texas 32
4. Post-retirement Mortality: The 2018 TRS of Texas Healthy Pensioner Mortality Tables, with full generational projection using the ultimate calendar (i.e.2027) of rates in the mortality projection scale MP-2014, 2D for male and female, used for service retirement annuitants, beneficiaries and survivors. These tables are developed based on the experience in the actuarial investigation as of August 31, 2017 Below are the samples rates for 2018 and 2048.
2018 Mortality Rates
Age
Male
Female
40
0.000615
0.000388
50
0.001652
0.001080
60
0.004651
0.002668
70
0.014356
0.008969
80
0.046716
0.032270
90
0.152340
0.116359
100
0.490265
0.422361
110
0.496658
0.496658
120
1.000000
1.000000
2048 Mortality Rates
Age
Male
Female
40
0.000455
0.000287
50
0.001222
0.000799
60
0.003440
0.001974
70
0.010619
0.006634
80
0.034556
0.023870
90
0.115101
0.087915
100
0.404369
0.348362
110
0.466303
0.466303
120
1.000000
1.000000
For disabled retirees, a three-year set forward of the above tables are used, with a minimum mortality rates of 0.0200 for female and 0.0400 for male.
2018 Mortality Rates
Age
Male
Female
40
0.040000
0.020000
50
0.040000
0.020000
60
0.040000
0.020000
70
0.040000
0.020000
80
0.066557
0.047384
90
0.217371
0.171112
100
0.492192
0.492192
110
0.498452
0.498452
120
1.000000
1.000000
2048 Mortality Rates
Age
Male
Female
40
0.040000
0.020000
50
0.040000
0.020000
60
0.040000
0.020000
70
0.040000
0.020000
80
0.049232
0.035050
90
0.166740
0.131256
100
0.422199
0.422199
110
0.485168
0.485168
120
1.000000
1.000000

Teacher Retirement System of Texas 33
HANDLING OF ACTIVE DATA WITH MISSING INFORMATION:
As of the close of each fiscal year there is a large number of records for whom no statistical data has been received. The only information TRS has are social security number and initial contributions. Any of these records that were in the prior year’s data are treated as non-vested terminated members. The remaining records are treated as new entrants. These records are added to the count of active members, but have no liability.
There are other records provided by TRS that have missing gender and/or missing date of births. These records are handled as follows:
1. 80% of records with missing gender are assumed to be female. The overall male/female ratio of the active membership is used to set this assumption.
2. Records with missing dates of birth are assigned a date of birth that produces an entry age equal to the average entry age for the overall active population, based on the member’s actual service.
ASSUMPTION FOR DROP PARTICIPATION
Current active members are not eligible to participate in DROP, therefore no new DROP members are assumed.
BENEFIT ELECTION OF VESTED TERMINATING MEMBERS:
In determining the liabilities developed for future terminating vested members, it is assumed that the member elects either a refund or a deferred vested benefit, whichever is more valuable. The deferred benefit is assumed to commence at the earliest age the member is eligible for unreduced retirement.
ELECTION RATES FOR ACTIVE MEMBER DEATH BENEFITS:
It is assumed that the beneficiary will elect the death benefit option with the greatest value.
DECREMENT TIMING:
Retirement is assumed to occur at the end of the year. Termination from service is assumed to occur at the beginning of the year. All other decrements are assumed to occur mid-year.
BENEFIT ELECTION OPTIONS:
It is assumed that future healthy retirees will select the normal form of payment. For disabled members, 80% are assumed to select the normal form of payment and 20% to select the 100% joint and survivor option.
MARRIAGE ASSUMPTION:
While not implicitly used in the valuation, 100% of active members are assumed to be married when setting other benefit election and eligibility assumptions.

Teacher Retirement System of Texas 34
SPOUSAL AGE DIFFERENCE:
Husbands are assumed to be three years older than their wives.
CLASSIFICATION OF WHO ARE ACTIVE MEMBERS:
Members who contributed during the just-completed plan year but did not retire before August 31st are considered active.
AVERAGE SURVIVOR BENEFIT LIABILITY:
One of the options on the death of an active member, a disabled member, or a retired member is a survivor benefit. To determine the liability for this benefit the following average values are used.
Males Females
1. Active member $62,200 $59,000
2. Disabled member $13,000 $11,000
3. Retired member $12,000 $12,000
ACTUARIAL VALUE OF ASSETS:
A. The actuarial value of assets is equal to the market value of assets less a five-year phase in of the excess/(shortfall) between expected investment return and actual income. The actual calculation is based on the difference between actual market value and the expected actuarial value of assets each year, and recognizes the cumulative excess return (or shortfall) over a minimum rate of 20% per year. Each year a base is set up to reflect this difference. If the current year’s base is of opposite sign to the deferred bases then it is offset dollar for dollar against the deferred bases. Any remaining bases are then recognized over the remaining period for the base (5 less the number of years between the bases year and the valuation year). This is intended to ensure the smoothed value of assets will converge towards the market value in a reasonable amount of time.
B. Expected earnings are determined using the assumed investment return rate and the beginning of year actuarial value of assets (adjusted for receipts and disbursements during the year). Beginning in fiscal year 2016, the returns are computed net of investment expenses.
ACTUARIAL COST METHOD:
The actuarial valuation is used to determine the adequacy of the State contribution rate (established by Legislative appropriation) and employer contribution rate (established by statute) and to describe the current financial condition of TRS. The actuarial valuation uses the Entry Age Normal actuarial cost method. Under this method, the first step is to determine the contribution rate (level as a percentage of pay) required to provide

Teacher Retirement System of Texas 35
the benefits to each member, or the normal cost rate. The normal cost rate consists of two pieces: (i) the member’s contribution rate, and (ii) the remaining portion of the normal cost rate which is the employer’s normal cost rate. The total normal cost rate is based on the benefits payable to
each individual active member. The Unfunded Actuarial Accrued Liability (UAAL) is the liability for future benefits which is in excess of (i) the actuarial value of assets, and (ii) the present value of future normal costs. The employer contribution provided in excess of the employer normal cost is applied to amortize the UAAL. The funding period is calculated as the number of years required to fully amortize the UAAL, and is calculated with the use of an open group projection that takes into account: (a) future market earnings, net of investment-related expenses, will equal 7.25% per year, (b) there will be no changes in assumptions, (c) the number of active members will remain unchanged, (d) active members who leave employment will be replaced by new entrants each year, and (e) State and
employer contributions will remain the same percentage of payroll. The Entry Age actuarial cost method is an “immediate gain” method (i.e., experience gains and losses are separately identified as part of the UAAL). However, they are amortized over the same period applied to all other components of the UAAL.
PROJECTED PAYROLL FOR CONTRIBUTIONS:
The aggregate projected payroll for the fiscal year following the valuation date is calculated by increasing the actual payroll paid during the previous fiscal year by the payroll growth rate.
PROJECTION OF CONTRIBUTIONS FOR FUNDING OF UNFUNDED ACTUARIAL ACCRUED LIABILITY:
Total payroll is expected to grow at 3.00% per year. The total general wage increase assumption of 3.00% is made up of an inflation rate of 2.30% plus a 0.70% productivity component. This value is used to increase the wages for each annual cohort of new entrants in an open group projection based on the current demographics and the current assumptions. In addition, annually, the dollar amount of contributions received from employers on non-OASDI payroll is divided by actual payroll for that fiscal year to determine an estimated effective rate of total payroll, and projected at the same 3.00% growth rate.
USE OF CELLED DATA:
For valuation purposes, every record in the census is valued individually.
For legislative purposes, the active valuation data is celled by benefit tier, gender, years of service, month and year of birth. Each individual cell is valued using the sum of the salary and account balances of the members in the cell. Every year we test this approach against using the individual records and the results are consistently less than 0.02% different in total present value of benefits.

0
SECTION VI
SUMMARY OF DATA AND EXPERIENCE

Teacher Retirement System of Texas 38
Age
Actual
Retirement
Weighted
By Liability
$M
Total
Liability
$M
Actual
Rate Current Proposed
Current
(3) * (5)
Proposed
(3) * (6)
Current
(2) / (7)
Proposed
(2) / (8)
(1) (2) (3) (4) (5) (6) (7) (8) (9) (10)
55 73 19,439 0.004 1% 1% 194 194 38% 38%
56 128 16,961 0.008 1% 1% 170 170 76% 76%
57 132 15,106 0.009 1% 1% 151 151 88% 88%
58 128 13,467 0.009 1% 1% 135 135 94% 94%
59 127 11,912 0.011 1% 1% 119 119 107% 107%
60 147 10,498 0.014 2% 1% 210 105 70% 140%
61 194 9,155 0.021 2% 2% 183 183 106% 106%
62 221 7,581 0.029 5% 4% 379 303 58% 73%
63 261 6,157 0.042 5% 5% 308 308 85% 85%
64 215 4,901 0.044 6% 5% 294 245 73% 88%
Total 1,626 115,178 0.014 2,143 1,913 76% 85%
TEACHER RETIREMENT SYSTEM
MALE RETIREMENT EXPERIENCE - AGE BASED
Early Retirement
Assumed Rate
Expected Retirement
Weighted By Liability
$M Actual/Expected
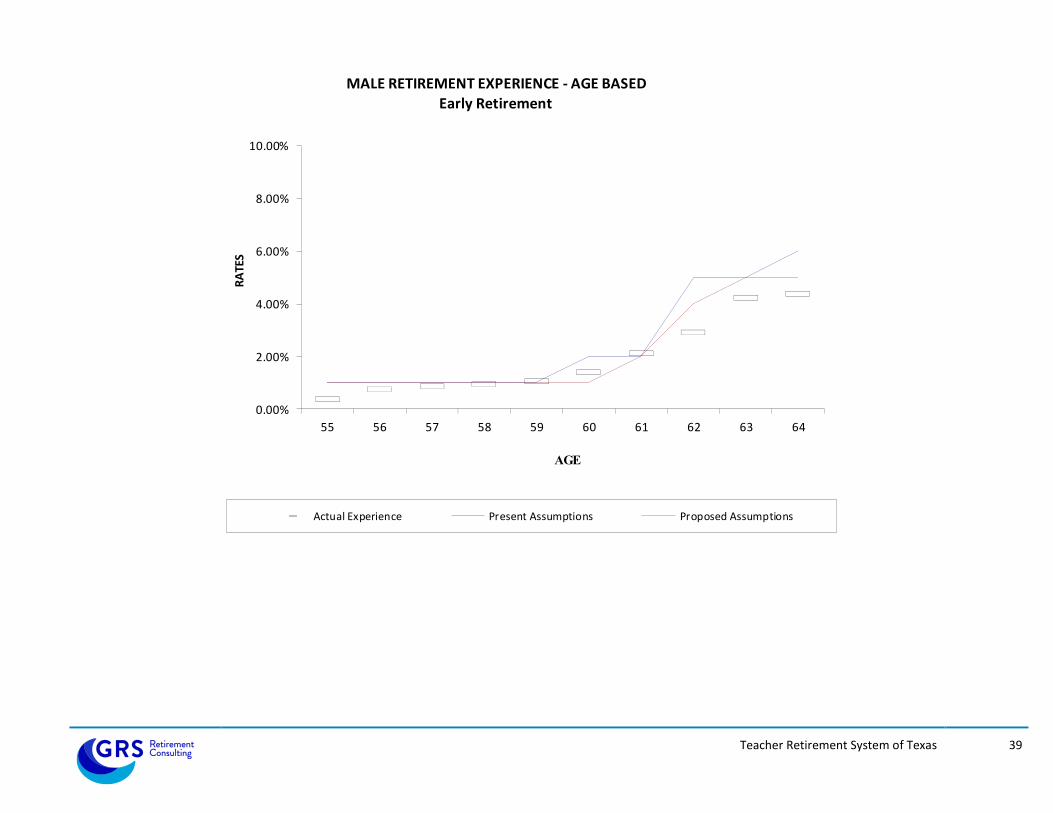
Teacher Retirement System of Texas 39
0.00%
2.00%
4.00%
6.00%
8.00%
10.00%
55 56 57 58 59 60 61 62 63 64
RA
TES
AGE
MALE RETIREMENT EXPERIENCE - AGE BASEDEarly Retirement
Actual Experience Present Assumptions Proposed Assumptions

Teacher Retirement System of Texas 40
Age
Actual
Retirement
Weighted
By Liability
$M
Total
Liability
$M
Actual
Rate Current Proposed
Current
(3) * (5)
Proposed
(3) * (6)
Current
(2) / (7)
Proposed
(2) / (8)
(1) (2) (3) (4) (5) (6) (7) (8) (9) (10)
55 301 60,367 0.005 1% 1% 604 604 50% 50%
56 467 54,317 0.009 1% 1% 543 543 86% 86%
57 437 47,506 0.009 1% 1% 475 475 92% 92%
58 476 40,729 0.012 1% 1% 407 407 117% 117%
59 442 33,778 0.013 2% 1% 676 338 65% 131%
60 486 27,606 0.018 2% 2% 552 552 88% 88%
61 489 21,759 0.022 2% 2% 435 435 112% 112%
62 549 17,037 0.032 4% 4% 681 681 81% 81%
63 589 12,645 0.047 5% 5% 632 632 93% 93%
64 416 8,914 0.047 6% 5% 535 446 78% 93%
Total 4,653 324,658 0.014 5,540 5,113 84% 91%
TEACHER RETIREMENT SYSTEM
FEMALE RETIREMENT EXPERIENCE - AGE BASED
Early Retirement
Assumed Rate
Expected Retirement
Weighted By Liability
$M Actual/Expected

Teacher Retirement System of Texas 41
0.00%
2.00%
4.00%
6.00%
8.00%
10.00%
55 56 57 58 59 60 61 62 63 64
RA
TES
AGE
FEMALE RETIREMENT EXPERIENCE - AGE BASEDEarly Retirement
Actual Experience Present Assumptions Proposed Assumptions

Teacher Retirement System of Texas 42
Age
Actual
Retirement
Weighted
By Liability
$M
Total
Liability
$M
Actual
Rate Current Proposed
Current
(3) * (5)
Proposed
(3) * (6)
Current
(2) / (7)
Proposed
(2) / (8)
(1) (2) (3) (4) (5) (6) (7) (8) (9) (10)
50 $166 $1,207 0.138 13% 13% $157 $157 106% 106%
51 516 3,574 0.144 13% 13% 465 465 111% 111%
52 1,122 11,041 0.102 13% 13% 1,435 1,435 78% 78%
53 2,235 17,333 0.129 13% 13% 2,253 2,253 99% 99%
54 2,603 20,405 0.128 14% 13% 2,857 2,653 91% 98%
55 2,834 22,456 0.126 15% 13% 3,368 2,919 84% 97%
56 3,199 24,008 0.133 16% 14% 3,841 3,361 83% 95%
57 3,351 24,444 0.137 17% 15% 4,155 3,667 81% 91%
58 3,824 24,786 0.154 18% 16% 4,461 3,966 86% 96%
59 3,774 24,608 0.153 18% 17% 4,429 4,183 85% 90%
60 3,968 23,810 0.167 22% 18% 5,238 4,286 76% 93%
61 3,744 22,016 0.170 20% 19% 4,403 4,183 85% 90%
62 3,834 20,839 0.184 24% 20% 5,001 4,168 77% 92%
63 4,079 18,803 0.217 20% 21% 3,761 3,949 108% 103%
64 2,942 15,867 0.185 20% 22% 3,173 3,491 93% 84%
65 3,582 17,940 0.200 22% 25% 3,947 4,485 91% 80%
66 3,537 14,512 0.244 22% 25% 3,193 3,628 111% 97%
67 2,885 11,258 0.256 22% 25% 2,477 2,814 116% 103%
68 1,899 8,165 0.233 22% 25% 1,796 2,041 106% 93%
69 1,470 6,272 0.234 22% 25% 1,380 1,568 106% 94%
70 1,087 4,742 0.229 22% 25% 1,043 1,185 104% 92%
71 890 3,563 0.250 22% 25% 784 891 113% 100%
72 584 2,546 0.229 22% 25% 560 636 104% 92%
73 447 2,037 0.220 22% 25% 448 509 100% 88%
74 349 1,650 0.211 22% 25% 363 412 96% 85%
Total $58,921 $347,884 0.169 $64,988 $63,305 91% 93%
TEACHER RETIREMENT SYSTEM
MALE RETIREMENT EXPERIENCE - AGE BASED
Normal Retirement
Assumed Rate
Expected Retirement
Weighted By Liability
$M Actual/Expected

Teacher Retirement System of Texas 43
10.00%
15.00%
20.00%
25.00%
30.00%
35.00%
40.00%
50 51 52 53 54 55 56 57 58 59 60 61 62 63 64 65 66 67 68 69 70 71 72 73 74
RA
TES
AGE
MALE RETIREMENT EXPERIENCE - AGE BASED
Normal Retirement
Actual Experience Present Assumptions Proposed Assumptions

Teacher Retirement System of Texas 44
Age
Actual
Retirement
Weighted
By Liability
$M
Total
Liability
$M
Actual
Rate Current Proposed
Current
(3) * (5)
Proposed
(3) * (6)
Current
(2) / (7)
Proposed
(2) / (8)
(1) (2) (3) (4) (5) (6) (7) (8) (9) (10)
50 $231 $1,640 0.141 30% 14% $492 $230 47% 100%
51 1,239 11,263 0.110 12% 14% 1,352 1,577 92% 79%
52 4,409 33,789 0.130 13% 14% 4,393 4,730 100% 93%
53 6,487 45,776 0.142 14% 14% 6,409 6,409 101% 101%
54 7,179 53,187 0.135 15% 14% 7,978 7,446 90% 96%
55 8,265 59,631 0.139 16% 15% 9,541 8,945 87% 92%
56 9,819 65,001 0.151 17% 16% 11,050 10,400 89% 94%
57 10,793 69,079 0.156 18% 17% 12,434 11,743 87% 92%
58 12,395 72,049 0.172 19% 18% 13,689 12,969 91% 96%
59 12,589 72,682 0.173 20% 19% 14,536 13,810 87% 91%
60 13,725 72,010 0.191 21% 20% 15,122 14,402 91% 95%
61 13,539 68,723 0.197 22% 21% 15,119 14,432 90% 94%
62 12,898 63,625 0.203 23% 22% 14,634 13,997 88% 92%
63 12,761 56,599 0.225 23% 23% 13,018 13,018 98% 98%
64 10,408 48,149 0.216 23% 24% 11,074 11,556 94% 90%
65 10,830 46,424 0.233 23% 25% 10,678 11,606 101% 93%
66 9,722 35,800 0.272 23% 25% 8,234 8,950 118% 109%
67 6,476 25,896 0.250 23% 25% 5,956 6,474 109% 100%
68 4,584 18,609 0.246 23% 25% 4,280 4,652 107% 99%
69 3,084 13,548 0.228 23% 25% 3,116 3,387 99% 91%
70 2,430 10,047 0.242 23% 25% 2,311 2,512 105% 97%
71 1,924 7,147 0.269 23% 25% 1,644 1,787 117% 108%
72 1,144 4,871 0.235 23% 25% 1,120 1,218 102% 94%
73 815 3,629 0.225 23% 25% 835 907 98% 90%
74 689 2,741 0.251 23% 25% 630 685 109% 101%
Total $178,436 $961,914 0.186 $189,645 $187,842 94% 95%
TEACHER RETIREMENT SYSTEM
FEMALE RETIREMENT EXPERIENCE - AGE BASED
Normal Retirement
Assumed Rate
Expected Retirement
Weighted By Liability
$M Actual/Expected
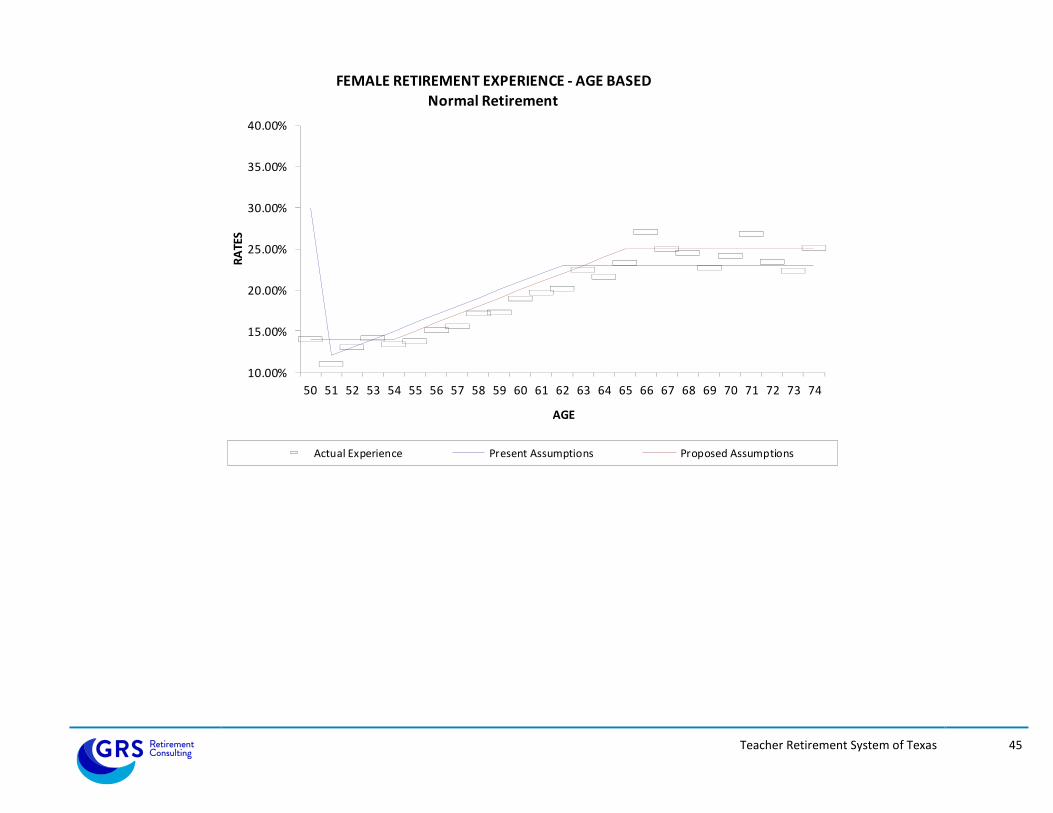
Teacher Retirement System of Texas 45
10.00%
15.00%
20.00%
25.00%
30.00%
35.00%
40.00%
50 51 52 53 54 55 56 57 58 59 60 61 62 63 64 65 66 67 68 69 70 71 72 73 74
RA
TES
AGE
FEMALE RETIREMENT EXPERIENCE - AGE BASED
Normal Retirement
Actual Experience Present Assumptions Proposed Assumptions

Teacher Retirement System of Texas 46
Age
Actual
Death
Weighted
by Annuity
$M
Total
Annuity
$M
Actual
Rate Current Proposed
Current
(3) * (5)
Proposed
(3) * (6)
Current
(2) / (7)
Proposed
(2) / (8)
(1) (2) (3) (4) (5) (6) (7) (8) (9) (10)
60-64 $90 $11,722 0.0077 0.0065 0.0060 $78 $70 115% 129%
65-69 186 16,315 0.0114 0.0105 0.0106 176 173 106% 108%
70-74 221 12,662 0.0174 0.0190 0.0187 240 236 92% 93%
75-79 265 8,316 0.0319 0.0355 0.0337 294 280 90% 95%
80-84 365 5,959 0.0613 0.0651 0.0606 385 361 95% 101%
85-89 353 3,271 0.1079 0.1144 0.1068 363 349 97% 101%
90-94 244 1,168 0.2088 0.1933 0.1899 217 222 113% 110%
95-99 67 218 0.3057 0.3115 0.3261 63 71 106% 94%
100-104 5 17 0.3155 0.4769 0.5000 7 8 74% 63%
105-109 0 1 0.3986 0.5000 0.5000 1 1 80% 80%
Totals $1,796 $59,649 $1,824 $1,772 99% 101%
TEACHER RETIREMENT SYSTEM OF TEXAS
MALE POST-RETIREMENT MORTALITY
Assumed Rate
Expected Deaths
Weighted By Annuity
$M Actual/Expected

Teacher Retirement System of Texas 47
0.0%
5.0%
10.0%
15.0%
20.0%
25.0%
65-69 70-74 75-79 80-84 85-89 90-94
RA
TES
AGE
MALE POST-RETIREMENT MORTALITY
Actual Experience Present Assumptions Proposed Assumptions

Teacher Retirement System of Texas 48
Age
Actual
Death
Weighted
by Annuity
$M
Total
Annuity
$M
Actual
Rate Current Proposed
Current
(3) * (5)
Proposed
(3) * (6)
Current
(2) / (7)
Proposed
(2) / (8)
(1) (2) (3) (4) (5) (6) (7) (8) (9) (10)
60-64 $168 $37,774 0.0044 0.0045 0.0035 $174 $131 96% 128%
65-69 300 46,459 0.0065 0.0069 0.0064 324 296 93% 101%
70-74 371 31,052 0.0119 0.0116 0.0119 360 368 103% 101%
75-79 390 18,326 0.0213 0.0225 0.0225 410 412 95% 95%
80-84 520 11,852 0.0439 0.0455 0.0427 536 507 97% 103%
85-89 579 6,936 0.0835 0.0889 0.0795 600 552 97% 105%
90-94 394 2,563 0.1537 0.1646 0.1491 407 382 97% 103%
95-99 177 787 0.2246 0.2879 0.2768 215 218 82% 81%
100-104 50 146 0.3438 0.4713 0.4700 63 68 79% 73%
105-109 6 12 0.5115 0.5000 0.5000 6 6 102% 102%
Totals $2,955 $155,907 $3,094 $2,940 96% 101%
FEMALE POST-RETIREMENT MORTALITY
Assumed Rate
Expected Deaths
Weighted By Annuity
$M Actual/Expected
TEACHER RETIREMENT SYSTEM OF TEXAS
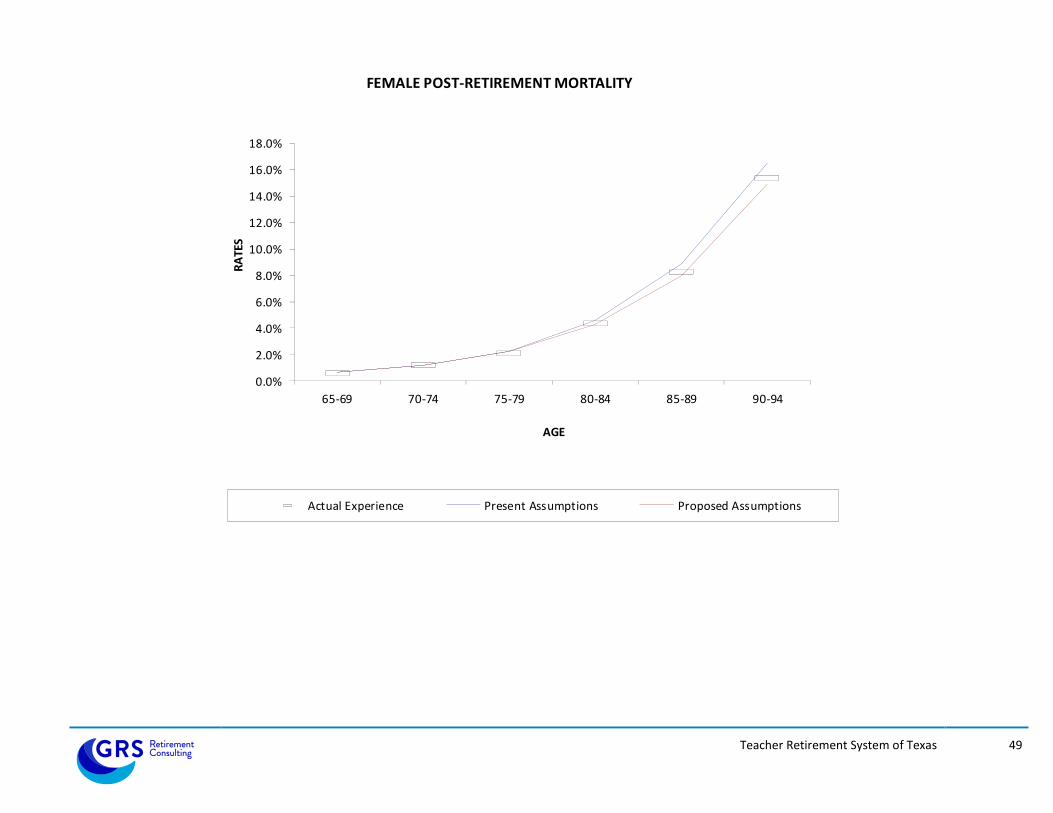
Teacher Retirement System of Texas 49
0.0%
2.0%
4.0%
6.0%
8.0%
10.0%
12.0%
14.0%
16.0%
18.0%
65-69 70-74 75-79 80-84 85-89 90-94
RA
TES
AGE
FEMALE POST-RETIREMENT MORTALITY
Actual Experience Present Assumptions Proposed Assumptions

Teacher Retirement System of Texas 50
Current Salary Scale 07/17 Actual Experience Proposed Salary Scale
Years of Step Rate/ Above Step Rate/ Step Rate/
Service Total Promotional Total Inflation Promotional Total Promotional
(1) (2) (3) (4) (5) (6) (7) (8)
1 9.50% 6.00% 11.87% 10.20% 9.60% 9.05% 6.00%
2 6.00% 2.50% 4.79% 3.11% 2.51% 5.55% 2.50%
3 5.40% 1.90% 4.03% 2.35% 1.76% 4.95% 1.90%
4 5.20% 1.70% 3.74% 2.06% 1.47% 4.55% 1.50%
5 5.00% 1.50% 3.48% 1.81% 1.21% 4.45% 1.40%
6 4.90% 1.40% 3.44% 1.77% 1.17% 4.25% 1.20%
7 4.70% 1.20% 3.41% 1.74% 1.14% 4.15% 1.10%
8 4.50% 1.00% 3.32% 1.64% 1.04% 4.05% 1.00%
9 4.50% 1.00% 3.09% 1.42% 0.82% 4.05% 1.00%
10 4.50% 1.00% 3.16% 1.49% 0.89% 4.05% 1.00%
11 4.50% 1.00% 2.71% 1.03% 0.44% 3.95% 0.90%
12 4.50% 1.00% 3.18% 1.50% 0.90% 3.95% 0.90%
13 4.30% 0.80% 2.96% 1.28% 0.69% 3.85% 0.80%
14 4.20% 0.70% 2.92% 1.25% 0.65% 3.75% 0.70%
15 4.10% 0.60% 2.93% 1.25% 0.66% 3.65% 0.60%
16 4.00% 0.50% 2.72% 1.05% 0.45% 3.55% 0.50%
17 4.00% 0.50% 2.76% 1.09% 0.49% 3.55% 0.50%
18 3.90% 0.40% 2.63% 0.95% 0.35% 3.45% 0.40%
19 3.80% 0.30% 2.65% 0.98% 0.38% 3.35% 0.30%
20 3.80% 0.30% 2.67% 1.00% 0.40% 3.35% 0.30%
21 3.70% 0.20% 2.44% 0.77% 0.17% 3.25% 0.20%
22 3.70% 0.20% 2.50% 0.82% 0.22% 3.25% 0.20%
23 3.60% 0.10% 2.46% 0.78% 0.18% 3.15% 0.10%
24 3.60% 0.10% 2.31% 0.64% 0.04% 3.15% 0.10%
25 3.50% 0.00% 2.27% 0.60% 0.00% 3.05% 0.00%
TEACHER RETIREMENT SYSTEM OF TEXAS
Service-Based Salary Rates

Teacher Retirement System of Texas 51
0.0%
0.5%
1.0%
1.5%
2.0%
2.5%
3.0%
2 3 4 5 6 7 8 9 10 11 12 13 14 15 16 17 18 19 20 21 22 23 24 25
RA
TES
Years of Service
Service-Based Salary Rates
Actual Experience Present Assumptions Proposed Assumptions

Teacher Retirement System of Texas 52
Years from
Retirement
Actual
Termination
Weighted By
Salary $M
Total
Salary $M
Actual
Rate Current Proposed Current Proposed
Current
(2) / (7)
Proposed
(2) / (8)
(1) (2) (3) (4) (5) (6) (7) (8) (9) (10)
1 $18 $1,291 0.0141 0.0121 0.0130 $16 $17 116% 109%
2 37 2,379 0.0156 0.0144 0.0154 34 37 109% 101%
3 38 2,398 0.0160 0.0159 0.0171 38 41 101% 93%
4 44 2,420 0.0183 0.0170 0.0184 41 45 108% 100%
5 46 2,445 0.0190 0.0180 0.0195 44 48 106% 98%
6 48 2,384 0.0202 0.0188 0.0204 45 49 107% 99%
7 49 2,299 0.0211 0.0195 0.0212 45 49 108% 100%
8 49 2,211 0.0223 0.0201 0.0219 45 48 111% 102%
9 46 2,125 0.0219 0.0207 0.0226 44 48 105% 97%
10 46 2,025 0.0228 0.0213 0.0232 43 47 107% 99%
11 48 1,924 0.0250 0.0218 0.0237 42 46 115% 105%
12 42 1,801 0.0235 0.0222 0.0243 40 44 106% 97%
13 44 1,647 0.0270 0.0227 0.0248 37 41 119% 109%
14 39 1,469 0.0269 0.0231 0.0252 34 37 116% 106%
15 34 1,229 0.0278 0.0235 0.0257 29 32 119% 108%
Totals $632 $30,045 $576 $626 110% 101%
TEACHER RETIREMENT SYSTEM OF TEXAS
MALE TERMINATION EXPERIENCE - YEARS FROM RETIREMENT
Assumed Rate
Expected Termination
Weighted By Salary Actual/Expected

Teacher Retirement System of Texas 53
0.0%
0.5%
1.0%
1.5%
2.0%
2.5%
3.0%
123456789101112131415
RA
TES
Years from Retirement
MALE TERMINATION EXPERIENCE - YEARS FROM RETIREMENT
Actual Experience Current Assumption Proposed Assumption

Teacher Retirement System of Texas 54
Years from
Retirement
Actual
Termination
Weighted By
Salary $M
Total
Salary $M
Actual
Rate Current Proposed Current Proposed
Current
(2) / (7)
Proposed
(2) / (8)
(1) (2) (3) (4) (5) (6) (7) (8) (9) (10)
1 $45 $3,416 0.0131 0.0095 0.0123 $32 $42 137% 106%
2 96 6,488 0.0148 0.0124 0.0154 80 100 120% 97%
3 109 6,538 0.0167 0.0144 0.0175 94 114 116% 96%
4 121 6,584 0.0184 0.0161 0.0192 106 126 114% 96%
5 134 6,614 0.0202 0.0175 0.0206 116 136 116% 98%
6 140 6,356 0.0221 0.0187 0.0218 119 139 118% 101%
7 147 6,243 0.0236 0.0199 0.0229 124 143 119% 103%
8 142 5,946 0.0239 0.0209 0.0240 124 142 114% 100%
9 137 5,553 0.0247 0.0218 0.0249 121 138 113% 99%
10 126 4,991 0.0253 0.0227 0.0257 113 128 111% 98%
11 123 4,415 0.0279 0.0236 0.0265 104 117 118% 105%
12 118 3,909 0.0301 0.0244 0.0273 95 107 124% 110%
13 114 3,382 0.0338 0.0251 0.0280 85 95 134% 121%
14 111 2,810 0.0394 0.0258 0.0287 73 81 153% 138%
15 98 2,255 0.0435 0.0265 0.0293 60 66 164% 148%
Totals $1,762 $75,499 $1,447 $1,675 122% 105%
TEACHER RETIREMENT SYSTEM OF TEXAS
FEMALE TERMINATION EXPERIENCE - YEARS FROM RETIREMENT
Assumed Rate
Expected Termination
Weighted By Salary Actual/Expected

Teacher Retirement System of Texas 55
0.0%
0.5%
1.0%
1.5%
2.0%
2.5%
3.0%
3.5%
4.0%
4.5%
5.0%
123456789101112131415
RA
TES
Years from Retirement
FEMALE TERMINATION EXPERIENCE - YEARS FROM RETIREMENT
Actual Experience Present Assumptions Proposed Assumptions

Teacher Retirement System of Texas 56
Years of
service
Actual
Termination
Weighted By
Salary $M Total Salary $M
Actual
Rate Current Proposed Current Proposed
Current
(2) / (7)
Proposed
(2) / (8)
(1) (2) (3) (4) (5) (6) (7) (8) (9) (10)
1 $1,163 $7,354 0.1581 0.1490 0.1555 $1,096 $1,144 106% 102%
2 919 7,137 0.1288 0.1198 0.1250 855 892 108% 103%
3 653 6,343 0.1030 0.0966 0.1008 613 640 107% 102%
4 421 5,429 0.0776 0.0723 0.0754 392 409 107% 103%
5 344 5,003 0.0688 0.0625 0.0652 312 326 110% 106%
6 290 4,759 0.0610 0.0556 0.0580 264 276 110% 105%
7 234 4,491 0.0521 0.0472 0.0492 212 221 110% 106%
8 194 4,252 0.0455 0.0415 0.0433 176 184 110% 105%
9 164 3,988 0.0410 0.0370 0.0386 147 154 111% 106%
10 140 3,729 0.0376 0.0338 0.0352 126 131 111% 107%
Totals $4,522 $52,485 $4,194 $4,377 108% 103%
TEACHER RETIREMENT SYSTEM OF TEXAS
MALE TERMINATION EXPERIENCE - DURING SELECT PERIOD
Assumed Rate
Expected Termination
Weighted By Salary $M Actual/Expected
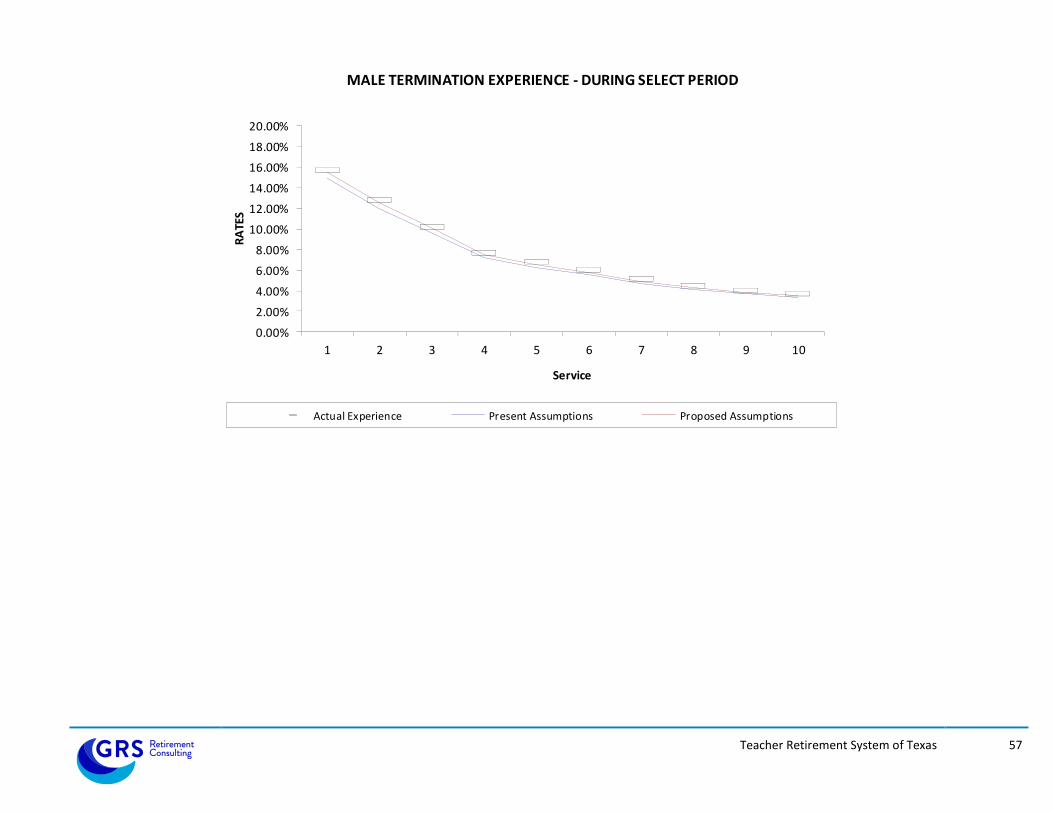
Teacher Retirement System of Texas 57
0.00%
2.00%
4.00%
6.00%
8.00%
10.00%
12.00%
14.00%
16.00%
18.00%
20.00%
1 2 3 4 5 6 7 8 9 10
RA
TES
Service
MALE TERMINATION EXPERIENCE - DURING SELECT PERIOD
Actual Experience Present Assumptions Proposed Assumptions

Teacher Retirement System of Texas 58
Years of
Service
Actual
Termination
Weighted By
Salary $M Total Salary $M
Actual
Rate Current Proposed Current Proposed
Current
(2) / (7)
Proposed
(2) / (8)
(1) (2) (3) (4) (5) (6) (7) (8) (9) (10)
1 $2,391 $14,088 0.1698 0.1431 0.162296 $2,016 $2,286 119% 105%
2 1,921 13,643 0.1408 0.1173 0.133070 1,601 1,815 120% 106%
3 1,469 12,806 0.1147 0.0979 0.111030 1,254 1,422 117% 103%
4 1,042 12,000 0.0869 0.0768 0.087064 921 1,045 113% 100%
5 894 11,581 0.0772 0.0684 0.077625 793 899 113% 99%
6 780 11,394 0.0684 0.0604 0.068467 688 780 113% 100%
7 664 11,606 0.0572 0.0496 0.056290 576 653 115% 102%
8 562 11,190 0.0502 0.0431 0.048891 482 547 116% 103%
9 472 10,648 0.0444 0.0385 0.043639 410 465 115% 102%
10 407 9,964 0.0408 0.0353 0.039995 351 399 116% 102%
Totals $10,602 $118,919 $9,091 $10,311 117% 103%
Assumed Rate
Expected Termination
Weighted By Salary $M Actual/Expected
TEACHER RETIREMENT SYSTEM OF TEXAS
FEMALE TERMINATION EXPERIENCE - DURING SELECT PERIOD

Teacher Retirement System of Texas 59
0.00%
2.00%
4.00%
6.00%
8.00%
10.00%
12.00%
14.00%
16.00%
18.00%
20.00%
1 2 3 4 5 6 7 8 9 10
RA
TES
Service
FEMALE TERMINATION EXPERIENCE - DURING SELECT PERIOD
Actual Experience Present Assumptions Proposed Assumptions